Article

Contaminants in the Soil and Typical Crops of the Pannonian Region of Slovenia

1
Pomurje Science and Innovation Centre, 9000 Murska Sobota, Slovenia
2
Faculty of Mechanical Engineering, University of Maribor, 2000 Maribor, Slovenia
3
Zlatarna Celje d.o.o., 3000 Celje, Slovenia
4
Chamber of Agriculture and Forestry, Slovenia Institute of Agriculture and Forestry, Murska Sobota, Štefana Kovača 40, 9000 Murska Sobota, Slovenia
5
Department of Manufacturing Machinery, Faculty of Mechanical and Computer Engineering, University of Mitrovica, 40000 Mitrovica, Kosovo
*
Author to whom correspondence should be addressed.
Sustainability 2024, 16(19), 8678; https://doi.org/10.3390/su16198678
Submission received: 2 September 2024 / Revised: 24 September 2024 / Accepted: 26 September 2024 / Published: 8 October 2024

Abstract

:
Soil contamination and the uptake of pollutants by food crops are widespread issues that vary greatly by region and are influenced by the mineral composition of the soil and local human activities. The Pannonian region, where agriculture has played a key role since Roman times, has been particularly impacted by the long-standing agricultural and industrial practices. While soil contamination with heavy metals is monitored by the Slovenian government, microplastic contamination and the uptake of pollutants into food crops have yet to become a regular component of monitoring efforts. In this study, we conducted a preliminary investigation into soil and crop contamination across the Pannonian region, focusing on identifying harmful contaminants and their potential uptake into food crops. Both soil and crop samples were analyzed for the presence of heavy metals with proven methods such as atomic absorption spectrometry (FASS), graphite furnace atomic absorption spectrometry (GF-AAS), atomic fluorescence spectrometry (AFS), and inductively coupled plasma–mass spectrometry (ICP-MS). Energy-dispersive X-ray spectroscopy (EDS) was found to be a potentially faster method of obtaining data on soil composition. Special attention was also given to the potential presence of microplastics in the region’s soils.

1. Introduction

Historically, agriculture has been a key economic activity in the Pannonian region, with its fertile plains supporting crop cultivation since before Roman times. The region, named Pannonia during Roman rule, derives its name from the Latin word panis, meaning “bread” [1,2,3]. Today, the area continues to be an important agricultural hub, producing crops such as wheat, barley, and corn, and serving as a strategic food supply region for Slovenia and its neighbors: Austria, Croatia, and Hungary [4]. In addition to its agricultural strength, the region hosts diverse industrial activities, including manufacturing, processing, and energy production. Eastern Slovenian cities like Maribor, Ptuj, and Murska Sobota are home to industrial zones that specialize in sectors such as automotive, machinery, and food processing, which significantly contribute to the local economy. Although short-lived, the region also experienced a period of oil and coal extraction [5,6,7].
Given the region’s strategic importance, long history, and ongoing industrial activity, it is essential to assess potential soil contamination and its impact on agricultural output [8,9,10,11,12]. Soil pollutants can have far-reaching environmental consequences, including ecosystem disruption, biodiversity loss, and contamination of water sources. Contaminants, such as heavy metals, pesticides, and industrial chemicals, can persist in the soil for extended periods, posing risks to plants, animals, and microorganisms. These pollutants can enter the food chain through plant uptake, which can threaten human health when crops meant for consumption become contaminated. Consuming such contaminated food can result in acute or chronic health issues, including poisoning, developmental problems, and an increased risk of cancer. Therefore, understanding and managing soil and food contamination risks are crucial for making informed decisions about remediation strategies, agricultural practices, and food safety monitoring [13,14,15,16,17,18].
Heavy metals are persistent environmental pollutants that can contaminate agricultural soils, impacting crop health and productivity negatively. Elements like Cd, Pb, As, Hg, and Cr are toxic even at low concentrations, while others such as Cu, Zn, and Fe are essential for plant functions but can be harmful when present in excessive amounts [19].
Slovenia regularly monitors the heavy metal content in its fertile soils, particularly in regions exposed to industrial pollution. The Agricultural Institute of Slovenia, along with its partners, conducts this research, with a special focus on protected water areas, as pollution there poses significant risks to public health. Their studies assess not only heavy metals but also other hazardous substances, including nitrate [4] In a recent report [4] on soil sampling in northeastern Slovenia, an area in the Pomurje region showed an excessive copper level of 148 mg/kg of dry soil, surpassing the warning threshold of 100 mg/kg. No other heavy metal exceedances were noted in that report.
The aim of this study was to fill the gap in the lack of monitoring of heavy metals in food crops and microplastic contamination, as these are currently not part of Slovenia’s National Monitoring Programme. Instead, the available data primarily come from studies in areas already known for soil contamination, such as gardens near urban centers or industrial sites [20,21,22,23]. Pollution from the metal production industry, particularly involving Zn and Pb, is the most significant threat to human health in Slovenia, with intensive research ongoing in regions like Celje and the Mežiška Valley [24,25,26,27].
Recent studies have noted growing concern over the presence of microplastics in agricultural soils, where the potential influence on plant growth and produce quality is still poorly understood. Despite the Pannonian region being predominantly focused on agriculture, there are a number of large plastic processing plants in the region. As recent studies have shown the potential for microplastics to migrate long distances [28], these plants have the potential to influence large areas of arable land.
Methods for determining heavy metals in soil include primarily flame atomic absorption spectrometry (FASS), graphite furnace atomic absorption spectrometry (GF-AAS), atomic fluorescence spectrometry (AFS), and inductively coupled plasma–mass spectrometry (ICP-MS). These techniques provide precise detection results and high reproducibility. However, they typically require digestion with strong acids, involve complex and time-consuming pretreatment steps, and can contribute to environmental pollution [29]. The need for fast and reliable heavy metal detection has led to advancements in X-ray fluorescence (XRF) and energy-dispersive X-ray spectroscopy (EDS), potentially to allow the determination of heavy metal contents in soil samples without requiring digestion. While these methods offer rapid results, their accuracy is relatively low, making them suitable primarily for early-stage on-site screening of heavy metal pollution. To assess the suitability of SEM and EDS for the fast determination of C, O, Na, Mg, Al, Si, P, Cl, K, Ca, Ti, and Fe in soil, crop, and fruit samples, the results of this study were additionally crosschecked with the results of AAS and spectrophotometry for P, Mg, K, Na, Fe, and Ca.

2. Materials and Methods

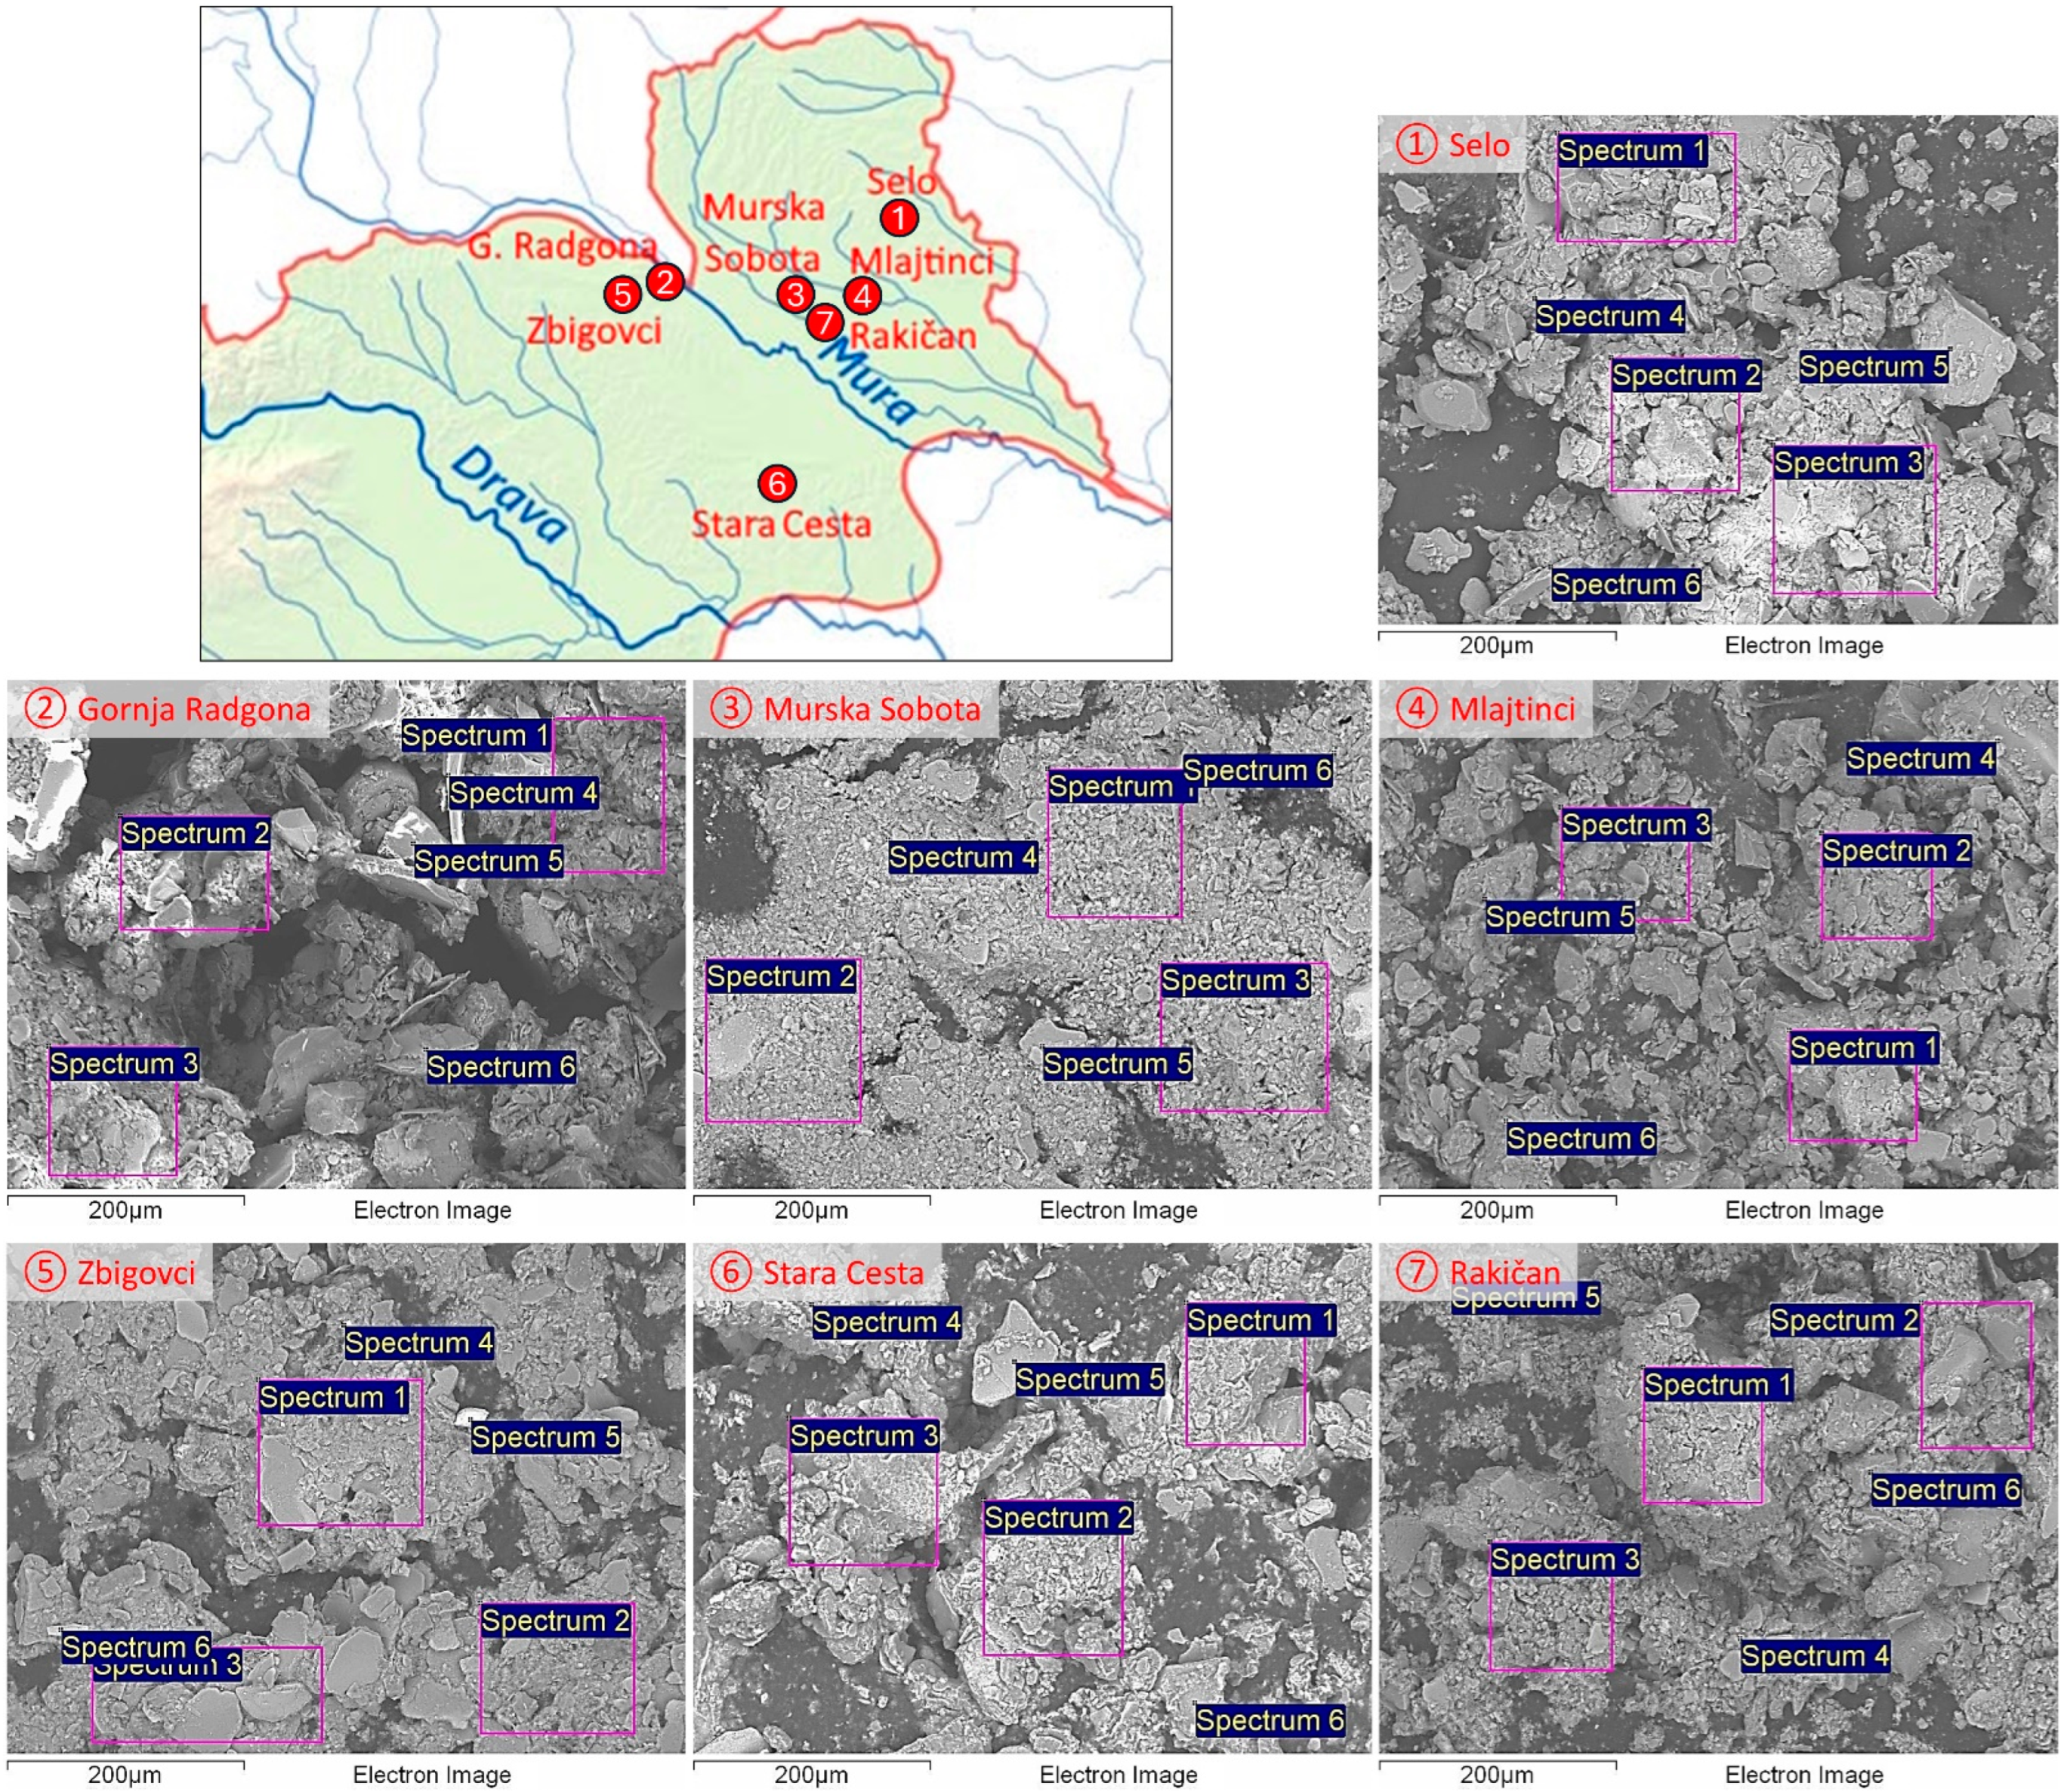
2.1. Sample Collection and Preparation

The soil samples were collected from several locations of the Pannonian region of Slovenia: Gornja Radgona, Zbigovci, Murska Sobota, Stara Cesta, Selo, Mlajtinci, and Rakičan. In the survey, we included soil from different areas of use. The soil from Mlajtinci, Murska Sobota, and Rakičan was obtained from nearby places, whereas the soil in Mlajtinci was obtained from a field cultivated by a large agricultural company. The soil samples from Murska Sobota and Rakičan were from a field owned by the surrounding individual farmers. The soil in Zbigovci and Stara Cesta was taken from a vineyard area where grapes were grown by a large agricultural company engaged in wine production. The soil from Gornja Radgona was taken from the forest in the immediate vicinity of the Mura River, which is the largest river in the region. Samples from all sites were collected as composite samples (composed of 10 subsamples) using a 3 cm diameter probe and taking cores from the 0–20 cm depth. The samples of approx. 1 kg were stored in polyethylene bags and placed in a cooler until transported to the laboratory. Samples of typical crops and fruits from this region were also collected for analysis: apples, pumpkin seeds, barley, corn, potatoes, and wheat. The samples were composed of five smaller subsamples, each weighing approx. 1 kg. In the laboratory, the individual samples were mixed thoroughly and then reduced to a final weight of 500 g. This composite sample was then processed further.

2.2. Sample Preparation for SEM

Sample preparation for the SEM microscopy was as follows: The apple and potato samples were first cut into slices and freeze-dried before performing the analysis to preserve the structures and properties of these samples. The freeze-drying was performed using an FD-200F SERIES lyophilizer (Labfreez Instruments Group Co., Ltd., Beijing, China). The freeze-drying protocol consisted of a freezing period of 8 h at −40 °C, followed by a drying period of 12 h, when the pressure was reduced to 1–4 Pa, and the temperature was raised to 20 °C. The temperature was then raised to 30 °C, and a vacuum was maintained for 30 h to complete the drying process.

2.3. SEM and EDS Analyses

SEM equipped with an EDS detector was used for the investigations of the soil and crop samples. The used instrument was a Sirion 400 NC (FEI Sirion 400 NC, FEI Technologies Inc., Hillsboro, OR, USA), with an EDS INCA 350 (Oxford Instruments, Abingdon, UK). The soil samples were spread on graphite tape, adhered to an SEM sample holder and left to dry. The crop samples of pumpkin seeds, barley, corn, and wheat were firstly milled into smaller particles before being applied to the SEM holder with graphite tape. Slices of the freeze-dried apple and potato were also applied on matching holders. The samples were coated with Au for 60 s before performing the SEM and EDS analyses. A total of 24 EDS spectra were generated from each sample, from which the mean, standard deviation, maximum, and minimum values were calculated. The lower detection limit of the EDS analysis was 0.1 wt.%, with a relative uncertainty of ±2% for major constituents with a mass fraction greater than 10 wt.% [30]. The error distribution increased rapidly for minor constituents with mass fractions < 10 wt.%, having a relative uncertainty up to ±25% for standard calibrated procedures [31]. EDS analysis errors were considered to be suitable for the given investigation of the soil and crop samples.

2.4. Analysis of the Elemental Composition

The analysis of P, Mg, K, Na, Fe, and Ca in the apple and potato samples was conducted according to ISO 5984:2022 [32] with a spectrometric method and atomic absorption spectrometry. The sample preparation procedure was as follows: samples were first homogenized—apple and potato were crushed, while wheat, barley, pumpkin seeds, and corn were ground in an electric grinder (Gorenje, Velenje, Slovenia). Samples were then dried to constant weight at 105 °C in a dryer (Memmert, UNB 400, Schwabach, Germany). For further determination of the elements, the samples were ashed in muffle furnace at 530 °C overnight (Nabertherm B150, Lilienthalu, Germany).
The determination of the phosphorus content in the crop and fruit samples was performed according to ISO 6491:1998 [33] with the spectrometric method. After dissolving the ashed sample in 25% hydrochloric acid (Merck, Germany), amonvanadate (Merck, Germany) reagent was added to the solution, and absorption was measured at 440 nm with a spectrophotometer (UV-VIS Agilent 8453, Agilent Technologies, Santa Clara, CA, USA).
Determination of the contents of Mg, K, Na, Fe, and Ca was performed according to ISO 6869:2000 [34] after dissolving the ashed sample in HCl (Merck, Germany) using atomic absorption spectrometry (VARIAN Spectra AA-240FS, Agilent Technologies, Santa Clara, CA, USA). The absorptions of the solutions were measured using an air-acetylene oxide flame at the following wavelengths: Mg at 285.2 nm, K at 769.9 nm, Na at 589.6 nm, Fe at 248.3 nm, and Ca 422.7 nm.

2.5. Analyzing Microplastic Contents

The collected soil samples were analyzed for the presence and composition of microplastics. Each soil sample was dried in a convection oven at 60 °C for 12 h, the dry soil was sieved up to a 1 mm sieve. A total of 250 g of the sub 1 mm particles was collected and used for the analysis. To separate the microplastic particles from the remaining soil, the sieved powders were dispersed in 0.5 L of a solution of NaCl with a specific density of 1.2 g/mL. The samples were mixed vigorously with a magnetic stir bar for 30 min and left to settle for 24 h. The remaining solution was decanted and separated. To increase the yield of microplastic extraction, the process was repeated 3 times, each time adding 0.5 L of a newly prepared NaCl solution. The prepared extracted solutions were additionally digested at 55 °C with the addition of 100 mL of H2O2 to remove any dissolved or suspended organic components. The suspensions were filtered through Express Plus (PES) 0.45 µm pore size filter paper (Merck Millipore, Ireland) using a Sartorius 25 mm glass vacuum filter holder, with a glass frit filter support (Sartorius, Gottingen, Germany). The filter papers were dried overnight in a desiccator.
The dry filter papers were analyzed on a PerkinElmer Spotlight 200i FTIR Micro-scope (PerkinElmer, UK), connected to a PerkinElmer Spectrum 3 FTIR/NIR/FIR Spectrometer (PerkinElmer, UK). Two image areas with a size of 5000 × 5000 µm were analyzed for the potential presence of microplastic particles. The chemical composition of every visible particle was analyzed to determine its material composition.

3. Results

3.1. Elemental Composition of Soil Samples

The results from the SEM and EDS investigations are shown in Figure 1 for the soil samples. Table 1 shows the mean, standard deviation, maximum, and minimum values for the 24 EDS spectra obtained from the individual samples. Table 2 shows the combined overall total average values for all the soil samples.
The main constituent elements in the soil were C, O, Al, and Si, with Fe and Ti metals. Lower values of K, Mg, Na, Ca, Mn, and P were detected in the samples as trace elements. In the soil sample from Zbigovci, Zr was additionally detected, which was not found in the other samples.

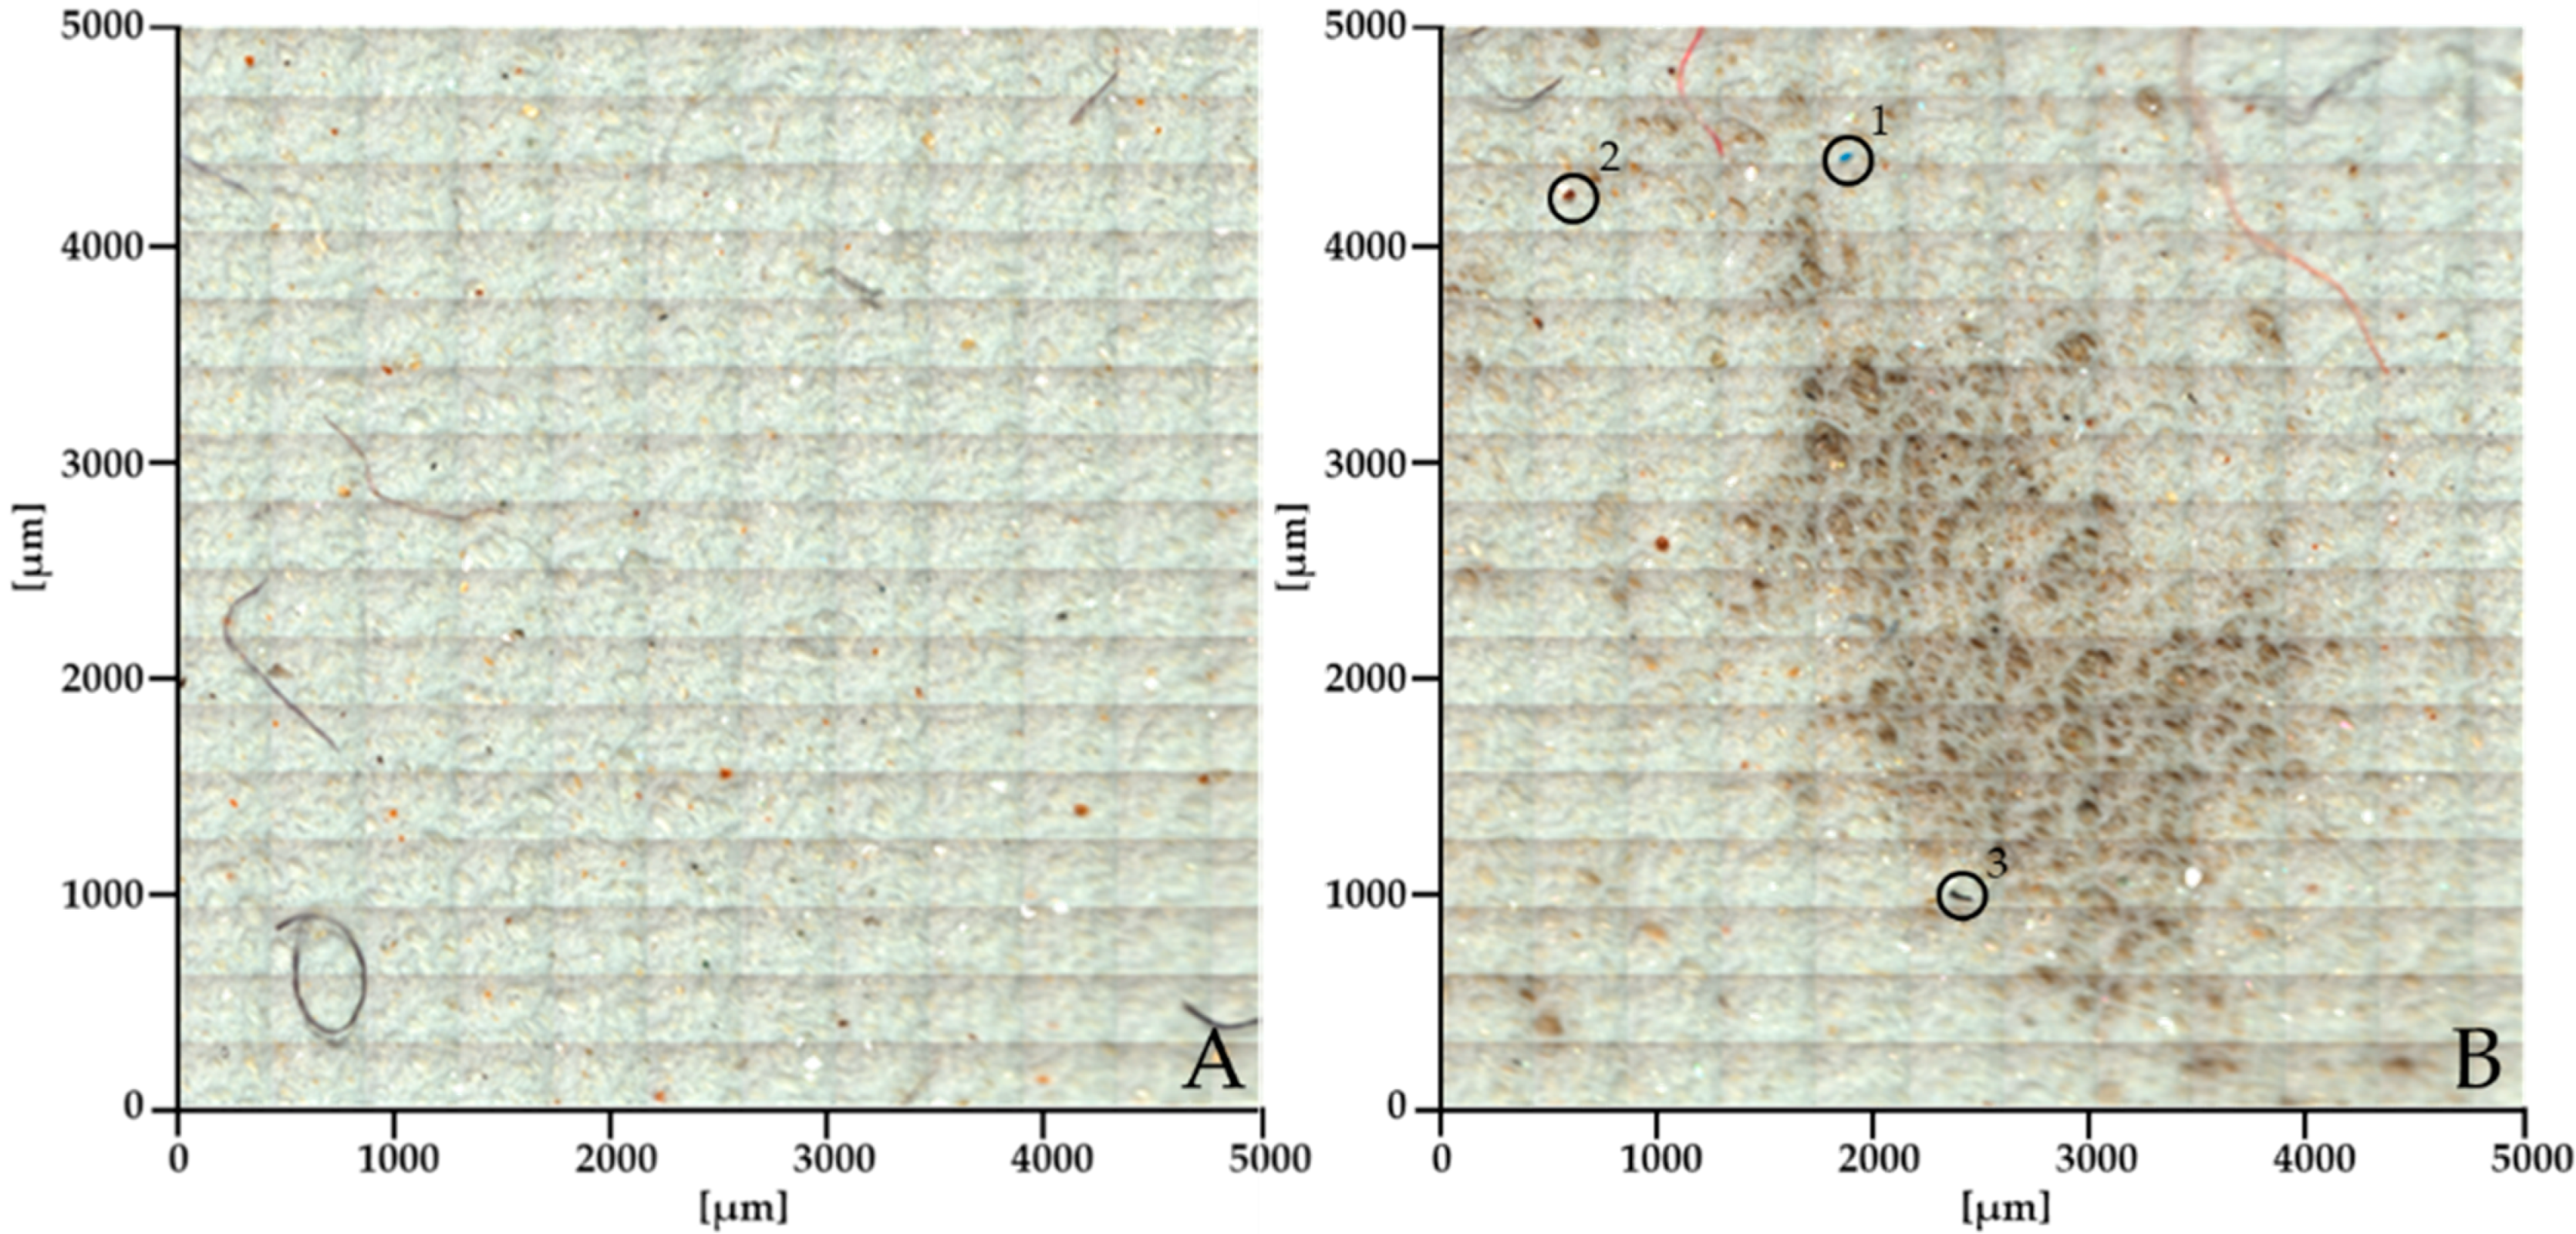
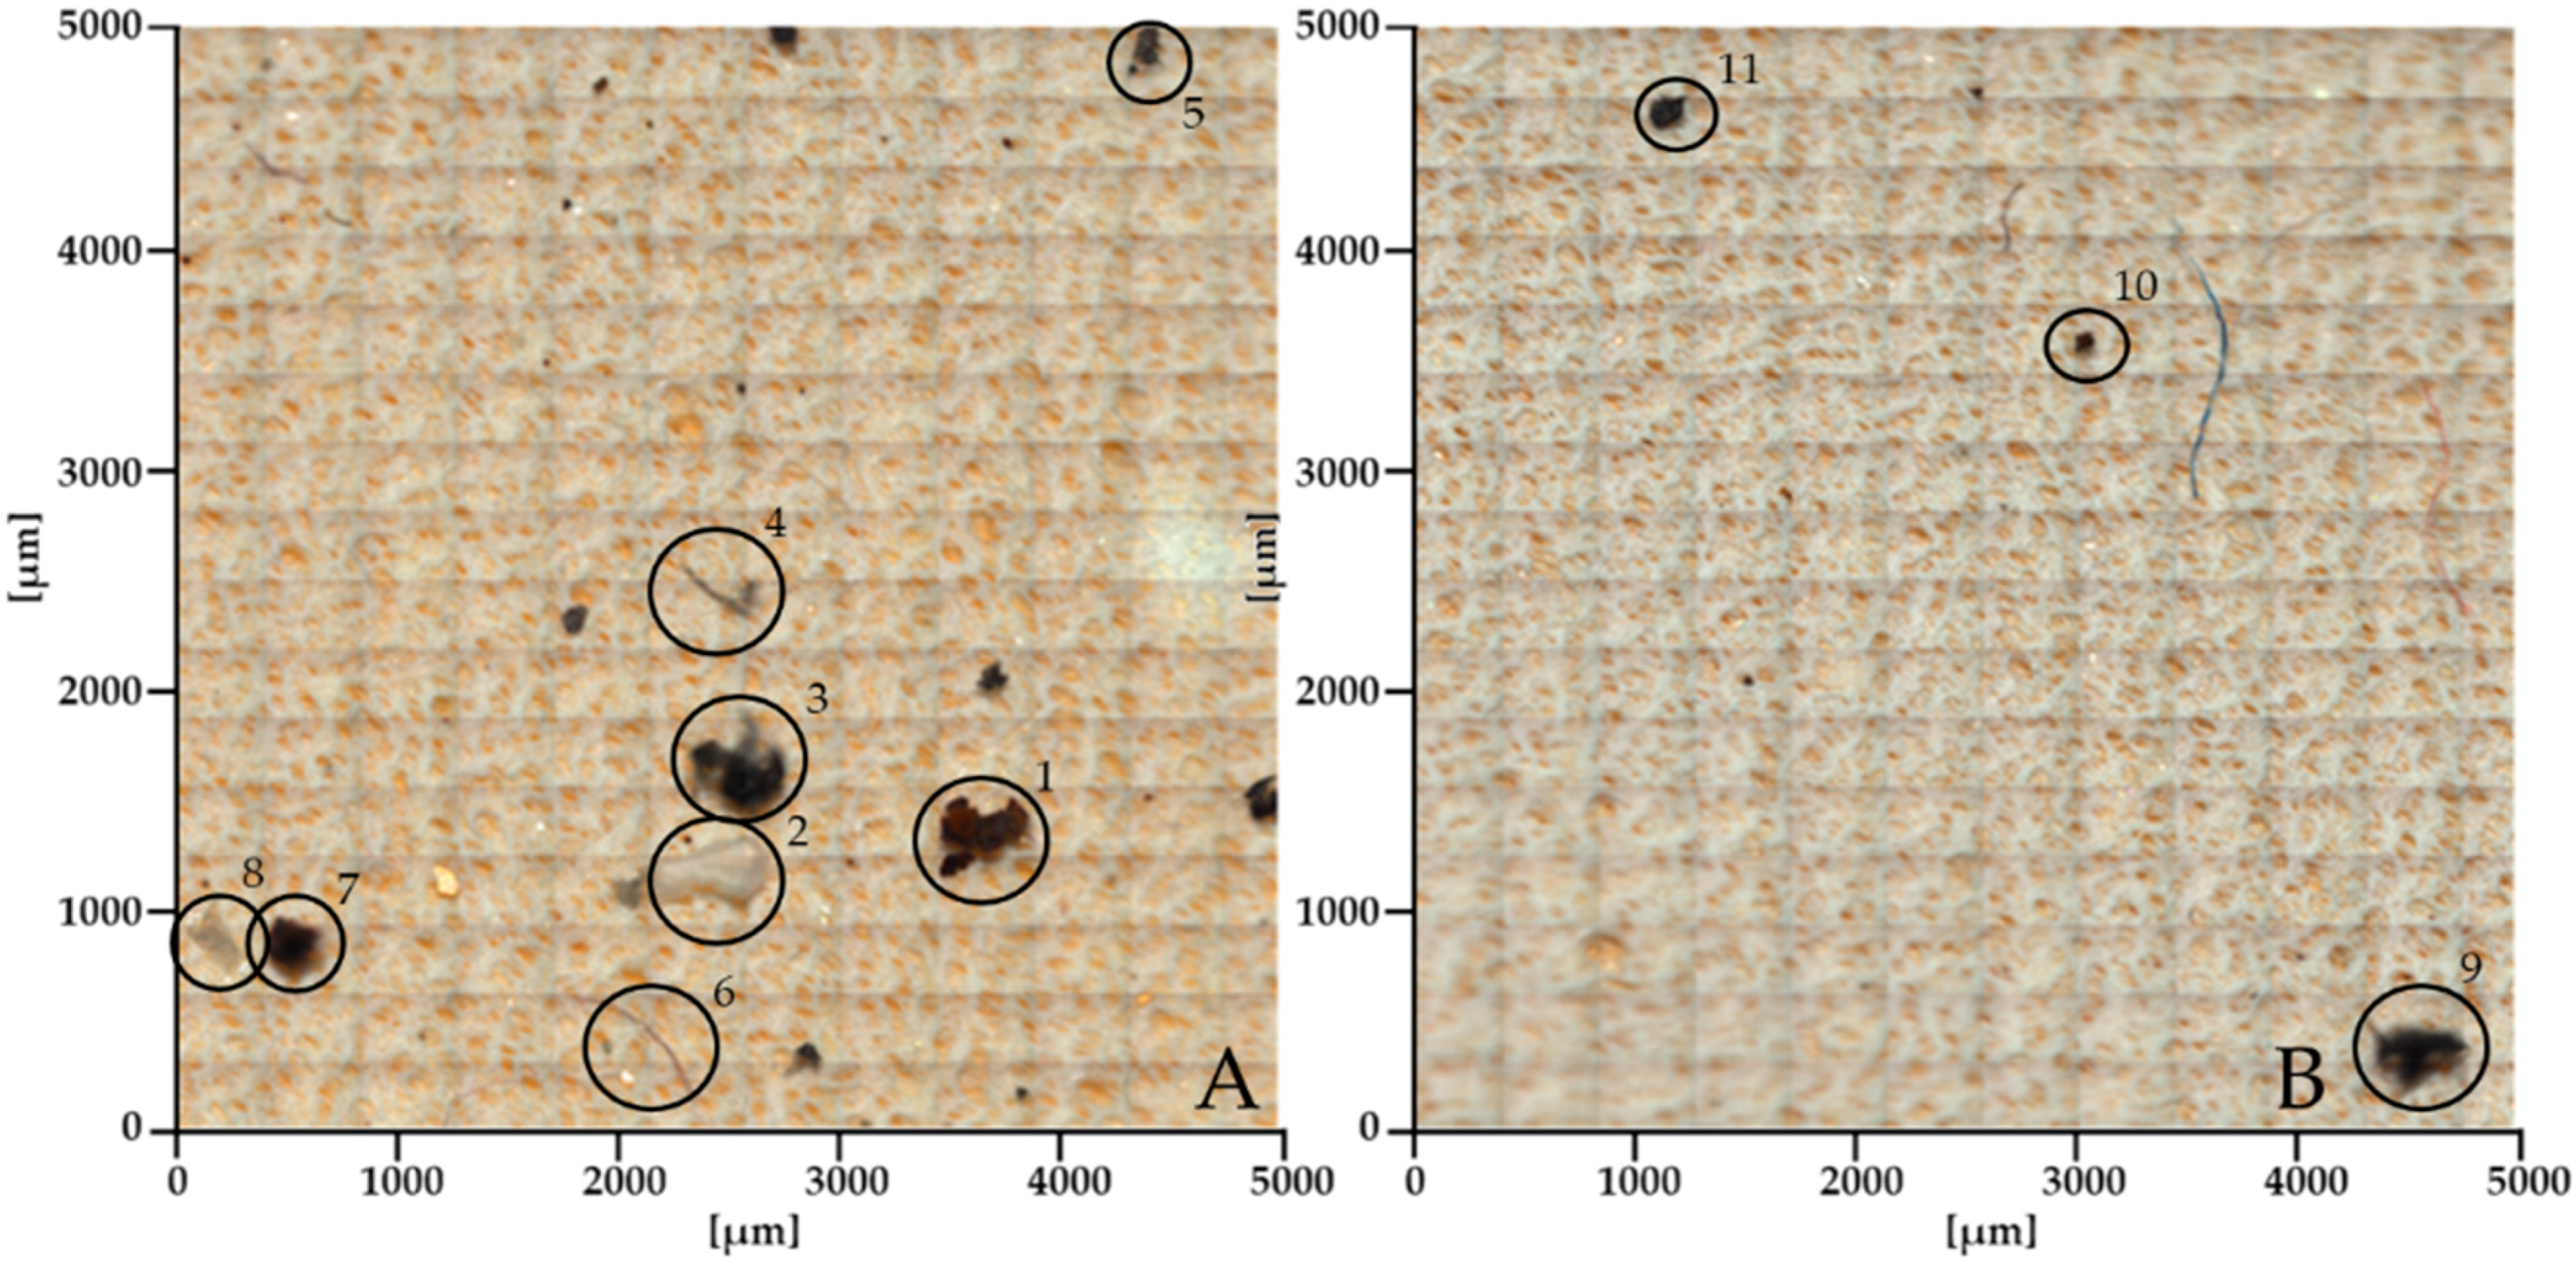
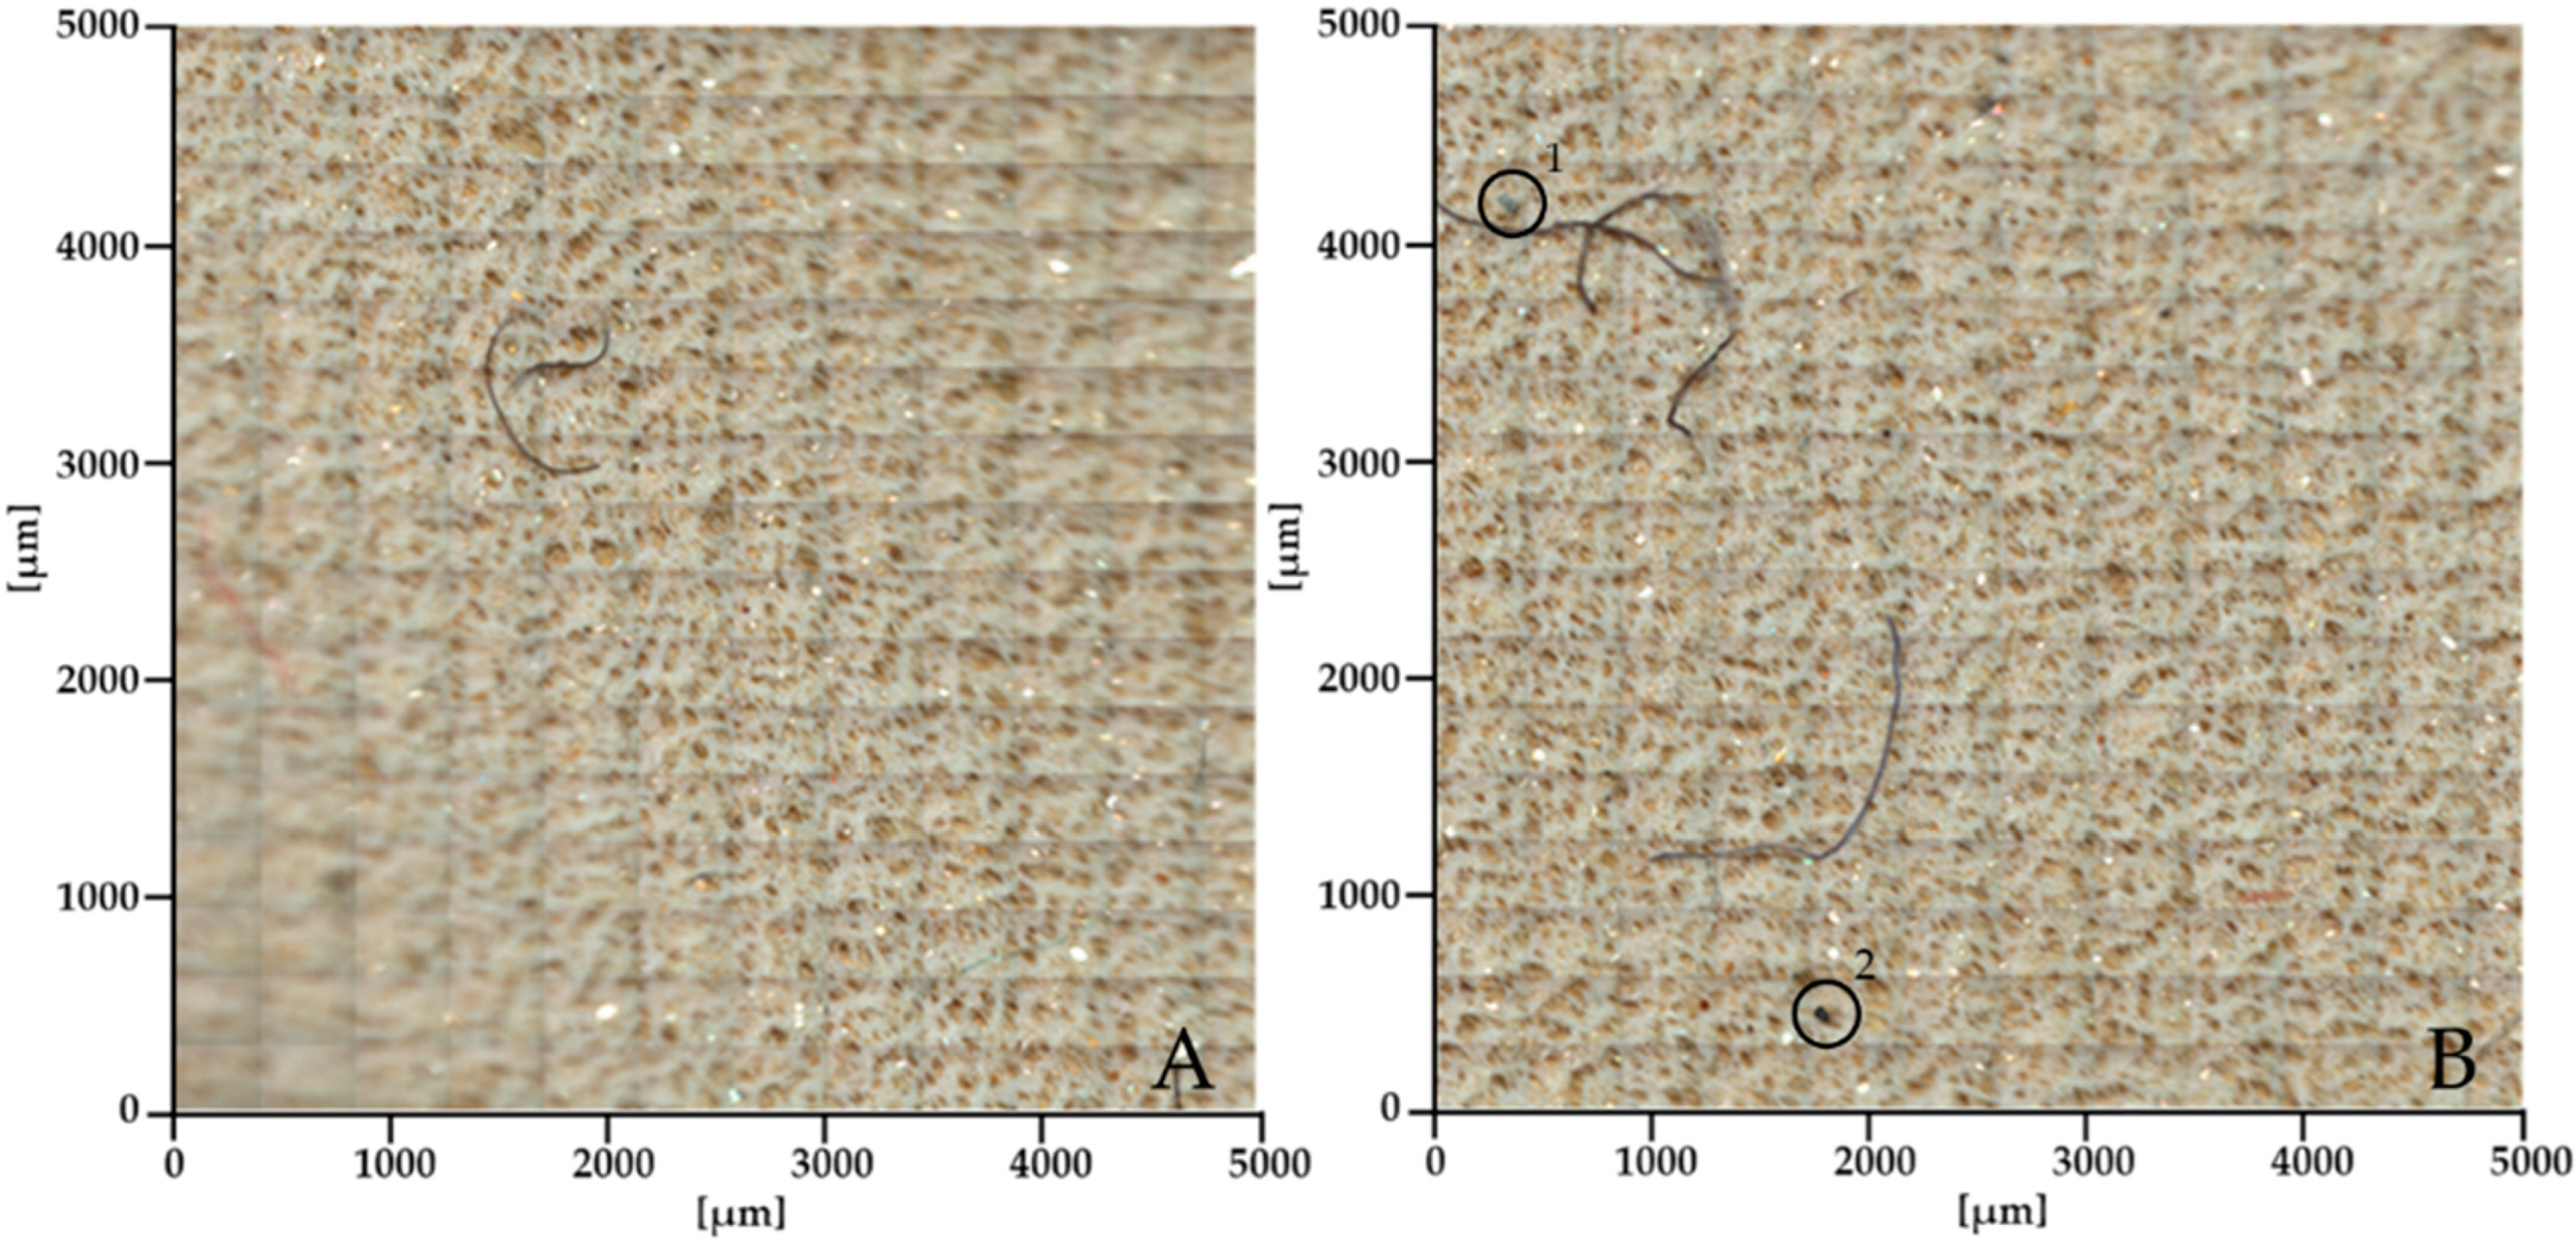
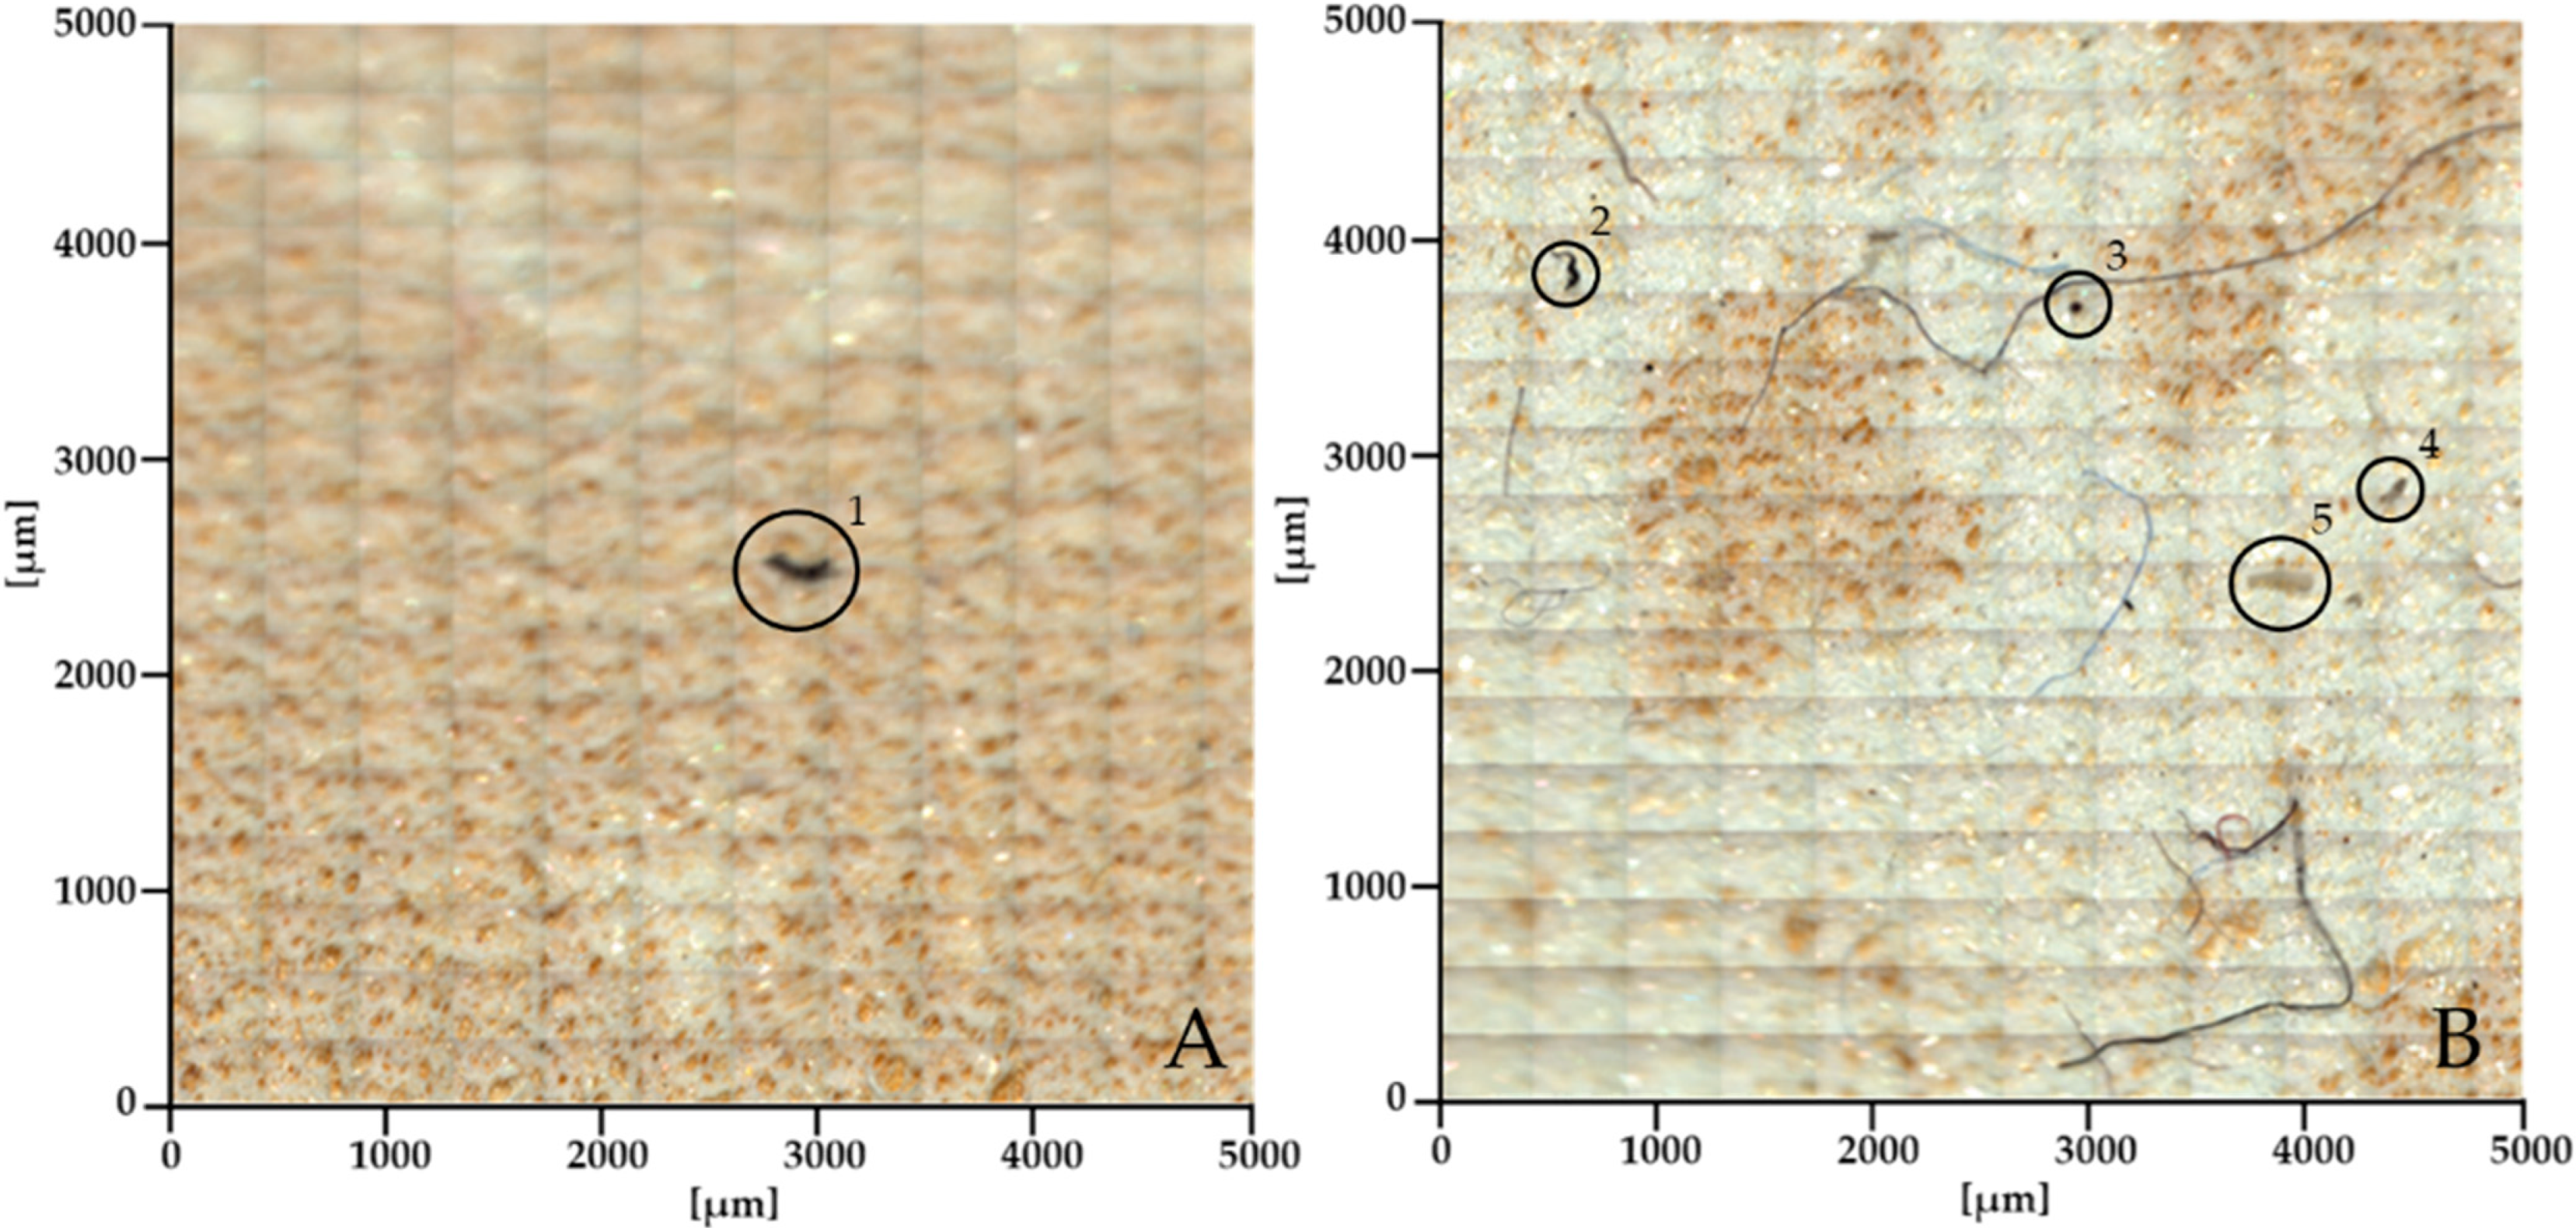
3.2. Microplastic Content in Soil Samples

The results from the microplastic analysis of the soil samples are shown in Figure 2, Figure 3, Figure 4, Figure 5, Figure 6, Figure 7 and Figure 8, with detailed images and the FTIR spectra of the various particles detailed in Supplementary Material S1.
Significant residues of manmade textile fibers are visible in Figure 2. While points 1 and 2 on image B visually seemed to be polymer-based, the small size prevented the acquisition of a clear spectrum. The spectral analysis of point 3 corresponded to natural cotton. Detailed images and FTIR spectra can be found in the Supplementary Material under 1. G. Radgona.
On both images in Figure 3, there is minimal residues of humanmade textile fibers, with the exception of point 4, which has the characteristic spectrum of spandex. Both images show significant microplastic residues based mostly on PE (points 3, 5, 8, and 11) and degraded PVC (points 1 and 7), with minor residues of polyester detected at point 8 and PTFE detected at point 2 (most likely residue from the magnetic stir bar). Detailed images and FTIR spectra can be found in the Supplementary Material under 2. Murska Sobota.
Figure 4 shows that the soil sample taken from Mljatinci had almost no microplastic contamination, although the few visible residues were too small for extracting a decent FTIR signal. Detailed images and FTIR spectra can be found in the Supplementary Material under 3. Mljatinci.
Figure 5 shows that the soil sample taken from Rakičan had almost no microplastic contamination but had some contamination with synthetic fibers. Detailed images and FTIR spectra can be found in the Supplementary Material under 4. Rakičan.
Figure 6 shows that the soil sample taken from S. Cesta had almost no microplastic or synthetic fiber contamination. Detailed images and FTIR spectra are provided in the Supplementary Material under 5. S. Cesta.
Figure 7 shows that the soil sample taken from Selo had moderate fiber residues and some larger microplastic residues identified via the FTIR spectrum as polyester urethane (points 1 and 2). Detailed images and FTIR spectra are provided in the Supplementary Material under 6. Selo.
Figure 8 shows that the soil sample taken from Zbigovci had moderate fiber residues (points 1–3) and some smaller microplastic residues identified via the FTIR spectrum as PE (point 4). Detailed images and FTIR spectra can be found in the Supplementary Material under 7. Zbigovci.

3.3. Crop Sample Results

The results from the SEM and EDS investigations are shown in Figure 9 and Table 3 for the crop samples. Table 4 displays the results obtained with AAS.
The crop samples contained mainly C and O from organic matter, along with varying smaller amounts of Na, Mg, Al, Si, P, Cl, K, Ca, Ti and Fe. Al and Si were present in the apple, barley, and potato samples, with Ti and Fe also being present in the potato sample. The other elements, Na, Mg, P, Cl, K, and Ca, had lower values in the samples of below or around 1 wt.%.

4. Discussion

4.1. Soil Sample Results

Oxygen is the most abundant element in soil, while Si and Al are the second and third most abundant [35]. These are followed by the fourth most abundant element, Fe, which plays a crucial role in plant and animal functions, including chlorophyll production, energy transfer, cell metabolism, nitrogen fixation, and plant respiration [36]. The soil analysis in this study, displayed in Table 1 and Table 2, confirmed these expected element concentrations, with Ti also being notable due to its importance in enhancing crop growth, as it is commonly used in commercial fertilizers [37].
Soil composition is strongly influenced by soil parent material, mineralogy, and environmental factors such as climate and biota [38]. However, intensive agricultural practices disrupt nutrient cycling, depleting organic matter and prompting the use of fertilizers and amendments to maintain fertility [39]. Our findings highlight these effects: the soils from forested areas (Gornja Radgona) and vineyards (Zbigovci) had higher organic matter contents compared to those of the intensively farmed soils (Mlajtinci, Rakičan). Additionally, the forest soils showed elevated levels of Ca and Mg. The plants on forest soil are not regularly harvested, unlike those on soils in intensive agricultural areas, which exhibited higher concentrations of P and K due to frequent fertilization.
Of note was the higher iron content in the forest soils, with an average of 7.71% in the Pomurje region, surpassing both the Slovenian soil average of 3.80% and the global average of 2.5% [40,41].
This study also revealed a surprising finding regarding the vineyard soil from Zbigovci, where the Zr levels were extraordinarily high at 3.36 wt.%. This far exceeds the typical soil Zr concentrations, which range from 90 to 850 mg/kg [42,43]. The origin of this Zr remains unclear but is likely linked to phosphate fertilizers, a known source of zirconium contamination [44].
The analysis of potential microplastic contamination showed relatively low microplastic contamination from nontextile sources in the region, with the exception of the samples from Murska Sobota. The town of Murska Sobota is, on average, more industrialized, with a significant polymer processing industry that has potentially contributed to the locally higher microplastic contamination. The relatively high degree of textile fiber contamination may have been due to the local human activities. A main source may have been the water runoff from washing machines. While all possible steps were taken to minimize the potential contamination with fibers from the researchers’ clothes, this possible source of contamination cannot be disregarded.

4.2. Crop Sample Results

Lements of interest in the crop samples were Al, Si, Ti, and Fe, excluding the other elements with trace values. The potato sample had comparable values of Al, Si, Ti, and Fe to the oThe everall values of these elements in the soil (Table 3 potato sample and Table 2). This suggests an uptake of these elements from the soil into potatoes. Al and Si were also found in the apple sample, with similar ratios of these elements as found in the soil. Only Si was found in the barley sample. The results of elemental analysis with atomic spectroscopy (Table 4), in comparison with the EDS analysis (Table 3), revealed that the latter was not able to fully detect all the important elements present in the crops and fruits, such as P, K, Fe, Mg, and Na; only K was the element detected in all plant tissues. Those elements are otherwise widely present in crops and fruit, with concentrations varying with the plant species and variety, growth conditions, soil properties, and plant tissue analyzed [45,46,47]. The lack of determination might have been related to the very low concentration of those elements in the freeze-dried tissue (EMS analysis), while the elements analyzed in the ash were highly concentrated through the sample preparation procedure and were quantified successfully with ASS and spectrophotometry (Table 4). The SEM analysis was more reliable for the detection of the elements in the soil samples.

5. Conclusions

5.1. Elemental Composition of Soil

The results of the elemental composition of the soils from the Pomurje region can generally be classified in to two different categories, (i) soils from forests that were richer in Mg and Ca and (ii) soils where intense agricultural production occurred, where higher concentrations of P and K were typical for artificially fertilized soils.
Forest soils in the Pomurje region showed an unusually high iron concentration of 7.71%, significantly above both the Slovenian and global averages. Surprisingly, the vineyard soils in Zbigovci exhibited an extremely high Zr level of 3.36 wt.%. Both these values are likely linked to phosphate fertilizers.
Crop samples, especially potatoes, demonstrated the uptake of elements like Al, Si, Ti, and Fe from the soil. However, the EDS method was less effective in detecting key nutrients (e.g., P, K, Fe, Mg, and Na) in crops compared to atomic spectroscopy.

5.2. Microplastic Contamination

Microplastic contamination was generally low, except in Murska Sobota, where industrial activities, particularly polymer processing, may have contributed to localized pollution. Textile fiber contamination, potentially from household washing machine runoff, was also noted.

5.3. Analytical Techniques

This study highlights the limitations of EDS in detecting key elements in crops, whereas atomic absorption spectroscopy (AAS) and spectrophotometric methods were more reliable for element detection in the ash samples. The techniques are relatively time-consuming as compared to EDS.
While the EDS analysis was sufficiently accurate when analyzing the soil samples, the same was not observed in the organic crop samples, where the EDX analysis failed to completely detect the relevant elements in the crop samples.
The low detection rate of EDS was most likely the result of the compounding effects of low concentration, sample porosity, and low sample conductivity, which necessitated the use of a conductive Au coating to improve imaging.
Regardless of the drawbacks of SEM-EDS, the method offers one key advantage: the simultaneous acquisition of elemental and visual data, giving insights into the morphological composition of soil. These added data can be beneficial when attempting to determine the source of a specific contaminant.

Supplementary Materials

The following supporting information can be downloaded at: https://www.mdpi.com/article/10.3390/su16198678/s1, S1 Detailed images and FTIR spectra.

Author Contributions

Conceptualization, M.S. and R.R.; methodology, Ž.J., S.K. and T.Č.; software, P.M. and G.H. validation, Ž.J. and R.R.; formal analysis, P.M. and L.R.; investigation, Ž.J., P.M., L.R., T.Č. and G.H.; resources, M.S. and S.K.; data curation, P.M.; writing—original draft preparation, Ž.J. and L.R.; writing—review and editing, Ž.J. and R.R.; visualization, Ž.J. and P.M.; supervision, R.R.; project administration, R.R.; funding acquisition, M.S. and S.K. All authors have read and agreed to the published version of the manuscript.

Funding

This research and the APC were funded by the Slovenian Research Agency ARIS (P2-0120 Research Programme, Training and funding of a Young Researcher, (Co)-financing Agreements nos. 1000-19-0552, 1000-20-0552 and 1000-21-0552 and ZIS Pomurje Agreement No. 1000-24-8700) and International Infrastructure Project EuBi (I0-E014).

Data Availability Statement

Data is contained within the article and Supplementary Materials.

Conflicts of Interest

The authors declare no conflicts of interest.

References

  1. Mandic, O.; de Leeuw, A.; Bulić, J.; Kuiper, K.F.; Krijgsman, W.; Jurišić-Polšak, Z. Paleogeographic evolution of the Southern Pannonian Basin: 40Ar/ 39Ar age constraints on the Miocene continental series of Northern Croatia. Int. J. Earth Sci. 2012, 101, 1033–1046. [Google Scholar] [CrossRef]
  2. Zelnik, I.; Čarni, A. Plant species diversity and composition of wet grasslands in relation to environmental factors. Biodivers. Conserv. 2013, 22, 2179–2192. [Google Scholar] [CrossRef]
  3. Mócsy, A. Pannonia and Upper Moesia (Routledge Revivals): A History of the Middle Danube Provinces of the Roman Empire, 1st ed.; Routledge: London, UK, 1974. [Google Scholar] [CrossRef]
  4. Bedrač, M.; Bele, S.; Brećko, J.; Dvoršak, A.H.; Kožar, M.; Ložar, L.; Moljk, B.; Telič, V.; Tanja Travnikar, B.Z. Poročilo o Stanju Kmetijstva, Živilstva, Gozdarstva in Ribištva 2022; Ljubljana, Slovenia, 2022. Available online: https://www.gov.si/assets/ministrstva/MKGP/Dokumenti-/Stanje-v-kmetijstvu-2022/ZP_2022_splosno-+-priloge.pdf (accessed on 15 May 2024).
  5. Žarko, L.; Lorenčič, A. Strategije in Prakse Energetske Oskrbe v Sloveniji; Aleš, G., Ed.; ZALOŽBA INZ: Ljubljana, Slovenia, 2015; ISBN 2350-5656. [Google Scholar]
  6. Bräuer, K.; Geissler, W.H.; Kämpf, H.; Niedermannn, S.; Rman, N. Helium and carbon isotope signatures of gas exhalations in the westernmost part of the Pannonian Basin (SE Austria/NE Slovenia): Evidence for active lithospheric mantle degassing. Chem. Geol. 2016, 422, 60–70. [Google Scholar] [CrossRef]
  7. Markič, M.; zavod Slovenije, G. Premogi v Sloveniji ter prikaz njihovih nahajališč na šestih izbranih kartah. Available online: https://www.geo-zs.si/PDF/PeriodicnePublikacije/Premogi_v_Sloveniji_in_njihova_nahajalisca_-_Posodobljeno_2014.pdf (accessed on 15 May 2024).
  8. Edwards-Jones, G. Symposium on “Food supply and quality in a climate-changed world” Does eating local food reduce the environmental impact of food production and enhance consumer health? Proc. Nutr. Soc. 2004, 69, 582–591. [Google Scholar] [CrossRef] [PubMed]
  9. Cvijanović, D.; Ignjatijević, S.; Tankosić, J.V.; Cvijanović, V. Do local food products contribute to sustainable economic development? Sustainability 2020, 12, 2847. [Google Scholar] [CrossRef]
  10. Coelho, F.C.; Coelho, E.M.; Egerer, M. Local food: Benefits and failings due to modern agriculture. Sci. Agric. 2018, 75, 84–94. [Google Scholar] [CrossRef]
  11. Hardesty, S.D. The growing role of local food markets. Am. J. Agric. Econ. 2008, 90, 1289–1295. [Google Scholar] [CrossRef]
  12. Hempel, C.; Hamm, U. How important is local food to organic-minded consumers? Appetite 2016, 96, 309–318. [Google Scholar] [CrossRef]
  13. Lombi, E.; Wenzel, W.W.; Adriano, D.C. Soil contamination, risk reduction and remediation. Land Contam. Reclam. 1998, 6, 183–197. [Google Scholar] [CrossRef]
  14. Khan, M.A.; Khan, S.; Khan, A.; Alam, M. Soil contamination with cadmium, consequences and remediation using organic amendments. Sci. Total Environ. 2017, 601–602, 1591–1605. [Google Scholar] [CrossRef]
  15. Kowalska, J.B.; Mazurek, R.; Gąsiorek, M.; Zaleski, T. Pollution indices as useful tools for the comprehensive evaluation of the degree of soil contamination—A review. Environ. Geochem. Health 2018, 40, 2395–2420. [Google Scholar] [CrossRef] [PubMed]
  16. Chen, L.; Fang, L.; Yang, X.; Luo, X.; Qiu, T.; Zeng, Y.; Huang, F.; Dong, F.; White, J.C.; Bolan, N.; et al. Sources and human health risks associated with potentially toxic elements (PTEs) in urban dust: A global perspective. Environ. Int. 2024, 187, 108708. [Google Scholar] [CrossRef]
  17. Neža, F.; Leštan, D. Možnost uresni č evanja koncepta “č lovekove varnosti” v razmerah prekomerne obremenitve okolja—Primer Prekmurja. Acta Agric. Slov. 2008, 91, 157–166. [Google Scholar]
  18. Van Straalen, N.M. Assessment of soil contamination—A functional perspective. Biodegradation 2002, 13, 41–52. [Google Scholar] [CrossRef]
  19. Rashid, A.; Schutte, B.J.; Ulery, A.; Deyholos, M.K.; Sanogo, S.; Lehnhoff, E.A.; Beck, L. Heavy Metal Contamination in Agricultural Soil: Environmental Pollutants Affecting Crop Health. Agronomy 2023, 13, 1521. [Google Scholar] [CrossRef]
  20. Karo Bešter, P.; Vrščaj, B. Vsebnost težkih kovin v tleh in vrtninah, ki so pridelane na izbranem območju občine Kanal ob Soči. Agricultural Institute of Slovenia. 2015. Available online: https://www.obcina-kanal.si/mma/2015_11-OnesnazenjeTalKanal.KoncnoPorocilo.pdf/2015121111192477/?m=1449829165 (accessed on 15 May 2024).
  21. Nives, K.; Melita, S. Vsebnost Težkih Kovin v Tleh in Rastlinah na Kmetijskih Površinah v Šaleški Dolini: Končno Poročilo; Agricultural Institute of Slovenia: Velenje, Slovenia, 2001. [Google Scholar]
  22. Al Sayegh-Petkovšek, S.; Pokorny, B. Vsebnost Težkih Kovin v Ribah iz Šaleških Jezer in Ocena Njihove Primernosti za Prehrano Ljudi: Poročilo; Agricultural Institute of Slovenia: Velenje, Slovenia, 2005. [Google Scholar]
  23. Mavrič, I. Vsebnosti Težkih Kovin v Izbranih Zeliščih na Območju Šoštanja in Zgornjesavinjske Doline. Thesis, University of Ljubljana, Ljubljana, Slovenia, 2014. Available online: https://repozitorij.uni-lj.si/IzpisGradiva.php?id=69038&lang=slv (accessed on 15 May 2024).
  24. Voglar, G.E.; Leštan, D. Solidification/stabilisation of metals contaminated industrial soil from former Zn smelter in Celje, Slovenia, using cement as a hydraulic binder. J. Hazard. Mater. 2010, 178, 926–933. [Google Scholar] [CrossRef]
  25. Le, D.; March, R. Ocena dostopnosti težkih kovin iz onesnaženih tal Mežiške doline (Toxicity Characteristic Leaching Procedure) se po standardiziranem postopku tleh zelenjavnih vrtov in igrišč v Mežiški dolini. Potencialno nevarnost vnosa Pb in sativa L.) kot testni ra. Acta Agric. Slov. 2008, 91, 157–166. [Google Scholar]
  26. Gluhar, S. Okoljska Tveganja po Remediaciji tal, Onesnaženih s Potencialno Strupenimi Elementi, s Kelatnim Ligandom; University of Ljubljana: Ljubljana, Slovenia, 2020. [Google Scholar]
  27. Gluhar, S.; Jez, E.; Lestan, D. The use of zero-valent Fe for curbing toxic emissions after EDTA-based washing of Pb, Zn and Cd contaminated calcareous and acidic soil. Chemosphere 2019, 215, 482–489. [Google Scholar] [CrossRef]
  28. Xiao, S.; Cui, Y.; Brahney, J.; Mahowald, N.M.; Li, Q. Long-distance atmospheric transport of microplastic fibres influenced by their shapes. Nat. Geosci. 2023, 16, 863–870. [Google Scholar] [CrossRef]
  29. Li, W.; Niu, N.; Guo, N.; Zhou, H.; Bu, J.; Ding, A. Comparative study on the determination of heavy metals in soil by XRF and ICP-MS. J. Phys. Conf. Ser. 2021, 2009, 012075. [Google Scholar] [CrossRef]
  30. Statham, P.J. Limitations to accuracy in extracting characteristic line intensities from x-ray spectra. J. Res. Natl. Inst. Stand. Technol. 2002, 107, 531–546. [Google Scholar] [CrossRef] [PubMed]
  31. Newbury, D.E. Standardless quantitative electron-excited X-ray microanalysis by energy-dispersive spectrometry: What is its proper role? Microsc. Microanal. 1998, 4, 585–597. [Google Scholar] [CrossRef] [PubMed]
  32. ISO 5984:2022; Animal Feeding Stuffs—Determination of Crude Ash. ISO: Geneva, Switzerland, 2022.
  33. ISO 6491:1998; Animal Feeding Stuffs—Determination of Phosphorus Content—Spectrometric Method. ISO: Geneva, Switzerland, 1998.
  34. ISO 6869:2000; Animal Feeding Stuffs—Determination of the Contents of Calcium, Copper, Iron, Magnesium, Manganese, Potassium, Sodium and Zinc—Method Using Atomic Absorption Spectrometry. ISO: Geneva, Switzerland, 2000.
  35. Hodson, M.J.; Evans, D.E. Aluminium-silicon interactions in higher plants: An update. J. Exp. Bot. 2020, 71, 6719–6729. [Google Scholar] [CrossRef]
  36. Patra, A.; Sharma, V.K.; Jatav, H.S.; Dutta, A.; Rekwar, R.K.; Chattopadhyay, A.; Trivedi, A.; Mohapatra, K.K.; Anil, A.S. Iron in the Soil-Plant-Human Continuum; Academic Press: Cambridge, MA, USA, 2021; ISBN 9780323909433. [Google Scholar] [CrossRef]
  37. Lyu, S.; Wei, X.; Chen, J.; Wang, C.; Wang, X.; Pan, D. Titanium as a beneficial element for crop production. Front. Plant Sci. 2017, 8, 597. [Google Scholar] [CrossRef]
  38. Wilson, M.J. The importance of parent material in soil classification: A review in a historical context. CATENA 2019, 182, 104131. [Google Scholar] [CrossRef]
  39. Sanjai, J.P.; Bruce, R.J. Soil: The Foundation of Agriculture. Available online: https://www.nature.com/scitable/knowledge/library/soil-the-foundation-of-agriculture-84224268/ (accessed on 15 May 2024).
  40. Iron 2022, 1–7. Available online: https://www.incitecpivotfertilisers.com.au/contentassets/5d912d3ebea9460e93c4c608c5277243/23-iron-fact-sheet.pdf (accessed on 15 May 2024).
  41. Robert, Š.; Milan, B.; Mateja, G. Geochemical Soil Survey at Jesenice area, Slovenia. Geologija 1999, 338, 319–338. [Google Scholar] [CrossRef]
  42. Alina, K.-P.; Barbara, S. 56 Zirconium. In Trace elements in Abiotic and Biotic Enviroments; CRC Press: Boca Raton, FL, USA, 2015; Volume 760, pp. 367–370. [Google Scholar]
  43. Shahid, M.; Ferrand, E.; Schreck, E.; Dumat, C. Behavior and impact of zirconium in the soil-plant system: Plant uptake and phytotoxicity. Rev. Environ. Contam. Toxicol. 2013, 221, 107–127. [Google Scholar] [CrossRef]
  44. Senesi, N.; Padovano, G.; Bruneti, G. Scandium, titanium, tungsten and zirconium content in commercial inorganic fertilizers and their contribution to soil. Environ. Technol. Lett. 1988, 9, 1011–1020. [Google Scholar] [CrossRef]
  45. Gyawali, S.; Otte, M.L.; Jacob, D.L.; Abderrazek, J.; Singh Verma, R.P. Multiple element concentration in the grain of spring barley (Hordeum vulgare L.) collection. J. Plant Nutr. 2019, 42, 1036–1046. [Google Scholar] [CrossRef]
  46. Jakobsone, I.; Zute, S.; Bleidere, M.; Kantane, I.; Bartkevičs, V. Macro and trace elements in barley (Hordeum vulgare L.) breeds in Latvia depending on variety, environment, and agricultural practice. Proc. Latv. Acad. Sci. Sect. B Nat. Exact Appl. Sci. 2018, 72, 54–64. [Google Scholar] [CrossRef]
  47. Francini, A.; Fidalgo-Illesca, C.; Raffaelli, A.; Sebastiani, L. Phenolics and Mineral Elements Composition in Underutilized Apple Varieties. Horticulturae 2022, 8, 40. [Google Scholar] [CrossRef]
Figure 1. SEM and EDS analysis examples of each soil sample, with the sample locations marked on a map (the Pannonian region of Slovenia).
Sustainability 16 08678 g001
Figure 2. Stitched FTIR microscopy images of residues taken from the G. Radgona filtered soil sample: (A) centre of filter and (B) bottom of filter.
Sustainability 16 08678 g002
Figure 3. Stitched FTIR microscopy images of the residues taken from the Murska Sobota filtered soil sample: (A) centre of filter and (B) bottom of filter.
Sustainability 16 08678 g003
Figure 4. Stitched FTIR microscopy images of residues taken from the Mljatinci filtered soil sample: (A) centre of filter and (B) bottom of filter.
Sustainability 16 08678 g004
Figure 5. Stitched FTIR microscopy images of residues taken from the Rakičan filtered soil sample: (A) centre of filter and (B) bottom of filter.
Sustainability 16 08678 g005
Figure 6. Stitched FTIR microscopy images of residues taken from the S. Cesta filtered soil sample: (A) centre of filter and (B) bottom of filter.
Sustainability 16 08678 g006
Figure 7. Stitched FTIR microscopy images of residues taken from the Selo filtered soil sample: (A) centre of filter and (B) bottom of filter.
Sustainability 16 08678 g007
Figure 8. Stitched FTIR microscopy images of residues taken from the Zbigovci filtered soil sample: (A) centre of filter and (B) bottom of filter.
Sustainability 16 08678 g008
Figure 9. SEM and EDS analysis examples of each crop sample.
Sustainability 16 08678 g009
Table 1. Elemental composition of the soil samples obtained from the EDS analysis.
CONaMgAlSiPKCaTiMnFeZr
SeloMean4.5756.160.560.738.9123.300.002.390.290.160.002.950.00
SD3.694.361.070.654.576.090.002.010.370.230.002.130.00
Max11.7968.215.142.5017.4142.040.009.131.340.670.008.200.00
Min0.0050.170.000.000.0016.370.000.000.000.000.000.000.00
GornjaMean11.2849.020.751.966.5016.780.041.492.460.370.029.330.00
RadgonaSD6.4213.551.052.412.835.840.131.402.981.580.1117.360.00
Max21.5861.413.709.6911.1632.790.566.5011.147.910.5583.410.00
Min0.000.000.000.000.000.270.000.000.000.000.000.000.00
MurskaMean5.0152.110.621.189.7418.230.132.320.572.990.027.100.00
SobotaSD4.066.590.960.743.555.520.191.981.099.180.097.750.00
Max12.2761.603.924.1115.3427.610.597.125.5342.430.4735.580.00
Min0.0029.360.000.000.360.650.000.000.000.000.000.580.00
MlajtinciMean4.7850.810.360.837.9316.950.072.010.205.830.619.630.00
SD4.958.810.760.474.029.740.191.830.3011.311.7410.310.00
Max21.1861.063.141.7714.6749.230.736.661.1335.258.0542.000.00
Min0.0021.720.000.000.420.910.000.000.000.000.000.000.00
ZbigovciMean9.9949.970.160.947.3014.730.101.860.352.320.008.923.36
SD16.348.060.420.634.287.120.241.590.607.310.009.8311.23
Max66.8960.111.922.1116.2725.980.787.032.5830.310.0032.7345.12
Min0.0021.900.000.000.002.160.000.000.000.000.000.000.00
StaraMean4.4053.570.300.9510.2622.010.022.250.160.310.005.750.00
CestaSD4.223.520.531.173.815.610.102.220.280.470.004.000.00
Max13.6057.681.724.6617.9241.800.508.081.031.920.0018.530.00
Min0.0042.510.000.001.5513.490.000.000.000.000.000.730.00
RakičanMean7.6053.190.600.887.0216.210.071.090.492.470.1210.280.00
SD4.534.791.310.633.128.540.180.820.635.870.4912.780.00
Max13.7163.946.302.3911.4532.590.702.962.8620.922.4546.370.00
Min0.0043.240.000.000.841.100.000.000.000.000.000.620.00
All values are in weight%.
Table 2. Elemental composition of the soil for all the soil samples combined (the Pannonian region of Slovenia).
CONaMgAlSiPKCaTiMnFeZr
TotalMean6.8052.120.481.078.2418.310.061.910.652.060.117.710.48
SD8.028.100.941.214.017.670.171.801.476.840.7210.624.40
Max66.8968.216.309.6917.9249.230.789.1311.1442.438.0583.4145.12
Min0.000.000.000.000.000.270.000.000.000.000.000.000.00
All values are in weight%.
Table 3. Elemental composition of the crop samples obtained from EDS analysis.
CONaMgAlSiPClKCaTiFe
AppleMean489.32461.864.101.488.4119.540.000.009.311.990.003.98
SD134.52100.3512.451.6221.3856.060.000.005.962.340.004.90
Max763.60697.4057.707.0077.00252.300.000.0032.508.600.0015.80
Min150.80230.300.000.000.000.000.000.000.000.000.000.00
BarleyMean521.76396.941.111.190.0040.770.015.9527.961.870.002.42
SD109.9274.581.731.360.0093.740.077.5922.832.460.003.21
Max653.60513.007.805.300.00391.000.4029.60101.3011.700.0013.10
Min162.90188.300.000.000.000.000.000.003.300.000.000.00
CornMean566.45422.610.801.800.000.000.000.003.400.650.004.31
SD65.6865.320.963.930.000.000.000.003.680.860.0012.45
Max709.90511.203.6020.900.000.000.000.0014.303.000.0067.00
Min483.20283.200.000.000.000.000.000.000.000.000.000.00
PotatoMean351.71434.261.7410.1730.8783.690.032.8937.2310.898.6727.85
SD134.2682.334.2611.2236.28107.840.156.2330.3537.8434.8136.82
Max538.90563.7025.8050.80113.60419.500.9027.90138.40230.50167.00118.30
Min67.40167.300.000.000.000.000.000.003.900.000.000.00
Pumpkin
seed
Mean746.98226.050.404.900.000.006.160.0011.652.390.001.45
SD77.7871.110.666.550.000.0011.430.0017.794.980.003.02
Max890.70392.502.5026.000.000.0047.800.0093.2018.600.0014.30
Min559.8087.900.000.000.000.000.000.000.000.000.000.00
WheatMean577.83413.330.800.900.000.000.130.004.560.780.001.70
SD62.1558.801.231.230.000.000.670.005.601.600.003.09
Max677.50507.404.604.800.000.003.600.0022.007.600.0015.90
Min490.20320.100.000.000.000.000.000.000.000.000.000.00
All values are in g/kg, calculated from the weight% obtained from the EDS analysis.
Table 4. Elemental composition of the crop and fruit samples obtained from spectrometric and AAS analyses. The analyses were performed on the dried and ashed samples (dm—dry matter).
Ash
[g/kg dm]
P
[g/kg dm]
Mg
[g/kg dm]
K
[g/kg dm]
Na
[g/kg dm]
Fe
[mg/kg dm]
Ca
[g/kg dm]
Apple19.770.870.348.010.4367.80.29
Barley29.263.261.184.900.05301.30.24
Corn12.422.320.713.510.0224.50.03
Potato54.562.641.1424.100.30146.90.42
Pumpkin seed45.159.974.308.340.06285.00.21
Wheat16.913.441.094.200.0224.50.03
Disclaimer/Publisher’s Note: The statements, opinions and data contained in all publications are solely those of the individual author(s) and contributor(s) and not of MDPI and/or the editor(s). MDPI and/or the editor(s) disclaim responsibility for any injury to people or property resulting from any ideas, methods, instructions or products referred to in the content.

