Article

The Synergistic Effect of the Carbon Emission Trading Scheme on Pollution and Carbon Reduction in China’s Power Industry

1
College of Architecture and Environment, Sichuan University, Chengdu 610065, China
2
College of Carbon Neutrality Future Technology, Sichuan University, Chengdu 610065, China
*
Author to whom correspondence should be addressed.
Sustainability 2024, 16(19), 8681; https://doi.org/10.3390/su16198681
Submission received: 2 September 2024 / Revised: 26 September 2024 / Accepted: 30 September 2024 / Published: 8 October 2024

Abstract

:
The synergistic effect of pollution and carbon reduction can alleviate the dual pressure of improving environmental quality and reducing greenhouse gas emissions in China. The carbon emission trading scheme (CETS) is a crucial market-based tool for carbon emission reduction, and understanding its synergistic impact on air pollution control is essential. Based on data from 30 provincial panels in China spanning from 2007 to 2021, we employ the difference-in-differences (DID) method to analyze the synergistic effects of the carbon emission trading plan in the power industry and its influence mechanisms are examined. We observe that the CETS significantly enhances both pollution and carbon reduction in China’s power sector, particularly demonstrating effective synergy in reducing CO2, SO2, and PM2.5 emissions. Furthermore, mechanism analysis reveals that the CETS achieves joint emission reductions by lowering energy consumption, influencing the power industry’s generation structure, promoting technological innovation among enterprises, and thereby realizing synergistic pollution and carbon reduction effects in China’s power sector. Heterogeneity analysis shows that regions with limited power facility, low electricity generation, and small economic scale exhibit the most pronounced synergistic benefits from pollution and carbon reduction efforts.

1. Introduction

China, being the largest consumer of energy and the top emitter of carbon dioxide globally, also ranks first in the emission of sulfur dioxide, nitrogen oxides, and various other air pollutants [1,2,3]. Based on this, China has set ambitious carbon reduction targets for 2030 [4], with the goal of reaching peak carbon emissions by 2030 and attaining carbon neutrality by 2060 [5]. The implementation plan for reducing pollution and carbon emissions, along with enhancing synergistic efficiency, aims to achieve notable outcomes by 2030. It emphasizes the coordinated efforts in key areas of air pollution prevention and control to promote both carbon peak and air quality improvement in China [6]. Relevant studies confirm that air pollutants and greenhouse gasses share common origins [7,8,9]. During economic development, the combustion of fossil fuels releases significant amounts of air pollutants such as particulate matter, sulfur dioxide, and nitrogen oxides into the atmosphere, alongside greenhouse gasses like carbon dioxide, methane, and nitrous oxide [10,11]. Production and daily activities also contribute to substantial emissions of air pollutants and greenhouse gasses, including agricultural production and household waste disposal [12,13,14,15]. Consequently, collaborative governance of pollution and carbon reduction is essential for China as it navigates a pivotal phase in its transition to a low-carbon economy.
Existing studies have explored the synergistic effect between reductions in air pollutant emissions and greenhouse gasses. Liu et al. (2021) [16], who used a DID model, indicate that China’s carbon emission trading system effectively reduces carbon dioxide emissions while simultaneously coordinating PM2.5 reductions. This is accomplished by incentivizing businesses to adopt emission reduction strategies and modify their industrial structures, with the most significant impacts noted during the summer months. Dong et al. (2019) [17] appropriately extended the basic Kaya identity model, considering the synergistic effect of carbon dioxide emissions on PM2.5 emissions, and concluded that reducing carbon emissions significantly reduces sulfur emissions. Some scholars also focus on various environmental policies and analyze their synergies, including the carbon emission trading system [18,19], low-carbon city policies [20], and pollution control regulations [1,21].
As a market mechanism for reducing carbon dioxide emissions, the carbon emission trading scheme (CETS) is widely regarded by scholars as the most effective means to achieve greenhouse gas emission reduction targets at lower social costs [22,23,24,25,26,27,28]. Feng et al. (2024) [29] used the STSA algorithm to predict carbon emissions. Huang et al. (2023) [30] studied the Maritime Emissions Trading Scheme (METS). In recent years, the synergistic effects of emission reductions from the CETS in China have received significant attention, yet consensus remains elusive. Several scholars have validated the synergistic impact of carbon trading on reducing emissions of additional pollutants. Liu et al. (2021) [16] analyzed the impact of the carbon trading pilot on PM2.5 using the DID method and found that the policy reduced PM2.5 concentrations in the pilot area by 4.8%. However, studies have found that certain emission reduction measures aimed at a single pollutant may inadvertently lead to increases in other air pollutants [31,32,33,34]. Moreover, some researchers contend that the synergistic effect of carbon trading primarily occurs through the concurrent reduction of SO2 and carbon dioxide emissions [35,36,37], attributable to the high proportion of sulfur elements in Chinese fossil fuels compared to other pollutants [35]. Thus, significant debate persists about the synergistic effects of implementing the CETS on different atmospheric pollutants and carbon dioxide emissions. Existing studies suggest that the CETS has the potential to promote synergistic emissions reductions, but uncertainty and controversy about its effectiveness remain. Future studies are needed to more deeply explore the interactions between different pollutants and how the policy design can be optimized to achieve broader environmental benefits. Furthermore, researchers should focus on the synergistic effects of CETS across various regions and industries, so as to provide better technical support for the implementation of national and regional policies.
In 2017, China’s National Development and Reform Commission released the Plan for the Construction of the National Carbon Emission Trading Market, specifically aimed at the power generation sector, marking the official inception of the national carbon market [38]. The power sector is a major contributor to air pollutants and greenhouse gas emissions across production and consumer industries, generating significant amounts of air pollutants and carbon dioxide emissions that contribute to environmental degradation and climate change. In 2020, emissions from coal-fired power generation in China comprised 43.5% of CO2, 13.1% of NOx, 13.2% of SO2, and 3.8% of PM from total industrial emissions, respectively [39,40,41]. Historically, most studies have concentrated on industries that generate the highest levels of carbon emissions [42,43], neglecting the power sector which, alongside transportation and industry, comprises China’s top three carbon-emitting sectors.
Building on this, this study centers on the carbon emission trading mechanism, using the electric power industry as its research subject. It analyzes carbon dioxide emissions and major atmospheric pollutants (SO2, NOx, PM2.5) data from 2007 to 2021 across provinces and cities, employing the difference-in-differences method to quantify the synergistic emission reduction effects of the CETS. Furthermore, it examines the pathways through which the CETS affects both pollution reduction and carbon reduction within the power industry. Results indicate that under the CETS implementation, a synergistic effect exists between carbon emissions and atmospheric pollutant emissions in China’s power sector, with the strongest synergy observed between CO2 and PM2.5. The synergistic reduction in pollution and carbon emissions in China’s power industry primarily occurs through pathways affecting energy consumption, power generation outcomes, and technological innovation. Heterogeneity analysis reveals that variations in power facility levels significantly impact CO2 and SO2 emissions across different regions. Differences in electricity generation also notably affect SO2 emissions, while variations in economic scale affect SO2 and NOx emissions. Hence, regions with lower power facility levels, electricity generation, and economic scale exhibit the most significant synergistic effects. These findings can facilitate coordinated monitoring of air pollution control and carbon dioxide emission reduction across various industries.
The primary contributions of this paper are as follows. First, regarding the research subjects, existing studies on synergistic emission reduction effects primarily concentrate on the national level or specific regions, with only a limited number examining particular industries [43,44,45]. The research on collaborative emission reduction in the power industry with huge emissions still needs to be improved. This study addresses this gap by focusing specifically on China’s power industry, providing insights into emission reduction technology options and enhancing the implementation of the CETS across various industries. Second, existing research predominantly examines the CETS’s impact on carbon emission reduction [46,47,48], overlooking its synergistic effects on both carbon emissions and air pollutants. This paper examines how the CETS facilitates synergistic reductions in pollution and carbon emissions in China, emphasizing the importance of energy consumption, power generation structure, and technological innovation within the power industry. Third, many power industry enterprises may increase energy consumption and pollutant production due to installing desulfurization, denitrification, and dust removal facilities [49]. This paper tackles the debate over the synergistic effects of pollution and carbon reduction in the power industry by analyzing the impact of the CETS, confirming its beneficial role in promoting both pollution and carbon reduction. Finally, we examined the varied impact of the CETS on the synergy between pollution and carbon reduction in China’s power industry. By examining power facility levels, electricity generation, and economic scale across regions, we identified significant synergistic effects in regions with lower facility levels, electricity generation, and economic scale. This insight guides the selection and prioritization of CETS implementation areas.
The rest of this paper is structured as follows. Section 2 presents the research background and theoretical hypotheses. Section 3 outlines the research design. Section 4, Section 5 and Section 6 detail the empirical results; and the final section offers conclusions and policy implications.

2. Research Background and Theoretical Assumptions

2.1. Policy Background

The concept of the carbon emissions trading mechanism, aimed at reducing carbon dioxide emissions [50], originated in the early 1990s. Coase (1960) [51] argued that while carbon taxes can reduce carbon dioxide emissions to some extent, government intervention disrupts market resource allocation. He proposed an alternative: treating negative externalities as commodities tradable in a market with clear property rights, satisfying the interests of all relevant parties. This approach allows negative externalities to be traded as commodities with clear property rights, satisfying the interests of all parties involved in the market mechanism. This method not only fulfills the market’s resource allocation function but also enhances overall societal welfare. The carbon emissions trading system emerged from this theoretical basis. As environmental issues have gained prominence, economists have increasingly explored market mechanisms to address them, including greenhouse gas emissions reduction.
China’s carbon emissions trading system started later and is smaller in scale compared to other CETS markets worldwide, but it is rapidly developing [52]. China initiated its carbon emissions trading pilot program in 2011. Launched in 2013, the pilot program encompassed seven provinces and municipalities: Beijing, Tianjin, Shanghai, Chongqing, Guangdong, Hubei, and Shenzhen, following comprehensive considerations of regional conditions and foundational work. In 2017, China’s National Development and Reform Commission (NDRC) issued the “National Carbon Emissions Trading Market Construction Programme (Power Generation Sector),” officially establishing the national carbon market [53]. In 2015, China introduced the concept of “coordinated control of air pollutants and greenhouse gas emissions” in the Air Pollution Prevention and Control Law for the first time [54]. The “Implementation Programme of Pollution Reduction, Carbon Reduction and Synergistic Enhancement” proposes that by 2030, synergistically promoting carbon peaking and enhancing air quality in critical areas of China’s air pollution prevention and control is expected to yield significant results [6]. Currently, China’s ecological civilization construction faces two strategic imperatives: essentially enhancing the ecological environment and reaching carbon neutrality. Advancing synergistic pollution and carbon reduction has emerged as a crucial strategy for the comprehensive green transformation of China’s economic and social development in this new phase of growth.

2.2. Theoretical Assumptions

2.2.1. Synergistic Effect of the CETS on Pollution and Carbon Reduction

China’s carbon emissions trading market has effectively contributed to a reduction in air pollution and carbon dioxide emissions through a variety of means, including economic incentives, technological innovation, data transparency, international cooperation, and legal and policy support. Hu et al. (2020) [55] pointed out that as the cost of carbon emissions rises, firms have an incentive to invest in more efficient energy technologies and low-carbon technologies, such as renewable energy and energy efficiency enhancement technologies, thereby reducing their dependence on fossil fuels and their carbon emissions. Moreover, the carbon market requires companies to report their carbon emissions data on a regular basis and through third-party verification, which increases the transparency and accuracy of the data [56]. Greenhouse gasses and atmospheric pollutants originate predominantly from fossil fuel combustion [57,58], necessitating integrated control strategies rather than isolated approaches [1,21]. The alignment of policy frameworks and strategies for reducing carbon emissions underscores their fundamental consistency [59]. Beyond end-of-pipe dust control measures, policies emphasize coordinated emissions management [60]. This integrated approach represents a critical climate policy for effectively reducing carbon emissions [50,61,62,63,64,65]. Given its status as China’s primary carbon emitter, the power industry significantly contributes to air pollution [66,67,68,69,70,71]. Building on the preceding analysis, we propose Hypothesis 1:
Hypothesis 1.
The implementation of the CETS may produce a synergistic effect on pollution and carbon reduction within China’s power sector.

2.2.2. Mechanisms of CETS Pollution and Carbon Reduction

The CETS aims to reduce overall energy consumption and achieve “double control” over both total energy consumption and its intensity. Enterprises participating in the CETS initially implement measures to curtail carbon emissions to meet allocated quotas [72,73]. Energy consumption is the primary source of CO2 and air pollutants [58,74], thus reducing energy usage correlates with decreased emissions of air pollutants [75]. As the largest energy consumer across various industries in China [76], the power industry’s adoption of a CETS has the potential to concurrently lower CO2 and air pollutant emissions through reduced energy consumption. Building on the preceding analysis, we propose Hypothesis 2:
Hypothesis 2.
The implementation of the CETS facilitates synergistic pollution and carbon reduction in China’s power sector by lowering energy consumption.
Following CETS implementation, the cost of traditional fossil energy sources such as coal has escalated [77], compelling enterprises to increase their reliance on clean energy and decrease coal consumption to meet emission targets [19]. In the power sector, Pahle et al. (2011) [78] and Denny et al. (2009) [79] observed that the CETS introduction prompted power plants to phase out thermal power facilities due to increased costs. Consequently, with the CETS in place, the proportion of clean energy generation—such as hydropower, wind power, and solar power—will rise, while thermal power generation will decline [80], thereby optimizing the overall power generation structure of the region. China’s reliance on coal in its energy structure has resulted in a power generation landscape dominated by thermal power in the industry [81,82]. As thermal power is a significant contributor to carbon emissions and air pollutants [83,84], reducing its share will realize synergistic effects in pollution and carbon reduction. Building on the preceding analysis, we propose Hypothesis 3:
Hypothesis 3.
The implementation of the CETS achieves synergistic pollution and carbon reduction in China’s power sector by influencing the power generation structure.
The innovation compensation effect [85] of the CETS enables enterprises to gain a competitive advantage. To ensure long-term development, enterprises adopt innovative technologies to reduce carbon emissions. Technological innovation enhances energy efficiency [86], decreases per-unit emissions [87], optimizes energy consumption structures, and consequently reduces both carbon and air pollutant emissions [88,89,90]. Research indicates that the CETS stimulates technological innovation in the power industry, thereby enhancing energy structures and yielding positive economic and environmental benefits [45,78,79,91]. Building on the preceding analysis, we propose Hypothesis 4:
Hypothesis 4.
The implementation of the CETS achieves synergistic pollution and carbon reduction in China’s power sector by stimulating technological innovation.

3. Research Design

3.1. Methodology

Compared with previous models, the difference-in-differences (DID) model as a representative model is valid and reliable. The advantage of the DID model lies in its ability to control for non-time-varying heterogeneity and mitigate endogeneity due to omitted variables, with policy evaluations typically unaffected by reverse causality issues. Therefore, we use the CETS as a “natural experiment” to construct difference-in-differences models, using 2013 as the policy shock date. The seven pilot regions of China’s carbon emissions trading policy are designated as the experimental group, while other provinces and cities serve as the control group. The following model is then constructed.
Y i t = β 0 + β 1 N i t T i t + λ X i t + μ i + δ t + ε i t
where i denotes the region and t denotes the year; the dependent variable Y i t is the CO2 or air pollutants emissions from the power sector in region i at time t, which are, respectively, expressed as CO2 emissions, SO2 emissions, NOx emissions, and PM2.5 concentrations; N i t is a policy dummy variable, which is taken as 1 in the pilot region and 0 otherwise; T i t is a time dummy variable that takes 0 before the policy occurs and 1 after; N i t T i t is the interaction term of dummy variables N i t and T i t , representing policy implementation; β 1 is the coefficient of interest, which measures the net effect of the policy, with negative coefficients indicating that a negative coefficient indicates that policy implementation reduces pollutant emissions and vice versa; X i t represents a series of control variables, including industrial structure, urbanization level, economic development level, openness to the outside world, energy structure, R&D investment, environmental regulation, and power generation structure; μ i denotes a regional fixed effect; δ t denotes a time fixed effect; ε i t is the random perturbation term.

3.2. Data Description

By collecting, screening, and calculating data from sources such as China’s National Statistical Yearbook, the CEADs database, and the MEIC database, this study obtained the average annual emissions of CO2 and three air pollutants (SO2, NOx, and PM2.5) from the power industry across 30 provinces and municipalities in China (excluding the Tibet Autonomous Region) for the years 2007 to 2021, along with related control variables. CO2 emissions from the power industry were calculated using the carbon emission factors established by the United Nations Intergovernmental Panel on Climate Change (IPCC). The specific definitions and sources of the data are detailed in Table 1. To mitigate the impact of heteroscedasticity on the estimation results, all variables (except ratio and dummy variables) were log-transformed.

3.3. Descriptive Statistics

Table 2 shows the descriptive statistics of the variables for the period 2007–2021. A significant disparity exists between the experimental group and the control group, with CO2 and SO2 concentrations lower in the pilot region than in the nonpilot region, but the concentrations of NOx and PM2.5 are greater, suggesting that the composition of the sources of NOx and PM2.5 may be different from that of other pollutants. The level of economic development, industrial structure, urbanization level, and degree of opening up to the outside world of the pilot areas are significantly greater than those of the nonpilot areas, the structure of power generation is reasonable, and investment in scientific and technological research and development is substantially higher than in the nonpilot areas, but the investment in environmental governance in the nonpilot areas is somewhat greater than that of the pilot areas.

4. Empirical Results

4.1. Benchmark Results

To ensure the reasonableness and robustness of the results, we used a regression with progressively increasing fixed effects and control variables, and the main results are presented in Table 3. Model (1) conducts a simple baseline regression analysis and provides simple regression results for the core explanatory variables, Model (2) accounts for city fixed effects and time fixed effects in addition to those in Model (1), while Model (3) incorporates eight control variables to enhance the reliability of the findings.
The results in Table 3 indicate that all regression coefficients are negative, with most being statistically significant at the 1% level. This suggests that the policy implementation had a substantial emission reduction effect on CO2 and the three air pollutants, regardless of whether control variables are included. The coefficients of the cross terms in Model (3) show a significant improvement in model explanation upon adding control variables, with policy implementation variables yielding coefficients less than zero at the 0.01 significance level. This indicates that carbon emissions trading significantly reduces CO2 and air pollutant emissions; specifically, CO2 emissions decreased by 75.3%, SO2 by 31.1%, NOx by 18.4%, and PM2.5 by 50.7%. Notably, the synergistic emission reduction effect of CO2 with SO2 and PM2.5 is the most pronounced.
The data indicate that the implementation of the carbon emissions trading market has a notable synergistic effect on pollution and carbon reduction within the power industry.

4.2. Robustness Test

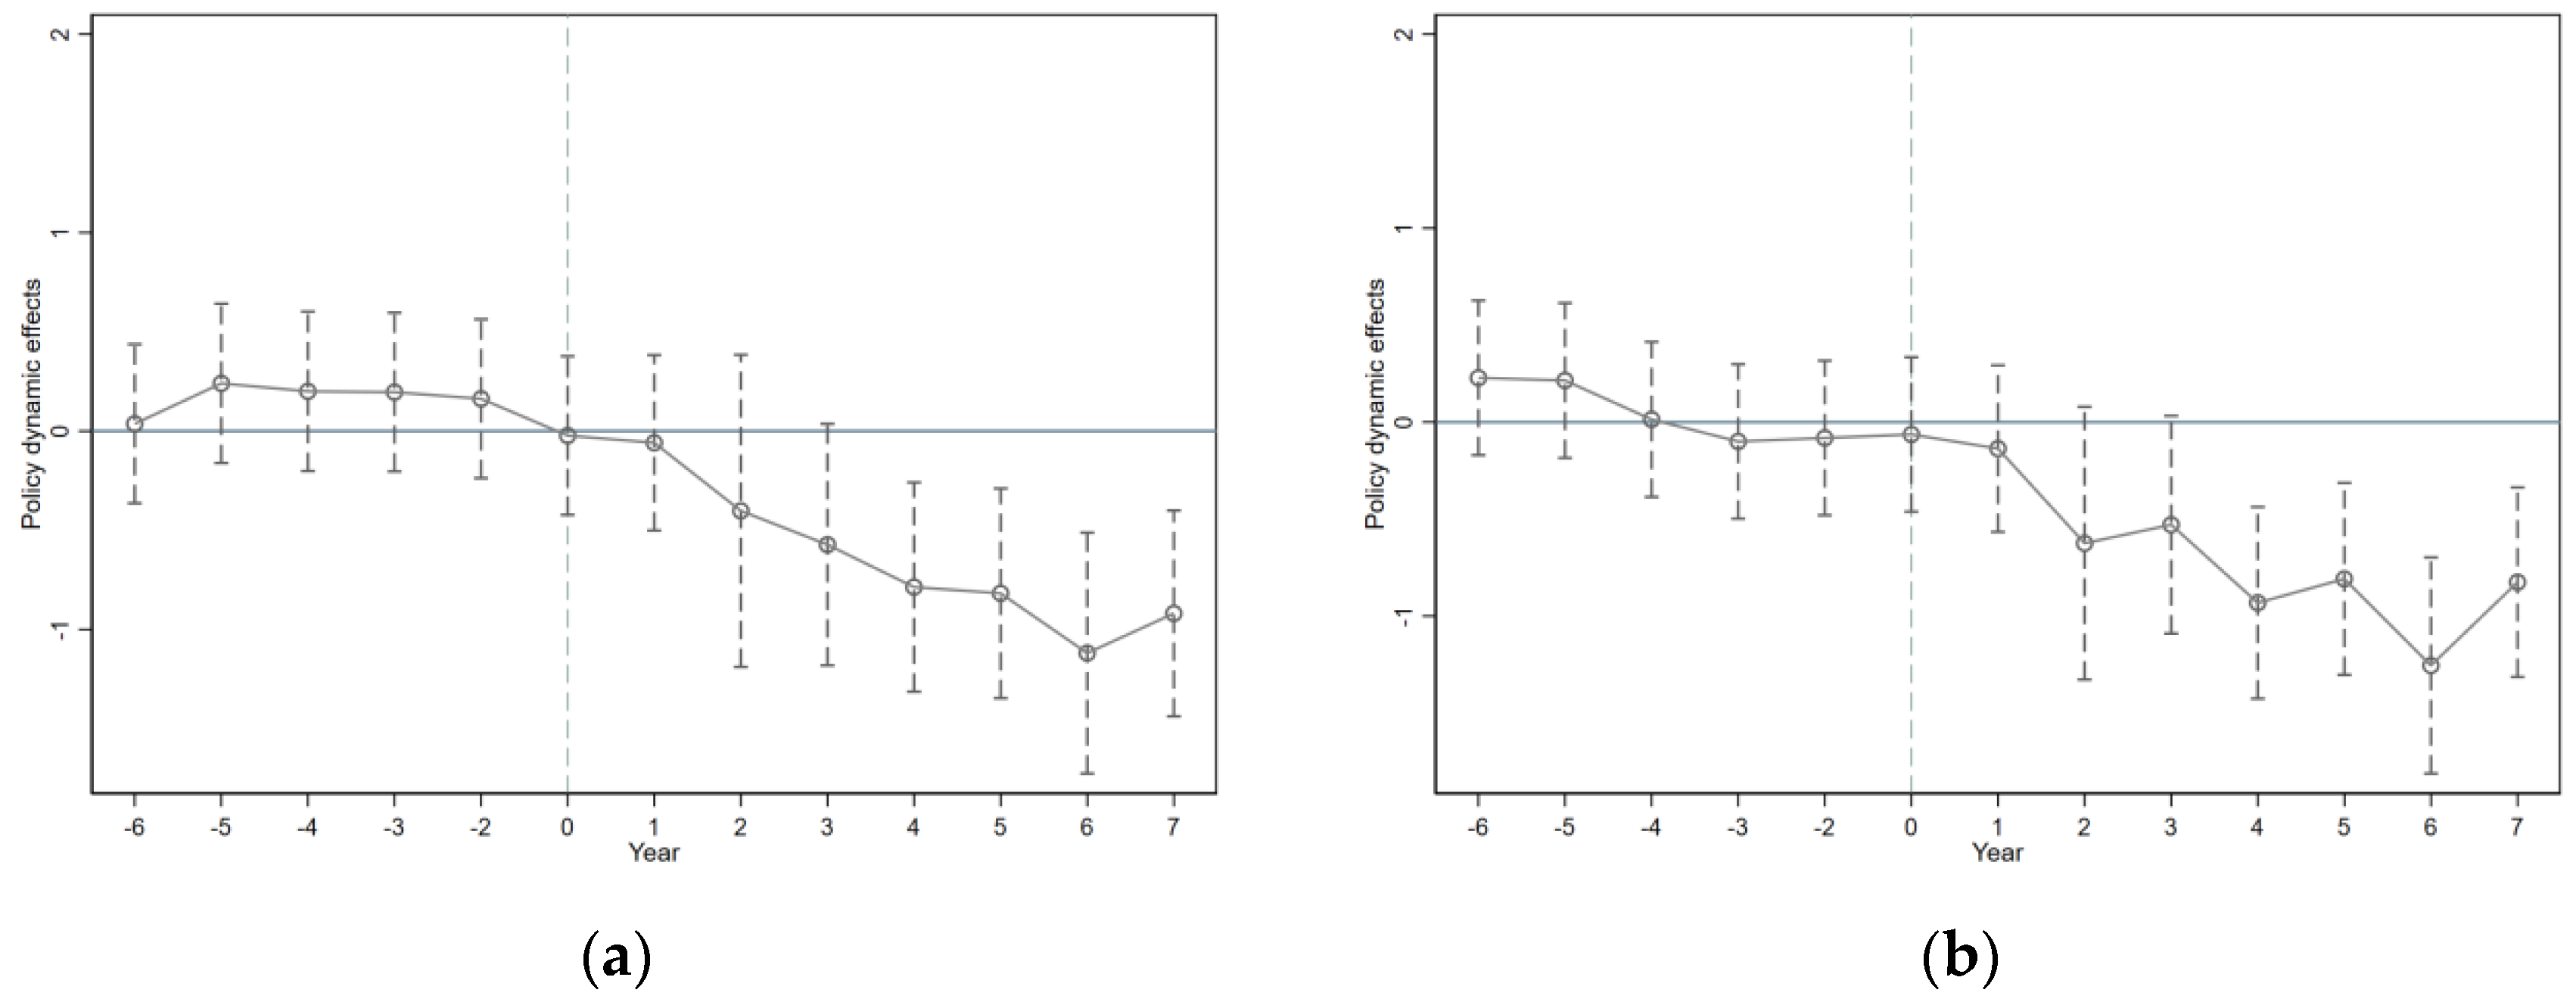
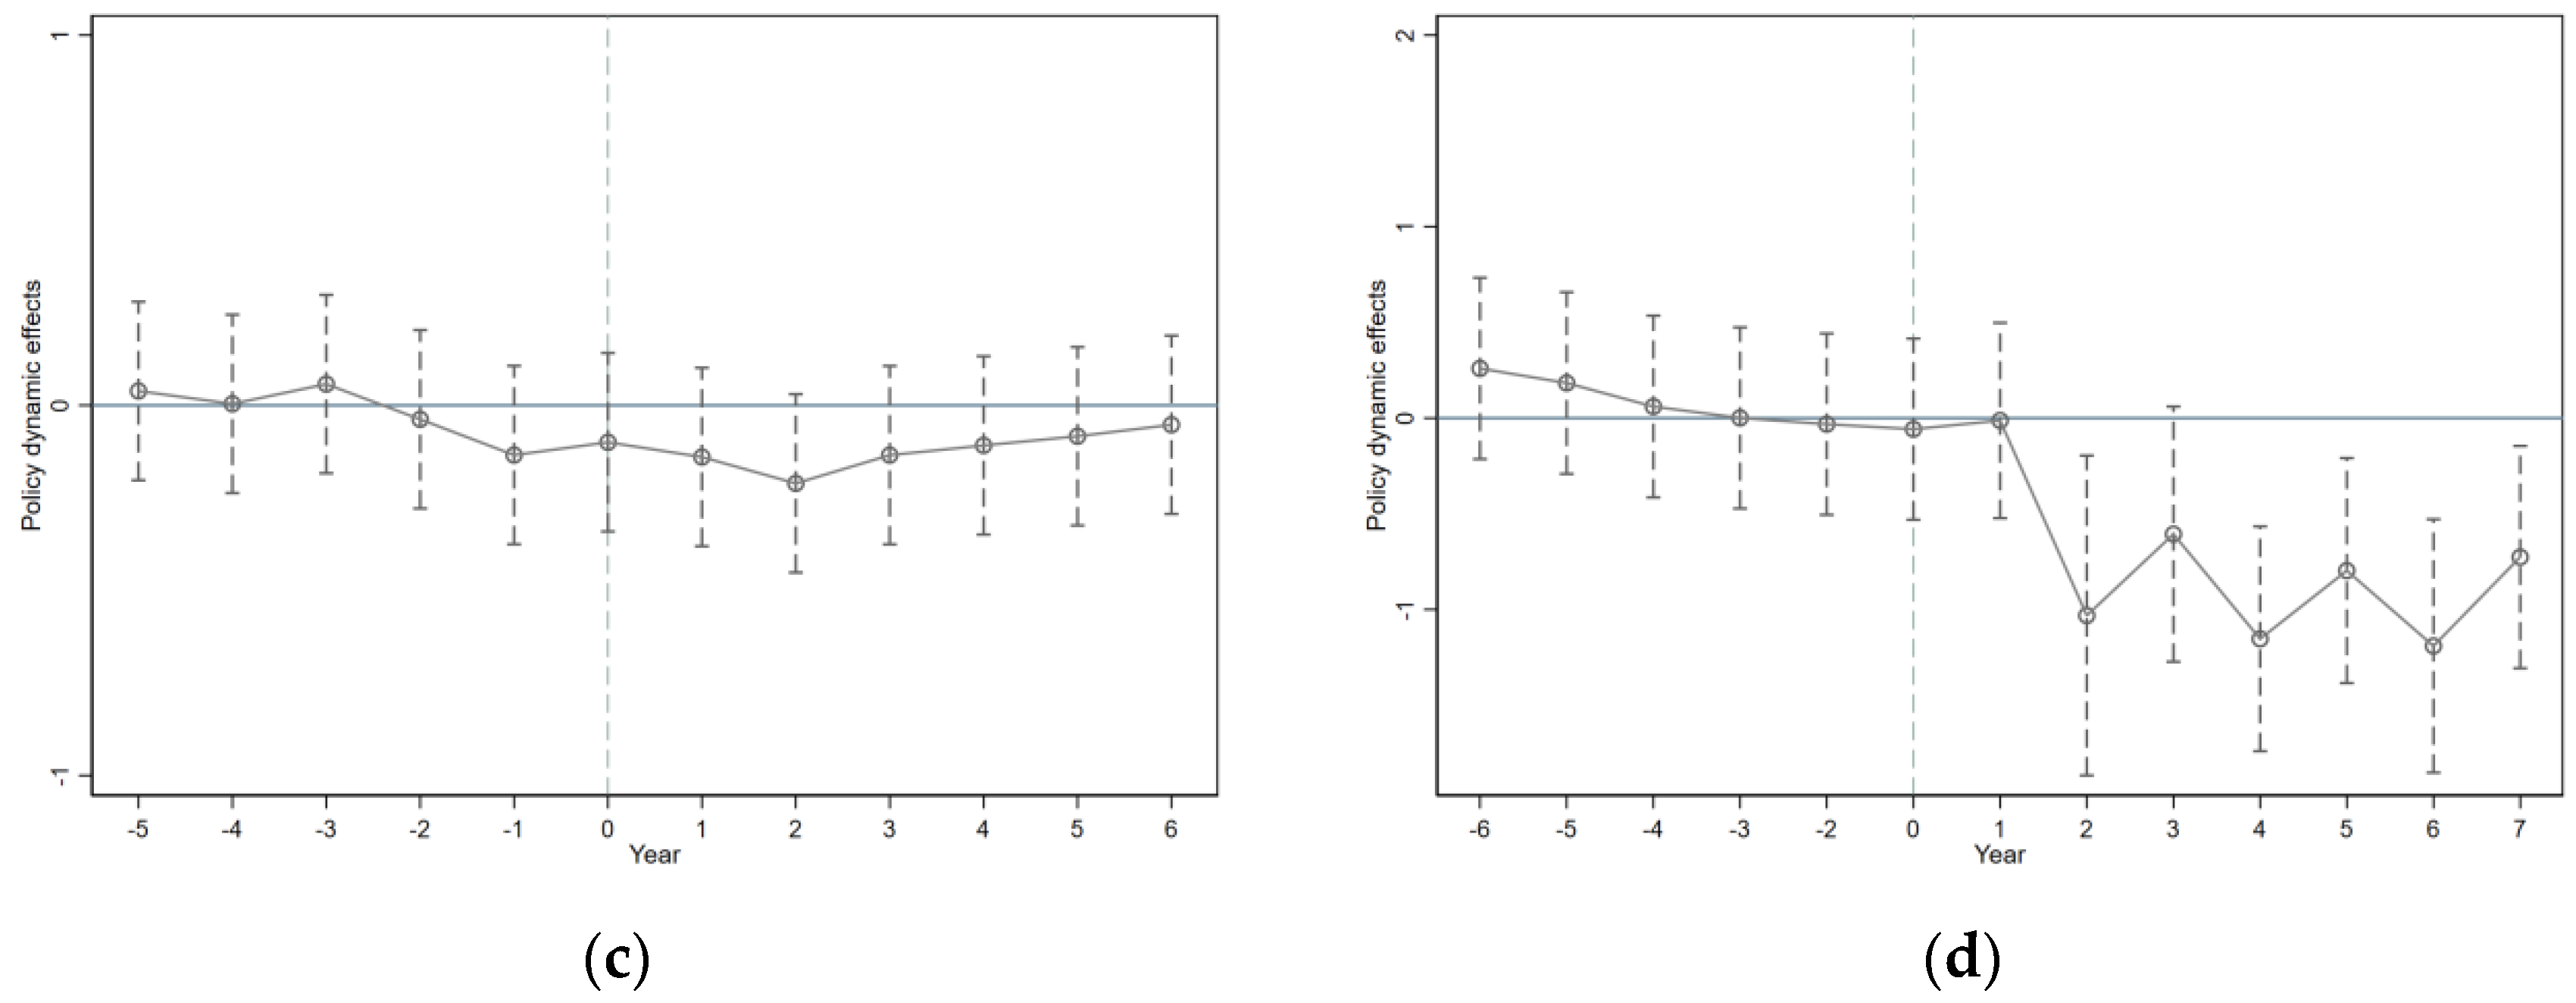
4.2.1. Parallel Trend Test
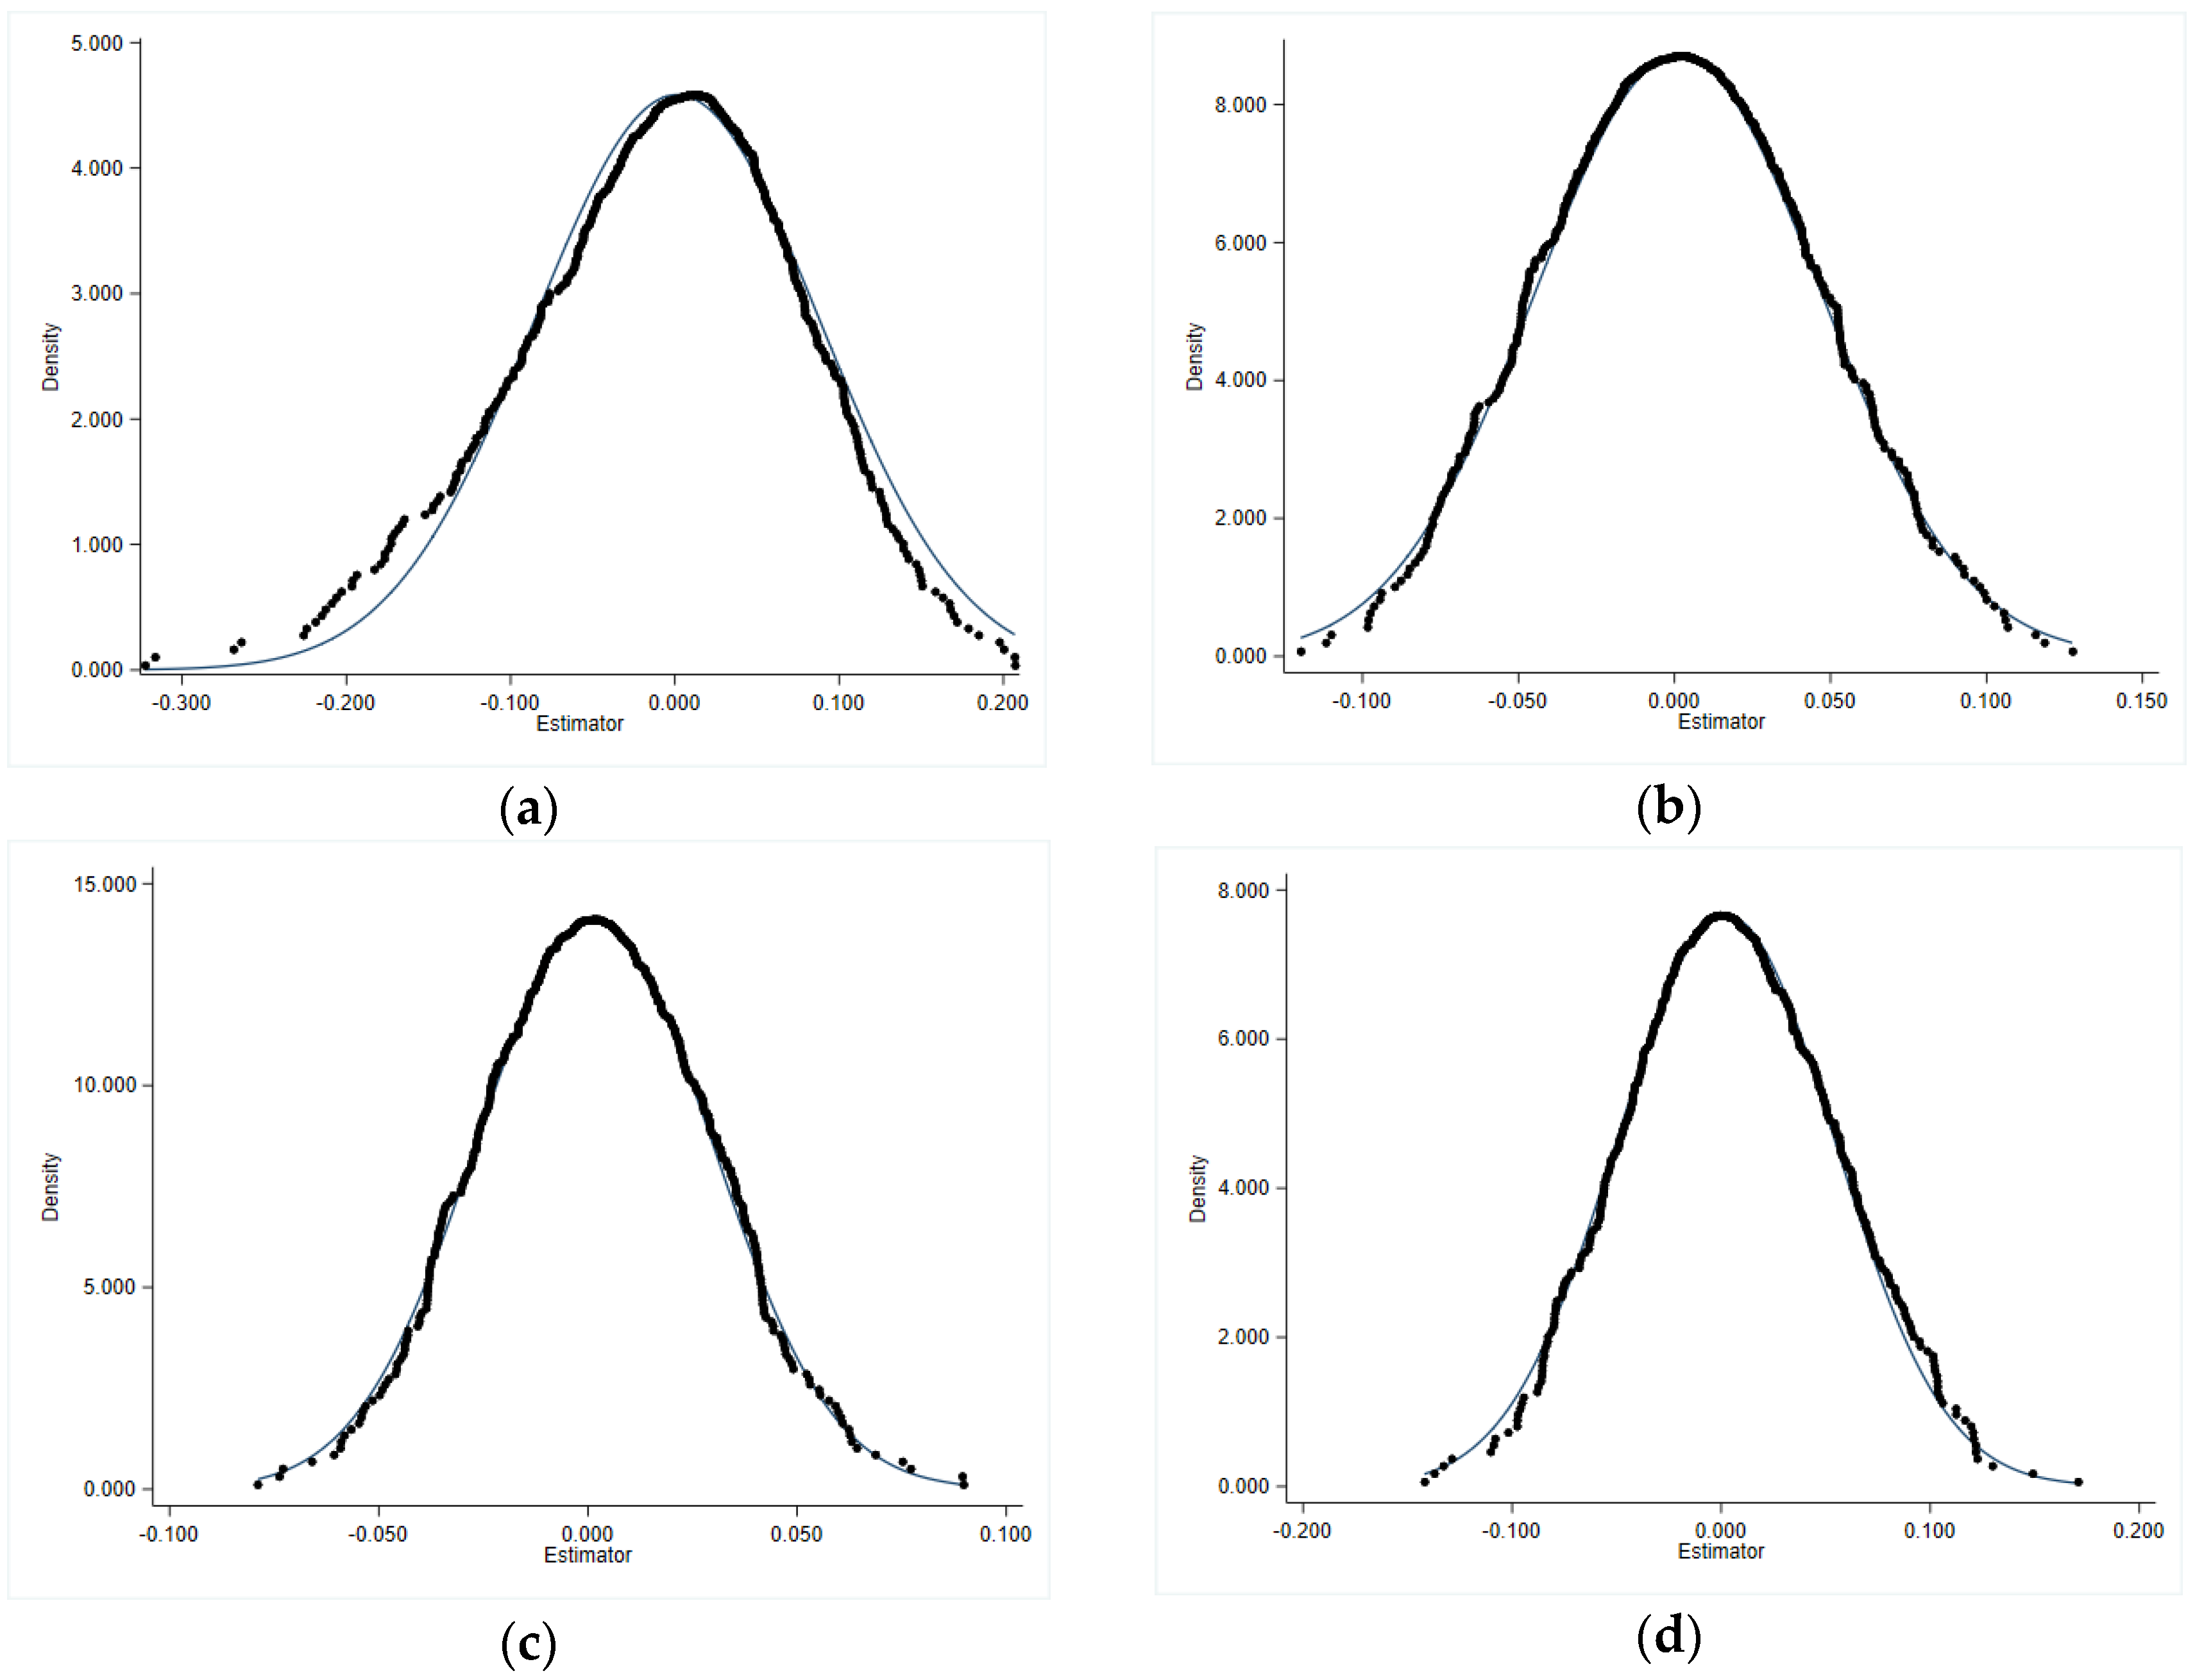
The estimation of policy effectiveness using the double difference method relies on the prerequisite that the experimental and control groups exhibit identical growth trends prior to experiencing the policy shock. Therefore, conducting a parallel trend analysis of the explanatory variables becomes imperative. In this study, lagged virtual variables were introduced for each year preceding the implementation of the carbon emission trading market policy. These variables were subsequently interacted with by the experimental group’s virtual variables. The resulting interaction terms, combined with the core DID explanatory variables, were utilized in the regression analysis of carbon dioxide and atmospheric pollutant emissions.
Figure 1a–d illustrate the results of emission tests for CO2, SO2, NOx, and PM2.5. The coefficient β t (t = −5 to 0) is not significant, confirming that the DID model satisfies the parallel trend assumption. Analyzing the annual dynamic changes post-implementation of the CETS reveals that the regression coefficients β t (t = 1 to 7) for CO2, SO2, and PM2.5 emissions are generally significantly negative, indicating an overall decreasing trend in these emissions, as shown in Figure 1a,b,d. This suggests that the CETS has a dynamic impact on reducing CO2, SO2, and PM2.5 emissions. Although the regression coefficient β t (t = 1 to 7) for SO2 is negative, it is not statistically significant, indicating that while the CETS contributes to reducing SO2 emissions, it is not a primary factor and lacks a dynamic effect.

4.2.2. Placebo Test

For different provinces and cities with many other different traits, some of their traits may have different impacts over time, thus affecting the identification assumptions. Therefore, we first establish controls for a set of observable key city characteristics, including industrial structure, urbanization level, economic development level, openness to the outside world, energy structure, R&D intensity, environmental regulations, and power generation structure. However, for the effects of uncontrollable characteristics, especially unobservable characteristics, we employ an indirect placebo test. The results are shown in Figure 2, where it can be seen that the distribution of the test regression coefficients for all four models is concentrated at approximately 0, which shows that the randomly sampled sample mix has no impact on the effect of policy implementation. Therefore, it can be concluded that the baseline regression results, which differentiate between the experimental and control groups based on participation, are robust.

5. Further Analysis

According to the above analysis, the CETS significantly reduces carbon dioxide and air pollutant emissions, achieving synergistic emission reduction in China’s electric power industry and enhancing environmental quality. This supports Hypothesis 1. Further, to test Hypotheses 2–4, we explore the mediating effects of energy consumption, power generation structure, and technological innovation on the synergistic effect of pollution and carbon reduction through the influence of the CETS. The following mediation effect model is constructed with reference to Reuben M. Baron and David A. Kenny [92]:
Y i t = β 0 + β 2 N i t T i t + λ X i t + μ i + δ t + ε i t
M i t = β 0 + β 3 N i t T i t + λ X i t + μ i + δ t + ε i t
Y i t = β 0 + β 4 N i t T i t + α 1 M i t + λ X i t + μ i + δ t + ε i t
Since some of the mediating variables are included in the control variable X i t in Model (1), to ensure consistency of the test, X i t in Model (2)–(4) removes the energy structure and industrial structure compared to X i t , and the final control variables include urbanization level, level of economic development, degree of openness to the outside world, R&D intensity, environmental regulation, and power generation structure. M i t is the mediating variable.
First, Model (2) is regressed such that if β 2 is significant, it indicates that policy affects Y i t emissions; second, Model (3) is regressed such that if β 3 is significant, it indicates that policy acts on the mediator variable; final, in regressing Model (4) to compare the coefficients of β 4 with those of the policy implementation without the inclusion of the mediating variable M i t , the size of β 2 , if β 4 is smaller than β 2 or the significance level decreases, this suggests that there is a mediating effect.
The results of the mediating effect model test are shown in Table 4, Table 5 and Table 6.

5.1. Energy Consumption

The dummy variables for the treat × time in columns (2) and (5) of Table 4 are all significantly negative, indicating that the CETS has a substantial negative effect on total energy consumption. This means that total energy consumption in the pilot areas decreases significantly following the policy implementation. In columns (3) and (6), both the core dummy variable treat × time and the mediator variable energy consumption are included simultaneously. The regression coefficients for treat*time remain significantly negative, while those for energy consumption are significantly positive, indicating a strong correlation between energy consumption and both carbon dioxide and sulfur dioxide emissions. This demonstrates that a higher total energy consumption correlates with increased emissions. Compared to columns (1) and (4), treat × time remains negative at the 1% significance level, but its absolute value slightly decreases. This suggests that the CETS achieves the synergistic effect of pollution and carbon reduction in the electric power industry by lowering total energy consumption, thus confirming the mediating role of energy consumption and verifying Hypothesis 2.

5.2. Generation Structure

The dummy variable treat*time in columns (2) and (5) of Table 5 is significantly negative, indicating that carbon emissions trading policies have a substantial negative effect on the generation structure. Specifically, after the policy implementation, the share of thermal power generation in total generation within the pilot region decreases significantly. In columns (3) and (6), both the core dummy variable treat*time and the mediating variable generation structure are included, with the regression coefficients for treat*time remaining significantly negative, while those for generation structure are also significant. This suggests a significant relationship between the generation structure and both carbon dioxide and sulfur dioxide emissions. Compared to columns (1) and (4), the regression coefficient for treat*time remains significantly negative, although its absolute value slightly decreases. This indicates that the CETS facilitates pollution and carbon reduction in China’s power sector by adjusting the generation structure and reducing the proportion of thermal power generation, thereby confirming the mediating role of generation structure and verifying Hypothesis 3.

5.3. Technological Innovation

The dummy variable treat*time in columns (2) and (5) of Table 6 is significantly negative, indicating that the CETS has a substantial positive impact on technological innovation, suggesting that the implementation of the CETS has fostered technological advancements in the pilot region. In columns (3) and (6), both the core dummy variable treat × time and the mediator variable technological innovation are included, where the regression coefficient for treat × time remains significantly negative, consistent with the findings in columns (1) and (4). However, the absolute value of its coefficient decreases slightly, indicating that the CETS achieves pollution and carbon reduction in China’s power sector by promoting technological innovation. This supports the mediating role of technological innovation, thereby verifying Hypothesis 4. Overall, the results in Table 4, Table 5 and Table 6 reveal that the mediating effect of SO2 is notable, and similar findings are obtained for NOx and PM2.5. For brevity, Table 4, Table 5 and Table 6 show the regression results for CO2 and SO2.

6. Heterogeneity Test

The ideal situation for the DID model, as a natural experiment of sorts, is that the pilot and nonpilot cities are chosen randomly. However, the choice of relevant policies is mostly not random. Similarly, the determination of the list of pilot cities is not random: the list of pilot areas is closely related to the geographical location of the city, the existing economy, the level of social development and the degree of openness, etc., and these preexisting differences between the cities may have different impacts on the urban environment over time trends, which may result in biases in the estimates.

6.1. Differences in Power Facility

As essential infrastructure supporting urban survival, power facilities serve as the sole provider of electricity, crucial for accelerating economic development and ensuring public security. The installed power generation capacity serves as a pivotal metric to gauge the extent of public power infrastructure, reflecting the scale of the power system. Regional disparities in power facility size may influence their carbon and air pollutant emissions. To this end, the interaction term M1DID (M1DID = M1 × treat × time) of the dummy variable for the power facility and the core explanatory variable treat × time is further added to control the influence on the result estimation.

6.2. Differences in Power Generation

Coal power is still the dominant energy source in China’s current electricity supply, giving full play to the role of touting and guaranteeing supply; coal power is also the main source of carbon emissions and air pollutants emissions in the power sector, and this difference may have an impact on the benchmark results as power generation is higher in the five relevant provinces of China, Inner Mongolia, Guangdong Province, Jiangsu Province, Shandong Province, and Xinjiang, as compared to the other provinces. Therefore, the interaction term M2DID (M2DID = M2 × treat × time) between the dummy variable for electricity generation and the core explanatory variable treat × time is added to control for the effect on the estimation of the results.

6.3. Differences in Economic Development

Differences in the scale of provinces may lead to different manifestations of the impact of carbon emissions, and these differences may stem from a variety of factors such as the level of economic development, industrial structure, energy consumption patterns, geographic location, climatic conditions, policy orientation, and technological level of each province. As a policy instrument of environmental regulation, the carbon emissions trading mechanism may have different impacts depending on the size of provinces and cities. Therefore, the interaction term M3DID (M3DID = M3 × treat × time) between the dummy variable for the size of the province and city and the core explanatory variable treat*time is added to control for the effect on the estimation of the results.
The results of M1, M2, and M3 are presented in Table 7. In the main estimated coefficient M1DID, the CO2 coefficient shows a significant positive effect, while the SO2 coefficient exhibits a significant negative effect. This suggests that variations in power facility levels significantly influence CO2 and SO2 emissions, whereas no significant effects are observed on the other two pollutants. Specifically, higher levels of power facility correlate with increased CO2 emissions but decreased SO2 emissions. In the main estimated coefficient M2DID coefficient, only the SO2 coefficient is significantly positive, indicating that variations in power generation across different regions significantly impact SO2 emissions, while there is no significant impact on the remaining three pollutants, implying lower power generation leads to reduced SO2 emissions. In the main estimated coefficient M3DID coefficient, the SO2 and NOx coefficients are significantly positive, indicating that differences in economic scale significantly influence SO2 and NOx emissions, with no significant impact on the remaining two pollutants, suggesting smaller economic scales lead to reduced SO2 and NOx emissions.

7. Conclusions

The synergistic promotion of pollution and carbon reduction is essential for China’s green transformation in the new development stage, making it crucial to investigate the synergistic effects of carbon trading and other market instruments. This study focuses on the emissions of air pollutants from China’s power industry across 30 provinces and cities from 2007 to 2021, utilizing the DID model to analyze the impact of the CETS on pollution and carbon reduction in this sector. Furthermore, we explored the pathways through which the CETS contributes to the synergy between pollution and carbon reduction in the power industry, leading to the following conclusions.
First, the implementation of the CETS has a significant synergistic effect on reducing pollution and carbon in China’s power sector. CO2 emissions decreased by 75.3%, SO2 emissions by 31.1%, NOx emissions by 18.4%, and PM2.5 emissions by 50.7%. After a series of robustness tests, this conclusion remains reliable. It can be seen that the CETS significantly reduces CO2 and air pollutant emissions in the power industry, and the synergistic emission reduction effect of CO2 and PM2.5 is most obvious. This indicates that the implementation of the CETS has largely produced a synergistic effect of pollution and carbon reduction in China’s power industry.
Second, the implementation of the CETS will indirectly promote the synergistic effect of pollution and carbon reduction in China’s power sector. Based on previous studies, three pathways of CETS synergistic effects on pollution and carbon reduction in China’s power sector have been proposed and confirmed: reducing energy consumption, influencing power generation structure, and promoting technological innovation.
Third, variations in power facility level, power generation, and economic scale significantly influence CO2 and SO2 emissions, as well as SO2 and NOx emissions. Therefore, the outcomes of the CETS’s synergistic effect on pollution and carbon reduction in the power industry vary notably depending on these factors.
Based on these findings, we draw the following policy implications.
First, the industry coverage of carbon emission trading makets should be improved, more trading entities should be introduced to enhance trading activities, so that the synergistic effect of the CETS in reducing pollution and carbon emissions can be realized in more industries and in a wider area.
Second, green and low-carbon industries should be cultivated. The government should adjust its industrial structure transformation strategy to make greater use of green technologies. To this end, localities are actively building low-carbon agriculture, developing energy-saving industries, nurturing the service sector, and improving ecoefficiency by optimizing the industrial structure.
Third, with respect to achieving innovation-driven low-carbon development, technological innovation remains the fundamental driver of green economic development. Therefore, this study recommends that the government take measures to guide enterprises to adopt green technologies and change the crude development model. For example, technology subsidies and financial support can be provided to heavily polluting industries to reduce the negative externalities brought about by environmental regulations and to encourage enterprises to make technological improvements and innovations and take a long-term path to sustainable development.

Author Contributions

Conceptualization, X.Z., J.Y. and X.L.; methodology, X.Z. and J.Y.; software, X.Z., R.T. and Z.Z.; validation, J.Y., Z.Z. and R.T.; formal analysis, X.Z., X.L. and T.Z.; investigation, X.Z., X.L. and R.T.; resources, X.Z.; data curation, X.Z. and T.Z.; writing—original draft preparation, X.Z., X.L. and Z.Z.; writing—review and editing, X.Z., X.L. and R.T.; visualization, X.Z. and X.L.; supervision, X.Z., Z.Z. and J.Y.; project administration, X.Z. All authors have read and agreed to the published version of the manuscript.

Funding

This research is supported by the Postdoctoral Fellowship Program of CPSF under Grant Number GZB20240484.

Institutional Review Board Statement

Not applicable.

Informed Consent Statement

Not applicable.

Data Availability Statement

The data presented in this study are available on request from the corresponding author.

Conflicts of Interest

The authors declare no conflicts of interest.

References

  1. Gao, X.; Liu, N.; Hua, Y. Environmental Protection Tax Law on the Synergy of Pollution Reduction and Carbon Reduction in China: Evidence from a Panel Data of 107 Cities. Sustain. Prod. Consum. 2022, 33, 425–437. [Google Scholar] [CrossRef]
  2. Gao, Y.; Zhang, L.; Huang, A.; Kou, W.; Bo, X.; Cai, B.; Qu, J. Unveiling the Spatial and Sectoral Characteristics of a High-Resolution Emission Inventory of CO2 and Air Pollutants in China. Sci. Total Environ. 2022, 847, 157623. [Google Scholar] [CrossRef] [PubMed]
  3. Zheng, B.; Tong, D.; Li, M.; Liu, F.; Hong, C.; Geng, G.; Li, H.; Li, X.; Peng, L.; Qi, J.; et al. Trends in China’s Anthropogenic Emissions since 2010 as the Consequence of Clean Air Actions. Atmos. Chem. Phys. 2018, 18, 14095–14111. [Google Scholar] [CrossRef]
  4. Normile, D. China’s Bold Climate Pledge Earns Praise—but Is It Feasible? Science 2020, 370, 17–18. [Google Scholar] [CrossRef]
  5. Chen, Y.; Zhu, Z.; Cheng, S. Industrial Agglomeration and Haze Pollution: Evidence from China. Sci. Total Environ. 2022, 845, 157392. [Google Scholar] [CrossRef]
  6. He, J. Seven Departments Issued a Program for the Implementation of Pollution Reduction and Carbon Synergies. Securities Times, 18 June 2022; A02. [Google Scholar]
  7. Lin, H.; Jiang, P. Analyzing the Phased Changes of Socioeconomic Drivers to Carbon Dioxide and Particulate Matter Emissions in the Yangtze River Delta. Ecol. Indic. 2022, 140, 109044. [Google Scholar] [CrossRef]
  8. Song, J.; Chen, R.; Ma, X. Collaborative Allocation of Energy Consumption, Air Pollutants and CO2 Emissions in China. Sustainability 2021, 13, 9443. [Google Scholar] [CrossRef]
  9. Zhang, H.; Ma, X.; Han, G.; Xu, H.; Shi, T.; Zhong, W.; Gong, W. Study on Collaborative Emission Reduction in Green-House and Pollutant Gas Due to COVID-19 Lockdown in China. Remote Sens. 2021, 13, 3492. [Google Scholar] [CrossRef]
  10. Hanaoka, T.; Masui, T. Exploring Effective Short-Lived Climate Pollutant Mitigation Scenarios by Considering Synergies and Trade-Offs of Combinations of Air Pollutant Measures and Low Carbon Measures towards the Level of the 2°C Target in Asia. Environ. Pollut. 2020, 261, 113650. [Google Scholar] [CrossRef]
  11. Monjardino, J.; Dias, L.; Fortes, P.; Tente, H.; Ferreira, F.; Seixas, J. Carbon Neutrality Pathways Effects on Air Pollutant Emissions: The Portuguese Case. Atmosphere 2021, 12, 324. [Google Scholar] [CrossRef]
  12. Chae, Y. Co-Benefit Analysis of an Air Quality Management Plan and Greenhouse Gas Reduction Strategies in the Seoul Metropolitan Area. Environ. Sci. Policy 2010, 13, 205–216. [Google Scholar] [CrossRef]
  13. Zhou, Y.; Liu, L.; Cao, D. Study on synergistic emission reduction of carbon dioxide and conventional pollutants. Therm. Power 2013, 42, 63–65. [Google Scholar]
  14. Mao, X.; Zeng, A.; Liu, S.; Hu, T.; Xin, Y. Evaluation of the synergistic control effect of sulphur, nitrogen and carbon of technical emission reduction measures in the iron and steel industry. J. Environ. Sci. 2012, 32, 1253–1260. [Google Scholar] [CrossRef]
  15. Xue, J.; Luo, H.; Lvl, L.; Zhao, J.; Wang, X. Emission characteristics and correlation of major air pollutants and greenhouse gases in China. Resour. Sci. 2012, 34, 1452–1460. [Google Scholar]
  16. Liu, J.-Y.; Woodward, R.T.; Zhang, Y.-J. Has Carbon Emissions Trading Reduced PM2.5 in China? Environ. Sci. Technol. 2021, 55, 6631–6643. [Google Scholar] [CrossRef]
  17. Dong, F.; Yu, B.; Pan, Y. Examining the Synergistic Effect of CO2 Emissions on PM2.5 Emissions Reduction: Evidence from China. J. Cleaner Prod. 2019, 223, 759–771. [Google Scholar] [CrossRef]
  18. Chen, L.; Wang, D.; Shi, R. Can China’s Carbon Emissions Trading System Achieve the Synergistic Effect of Carbon Reduction and Pollution Control? Int. J. Environ. Res. Public Health 2022, 19, 8932. [Google Scholar] [CrossRef]
  19. Dong, Z.; Xia, C.; Fang, K.; Zhang, W. Effect of the Carbon Emissions Trading Policy on the Co-Benefits of Carbon Emissions Reduction and Air Pollution Control. Energy Policy 2022, 165, 112998. [Google Scholar] [CrossRef]
  20. Wang, Z.; Qiu, S. Can “Energy Saving and Emission Reduction” Demonstration City Selection Actually Contribute to Pollution Abatement in China? Sustain. Prod. Consum. 2021, 27, 1882–1902. [Google Scholar] [CrossRef]
  21. Du, W.; Li, M. Assessing the Impact of Environmental Regulation on Pollution Abatement and Collaborative Emissions Reduction: Micro-Evidence from Chinese Industrial Enterprises. Environ. Impact Assess. Rev. 2020, 82, 106382. [Google Scholar] [CrossRef]
  22. Cecchini, L.; Venanzi, S.; Pierri, A.; Chiorri, M. Environmental Efficiency Analysis and Estimation of CO2 Abatement Costs in Dairy Cattle Farms in Umbria (Italy): A SBM-DEA Model with Undesirable Output. J. Cleaner Prod. 2018, 197, 895–907. [Google Scholar] [CrossRef]
  23. Jiang, M.; Zhu, B.; Chevallier, J.; Xie, R. Allocating Provincial CO2 Quotas for the Chinese National Carbon Program. Aust. J. Agric. Resour. Econ. 2018, 62, 457–479. [Google Scholar] [CrossRef]
  24. Jie, D.; Xu, X.; Guo, F. The Future of Coal Supply in China Based on Non-Fossil Energy Development and Carbon Price Strategies. Energy 2021, 220, 119644. [Google Scholar] [CrossRef]
  25. Liu, X.; Zhou, X.; Zhu, B.; He, K.; Wang, P. Measuring the Maturity of Carbon Market in China: An Entropy-Based TOPSIS Approach. J. Cleaner Prod. 2019, 229, 94–103. [Google Scholar] [CrossRef]
  26. Qu, K.; Yu, T.; Huang, L.; Yang, B.; Zhang, X. Decentralized Optimal Multi-Energy Flow of Large-Scale Integrated Energy Systems in a Carbon Trading Market. Energy 2018, 149, 779–791. [Google Scholar] [CrossRef]
  27. Tang, L.; Shi, J.; Bao, Q. Designing an Emissions Trading Scheme for China with a Dynamic Computable General Equilibrium Model. Energy Policy 2016, 97, 507–520. [Google Scholar] [CrossRef]
  28. Wang, K.; Wei, Y.-M.; Huang, Z. Potential Gains from Carbon Emissions Trading in China: A DEA Based Estimation on Abatement Cost Savings. Omega 2016, 63, 48–59. [Google Scholar] [CrossRef]
  29. Feng, Y.; Wang, X.; Luan, J.; Wang, H.; Li, H.; Li, H.; Liu, Z.; Yang, Z. A Novel Method for Ship Carbon Emissions Prediction under the Influence of Emergency Events. Transp. Res. Part C Emerging Technol. 2024, 165, 104749. [Google Scholar] [CrossRef]
  30. Huang, D.; Wang, Y.; Yin, C. Selection of CO2 Emission Reduction Measures Affecting the Maximum Annual Income of a Container Ship. J. Mar. Sci. Eng. 2023, 11, 534. [Google Scholar] [CrossRef]
  31. Fu, J.; Liu, J. A review of the co-benefits of climate change policies. Environ. Econ. Res. 2018, 3, 134–148. [Google Scholar] [CrossRef]
  32. Zhou, Y.; Zhang, H.; Cai, B.; He, J. Study on synergistic emission reduction of conventional pollutants and carbon dioxide in the cement industry. Environ. Sci. Technol. 2013, 36, 164–168. [Google Scholar]
  33. Xiao, Q.; Liu, N. Study on the synergistic effect of urban greenhouse gases and air pollution control. Jiangsu Sci. Technol. Inf. 2012, 09, 59–61. [Google Scholar]
  34. Gu, A.L.; Teng, F.; Feng, X. Greenhouse gas synergy analysis and evaluation of pollutant control policies in major sectors. China Popul. Resour. Environ. 2016, 26, 10–17. [Google Scholar]
  35. Ren, Y.; Fu, J. Study on Emission Reduction and Green Development Effect of Carbon Trading. China Popul. Resour. Environ. 2019, 29, 11–20. [Google Scholar]
  36. Zeng, S.; Li, F.; Weng, Z.; Zhong, Z. Emission Reduction Effect of China’s Carbon Trading Pilot Policy and Regional Differences. China Environ. Sci. 2022, 42, 1922–1933. [Google Scholar] [CrossRef]
  37. Xue, F.; Zhou, M. Study on the Emission Reduction Effect of Carbon Market Size in China. East China Econ. Manag. 2021, 35, 11–21. [Google Scholar] [CrossRef]
  38. Xuan, D.; Ma, X.; Shang, Y. Can China’s Policy of Carbon Emission Trading Promote Carbon Emission Reduction? J. Cleaner Prod. 2020, 270, 122383. [Google Scholar] [CrossRef]
  39. Guan, Y.; Shan, Y.; Huang, Q.; Chen, H.; Wang, D.; Hubacek, K. Assessment to China’s Recent Emission Pattern Shifts. Earth’s Future 2021, 9, e2021EF002241. [Google Scholar] [CrossRef]
  40. Shan, Y.; Huang, Q.; Guan, D.; Hubacek, K. China CO2 Emission Accounts 2016–2017. Sci. Data 2020, 7, 54. [Google Scholar] [CrossRef]
  41. Shan, Y.; Guan, D.; Zheng, H.; Ou, J.; Li, Y.; Meng, J.; Mi, Z.; Liu, Z.; Zhang, Q. China CO2 Emission Accounts 1997–2015. Sci. Data 2018, 5, 170201. [Google Scholar] [CrossRef]
  42. Chen, S. Energy consumption, carbon dioxide emissions and sustainable industrial development in China. Econ. Res. 2009, 44, 41–55. [Google Scholar]
  43. Wan, P.; Yang, M.; Chen, L. How Environmental Technology Standards Influence the Green Transformation of China’s Manufacturing Industry: A Perspective Based on Technological Transformation. China’s Ind. Econ. 2021, 9, 118–136. [Google Scholar] [CrossRef]
  44. Wang, B.; Wang, Y.; Zhao, Y. Collaborative Governance Mechanism of Climate Change and Air Pollution: Evidence from China. Sustainability 2021, 13, 6785. [Google Scholar] [CrossRef]
  45. Zhang, W.; Li, J.; Li, G.; Guo, S. Emission Reduction Effect and Carbon Market Efficiency of Carbon Emissions Trading Policy in China. Energy 2020, 196, 117117. [Google Scholar] [CrossRef]
  46. Chen, X.; Lin, B. Towards Carbon Neutrality by Implementing Carbon Emissions Trading Scheme: Policy Evaluation in China. Energy Policy 2021, 157, 112510. [Google Scholar] [CrossRef]
  47. Guo, Q.; Su, Z.; Chiao, C. Carbon Emissions Trading Policy, Carbon Finance, and Carbon Emissions Reduction: Evidence from a Quasi-Natural Experiment in China. Econ. Change Restruct. 2022, 55, 1445–1480. [Google Scholar] [CrossRef]
  48. Wang, X.; Huang, J.; Liu, H. Can China’s Carbon Trading Policy Help Achieve Carbon Neutrality?—A Study of Policy Effects from the Five-Sphere Integrated Plan Perspective. J. Environ. Manage. 2022, 305, 114357. [Google Scholar] [CrossRef]
  49. Yi, L.; Zhao, W.; Yang, L. Innovation of synergistic management mechanism of air pollution and climate change. Res. Manag. 2020, 41, 134–144. [Google Scholar] [CrossRef]
  50. Gao, Y.; Li, M.; Xue, J.; Liu, Y. Evaluation of Effectiveness of China’s Carbon Emissions Trading Scheme in Carbon Mitigation. Energy Econ. 2020, 90, 104872. [Google Scholar] [CrossRef]
  51. Coase, R.H. The Problem of Social Cost. J. Law Econ. 1960, 3, 1–44. [Google Scholar] [CrossRef]
  52. Wang, H.; Shi, W.; He, Y.; Dong, J. Spill-over Effect and Efficiency of Seven Pilot Carbon Emissions Trading Exchanges in China. Sci. Total Environ. 2022, 838, 156020. [Google Scholar] [CrossRef] [PubMed]
  53. Heggelund, G.; Stensdal, I.; Duan, M. China’s Carbon Market: Potential for Success? Politics Gov. 2022, 10, 265–274. [Google Scholar] [CrossRef]
  54. Chang, J. Air Pollution Prevention and Control Act Moves Forward amid Controversy. Economic Reference News, 8 September 2015; 8. [Google Scholar]
  55. Hu, Y.; Ren, S.; Wang, Y.; Chen, X. Can Carbon Emission Trading Scheme Achieve Energy Conservation and Emission Reduction? Evidence from the Industrial Sector in China. Energy Econ. 2020, 85, 104590. [Google Scholar] [CrossRef]
  56. Ministry of Ecology and Environment releases National Carbon Market Development Report (2024). Pap. Inf. 2024, 8, 55.
  57. Pachauri, R.K.; Allen, M.R.; Barros, V.R.; Broome, J.; Cramer, W.; Christ, R.; Church, J.A.; Clarke, L.; Dahe, Q.; Dasgupta, P.; et al. Climate Change 2014: Synthesis Report. Contribution of Working Groups I, II and III to the Fifth Assessment Report of the Intergovernmental Panel on Climate Change; Pachauri, R.K., Meyer, L., Eds.; IPCC: Geneva, Switzerland, 2014; p. 151. ISBN 978-92-9169-143-2. [Google Scholar]
  58. Swart, R.; Amann, M.; Raes, F.; Tuinstra, W. A Good Climate for Clean Air: Linkages between Climate Change and Air Pollution. An Editorial Essay. Clim. Change 2004, 66, 263–269. [Google Scholar] [CrossRef]
  59. Lee, H.; Calvin, K.; Dasgupta, D.; Krinner, G.; Mukherji, A.; Thorne, P.; Trisos, C.; Romero, J.; Aldunce, P.; Barret, K.; et al. IPCC, 2023: Climate Change 2023: Synthesis Report, Summary for Policymakers. Contribution of Working Groups I, II and III to the Sixth Assessment Report of the Intergovernmental Panel on Climate Change. Available online: https://www.ipcc.ch/report/ar6/syr/ (accessed on 29 May 2024).
  60. Mao, X.; Zeng, A.; Xin, Y.; Gao, Y.; He, F. From Idea to Action: Synthesis of Research on Synergistic Benefits and Synergistic Control of Greenhouse Gas and Local Pollutant Emission Reductions. Prog. Clim. Change Res. 2021, 17, 255–267. [Google Scholar]
  61. Bayer, P.; Aklin, M. The European Union Emissions Trading System Reduced CO2 Emissions despite Low Prices. Proc. Natl. Acad. Sci. USA 2020, 117, 8804–8812. [Google Scholar] [CrossRef]
  62. Murray, B.C.; Maniloff, P.T. Why Have Greenhouse Emissions in RGGI States Declined? An Econometric Attribution to Economic, Energy Market, and Policy Factors. Energy Econ. 2015, 51, 581–589. [Google Scholar] [CrossRef]
  63. Wu, Y.; Qi, J.; Xian, Q.; Chen, J. Study on Carbon Emission Reduction Effect of China’s Carbon Market: Based on the Synergistic Perspective of Market Mechanism and Administrative Intervention. China’s Ind. Econ. 2021, 8, 114–132. [Google Scholar] [CrossRef]
  64. Zhou, D.; Liu, Y. Impacts and Mechanisms of China’s Carbon Trading Pilot Policies on Urban Carbon Emission Performance. China Environ. Sci. 2020, 40, 453–464. [Google Scholar] [CrossRef]
  65. Li, G.; Zhang, W. Research on Industrial Carbon Emissions and Emission Reduction Mechanisms under Carbon Trading in China. China Popul. Resour. Environ. 2017, 27, 141–148. [Google Scholar]
  66. Fu, X.; Wang, S.X.; Cheng, Z.; Xing, J.; Zhao, B.; Wang, J.D.; Hao, J.M. Source, Transport and Impacts of a Heavy Dust Event in the Yangtze River Delta, China, in 2011. Atmos. Chem. Phys. 2014, 14, 1239–1254. [Google Scholar] [CrossRef]
  67. Li, L.; Chen, C.H.; Fu, J.S.; Huang, C.; Streets, D.G.; Huang, H.Y.; Zhang, G.F.; Wang, Y.J.; Jang, C.J.; Wang, H.L.; et al. Air Quality and Emissions in the Yangtze River Delta, China. Atmos. Chem. Phys. 2011, 11, 1621–1639. [Google Scholar] [CrossRef]
  68. Liu, F.; Zhang, Q.; Tong, D.; Zheng, B.; Li, M.; Huo, H.; He, K.B. High-Resolution Inventory of Technologies, Activities, and Emissions of Coal-Fired Power Plants in China from 1990 to 2010. Atmos. Chem. Phys. 2015, 15, 13299–13317. [Google Scholar] [CrossRef]
  69. Tang, X.; Zhang, Y.; Yi, H.; Ma, J.; Pu, L. Development a Detailed Inventory Framework for Estimating Major Pollutants Emissions Inventory for Yunnan Province, China. Atmos. Environ. 2012, 57, 116–125. [Google Scholar] [CrossRef]
  70. Wang, X.; Mauzerall, D.L.; Hu, Y.; Russell, A.G.; Larson, E.D.; Woo, J.-H.; Streets, D.G.; Guenther, A. A High-Resolution Emission Inventory for Eastern China in 2000 and Three Scenarios for 2020. Atmos. Environ. 2005, 39, 5917–5933. [Google Scholar] [CrossRef]
  71. Huang, Q.; Chen, S.S.; Chen, D.; Zhao, X.; Guo, X.; Wang, H. Impact of North China power plant sources on SO2 in Beijing and surrounding areas. J. Beijing Univ. Technol. 2009, 35, 1389–1395. [Google Scholar]
  72. Caparrós, A.; Péreau, J.-C.; Tazdaït, T. Emission Trading and International Competition: The Impact of Labor Market Rigidity on Technology Adoption and Output. Energy Policy 2013, 55, 36–43. [Google Scholar] [CrossRef]
  73. Rojas Sánchez, D.; Hoadley, A.F.A.; Khalilpour, K.R. A Multi-Objective Extended Input–Output Model for a Regional Economy. Sustain. Prod. Consum. 2019, 20, 15–28. [Google Scholar] [CrossRef]
  74. Zheng, J.; Sun, X.; Zhang, M.; Jiang, P.; Zhu, Y.; Gao, S. Synergistic Effects of Greenhouse Gas Emission Reduction and Air Pollution Control—A Review of Domestic and International Studies. Ecol. Econ. 2015, 31, 133–137. [Google Scholar]
  75. Von Stechow, C.; McCollum, D.; Riahi, K.; Minx, J.C.; Kriegler, E.; van Vuuren, D.P.; Jewell, J.; Robledo-Abad, C.; Hertwich, E.; Tavoni, M.; et al. Integrating Global Climate Change Mitigation Goals with Other Sustainability Objectives: A Synthesis. Annu. Rev. Environ. Resour. 2015, 40, 363–394. [Google Scholar] [CrossRef]
  76. Xiang, M.; Wang, S.; Lv, L.; Zhang, N.; Bai, Z. A Synergistic Path to Pollution Reduction and Carbon Reduction in China Based on Different Electricity Demands. Environ. Sci. 2023, 44, 3637–3648. [Google Scholar] [CrossRef]
  77. Shih, C.F.; Zhang, T.; Li, J.; Bai, C. Powering the Future with Liquid Sunshine. Joule 2018, 2, 1925–1949. [Google Scholar] [CrossRef]
  78. Pahle, M.; Fan, L.; Schill, W.-P. How Emission Certificate Allocations Distort Fossil Investments: The German Example. Energy Policy 2011, 39, 1975–1987. [Google Scholar] [CrossRef]
  79. Denny, E.; O’Malley, M. The Impact of Carbon Prices on Generation-Cycling Costs. Energy Policy 2009, 37, 1204–1212. [Google Scholar] [CrossRef]
  80. Jiang, P.; Khishgee, S.; Alimujiang, A.; Dong, H. Cost-Effective Approaches for Reducing Carbon and Air Pollution Emissions in the Power Industry in China. J. Environ. Manage. 2020, 264, 110452. [Google Scholar] [CrossRef]
  81. Wang, C.; Xia, Z.; Fan, S.; Gong, W. Energy Conservation and Emission Reduction Effect and Potential Emission Reduction Mechanism of China’s Thermal Power Generation Industry–Evidence from Carbon Emission Trading Policy. Pol. J. Environ. Stud. 2023, 32, 4825–4839. [Google Scholar] [CrossRef]
  82. Xing, Z.; Li, C.; Sun, M. Analysis of Influencing Factors of Carbon Emissions in the Power Industry and Forecast of Peak Scenarios. In Proceedings of the 2022 4th International Conference on Smart Power & Internet Energy Systems (SPIES), Beijing, China, 9–12 December 2022; pp. 2184–2188. [Google Scholar]
  83. Chen, L.; Sun, Y.; Wu, X.; Zhang, Y.; Zheng, C.; Gao, X.; Cen, K. Unit-Based Emission Inventory and Uncertainty Assessment of Coal-Fired Power Plants. Atmos. Environ. 2014, 99, 527–535. [Google Scholar] [CrossRef]
  84. Hagi, H.; Neveux, T.; Le Moullec, Y. Efficiency Evaluation Procedure of Coal-Fired Power Plants with CO2 Capture, Cogeneration and Hybridization. Energy 2015, 91, 306–323. [Google Scholar] [CrossRef]
  85. Liu, X.; Xu, Y. Research on the Impact of Low-Carbon City Pilot Policies on Corporate ESG Performance - An Empirical Test Based on Multi-Period Double Difference Approach. Financ. Econ. 2023, 38–50. [Google Scholar] [CrossRef]
  86. Damert, M.; Baumgartner, R.J. Intra-Sectoral Differences in Climate Change Strategies: Evidence from the Global Automotive Industry. Bus. Strateg. Environ. 2018, 27, 265–281. [Google Scholar] [CrossRef] [PubMed]
  87. Smale, R.; Hartley, M.; Hepburn, C.; Ward, J.; Grubb, M. The Impact of CO2 Emissions Trading on Firm Profits and Market Prices. Clim. Policy 2006, 6, 31–48. [Google Scholar] [CrossRef]
  88. Berrone, P.; Fosfuri, A.; Gelabert, L.; Gomez-Mejia, L.R. Necessity as the Mother of ‘Green’ Inventions: Institutional Pressures and Environmental Innovations. Strategic Manage. J. 2013, 34, 891–909. [Google Scholar] [CrossRef]
  89. Demirel, P.; Kesidou, E. Stimulating Different Types of Eco-Innovation in the UK: Government Policies and Firm Motivations. Ecol. Econ. 2011, 70, 1546–1557. [Google Scholar] [CrossRef]
  90. Zhu, X.; Zuo, X.; Li, H. The Dual Effects of Heterogeneous Environmental Regulation on the Technological Innovation of Chinese Steel Enterprises—Based on a High-Dimensional Fixed Effects Model. Ecol. Econ. 2021, 188, 107113. [Google Scholar] [CrossRef]
  91. Lei, X.; Xin-gang, Z. The Synergistic Effect between Renewable Portfolio Standards and Carbon Emission Trading System: A Perspective of China. Renew. Energy 2023, 211, 1010–1023. [Google Scholar] [CrossRef]
  92. Baron, R.M.; Kenny, D.A. The Moderator–Mediator Variable Distinction in Social Psychological Research: Conceptual, Strategic, and Statistical Considerations. J. Pers. Soc. Psychol. 1986, 51, 1173–1182. [Google Scholar] [CrossRef]
Figure 1. Parallel trend test, as applied to each of the following: (a) description of CO2; (b) description of SO2; (c) description of NOx; (d) description of PM2.5.
Sustainability 16 08681 g001aSustainability 16 08681 g001b
Figure 2. Placebo test, as applied to each of the following: (a) description of CO2; (b) description of SO2; (c) description of NOx; (d) description of PM2.5.
Sustainability 16 08681 g002
Table 1. Description of variables and data sources.
NumberTypologyVariable NameDefineSource of Data
1Explanatory variableCO2 emissionsCO2 emissions from the power sector, in logarithmsChina Carbon Accounting Databases (CEADs)
2SO2 emissionsSO2 emissions from the power sector, in logarithmsMEIC database
3NOx emissionsNOx emissions from the power sector, in logarithmsMEIC database
4PM2.5 emissionsPM2.5 emissions from the power sector, in logarithmsMEIC database
5Control variableIndustrial structureTertiary sector output/secondary sector outputChina Statistical Yearbook
6Urbanization level (of a city or town)Urban population/total populationChina Statistical Yearbook
7Level of economic developmentGDP per capita, logarithmicChina Statistical Yearbook
8Degree of openness to the outside world(Total exports and imports of goods × US dollar to renminbi exchange rate)/gross regional productChina Statistical Yearbook
9Energy structureCoal consumption/total consumptionChina Statistical Yearbook
10R&D intensityInternal expenditure on R&D/gross regional productChina Statistical Yearbook
11Environmental regulationCompleted investment in industrial pollution control/industrial added valueChina Statistical Yearbook
12Generation structureThermal power generation/total power generationChina Statistical Yearbook
Table 2. Descriptive statistics of variables.
VariantExperimental GroupControl Group
Sample SizeAverage Value(Statistics) Standard DeviationMaximum ValuesMinimum ValueSample SizeAverage Value(Statistics) Standard DeviationMaximum ValuesMinimum Value
V11052501.1641541.6616440.08777.8723452364.1951737.9117166.9410.364
V2105163,880.373205,365.4101,130,800.673204.870345195,850.011212,043.2181,275,800.2772926.197
V3105165,726.455128,133.676576,852.58625,205.490345228,662.623199,705.109991,383.81012,789.192
V410515,865.34413,761.99081,725.37635.82434524,585.12022,679.221112,960.050630.388
V51051.5501.0745.2970.6313451.0250.4063.2140.500
V61050.7180.1360.8960.4433450.5250.0960.7390.282
V710521,028.71811,482.86048,075.0006642.3303459714.7043353.45421,037.6003561.510
V81050.6620.4591.7210.0803450.1700.1511.0210.008
V91050.0330.0260.1040.0123450.0330.0220.0930.004
V101050.0280.0150.0650.0093450.0120.0060.0300.002
V111050.0020.0020.0080.0003450.0040.0040.0310.000
V121053.9590.8556.089 2.5013453.8730.7165.7372.359
Table 3. Basic regression results.
Variant(1)(2)(3)
CO2SO2NOxPM2.5CO2SO2NOxPM2.5CO2SO2NOxPM2.5
Treat × time−0.908 **−0.780 ***−0.446 **−0.800 ***−0.547 ***−0.353 ***−0.104 **−0.429 ***−0.753 **−0.311 ***−0.184 ***−0.507 ***
(0.381)(0.277)(0.223)(0.286)(0.145)(0.080)(0.047)(0.094)(0.366)(0.099)(0.066)(0.122)
Time0.054−1.247 ***−0.399 ***−0.761 ***0.044−2.518 ***−0.747 ***−1.932 ***−0.863−1.924 ***−0.598 ***−3.070 ***
(0.180)(0.126)(0.103)(0.129)(0.168)(0.090)(0.053)(0.106)(0.564)(0.298)(0.198)(0.360)
Treat−1.083 ***−0.726 ***−0.275 *−0.722 ***−2.188 ***−3.791 ***−1.838 ***−3.419 ***1.1360.096−0.212−5.997 ***
(0.289)(0.197)(0.157)(0.205)(0.249)(0.137)(0.080)(0.162)(1.495)(0.733)(0.498)(0.843)
Constant term7.425 ***12.395 ***12.341 ***10.150 ***8.126 ***12.964 ***12.770 ***10.549 ***6.23023.6275 ***11.793 ***−0.051
(0.140)(0.096)(0.073)(0.096)(0.201)(0.110)(0.064)(0.130)(4.075)(2.243)(1.510)(2.782)
R-squared0.1520.3540.1480.2530.88220.9450.9570.9120.9030.9640.9660.948
Time fixed effectNONONONOYESYESYESYESYESYESYESYES
Location fixed effectsNONONONOYESYESYESYESYESYESYESYES
ControlNONONONONONONONOYESYESYESYES
Note: *, **, and *** indicate significance at the 10%, 5%, and 1% levels, respectively. Values in parentheses are standard errors.
Table 4. Mechanism analysis 1: Energy consumption.
Variant(1)(2)(3)(4)(5)(6)
LNCO2Energy
Consumption
LNCO2LNSO2Energy
Consumption
LNSO2
Treat × time−1.4883 ***−0.032 **−0.3609 *−1.6561 ***−0.032 **−0.2476 **
(−6.4779)(0.016)(−1.7694)(−9.1627)(0.016)(−2.0721)
Energy consumption 0.0017 *** 0.0016 ***
(3.4659) (5.5702)
Constant term 7.3360 ***1.938 ***16.4711 ***11.6877 ***1.938 ***16.3691 ***
(85.3361)(0.030)(6.3219)(177.0871)(0.030)(10.6929)
R-squared0.0860.0280.5070.1670.0280.748
Time fixed effectYESYESYESYESYESYES
Location fixed effectsYESYESYESYESYESYES
ControlYESYESYESYESYESYES
Note: *, **, and *** indicate significance at the 10%, 5%, and 1% levels, respectively. Values in parentheses are standard errors.
Table 5. Mechanism analysis 2: Generation structure.
Variant(1)(2)(3)(4)(5)(6)
LNCO2Generation StructureLNCO2LNSO2Generation StructureLNSO2
Treat×time−1.4883 ***−0.010 ***−0.4190 **−1.6561 ***−0.010 ***−0.2206 *
(−6.4779)(0.003)(−2.0876)(−9.1627)(0.003)(−1.7595)
Generation structure −0.0009 * 0.0021 ***
(−1.6596) (6.4890)
Constant term 7.3360 ***−0.232 ***13.7486 ***11.6877 ***−0.232 ***18.0859 ***
(85.3361)(0.033)(5.3234)(177.0871)(0.033)(11.7289)
R-squared0.0860.1590.5420.1670.1590.767
Time fixed effectYESYESYESYESYESYES
Location fixed effectsYESYESYESYESYESYES
ControlYESYESYESYESYESYES
Note: *, **, and *** indicate significance at the 10%, 5%, and 1% levels, respectively. Values in parentheses are standard errors.
Table 6. Mechanism analysis 3: Technological innovation.
Variant(1)(2)(3)(4)(5)(6)
LNCO2Technological
Innovation
LNCO2LNSO2Technological
Innovation
LNSO2
Treat×time−1.4883 ***0.0040 ***−0.3609 *−1.6561 ***0.0040 ***−0.2535 **
(−6.4779)(4.4366)(−1.7694)(−9.1627)(4.4366)(−2.0071)
Technological innovation 0.0017 *** 5.0510
(3.4659) (0.7836)
Constant term 7.3360 ***−0.0629 ***16.4711 ***11.6877 ***−0.0629 ***16.3264 ***
(85.3361)(−5.3817)(6.3219)(177.0871)(−5.3817)(9.9858)
R-squared0.0860.7520.5070.1670.7520.730
Time fixed effectYESYESYESYESYESYES
Location fixed effectsYESYESYESYESYESYES
ControlYESYESYESYESYESYES
Note: *, **, and *** indicate significance at the 10%, 5%, and 1% levels, respectively. Values in parentheses are standard errors.
Table 7. Heterogeneity tests: power facility, power generation, and economic development.
VariantM1M2M3
CO2SO2NOxPM2.5CO2SO2NOxPM2.5CO2SO2NOxPM2.5
MDID1.222 ***−0.426 **−0.078−0.1750.1430.197 *−0.0100.035−0.4060.333 *0.431 ***−0.317
(0.347)(0.185)(0.132)(0.180)(0.228)(0.109)(0.063)(0.135)(0.370)(0.177)(0.097)(0.217)
Constant term17.507 ***19.711 ***12.972 ***16.161 ***4.58022.955 ***11.656 ***12.259 ***4.04823.391 ***12.865 ***11.099 ***
(2.870)(1.528)(1.087)(1.492)(4.431)(2.121)(1.281)(2.613)(4.509)(2.151)(1.181)(2.641)
R-squared0.5160.7780.7420.7580.89020.95680.96730.92830.88710.95850.95850.9283
Time fixed effectYESYESYESYESYESYESYESYESYESYESYESYES
Location fixed effectYESYESYESYESYESYESYESYESYESYESYESYES
ControlYESYESYESYESYESYESYESYESYESYESYESYES
Note: *, **, and *** indicate significance at the 10%, 5%, and 1% levels, respectively. Values in parentheses are standard errors.
Disclaimer/Publisher’s Note: The statements, opinions and data contained in all publications are solely those of the individual author(s) and contributor(s) and not of MDPI and/or the editor(s). MDPI and/or the editor(s) disclaim responsibility for any injury to people or property resulting from any ideas, methods, instructions or products referred to in the content.

