Thermographic Analysis of Green Wall and Green Roof Plant Types under Levels of Water Stress


Abstract
1. Introduction
1.1. Soil–Water–Plant Interactions
1.2. Plant Thermography
1.3. Understanding Plant Thermography through Analyzing Water Stress with Thermal Sensors
2. Materials and Methods
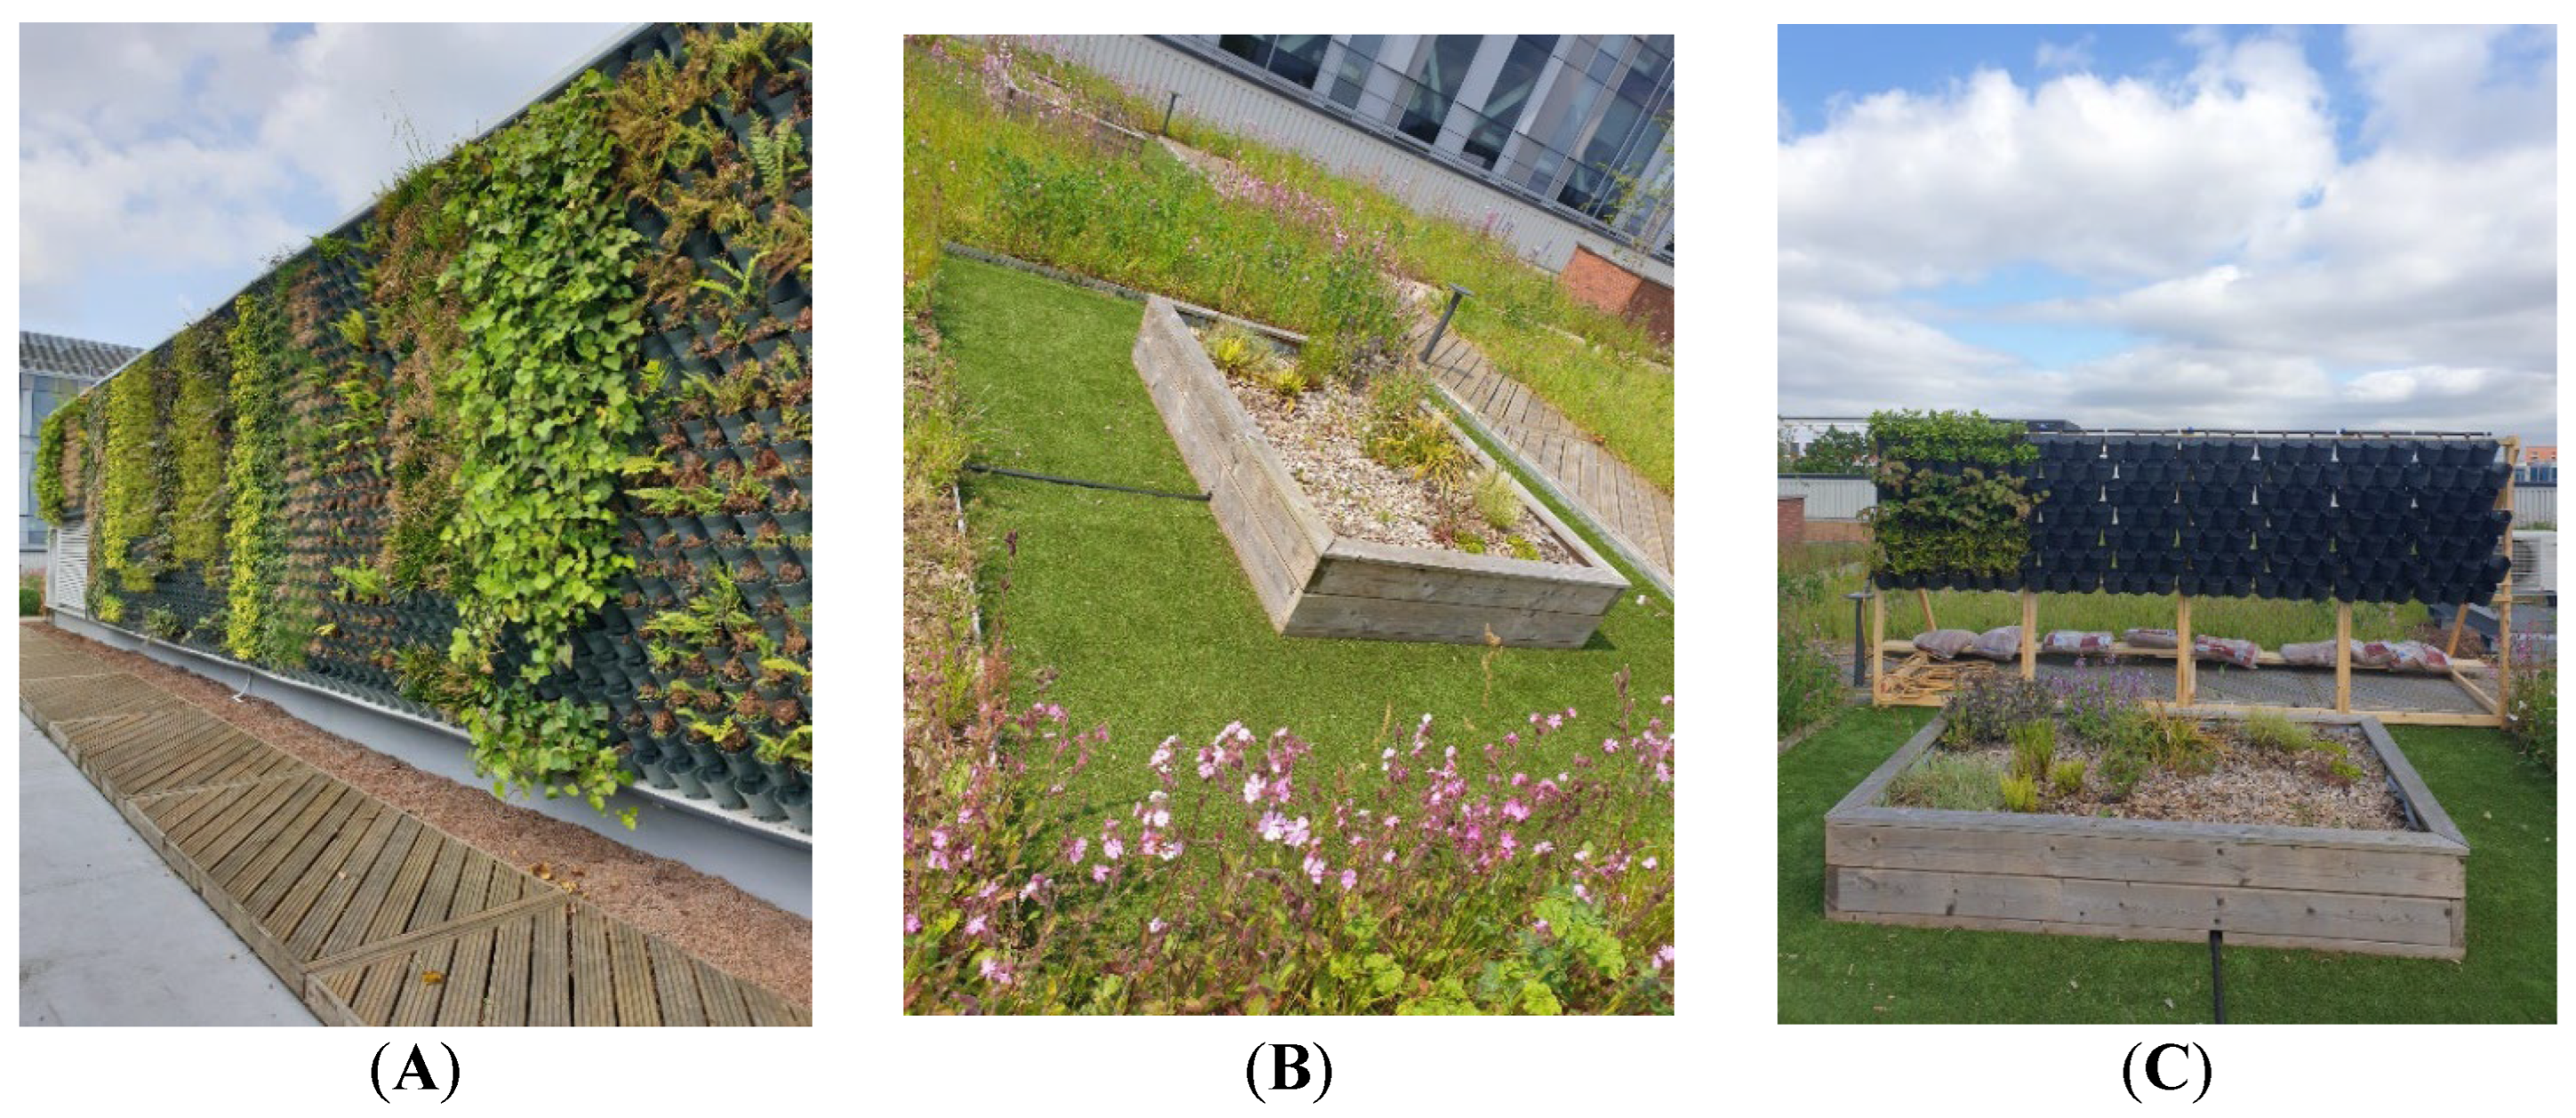
2.1. Experiment Location
Local Climate Conditions to Salford, UK
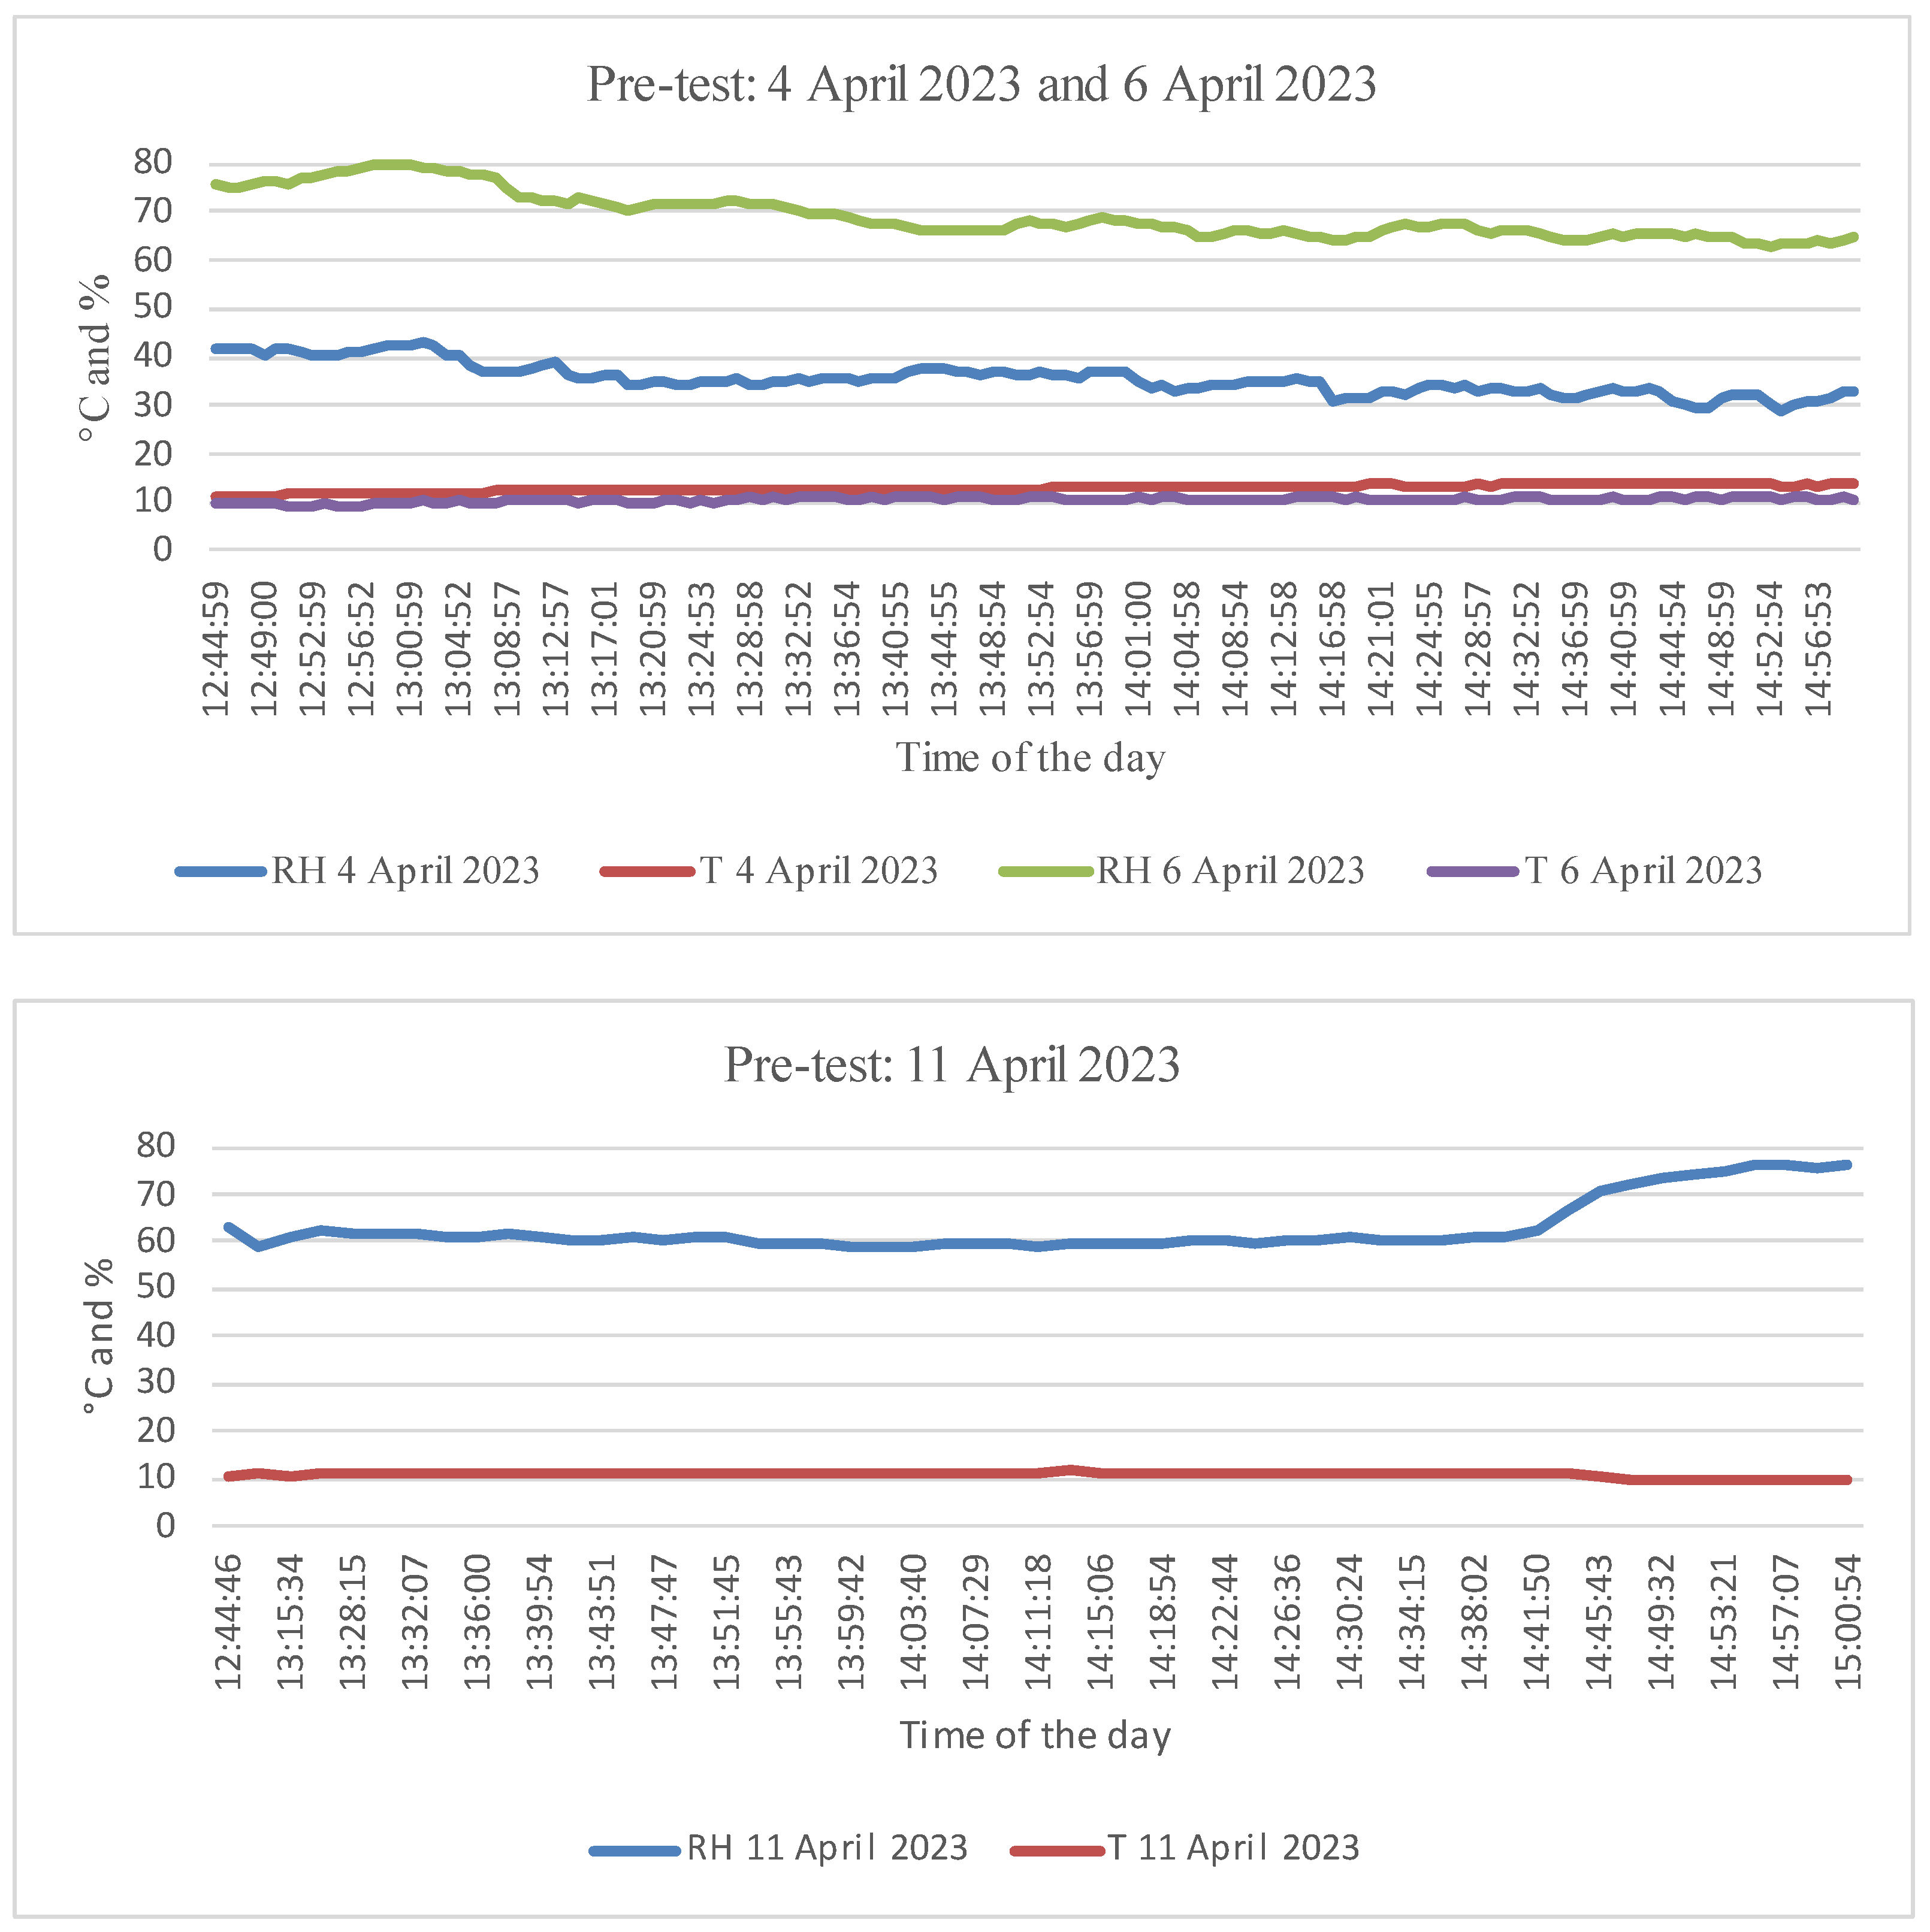
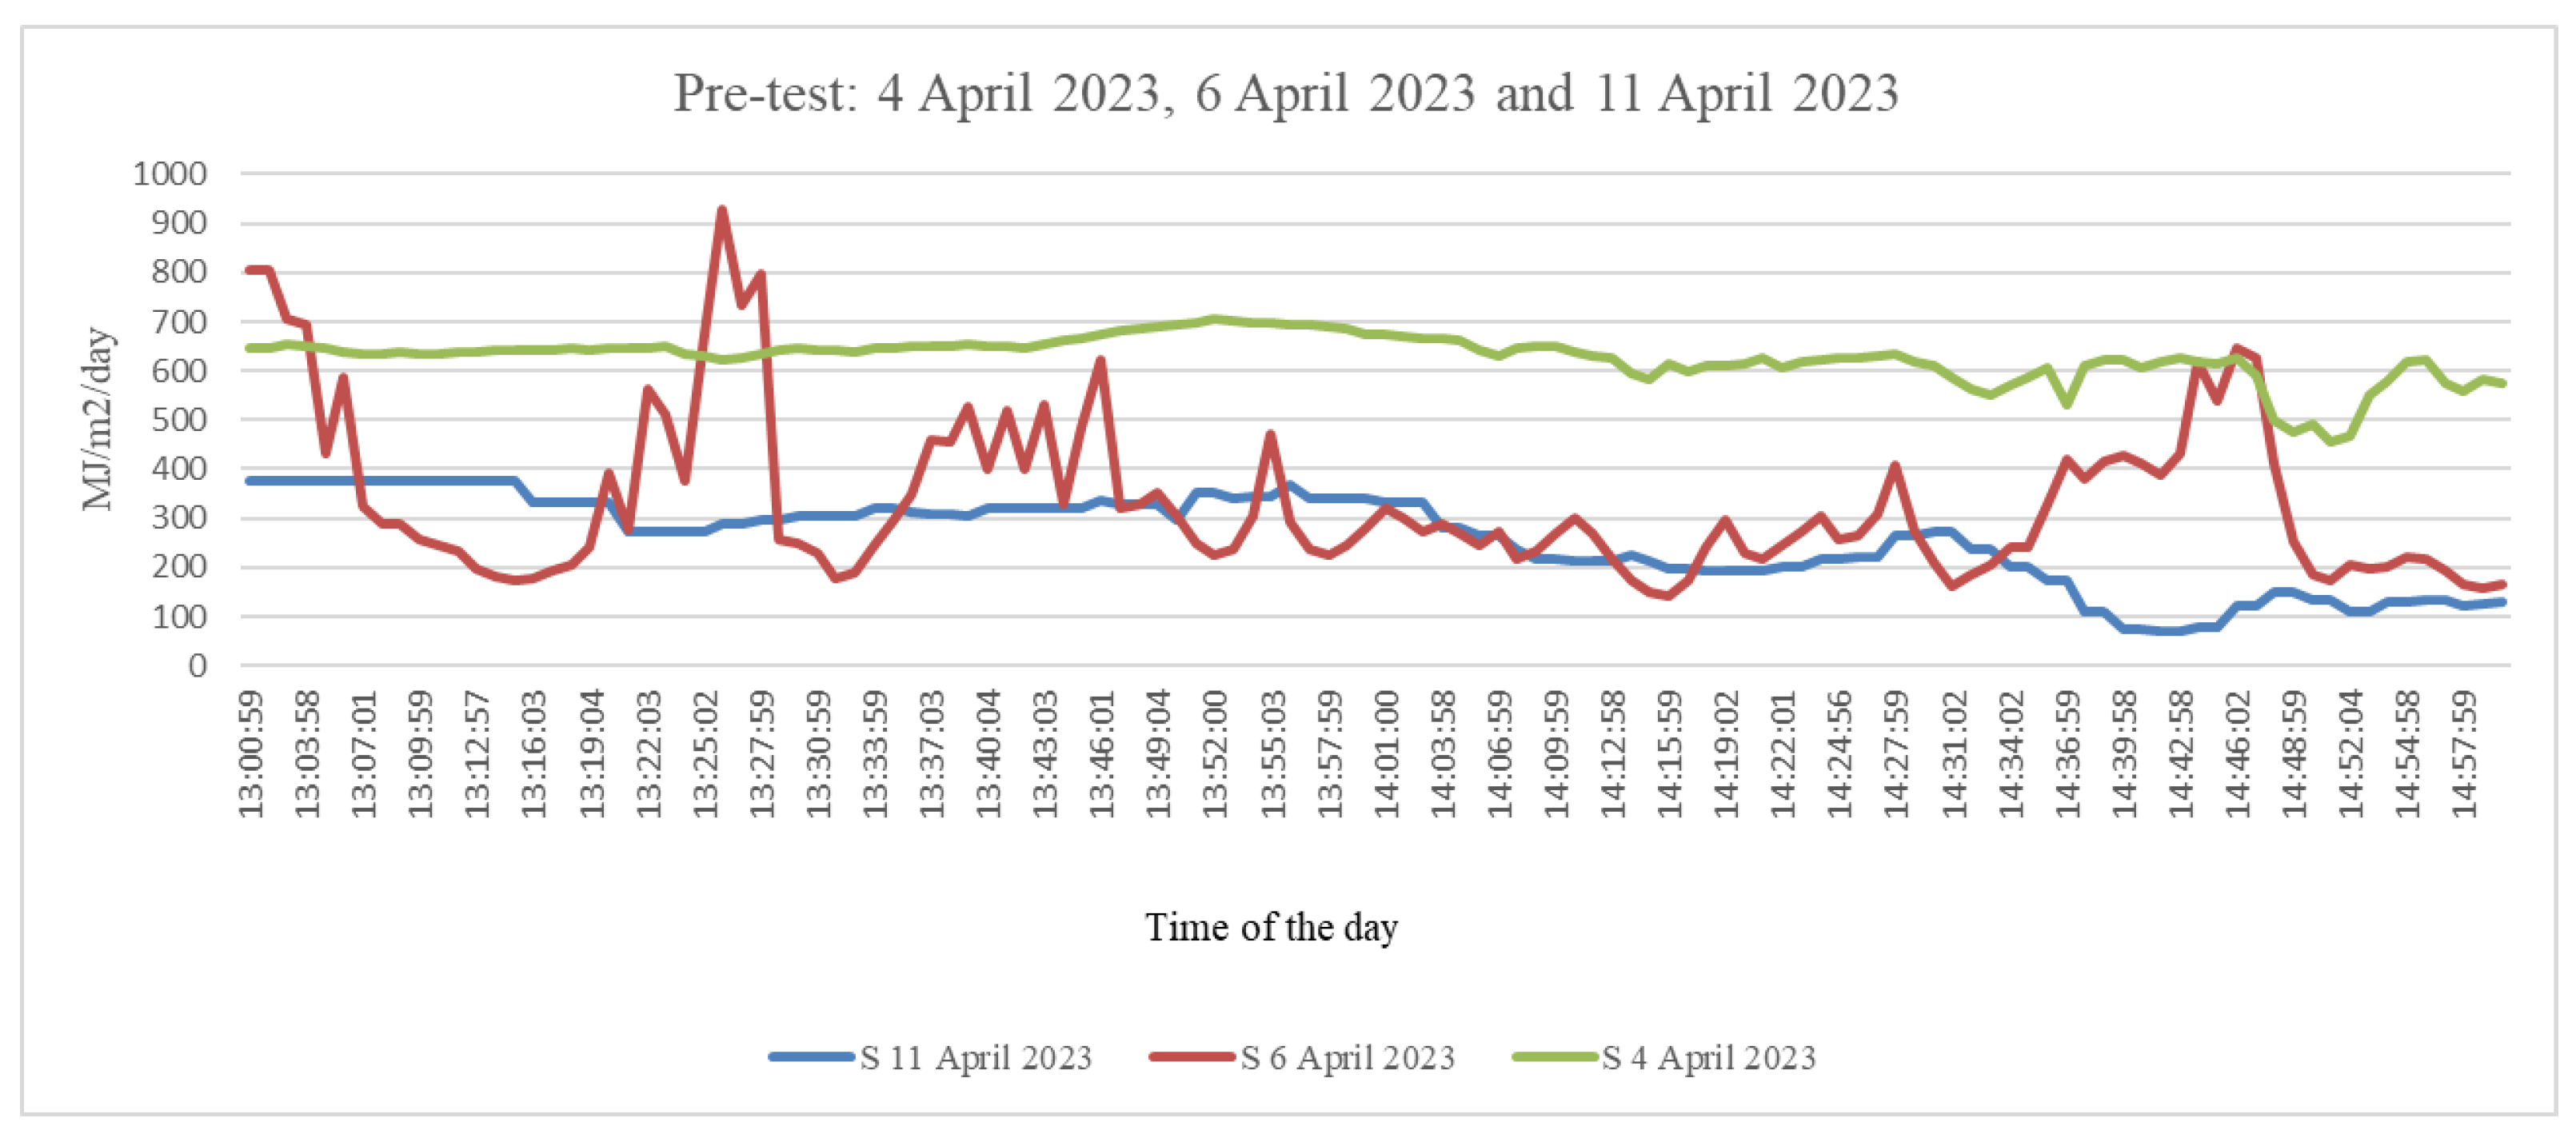
2.2. Pre-Test Experiment
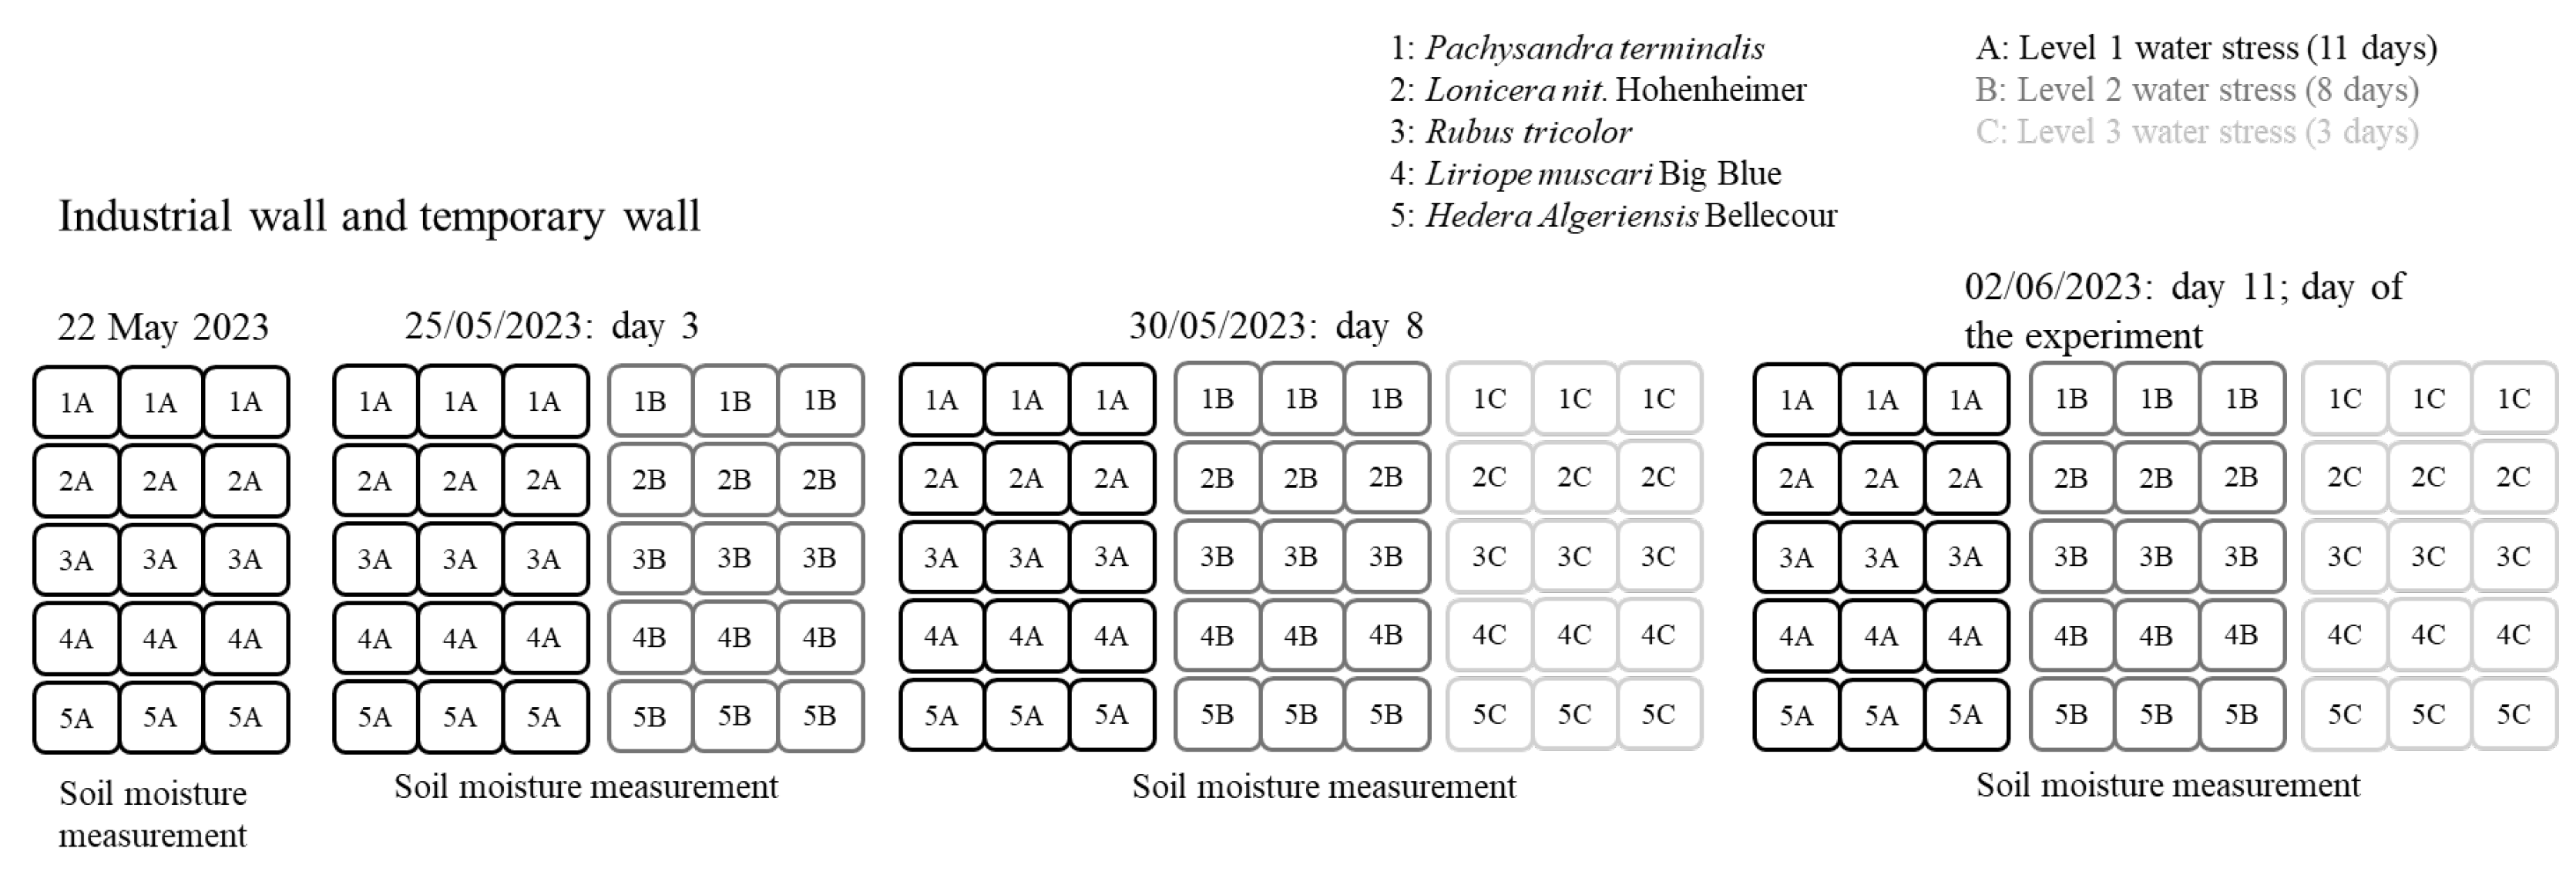
2.3. Main Experiment
2.3.1. Plant Species
2.3.2. Pre-Main Experiment: Preparing Plants to Detect Water Stress
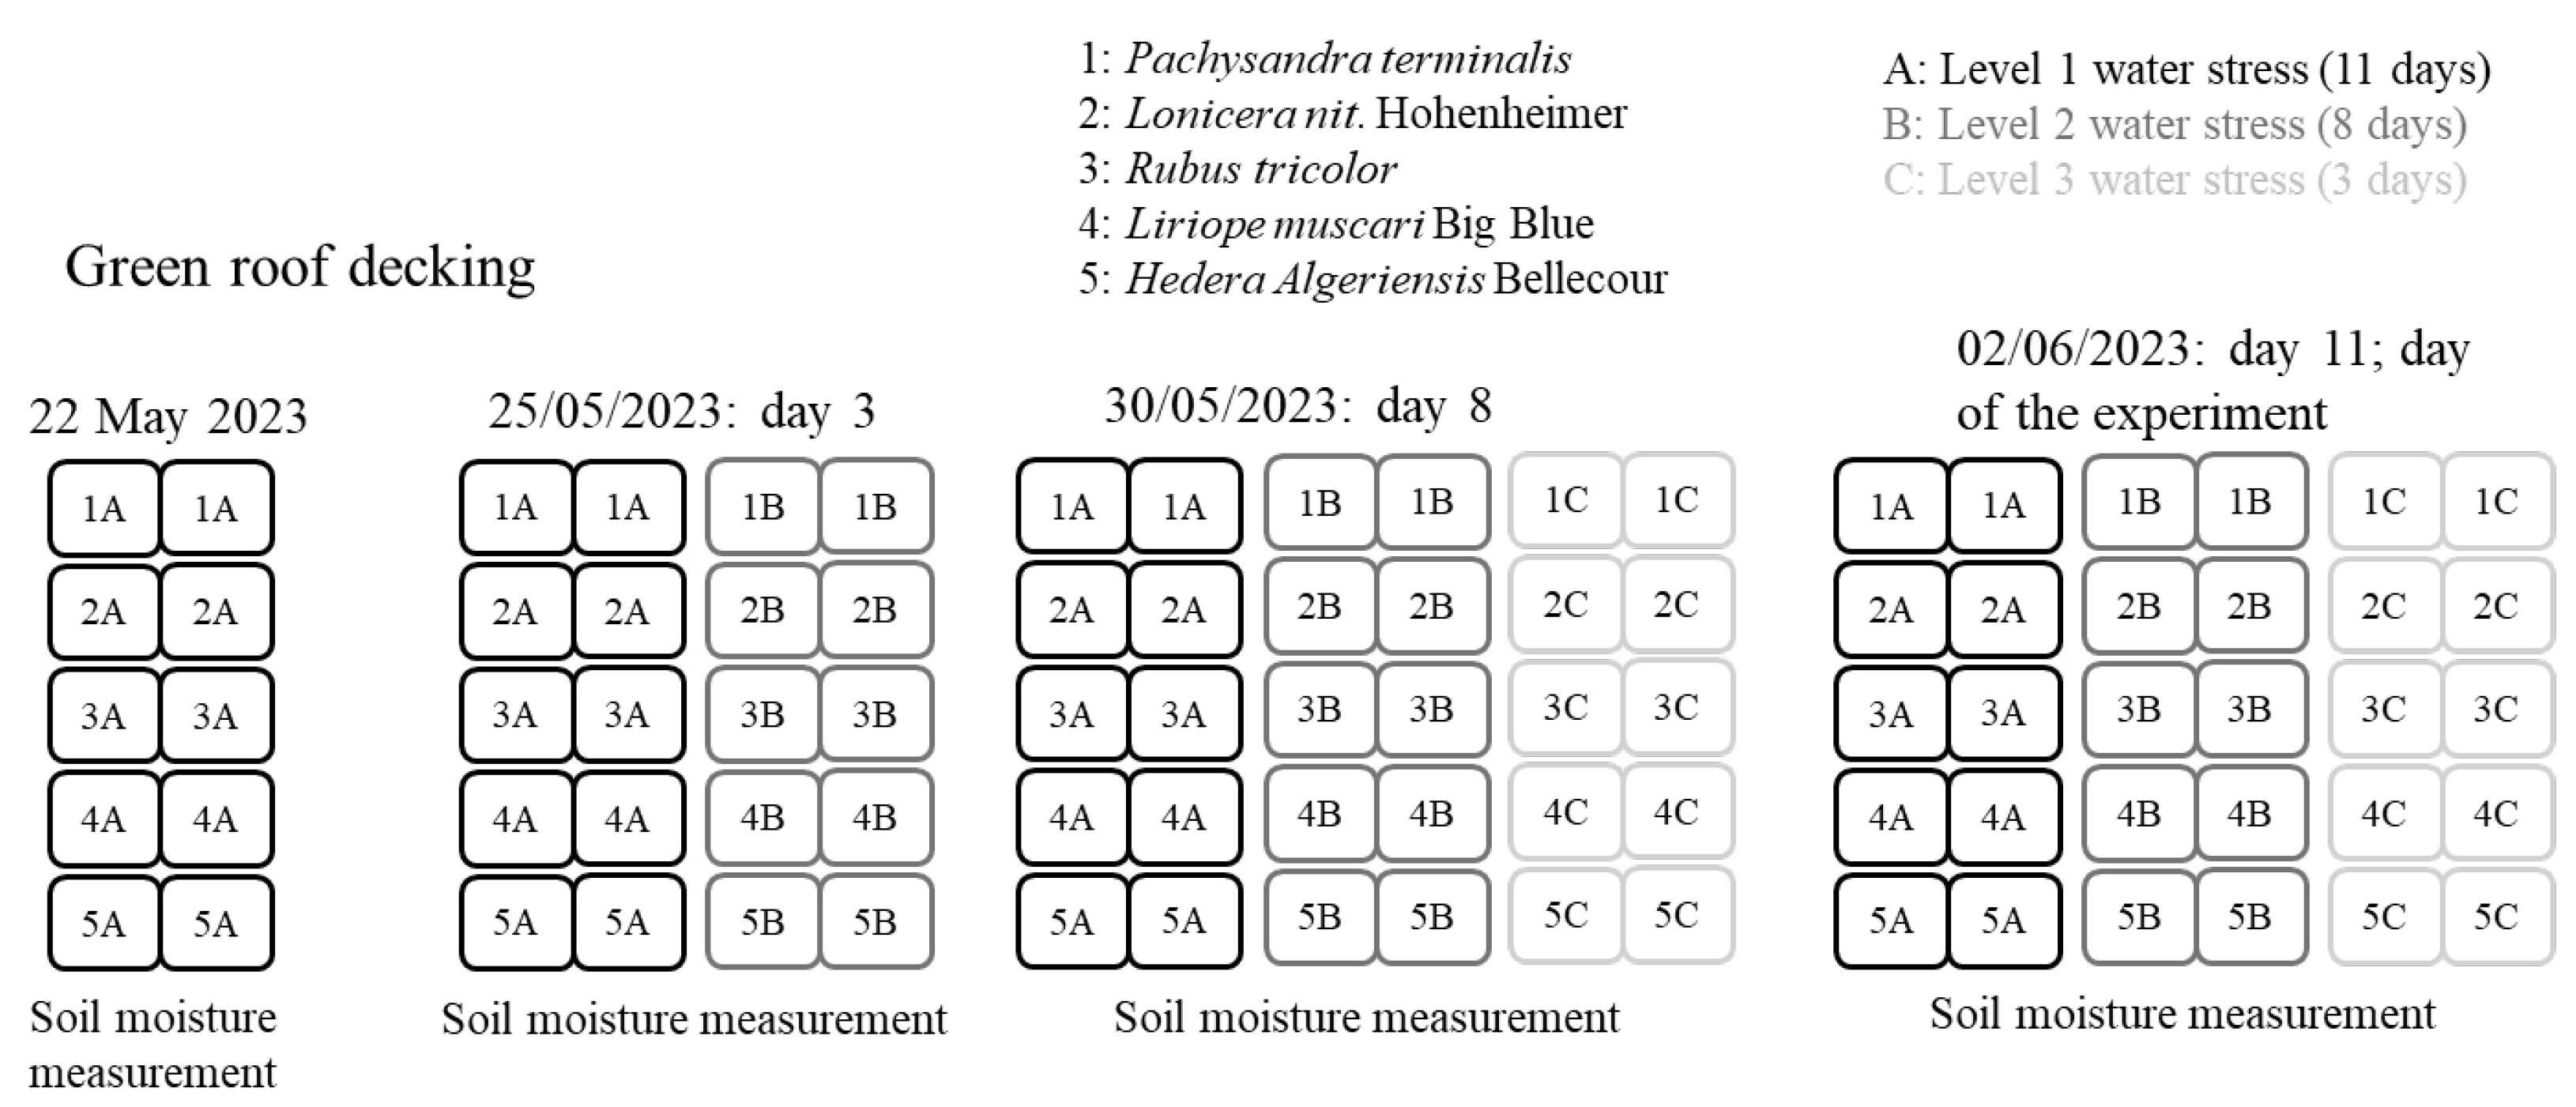
2.3.3. Main Experiment Setup
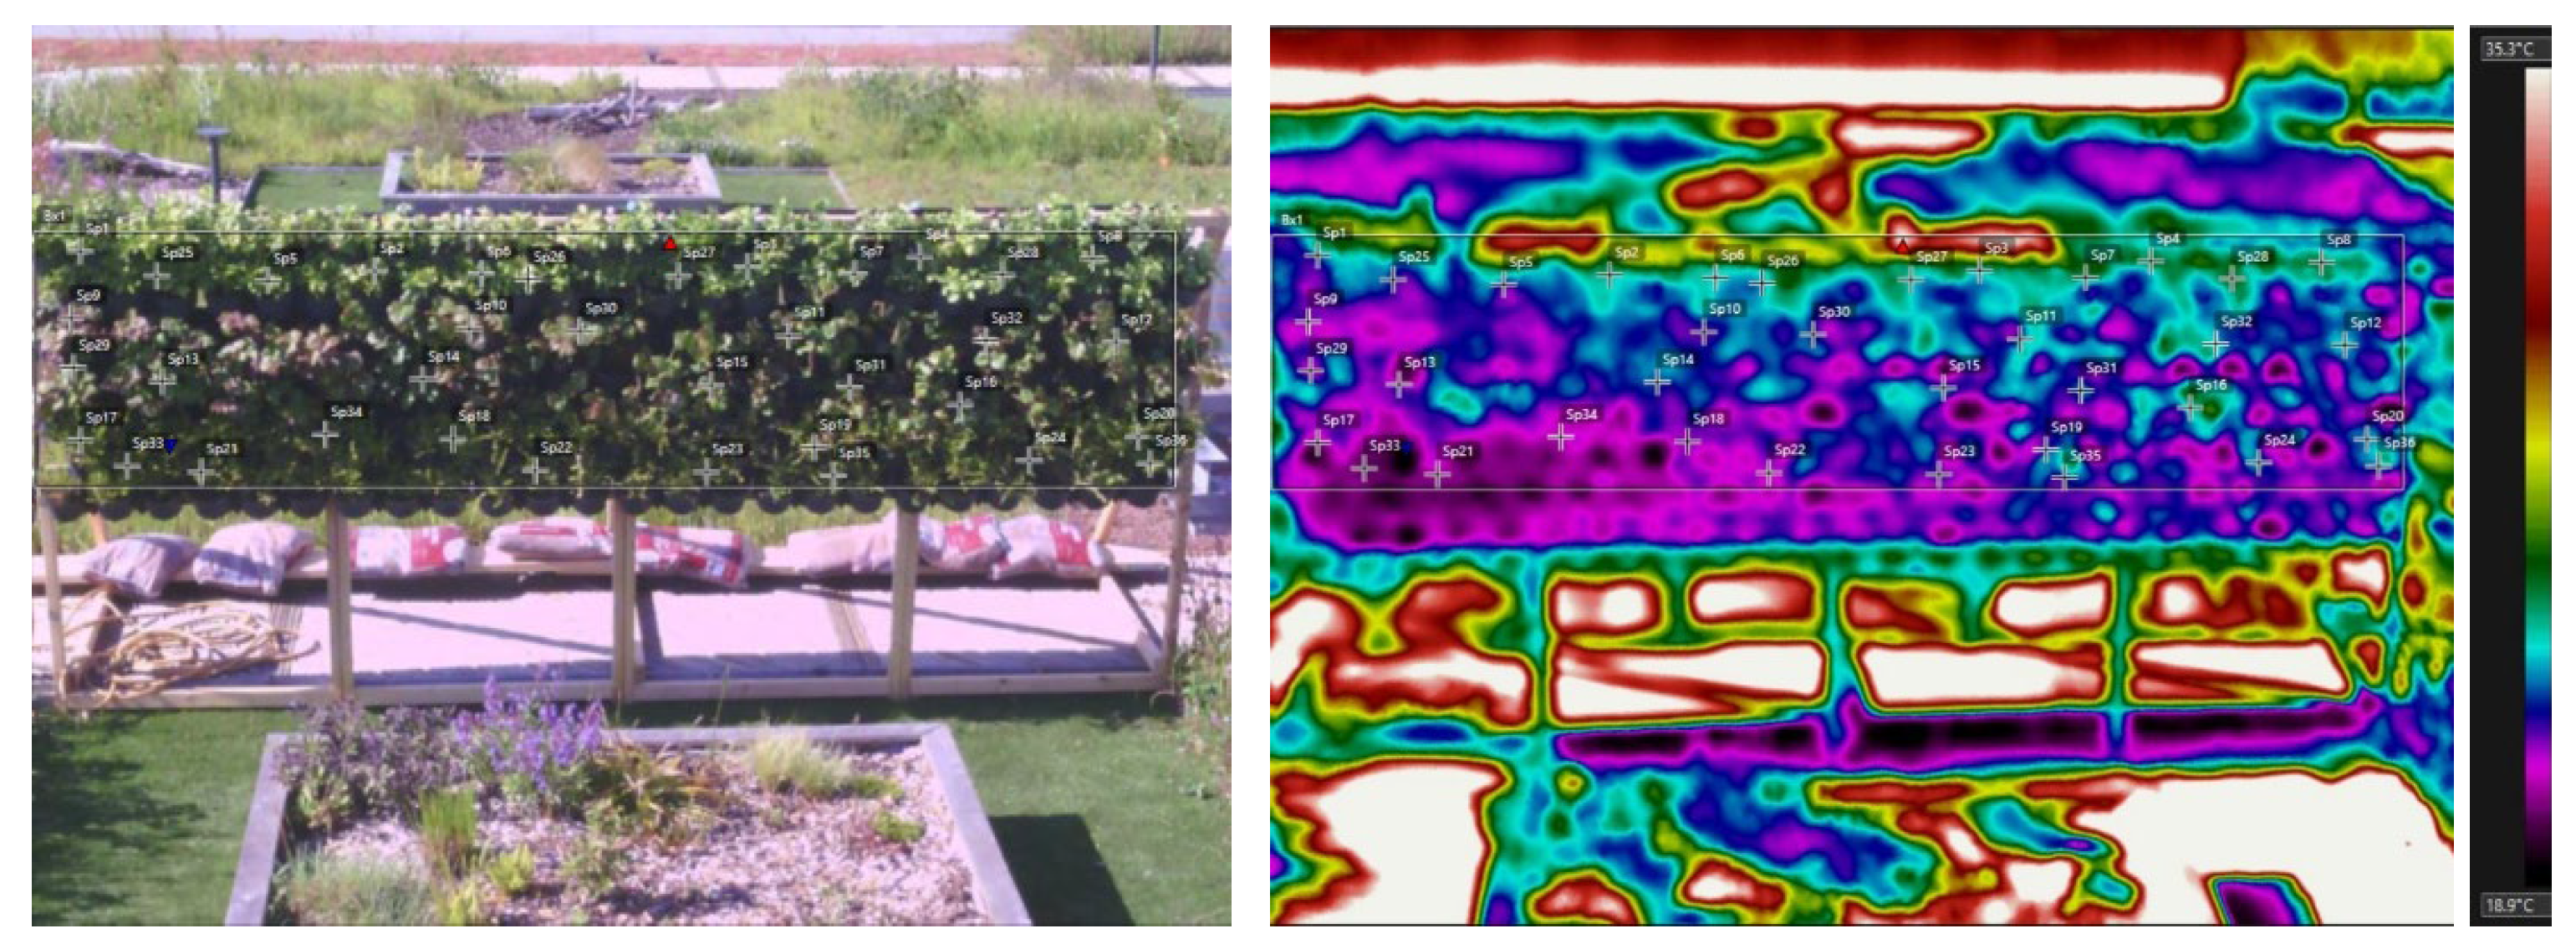
2.3.4. Materials: Thermal Camera and Drone
3. Results
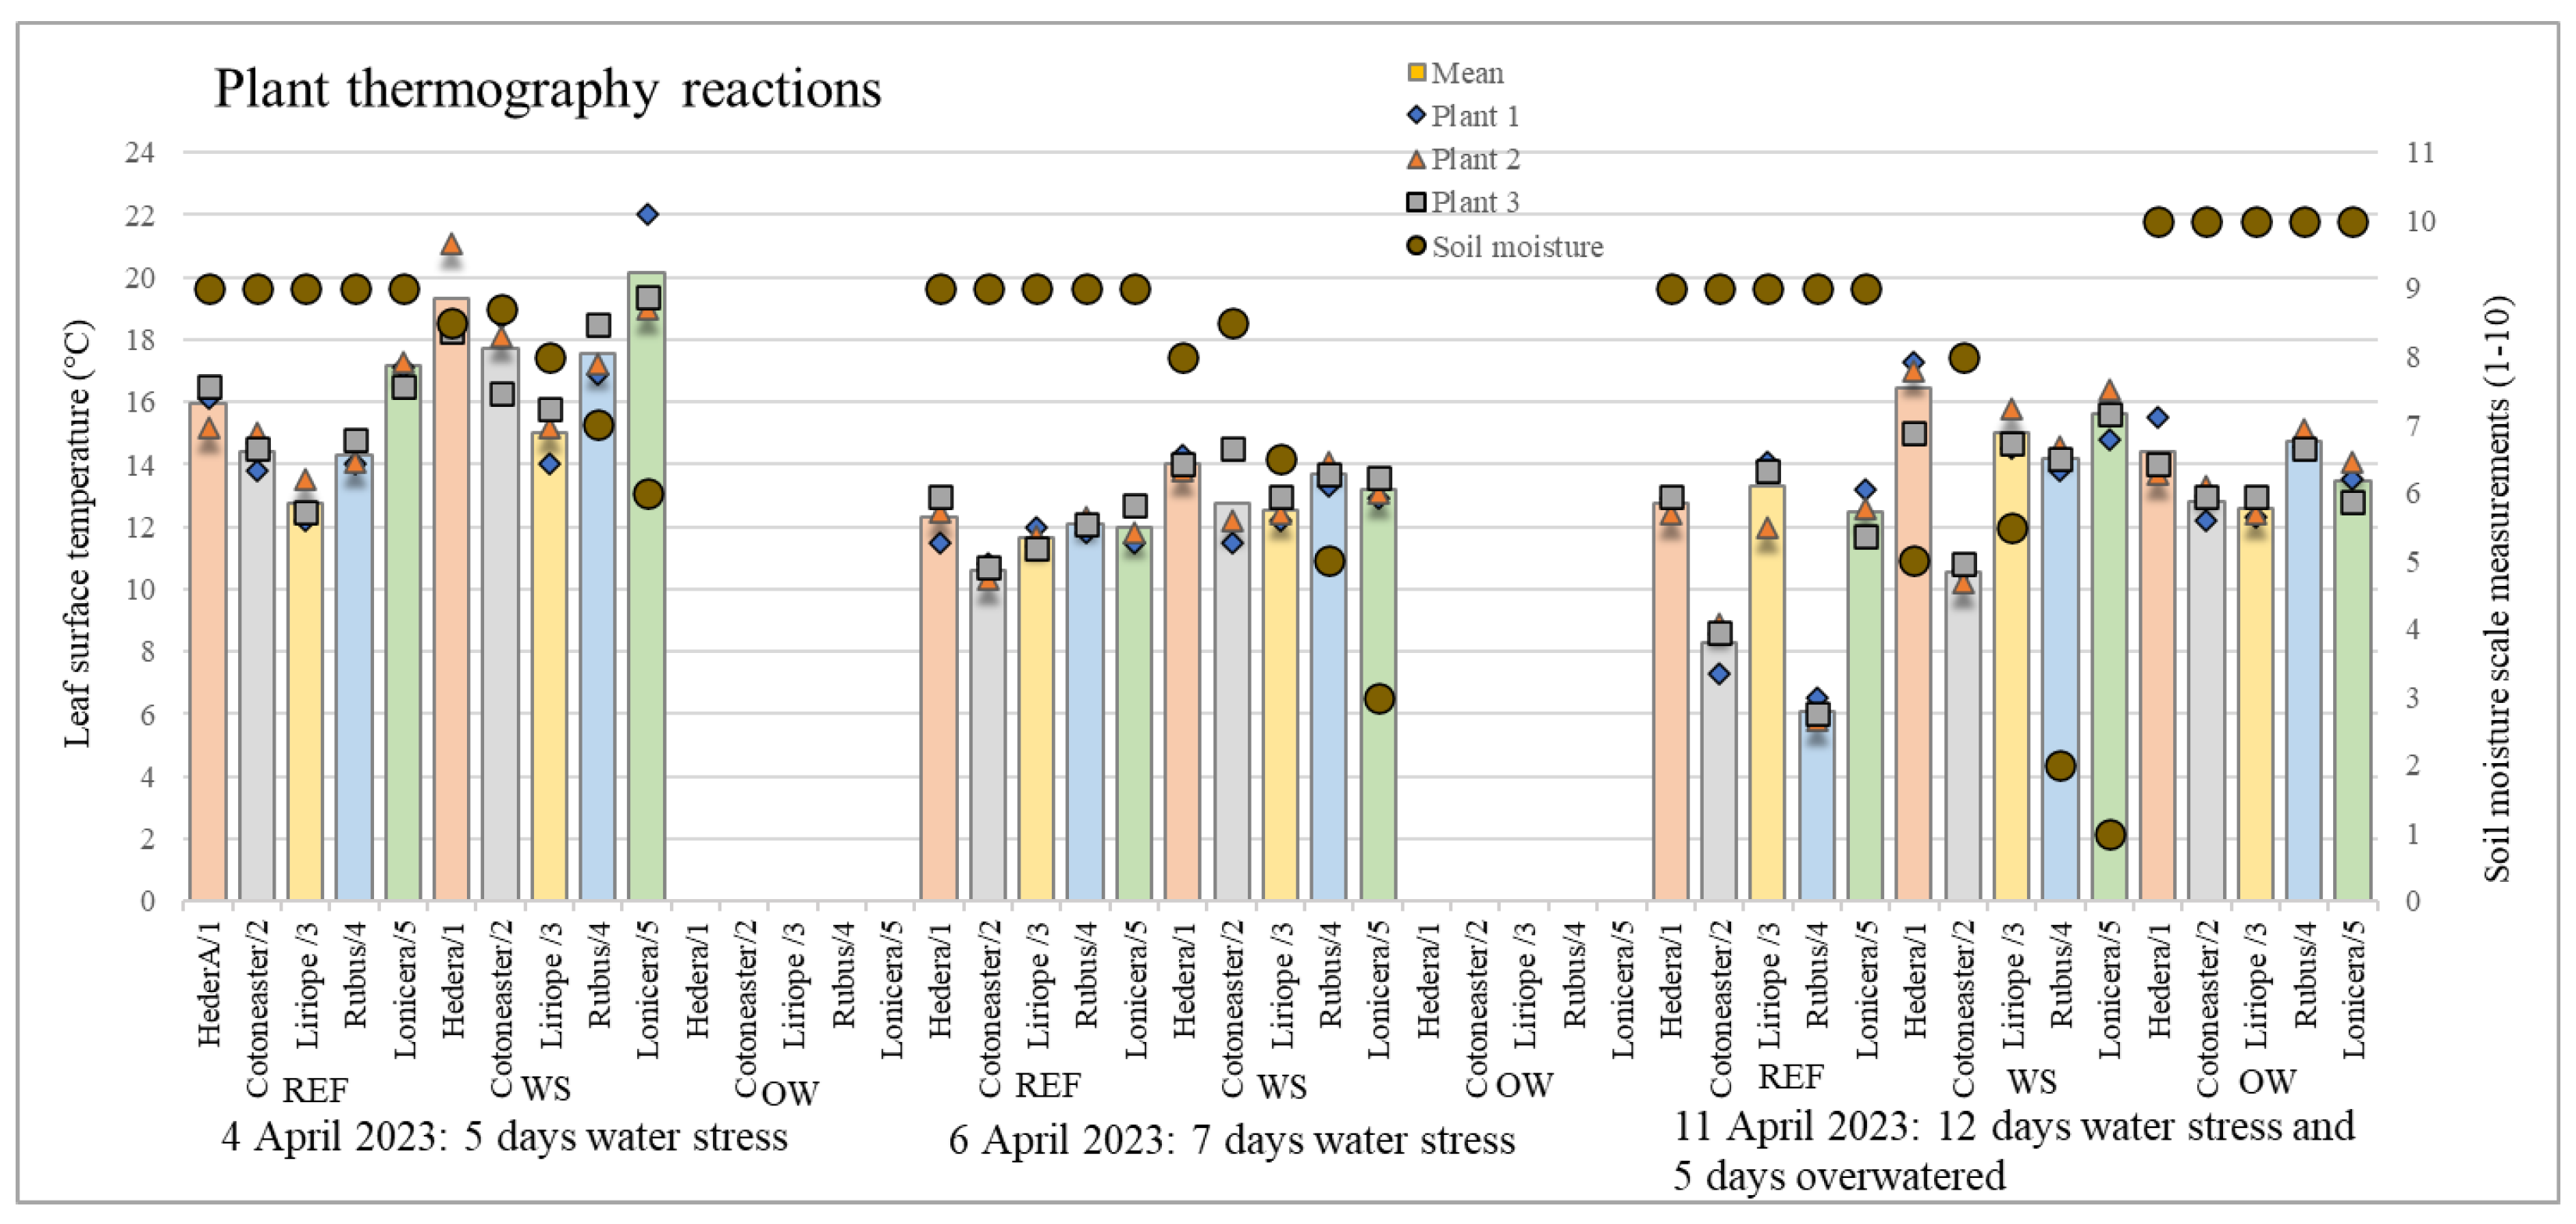
3.1. Pre-Test Experiment: Thermography Reactions from Plant Typologies
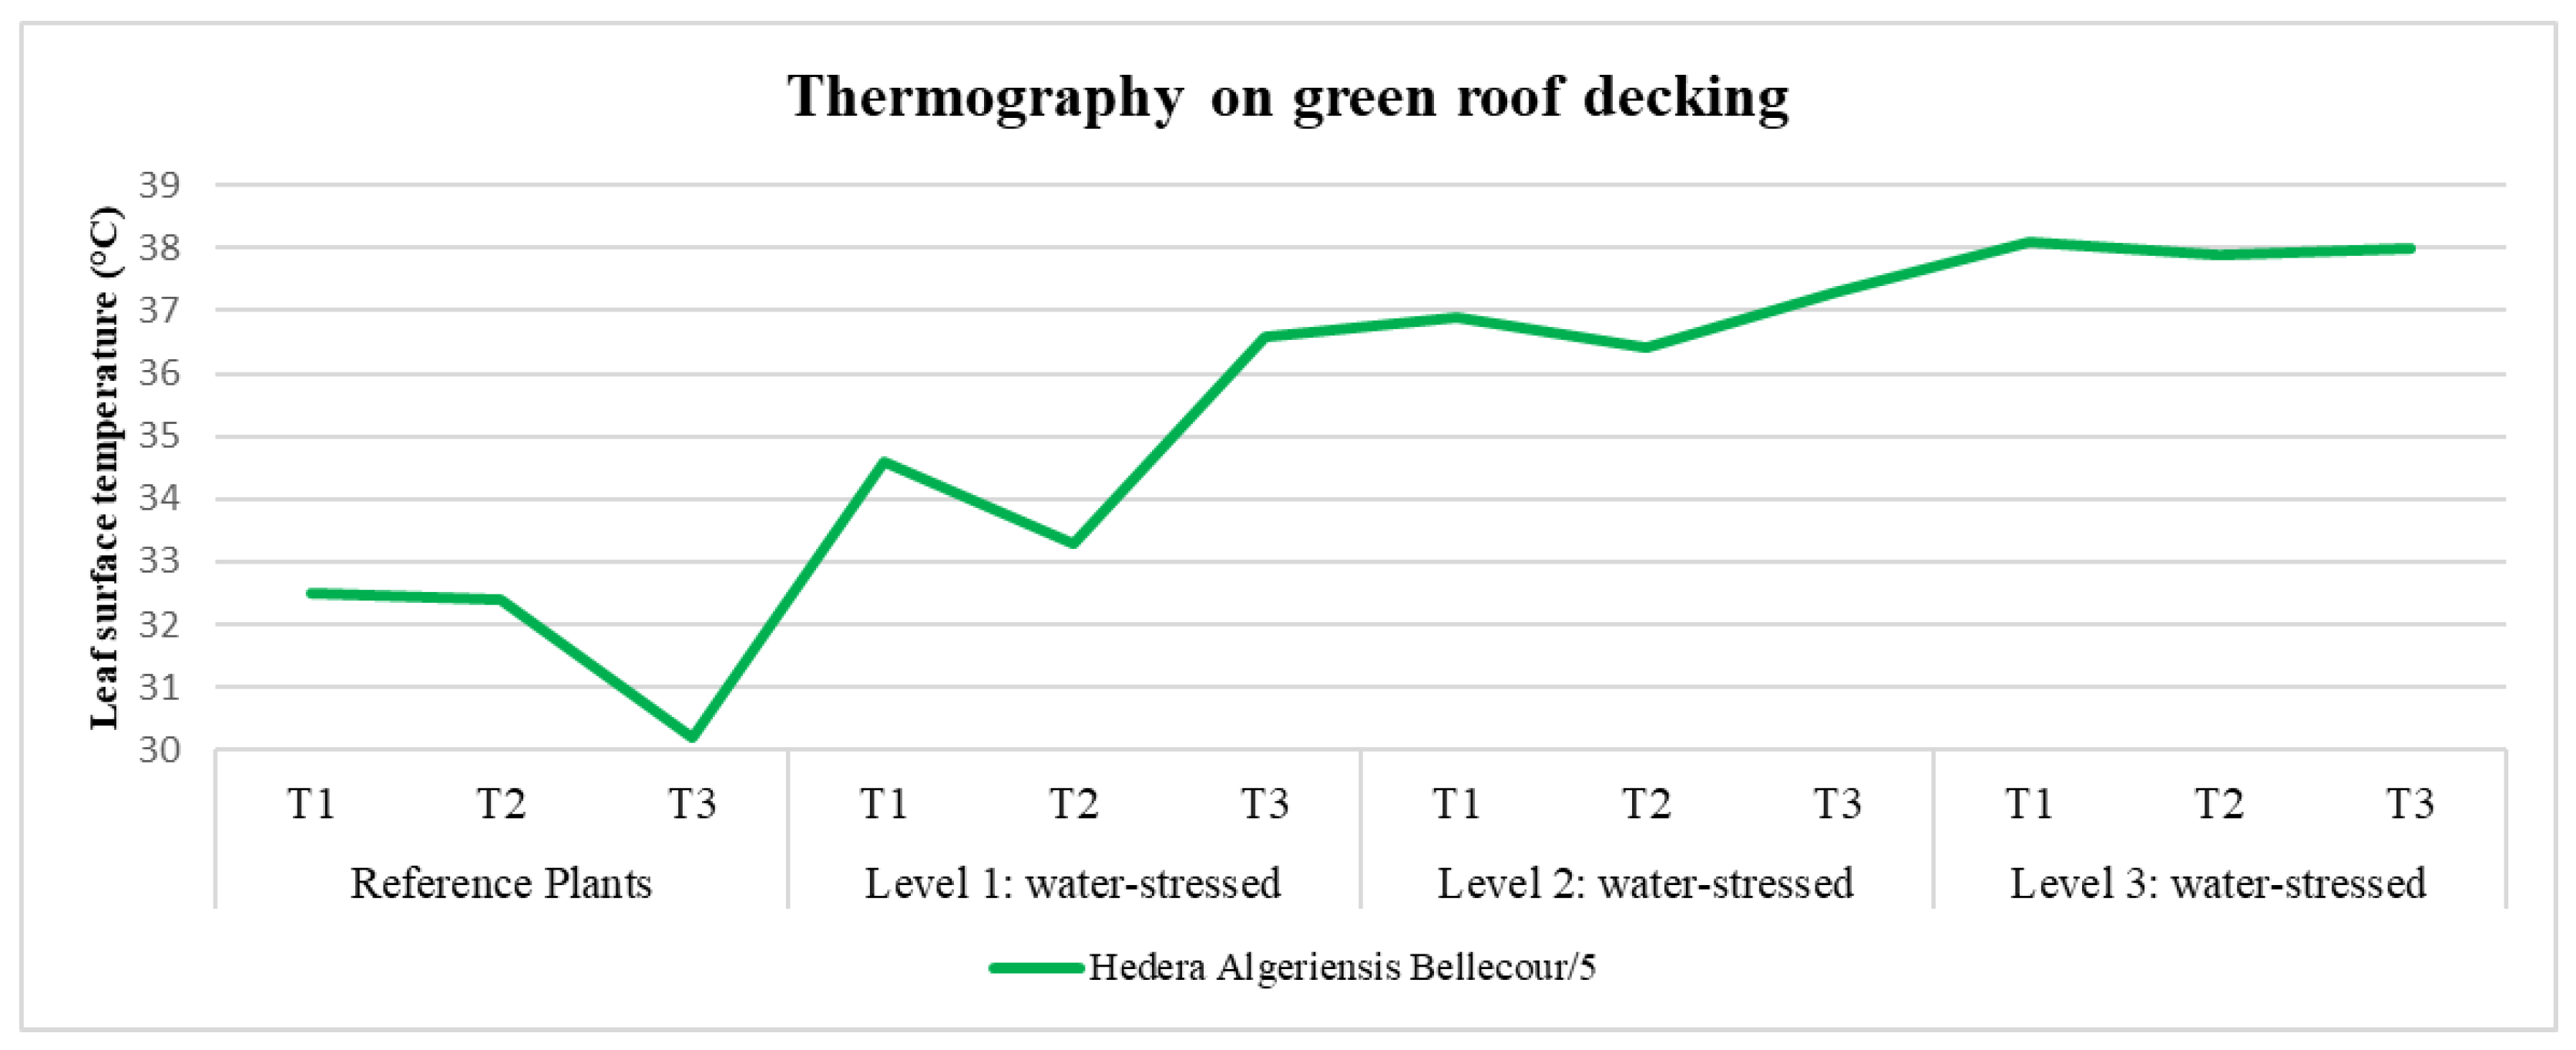
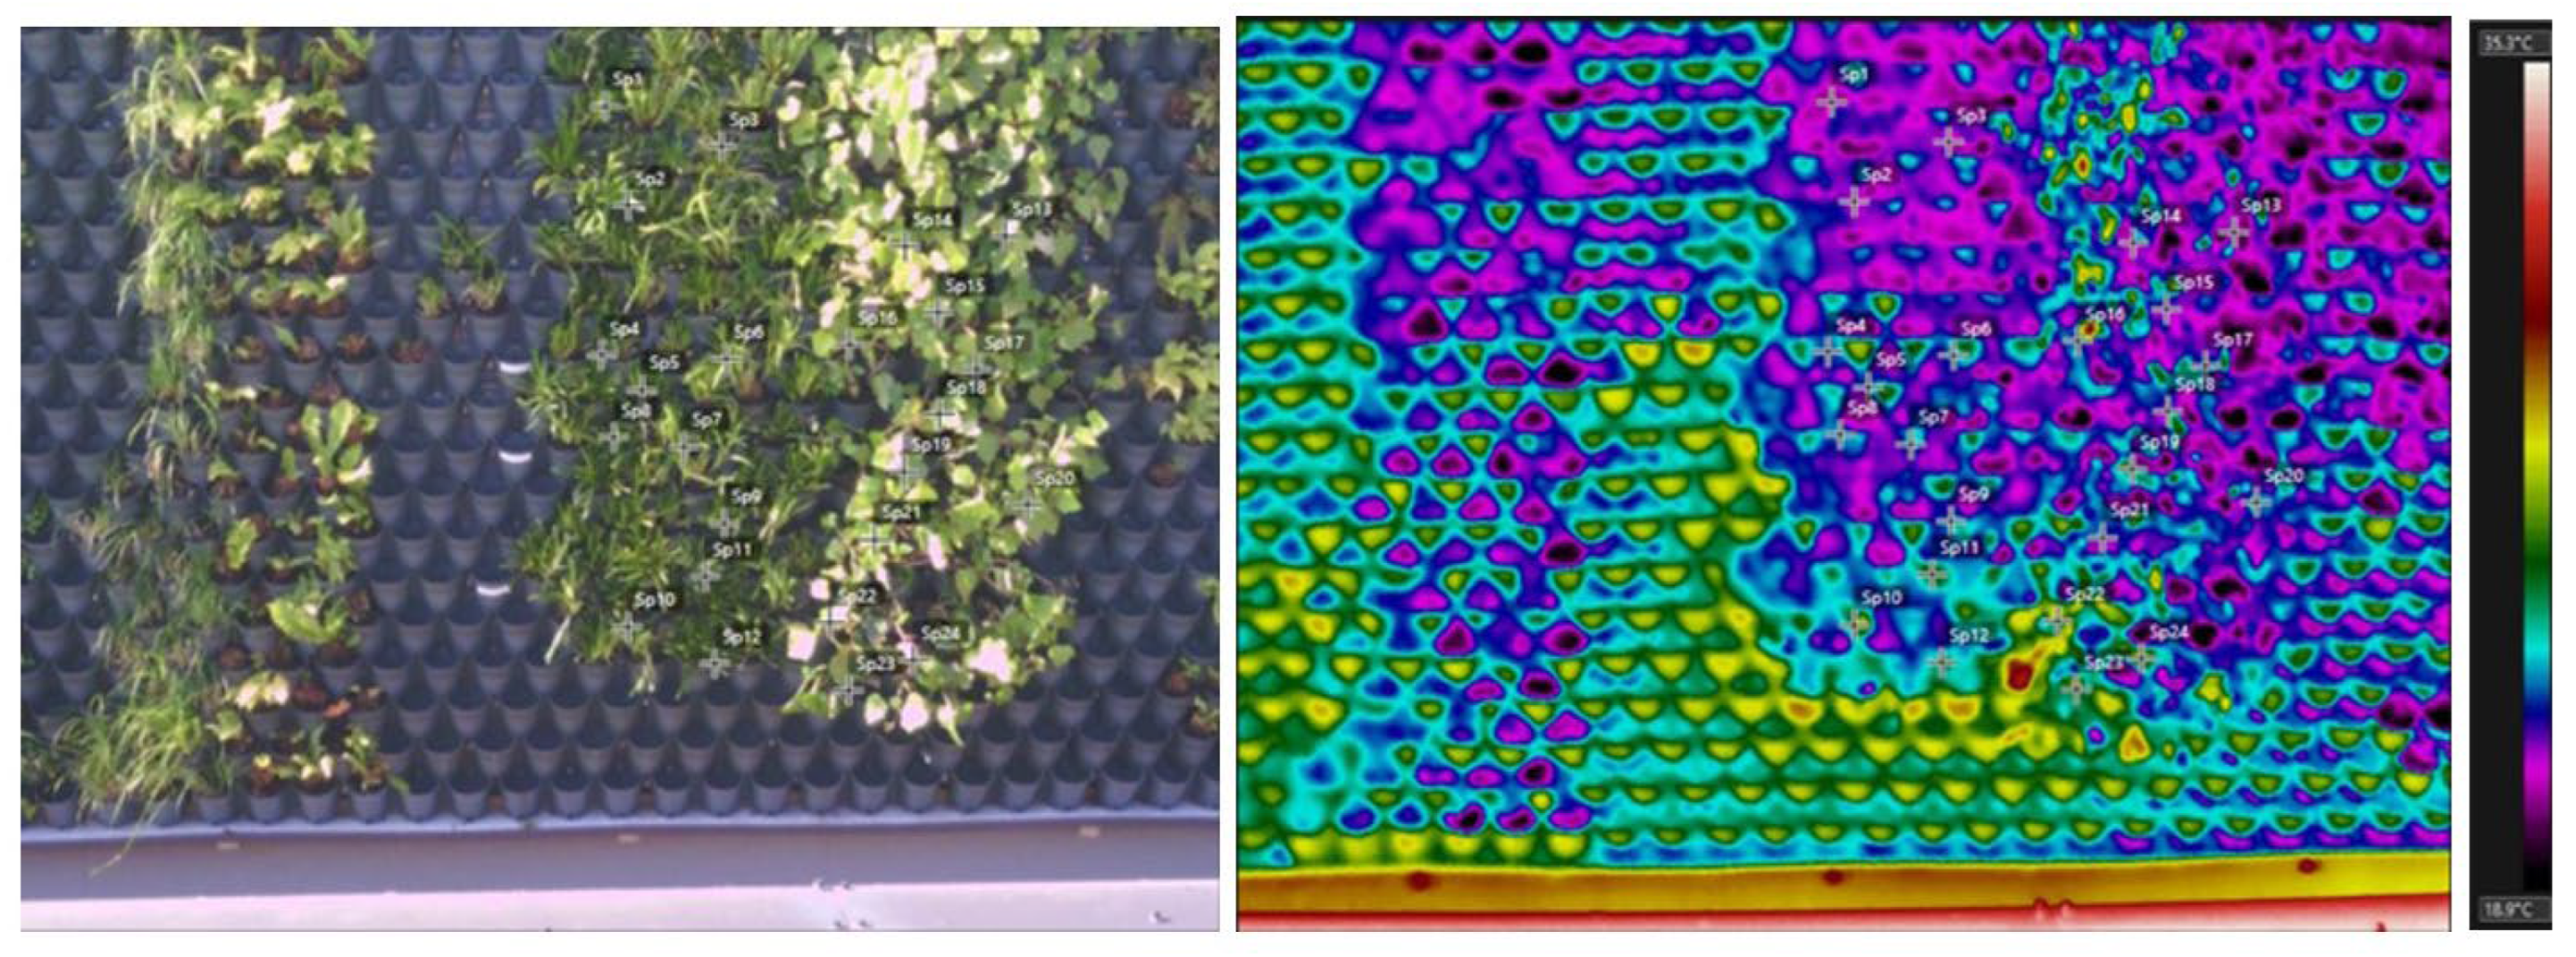
3.2. Main Experiment: Thermography between Green Infrastructure Typologies
4. Discussion
Limitations and Future Work
5. Conclusions
Author Contributions
Funding
Institutional Review Board Statement
Informed Consent Statement
Data Availability Statement
Acknowledgments
Conflicts of Interest
References
- Choi, C.; Berry, P.; Smith, A. The climate benefits, co-benefits, and trade-offs of green infrastructure: A systematic literature review. J. Environ. Manag. 2021, 291, 112583. [Google Scholar] [CrossRef] [PubMed]
- Ramyar, R.; Ackerman, A.; Johnston, D.M. Adapting cities for climate change through urban green infrastructure planning. Cities 2021, 117, 103316. [Google Scholar] [CrossRef]
- Singh, N.; Singh, S.; Mall, R.K. Chapter 17—Urban ecology and human health: Implications of urban heat island, air pollution and climate change nexus. In Urban Ecology; Verma, P., Singh, P., Singh, R., Raghubanshi, A.S., Eds.; Elsevier: Amsterdam, The Netherlands, 2020; pp. 317–334. [Google Scholar] [CrossRef]
- Ying, J.; Zhang, X.; Zhang, Y.; Bilan, S. Green infrastructure: Systematic literature review. Econ. Res.-Ekon. Istraživanja 2022, 35, 343–366. [Google Scholar] [CrossRef]
- Hesslerová, P.; Pokorný, J.; Huryna, H.; Seják, J.; Jirka, V. The impacts of greenery on urban climate and the options for use of thermal data in urban areas. Prog. Plan. 2022, 159, 100545. [Google Scholar] [CrossRef]
- Al-Kayiem, H.H.; Koh, K.; Riyadi, T.W.B.; Effendy, M. A Comparative Review on Greenery Ecosystems and Their Impacts on Sustainability of Building Environment. Sustainability 2020, 12, 8529. [Google Scholar] [CrossRef]
- Liu, Z.; Cheng, W.; Jim, C.Y.; Morakinyo, T.E.; Shi, Y.; Ng, E. Heat mitigation benefits of urban green and blue infrastructures: A systematic review of modeling techniques, validation and scenario simulation in ENVI-met V4. Build. Environ. 2021, 200, 107939. [Google Scholar] [CrossRef]
- Coutts, A.M.; Daly, E.; Beringer, J.; Tapper, N.J. Assessing practical measures to reduce urban heat: Green and cool roofs. Build. Environ. 2013, 70, 266–276. [Google Scholar] [CrossRef]
- Cameron, R.W.F.; Taylor, J.E.; Emmett, M.R. What’s ‘cool’ in the world of green façades? How plant choice influences the cooling properties of green walls. Build. Environ. 2014, 73, 198–207. [Google Scholar] [CrossRef]
- Basu, S.; Ramegowda, V.; Kumar, A.; Pereira, A. Plant adaptation to drought stress. F1000Research 2016, 5, 1554. [Google Scholar] [CrossRef]
- Gräf, M.; Immitzer, M.; Hietz, P.; Stangl, R. Water-Stressed Plants Do Not Cool: Leaf Surface Temperature of Living Wall Plants under Water Stress. Sustainability 2021, 13, 3910. [Google Scholar] [CrossRef]
- Lisar, S.Y.; Motafakkerazad, R.; Hossain, M.M.; Rahman, I. Water Stress in Plants: Causes, Effects and Responses. In Water Stress; Ismail, M., Mofizur, R., Hiroshi, H., Eds.; IntechOpen: London, UK, 2012. [Google Scholar] [CrossRef]
- Osakabe, Y.; Osakabe, K.; Shinozaki, K.; Tran, L.-S. Response of plants to water stress. Front. Plant Sci. 2014, 5, 86. [Google Scholar] [CrossRef] [PubMed]
- Bradford, K.J.; Hsiao, T.C. Physiological Responses to Moderate Water Stress. In Physiological Plant Ecology II: Water Relations and Carbon Assimilation; Lange, O.L., Nobel, P.S., Osmond, C.B., Ziegler, H., Eds.; Springer: Berlin/Heidelberg, Germany, 1982; pp. 263–324. [Google Scholar] [CrossRef]
- Lipiec, J.; Doussan, C.; Nosalewicz, A.; Kondracka, K. Effect of drought and heat stresses on plant growth and yield: A review. Int. Agrophysics 2013, 27, 463–477. [Google Scholar] [CrossRef]
- Sánchez-Blanco, M.J.; Álvarez, S.; Ortuño, M.F.; Ruiz-Sánchez, M.C. Root System Response to Drought and Salinity: Root Distribution and Water Transport. In Root Engineering: Basic and Applied Concepts; Morte, A., Varma, A., Eds.; Springer: Berlin/Heidelberg, Germany, 2014; pp. 325–352. [Google Scholar] [CrossRef]
- Buckley, T.N. How do stomata respond to water status? New Phytol. 2019, 224, 21–36. [Google Scholar] [CrossRef] [PubMed]
- Zardo, L.; Geneletti, D.; Pérez-Soba, M.; Van Eupen, M. Estimating the cooling capacity of green infrastructures to support urban planning. Ecosyst. Serv. 2017, 26, 225–235. [Google Scholar] [CrossRef]
- Imadi, S.; Gul, A.; Dikilitas, M.; Karakas, S.; Sharma, I.; Ahmad, P. Types, Causes, and Impact on Plant Growth and Development; Wiley: Hoboken, NJ, USA, 2016; pp. 343–355. [Google Scholar] [CrossRef]
- Cameron, R.W.F.; Taylor, J.; Emmett, M. A Hedera green façade–Energy performance and saving under different maritime-temperate, winter weather conditions. Build. Environ. 2015, 92, 111–121. [Google Scholar] [CrossRef]
- Čechová, K.; Kunt, M.; Jebavý, M.; Kozáková, D. Assortment of Plants for Growing in Vertical Gardens of Central Europe. Sci. Agric. Bohem. 2023, 54, 1–10. [Google Scholar]
- López-Rodríguez, G.; Pérez-Esteban, J.; Ruiz-Fernández, J.; Masaguer, A. Behavior and evolution of sustainable organic substrates in a vertical garden. Ecol. Eng. 2016, 93, 129–134. [Google Scholar] [CrossRef]
- Maria Raquel, C.D.S.; Montalto, F.A.; Palmer, M.I. Potential climate change impacts on green infrastructure vegetation. Urban For. Urban Green. 2016, 20, 128–139. [Google Scholar] [CrossRef]
- Tang, K.H.D. Green Walls as Mitigation of Urban Air Pollution: A Review of Their Effectiveness. Res. Ecol. 2023, 5, 1–13. [Google Scholar] [CrossRef]
- Bagnall, D.K.; McIntosh Wm, A.; Morgan, C.L.S.; Woodward, R.T.; Cisneros, M.; Black, M.; Kiella, E.M.; Ale, S. Farmers’ insights on soil health indicators and adoption. Agrosystems Geosci. Environ. 2020, 3, e20066. [Google Scholar] [CrossRef]
- Rabot, E.; Wiesmeier, M.; Schlüter, S.; Vogel, H.-J. Soil structure as an indicator of soil functions: A review. Geoderma 2018, 314, 122–137. [Google Scholar] [CrossRef]
- Wang, X.; Cheng, L.; Xiong, C.; Whalley, W.R.; Miller, A.J.; Rengel, Z.; Zhang, F.; Shen, J. Understanding plant–soil interactions underpins enhanced sustainability of crop production. Trends Plant Sci. 2024, 24, S1360–S1385. [Google Scholar] [CrossRef] [PubMed]
- Meetam, M.; Sripintusorn, N.; Songnuan, W.; Siriwattanakul, U.; Pichakum, A. Assessment of physiological parameters to determine water tolerance of plants for extensive green roof architecture in tropical areas. Urban For. Urban Green. 2020, 56, 126874. [Google Scholar] [CrossRef]
- Marx, C.; Tetzlaff, D.; Hinkelmann, R.; Soulsby, C. Seasonal variations in soil–plant interactions in contrasting urban green spaces: Insights from water stable isotopes. J. Hydrol. 2022, 612, 127998. [Google Scholar] [CrossRef]
- Baryła, A.; Gnatowski, T.; Karczmarczyk, A.; Szatyłowicz, J. Changes in Temperature and Moisture Content of an Extensive-Type Green Roof. Sustainability 2019, 11, 2498. [Google Scholar] [CrossRef]
- Yuan, M.; Zhao, L.; Lin, A.; Wang, L.; Li, Q.; She, D.; Qu, S. Impacts of preseason water on vegetation spring phenology across the Northeast China Transect. Sci. Total Environ. 2020, 738, 140297. [Google Scholar] [CrossRef]
- López-Mata, E.; Tarjuelo, J.M.; de Juan, J.A.; Ballesteros, R.; Domínguez, A. Effect of irrigation uniformity on the profitability of crops. Agric. Water Manag. 2010, 98, 190–198. [Google Scholar] [CrossRef]
- Perera, R.S.; Cullen, B.R.; Eckard, R.J. Using Leaf Temperature to Improve Simulation of Heat and Water Stresses in a Biophysical Model. Plants 2020, 9, 8. [Google Scholar] [CrossRef]
- Vialet-Chabrand, S.; Lawson, T. Thermography methods to assess stomatal behaviour in a dynamic environment. J. Exp. Bot. 2020, 71, 2329–2338. [Google Scholar] [CrossRef]
- Daemei, A.B.; Shafiee, E.; Chitgar, A.A.; Asadi, S. Investigating the thermal performance of green wall: Experimental analysis, deep learning model, and simulation studies in a humid climate. Build. Environ. 2021, 205, 108201. [Google Scholar] [CrossRef]
- Kim, Y.; Still, C.J.; Roberts, D.A.; Goulden, M.L. Thermal infrared imaging of conifer leaf temperatures: Comparison to thermocouple measurements and assessment of environmental influences. Agric. For. Meteorol. 2018, 248, 361–371. [Google Scholar] [CrossRef]
- García-Tejero, I.F.; Rubio, A.E.; Viñuela, I.; Hernández, A.; Gutiérrez-Gordillo, S.; Rodríguez-Pleguezuelo, C.R.; Durán-Zuazo, V.H. Thermal imaging at plant level to assess the crop-water status in almond trees (cv. Guara) under deficit irrigation strategies. Agric. Water Manag. 2018, 208, 176–186. [Google Scholar] [CrossRef]
- Jones, H.G.; Serraj, R.; Loveys, B.R.; Xiong, L.; Wheaton, A.; Price, A.H. Thermal infrared imaging of crop canopies for the remote diagnosis and quantification of plant responses to water stress in the field. Funct. Plant Biol. 2009, 36, 978–989. [Google Scholar] [CrossRef]
- Fox, M.; Morewood, J.; Murphy, T.; Lunt, P.; Goodhew, S. Living wall systems for improved thermal performance of existing buildings. Build. Environ. 2022, 207, 108491. [Google Scholar] [CrossRef]
- Fuentes, S.; Tongson, E.; Gonzalez Viejo, C. Urban Green Infrastructure Monitoring Using Remote Sensing from Integrated Visible and Thermal Infrared Cameras Mounted on a Moving Vehicle. Sensors 2021, 21, 295. [Google Scholar] [CrossRef] [PubMed]
- MeteoBlue. Simulated Historical Climate & Weather Data for Salford. Available online: https://www.meteoblue.com/en/weather/historyclimate/climatemodelled/salford_united-kingdom_2638671 (accessed on 30 September 2024).
- Hatfield, J.L. Measuring Plant Stress with an Infrared Thermometer. HortScience 1990, 25, 1535–1538. [Google Scholar] [CrossRef]
- de Langre, E. Effects of Wind on Plants. Annu. Rev. Fluid Mech. 2008, 40, 141–168. [Google Scholar] [CrossRef]
- Wang, B.H.; Wang, D.B.; Ali, Z.A.; Ting Ting, B.; Wang, H. An overview of various kinds of wind effects on unmanned aerial vehicle. Meas. Control 2019, 52, 731–739. [Google Scholar] [CrossRef]
- Iwabe, R.; Koyama, K.; Komamura, R. Shade Avoidance and Light Foraging of a Clonal Woody Species, Pachysandra terminalis. Plants 2021, 10, 809. [Google Scholar] [CrossRef]
- RHS. Lonicera nitida ‘Hohenheimer Findling’. Available online: https://www.rhs.org.uk/plants/53380/lonicera-nitida-hohenheimer-findling/details (accessed on 7 September 2024).
- Costea, T.; Vlase, L.; Gostin, I.N.; Olah, N.K.; Mihaela, G.; Predan, I. Botanical characterization, phytochemical analysis and antioxidant activity of indigenous red raspberry (Rubus idaeus L.) leaves. Stud. Univ. “Vasile Goldiş” Ser. Ştiinţele Vieţi 2016, 26, 463–472. [Google Scholar]
- Zhang, J.J.; Zhu, L.; Zhang, X.; Zhou, J.; Guy, R.D. Photosynthetic performance and growth responses of Liriope muscari (Decne.) L.H. Bailey (Asparagaceae) to different levels of irradiance in three seasons. Flora 2021, 278, 151798. [Google Scholar] [CrossRef]
- Marshall, R.H.; McAllister, H.A.; Armitage, J.D. A summary of hybrids detected in the genus Hedera (Araliaceae) with the provision of three new names. New J. Bot. 2017, 7, 2–8. [Google Scholar] [CrossRef]
- MetOffice. Weather and Climate-Salford (Greater Manchester). Available online: https://www.metoffice.gov.uk/weather/forecast/gcw279prq#?date=2023-06-15 (accessed on 15 June 2023).
- FREEFLY. Movi pro Gimble. Available online: https://freeflysystems.com/movi-pro (accessed on 15 June 2023).
- CVP. Freefly Alta 8 Drone. Available online: https://cvp.com/product/freefly_alta_8 (accessed on 15 June 2023).
- FLIR Systems. Flir T1030sc HD Thermal Imaging for R&D Applications; Product manual; FLIR Systems: Wilsonville, ON, USA, 2015; p. 8. [Google Scholar]
- Mickky, B.; Aldesuquy, H.; Elnajar, M. Effect of water on yield of ten wheat cultivars linked with their flag leaf water status, fatty acid profile and shoot vigor at heading. Physiol. Mol. Biol. Plants 2020, 26, 1111–1117. [Google Scholar] [CrossRef] [PubMed]
- Niu, Y.; Xiang, Y. An Overview of Biomembrane Functions in Plant Responses to High-Temperature Stress. Front. Plant Sci. 2018, 9, 915. [Google Scholar] [CrossRef] [PubMed]
- Alkaabi, K.; Senghore, S.; Rhman El Fawair, A. Toward sustainable cities: Monitoring thermal environment for buildings and pedestrian space using drone-captured 3D thermal imaging. Front. Built Environ. 2023, 8, 1035546. [Google Scholar] [CrossRef]
- McConnell, K.; Braneon, C.V.; Glenn, E.; Stamler, N.; Mallen, E.; Johnson, D.P.; Pandya, R.; Abramowitz, J.; Fernandez, G.; Rosenzweig, C. A quasi-experimental approach for evaluating the heat mitigation effects of green roofs in Chicago, Illinois. Sustain. Cities Soc. 2022, 76, 103376. [Google Scholar] [CrossRef]
- Coma, J.; Pérez, G.; de Gracia, A.; Burés, S.; Urrestarazu, M.; Cabeza, L.F. Vertical greenery systems for energy savings in buildings: A comparative study between green walls and green facades. Build. Environ. 2017, 111, 228–237. [Google Scholar] [CrossRef]
- Liu, S.; Zenda, T.; Dong, A.; Yang, Y.; Wang, N.; Duan, H. Global Transcriptome and Weighted Gene Co-expression Network Analyses of Growth-Stage-Specific Water Stress Responses in Maize. Front. Genet. 2021, 12, 645443. [Google Scholar] [CrossRef]
- Michaletti, A.; Naghavi, M.R.; Toorchi, M.; Zolla, L.; Rinalducci, S. Metabolomics and proteomics reveal water-stress responses of leaf tissues from spring-wheat. Sci. Rep. 2018, 8, 5710. [Google Scholar] [CrossRef]
- Fritz, M.A.; Rosa, S.; Sicard, A. Mechanisms Underlying the Environmentally Induced Plasticity of Leaf Morphology. Front. Genet. 2018, 9, 478. [Google Scholar] [CrossRef]
- Alizadeh, B.; Hitchmough, J.D. Designing sustainable urban landscape and meeting the challenge of climate change: A study of plant species adaptation and fitness under different climate change scenarios in public landscape of UK. Landsc. Res. 2020, 45, 228–246. [Google Scholar] [CrossRef]


| Plant Type | 1 | 2 | 3 | 4 | 5 |
|---|---|---|---|---|---|
| Plant image |  | 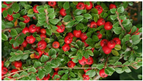 | 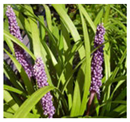 | 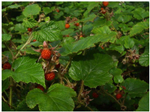 |  |
| Plant name | Hedera Algeriensis Bellecour | Cotoneaster dammeri | Liriope muscari Big Blue | Rubus tricolor | Lonicera nit. Hohenheimer |
| Plant Type | 1 | 2 | 3 | 4 | 5 |
|---|---|---|---|---|---|
| Plant image | 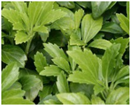 | 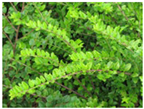 |  | 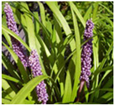 |  |
| Plant name | Pachysandra terminalis | Lonicera nit. Hohenheimer | Rubus tricolor | Liriope muscari Big Blue | Hedera algeriensis Bellecour |
| Plant Name/Type | Pachysandra terminalis/1 | Lonicera nit. Hohenheimer/2 | Rubus tricolor/3 | Liriope muscari Big Blue/4 | Hedera algeriensis Bellecour/5 | |
|---|---|---|---|---|---|---|
| Level 1—water-stressed | Water stress start | 30 May 2023 | 30 May 2023 | 30 May 2023 | 30 May 2023 | 30 May 2023 |
| Day 0—30 May 2023 | 9 | 9 | 9 | 9 | 9 | |
| Day 2—1 June 2023 | 8.5 | 8.5 | 7.5 | 8.5 | 8 | |
| Day 3—2 June 2023 | 8.5 | 8.5 | 7.5 | 8.5 | 8 | |
| Level 2—water-stressed | Water stress start | 25 May 2023 | 25 May 2023 | 25 May 2023 | 25 May 2023 | 25 May 2023 |
| Day 0—25 May 2023 | 9 | 9 | 9 | 9 | 9 | |
| Day 7—1 June 2023 | 8.5 | 8.5 | 7 | 7.5 | 7.5 | |
| Day 8—2 June 2023 | 8 | 8 | 7 | 7 | 7 | |
| Level 3—water-stressed | Water stress start | 22 May 2023 | 22 May 2023 | 22 May 2023 | 22 May 2023 | 22 May 2023 |
| Day 0—22 May 2023 | 8.5 | 9.5 | 8.5 | 9.5 | 8 | |
| Day 3—25 May 2023 | 8.5 | 9 | 7 | 8.5 | 7.5 | |
| Day 10—1 June 2023 | 7 | 7.5 | 6.5 | 5.5 | 6 | |
| Day 11—2 June 2023 | 6.5 | 7 | 6.5 | 5 | 4.5 |
| Date | Measurement Performed | Hedera/1 | Cotoneaster/2 | Liriope/3 | Rubus/4 | Lonicera/5 |
|---|---|---|---|---|---|---|
| 4 April 2023 | REF | 0.544 | 0.492 | 0.556 | 0.356 | 0.340 |
| WS | 1.276 | 1.020 | 0.748 | 0.694 | 1.330 | |
| 6 April 2023 | REF | 0.624 | 0.216 | 0.287 | 0.205 | 0.510 |
| WS | 0.205 | 1.281 | 0.340 | 0.327 | 0.294 | |
| 11 April 2023 | REF | 0.262 | 0.694 | 0.927 | 0.294 | 0.616 |
| WS | 1.021 | 0.249 | 0.572 | 0.327 | 0.653 | |
| OW | 0.787 | 0.464 | 0.309 | 0.262 | 0.531 |
| Plant Type | Temperature Difference between Reference and L1–3 Water-Stressed Plants | |||
|---|---|---|---|---|
| DT L1 | DT L2 | DT L3 | ||
| Temporary wall | 1 | 1.17 | 1.50 | 2.33 |
| 2 | 0.93 | 1.43 | 2.33 | |
| 3 | 0.87 | 1.90 | 2.70 | |
| Industrial wall | 4 | 1.26 | 1.63 | 2.96 |
| 5 | 0.87 | 1.60 | 3.20 | |
| Green roof decking | 5 | 3.10 | 5.20 | 6.30 |
Disclaimer/Publisher’s Note: The statements, opinions and data contained in all publications are solely those of the individual author(s) and contributor(s) and not of MDPI and/or the editor(s). MDPI and/or the editor(s) disclaim responsibility for any injury to people or property resulting from any ideas, methods, instructions or products referred to in the content. |
© 2024 by the authors. Licensee MDPI, Basel, Switzerland. This article is an open access article distributed under the terms and conditions of the Creative Commons Attribution (CC BY) license (https://creativecommons.org/licenses/by/4.0/).
Share and Cite
Elkadi, H.; Seifhashemi, M.; Lauwerijssen, R. Thermographic Analysis of Green Wall and Green Roof Plant Types under Levels of Water Stress. Sustainability 2024, 16, 8685. https://doi.org/10.3390/su16198685
Elkadi H, Seifhashemi M, Lauwerijssen R. Thermographic Analysis of Green Wall and Green Roof Plant Types under Levels of Water Stress. Sustainability. 2024; 16(19):8685. https://doi.org/10.3390/su16198685
Chicago/Turabian StyleElkadi, Hisham, Mahsa Seifhashemi, and Rachel Lauwerijssen. 2024. "Thermographic Analysis of Green Wall and Green Roof Plant Types under Levels of Water Stress" Sustainability 16, no. 19: 8685. https://doi.org/10.3390/su16198685
APA StyleElkadi, H., Seifhashemi, M., & Lauwerijssen, R. (2024). Thermographic Analysis of Green Wall and Green Roof Plant Types under Levels of Water Stress. Sustainability, 16(19), 8685. https://doi.org/10.3390/su16198685