Article

Regional Economic Development, Climate Change, and Work Force in a Gender Perspective in Chile: Insights from the Input–Output Matrix

by
Sergio Soza-Amigo
1,* and
Jean Pierre Doussoulin
2,3,*
1
Instituto de Gestión e Industria, Universidad Austral de Chile, Puerto Montt 5480000, Chile
2
Economic Institute, Facultad de Ciencias Económicas y Administrativas, Universidad Austral de Chile, Valdivia 5090000, Chile
3
Research Team on the Use of Panel Data in Economics, Université Gustave Eiffel, 77420 Champs-sur-Marne, France
*
Authors to whom correspondence should be addressed.
Sustainability 2024, 16(19), 8692; https://doi.org/10.3390/su16198692
Submission received: 23 August 2024 / Revised: 3 October 2024 / Accepted: 6 October 2024 / Published: 9 October 2024

Abstract

:
Most nations fulfilled the commitment to reduce their emissions after the Paris Climate Agreement, and as a result, each nation has produced suitable plans to reach those goals. In this sense, Chile is hardly an exception. The emission multiplier product matrix (eMPM) and labor multiplier product matrix (lMPM), which are associated with the gender differences in the labor market, a state-of-the-art technique that integrates CO2 emissions with multi-region input–output table (MRIO) databases and elasticity to estimate the pollution caused by inter-industrial activity in the nation’s various north, center, and south regions, are used in this article to analyze the emissions of Chilean industries. This approach, by studying the economic territorial consistency (ETC) issue, is expected to establish a connection between each region’s production structure and interregional relationships between gender and the main industries that produce emissions. Indeed, the study aims to determine which regions foster economic development from an equitable perspective through the ETC study. The ETC in Chile depends on some variables, such as labor force, gender and CO2 emissions. The improvement in terms ofion will depend on the use of technology and the proper state regulation in line with the promises gained by Chile following the convening of COP25.

1. Introduction

Climate change has been the main issue of discussion for a long time [1]. As is well known, the production matrix of each country determines the amount of greenhouse gas (GHG) emissions produced, as do growth strategies and the nation’s capacity to recover from crises such as COVID-19 [2,3]. Thus, there is a strong correlation between economic growth and greenhouse gas emissions [4,5]. This deep relationship between country growth and emissions has also been a concern of companies through the Global Reporting Initiative, and authors such as Li [6] have studied how to motivate companies to achieve more sustainable behavior using green technology innovation. This is related to the effort of companies to transition to low-carbon production in Latin American countries [7,8].
The techniques of many economists have been helpful in the analysis of climate change [9,10]. This includes, in more contemporary terms, the development of a carbon credit market [11]. One of the most popular instruments for analyzing greenhouse gas emissions and their effects on the structural transformation of the economy is the input–output matrix proposed by Leontief [12]. This matrix has been used to study the effects of climate change and sustainability on various topics such as waste management in several countries such as China [13], France, and Brazil [14], and it has made a significant contribution to raising society’s sustainability level.
Leontief has highlighted the significance of wages and salaries since his seminal work in 1936 [12]. According to Leontief [15], job losses in agriculture and manufacturing in England will be replaced by new opportunities in rapidly expanding service industries, resulting in a structural shift that will impact final demand.
Leontief [16] has written about the relationship between human labor and the use of machines as a factor of substitution since the 1950s. Leontief and Duchin [17] are also concerned about the increasing loss of jobs due to work automation; this theme has been revisited by several authors, including Rifkin [18], Fleming [19] regarding robotics and artificial intelligence (or AI).
The Leontief matrix has been used in a variety of applications, including multiregional input–output tables (MRIO). MRIO offer important insights on the composition of economies and interregional disaggregation within nations [20], particularly in that they may be used as the basis for a comparative analysis of the economic composition of each area within a country using the Global Trade Analysis Project (GTAP) database [21] available at www.gtap.agecon.purdue.edu, accessed on 13 July 2024.
MRIO has also been used to make the link between climate change and economic development in China [22], aligning these issues with the production of biomass in the France [23] and the applications in terms of public policies based on MRIO in the UK [24].
The multiplier product matrix (MPM) can also be linked to other methodologies for the purpose of analyzing the influences [25], examining the interrelationships and intersectoral feedbacks [26], or comparing the level of economic development based on productive structures [27]. The idea has been illustrated with a set of input and output data; social and demographic accounting matrices, such as those developed by Pyatt and Round [28], can be employed in conjunction with this approach.
One of the advantages of the technique is the content of the information it displays and its structure. The reading of a multiregional matrix will show how a given region distributes and makes use of its own resources (endogenous relationship) and how the same region interacts with the rest of the economic system (exogenous relationship). Over time, there have been advances in the improvement of the technique, thus leading to the MPM matrix [29], whose main advantage is the consideration of a more appropriate weighing of economic activities, as will be discussed below. The use of the technique is so broad that it ranges from a social approach or social accounting matrices [30] to a demographic approach (entry–exit of workers, or people entering the labor market according to origin and destination).
The use of multipliers derived from an input–output matrix has been used for a long time, so they are not free of improvements. In the opinion of the authors, there are two episodes that reflect the main contributions or modifications that exist in them today; one of the first to note that the approach could be improved was Rasmussen [31], where he emphasized that the matrix could be used to additional advantage if the concept of linkages that he proposed was incorporated into the concept of linkages, the scope of the effects (dispersion), and an adequate weighting. He distinguished the type of analysis that can be carried out (on the whole system), and how to review the consequences of having intermediate purchases that are much greater than the final demand, and he discussed the type of analysis that can be carried out (on the totality of the system). In addition, he studied how to review the consequences of having intermediate purchases much larger than the final demand, and he considered the implications of the indirect effects on other industries). In this manner, he proposed to analyze all of this as a whole.
However, it was Hewings [32] who proposed to correct the approach by using the MPM matrix. Hewings and his colleagues proposed to weight the matrix by its own global intensity (sum of all the elements of the well-known Leontief inverse matrix), so that in this proposal the new multipliers can not only be ordered hierarchically but also the impacts of changes in intermediate flows are more easily visualized with respect to the mean; this last feature is important since it now allows attention to be focused on the importance of the relationships that form the sectors whose changes have high consequences either for the sector itself or for the economy as a whole. Guo [33] argued that the use of MPM is key to understanding how changes in the structure of final demand affect the structure of the economy (intermediate purchases and sales).
Subsequently, a series of proposals were born in which, based on the MPM matrix, they were pre-multiplied by different vectors. Employment, CO2, and other vectors were used to observe in greater detail how, for example, a change in final demand has repercussions in terms of production and employment; or, how an increase in production has an impact on the economic system via the consequences of the pollution it generates directly and indirectly; or, how water can be used to make changes in production or energy [34,35,36,37,38].
Regarding the gap that this article covers, or how it differs from other articles that are related to the variables used, the following points should be noted. A search in Google Scholar (input–output analysis, multiplier product matrix (CO2, eMPM, employment, gender, salary, wages, sensitivity, capital payments and labor payments)), separately and as a whole, shows that there are countless articles that have addressed these aspects (268 according to the keywords just identified in conjunction with the exclusion of eMPM, if it is included it drops to 9). The point is that although they do address it, it is also true that no single paper has attempted to address it. Most of them focus on analyzing the employment multiplier, sensitivity analysis, the impact of climate change, the development and evolution of employment by gender and the effect of emissions, among others. As can be seen, the success of this paper lies in the unique way in which everything is combined, even though Soza-Amigo and Doussoulin [38] have recently published an article where they make use of the MPM matrix and the sensitivity analysis as a whole and weigh it by emissions. In this case, they exclude that first part to focus only on global production and then compare it with the MPM matrices weighted by the different vectors (employment by gender and CO2 emissions), to which they add the comparison of what they have called fair and unfair behavior, derived from the payment of profits with respect to wages. The proposed approach, along with what the authors have called economic territorial consistency (ETC) is a novelty, which allows for a debate between different aspects, such as economic and fair trade-offs, given the differences in terms of wealth capture and labor participation.
We define ETC by adapting the definition of Marangos [39,40] as the consistency required across time to produce equity. This guarantees geographical coherence and necessitates that public policy implements consistent employment, gender, and environmental policies over time. To achieve ETC in Chile, the authors aim to determine which regions foster economic development from an equitable perspective. The ETC in Chile is dependent on a few variables, including labor, gender, and CO2 emissions—all of which are covered in more detail below.
This article seeks to answer the following question: Is the ETC the same in all the territories studied? From that main question, we can propose the following secondary question: Does the variation of the ETC depend on the requirements of the productive system in terms of CO2 emissions, employment, gender and distribution of profits?
To investigate these questions, Chile has been divided into four macrozones based on its economic sectors to study the ETC (Figure 1). The zones are physically isolated from each other. This generates emissions from both land and air transport and makes trade between the areas difficult.
Through an analysis of the added value, elasticity, and MPM of CO2 emissions and jobs, this study aims to describe ETC from a gender viewpoint. These aims can be analyzed by characterizing the terrain through a holistic approach in five dimensions that we suggest in Figure 2.
In the economic performance, Soza-Amigo and Ramos [41] argue that low-elasticity activities can promote economic development using input–output analysis. This performance can also be studied by comparing the economic activities of an economy in terms of added value, and by comparing the payment for the contribution or payment for which the company capital payment (CP) versus the labor payment (LP).
Researchers can examine environmental performance in addition to economic performance. Therefore, the pollution activity measure can be quantified through an appropriate weighting in the production system, such as using the pollution-weighted (eMPM) [42].
It is important to demonstrate whether the generation or multiplier effects of employment are the same for women (wMPM) and men (mMPM), that is, whether there is no discrimination or employment repercussions. This can be quantified similarly to the eMPM, using the MPM matrix weighted by total labor (lMPM).
As mentioned above, ETC is also linked to gender and considering the natural disposition of women to care for the environment. This issue has been widely studied through ecofeminism [43], a theoretical and cultural construct and a school of thought close to eco-Marxism that emerged in the 1960s [44].
Authors like Gaard [45] have criticized ecofeminism by considering women as a single and separate component of the ecosystem. Other authors mention that the characteristics and definitions of ecofeminism are profound and depend on race and socioeconomic level [46]. Our paper, being in a country area where the role of women is fundamental, considers these precepts proposed by ecofeminism.
In the gender-wise issue, salaries would indicate a wage men/wage women ≈ 1 relationship, meaning that there will not be any salary discrimination (men’s and women’s earnings must go toward unity).
This work is significant because it is the first to use the eMPM and lMPM to assess how the economy of a developing nation like Chile is structurally evolving in relation to emissions and gender. This allows the change in ETC to be studied and justified.
The article is structured as follows: Section 2 presents the data and methodology of the study. Section 3 discusses the main results of the study. Section 4 concludes by outlining the limitations and potential research directions.

2. Methodology and Data

The Leontief methodological proposal, which is based on multiregional input–output models and is summarized in Figure 3, will be given in the following manner.
Schaffer [47] used traditional input–output analytic tools to combine data on working hours by industry, gender, and educational attainment for employees and conclude that men labor far longer hours for pay than women do.
Kucera [48] used social accounting matrices (SAM) in a Leontief multiplier model, where changes in exports from South Africa and India to the US and the EU represent changes in demand, to examine the effects of economic contraction during the recession on employment by gender in those countries. Indeed, in order to examine gender in the energy input–output analysis, Valiollahi Bisheh [49] examined the energy indicators in paddy production in farms managed by women and farms headed by men. One could argue that the gender issue had a major impact on the amount of direct, indirect, and renewable energy inputs.

2.1. Data

The study has used three sources for the data referred to in 2014: first, the internal revenue system (IRS) or SII in Chile, which provides weighted data on salaries based on time worked and gender as well as total employment (male and female, the last two weighted by days worked). This constitutes a relevant aspect of using this source of information. However, the database has the disadvantage that it is not weighted by the type of activity carried out. Therefore, for example, management positions are not differentiated from administrative or lower-ranking positions. Second, data from the FIGARO source, which Eurostat database generated, were used. Here, the CO2 emission vector for each sector of the Chilean economy was derived from final demand using location coefficients [50,51]. Many OECD countries [52,53] as well as other countries including Spain [54] and several Latin American countries [55], have also used this same approach to study the trend, but from the perspective of domestic final demand (DFD) [56]. Pottier and Le Treut [57] used the Multi-Regional Environmentally Extended Input–Output Database, or EXIOBASE (Multi-Regional Input-Output Database), which can be accessed at https://www.exiobase.eu accessed on 13 July 2024. For instance, this database made it possible to ascertain the downstream carbon intensity of the main inputs for 35 French sectors, finding that women contribute less to the emissions of greenhouse gases (GHGs) than males do, despite what would appear to be their income share.
Consequently, CO2 emissions in Chile are first weighted according to each sector, and based on these findings, the procedure is repeated for the various areas of the nation. It is noteworthy that Soza-Amigo [58] contended that Chile and Turkey display distinct production functions and structures equivalent to those of economies like Australia, New Zealand, Austria, Finland, France, and Greece; consequently. We think the application of such pondering is appropriate, given that the process has also been employed in other works, including Napleda [59] and Naspleda [60] in which the production function varies with increasing technology. Thirdly, Haddad [61]’s MRIO, dated 2014, is employed for Chile.
MRIO matrix is the only one of its kind that exists for Chile currently: The matrix consists of 15 regions and 12 sectors (s) presented in Figure 4. This, when combined, yields 180 data points in total (12 × 5 = 180).
The previously mentioned MRIO matrix will obtain the following results. The first is the connection between labor payment (LP) and capital payment (CP). The second is the most sensitive activities that support the nation’s economic development, as determined by applying Schintke and Stäglin [62] methodology. An intensity-weighted matrix (MPM) comes in third.
The matrix that was discussed in point three is then pre-weighted by the following: first, the pollution coefficient, which is used to calculate the “eMPM”. This matrix will assist us in determining which economic activity and which region have more effects on the multiplicator of CO2 emissions. Second, we may add the gender issue that we previously discussed by using the employment coefficient, which enables us to generate multipliers of the influence of work “lMPM”. In this way, the multipliers of total, female, and male employment will be obtained depending on your participation.

2.2. Methodology

The study applies an expression for elasticity (sensitivity) that Schintke and Stäglin [62] created, which we shall discuss later, to assess an activity’s significance for the production system. As a result, we separate the effects of a shift in output that are solely economic. Our goal in this study is to analyze which activity provides the most sensitive production stages in the economic system, rather than figuring out the productive framework in terms of the domains of influence that can be generated from these sensitivities. As such, we have little interest in exploring the effects or connections that arise within the economic system.
Let us look at an initial situation in which the output of an economy is represented by the equation:
x = ( I A ) 1 y = Ω y
A = [aij]; with aij = xij/xj; y, the final demand; and (IA)−1, the well-known inverse Leontief matrix (Ω = [ωij]), formed from the matrix A of technical coefficients, where x represents the total output. It follows from expression (1) that this information can be utilized to evaluate an activity’s sensitivity. Starting from Equation (1) and after making some adjustments, Schintke and Stäglin [62] presented Equation (2), which allows us to identify which activity is most sensitive based on a change to be defined (value of p):
r i j ( p ) = p a i j ω j i p + 100 ω i i X j x i
where rij(p) represents the percentage change limited to the fixed percentage of production “p”.
A value of p = 1% is established as a criterion to determine the degree of sensitivity (it is established at a 1% change in the production of the activity investigated), and the resulting sectoral elasticities are less than or equal to 15 (rij ≤ 15). To determine the potential relationship between a sector and another activity (referred to as sensitivity), a minimum of 15% change in the relationship is required for every 1% change in the sector’s production. As an outcome, we can determine the number of sensitivities that each activity provided using Equation (2). Greater impact over the change that can be made to the producing system is assumed when the response value is lower. In other words, rij will exhibit high sensitivity if its value is low (less than or equal to 15). This means that there is a greater chance of attaining the suggested change in production because there are fewer modifications needed, which makes it easier to raise output and create a productive system. Therefore rij will exhibit high sensitivity if its value is low (less than or equal to 15); in this case, there is a greater chance of accomplishing the suggested production modification because there are fewer changes needed, which makes it easier to boost output and create a productive system. In contrast, if rij has a value larger than 15, it will suggest that numerous adjustments are needed between activities “i” and “j” in order to achieve a 1% increase in production in that particular activity. As a result, there will be little evidence of productive interaction, which is consistent with the findings of Hewings [32,63] and Soza-Amigo [64].
We point out that, regarding the predetermined conditions (p = 1 and rij = 15), no methodology has been found to help determine which, how, and to what extent the stages of the various production processes can be changed to achieve the predetermined production, or what change can be accepted at most. Thus, scholars [58,65,66,67,68,69,70,71] have restricted themselves to defining this requirement in accordance with the field of study.
The MPM, a derived extension of the row and column multipliers of the Leontief inverse, has been introduced in the paper of Sonis and Hewings [29]. We may observe the strength of flow between sectors and the current interrelationships within an economy with the help of this matrix. This can be interpreted as an adjustment to the weighting and dispersion issues with the data that are kept in an input–output matrix.
M P M Ω = 1 V Ω Ω i . Ω . j = 1 V Ω ω 1 . ω n . ω 1 . ω n . ;             M P M Ω . = ω i j
where V Ω represents the global intensity of matrix Ω , defined a V Ω = i = 1 n j = 1 n ω i j .
As the total of all the elements of the inverse Leontief matrix representing the total impact, the MPMΩ will demonstrate the global intensity. Indeed, we consider direct, indirect, and induced impacts
The notion of eMPM, as proposed by Ali [42], combines the MPM matrix with the CO2 emission, denoted by (e). Information about how emissions affect the economy is available in the new matrix.
e M P M B = 1 V B B i . B . j = 1 V B b 1 . b n . b . 1 b . n ;           e M P M B = m i j
where VB. is the global intensity of matrix B, defined as V B = i = 1 n j = 1 n b i j ; y, B = e ^ L , with B = [bij]. e ^ , corresponds to the diagonalized vector of CO2 pollution, related to the production ( e ^ = e i /   x i ) .
The total of all the matrix elements that represent the overall impacts is the global intensity of CO2 emissions.
Using the same prior criteria, we can now incorporate the gender perspective into our methodology and generate the lMPM relationships, wMPM and mMPM, for total employment (l), women (w), and men (m). Thus, the well-known multipliers weighted by the intensity of the MRIO14 matrix will be produced from these final four expressions.
Once the desired data and outcomes (elasticities and different multipliers) are obtained, these results are normalized, and we then move on to a global study to see how these relationships behave in the Chilean economy. After determining the reference pattern’s behavior, the same analysis is carried out using the study areas that will be mentioned in the background section.
In terms of graphical visualization of the results that will be shown later, the Hj-Biplot technique was applied to investigate the reference pattern [72]. Vicente Villardón’s [73] program was utilized for visualization to provide the highest possible quality in the display of data in the data matrix’s rows and columns. The approach that was thought to be best suitable for this activity is the matrix decomposition by singular values method. Considering that the variables we have taken into consideration have an impact on the economy, the representation was produced on three axes once the approach was formed.
Utilizing the Hj-Biplot multivariate data graphic tool has the benefit of making it simpler to determine the information that an independent variable adds to the set as a first assignment. The variable will have a wider line to indicate it if it is more intensive or gives a lot of information. Additionally, this vector can be displayed wider if you are searching for a more visually pleasing representation or visualization. However, it is important to remember that if two variables form an angle that is nearly or exactly equal to 90 degrees, it is assumed that there is no relationship between them (cos90 = 0); on the other hand, if the angle is nearly or exactly equal to 180 degrees, it will show that there is an inverse relationship between them. A high and positive correlation between the variables is shown if the angle between them is near zero.
The purpose of the axes is to identify potential links, not to anticipate an individual’s values, which is not what was intended in this instance. Regarding the lack of scale in the graphs, it is common to omit the scales when there are many variables because doing so makes it harder to interpret the Biplot. This tool makes it easier to complete the initial exercise or the overall analysis of the data.

3. Results

It is necessary to emphasize that each region is different. These differences must be considered in ETC analysis. Figure A1 of Appendix A.1 presents the ideal results that can be compared with the actual results that are presented in this section.
The variables utilized in Table 1 will be presented first, followed by the findings. The following represents a summary of the variables’ attributes.
As the introduction to the work stated, we utilized graphs of the Hj-Biplot type to analyze what we have named ETC. Figure 4 then demonstrates the relationship that exists in Chile between the creation of jobs, CO2 emissions, and the sensitivity of economic activity. This enables us to research the economic sectors that may assist the nation’s producing activities to rise. The hiring of individuals of different genders and CO2 emissions are strongly positively correlated, which brings us to our topic.
In addition, Figure 5 illustrates a nearly inverse connection between the activity’s profitability and three factors: the salaries paid for them, the economy’s sensitivity, and the activity’s CO2 emissions. Consequently, the actions that have the biggest effects on CO2 that encourage economic activity and have the potential to produce riches and higher compensation for the work considered. This is displayed in Figure 4 in the opposite direction of the vectors. Another way to read this would be as a desire to create a venture that promotes economic development (S&S). Pollution and the negative externalities produced by the polluting activity (eMPM) would have an impact on this development, even though it offers high compensation for performing the same activity (CPvs.LP). Regardless of the implied job creation (lMPM), this is the case. The tables with the results of the Biplot analysis (principal components analysis) using Singular Value Decomposition are in Appendix A.2.
“Social determinants” are relevant to pollution and climate change concerns, as Coskuner [74,75] point out. This has much to do with the amount that men make in comparison to what women make. It is connected to the creation of jobs and increased CO2 emissions (eMPM) through sensitive activities (S&S). These reflect the salary ratio (S-MvsW) between men and women. The above has a greater relationship with pollutants (eMPM) and sensitive activities (S&S) than with jobs (lMPM). The magnitude of the wage ratio (S-MvsW) is linked to a relevant representation in Figure 5. This is considering the size of the information it presents. The link between salary (S-MvsW) and payment for activity (CPvsLP) is opposite to each other. Consequently, the probability of high utility relative to salary payment runs counter to the idea that one should earn more money for doing a job.
We continue the investigation of equivalent labor market results, but now with respect to gender. This would show that there is no discrimination at work. It would also be intriguing to discover that the connection (S_(MvsW)) between men’s and women’s salaries is almost equal (S_(MvsW) ≈ 1). This would suggest that there is no discrimination based on salary. Nevertheless, these activities—particularly s02—show low pay and the development of jobs; also, it is the activity that, on average, demonstrates the most wage discrimination in this region. Across the entire country, this is the most discriminatory sector.
In terms of environmental performance, these are the industries that are most affected by CO2 emissions (s04): electricity, gas, water, and waste management. These effects are associated with the mining industry, which has high energy and water requirements. However, it is noted that the multiplier effect of female employment relative to the average is higher than that of male employment, except for the following sectors: financial intermediation (s08); real estate and housing services (s09); personal services (s11); public administration (s12); and commerce, lodging, and restaurants (s06).
As we can see from the list of their incomes, however, there is salary discrimination because none of them are above the norm. Even though the activity encourages employment, wage discrimination is obviously present. The industries that most closely resemble the conditions listed in Appendix A.1 are probably the manufacturing industry sector (s03), trade, lodging, and dining (s06), especially the last one, which stimulates the economy, creates a fairly equitable distribution, pollutes less than average, has a high multiplier effect on female employment, and exhibits low wage discrimination.
From a gender perspective, it is noted that the following activities—mining (s02), manufacturing industry (s03), construction (s05), trading, lodging, and eating (s06), transportation, communications, and information services (s07)—are more sensitive than usual. When it comes to their salary and gender, these activities have minimal effects on employment. Compared to the national average, wage discrimination is more prevalent in sectors 02, 05, and 07, particularly in the mining industry. Regarding payment for the activity (CPvsPL), emissions (eMPM), and gender, the most polluting sectors (agricultural, forestry, and fishing; s01), as well as the activities with the biggest payment differences, are involved with manufacturing (s03). It is evident that the effects on employment are not very substantial, and that women’s engagement has somewhat more repercussions than men’s. Agriculture, forestry, and fishing (s01) as well as energy, gas, water, and waste management (s04), are the industries having the biggest effects on CO2 emissions nationally. These activities also have the lowest labor impacts. That being the case, women have a bigger effect than males do, even in cases where the multiplier effect is minimal.
Concerning the results that were acquired for the regions examined in Figure 6 and Table A1 in the Appendix A, the most sensitive activities in terms of average generated have minimal effects on CO2 emission (mining, s02): construction, s05; trade, lodging, and dining, s06; and transportation, communications, and information services, s07) in the Norte Grande (Figure 6). However, the wages and employment creation from these operations, particularly in s02, are poor. Sector s02 is the most discriminatory sector throughout the entire country and exhibits the highest level of wage discrimination in this area.
Sector s04 (energy, gas, water, and waste management) is the one with the greatest impact on CO2 emissions. The resulting situation is because of the connection with the mining industry, which has high energy and water requirements. However, it is noted that the multiplier effect of female employment relative to the average is higher than that of male employment, except for the sectors of trade, lodging, and dining (s06); financial intermediation (s08); real estate and housing services (s09); personal services (s11); and public administration (s12). On the other hand, their wages are all below average when we look at the list. This suggests that there is discrimination in wages. There is obvious wage discrimination in the activity even as it encourages employment. The manufacturing industry sector (s03), together with trade, lodging, and dining (s06), are possibly the ones that come closest to meeting the requirement requested and listed in the Appendix A. Particularly, the final one appears to be the one that stimulates the economy. This industry has little wage discrimination, produces a fairly equitable distribution, pollutes less than average, and has a high multiplier effect on female employment.
Gender-wise, this sector—mining (s02), manufacturing industry (s03), construction (s05), trade, lodging, and dining (s06), transportation, communications, and information services (s07)—has the most sensitive activities compared to the average. Regardless of gender type, these activities have minimal effects on employment. In terms of pay, we observe that there is a significant disparity between salaries in sectors 02, 05, and 07 and the national average, particularly in the mining industry. Regarding the connection between gender, emissions (eMPM), and compensation for payment for the activity (CPvsPL), employment is not significantly affected by industries with higher payment disparities and greater pollution, such as forestry, fishing, and agriculture (s01), and eventually the industrial sector (S03). The participation rate for women is somewhat greater than for males. If we focus our comparison on the industries that have the biggest effects on CO2 emissions relative to the national average (fishing, forestry, and agriculture (s01) as well as gas, electricity, water, and waste management (s04)), we find that these activities have little impact on labor, even in cases where women’s contributions outweigh men’s, even at low multiplier effects.
The situation in the Norte Chico (Figure 7) is comparable to that in the Norte Grande (Figure 6), although there are certain areas that are slightly different, such as the manufacturing industry (s03) and trade, accommodation, and dining (s06). In the first place, there is no indication that this is a highly sensitive industry as in Norte Grande, and interestingly, their levels of pollution are almost identical. However, Norte Chico has a higher employment generation than average, even though this does not shield her from wage discrimination. Except for the quantity of the most sensitive activities, which is more in Norte Grande than it is in Norte Chico, they are essentially the same in sector s06.
Although the amount of mining activity varies, both areas exhibit comparable patterns. Regarding the pattern that is being sought and described in the Appendix A, with respect to Norte Chico, it is partially identified in the construction industry (s05), It is characterized by high sensitivity, near-unity reward for activity, minimal impact on CO2 emissions, low but near-unity impacts on employment, but regrettably it marked by considerable wage discrimination.
Revisiting the analysis with a gendered viewpoint, we note that, when compared to the average, none of the most sensitive activities (s02, s05, s06, and s07) have a significant impact on labor terms (lMPM). They proceed in different directions; aside from this, only activity s06 (trade, lodging, and dining) exhibits a strong influence of women on labor (wMPM), but it is also one of the most unjust and discriminatory in terms of salaries (S(mvsW)). In terms of the CPvsPL relationship and emissions (eMPM), the construction industry (s05) is noteworthy because it exhibits compensation greater than unity, very low emissions impacts, and minimal labor-related consequences (lMPM). This indicates that the impacts on women versus men are similar and low.
Sectors s01 & s04 (agricultural, forestry, and fisheries & power, gas, water, and waste management) are highlighted as having the highest levels of pollution (eMPM). One of the most polluting industries in the nation and in every region is this last one. This sector’s influence on the connection between employment and emissions is average (lMPM = 1.05), with women having a higher impact (wMPM = 1.35) than males (mMPM = 0.96). Regarding sector s04, despite being the most polluting, it is also one of the least affected in this area when compared to the national average (lMPM; wMPM& mMPM). A certain common impact is observed, and even a salary payment is close to the average, which leaves it positioned as one of the fairest, maintaining the proportions despite the existence of discrimination (s(MvsW) = 0.95), and displaying ideals with labor inequalities and under one unit for the benefit of women). Interestingly, it has one of the fairest compensation structures (S(MvsW) = 0.99), meaning that men and women in that industry essentially make the same amount.
The manufacturing industry (s03) and the construction sector (s05) are particularly noteworthy in the Central Zone (Figure 8). Out of all of them, only the first exhibits close to unity CPvsPL ratios and strong sensitivities, with an eMPM of 0.81, which is lower than the norm. In addition, there are not many labor-related consequences; on average, women have more power than men, and the salary ratio is marginally above unity (S(MvsW) = 1.15). In contrast, the construction industry (s05) has a respectable wage (CPvsPL = 1.26) despite not being among the most sensitive. This industry has labor generation or consequences that are somewhat higher than average (lMPM = 1.12) and is among the least polluting (eMPM = 0.25). There are variations in this industry regarding labor impact (wMPM versus mMPM) where (S(MvsW) = 2.05) is among the biggest salary discrimination.
According to the gender approach, the manufacturing industry (s03), energy, gas, water, and waste management (s04), and transportation, communications, and information services (s07) were found to have the highest levels of sensitivity. None of these activities have an average impact on labor or similarly significant effects on either gender. Sectors s03 and s04 are discriminators in terms of discrimination, but despite this, their values (s03 = 1.15 and s04 = 1.12) are rather close to unity.
In relation to gender, emissions (eMPM), and payment (CPvsPL), the findings indicate that only the manufacturing industry (s03) and construction (s05) sectors have payments that are almost equal and produce little pollution. The findings demonstrate an influence on labor that is higher than average (lMPM = 1.12) and comparable impacts that are almost equal for both genders (wMPM = 0.80 & mMPM = 1.22). This is one of the highest levels of sectoral wage discrimination (S(MvsW) = 2.05). The industries that pollute the most in terms of emissions (eMPM) include waste management (s04), power, gas, water, and forestry and fishery (s01). The intriguing aspect of this situation is that women’s (wMPM) labor-related consequences are nearly twice as great as men’s (mMPM) due to the s01 sector. In addition, women would earn more than males would on average (S(MvsW) = 0.84), indicating that there is inverse discrimination up to the extent that these numbers demonstrate it—that is, a favorable salary anomaly for the feminine gender.
In the region known as Patagonia in the south of the nation (Figure 9), mining activity (s02) is the only one with a high presence in the indicators. It also demonstrates the following: first, mining exists in this region; generally speaking, except for the southernmost area, mining in this area is associated more with aggregates than with the extraction that takes place in the nation’s north in the area that is traditionally mined for copper. As a result, its effects on sensitivity, expense, and pollution are negligible. Thus, it primarily affects other issues like employment. The issue is that it additionally illustrates discrimination against high wages. As is evident in Patagonia, the region is excluded from the country’s economic growth dynamics due to the lack of pertinent activity when compared to the national average.
According to the gender perspective, compared to the national average, there are more sensitive activities in the manufacturing industry (s03), transportation, communications, and information services (s07), and agriculture, forestry, and fishing sectors (s01). Only the first of these activities—albeit both fall within the unit—has any labor impact (lMPM = 0.75) and affects women more than men. Salary discrimination against women is a problem that is unique to this industry in this region.
Especially the construction industry (s05) shows a payment near to unity (1.26) and little pollution (0.26) in terms of compensation (CPvsPL) and emissions (eMPM). Nonetheless, this industry has low labor dynamics (lMPM = 0.75), low impact from women (wMPM = 0.60), low impact from men (mMPM = 0.80), and strong wage discrimination (S (MvsW) = 2.00). The sectors of power, gas, water, and waste management (s04) and agriculture, forestry, and fisheries (s01) were found to have high emissions (eMPM) in comparison to the national average. The first economic sector (S(MvsW = 1.19)) has pay discrimination and minimal labor consequences. Though to a higher degree, the second sector exhibits comparable characteristics.

4. Conclusions

As a result of numerous climate change meetings, the Intergovernmental Panel on Climate Change (IPCC) has underlined the necessity of centering analysis around carbon emissions. This encourages every nation to modify its medium and long-term plans to fulfill its obligations to reduce emissions, including the Paris Agreement.
Chile is not unique in this regard. To improve the sustainability and climate change indicators of the territories throughout time, this research uses the product matrix to investigate carbon emissions in terms of the economy and related concerns like gender and employment generation.
This was accomplished using a cutting-edge method that incorporates CO2 emissions: the emissions multiplier (eMPM) and the work multiplier product matrix (lMPM) related to gender disparities in the labor market. Taking into consideration the economic structure and productive vocation of each region, we have worked with the data available for Chile from the multiregional input–output (MRIO) and elasticity tables to estimate the pollution caused by inter-industrial activity in the different regions of the country, where different results have been found.
Through the study of the topic of economic territorial consistency (ETC), a connection was made between the economic structure of each region and the interregional relationships between gender and the primary industries that produce carbon emissions in some regions that were stronger and in others weaker. It was discovered that improvements in terms of reducing emissions will depend on the application of technology and appropriate state regulation in accordance with the agreements Chile obtained following the COP25 conventions that it hosted.
Like any data-driven study, our research is restricted the analysis to Chilean data. We might be able to examine the outcomes in greater detail if there were additional territorially-level disaggregated data available.
Considering that there are activities that raise understanding in the economy and that pollute less than a typical basis but, at the same time, contribute little in terms of employment and even present some form of labor or salary discrimination, one of the questions the study poses is what mechanisms or proposals can contribute to improving what has been defined as ETC. Others, however, pollute more yet have less of an impact on most of the topics covered here.
The findings, which are summed up in Table A1 in the Appendix A, prompt us to question whether social commitment—defined as fair compensation, the absence of discrimination in employment and compensation, and even minimal pollution—is preferable to the decision of whether to support sensitive and polluting activities. The latter are individuals who, in theory, act as intermediaries between different intersectoral dynamics. We think the solution is complex and depends on the issues that public policy and territorial planners aim to address. In this last sense, it is noted that, regarding Chile, each of the four macro-territories under study presents unique features that are either in support of or contrary to some of the variables addressed. Given that, creating a national policy that is also focused on the regions or macro-territories is challenging.
Several implications for management or recommendations that may arise from this proposal that we have called ETC should be considered. It is interesting to comment that Chile has been one of the countries that has stood out the most for generating egalitarian conditions and policies referred to equitable participation from a gender perspective from different angles [76]. On the other hand, there are some antecedents that have emerged in light of the results that we consider necessary to add to the above. First, the document has shown that there are certain differentiated economic behaviors in the different regions; for example, the productive sensitivity of the mining sector (s02) that is desirable from the economic perspective and that is present in both Norte Grande and Norte Chico is very different and undesirable from that observed in the Central Zone and Patagonia, which is understood to originate from the presence of mining resources. Second, the same sector shows much better multiplicative effects and wage parity in the latter zones, which makes it difficult to propose or apply a national and integrated development policy; therefore, the ETC approach should be approached from different perspectives.
The above makes it clear that national development policies should not be treated in a global way but rather in a localized way. In this sense, we propose that local authorities should be the ones to set the policies that contribute to a development consistent with what we have defined as ETC. First, we propose a territory-based approach and, second, an approach based on what is sought by the ETC.
Given the above, a policy to implement in sectors that are marked by wage equity and labor participation, along with similar multiplicative effects and few impacts via pollution, should be supported via worktables that allow two things. First, there should be an adjustment of the returns (0.8 ≤ CpvsPL ≤ 1.2), perhaps with the participation of workers in the ownership of the company, thus making the distribution of profits more equitable. Second, there should be research into and implementation of new technologies that facilitate a high sensitivity between activities. On the other hand, the above can be accomplished in reverse, once the sensitive sectors are detected. The management of a distribution of profits must be supported, as mentioned above, and then mechanisms to reduce the effects caused by pollution must be generated, along with the provision of spaces and state aid such as training, so that both women and men can participate in the labor market in an equitable manner.
In terms of implications for private company management, Wittneben [77] mentions that considering climate change is economically profitable, as increasingly financial institutions and credit risk assessment institutions must consider climate risks. Rating agencies and investment funds are looking for answers from companies on their solutions to mitigate climate change or take on more sustainable standards such as those proposed by the Global Reporting Initiative (GRI) or bioeconomy [78]. If these climate or sustainability standards are not met, and as global economic losses due to natural catastrophes accumulate, climate change-related risks and opportunities are increasingly considered in economic assessment. This has direct implications for the financing of business investments in key areas such as lithium mining, fruit farming, and the salmon industry in Chile [79].
Research in the future should compare how different public policies, like a tax akin to the Pigouvian tax, affect emissions. That research should consider how the IPCC’s suggested scenarios for climate mitigation could be the second course of action, by examining the effects of various climate mitigation scenarios on emissions, labor, and gender-specific employment using eMPM and lMPM and sensibility.

Author Contributions

Conceptualization, S.S.-A. and J.P.D.; methodology, S.S.-A.; software, S.S.-A.; formal analysis, S.S.-A.; data curation, S.S.-A.; writing—original draft preparation, S.S.-A. and J.P.D.; writing—review and editing, J.P.D.; visualization, S.S.-A.; funding acquisition, S.S.-A. All authors have read and agreed to the published version of the manuscript.

Funding

National Research and Development Agency of Chile (ANID) provided the funds to assist us in conducting this study: Fondecyt-Regular project “Factores Territoriales de Localización y Especializaión como Motores del Desarrollo” (project number 1221173).

Informed Consent Statement

Not applicable.

Data Availability Statement

The data is available and the links to access it are mentioned in the article.

Acknowledgments

We appreciate the following funds the National Research and Development Agency of Chile (ANID) sent to help us carry out this study: Fondecyt- Regular project “Factores Territoriales de Localización y Especialización como Motores del Desarrollo” (projet number 1221173) and Fondecyt- Iniciación Project “Institutional and individual factors to promote responsible behavior in Chile’s household waste governance” (projet number 11240954). The authors also acknowledge Jacqueline Aldridge of Universidad de Magallanes for her assistance with permitting us to visualize our results.

Conflicts of Interest

The authors declare no conflict of interest.

Appendix A

Appendix A.1. Ideal Results Compared with the Actual Results Presented in This Section 3
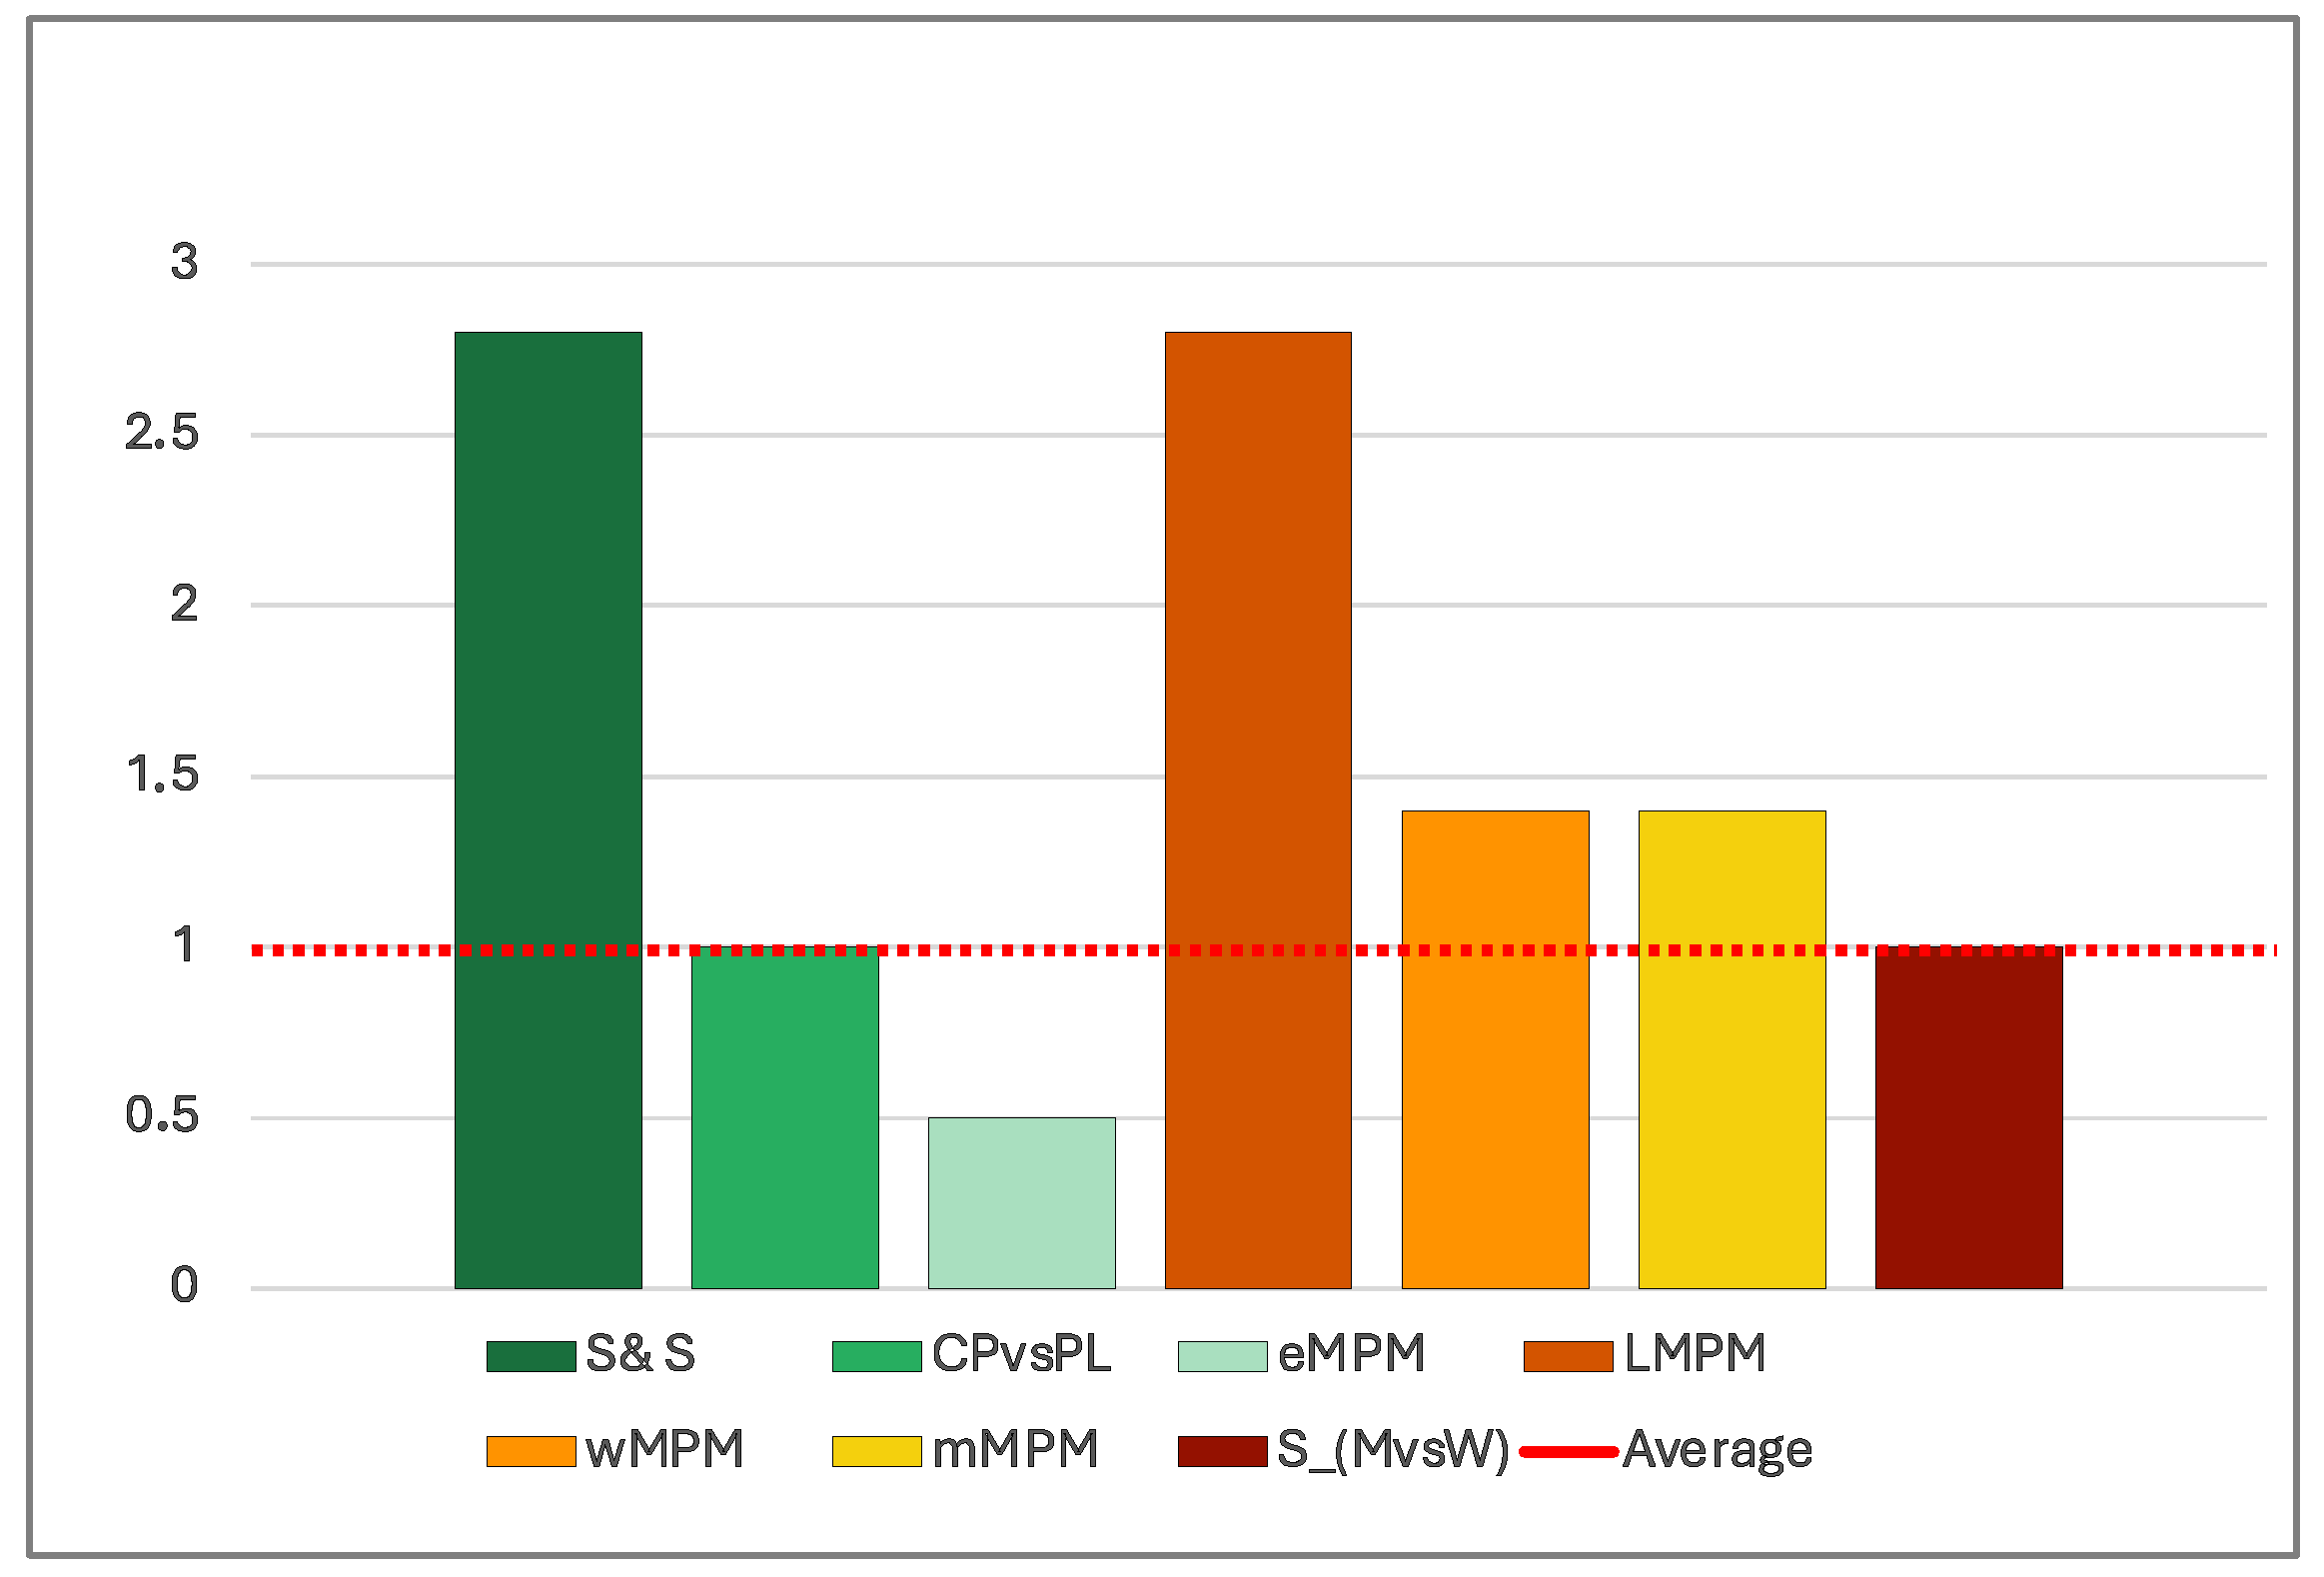
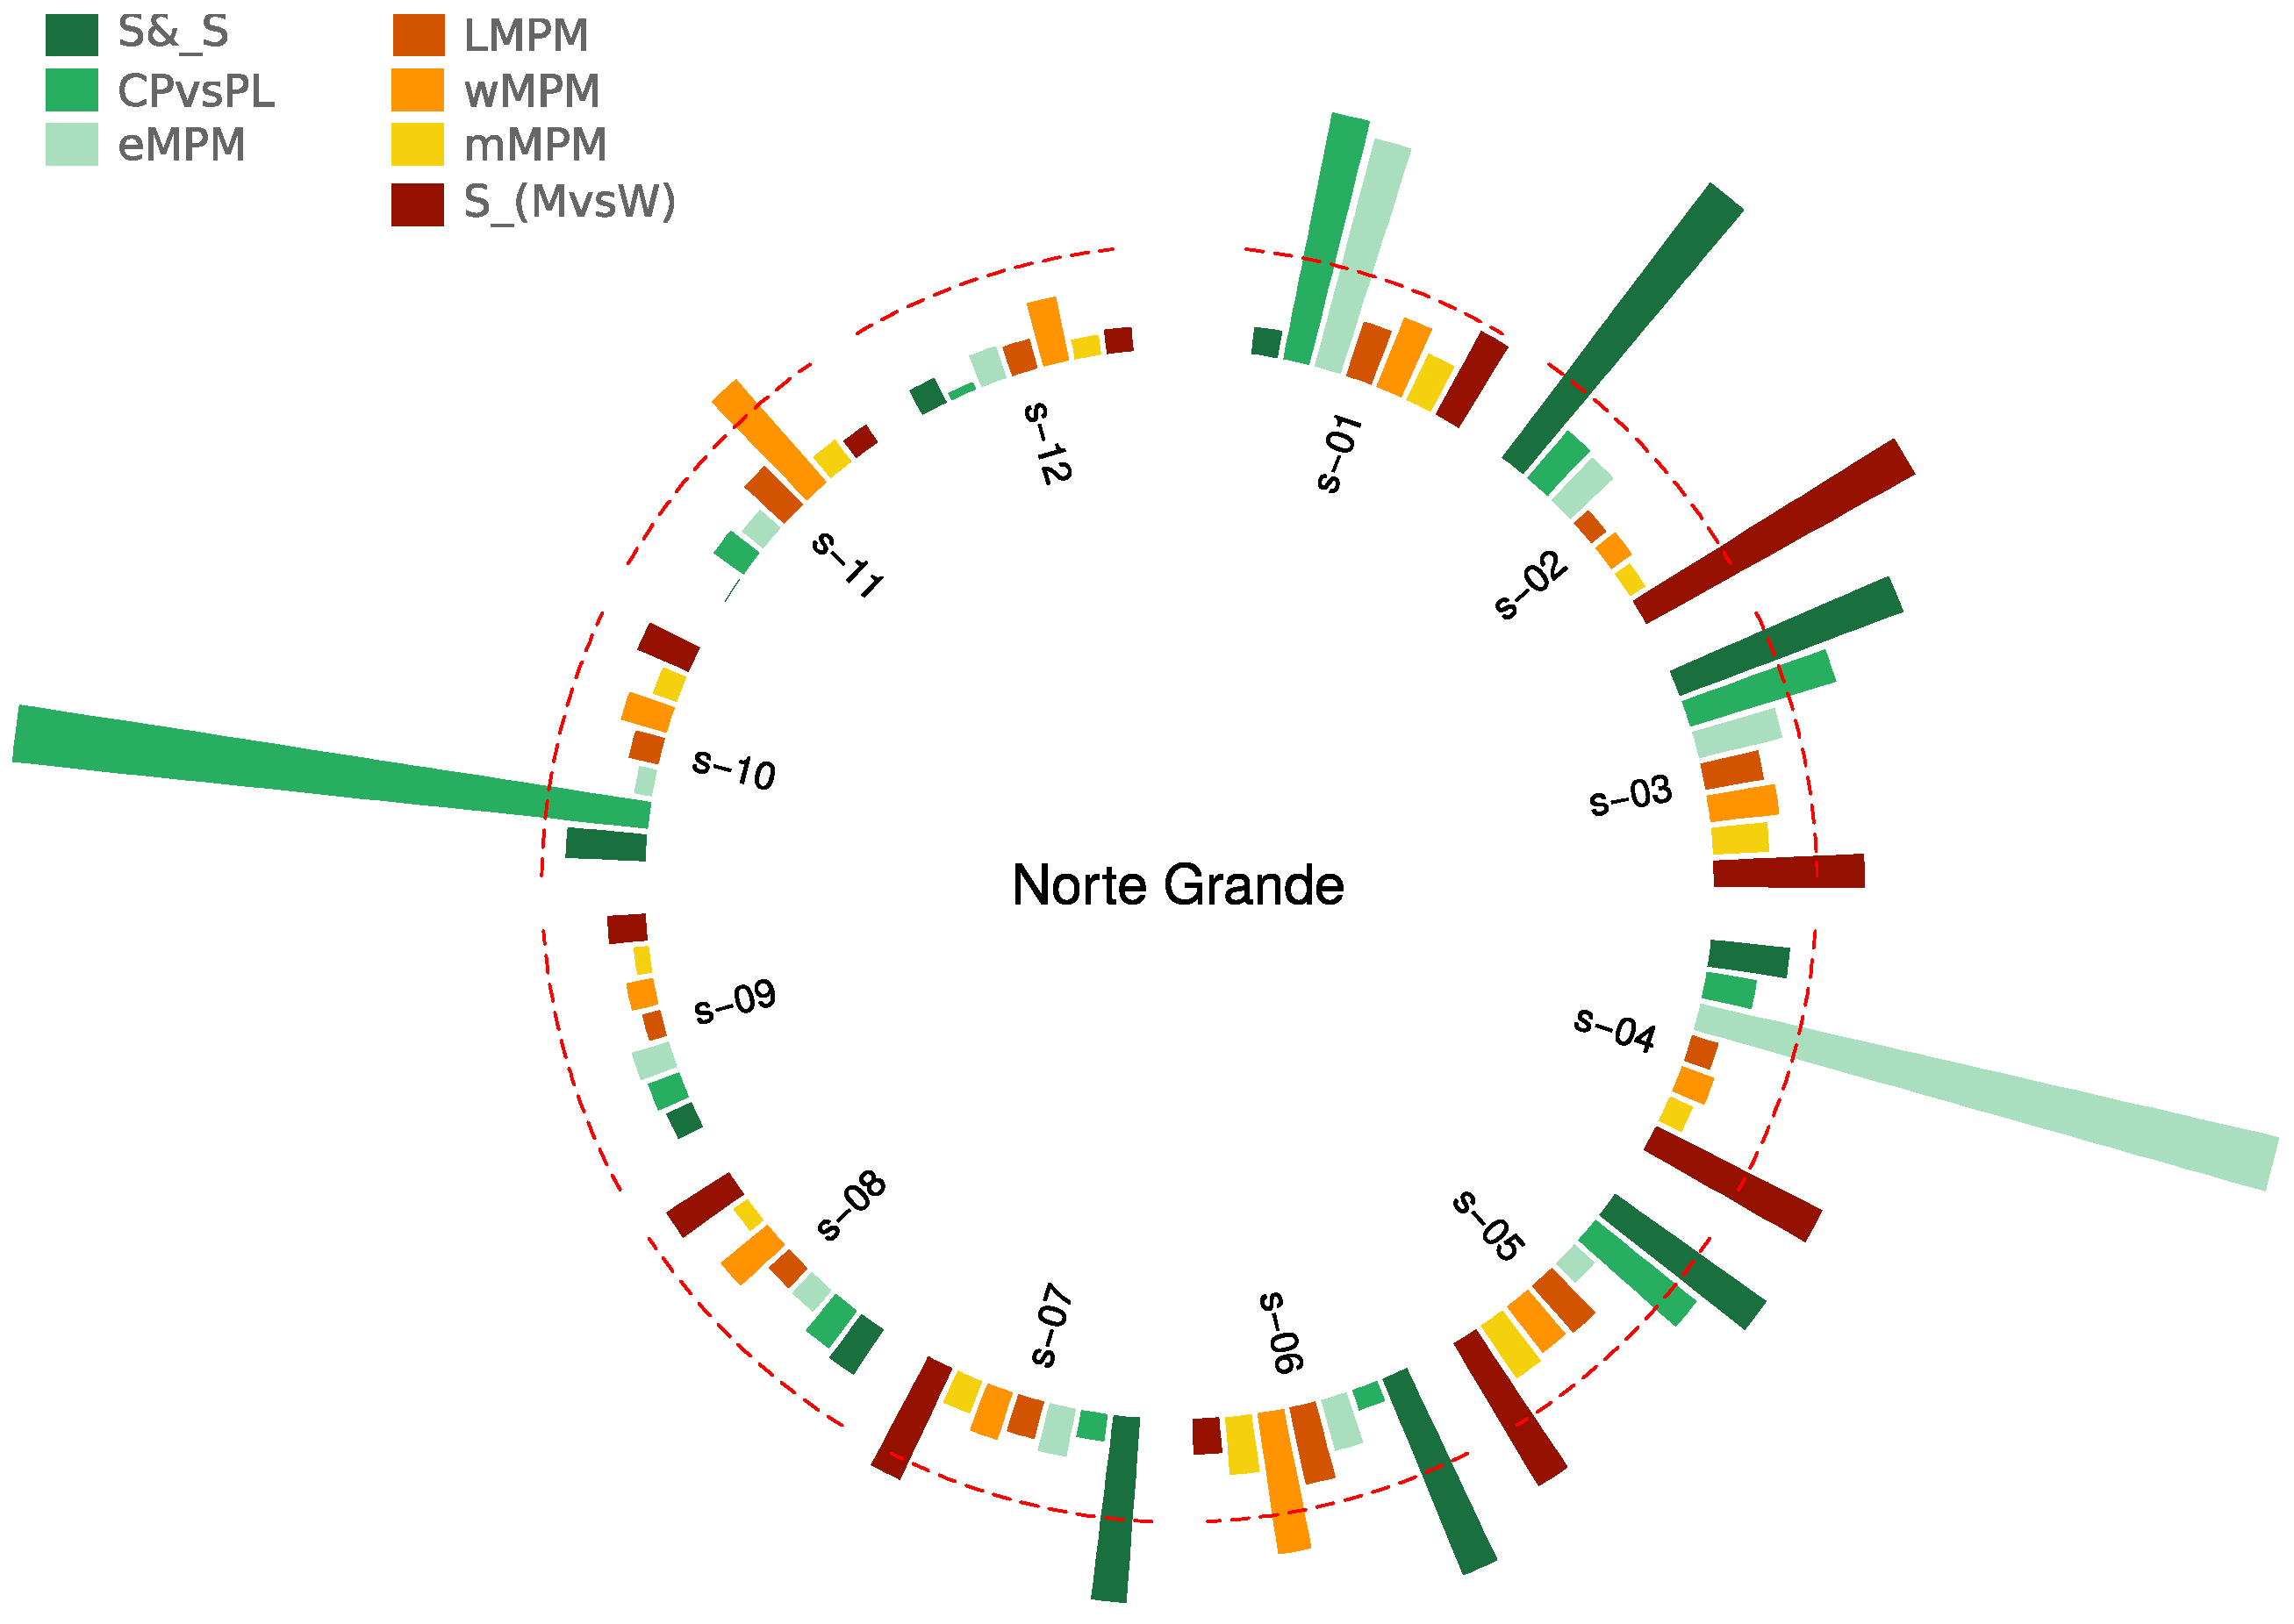
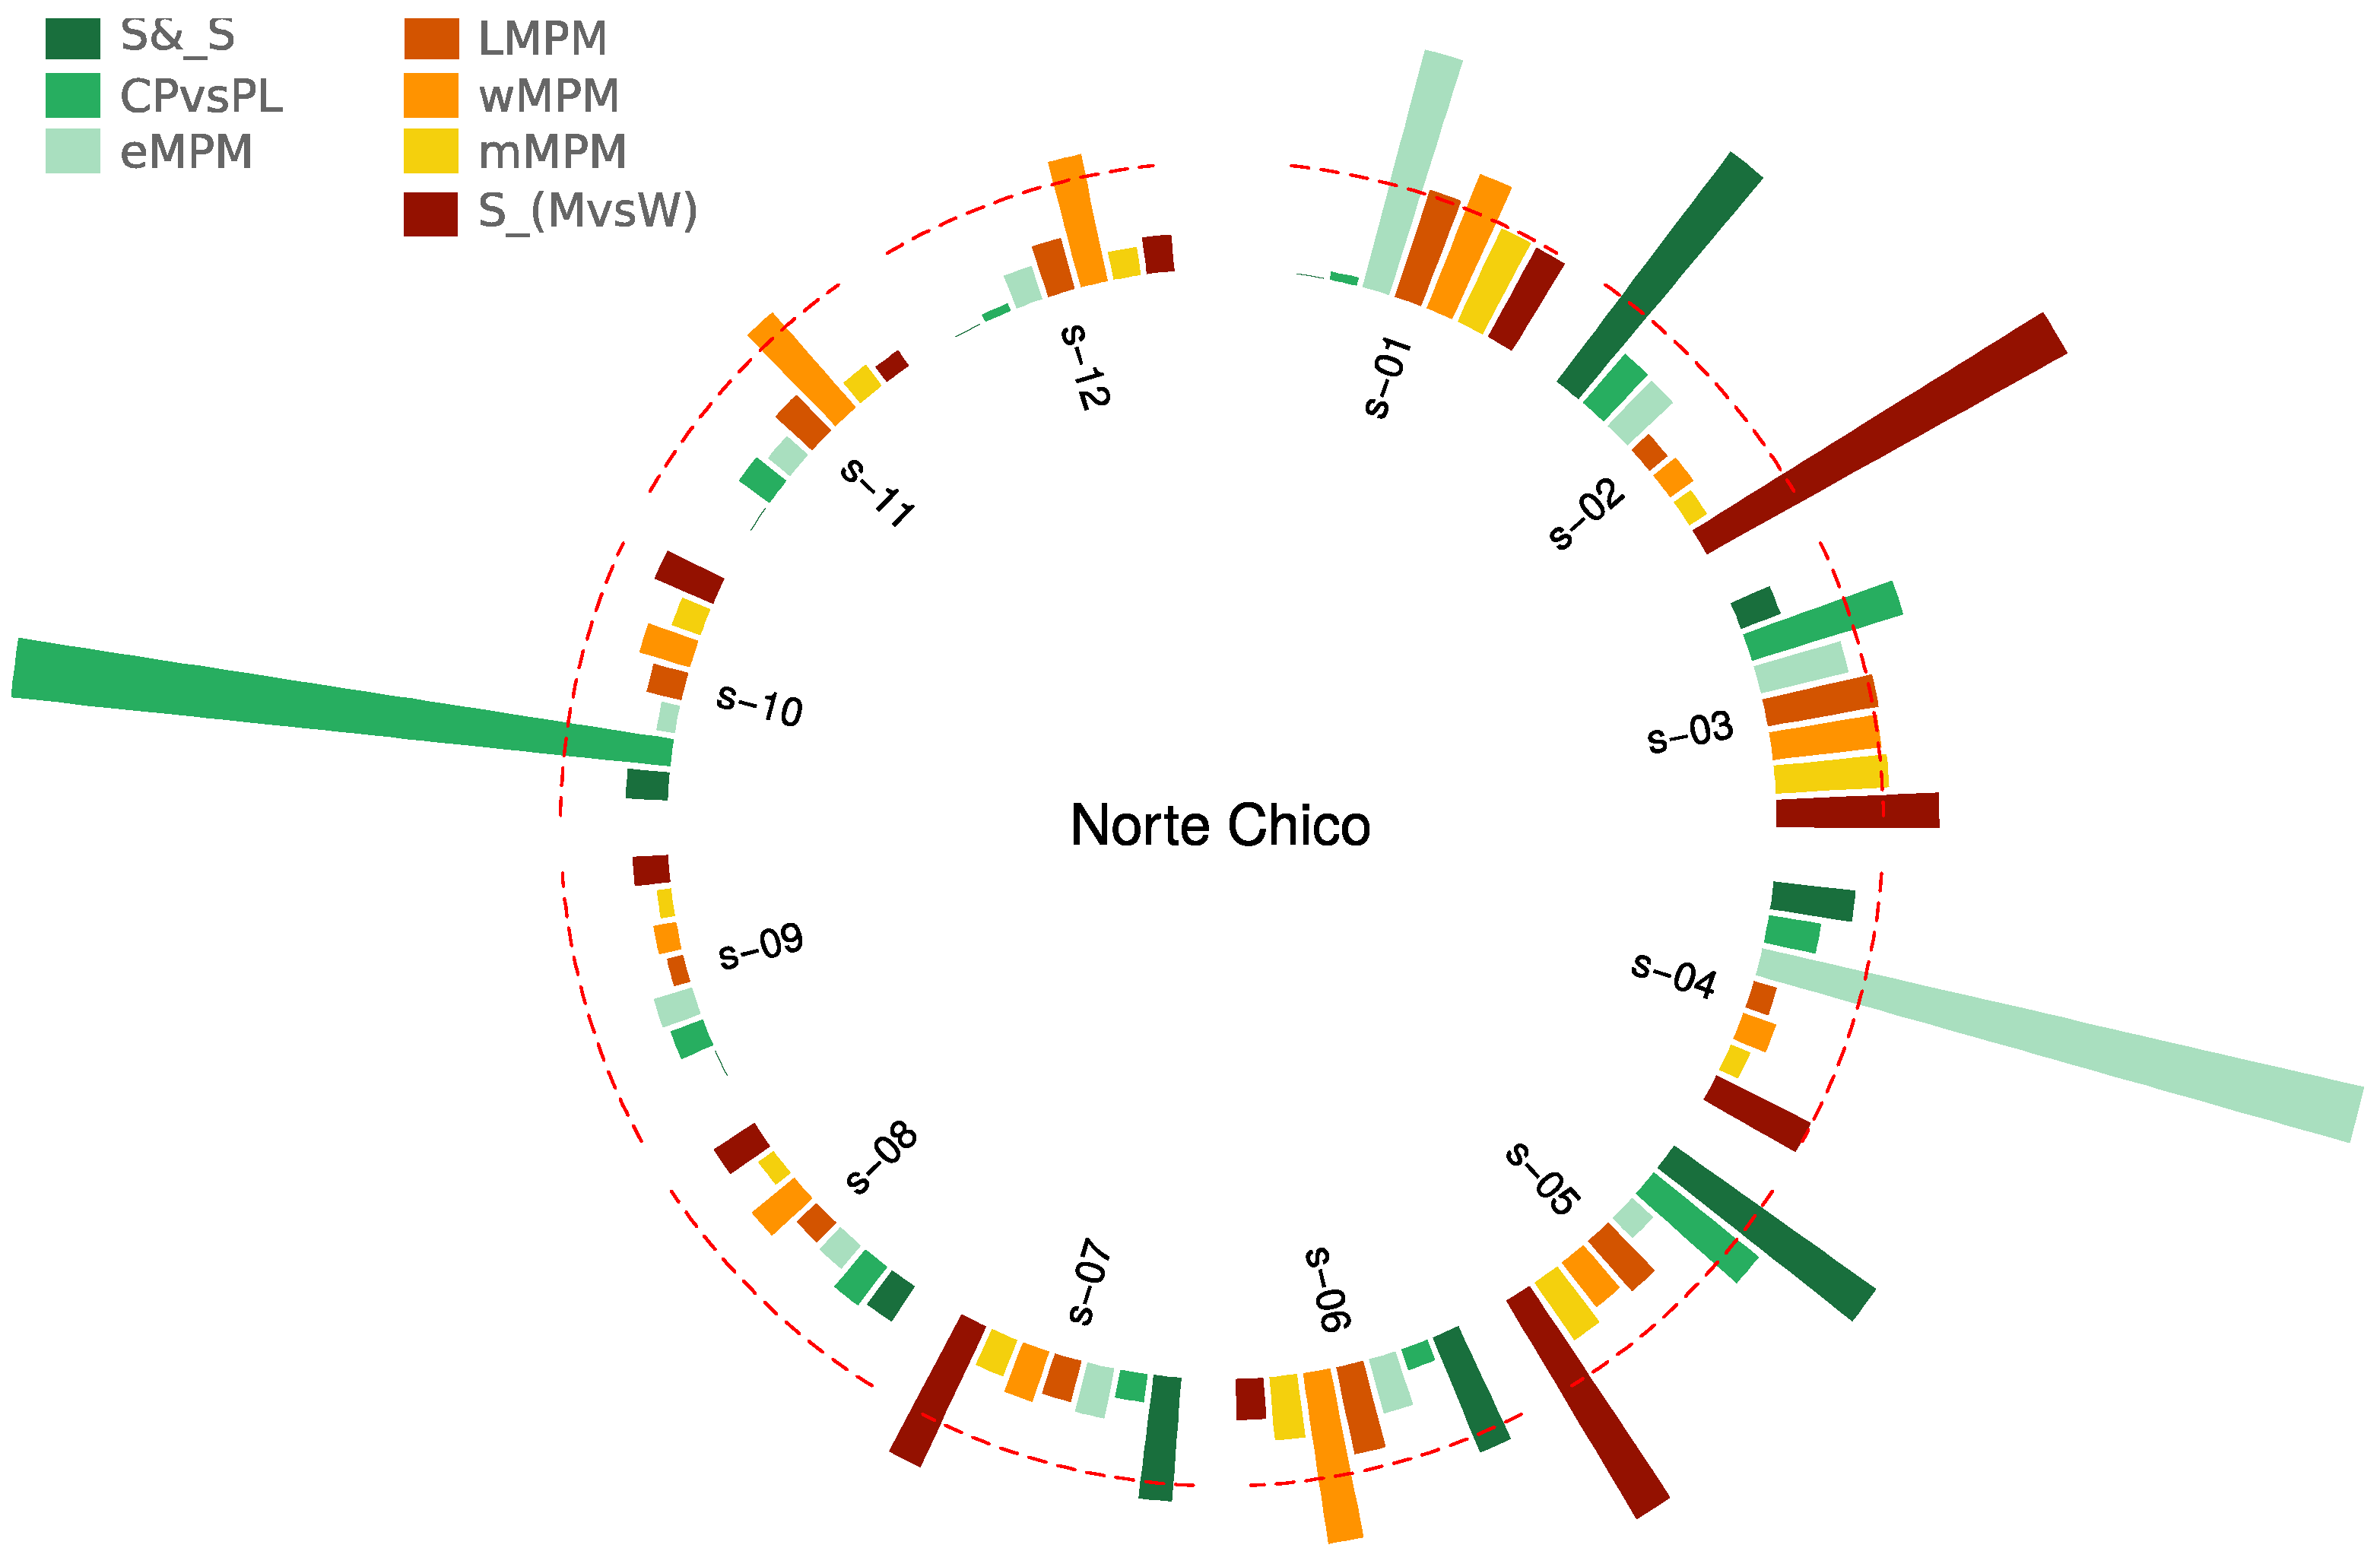
According to Figure A1, a large proportion of sensitive activities (S&S > 1) will be interpreted as ones that, on average, have a significant chance of producing changes in the economy’s total production. Therefore, compared to other activities that exhibit minimal sensitivity, a 1% change in sectoral production has a greater chance of being realized. Moreover, this value represents sectoral interaction. The more interactions or the bigger quantity of delicate activities. In this regard, the interaction that materializes not only indicates a stronger sectoral impact, but also increases the likelihood of a sectoral transformation.
Figure A1. Condition used as reference in the analysis. Source: the authors.
Sustainability 16 08692 g0a1
The link between salary and payment for activity is particularly interesting; on average, they are near to 1 (CPvsPL ≈ 1), or in the range of ±0.2 (0.8 < CPvsPL< 1.2). From this perspective, it is evident that the addition of taxes or subsidies (net taxes) has not occurred. Since society would have already received payment through the collection of net taxes, the indicator will display a distribution or premium that, in our opinion, is fairly equitable between the parties (profits and wages).
In this regard, it is evident that the issue at hand is more nuanced than clear-cut, going beyond our understandings of what distribution is fair and unfair. This is because, while the capital owner is the one who risks his financial capital during the activity, a low value—that is, a salary payment that exceeds the compensation due to the capital owners—might create a kind of disincentive. Consequently, the suggested value is precisely because of these latter observations—these would be unpleasant activities in terms of compensation for individuals who risk their capital. Also, it should be mentioned that CO2 emissions have values that are less than one (eMPM < 1). While it is beneficial for them to be zero, meaning that they are activities that, on average, generate fewer emissions than others, the lower the emissions, the lower the indicated damage to the environment.
There must be more jobs created than one (lMPM > 1). The high number suggests that there will be significant direct and indirect effects on hiring when there is a change in that sector’s production. It would be assumed that the employment multipliers for men and women (wMPM and mMPM, respectively) would be high and comparable to the overall employment rate. It is also interesting to determine if the outcomes are the same for the two. As a result, their values are somewhat comparable. This would demonstrate the lack of discrimination in the workplace. Moreover, it would be remarkable to discover that the connection between men’s and women’s earnings (S_(MvsW)) approaches unity (S_(MvsW) ≈ 1). This would suggest that discrimination based on wage does not exist.
Table A1. Condition used as reference in the analysis with indicators.
S&SCPvsLPeMPMLMPMwMPMmMPMS (MvsW)
Condition/Territory>1≈1 or
[1.2–0.8]
<1>1>1&
(wMPM ≈ mMPM)
>1&
(wMPM ≈ mMPM)
≈1
Norte Grandes02; s03; s05; s06 & s07 s05s02; s03; s05 to s12 -s06 (no) & s1 (no)-s01 & s07
Norte Chicos02; s05; s06 & s07s05s02; s03; s05 to s12s01 & s03s01 (yes); s03 (yes); s06 (no); s11 (no) & s12 (no)s03 (yes)s01 & s04
Central Zones03 & s07s03 & s05s02; s03; s05 to s12s01; s02 & s05s01 (no); s02 (no); s06 (no); s10 to s12 (no)s01 (no); s02 (no) & s05 (no)s03 & s04
Patagonias01; s03 & s07s05s02; s03; s05 to s12 s02s02 (no); s06 (no) & s11 (no)s02 (no)s01
Note: each sector that appears with three or more conditions is highlighted in bold. Source: the authors.

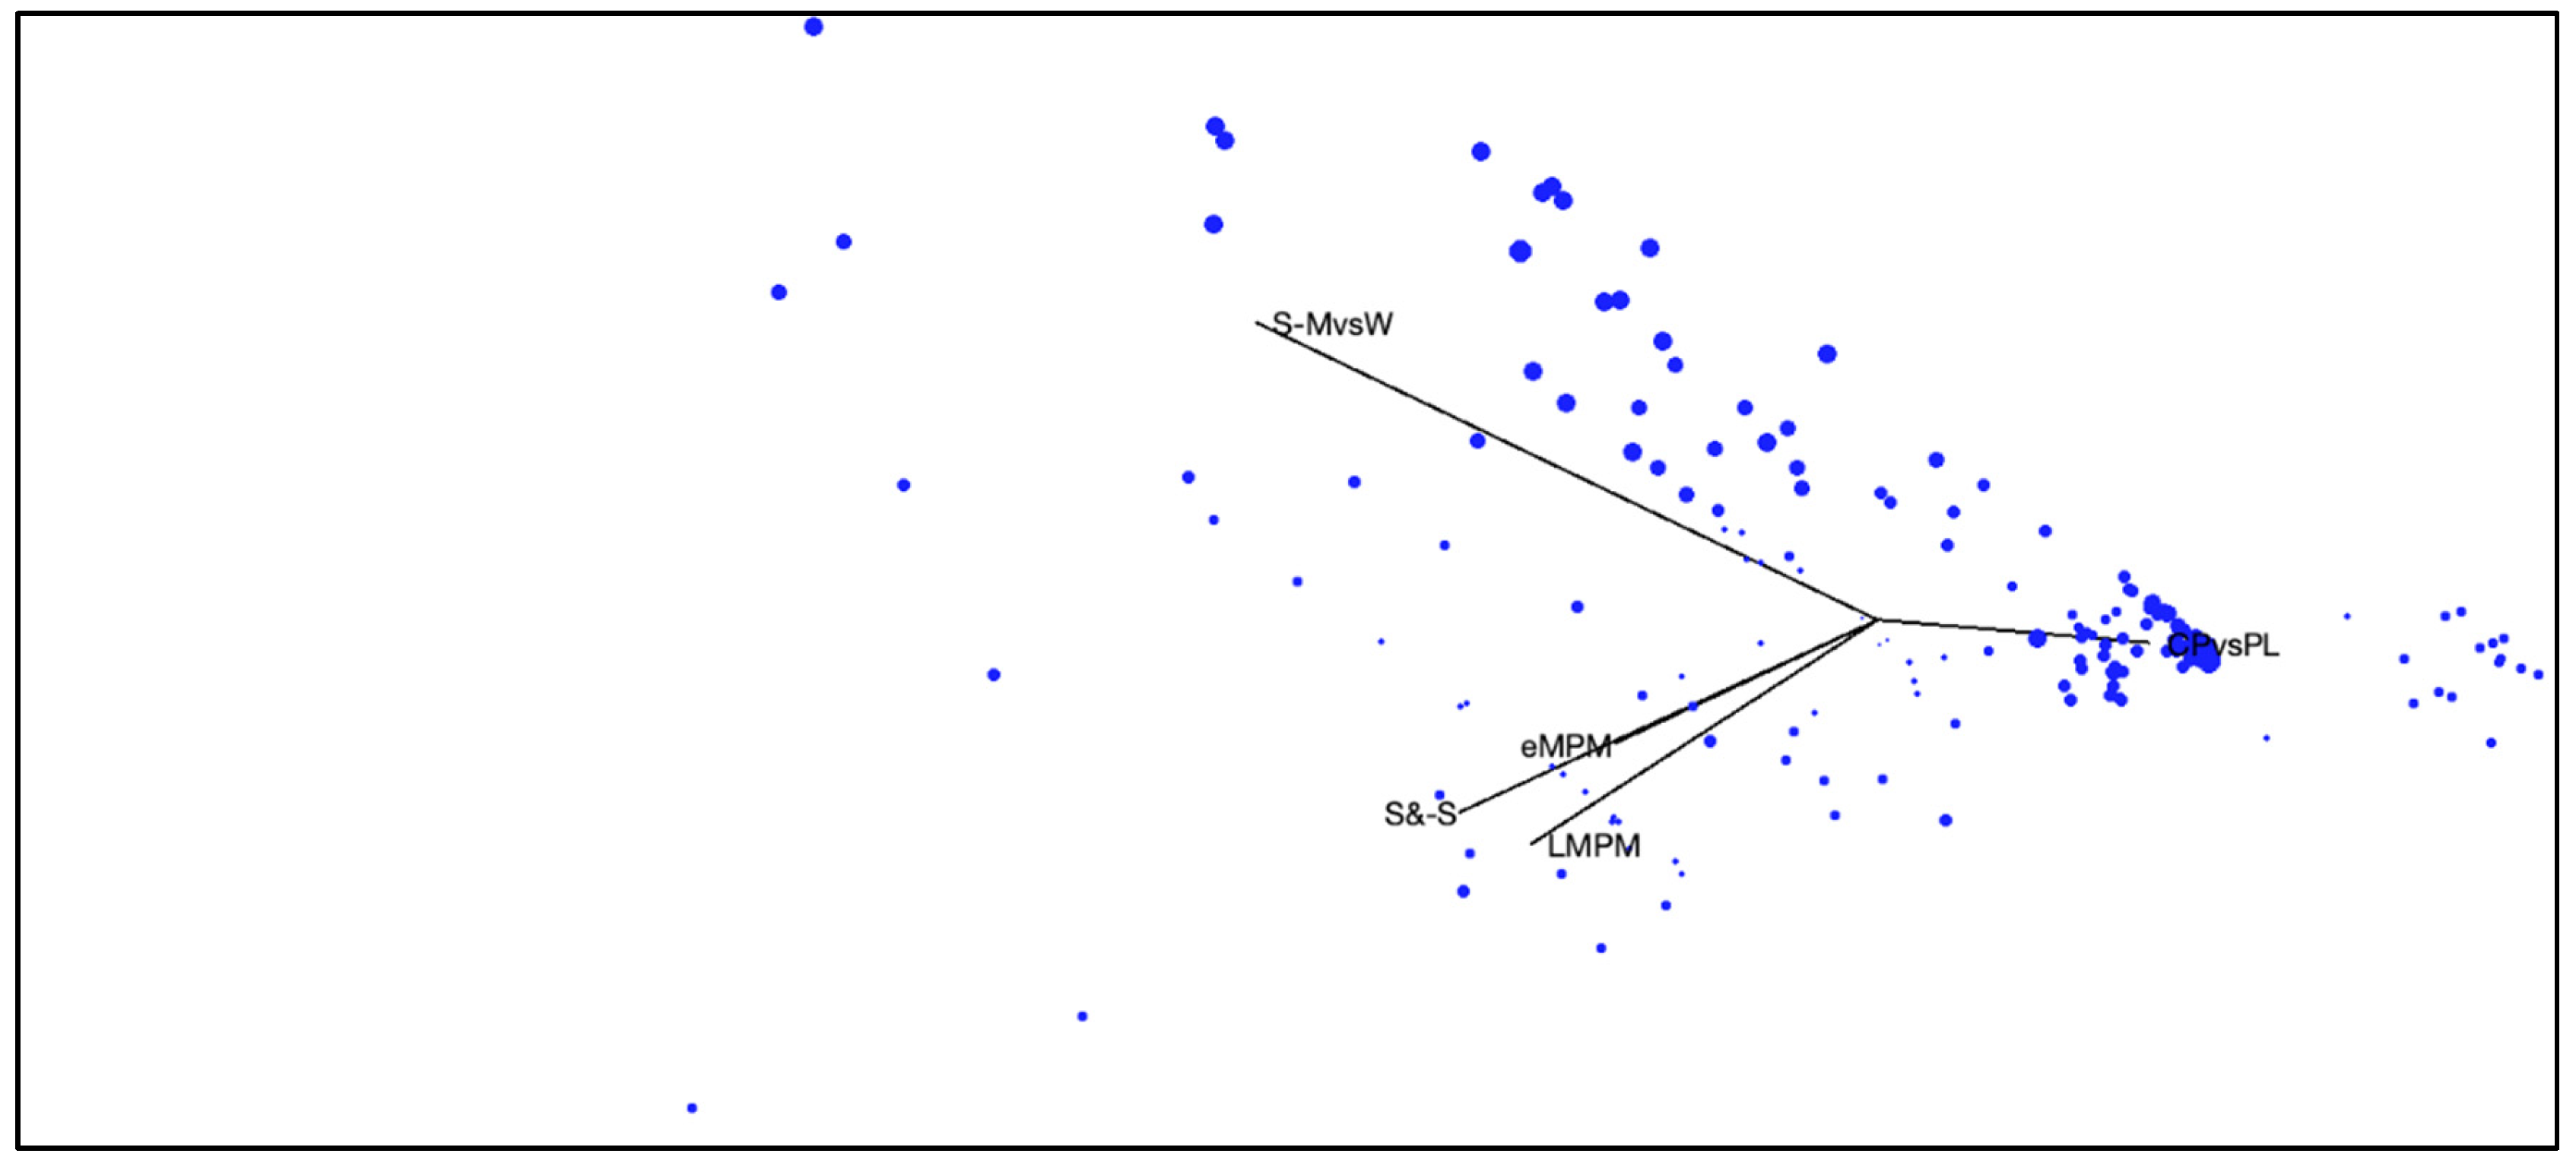
Appendix A.2. Biplot Analysis (Principal Components Analysis)

Data file: MultiPlot_FN.xls
Transformation of the raw data: Column standardization
Estimation Method: Singular Value Decomposition
Type of Biplot: Principal Normalization (Baricentric Scaling)
Eigenvalues & variance explained
Table A2. Inertia.
Table A2. Inertia.
AxisEigenvalueExpl. Var.Cummulative
Axis 1250.49327.98827.988
Axis 2203.56222.74450.732
Axis 3181.98520.33371.066
Axis 4152.27217.01488.079
Axis 5106.68911.921100
Table A3. Column Coordinates.
ColumnAxis 1Axis 2Axis 3
S&-S−7.296−0.43−9.465
CPvsPL4.7266.602−6.599
eMPM−4.584−9.2951.468
LMPM−6.0478.1846.773
S-MvsW−10.8332.535−0.906
Table A4. Column Contributions.
ColumnAxis 1Axis 2Axis 3
S&-S2971500
CPvsPL125243243
eMPM11748312
LMPM204374256
S-MvsW656365
Table A5. Ordered Contributions [columns].
Col LabelAxis1LabelAxis2LabelAxis3
1S-MvsW656eMPM483S&-S500
2S&-S297LMPM374LMPM256
3LMPM204CPvsPL243CPvsPL243
4CPvsPL125S-MvsW36eMPM12
5eMPM117S&-S1S-MvsW5
Table A6. Qualities of representation of the rows (Cummulative contributions).
ColLabelAxis1Axis2Axis3
1S&-S297298798
2CPvsPL125368611
3eMPM117600612
4LMPM204578834
5S-MvsW656692697
Table A7. Ordered QLRs [columns].
ColLabelAxis1LabelAxis2LabelAxis3
1S-MvsW656S-MvsW692LMPM834
2S&-S297eMPM600S&-S798
3LMPM204LMPM578S-MvsW697
4CPvsPL125CPvsPL368eMPM612
5eMPM117S&-S298CPvsPL611

References

  1. Sharifi, A.; Simangan, D.; Kaneko, S. Three decades of research on climate change and peace: A bibliometrics analysis. Sustain. Sci. 2021, 16, 1079–1095. [Google Scholar] [CrossRef]
  2. Doussoulin, J.P.; Mougenot, B. The Economic, Climate Change and Public Health Edges of the Geopolitics of COVID-19: An Exploratory Bibliometric Analysis. In Biotechnology to Combat COVID-19; IntechOpen: London, UK, 2021; ISBN 1-83968-627-8. [Google Scholar]
  3. Li, M.; Peng, M.Y.-P.; Nazar, R.; Ngozi Adeleye, B.; Shang, M.; Waqas, M. How does energy efficiency mitigate carbon emissions without reducing economic growth in post COVID-19 era. Front. Energy Res. 2022, 10, 832189. [Google Scholar] [CrossRef]
  4. Burgess, M.G.; Ritchie, J.; Shapland, J.; Pielke, R. IPCC baseline scenarios have over-projected CO2 emissions and economic growth. Environ. Res. Lett. 2020, 16, 014016. [Google Scholar] [CrossRef]
  5. Kais, S.; Sami, H. An econometric study of the impact of economic growth and energy use on carbon emissions: Panel data evidence from fifty eight countries. Renew. Sustain. Energy Rev. 2016, 59, 1101–1110. [Google Scholar] [CrossRef]
  6. Li, Z.; Huang, Z.; Su, Y. New media environment, environmental regulation and corporate green technology innovation: Evidence from China. Energy Econ. 2023, 119, 106545. [Google Scholar] [CrossRef]
  7. Córdova, C.; Zorio-Grima, A.; Merello, P. Carbon Emissions by South American Companies: Driving Factors for Reporting Decisions and Emissions Reduction. Sustainability 2018, 10, 2411. [Google Scholar] [CrossRef]
  8. Pinedo-López, J.; Baena-Navarro, R.; Durán-Rojas, N.; Díaz-Cogollo, L.; Farak-Flórez, L. Energy Transition in Colombia: An Implementation Proposal for SMEs. Sustainability 2024, 16, 7263. [Google Scholar] [CrossRef]
  9. Folini, D.; Friedl, A.; Kübler, F.; Scheidegger, S. The climate in climate economics. Rev. Econ. Stud. 2024, rdae011. [Google Scholar] [CrossRef]
  10. Nordhaus, W.D. A review of the Stern review on the economics of climate change. J. Econ. Lit. 2007, 45, 686–702. [Google Scholar] [CrossRef]
  11. Ribeiro, V.M. Green bond market boom: Did environmental, social and governance criteria play a role in reducing health-related uncertainty? Green Financ. 2023, 5, 18–67. [Google Scholar] [CrossRef]
  12. Leontief, W.W. Quantitative Input and Output Relations in the Economic Systems of the United States. Rev. Econ. Stat. 1936, 18, 105–125. [Google Scholar] [CrossRef]
  13. He, H.; Gao, Y.; Wang, X. Applying the Hypothetical Extraction Method to Investigate Intersectoral Carbon Emission Linkages of China’s Transportation Sector. Sustainability 2024, 16, 4046. [Google Scholar] [CrossRef]
  14. Doussoulin, J.P.; Bittencourt, M. How effective is the construction sector in promoting the circular economy in Brazil and France?: A waste input-output analysis. Struct. Change Econ. Dyn. 2022, 60, 47–58. [Google Scholar] [CrossRef]
  15. Leontief, W. Technological advance, economic growth, and the distribution of income. Popul. Dev. Rev. 1983, 9, 403–410. [Google Scholar] [CrossRef]
  16. Leontief, W. Machines and man. Sci. Am. 1952, 187, 150–164. [Google Scholar] [CrossRef]
  17. Leontief, W.; Duchin, F. The Future Impact of Automation on Workers; Oxford University Press: New York, NY, USA, 1986; ISBN 0-19-503623-9. [Google Scholar]
  18. Rifkin, J. The End of Work; G. P. Putnam’s Sons: New York, NY, USA, 1995; ISBN 0-87477-824-7. [Google Scholar]
  19. Fleming, P. Robots and organization studies: Why robots might not want to steal your job. Organ. Stud. 2019, 40, 23–38. [Google Scholar] [CrossRef]
  20. Andrew, R.M.; Peters, G.P. A multi-region input–output table based on the global trade analysis project database (GTAP-MRIO). Econ. Syst. Res. 2013, 25, 99–121. [Google Scholar] [CrossRef]
  21. Peters, G.P.; Andrew, R.; Lennox, J. Constructing an environmentally-extended multi-regional input–output table using the GTAP database. Econ. Syst. Res. 2011, 23, 131–152. [Google Scholar] [CrossRef]
  22. Huang, C.; Zhang, Z.; Li, N.; Liu, Y.; Chen, X.; Liu, F. Estimating economic impacts from future energy demand changes due to climate change and economic development in China. J. Clean. Prod. 2021, 311, 127576. [Google Scholar] [CrossRef]
  23. de la Rúa, C.; Lechón, Y. An integrated Multi-Regional Input-Output (MRIO) Analysis of miscanthus biomass production in France: Socio-economic and climate change consequences. Biomass Bioenergy 2016, 94, 21–30. [Google Scholar] [CrossRef]
  24. Wiedmann, T.; Barrett, J. Policy-relevant applications of environmentally extended MRIO databases–experiences from the UK. Econ. Syst. Res. 2013, 25, 143–156. [Google Scholar] [CrossRef]
  25. Sonis, M.; Guilhoto, J.; Hewings, G.J.; Martins, E. Linkages, key sectors and structural change: Some new perspectives. Dev. Econ. 1995, 32, 233–270. [Google Scholar]
  26. Sonis, M.; Hewings, G.J.D.; Miyazawa, K. Synergetic interactions within the pair-wise hierarchy of economic linkages sub-systems. Hitotsubashi J. Econ. 1997, 38, 183–199. [Google Scholar]
  27. Soza-Amigo, S.; Aroca, P. Productive structures and development: The case of the Chilean economy. Rev. Metodos Cuantitativos Econ. Empresa 2018, 26, 175–202. [Google Scholar] [CrossRef]
  28. Pyatt, G.; Round, J.I. Accounting and fixed price multipliers in a social accounting matrix framework. Econ. J. 1979, 89, 850–873. [Google Scholar] [CrossRef]
  29. Sonis, M.; Hewings, G.J. New Developments in Input-Output Analysis: Fields of Influence of Changes, the Temporal Leontief Inverse and the Reconsideration of Classical Key Sector Analysis. In Tool Kits in Regional Science: Theory, Models, and Estimation; Springer: Berlin/Heidelberg, Germany, 2009; pp. 69–117. [Google Scholar]
  30. Rivera, N.M. Disaggregation of sectors in social accounting matrices using a customized Wolsky method: A comment on its estimation bias. Appl. Econ. Lett. 2016, 23, 785–789. [Google Scholar] [CrossRef]
  31. Rasmussen, P.N. Studies in Inter-Sectoral Relations; Einar Harcks: Copenhagen, Denmark, 1956. [Google Scholar]
  32. Hewings, G.J.; Jensen, R.C.; West, G.R.; Sonis, M.; Jackson, R.W. The spatial organization of production: An input-output perspective. Socioecon. Plann. Sci. 1989, 23, 67–86. [Google Scholar] [CrossRef]
  33. Guo, J.; Planting, M.A. Using Input-Output Analysis to Measure US Economic Structural Change Over a 24 Year Period. In Proceedings of the 13th International Conference on Input-Output Techniques, Macerata, Italy, 21–28 August 2000. [Google Scholar]
  34. Geršak, U.; Muhaj, D. Inter-Sectoral Production Linkages in Slovenia: An Input-Output Analysis; Banka Slovenije: Ljubljana, Slovenia, 2016; ISBN 961-6960-11-3. [Google Scholar]
  35. Khanal, B.R.; Gan, C.; Becken, S. Tourism Inter-Industry Linkages in the Lao PDR Economy: An Input—Output Analysis. Tour. Econ. 2014, 20, 171–194. [Google Scholar] [CrossRef]
  36. Kim, H.-W.; Dong, L.; Jung, S.; Park, H.-S. The role of the eco-industrial park (EIP) at the national economy: An input-output analysis on Korea. Sustainability 2018, 10, 4545. [Google Scholar] [CrossRef]
  37. Munjal, P. Structural changes in Indian economy: An input-output analysis. Indian Econ. Rev. 2007, 42, 77–95. Available online: https://www.jstor.org/stable/29793876 (accessed on 5 October 2024).
  38. Soza-Amigo, S.; Doussoulin, J.P. Structural Changes in Chile’s Industries to Reduce Carbon Dioxide (CO2) Emissions: An Emissions Multiplier Product Matrix Analysis (eMPM). Sustainability 2024, 16, 6615. [Google Scholar] [CrossRef]
  39. Marangos, J. Consistency and Viability of Economic Systems. In Consistency and Viability of Islamic Economic Systems and the Transition Process; Springer: Berlin/Heidelberg, Germany, 2013; pp. 11–52. [Google Scholar]
  40. Molle, W. European Economic Governance: The Quest for Consistency and Effectiveness; Routledge: Abingdon, UK, 2011; ISBN 0-203-82868-2. [Google Scholar]
  41. Soza-Amigo, S.; Ramos, C. La elasticidad en un entorno input-output: Replanteando efectos. Stud. Appl. Econ. 2020, 38, 12. [Google Scholar] [CrossRef]
  42. Ali, Y.; Pretaroli, R.; Sabir, M.; Socci, C.; Severini, F. Structural changes in carbon dioxide (CO2) emissions in the United Kingdom (UK): An emission multiplier product matrix (EMPM) approach. Mitig. Adapt. Strateg. Glob. Change 2020, 25, 1545–1564. [Google Scholar] [CrossRef]
  43. Carcaño Valencia, E. Ecofeminismo y ambientalismo feminista: Una reflexión crítica. Argumentos 2008, 21, 183–188. [Google Scholar]
  44. Salleh, A. Ecofeminism as Politics: Nature, Marx and the Postmodern; Zed Books Ltd.: London, UK, 2017; ISBN 1-78699-042-3. [Google Scholar]
  45. Gaard, G.; Gaard, G.C.; Murphy, P.D. Ecofeminist Literary Criticism: Theory, Interpretation, Pedagogy; University of Illinois Press: Champaign, IL, USA, 1998; Volume 13, ISBN 0-252-06708-8. [Google Scholar]
  46. Salleh, A. Class, race, and gender discourse in the ecofeminism/deep ecology debate. Environ. Ethics 1993, 15, 225–244. [Google Scholar] [CrossRef]
  47. Schaffer, A. Women’s and Men’s Contributions to Satisfying Consumers’ Needs: A Combined Time Use and Input–Output Analysis. Econ. Syst. Res. 2007, 19, 23–36. [Google Scholar] [CrossRef]
  48. Kucera, D.; Roncolato, L.; von Uexkull, E. Trade contraction in India and South Africa during the global crisis Examining gender and skill biases in job loss. In Gender Perspectives and Gender Impacts of the Global Economic Crisis; Routledge: Abingdon, UK, 2014; pp. 104–131. [Google Scholar]
  49. Valiollahi Bisheh, A.; Veisi, H.; Liaghati, H.; Mahdavi Damghani, A.M.; Kambouzia, J. Embedding gender factor in energy input–output analysis of paddy production systems in Mazandaran province, Iran. Energy Ecol. Environ. 2017, 2, 214–224. [Google Scholar] [CrossRef]
  50. Jebli, M.B.; Farhani, S.; Guesmi, K. Renewable energy, CO2 emissions and value added: Empirical evidence from countries with different income levels. Struct. Change Econ. Dyn. 2020, 53, 402–410. [Google Scholar] [CrossRef]
  51. Mascaretti, A.; Dell’Agostino, L.; Arena, M.; Flori, A.; Menafoglio, A.; Vantini, S. Heterogeneity of technological structures between EU countries: An application of complex systems methods to Input–Output Tables. Expert Syst. Appl. 2022, 206, 117875. [Google Scholar] [CrossRef]
  52. Wixted, B.; Yamano, N.; Webb, C. Input-Output Analysis in an Increasingly Globalised World: Applications of OECD’s Harmonised International Tables. 2006. Available online: https://www.oecd-ilibrary.org/science-and-technology/input-output-analysis-in-an-increasingly-globalised-world_303252313764 (accessed on 5 October 2024).
  53. Yamano, N.; Guilhoto, J. CO2 Emissions Embodied in International Trade and Domestic Final Demand: Methodology and Results Using the OECD Inter-Country Input-Output Database. 2020. Available online: https://www.oecd.org/en/publications/co2-emissions-embodied-in-international-trade-and-domestic-final-demand_8f2963b8-en.html (accessed on 5 October 2024).
  54. Butnar, I.; Llop, M. Composition of greenhouse gas emissions in Spain: An input–output analysis. Ecol. Econ. 2007, 61, 388–395. [Google Scholar] [CrossRef]
  55. Sanguinet, E.R.; Azzoni, C.R.; Alvim, A.M. Resource-Based Industries and CO2 emissions embedded in value chains: A Regional Analysis for Selected Countries in Latin America. Atmosphere 2022, 13, 856. [Google Scholar] [CrossRef]
  56. Rhee, H.-C.; Chung, H.-S. Change in CO2 emission and its transmissions between Korea and Japan using international input–output analysis. Ecol. Econ. 2006, 58, 788–800. [Google Scholar] [CrossRef]
  57. Pottier, A.; Le Treut, G. Quantifying GHG emissions enabled by capital and labor: Economic and gender inequalities in France. J. Ind. Ecol. 2023, 27, 624–636. [Google Scholar] [CrossRef]
  58. Soza-Amigo, S.S.; Aroca, P.; Rueda-Cantuche, J.M. El desarrollo y los campos de influencia. Investig. Reg. J. Reg. Res. 2018, 7–34. Available online: https://dialnet.unirioja.es/servlet/articulo?codigo=6459712 (accessed on 22 August 2024).
  59. Naspleda, F.D. Contribuciones al examen del crecimiento de la acumulación industrialargentina en la posconvertibilidad (2005–2011) y su comparación con la fase de incremento neoliberal (1993–1998). Rev. Galega Econ. 2020, 20. Available online: https://www.memoria.fahce.unlp.edu.ar/art_revistas/pr.15514/pr.15514.pdf (accessed on 22 August 2024).
  60. Demirer, M. Production function estimation with factor-augmenting technology: An application to markups. Job Mark. Pap. 2020. Available online: https://economics.sas.upenn.edu/system/files/2020-01/Demirer_JMP.pdf (accessed on 22 August 2024).
  61. Haddad, E.; Aroca, A.; Arantes, A.; Días, L.; Fernandes, L.; Li, D.; Pimenta, B.; Rocha, A.; Sass, K.; Ussami, K. Interregional Input-Output System for Chile, 2014; The University of Sao Paulo Regional and Urban Economics Lab (NEREUS): Sao Paulo, Brazil, 2018. [Google Scholar]
  62. Schintke, J.; Stäglin, R. Important input coefficients in market transaction tables and production flow tables. In Input-Output Analysis, Current Developments; Chapman and Hall: New York, NY, USA, 1988. [Google Scholar]
  63. Hewings, G.J.; Sonis, M.; Jensen, R.C. Fields of influence of technological change in input-output models. Pap. Reg. Sci. 1988, 64, 25–36. [Google Scholar] [CrossRef]
  64. Soza-Amigo, S.; Fuders, F.; Aroca, P. La importancia del sector minero para el desarrollo de la economía chilena: La evolución de sus campos de influencia. El Trimest. Económico 2021, 88, 831–872. [Google Scholar] [CrossRef]
  65. Tarancón, M.A.; Del Río, P. Cambio tecnológico y emisiones de CO2: Análisis input-output y análisis de sensibilidad mediante programación lineal. Estud. Económicos Desarro. Int. 2004, 4. Available online: https://dialnet.unirioja.es/servlet/articulo?codigo=7402346 (accessed on 5 October 2024).
  66. Aroche, A. Desintegración en la estructura productiva mexicana y el empleo: Los coeficientes importantes y la integración. RAE Rev. Astur. Econ. 2005, 31–61. Available online: https://dialnet.unirioja.es/servlet/articulo?codigo=2304672 (accessed on 5 October 2024).
  67. Aroche, F. Structural transformations and important coefficients in the North American economies. Econ. Syst. Res. 2002, 14, 257–273. [Google Scholar] [CrossRef]
  68. Aroche, F. Important coefficients and structural change: A multi-layer approach. Econ. Syst. Res. 1996, 8, 235–246. [Google Scholar] [CrossRef]
  69. Robles Teigeiro, L.; Sanjuán Solís, J. Key Sectors: Big Coefficients and Important Coefficients in Spain. In Proceedings of the Jornadas de Analisis Input-Output, 1st Spanish Input-Output Conference in Oviedo, September 2005 in Oviedo. Available online: http://www.shaio.es/jornadas/1jeaio/PAP_IOJ1_uma_robles_sanjuan.pdf (accessed on 13 July 2024).
  70. Ghosh, S.; Roy, J. Qualitative input–output analysis of the Indian economic structure. Econ. Syst. Res. 1998, 10, 263–274. [Google Scholar] [CrossRef]
  71. Pulido, A.; Fontela, E. Análisis Input-Output: Modelos, Datos y Aplicaciones; Editorial Pirámide: Madrid, Spain, 1993; ISBN 84-368-0756-1. [Google Scholar]
  72. Villardón, M.P.G. Una alternativa de representación simultánea: HJ-Biplot. In Qüestiió: Quaderns d’Estadística i Investigació Operativa; Centre de Càlcul, Universitat Politècnica de Barcelona: Barcelona, Spain, 1986; pp. 13–23. [Google Scholar]
  73. Villardón, V. A Package for Multivariate Analysis Using Biplots; Departamento de Estadística, Universidad de Salamanca: Salamanca, Spain, 2010. [Google Scholar]
  74. Coskuner, C.; Paskeh, M.K.; Olasehinde-Williams, G.; Akadiri, S.S. Economic and social determinants of carbon emissions: Evidence from organization of petroleum exporting countries. J. Public Aff. 2020, 20, e2092. [Google Scholar] [CrossRef]
  75. Lithgow, D.; Von Thaden, J.J.; Revollo-Fernández, D.A.; del Pilar Salazar-Vargas, M.; Rodríguez de los Santos, A. Assessing the Feasibility and Socioecological Benefits of Climate-Smart Practices at the Watershed Scale. Sustainability 2024, 16, 2852. [Google Scholar] [CrossRef]
  76. Conceição, P. Human development report 2020-the next frontier: Human development and the anthropocene. In Human Development Report; United Nations Development Programme: New York, NY, USA, 2020. [Google Scholar]
  77. Wittneben, B.B.; Kiyar, D. Climate change basics for managers. Manag. Decis. 2009, 47, 1122–1132. [Google Scholar] [CrossRef]
  78. Mougenot, B.; Doussoulin, J.-P. Conceptual evolution of the bioeconomy: A bibliometric analysis. Environ. Dev. Sustain. 2021, 24, 1031–1047. [Google Scholar] [CrossRef]
  79. Del Rio, J.I.; Fernandez, P.; Castillo, E.; Orellana, L.F. Assesing Climate Change Risk in the Mining Industry: A Case Study in the Copper Industry in the Antofagasta Region, Chile. Commodities 2023, 2, 246–260. [Google Scholar] [CrossRef]
Figure 1. Distribution of the productive areas of Chile and main sales in 2014. Source: the authors based on SII data in 2014 (The internal revenue system (IRS) or SII data for this figure is available at https://homer.sii.cl/ accessed on 13 July 2024).
Sustainability 16 08692 g001
Figure 2. Holistic approach of the five dimensions. Source: the authors.
Sustainability 16 08692 g002
Figure 3. Methodological approach. Source: the authors.
Sustainability 16 08692 g003
Figure 4. Economics sectors on the MRIO matrix. Source: the authors.
Sustainability 16 08692 g004
Figure 5. Hj-Biplot. Source: the authors employ Vicente Villardón’s [73] software.
Sustainability 16 08692 g005
Figure 6. Main results of zones [Norte Grande]. Source: the authors.
Sustainability 16 08692 g006
Figure 7. Main results of zones [Norte Chico]. Source: the authors.
Sustainability 16 08692 g007
Figure 8. Main results of zones [Central Zone]. Source: the authors.
Sustainability 16 08692 g008
Figure 9. Main results of zones [Patagonia]. Source: the authors.
Sustainability 16 08692 g009
Table 1. Variables.
Table 1. Variables.
AverageStandard Deviation
VariableAbbreviationNorteGrandeNorte ChicoNorteGrandeNorte Chico
ElasticityS&S1.180.771.401.04
MPM weighted by CO2eMPM1.011.011.561.58
CapitalPayments/LaborPaymentsCP/LP1.180.981.951.67
MPM weighted by LaborLMPM0.400.510.210.33
MPM weighted by womenwMPM0.640.760.420.51
MPM weighted by menmMPM0.330.420.200.33
Men vs. Women’s salariesS-MvsW1.031.120.951.08
Central ZonePatagoniaCentral ZonePatagonia
ElasticityS&S1.020.952.341.44
MPM weighted by CO2eMPM1.000.991.551.56
CapitalPayments/LaborPaymentsCP/LP0.960.931.651.66
MPM weighted by LaborLMPM1.341.194.583.60
MPM weighted by womenwMPM1.290.951.761.06
MPM weighted by menmMPM1.351.275.524.43
Men vs. Women’s salariesS-MvsW0.950.990.840.90
Source: the authors.
Disclaimer/Publisher’s Note: The statements, opinions and data contained in all publications are solely those of the individual author(s) and contributor(s) and not of MDPI and/or the editor(s). MDPI and/or the editor(s) disclaim responsibility for any injury to people or property resulting from any ideas, methods, instructions or products referred to in the content.

