Article

The Impact of Rapid Urbanization on the Efficiency of Industrial Green Water Use in Urban Agglomerations around Poyang Lake

1
Changzhou University Huaide College, Jingjiang 214500, China
2
School of Education Science, Northwest Normal University, Lanzhou 730071, China
3
School of Business, Changzhou University, Changzhou 213164, China
4
School of Finance and Economics, Jiangsu University, Zhenjiang 212013, China
5
School of Information, Yunnan Normal University, Kunming 650092, China
*
Author to whom correspondence should be addressed.
Sustainability 2024, 16(19), 8698; https://doi.org/10.3390/su16198698
Submission received: 5 September 2024 / Revised: 1 October 2024 / Accepted: 2 October 2024 / Published: 9 October 2024
(This article belongs to the Special Issue Sustainable Water Management in Rapid Urbanization)

Abstract

:
The construction of urban agglomerations around Poyang Lake is an important starting point of the strategy for the improvement of central China, but the spatial agglomeration of industry and population brings great pressure to the ecological environment. It is of great practical value to explore the impact of rapid urbanization on the water use efficiency of important ecological functional areas. Considering the undesired output of industrial production, this paper adopts the SE-SBM model to measure industrial green water use efficiency, comprehensively considers different aspects of urbanization of the urban agglomeration around Poyang Lake, empirically tests its inhibiting or boosting effect on industrial green water use and explores its spatial spillover effect with the help of a spatial metrology model. The results show that (1) the industrial green water use efficiency of urban agglomerations shows an overall upward trend, and the efficiency value of central cities is significantly higher than that of non-central cities and continues to show a state of diffusion; (2) social urbanization, environmental urbanization, and balanced urbanization can significantly improve industrial green water use efficiency, while industrial urbanization or industrialization inhibits the improvement in water use efficiency; (3) considering the spatial spillover factor, there are significant positive local effects between population urbanization and balanced urbanization, and significant positive spatial spillover effects between industrial urbanization and environmental urbanization; (4) the original model can pass the significance test by replacing the output-oriented water use efficiency with the input-oriented or non-oriented water use efficiency; the study area is extended to Jiangxi Province, and the impact of urbanization on industrial water use efficiency is basically consistent. We should adhere to the new type of urbanization that improves well-being and is friendly to the environment, rationally plan the industrial spatial pattern of urban agglomerations, adhere to the ecological and environmental threshold on undertaking industrial transfer, and promote the flow and sharing of green production factors.

1. Introduction

Reservoir rivers and lakes play a vital role not only in supporting agricultural irrigation, industrial water supply, and urban drinking water, but also in providing clean energy and promoting related cultural industries [1]. Unfortunately, as human activities expand, the boundaries of these reservoir rivers and lakes are increasingly eroded. Taking China’s largest freshwater lake, Poyang Lake, as an example, the lake has experienced severe droughts more than ten times in the past two decades, leading to a continuous decline in water levels and a shrinking lake area. According to the water environment dataset published by China Scientific Data, the water quality of Poyang Lake deteriorated rapidly between 2013 and 2018, with the eutrophication index exceeding 50, indicating a moderate level of eutrophication. In some areas, blue-green algae blooms have even occurred. This illustrates that reservoir rivers and lakes, represented by Poyang Lake, are facing disastrous consequences. Therefore, ways to salvage water resources and address the declining trend of water pollution in reservoir areas have become core tasks for sustainable development in many countries.
In addressing water pollution, existing research has proposed three approaches: “prioritizing economic development before water pollution control”, “halting economic development to conserve water resources”, and “advancing economic development alongside water pollution control”. Clearly, abandoning economic development or accepting irreversible water pollution are not viable strategies for developing countries. The only feasible path is to enhance green water efficiency through the simultaneous advancement of economic development and water pollution control. A notable example is that rapid urbanization, as a product of economic development, is closely related to water pollution control. For instance, water pollution issues during the urbanization process can prompt governments to implement stricter water management policies, thereby improving green water efficiency in urban areas. However, contrary to expectations, the urban expansion resulting from rapid urbanization may also lead to ecosystem degradation and diminish the self-purification capacity of water bodies, ultimately affecting the effectiveness of pollution control measures. Thus, the impact of rapid urbanization on regional green water efficiency is complex and multifaceted, creating challenges for decision-makers in rapidly urbanizing areas with reservoir rivers and lakes. Therefore, investigating the relationship between rapid urbanization and regional green water efficiency is of urgent importance.
Existing research has explored the relationship between rapid urbanization and water resource management in different regions worldwide, concluding that urbanization leads to negative externalities regarding water resources. For example, Luo et al. (2018), based on samples from 19 regions in China during the dry and wet seasons in 2014–2015, found that rapid urbanization exacerbated the deterioration of water quality in mainstream rivers [2]. Wan et al. (2024) analyzed data from China from 2013 to 2023 and discovered that increased urbanization intensified pressure on regional water environment management [3]. Rashid et al. (2018), using survey data from Muzaffarabad, Pakistan in 2015, found that severe pollution in the Jhelum and Neelum rivers occurred due to urbanization [4]. Abraha et al. (2022), based on remote sensing data from Ethiopia, noted that urban development challenges water resources in valley regions [5]. Chen et al. (2024) demonstrated a conflict between urbanization and water resource management exists in the Xiangjiang River Basin. However, amid difficulties in achieving multiple objectives related to water resource sustainability, pollution control, and urban development, the configurational enhancement of green water efficiency in synergy with urbanization may be possible [6]. Related studies, such as Zhou et al. (2022), found that rapid urbanization can improve urban green water efficiency based on survey data from Guangdong Province [7]. Ding et al. (2019) and Lu et al. (2022) further supported the positive role of rapid urbanization in enhancing green water efficiency in the industrial and agricultural sectors, respectively [8,9]. Given that developing countries often face the concurrent challenges of economic growth, urbanization, and water resource protection, and recognizing that water resources are critically linked to economic development, sacrificing water resources to facilitate urbanization and promote economic growth is a pressing reality for these nations. Therefore, in the context of developing countries, improving water efficiency and increasing green sustainability should be key aims in urbanization efforts. However, a critical question arises: should similar sacrifices in water resources be advocated in regions with reservoir rivers and lakes to enhance overall water efficiency? This issue requires urgent academic investigation to identify potential solutions.
In light of this, this paper seeks to address the following questions: (1) In areas dense with reservoir rivers and lakes, is rapid urbanization a “resource curse” that lowers green water efficiency, or is it a “catalyst” that drives the improvement in green water efficiency? (2) In these regions, through what mechanisms does rapid urbanization impact green water efficiency? To tackle these questions, this study utilizes urban sample data from the Poyang Lake region in China covering the years 2009 to 2022. Building on the rapid urbanization index construction method proposed by [10], this paper constructs a rapid urbanization index specific to the Poyang Lake area and empirically tests the causal relationship between rapid urbanization and green water efficiency. Additionally, it explores how rapid urbanization influences green water efficiency through industrial structures and government environmental attention. The study also employs spatial modeling to conduct an exploratory analysis of the potential consequences of rapid urbanization on green water efficiency.
This paper selected the Poyang Lake urban agglomeration in China as the target research area for the following reasons: Finding a suitable sample of developing countries that exhibit characteristics of urbanization and “reservoir rivers and lakes” is not difficult. For instance, around Delhi and Mumbai in India, there are the Ganges and Godavari rivers, while Hanoi and Ho Chi Minh City in Vietnam are near the Red River and Mekong River. However, these samples either do not exhibit significant urbanization characteristics or have discrepancies in the functional definitions of “rivers and lakes.” In contrast, Poyang Lake is the largest freshwater lake in China, with its basin covering 94% of Jiangxi Province’s land area and encompassing eight cities across eleven municipalities (referred to as the Poyang Lake Ecological Urban Agglomeration, as shown in Figure 1). As of September 2024, the Poyang Lake urban agglomeration has already absorbed significant textile, ceramics, LE industry, metallurgy, and chemical industries, with its construction land and population capacity rapidly expanding. This provides an excellent platform for studying the relationship between green water efficiency and reservoir river and lake regions in developing countries. Moreover, developing countries like China are currently undergoing rapid urbanization. For example, in Jiangxi Province, the urbanization rate rose from 43.18% in 2009 to 61.46% in 2022, while industrial output increased from CNY 323.249 billion to CNY 1077.343 billion. This situation also provides an ideal platform for researching urbanization in developing countries.
Compared to the existing literature, this paper makes three marginal contributions:
First, from a research perspective, while existing studies have highlighted the externalities of water resources during the rapid urbanization process and noted that rapid urbanization may not favor the sustainability of water resources for developing countries like China, the consumption of water resources as a cost of economic development is inevitable. Therefore, enhancing sustainable water efficiency is crucial. Unfortunately, there has been limited exploration of the relationship between rapid urbanization and water resource utilization efficiency in the existing literature, which this paper aims to address.
Second, from a methodological standpoint, previous studies often assume regions operate independently and explore economic and environmental relationships in a fragmented manner which does not align with the spatial realities of factor flow. In response, this paper uses matched spatial sample data and introduces a spatial weighting social network approach, providing a more realistic complement to existing research.
Third, regarding the research sample, most existing studies investigate the externalities of water resources in the context of rapid urbanization across large regions, while studies focusing on reservoir areas are relatively scarce. Notably, water source regions have historically been vital for population concentration and urban formation, yet there remains considerable debate about whether urban development is necessary in these areas or if protected zones should be established to curtail urban growth. Therefore, this paper’s exploration of the Poyang Lake urban agglomeration, an important reservoir area, provides new empirical evidence for the ongoing debate on the necessity of rapid urbanization in such regions.
The remainder of this paper is structured as follows: Section 2 presents the theoretical analysis and research hypotheses; Section 3 outlines the econometric model, variable definitions, and data sources; Section 4 and Section 5 discuss and analyze empirical results; and Section 6 concludes with research findings and policy implications.

2. Theoretical Analysis and Research Hypotheses

2.1. Rapid Urbanization and Green Water Efficiency

Rapid urbanization has triggered a series of positive changes related to water resource management, beginning with infrastructure modernization. Emerging cities typically construct advanced water supply systems, including smart water meters and automated monitoring technologies, which can monitor water usage in real time and promptly identify and repair leaks, thereby reducing water resource waste [11]. Additionally, during the urbanization process, the emphasis placed by governments and enterprises on water resources has increased, driving the research and application of water-saving technologies, such as the promotion of efficient irrigation systems and water-saving sanitary facilities [12]. Furthermore, urbanization has led to the development of green infrastructure, including rainwater collection and reuse systems, ecological wetlands, and green roofs. These facilities effectively collect and treat rainwater, reduce urban runoff, improve water quality, and enhance the city’s flood resilience [13]. Moreover, green infrastructure provides ecological services that promote biodiversity, creating a favorable environment for the sustainable use of water resources [14]. Additionally, urbanization is often accompanied by economic development, which increases public attention to environmental protection. As residents’ living standards rise, environmental awareness gradually strengthens, and various sectors of society advocate more vigorously for water conservation and environmental protection [15]. Urban governments encourage residents and enterprises to participate in water-saving activities through incentive policies and public education, promoting community initiatives for rainwater utilization systems and wastewater recycling mechanisms. Finally, rapid urbanization facilitates the dissemination of knowledge and technology. Cities, as hubs of human activity, gather a wealth of talent and resources, fostering innovation and the sharing of best practices. This accelerates the spread and application of new green water technologies and management concepts, thereby enhancing overall water efficiency [16]. In summary, the first hypothesis of this paper is proposed as follows:
H1: 
Rapid urbanization is beneficial for improving green water efficiency in the Poyang Lake region.

2.2. Heterogeneous Analysis of the Impact of Rapid Urbanization on the Improvement in Green Water Efficiency

Although rapid urbanization contributes to the improvement in green water efficiency in the region, it is essential to explore the heterogeneous impacts of urbanization on green water efficiency, given that urbanization encompasses various dimensions, including population, industry, land, society, environment, and balance. Different dimensions of urbanization can lead to varying effects on green water efficiency. First, from the perspective of population and industry, the urbanization of population and industry often results in the concentration of water-intensive industries and increased water resource extraction, ultimately leading to significant wastewater discharges into water bodies, which decrease green water efficiency [17]. Second, regarding land, the large-scale development of farmland and wetlands during land urbanization reduces the area of natural water bodies and ecosystems, resulting in increased surface runoff and soil erosion, which further diminish green water efficiency [18].
In contrast, social and environmental urbanization have a positive impact on green water efficiency. From a social perspective, social urbanization emphasizes enhancing public awareness and community participation, which strengthens residents’ consciousness about water resource protection, making them more proactive in engaging in water-saving and environmental protection activities [19]. For example, through community collaboration, residents can jointly establish rainwater collection systems and optimize water management, fostering a positive social atmosphere that promotes sustainable water resource use. From an environmental perspective, environmental urbanization emphasizes the increase in green spaces and the implementation of ecological protection measures [20]. The addition of parks, green areas, and ecological wetlands in urban settings not only enhances biodiversity but also improves rainwater management by increasing rainwater infiltration and reducing runoff and pollution. This concept of promoting a harmonious coexistence between humans and nature aids in establishing a sustainable water resource management system, ultimately driving the improvement in green water efficiency. In summary, the second hypothesis of this paper is proposed as follows:
H2: 
Environmental urbanization and social urbanization are key ways to promote the improvement in green water efficiency in the Poyang Lake region, while population, land, and industrial urbanization do not contribute to the enhancement of green water efficiency in this area.

2.3. Analysis of the Channels through Which Rapid Urbanization Affects Green Water Efficiency

Rapid urbanization can enhance urban green water efficiency through several channels. First, upgrading infrastructure is a key pathway. As urban populations grow and economies develop, city governments often increase investments in water supply and drainage systems, constructing modern water networks and wastewater treatment facilities. These infrastructures not only effectively reduce water waste but also enable precise water management through smart meters and automated monitoring technologies that can detect leaks and unusual consumption in real time [21]. Second, technological innovation plays an important role in improving green water efficiency. The application of new technologies, such as efficient irrigation systems and water recycling techniques, can significantly reduce water consumption. For instance, precision irrigation technologies in agriculture and horticulture can supply water according to crop needs, preventing waste from over-irrigation. Additionally, the promotion of wastewater reuse technologies allows cities to use treated wastewater for landscaping and toilet flushing, further decreasing the demand for new water resources [22]. Finally, raising public awareness of participation is also crucial in this process. As urbanization progresses, residents become more concerned about environmental issues, fostering community engagement in water resource management. Many cities enhance their residents’ environmental awareness through community activities and educational campaigns, encouraging their involvement in water conservation and protection. Community collaboration not only helps establish local rainwater harvesting systems but also creates mechanisms for mutual supervision to ensure the effective implementation of green water measures [23]. Therefore, we propose the following third hypothesis:
H3: 
Rapid urbanization can promote the improvement in green water efficiency in the Poyang Lake region through three channels: upgrading urban infrastructure, enhancing technological innovation, and raising public environmental awareness.

2.4. Spatial Analysis of the Impact of Rapid Urbanization on Green Water Efficiency

The improvement in green water efficiency in a region as a result of rapid urbanization is primarily driven by factors such as infrastructure enhancement, technological innovation, and policy support. During the urbanization process, governments typically increase investments in water resource management, constructing modern water supply and wastewater treatment facilities, which improve water usage efficiency and management capabilities [24]. Additionally, technological innovations brought about by urbanization, such as the application of smart water meters and efficient irrigation systems, can effectively monitor and optimize water resource usage, reducing waste. However, this improvement is often confined to the local area and may have negative spillover effects on neighboring regions. First, the over-exploitation of water resources and increased demand in a local area may intensify competition for water sources with surrounding regions, limiting the availability of water resources in nearby areas. Second, increased industrial and domestic wastewater discharge associated with urbanization can lead to water pollution, with pollutants potentially flowing into adjacent regions, thereby lowering water quality and further impacting green water efficiency. Lastly, rapid urbanization, through land development and environmental degradation, weakens the natural water cycle capacity of the area, affecting the water conservation ability of surrounding regions. Overall, while rapid urbanization can improve green water efficiency in the local area, its negative spillover effects on neighboring areas—particularly in terms of resource competition and pollution diffusion—lead to a decline in green water efficiency in these regions [25]. This reasoning highlights the regional imbalances in urbanization development and calls for the consideration of interregional interactions when formulating policies to achieve broader sustainable development.
Based on the above, the fourth hypothesis of this paper is proposed as follows:
H4: 
Local rapid urbanization has a negative spillover effect on green water efficiency in neighboring regions.

3. Research Design and Model Construction Data Sources and Processing

3.1. Data Sources and Processing

This paper selects 11 prefecture-level cities in Jiangxi Province as the target for empirical research. Due to significant missing local data prior to 2008, and the absence of baseline data for DEA (Data Envelopment Analysis), the study period is set from 2004 to 2022. The data used in this paper primarily come from the Jiangxi Statistical Yearbook, China Industrial Statistical Yearbook, China Urban Statistical Yearbook, China Regional Economic Statistical Yearbook, and the statistical yearbooks or bulletins of the prefecture-level cities in Jiangxi, covering the period from 2010 to 2023.
In terms of data processing, the following measures were taken:
  • When certain variables had minor missing data, external interpolation was applied to fill in the missing values, ensuring data continuity;
  • GDP deflators and fixed asset deflators were used to adjust input and output indicators, respectively;
  • Since data on total social fixed asset investment in cities were only available until 2017, the data for 2018-2020 were calculated using the fixed asset investment growth rates from local statistical bulletins;
  • To avoid errors in the assignment of weights, the arrangement of spatial weight data and the sequence of panel data for each entity were carefully matched beforehand.

3.2. Variable Definition

(1)
Explained Variable: Green Water Efficiency (Green)
Drawing on the methods of Meng et al. (2016) [26], this study uses global green water efficiency measured by a data envelopment analysis (DEA) model under the most productive scale reference. The DEA model calculates green water efficiency based on the maximum distance from the most productive frontier. The reasons for using this approach are as follows:
  • The indicator derived from the DEA model is a composite indicator, which compensates for the bias of single-indicator measurements, providing a more comprehensive assessment of both the process and outcome of industrial green water efficiency;
  • The DEA model does not require a priori assumptions about functional relationships, allowing for a better analysis of green water efficiency based on the characteristics of the data;
  • The DEA model based on the most productive frontier relaxes the proportional input–output change constraints of conventional DEA, making it more suitable for handling undesirable output effects. The specific formula for calculating industrial green water efficiency is as follows:
ρ * = min 1 + 1 m m = 1 M s rm x / x i 0 1 - 1 n 1 + n 2 [ n 1 = 1 N 1 ( s r n 1 g / y r n 1 g ) ] + n 1 = 1 N 2 ( s r n 2 b / y r n 2 b ) ]   S . t . { x 0 = X λ + s t y 0 g = Y g λ s g y 0 b = Y b λ + s b s t , s g , s b , λ 0 m = 1 , 2 , , M ; n 1 = 1 , 2 , N 1 ; n 2 = 1 , 2 , N 2
M ( x t , y t , x t + 1 , y t + 1 ) = ( M t M t + 1 ) 1 2 = [ D r t ( x t + 1 , y t + 1 ) D r t + 1 ( x t + 1 , y t + 1 ) D r t ( x t , y t ) D r t + 1 ( x t , y t ) ] 1 2
The text in the image can be translated as follows:
In Equation (3), x r t , y r g t , y r b t represent the input variables, desirable output variables, and undesirable output variables of decision-making unit r at time t , respectively. Denote the input–output slack variable set as D r t = ( x r t , y r g t , y r b t ) . The slack variables s r x , s r g , s r b represent the slack for the input, desirable output, and undesirable output of decision-making unit r, respectively where m, n1, and n2 are the counts for input, desirable output, and undesirable output factors, and p* represents the optimal solution. When p * ≧ 1 and s r x = 0 , s r g = 0 , s r b = 0 , the decision-making unit (DMU) is considered strongly efficient. Otherwise, the slack variables need to be adjusted and optimized. To account for the issue of cross-period efficiency changes in calculating efficiency changes from period t to t + 1 , and to avoid random errors caused by selection bias across periods, the Malmquist–Luenberger index is introduced, including undesirable outputs. The calculation method is shown in Equation (4).
In terms of indicator variable selection, input variables are chosen from three perspectives: capital, labor, and energy. The specific variable names and measurement methods are listed in Table 1.
(2)
Core Explanatory Variable: Rapid Urbanization (Urbanization)
Since rapid urbanization involves multiple dimensions such as “population, industry, land, society, environment, and balance”, using a single indicator is not comprehensive. Therefore, following the method of Hong et al. (2024) [27], rapid urbanization is quantified based on six dimensions: “population, industry, land, society, environment, and balance”. The measurement process is divided into three steps. First, to account for temporal differences, the entropy weight method is used to determine the weights of secondary indicators each year. Second, the threshold method is applied to standardize the secondary indicator data. Third, the standardized secondary indicator data are multiplied by their respective weights from each year, and the comprehensive urbanization scores for each region are aggregated. The calculation method is shown in Table 2.
To clarify the causal relationship between rapid urbanization and industrial green water efficiency in the Poyang Lake urban agglomeration, this study draws on the research of Liu et al. (2023), Iakovoglou et al. (2013), and Koutalakis et al. (2023) to select a series of control variables to eliminate confounding factors [28,29,30]. The specific variables and their definitions are shown in Table 3.

3.3. Baseline Regression Model

In order to analyze the impact of rapid urbanization on industrial green water use efficiency in the Poyang Lake City cluster, the following basic measurement model was constructed:
Green i t = β 0 + α 1 Urbanization i t + α 2 Controls i t + μ i + λ t + ε i t
Among them, Greenit is the explained variable, representing the industrial green water use efficiency of the i city in the t year. Urbanizationit, as the explanatory variable, represents the rapid urbanization index of the i city in the t year. Here, urbanization is not represented by a single index but by multiple side indexes. Controlsit is a selection of control variables, μi is the city fixed effect, λt is the time fixed effect, and εit is the random winding term. The city fixed effect can solve the problem of missing variables that do not change with time but vary with individuals, and the time fixed effect can solve the problem of the remaining variables that do not change with individuals but change with time. When processing panel model data, whether fixed effect model or random effect model should be used needs to be further tested.

3.4. Spatial Model

The impact of rapid urbanization on industrial water use efficiency can be realized through the spatial spillover effect. The spatial agglomeration of industry and population in the region will produce a siphon effect and a trickle-down effect on the surrounding areas, and the industrial green water use efficiency in the region will spread to the surrounding areas. Considering that the industrial green water use efficiency of each city in the Poyang Lake City cluster may be affected by other regions outside the local area, in order to avoid the bias caused by the influence of spatial factors, this paper adopts the spatial Durbin model to comprehensively consider the spatial factors and test the relationship between rapid urbanization and industrial green water use efficiency in the Poyang Lake City cluster again. The spatial model has a more general form than the spatial error and spatial autoregression model, which can effectively distinguish spatial echo from spatial overflow. The spatial Durbin model is constructed as follows:
Green it = δ 0 + ρ j j i 11 W ij Green i t + θ 1 Urbanization it + θ 2 Controls it + θ 3 j j i 11 W ij Urbanization it + θ 4 j j i 11 W i j Controls i t + μ i + λ t + ε it
Among them, ρ measures the spatial autocorrelation effect of carbon emission performance. θ1 and θ2, respectively, measure the effects of rapid urbanization and related control variables on industrial green water efficiency in the region. θ3 and θ4, respectively, measure the spatial effects of rapid urbanization and related control variables on urban industrial green water efficiency. Wij is the weight matrix of the spatial Durbin model, jWij reflects the spatial connection between region i and the other regions. In this paper, the Queen matrix based on urban boundary adjacency is used to measure Wij.

3.5. Descriptive Statistics

Table 4 reports the descriptive statistics of the main variables. The mean value of regional green water efficiency (Green) is 0.73, which is higher than the median value of 0.651, indicating a positively skewed distribution. This distribution suggests that most cities in the Poyang Lake region have low green water efficiency, implying that green water efficiency in the region still requires improvement. Additionally, the maximum and minimum values of regional green water efficiency are 1.43 and 0.7, respectively, with a standard deviation of 0.15, indicating a significant variation in green water efficiency across different cities. The mean value of rapid urbanization (Attention) is 0.39, which is higher than the median value of 0.38, indicating a negatively skewed distribution. Moreover, the maximum and minimum values of rapid urbanization are 0.85 and 0.38, respectively, which highlight the uneven levels of rapid urbanization across different areas within the Poyang Lake urban agglomeration. Finally, the characteristics of the selected control variables align with those found in the existing literature and fall within a reasonable range, suggesting that the study sample is representative to a certain extent.

4. Estimation Results and Discussion

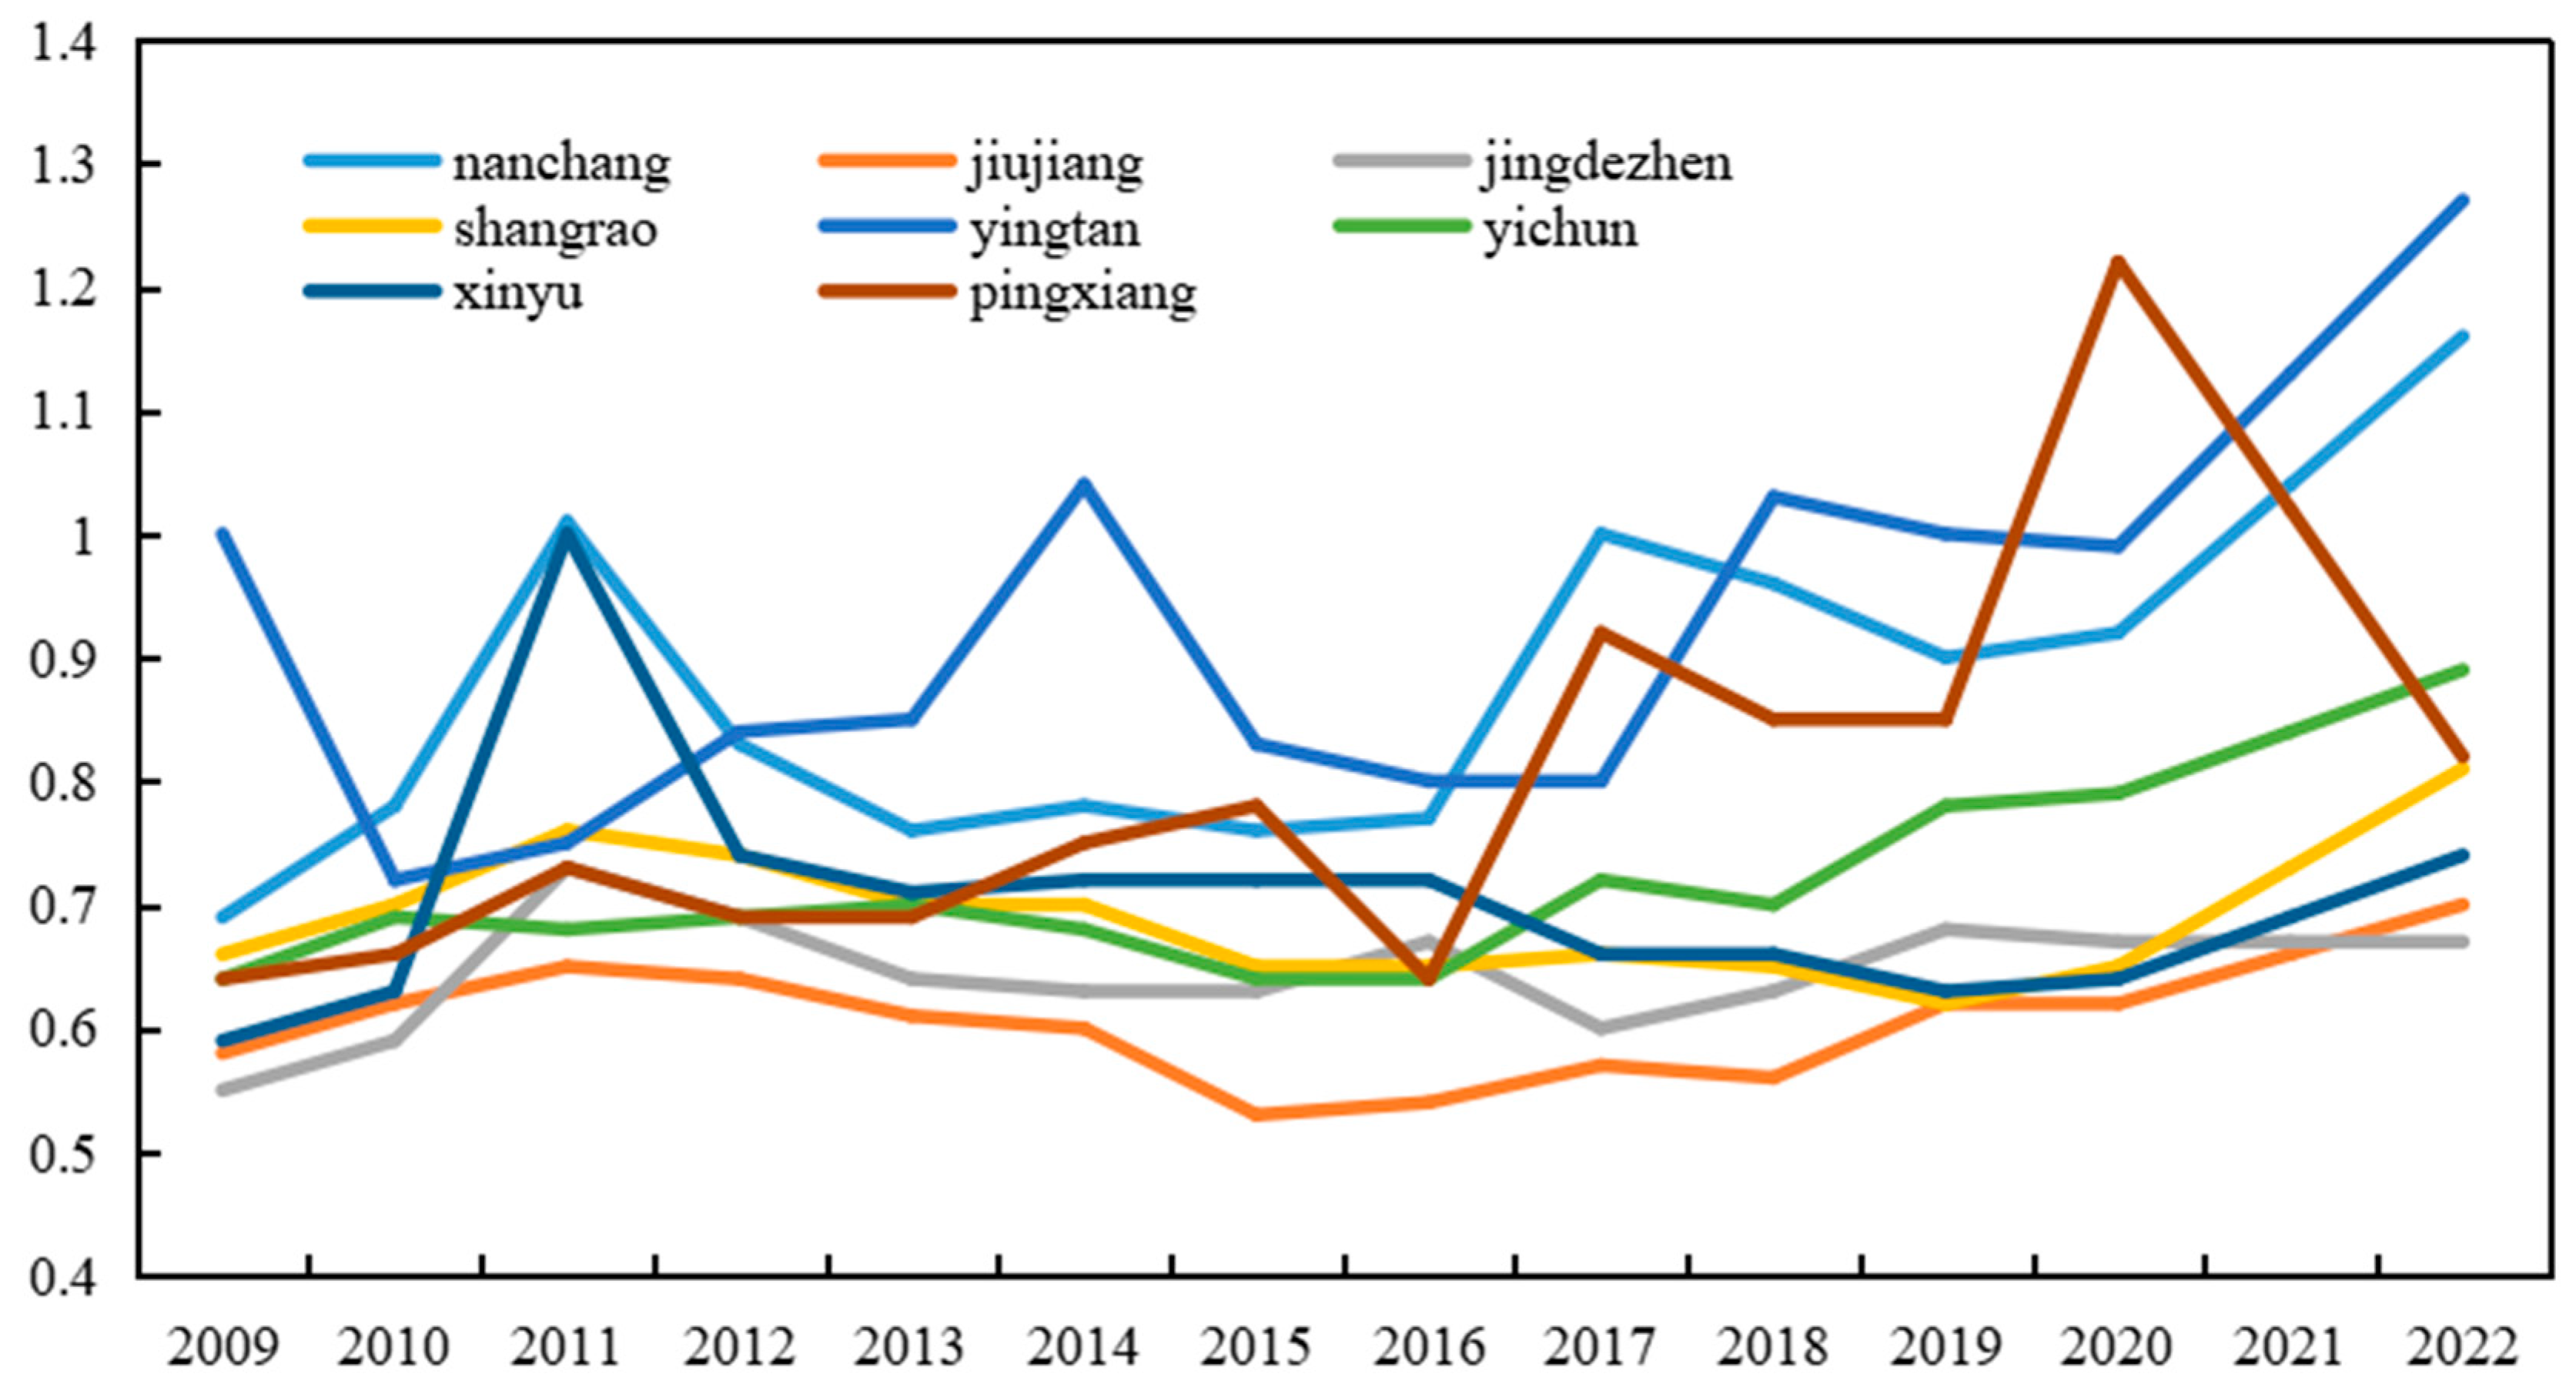
4.1. Analysis of Green Water Efficiency Characteristics

Figure 2 and Figure 3 show the green water efficiency of non-Poyang Lake and Poyang Lake urban agglomerations from 2009 to 2022. It can be observed that: First, there are significant time-dimension differences in green water efficiency between cities within the Poyang Lake urban agglomeration (such as Nanchang, Jiujiang, and Jingdezhen) and cities outside the agglomeration (Ganzhou, Ji’an, and Fuzhou). In particular, cities within the agglomeration have steadily improved their green water efficiency since 2009. For instance, cities like Nanchang and Yingtan saw noticeable improvements in green water efficiency after 2011, with most cities surpassing an efficiency level of one by 2022, indicating a high level of green development. In contrast, cities outside the Poyang Lake agglomeration were slower to improve their green water efficiency. For example, Ji’an and Fuzhou had relatively low green efficiency before 2010. However, starting in 2011, and especially after 2020, Ganzhou quickly improved its efficiency to 1.09 by 2021, approaching the levels of leading cities within the agglomeration. Second, when comparing the longitudinal regional trends, the fluctuation in green water efficiency between cities inside and outside the Poyang Lake agglomeration is also evident. Cities within the agglomeration show relatively small fluctuations, while cities outside it exhibit larger volatility. For instance, non-agglomeration city of Ganzhou peaked in 2011 before declining and then rising again after 2020. Finally, based on the overall trend comparison, although cities outside the agglomeration started improving their green water efficiency later, their growth rate has accelerated in recent years, gradually converging toward the efficiency levels of cities within the Poyang Lake agglomeration.

4.2. Baseline Regression Analysis

Table 5 presents the regression results of the baseline model. First, examining the results in column (1), it is evident that the coefficient of rapid urbanization (Urbanization) is positive and statistically significant at the 1% level. This indicates that rapid urbanization in the Poyang Lake region contributes to the improvement in regional green water efficiency, thus confirming Hypothesis 1.
Further, after deconstructing the urbanization level dimensions and running the regression, we found that the coefficients for population urbanization (Population), industrial urbanization (Industrial), and land urbanization (Land) are all negative, although not statistically significant at the 10% level in a two-sided test. This suggests, at least from an economic perspective, that the excessive expansion of population size, enterprise numbers, and land development during the rapid urbanization process do not contribute to the improvement in industrial green water efficiency in the Poyang Lake urban agglomeration. Next, examining the results in columns (4) and (5), the coefficients for social urbanization (Social-urbanization) and environmental urbanization (Environmental-urbanization) are both positive and statistically significant at least at the 10% level. This indicates that, during the rapid urbanization process, focusing on social equity and ecological quality is beneficial for the improvement in industrial green water efficiency in the Poyang Lake urban agglomeration.
Finally, in column (6), the coefficient for balanced urbanization (Balanced-urbanization) is positive but not statistically significant at the 10% level in a two-sided test. This implies, from an economic standpoint, that balanced and coordinated urbanization development is conducive to improving industrial green water efficiency in the Poyang Lake urban agglomeration during the rapid urbanization process. Therefore, Hypothesis 2 is also confirmed.

4.3. Robustness Analysis

The baseline regression confirmed the positive effect of rapid urbanization on regional green water efficiency. Although we incorporated a wide range of control variables and fixed effects throughout this process, potential biases may still exist. To ensure that the baseline regression results are not influenced by data processing methods, measurement, or sample selection biases, a series of robustness tests were conducted to revalidate the conclusions of the baseline regression. The test results are shown in Table 6.
(1)
Testing by Excluding Special Year Samples
Given that certain shock events during the study period had significant impacts on economic activity, government policies, and corporate behavior, which may have disrupted the normal trends in corporate carbon emissions, we excluded samples from four major exogenous shock years: the 2008 Beijing Olympics, the 2013 “Air Pollution Prevention and Control Action Plan”, and the 2020 public health event. We then re-estimated the model based on the baseline regression, and the results are shown in column (1) of Table 6. The results indicate that after excluding the special year samples, the coefficient of rapid urbanization remains significantly positive at the 1% statistical level, indicating that the baseline regression conclusion remains unchanged.
(2)
Testing by Changing the Missing Data Imputation Method
Considering that the extrapolation method often performs poorly when predicting extreme values (such as very large or small values outside the dataset), as it cannot accurately capture the potential extreme behavior or boundary effects of the data, we used the exponential interpolation method to refill the missing data. The results are shown in column (2) of Table 6. The results indicate that after changing the missing data imputation method, the coefficient of rapid urbanization remains significantly positive at the 5% statistical level, demonstrating that the baseline regression conclusion remains unchanged.
(3)
Testing to Mitigate the Interference of Control Variables
Given that the current control variables may be correlated with local government environmental attention, potentially affecting the baseline regression estimates, we lagged all control variables by one period and re-ran the baseline model to examine the impact of rapid urbanization on urban green water efficiency. The results are shown in column (3) of Table 6. The results indicate that after mitigating the interference of control variables, the coefficient of rapid urbanization remains significantly positive at the 1% statistical level, confirming that the baseline regression conclusion remains unchanged.
(4)
Testing by Changing the Estimation Method
Since the presence of a serial correlation in the error terms would render OLS estimates inefficient, we re-estimated the baseline model using the Generalized Least Squares (GLS) method, which provides more flexibility in handling the variance–covariance structure. The results are shown in column (4) of Table 6. The results indicate that after changing the estimation method, the coefficient of rapid urbanization remains significantly positive at the 1% statistical level, showing that the baseline regression conclusion remains unchanged.
(5)
Testing by Changing the Measurement Method of the Dependent Variable
Considering that the output-oriented SBM (slacks-based measure) model used for measurement might not be robust, we re-measured green water efficiency using an input-oriented SBM model and performed the regression again. The results are shown in column (5) of Table 6. The results indicate that after changing the measurement method of the dependent variable, the coefficient of rapid urbanization remains significantly positive at the 1% statistical level, reaffirming that the baseline regression conclusion remains unchanged.

4.4. Rapid Urbanization and Green Water Efficiency: Channel Effect Analysis

The results from the baseline regression and robustness analysis have demonstrated that rapid urbanization contributes to the improvement in green water efficiency in the Poyang Lake region. However, a question that remains unanswered is through which channels does rapid urbanization impact urban green water efficiency? The theoretical analysis suggests that rapid urbanization can improve green water efficiency by enhancing urban infrastructure, promoting innovation, and raising public environmental awareness. The following sections will verify this.
First, following the approach of Zeng et al. (2023) [31], fixed asset investment in the city’s region is used as a proxy variable for the level of urban infrastructure and is incorporated into the baseline model for regression testing. The results are shown in column (1) of Table 7 The findings indicate that the coefficient of rapid urbanization is significantly positive at the 1% statistical level, suggesting that rapid urbanization can enhance green water efficiency by improving the level of infrastructure in the region. Therefore, the infrastructure channel is validated.
Second, borrowing the method of Gao et al. (2024) [32], patent applications in the city’s region are used as a proxy variable for the level of technological innovation, and this is introduced into the baseline model for regression testing. The results are shown in column (2) of Table 8. The results indicate that the coefficient of rapid urbanization is significantly positive at the 1% statistical level, indicating that rapid urbanization can improve green water efficiency by enhancing technological innovation in the region. Thus, the technological innovation channel is validated.
Finally, drawing on the approach of Yu and Jin (2022) [33], the Baidu search index for the keyword “environmental protection” in the city’s region is used as a proxy variable for public environmental awareness and is included in the baseline model for regression testing. The results are shown in column (3) of Table 8. The findings reveal that the coefficient of rapid urbanization is significantly positive at the 1% statistical level, suggesting that rapid urbanization can improve green water efficiency by raising public environmental awareness in the region. Hence, the public environmental awareness channel is validated.
In summary, Hypothesis 3 is confirmed.

4.5. Rapid Urbanization and Spatial Regression of Industrial Water Use Efficiency

The analysis in the previous four sections has verified the impact of rapid urbanization on green water efficiency and its mechanisms. However, considering that the urbanization process often involves the spatial flow of factors, examining the effects of rapid urbanization solely within individual administrative regions may be incomplete. The theoretical analysis has also explored this issue preliminarily, so a spatial econometric model is used here for further verification.
The first step in verifying the necessity of a spatial econometric model is to test whether the dependent variable exhibits a spatial correlation. Therefore, a weight matrix extended over time (T = 12) is used to examine the spatial correlation of green economic efficiency in the panel data context (as shown in Table 8). The test results show that the global Moran’s Index is significantly positive, indicating that there is a high level of spatial correlation in green economic efficiency across regions, which justifies the use of spatial econometrics.
Secondly, we referred to Elhorst’s LM test method to judge which spatial model is more suitable for the empirical research in this paper (as shown in Table 9). The test results show that explanatory variables and random error terms in the existing models are significantly spatially correlated, so spatial Durbin model (SDM) is more appropriate.
Third, since the conventional spatial Durbin model does not investigate the spatial exogenous impact from random errors, and due to the limitations of endogenous control (especially missing variables) in control experiments, the existence of exogenous spatial errors needs to be further investigated (as shown in Table 10). Based on the AIC and BIC test rules, it is found that the AIC and BIC values after adding the spatial effect of the error term (GNS) are greater than the test results of the Durbin model (SDM), so it is more appropriate to use the spatial Durbin model as an empirical model.
Finally, since the spatial weighting coefficient under the point estimation cannot separate the two spatial effects, direct effect and indirect effect, in order to accurately distinguish the two spatial effects, this paper refers to the design method of LeSage (2009) and uses partial differential decomposition to divide the spatial effects [34]. Among them, the direct effect measures the change in the local dependent variable caused by the influence of the spatial spillover back to the local echo. The indirect effect measures the spatial conduction effect of the change in independent variables in other regions on the local dependent variables. Table 11 shows the estimated results of spatial effect decomposition.

4.6. Heterogeneity Test

When selecting the research area, we referred to the Plan for Poyang Lake Ecological Economic Zone approved by The State Council in 2009 and follow the Plan for Ecological Urban Agglomeration around Poyang Lake (2015–2030) formulated by the Jiangxi Provincial Government in 2016. This study selected Nanchang, Jingdezhen, Pingxiang, Jiujiang, Xinyu, Yingtan, Yichun, Shangrao, and eight other cities as the research area of the Poyang Lake urban agglomeration. In addition, this paper also discusses the relationship between urbanization and industrial green water efficiency in Jiangxi Province and non-Poyang Lake urban agglomerations. Table 12 shows the heterogeneity test of the basic regression model. Non-Poyang Lake urban agglomerations mainly cover Ganzhou, Ji’an, Fuzhou, and other cities. In recent years, the water environment and water ecology of Poyang Lake have been severely impacted. The urban agglomeration around Poyang Lake is more stringent in terms of ecological environment governance and urban industrial land use, while the non-urban agglomeration around Poyang Lake may show different rules of action.

5. Result Discussion

5.1. Industrial Green Water Efficiency Analysis

In terms of the overall development trend, the industrial water use efficiency of the urban agglomeration around Poyang Lake showed an overall trend of improvement, with the average green water use efficiency improving from 0.668 to 0.847. The water use efficiency of non-Poyang Lake cities such as Ganzhou, Ji’an, and Fuzhou also showed great improvement, and the industrial green water efficiency of central cities such as Nanchang and Ganzhou had the greatest improvement. During the study period, the per capita GDP of Jiangxi Province increased from CNY 17,277 in 2009 to CNY 65,560 in 2021. Industrial water use efficiency and economic development level are generally positively linked, and the industrial structure is evolving due to technological innovation and structural upgrading from early- to middle-stage industrialization to late- and post-industrialization stages. The performance of water resources utilization and water pollution reduction has been continuously improved. In terms of regional spatial differences, the industrial green water efficiency of Nanchang, Ganzhou, Yingtan, and other cities is at the first level. These cities rank high in economic aggregate or have a high level of economic development, and the concentration of technological innovation factors and high-level talents plays a positive role. However, the industrial green water efficiency of the urban agglomeration around Poyang Lake is slightly lower than that of the non-Poyang Lake cities. As an important region that undertakes the industrial transfer of the eastern coastal areas, the urban agglomeration around Poyang Lake is obviously relatively superior in terms of transportation infrastructure, water resource endowment, industrial base and human capital. In terms of the convergence of spatial differences, the industrial green water efficiency of the urban agglomeration around Poyang Lake or the whole Jiangxi Province showed a divergent trend. Cities competed fiercely in the process of industrialization or undertaking industrial transfer, and had different resource endowments and regional discourse rights, which eventually led to a significant widening of the gap between cities in industrial water conservation and emission reduction.

5.2. Analysis of Benchmark Regression Results

According to the regression results of rapid urbanization and industrial green water use efficiency in the Poyang Lake City cluster (as shown in Table 5), industrial urbanization has a significant negative effect on industrial green water use efficiency; social urbanization, environmental urbanization, and balanced urbanization have a significant positive effect; and population urbanization and land urbanization have no significant effect. The evolution of industrial structure generally shows a process of industrialization first increasing and then decreasing. The Poyang Lake city cluster is a subsidence area of economic development in central China and a key area to undertake the industrial transfer of the Yangtze River Delta and the Pearl River Delta. In a period of rapid industrialization, resource consumption and pollution emission will increase. Many experts have confirmed that the dual control of water saving and emission reduction can only be realized when industrialization reaches a certain stage, which is consistent with the environmental Kuznets curve theory and pollution refuge theory. To a certain extent, social urbanization and environmental urbanization represent the quality of new-type urbanization. Perfect social security can attract more high-level technical talents to gather and improve public services and urban green level to provide a good living environment to a high-quality labor force. The primary stage of urbanization is mainly focused on population expansion and urban expansion. In the middle and later stages of urbanization, the focus is on internal quality improvement, which is conducive to the improvement in water use efficiency. Balanced urbanization requires the integration of urban and rural development and the equalization of public services. Balanced urban and rural development can improve the green utilization of resources through factor accumulation, industrial upgrading, market development, management norms, and environmental protection awareness. However, the urban–rural dual structure leads to poor circulation of production factors, unable to allocate resources and industrial layout in a larger scope, hindering the development of rural non-agricultural industries and nearby urbanization, and thus negatively affecting industrial green water use efficiency. The rapid expansion of population urbanization and land urbanization has not shown a significant green effect, which promotes the intensive utilization of some factors while aggravating resource consumption and environmental pollution. Many people become part of the urban population passively due to land expropriation and a lack of skills and cannot improve the level of green economic development in the short term.

5.3. Spatial Effect Decomposition Analysis

After considering the influence of spatial factors (as shown in Table 11), there is a significant local effect of population urbanization, a significant positive spatial spillover effect of industrial urbanization, a significant positive spatial spillover effect of environmental urbanization, and a significant local effect of balanced urbanization. Water environmental pollution is naturally diffused at the spatial basin level. While Poyang Lake provides water resources for the development of these cities, many pollution-intensive industries will inevitably exert excessive burden on the water environment of the basin. Many studies have confirmed that industrial agglomeration has a strong spatial spillover effect: industrial development requires supporting upstream and downstream industries; leading enterprises can lead the agglomeration of related enterprises to generate economies of scale; diversified agglomeration can improve the utilization efficiency of water environment treatment facilities; and specialized agglomeration can carry out green technology innovation for specific industries. Functional division within urban agglomerations can promote the external economy and economies of scale, and spatial concentration of economic activities is conducive to reducing environmental pollution emissions, thus improving the industrial green water use efficiency of the Poyang Lake urban agglomerations. Environmental urbanization can generate a spatial spillover to surrounding cities through a demonstration effect and a benchmarking effect. In particular, environmental access and pollution emission standards, green city construction, and technology adoption of central cities will have a positive effect on industrial enterprises in non-central cities, and industries undertaken by central cities will further spill over to surrounding non-central cities. While environmental punishment and environmental protection interview will have a deterrent effect on surrounding cities, environmental performance assessment and civilized city evaluation will form a competitive comparison effect in the urban agglomeration around Poyang Lake. Local governments will gradually shift from the one-dimensional competition for economic growth to the diversified competition for environmental protection and people’s livelihood improvement.

5.4. Robust and Heterogeneous Analysis

According to the robustness test of the basic regression model (as shown in Table 6), the regression coefficient and significance level of the industrial green water efficiency with input guidance and non-guidance replaced by the explanatory variable are basically consistent, which again shows the effectiveness and robustness of the model construction and index selection. In the heterogeneity analysis model (as shown in Table 12), among 11 samples of prefecture-level cities in Jiangxi Province, social urbanization, environmental urbanization, and balanced urbanization still have significant positive effects, while industrial urbanization still shows negative effects in the economic sense, although it fails to pass the significance test. In the sample regression of non-Poyang Lake urban agglomerations, none of the six aspects of rapid urbanization passed the significance test, which may be caused by a too small sample size on the one hand, and the different ecological environment positioning of the three cities in southern Jiangxi on the other hand.

6. Conclusions

The urban agglomeration around Poyang Lake has become a key area in undertaking the industrial transfer in the eastern coastal area, and the spatial agglomeration of industries and population will inevitably bring great pressure on water supply environment management and water resources utilization. Therefore, it is of important practical value to explore the industrial green water use efficiency of rapid urbanization. Considering the non-expected output of water resources utilization in industrial production, this paper adopts the SE-SBM model to measure industrial green water use efficiency, taking into account different aspects of rapid urbanization in the Poyang Lake urban agglomeration, and empirically tests the inhibiting effect of rapid urbanization on industrial green water use efficiency. A spatial metering panel model was constructed to explore the spatial spillover effect of rapid urbanization on green water use efficiency. The results show that (1) the trend of industrial green water use efficiency in the urban agglomeration around Poyang Lake is significant, and the difference in water use efficiency between central cities and non-central cities is large and presents a divergence trend; (2) social urbanization, environmental urbanization and balanced urbanization can significantly improve industrial green water use efficiency, while industrial urbanization or industrialization inhibits the improvement in water use efficiency at the present stage, and the effect of population urbanization and land urbanization is not significant; (3) considering the spatial factors, population urbanization has significant local effects, industrial urbanization and environmental urbanization have significant positive spatial spillover effects, and balanced urbanization has significant local effects; (4) replacing the explained variables with other measurement models of industrial green water use efficiency can pass the robustness test and expand the study area to the whole Jiangxi Province. The impact of rapid urbanization on industrial green water use efficiency is basically consistent.
To promote green urban development and industrial water conservation in the Poyang Lake region, the following specific measures can be taken:
First, establish green skills training programs for local residents, focusing on cultivating talent in environmental protection technologies, renewable energy utilization, and ecological agriculture, to improve the quality of the workforce. Second, create green industrial parks centered on renewable energy and the manufacturing of environmental protection equipment, encouraging companies to conduct research and development in water treatment and conservation technologies, thereby driving the local economy toward green transformation.
Additionally, industrial and residential areas should be planned according to water resource distribution, ensuring the balanced allocation of water between industrial and residential use to avoid overburdening the environment. Public services in urban clusters should be enhanced by adding green transportation infrastructure (such as pedestrian and bicycle paths) to encourage low-carbon travel and reduce pollution through optimized public transportation systems.
On the policy front, financial subsidies and loans should be provided to support the development of ecological agriculture and circular economy projects in rural areas, encouraging farmers to engage in green economic activities. Finally, establish inter-county collaboration mechanisms for water resource management within the region, setting unified standards for water pollution prevention to ensure water quality safety. At the same time, leverage the ecological advantages of Poyang Lake to develop eco-tourism, driving the overall enhancement of the local green economy.

Author Contributions

Conceptualization, H.L. and X.Z.; methodology, X.D.; software, H.L.; validation, X.Z., X.D. and R.Z.; formal analysis, H.L.; investigation, X.Z.; resources, H.L.; data curation, R.Z.; writing—original draft preparation, H.L; writing—review and editing, X.Z. and X.D.; visualization, R.Z.; supervision, X.Z.; project administration, H.L. and X.D.; funding acquisition, X.D. All authors have read and agreed to the published version of the manuscript.

Funding

Humanities and Social Sciences Foundation of the Ministry of Education (Grant No. 21YJC790021).

Institutional Review Board Statement

Not applicable.

Informed Consent Statement

Not applicable.

Data Availability Statement

The data used in this paper primarily come from the Jiangxi Statistical Yearbook, China Industrial Statistical Yearbook, China Urban Statistical Yearbook, China Regional Economic Statistical Yearbook, and the statistical yearbooks or bulletins of the prefecture-level cities in Jiangxi province.

Conflicts of Interest

The authors declare no conflict of interest.

References

  1. Macklin, M.G.; Lewin, J. The rivers of civilization. Quat. Sci. Rev. 2015, 114, 228–244. [Google Scholar] [CrossRef]
  2. Luo, K.; Hu, X.; He, Q.; Wu, Z.; Cheng, H.; Hu, Z.; Mazumder, A. Impacts of rapid urbanization on the water quality and macroinvertebrate communities of streams: A case study in Liangjiang New Area, China. Sci. Total Environ. 2018, 621, 1601–1614. [Google Scholar] [CrossRef]
  3. Wan, H.; He, G.; Li, B.; Zeng, J.; Cai, Y.; Shen, X.; Yang, Z. Coupling coordination relationship between urbanization and water environment in China. J. Clean. Prod. 2024, 472, 143423. [Google Scholar] [CrossRef]
  4. Rashid, M.A.U.H.; Manzoor, M.M.; Mukhtar, S. Urbanization and its effects on water resources: An exploratory analysis. Asian J. Water Environ. Pollut. 2018, 15, 67–74. [Google Scholar] [CrossRef]
  5. Abraha, T.; Tibebu, A.; Ephrem, G. Rapid urbanization and the growing water risk challenges in Ethiopia: The need for water sensitive thinking. Front. Water 2022, 4, 890229. [Google Scholar] [CrossRef]
  6. Chen, X.; Li, Z.; Chao, L.; Hao, Y.; Wang, Y.; Liang, R.; Li, K.; Pu, X. Conflict between urbanization and water environmental protection: Lessons from the Xiangjiang River Basin in China. Water Res. 2024, 252, 121237. [Google Scholar] [CrossRef]
  7. Zhou, Q.; Tong, C. Does rapid urbanization improve green water-use efficiency? Based on the investigation of Guangdong prov-ince, China. Sustainability 2022, 14, 7481. [Google Scholar] [CrossRef]
  8. Ding, X.; Fu, Z.; Jia, H. Study on urbanization level, urban primacy and industrial water utilization efficiency in the Yangtze River Economic Belt. Sustainability 2019, 11, 6571. [Google Scholar] [CrossRef]
  9. Lu, W.; Sarkar, A.; Hou, M.; Liu, W.; Guo, X.; Zhao, K.; Zhao, M. The impacts of urbanization to improve agriculture water use efficiency—An empirical analysis based on spa-tial perspective of panel data of 30 provinces of China. Land 2022, 11, 80. [Google Scholar] [CrossRef]
  10. Guo, Y.; Ren, Z.; Wang, C.; Zhang, P.; Ma, Z.; Hong, S.; Hong, W.; He, X. Spatiotemporal patterns of urban forest carbon sequestration capacity: Implications for urban CO2 emission mitigation during China’s rapid urbanization. Sci. Total Environ. 2024, 912, 168781. [Google Scholar] [CrossRef]
  11. Salomons, E.; Sela, L.; Housh, M. Hedging for privacy in smart water meters. Water Resour. Res. 2020, 56, e2020WR027917. [Google Scholar] [CrossRef]
  12. Latif, M.; Haider, S.S.; Rashid, M.U. Adoption of high efficiency irrigation systems to overcome scarcity of irrigation water in Pakistan: Adoption of high efficiency irrigation systems. Proceedings of the Pakistan Academy of Sciences: B. Life Environ. Sci. 2016, 53, 243–252. [Google Scholar]
  13. Campisano, A.; Butler, D.; Ward, S.; Burns, M.J.; Friedler, E.; DeBusk, K.; Fisher-Jeffes, L.N.; Ghisi, E.; Rahman, A.; Furumai, H.; et al. Urban rainwater harvesting systems: Research, implementation and future perspectives. Water Res. 2017, 115, 195–209. [Google Scholar] [CrossRef]
  14. Cardinale, B.J. Biodiversity improves water quality through niche partitioning. Nature 2011, 472, 86–89. [Google Scholar] [CrossRef]
  15. Seelen, L.M.; Flaim, G.; Jennings, E.; Domis, L.N.D.S. Saving water for the future: Public awareness of water usage and water quality. J. Environ. Manag. 2019, 242, 246–257. [Google Scholar] [CrossRef]
  16. Wu, Z.; Liu, D.; Mei, Y.; Guo, S.; Xiong, L.; Liu, P.; Yin, J.; Zeng, Y. Delayed feedback between adaptive reservoir operation and environmental awareness within water supply-hydropower generation-environment nexus. J. Clean. Prod. 2022, 345, 131181. [Google Scholar] [CrossRef]
  17. Jia, C.; Yan, P.; Liu, P.; Li, Z. Energy industrial water withdrawal under different energy development scenarios: A multi-regional approach and a case study of China. Renew. Sustain. Energy Rev. 2021, 135, 110224. [Google Scholar] [CrossRef]
  18. Guzha, A.; Rufino, M.; Okoth, S.; Jacobs, S.; Nóbrega, R. Impacts of land use and land cover change on surface runoff, discharge and low flows: Evidence from East Africa. J. Hydrol. Reg. Stud. 2018, 15, 49–67. [Google Scholar] [CrossRef]
  19. Benameur, T.; Benameur, N.; Saidi, N.; Tartag, S.; Sayad, H.; Agouni, A. Predicting factors of public awareness and perception about the quality, safety of drinking water, and pollution incidents. Environ. Monit. Assess. 2022, 194, 22. [Google Scholar] [CrossRef]
  20. Tan, X.; Sun, X.; Huang, C.; Yuan, Y.; Hou, D. Comparison of cooling effect between green space and water body. Sustain. Cities Soc. 2021, 67, 102711. [Google Scholar] [CrossRef]
  21. Morris, J.C. Planning for water infrastructure: Challenges and opportunities. Public Work. Manag. Policy 2017, 22, 24–30. [Google Scholar] [CrossRef]
  22. Wehn, U.; Montalvo, C. Exploring the dynamics of water innovation: Foundations for water innovation studies. J. Clean. Prod. 2018, 171, S1–S19. [Google Scholar] [CrossRef]
  23. Wang, L.; Zhang, L.; Lv, J.; Zhang, Y.; Ye, B. Public awareness of drinking water safety and contamination accidents: A case study in Hainan Province, China. Water 2018, 10, 446. [Google Scholar] [CrossRef]
  24. Liu, D.; Zhang, Y.; Yang, Q.; Li, Y.; Li, J.; Liao, X. Fate of ofloxacin in rural wastewater treatment facility: Removal performance, pathways and microbial characteristics. Bioresour. Technol. 2023, 371, 128611. [Google Scholar] [CrossRef]
  25. Chen, W.; Wang, G.; Yang, L.; Huang, C.; Xu, N.; Gu, T.; Zeng, J. Spillover effects of urbanization on carbon emissions: A global view from 2000 to 2019. Environ. Impact Assess. Rev. 2023, 102, 107182. [Google Scholar] [CrossRef]
  26. Meng, X.Z.; Venkatesan, A.K.; Ni, Y.L.; Steele, J.C.; Wu, L.L.; Bignert, A.; Bergman, Å.; Halden, R.U. Organic contaminants in Chinese sewage sludge: A meta-analysis of the literature of the past 30 years. Environ. Sci. Technol. 2016, 50, 5454–5466. [Google Scholar] [CrossRef]
  27. Hong, W.; Ren, Z.; Guo, Y.; Wang, C.; Cao, F.; Zhang, P.; Hong, S.; Ma, Z. Spatiotemporal changes in urban forest carbon sequestration capacity and its potential drivers in an urban agglomeration: Implications for urban CO2 emission mitigation under China’s rapid urbanization. Ecol. Indic. 2024, 159, 111601. [Google Scholar] [CrossRef]
  28. Liu, W.; Li, H.; Xu, H.; Zhang, X.; Xie, Y. Spatiotemporal distribution and driving factors of regional green spaces during rapid urbanization in Nanjing metropolitan area, China. Ecol. Indic. 2023, 148, 110058. [Google Scholar] [CrossRef]
  29. Iakovoglou, V.; Zaimes, G.N.; Gounaridis, D. Riparian areas in urban settings: Two case studies from Greece. Int. J. Innov. Sustain. Dev. 2013, 7, 271–288. [Google Scholar] [CrossRef]
  30. Koutalakis, P.; Gkiatas, G.; Iakovoglou, V.; Zaimes, G.N. New Technologies to Assess and Map an Urban Riparian Area in Drama, Greece, and Determine Opportunity Sites for Litter Traps. Sustainability 2023, 15, 15620. [Google Scholar] [CrossRef]
  31. Zeng, J.; Chan, K.C. The tax incentives and corporate cash holdings: Evidence from a quasi-natural experiment of an accelerated depreciation tax policy for fixed assets. Int. Rev. Financ. Anal. 2023, 88, 102685. [Google Scholar] [CrossRef]
  32. Gao, M.; Cifuentes-Faura, J.; Liu, X.; Li, H. Do high administrative-level cities promote firm technological innovation? A novel analysis based on patent applications. Manag. Decis. Econ. 2024, 45, 5159–5181. [Google Scholar] [CrossRef]
  33. Yu, W.; Jin, X. Does environmental information disclosure promote the awakening of public environmental awareness? Insights from Baidu keyword analysis. J. Clean. Prod. 2022, 375, 134072. [Google Scholar] [CrossRef]
  34. LeSage, J.; Pace, R.K. Introduction to Spatial Econometrics; CRC Press: Boca Raton, FL, USA, 2009. [Google Scholar]
Figure 1. Geographic Location of the Poyang Lake Urban Agglomeration.
Sustainability 16 08698 g001
Figure 2. Green Water Efficiency Trend of Non-Poyang Lake Urban Agglomeration.
Sustainability 16 08698 g002
Figure 3. Green Water Efficiency Trend of Poyang Lake Urban Agglomeration.
Sustainability 16 08698 g003
Table 1. Input and Output Indicators of Carbon Emission Performance.
VariableVariable NameVariable Measurement Methods
InputCapital InputFixed industrial asset investment (in billion CNY) calculated with 2009 as the base year.
Labor InputNumber of employees in the secondary industry (in 10,000 people).
Water Resource InputIndustrial water usage in urban areas (in 10,000 tons)
OutputExpected OutputIndustrial added value (in billion CNY), deflated to 2009 prices
Unexpected OutputIndustrial wastewater discharge (in 10,000 tons)
Table 2. Indicator Composition of Urbanization Level.
IndicatorSymbolSecondary IndicatorIndicator
Direction
Rapid
Urbanization
Peocity
urbanization
Proportion of permanent urban population to total regional population+
Ecocity
urbanization
Proportion of secondary and tertiary industries to GDP+
Landcity
urbanization
Proportion of built-up urban area in the total city area+
Socity
urbanization
Proportion of individuals paying and receiving pension insurance to the total urban population+
Greencity
urbanization
Per capita urban park green space+
Balancecity
urbanization
Ratio of rural residents’ net income to urban residents’ disposable income+
+ Forward indicator.
Table 3. Control Variable Indicators.
VariablesVariable NameSymbolMeasurement Method
Control VariablesIndustrial Structure UpgradingIndustrialRatio of tertiary industry to secondary industry in GDP
Economic Development LevelEconomic Per capita GDP of the city
Technological Innovation LevelTechnologyNumber of patents granted per 10,000 people
Export DependencyExportsRatio of total exports to GDP
Level of OpennessForeignRatio of foreign direct investment (FDI) to GDP
Transportation ConvenienceTransportationRoad mileage per square kilometer of graded roads
Financial ActivityFinancialRatio of value added from the financial sector to GDP
Weight
Matrix
Nested Weight MatrixWBased on the Queen Contiguity Matrix
Table 4. Descriptive Statistics of Variables.
VariableObsMeanSDMinMedianMax
Green1540.730.150.430.71.43
Urban1540.390.240.230.380.85
Industrial 1543.6411.380.370.3952.7
Economic 1544.692.491.074.2511.69
Technological 1540.030.020.010.030.08
Exports 1540.100.090.000.090.98
Foreign1540.030.010.010.320.06
Transportation 1541.071.140.430.9014.33
Financial1540.720.020.010.040.11
Table 5. Baseline Regression Model Results.
Variables(1)
Green
(2)
Green
(3)
Green
(4)
Green
(5)
Green
(6)
Green
(7)
Green
Urbanization0.251 ***
(0.056)
Population-urbanization −0.077
(0.500)
Industrial-urbanization −0.349
(0.535)
Land-urbanization −0.400
(1.024)
Social-urbanization 1.174 **
(0.496)
Environmental-urbanization 0.011 *
(0.006)
Balanced-urbanization 0.899
(0.974)
Industrial structure0.0040.0050.0050.0060.0060.0060.006
(0.007)(0.009)(0.009)(0.009)(0.008)(0.009)(0.009)
Economic development0.0310.0320.0250.0270.0090.0250.020
(0.025)(0.024)(0.022)(0.023)(0.023)(0.022)(0.022)
Technological innovation0.5010.5050.408−0.245−1.044−0.042−0.301
(1.628)(1.623)(1.553)(1.556)(1.563)(1.471)(1.474)
Exports dependence0.1450.1490.1360.1370.1130.1460.130
(0.127)(0.129)(0.128)(0.129)(0.128)(0.129)(0.128)
Foreign direct investment3.827 *3.822 *3.697 *3.941 *2.9813.873 *3.532
(2.184)(2.186)(2.185)(2.237)(2.211)(2.201)(2.182)
Transportation convenience−0.013−0.016−0.015−0.015−0.017*−0.015−0.014
(0.010)(0.010)(0.010)(0.010)(0.010)(0.010)(0.010)
Financial activity−0.827−0.835−0.740−0.796−1.078−0.880−0.866
(1.351)(1.351)(1.356)(1.363)(1.343)(1.354)(1.344)
Constant0.425 ***0.673 ***0.936 **0.652 ***0.486 ***0.499 ***0.302
(0.048)(0.232)(0.458)(0.046)(0.068)(0.080)(0.364)
Regional Fixed Effect YESYESYESYESYESYESYES
Time Fixed EffectYESYESYESYESYESYESYES
R-squared0.4660.2340.2360.2340.2680.2550.239
N154154154154154154154
Note: *, **, and *** indicate significance levels of 0.1, 0.05, and 0.01, respectively. The values in parentheses are standard errors adjusted for clustering at the city level. The same applies to the following tables.
Table 6. Robustness Analysis.
Variables(1)
Green
(2)
Green
(3)
Green
(4)
Green
(5)
Green
Urbanization0.201 ***0.199 **0.211 ***0.285 **0.305 ***
(0.047)(0.086)(0.036)(0.056)(0.042)
Controls VariableYESYESYESYESYES
ConstantYESYESYESYESYES
Regional Fixed EffectYESYESYESYESYES
Time Fixed EffectYESYESYESYESYES
R-squared0.4220.1780.2660.1980.188
N131154154154154
Note: **, and *** indicate significance levels of 0.05, and 0.01, respectively. The values in parentheses are standard errors adjusted for clustering at the city level. The same applies to the following tables.
Table 7. Channel Analysis.
Variables(1)
Infrastructure
(2)
Innovation
(3)
Awareness
Urbanization6.201 ***4.175 **3.211 ***
(0.045)(0.022)(0.017)
Controls VariableYESYESYES
ConstantYESYESYES
Regional Fixed EffectYESYESYES
Time Fixed EffectYESYESYES
R-squared0.9850.8780.766
N154154154
Note: **, and *** indicate significance levels of 0.05, and 0.01, respectively. The values in parentheses are standard errors adjusted for clustering at the city level. The same applies to the following tables.
Table 8. Global Moran Index of green Economy efficiency.
VariablesMoran’I ValueE (I)sd (I)zp
Green water efficiency0.292−0.0070.0575.2150.000
Table 9. LM selection test of spatial autocorrelation, spatial error and spatial Durbin model.
Test MethodStatistical Value and Empirical p-Value
LM test (Spatial Autocorrelation) 13.056 (0.000)
Robust LM test (Spatial Autocorrelation) 16.077 (0.000)
LM test (Spatial error) 32.987 (0.000)
Robustness LM test (spatial error) 36.008 (0.000)
Number143
Table 10. The choice test of spatial Durbin model and generalized space nested model.
ModelAICBIC
SDM (Spatial Durbin)−653.911−596.2268
GNS (Generalized Space Nesting)−554.967−526.885
Table 11. Decomposition of spatial effect of rapid urbanization on industrial green water use efficiency.
Core VariablesDirect EffectSpillover EffectTotal EffectSample SizeR2RHOFixed EffectsControl Variables
(1)Urbanization0.632 *
(1.75)
−0.021 ***
(−6.05)
0.611 *
(1.78)
1540.2880.488 ***
(5.73)
YESYES
(2)Population
urbanization
0.565 *
(1.75)
−0.021
(−0.05)
0.544 *
(1.78)
1540.2530.479 ***
(5.23)
YESYES
(3)Industrial
urbanization
0.165
(0.28)
1.172 *
(1.77)
1.337 *
(1.69)
1540.1290.478 ***
(5.17)
YESYES
(4)Land
urbanization
1.161
(1.26)
0.680
(0.40)
1.841
(1.13)
1540.0290.479 ***
(5.23)
YESYES
(5)Social
urbanization
0.712 ***
(1.57)
0.170
(0.31)
0.882 **
(2.30)
1540.0960.462 ***
(4.95)
YESYES
(6)Environmentalurbanization0.005
(0.63)
0.031 ***
(2.88)
0.036 ***
(3.27)
1540.3480.399 ***
(3.80)
YESYES
(7)Balanced
urbanization
1.224 *
(1.93)
0.153
(0.19)
1.377 **
(2.07)
1540.0650.480 ***
(5.27)
YESYES
Note: ***, ** and * are significant at the level of 1%, 5% and 10%, respectively, where () is the Z-test statistical value.
Table 12. Heterogeneity test: Jiangxi province and non-Poyang Lake urban agglomeration cities.
Variables(1)
Green
(2)
Green
(3)
Green
(4)
Green
(5)
Green
(6)
Green
Sample of Cities in Jiangxi Province
Population-urbanization−0.077
(0.500)
Industrial-urbanization −0.349
(0.535)
Land-urbanization −0.400
(1.024)
Social-urbanization 1.174 **
(0.496)
Environmental-urbanization 0.011 *
(0.006)
Balanced-urbanization 0.899 ***
(0.974)
Urban fixedYESYESYESYESYESYES
Time fixedYESYESYESYESYESYES
ConstantYESYESYESYESYESYES
Number143143143143143143
R20.3580.3600.3590.1770.5710.363
Variables(7)
Green
(8)
Green
(9)
Green
(10)
Green
(11)
Green
(12)
Green
Sample of Urban Agglomeration Outside Poyang Lake
Population-urbanization0.203
(0.318)
Industrial-urbanization 0.935
(0.603)
Land-urbanization 1.512
(2.132)
Social-urbanization 0.272
(0.482)
Environmental- urbanization 0.003
(0.011)
Balanced-urbanization 0.174
(0.671)
Urban fixedYESYESYESYESYESYES
Time fixedYESYESYESYESYESYES
ConstantYESYESYESYESYESYES
Number393939393939
R20.1080.5730.1750.7080.9380.597
Note: *, ** and *** represent the significance levels of 0.1, 0.05 and 0.01, respectively, and () is the standard error adjusted by clustering at the city level, as shown in the table below.
Disclaimer/Publisher’s Note: The statements, opinions and data contained in all publications are solely those of the individual author(s) and contributor(s) and not of MDPI and/or the editor(s). MDPI and/or the editor(s) disclaim responsibility for any injury to people or property resulting from any ideas, methods, instructions or products referred to in the content.

