Abstract
In this study, the spatiotemporal variation of water pollution near a municipal solid waste landfill in Chorzow (southern Poland) was investigated. For this purpose, analyses of electrolytic conductivity, sulfates, chlorides, nitrates, ammonium ion, and boron were performed. The landfill water pollution index (LWPI) and Nemerow Pollution Index (NPI) were calculated on the basis of groundwater monitoring results for the study area. The results indicated very high pollution in each piezometer. The value of the LWPI index for the piezometer located at the groundwater outflow from the landfill exceeded 320, and values exceeding five indicate a high risk to groundwater. In the case of the NPI index, the value reached nearly 44, which also indicates a high risk. The structure of both indices allows for the assessment of the level of threat to groundwater in areas of pollution sources. However, the NPI index highlights the contribution of parameters other than main ions to total water pollution. The use of indexes in assessing the quality of groundwater around pollution hotspots is very helpful in waste management, as it allows for determining the degree of threat to water, and thus can help in implementing additional preventive solutions.
1. Introduction
Landfilling is one of the most common means of disposing of municipal waste [1,2], but this carries a risk of groundwater contamination by leachate migration [3,4,5,6,7]. In this context, it is extremely important to conduct monitoring studies as well as to have a well-developed method for assessing the level of risk to water [8]. The quality of groundwater is determined by the content of inorganic and organic substances. Conducting monitoring studies and determining the content of these parameters in water is very important, especially regarding landfills, waste sorting plants, composting plants, and coking plants [9]. Due to the fact that pollution sources may have a negative impact on the quality of groundwater, it is necessary to conduct representative monitoring of the quality and quantity of groundwater in the area of such facilities [10,11,12]. Conducting reliable monitoring around facilities such as landfills guarantees a reliable assessment of changes in the quality of groundwater and also influences rational water management.
The scope of parameters necessary for monitoring is determined by legal acts for each country. In Poland, the Notice of the Minister of Climate and Environment of 6 August 2022, on the publication of the uniform text of the regulation of the Minister of the Environment on waste landfills (Journal of Laws of 2022, item 1902) is in force.
The regulation requires measurements of specific electrical conductivity (EC), pH, total organic carbon (TOC), copper, zinc, lead, mercury, cadmium, chromium and the sum of polycyclic aromatic hydrocarbons. Some of these parameters (mercury and cadmium) are particularly emphasized in environmental studies [13]. This regulation also specifies the minimum number of observation holes, i.e., at least one at the groundwater inflow to the landfill and at least two at the groundwater outflow [14]. In addition to typical inorganic parameters, more and more attention is being paid to the content of herbicides and pesticides that are used in agricultural activities [15]. Depending on the decision of the landfill manager, it is also possible to perform measurements in an extended range, adding main ions to the basic range. The additional range of parameters allows for a better assessment of the quality of groundwater in the area of pollution sources [16]. Moreover, such information may provide the basis for creating a risk analysis for groundwater or assessing the vulnerability of groundwater to pollution [17,18,19,20].
The selection of appropriate measures for assessing water quality changes that could be applied to many different facilities may improve the sustainability of water risk assessment, as well as help managers and legislators make appropriate decisions regarding landfills. Index methods are one example of methods used to determine the risk to groundwater [21]. The first method using an index was proposed by Horton [22,23]. Then, other indices were created, such as the Landfill Water Pollution Index, Groundwater Index, Nemerow Index, Backman Index, and Canadian Index [24,25,26,27,28,29,30,31,32]. The formulas needed to calculate individual indicators differ, but each of them suggests that increased indicator values may indicate a negative impact of the facility on groundwater and pose a health risk [33]. Most indicators are designed to be able to select the parameters that are currently being measured in the water. Indices are not limited to the need to calculate their values only for metals.
Waste landfills always constitute a potential source of threats to the soil and water environment due to the possibility of leachate migration to aquifers. This article uses the Landfill Water Pollution Index and the Nemerow Pollution Index to assess the risk to groundwater around the landfill in Chorzów (southern Poland). The following parameters were taken into account: sulfates, chlorides, nitrates, ammonium ion and boron. For the area of southern Poland, research has already been carried out at various municipal waste landfills, such as in Tychy, Poczesna, Sosnowiec and Dąbrowa Górnicza. The choice of the research area for analyzing the quality of groundwater in the area of municipal waste landfills was dictated by the fact that no such research has been carried out for this facility so far. Attention should be paid to the location of the described landfill in a highly urbanized and anthropogenically transformed area, for which it is necessary to show the impact of such facilities on the soil and water environment.
2. Study Area
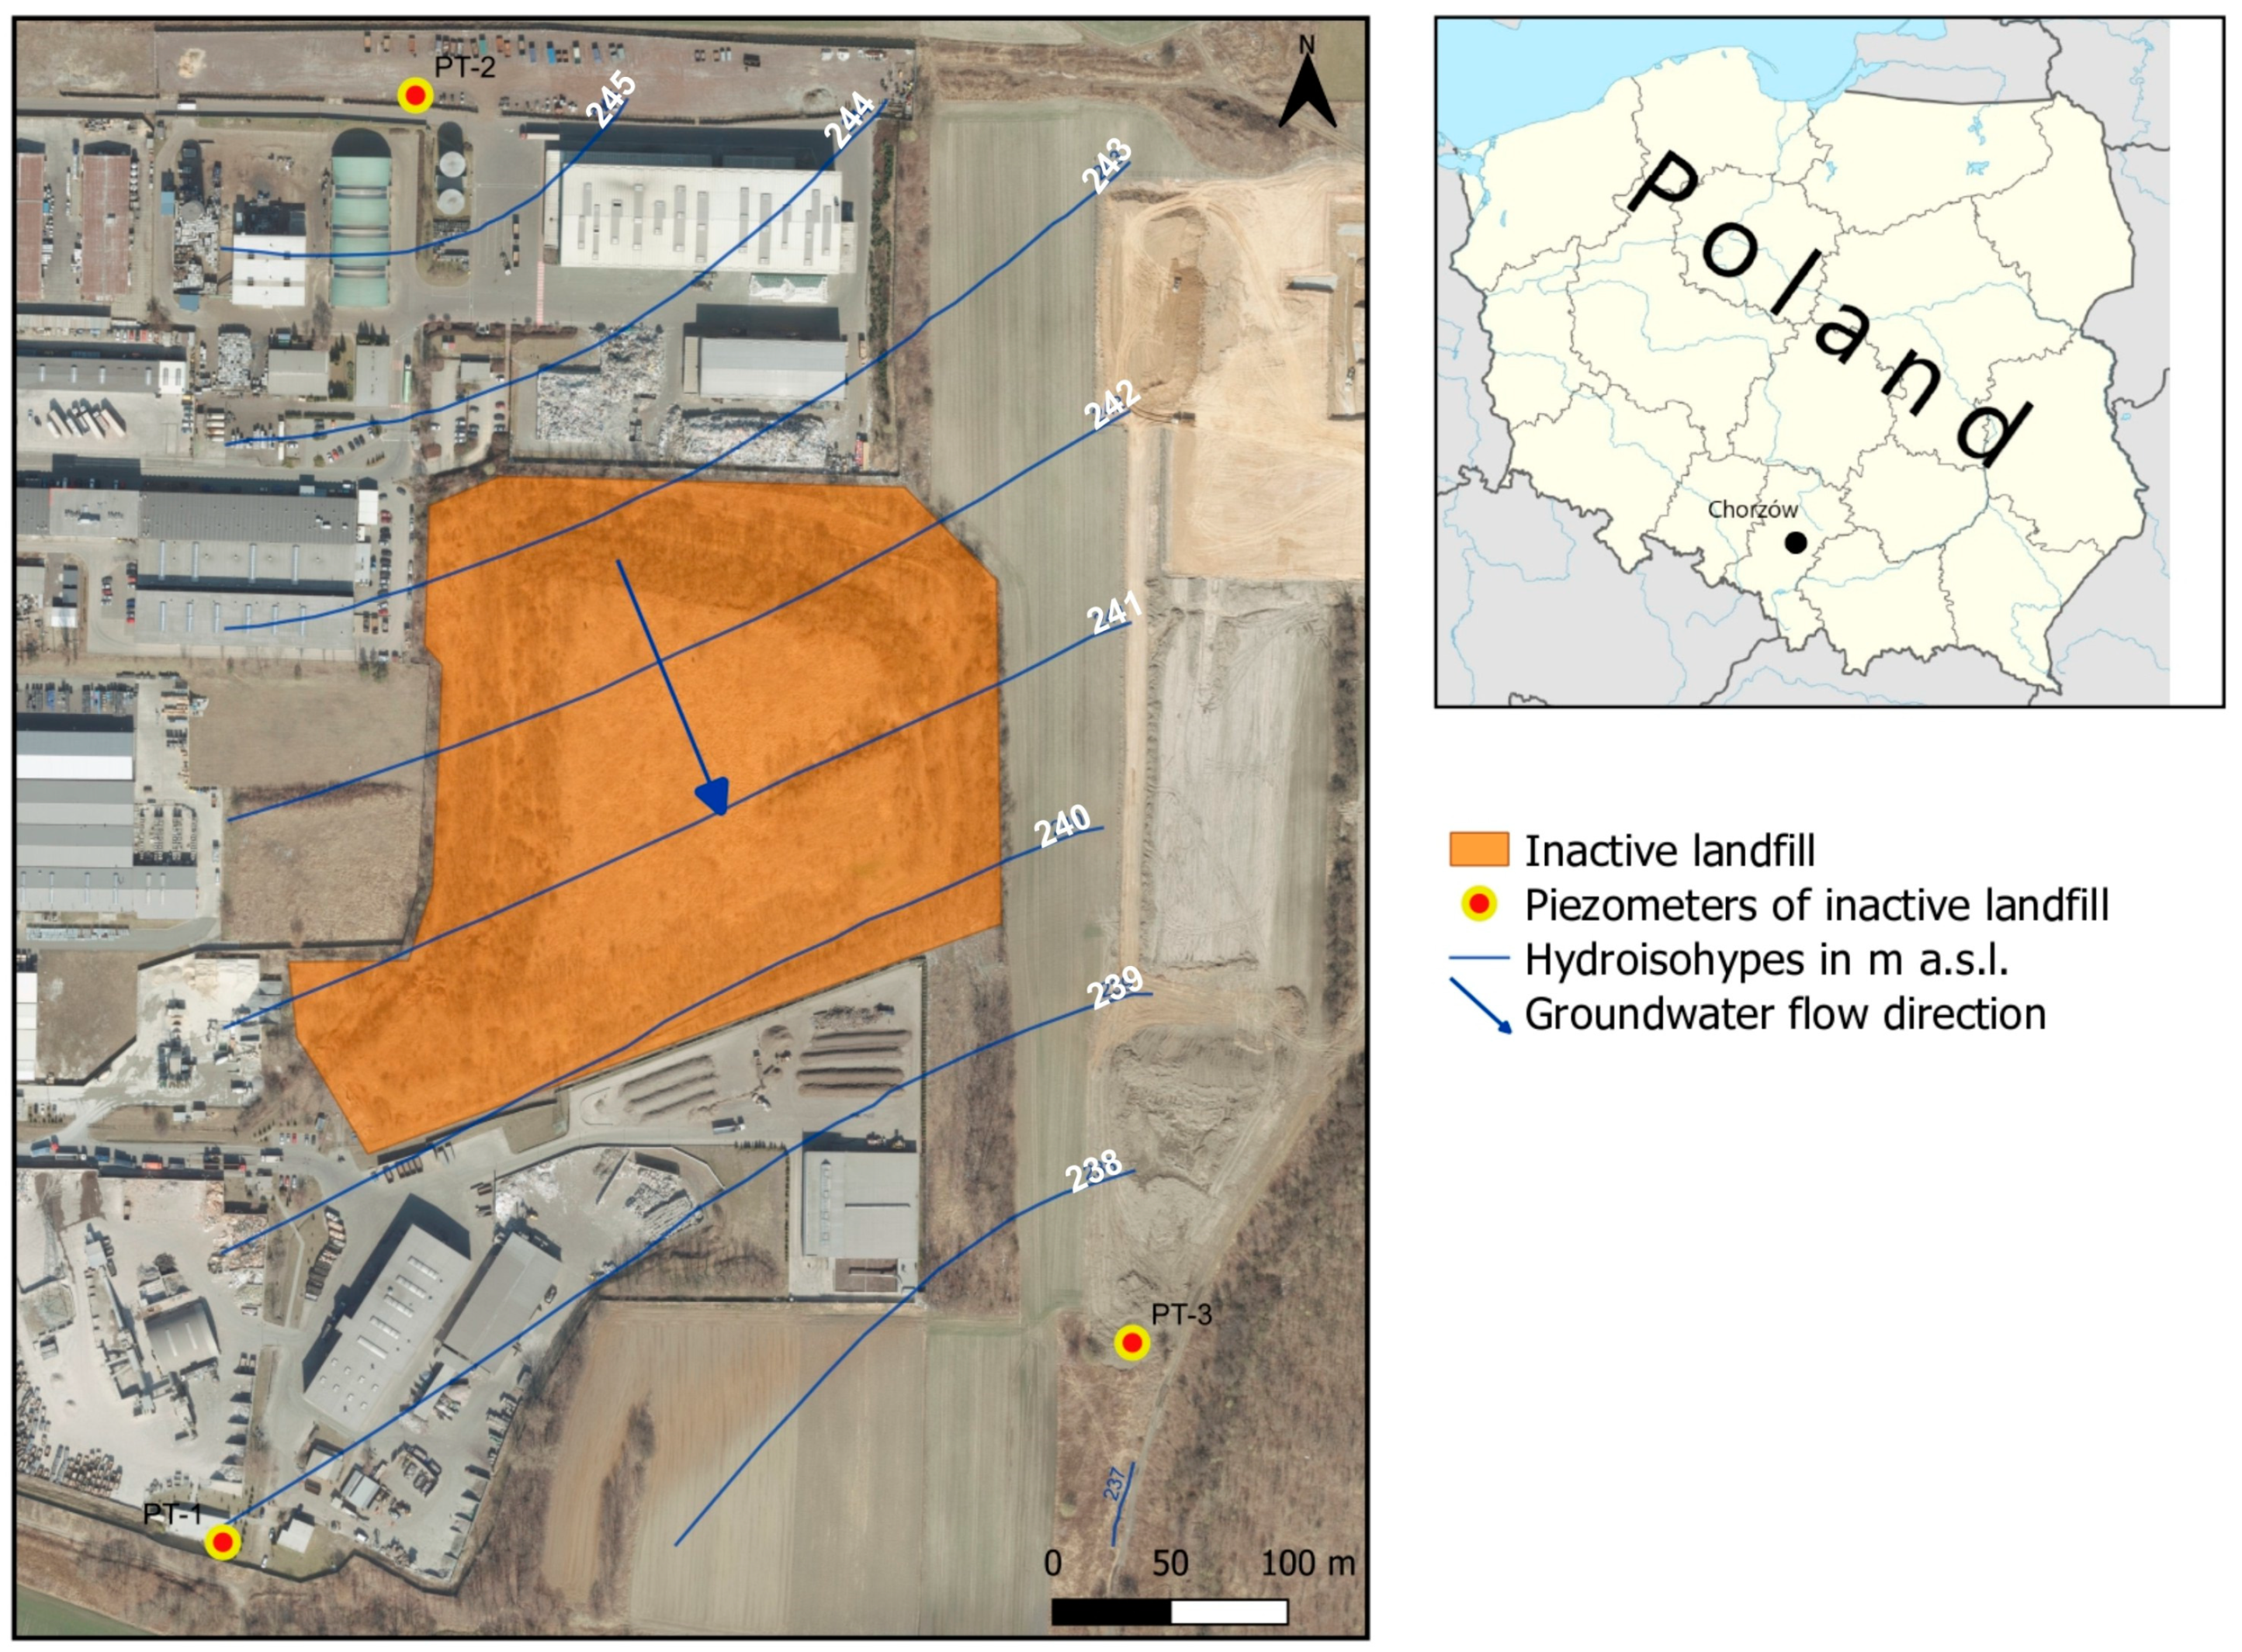
In administrative terms, the landfill is located in the central part of the Silesian Voivodeship, in the north-eastern region of Chorzów, southern Poland (Figure 1). This area is very urbanized and anthropogenically transformed. There are many industrial plants and factories nearby. The largest of them are Nitrogen plants Chorzów Inc. located to the south and a closed mine located southwest of the landfill. The area around the landfill is not densely populated and is dominated by single-family buildings and arable fields.

Figure 1.
Study area.
The analyzed waste landfill is located within the Upper Silesian depression [34]. The geological profile includes Carboniferous, Triassic and Quaternary deposits [35]. The Upper Carboniferous is represented here by the Upper Silesian sandstone series, which consists of sandstones and conglomerates with interlayers of claystones and mudstones, as well as hard coal, the thickness of which is highly variable. In this area, the Lower Triassic consists of sands, clays and sandstones. Above, there are rhet formations composed of limestones, dolomitic marls and dolomites [36]. The entire layer is characterized by red-colored sediments and its maximum thickness is approximately 80 m [37]. The Middle Triassic is represented here by the Gogolin layers divided into the upper and lower series. It contains limestones in a crystalline form that are pinkish and grey yellow in color and characterized by an organodetrital structure (they contain fragments of shells and crinoids), ranging in color from gray to beige to brown beige [36]. The thickness of the Gogolin layers in the area of the landfill is approximately 40 m [35]. There are also ore-bearing dolomites here, characterized by a fine-crystalline structure, strong cracks and porosity, with a gray, sometimes brown, or yellowish color. The ore-bearing dolomites contain deposits of zinc and lead ores [36]. The thickness ranges from approximately 20–25 m [38]. Another type of sediments is diplopore dolomites that are yellow or yellow brown in color, characterized by a porous structure and remains of green algae, with fragments of crinoids and cyanobacteria occurring on the rock surface [36]. The thickness of the diplopore layers does not exceed 15 m. The Quaternary is composed of brown and yellow weathered sands and clays. In the area of the landfill, the thickness ranges from 1.5 to 2 m.
There are three aquifers in the analyzed research area [39]. These are the Quaternary, Triassic and Carboniferous aquifers. The Quaternary aquifer is of a discontinuous nature. These are suspended waters with an unconfined water table in sandy formations located above impermeable clay sediments. The thickness of this layer, depending on the place of occurrence, is 1.7–16.8 m. The discontinuity indicates the variable lithology and thickness of this level [40]. It reaches its greatest thickness in the Rawa Valley area and decreases towards the north. In the scale of the entire Chorzów, the Quaternary aquifer is not a usable level because it was degraded as a result of mining activities [34]. The Triassic aquifer occurs only in the northern part of Chorzów and consists of levels of musky limestone and Rhaetian limestone as well as middle and lower variegated sandstone [40]. The Muschelkalk and Rhaetian levels have an unconfined water table, which is located at depths between 40 and 60 m below ground level. The aquifer has a fissure-karst-porous character, which allows for the accumulation of water in the rock voids. It is replenished by precipitation when it infiltrates deeper [34]. The middle and lower variegated sandstone levels are layers and lenses of weakly compact sandstones or arkosic and quartz sands. They lie directly on the Upper Carboniferous formations [40]. The flow of groundwater from the Triassic aquifer is towards the south (Figure 1). The Carboniferous aquifer is located in sandstones and is fed by atmospheric precipitation through infiltration, whereas the Poręba layers contain reserves of relict water. In many places, Carboniferous waters mix with each other [34].
The non-hazardous and neutral waste landfill has an area of 7.9 ha, of which only 2.4 ha were used for waste storage [40]. It was active in the years 1997–2007. The landfill, in accordance with its intended purpose, stores waste from households, infrastructure facilities, building construction and renovation, parks and gardens, the cleaning of streets and squares, as well as bulky waste. The sealing of the bottom and slopes of the landfill is made of layers of clay. The main seal is two separate layers of clay with a minimum thickness of 0.25 m and a permeability ranging between 1 × 10⁻⁷ m/s and 69 × 10−9 m/s. The next sealing layer is plasticized clay with a maximum hydraulic conductivity of 5.46 × 10⁻⁹ m/s. The top layer was sealed with 0.25 m thick mineral aggregate, a 0.25 m high impermeable clay layer and a 0.15 m thick soil layer [41]. Leachate is discharged from the landfill using a drainage system located at the very bottom of the landfill. The drainage system is placed on a sand bed and protected against silting. Leachate water is collected in a tank, flows there by gravity and is then transported to the sewage treatment plant. There are three degassing wells at the landfill that release gas directly into the atmosphere.
Local monitoring in the landfill area includes monitoring of groundwater, monitoring of leachate water, monitoring of land surface subsidence and monitoring of landfill gas emissions. Three piezometers PT-1, PT-2, PT-3 are used to monitor groundwater. Piezometers PT-1 and PT-2 are located at the water inflow to the landfill, and piezometer PT-3 is located at the outflow from the landfill. Measurements have been performed since 1998. In the operational phase until 2007, water samples were taken from piezometers 3–4 times a year. In the post-exploitation phase, measurements were performed every 6 months. The scope of groundwater monitoring included total dissolved substances, mineral dissolved substances, volatile dissolved substances, electrolytic conductivity, pH, oxidability, total organic carbon, Fe, Mn, Kjeldahl total N, N, NH4, NO3, NO2, Cl, SO4, PO4, Pb, Cd, Cr, Cu, Ni, B, Zn, Hg, and PAHs.
3. Methodology
The results of monitoring studies from 1997 to 2023 for three piezometers located in the area of the landfill in Chorzów were used to determine the risk to groundwater. The following parameters were taken into account for the analysis: sulfates, chlorides, nitrates, ammonium ion, boron and PAHs. The risk was determined by taking into account two indices, i.e., the Landfill Water Pollution Index and the Nemerow Pollution Index.
The first index takes into account the relationship between the values of individual parameters measured in the piezometer and the values for piezometers beyond the influence of the object (upstream groundwater). The general formula is as follows:
where Cp is the concentration of the i-th parameter in each sample and Cb is the concentration of the i-th parameter from the piezometer located upstream of the groundwater flow.
Ultimately, the formula for calculating the ratio is as follows [42,43]:
where wi is the weight of the i-th pollutant variable and n is the number of groundwater pollutants.
The weight values of the LWPI were made based on the literature [30] and hydrogeological knowledge. Detailed values of weight are presented in Table 1.

Table 1.
Weights of parameters required to calculate Landfill Water Pollution Index (LWPI).
An LWPI value ≤ 1 describes water under no landfill impact, Section 2 (1 < LWPI ≤ 2) describes moderately polluted water, and Section 3 (2 < LWPI ≤ 5) describes poor water with a highly visible landfill impact; an LWPI > 5 is connected with strongly polluted water [30].
The Nemerow Pollution Index (NPI) is a measure that involves the relationship between the measured value of a given parameter and the limit value [32]. The value of this index was calculated from the following formula:
where
- Ci—is the measured value of the i-th parameter.
- Li—is the allowable limit of the i-th parameter.
The values for groundwater quality class I were adopted on the basis of the Regulation of the Minister of Maritime Economy and Inland Navigation of 11 October 2019, using the criteria and method of assessing the state of groundwater bodies (Journal of Laws 2019, item 2148). As Li in the formula above, the following values were adopted (Table 2).
Table 2.
Background values for the used parameters.
All index methods have limitations in the form of the need to select the number of parameters, the hydrochemical background value, the selection of weights for some indicators, the appropriate selection of data and the need to verify the data. In most cases, the results obtained from such analyzes will be incomparable between different studies.
4. Results
Within the landfill, the chemical composition of the waters of the Muschelkalk aquifer showed large fluctuations in values. Selected parameters were analyzed for variability based on data from 1998 to 2010 for chemical parameters and from 2003 to 2017 for EC values. Some information is not complete due to the lowering of the water table and the inability to take a sample from the piezometer or a change in the method of determining parameters. In addition to the variability of the parameters used to determine the LWPI and NPI, the variability of specific electrolytic conductivity was presented as a parameter reflecting mineralization and the size of contaminants.
The specific electrolytic conductivity ranged from 260 μS/cm in water from the PT-2 piezometer to 4778 μS/cm in water from the PT-3 piezometer. In 2003 and 2004, the values for electrolytic conductivity increased in all piezometers. In later years, a downward trend is observed (Figure 2). The values in the water from the PT-3 piezometer, which is located at the outflow, are twice as high as in the water from the piezometers at the inflow. Taking into account individual piezometers, the waters in the PT-1 piezometer showed the greatest fluctuations, but they were within the limit of waters with good chemical status. PT-2 showed relative stability in the electrolytic conductivity level and was also below the limit. However, the water in the PT-3 piezometer presented the highest values, which were often beyond the limit value for good chemical status of water. This is related to the location of the piezometer at the groundwater outflow from the landfill (Figure 2).
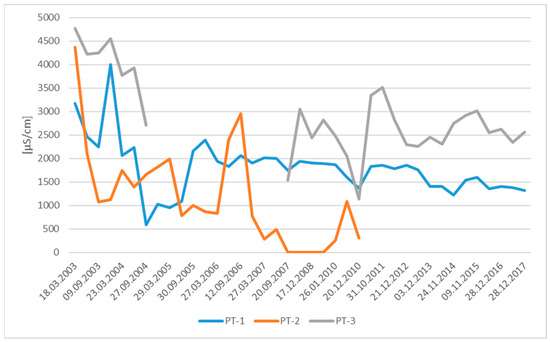
Figure 2.
Changes in EC values in piezometers.
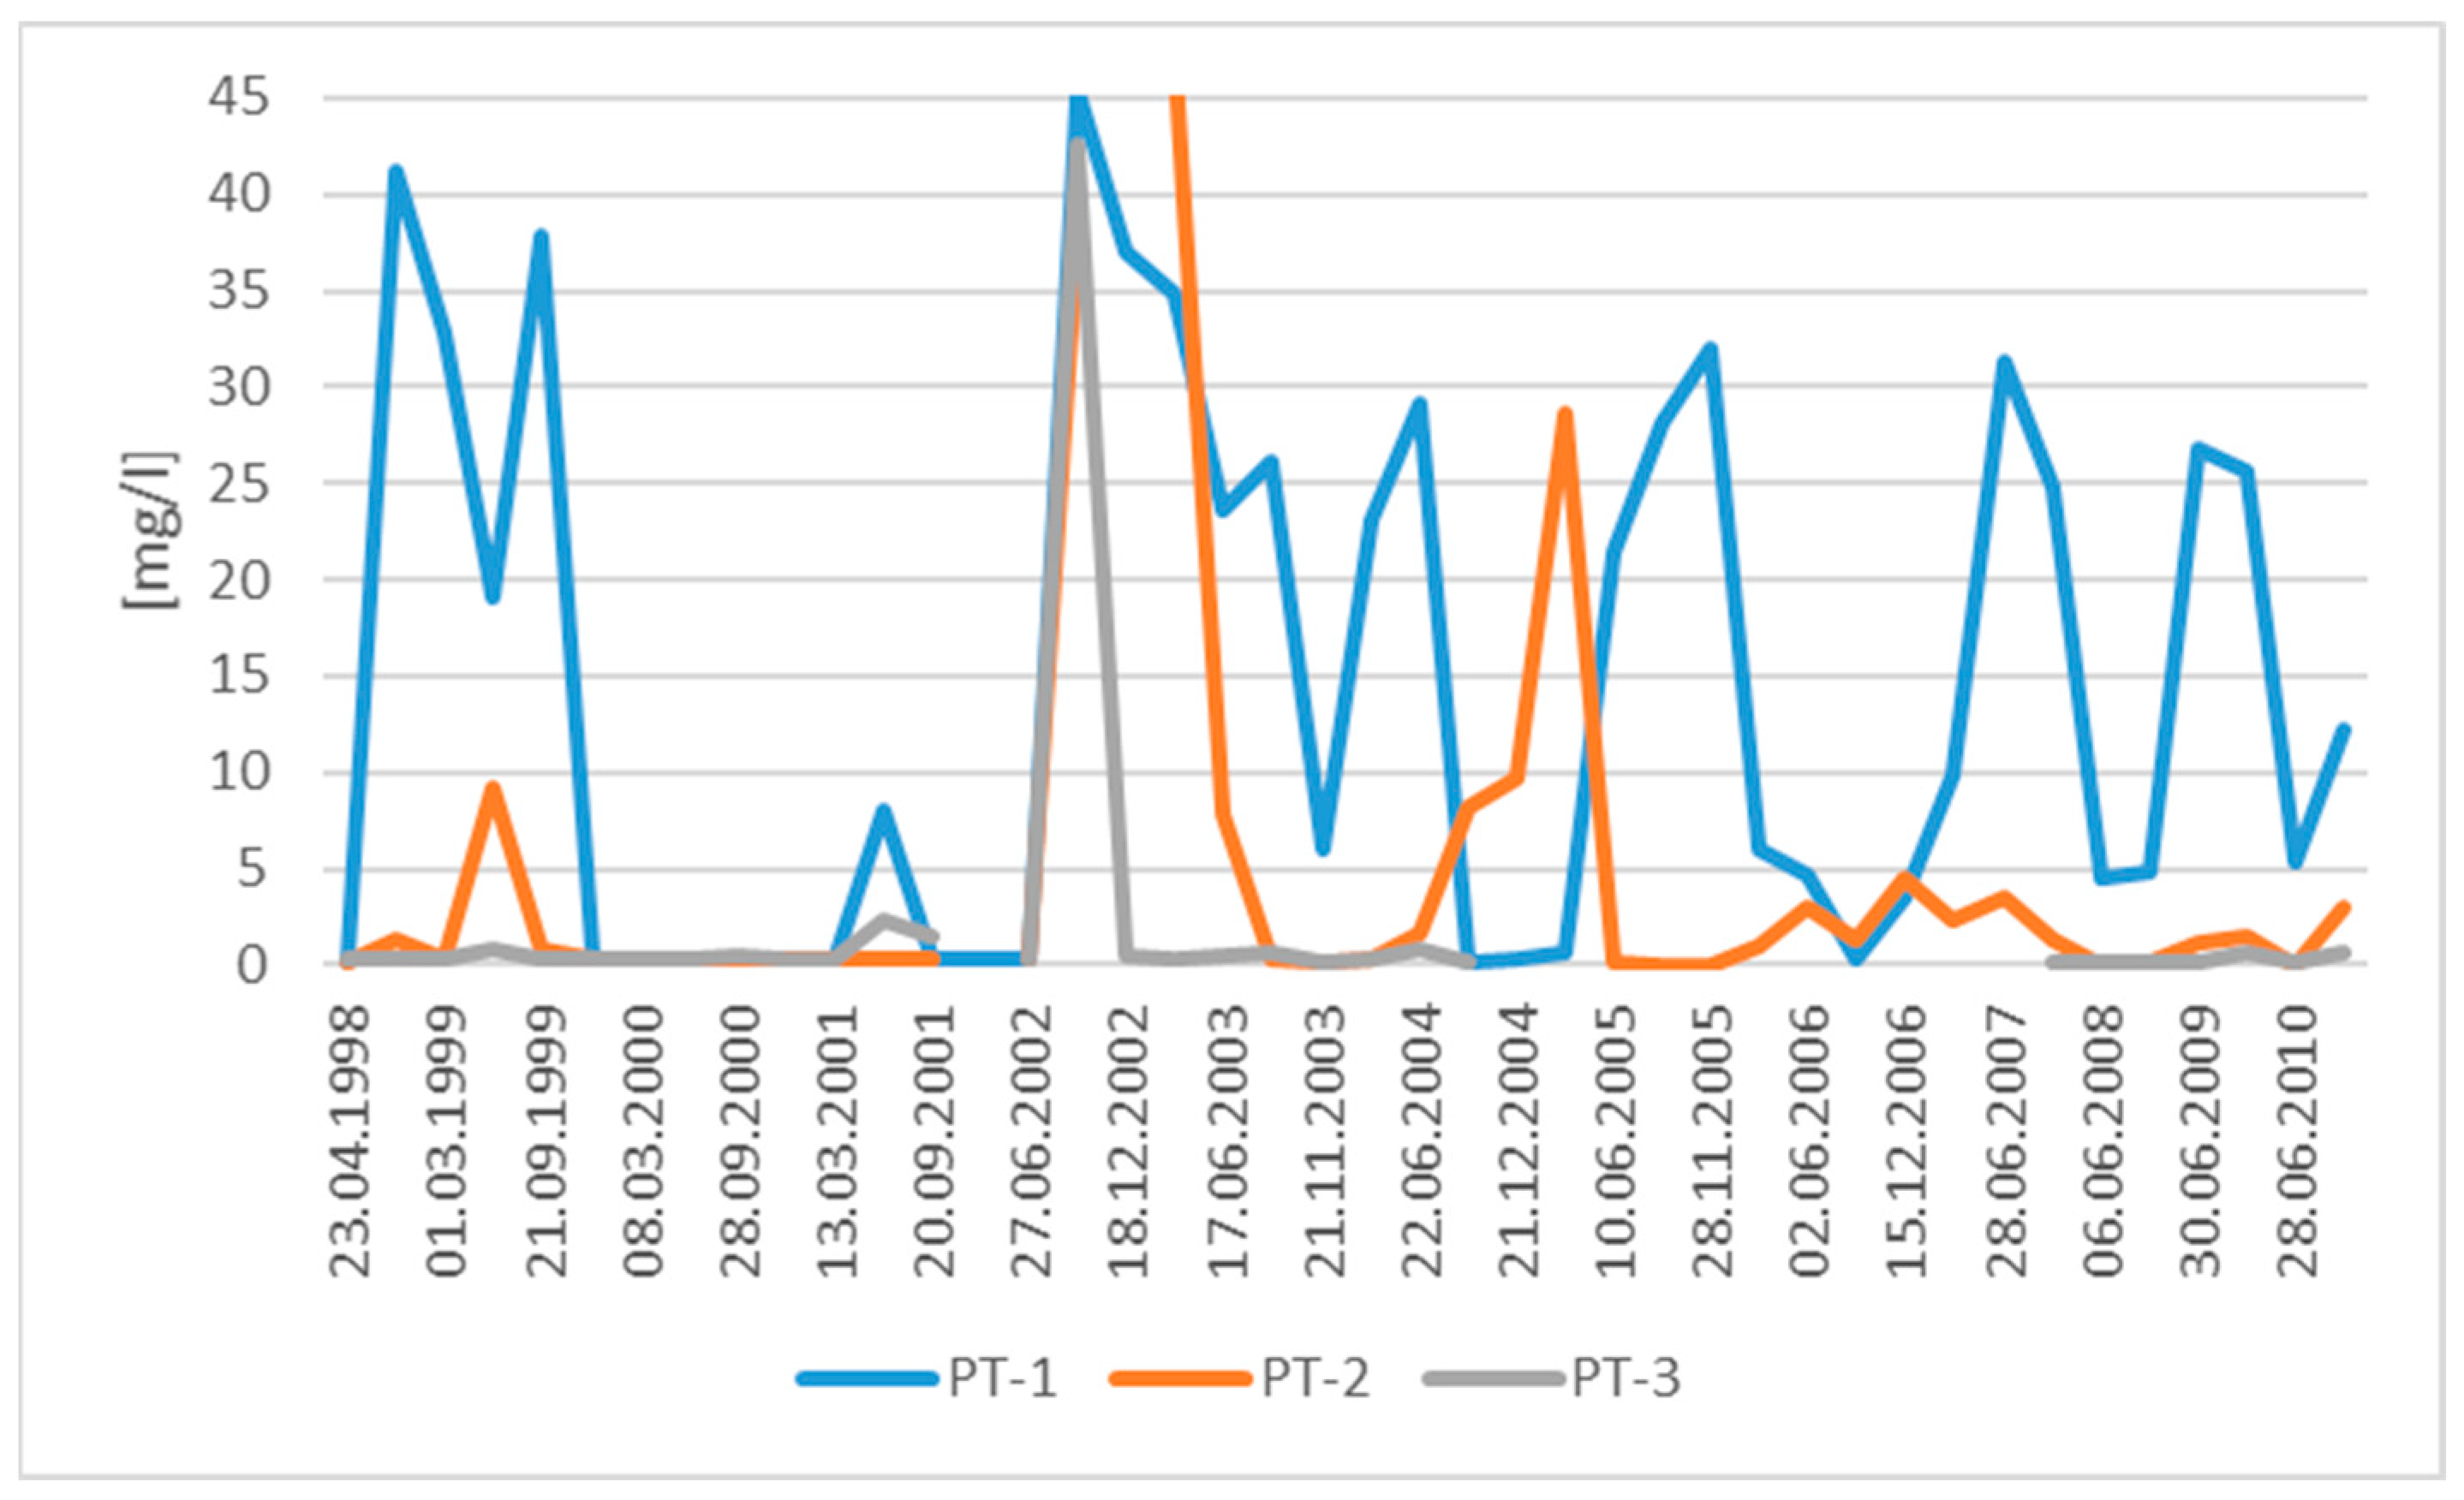
The highest values for the ammonium ion were repeatedly found in water from the PT-1 piezometer, where the average value was 14.52 mg/L, whereas in the remaining water samples from the piezometers, the average NH4 concentration was 4.5 mg/L in PT-2 and 1.85 mg/L in PT-3. In the inflow piezometer waters, the concentration of ammonium ion in most cases exceeded 1.5 mg/L for good chemical status of water, whereas in the outflow, the limit was exceeded twice (Figure 3). The minimum and maximum NH4 values were recorded in PT-2. These concentrations were 0.02 mg/L and 47.39 mg/L.
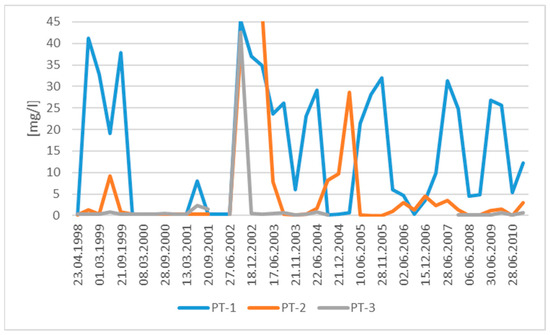
Figure 3.
Changes in NH4 values in piezometers.
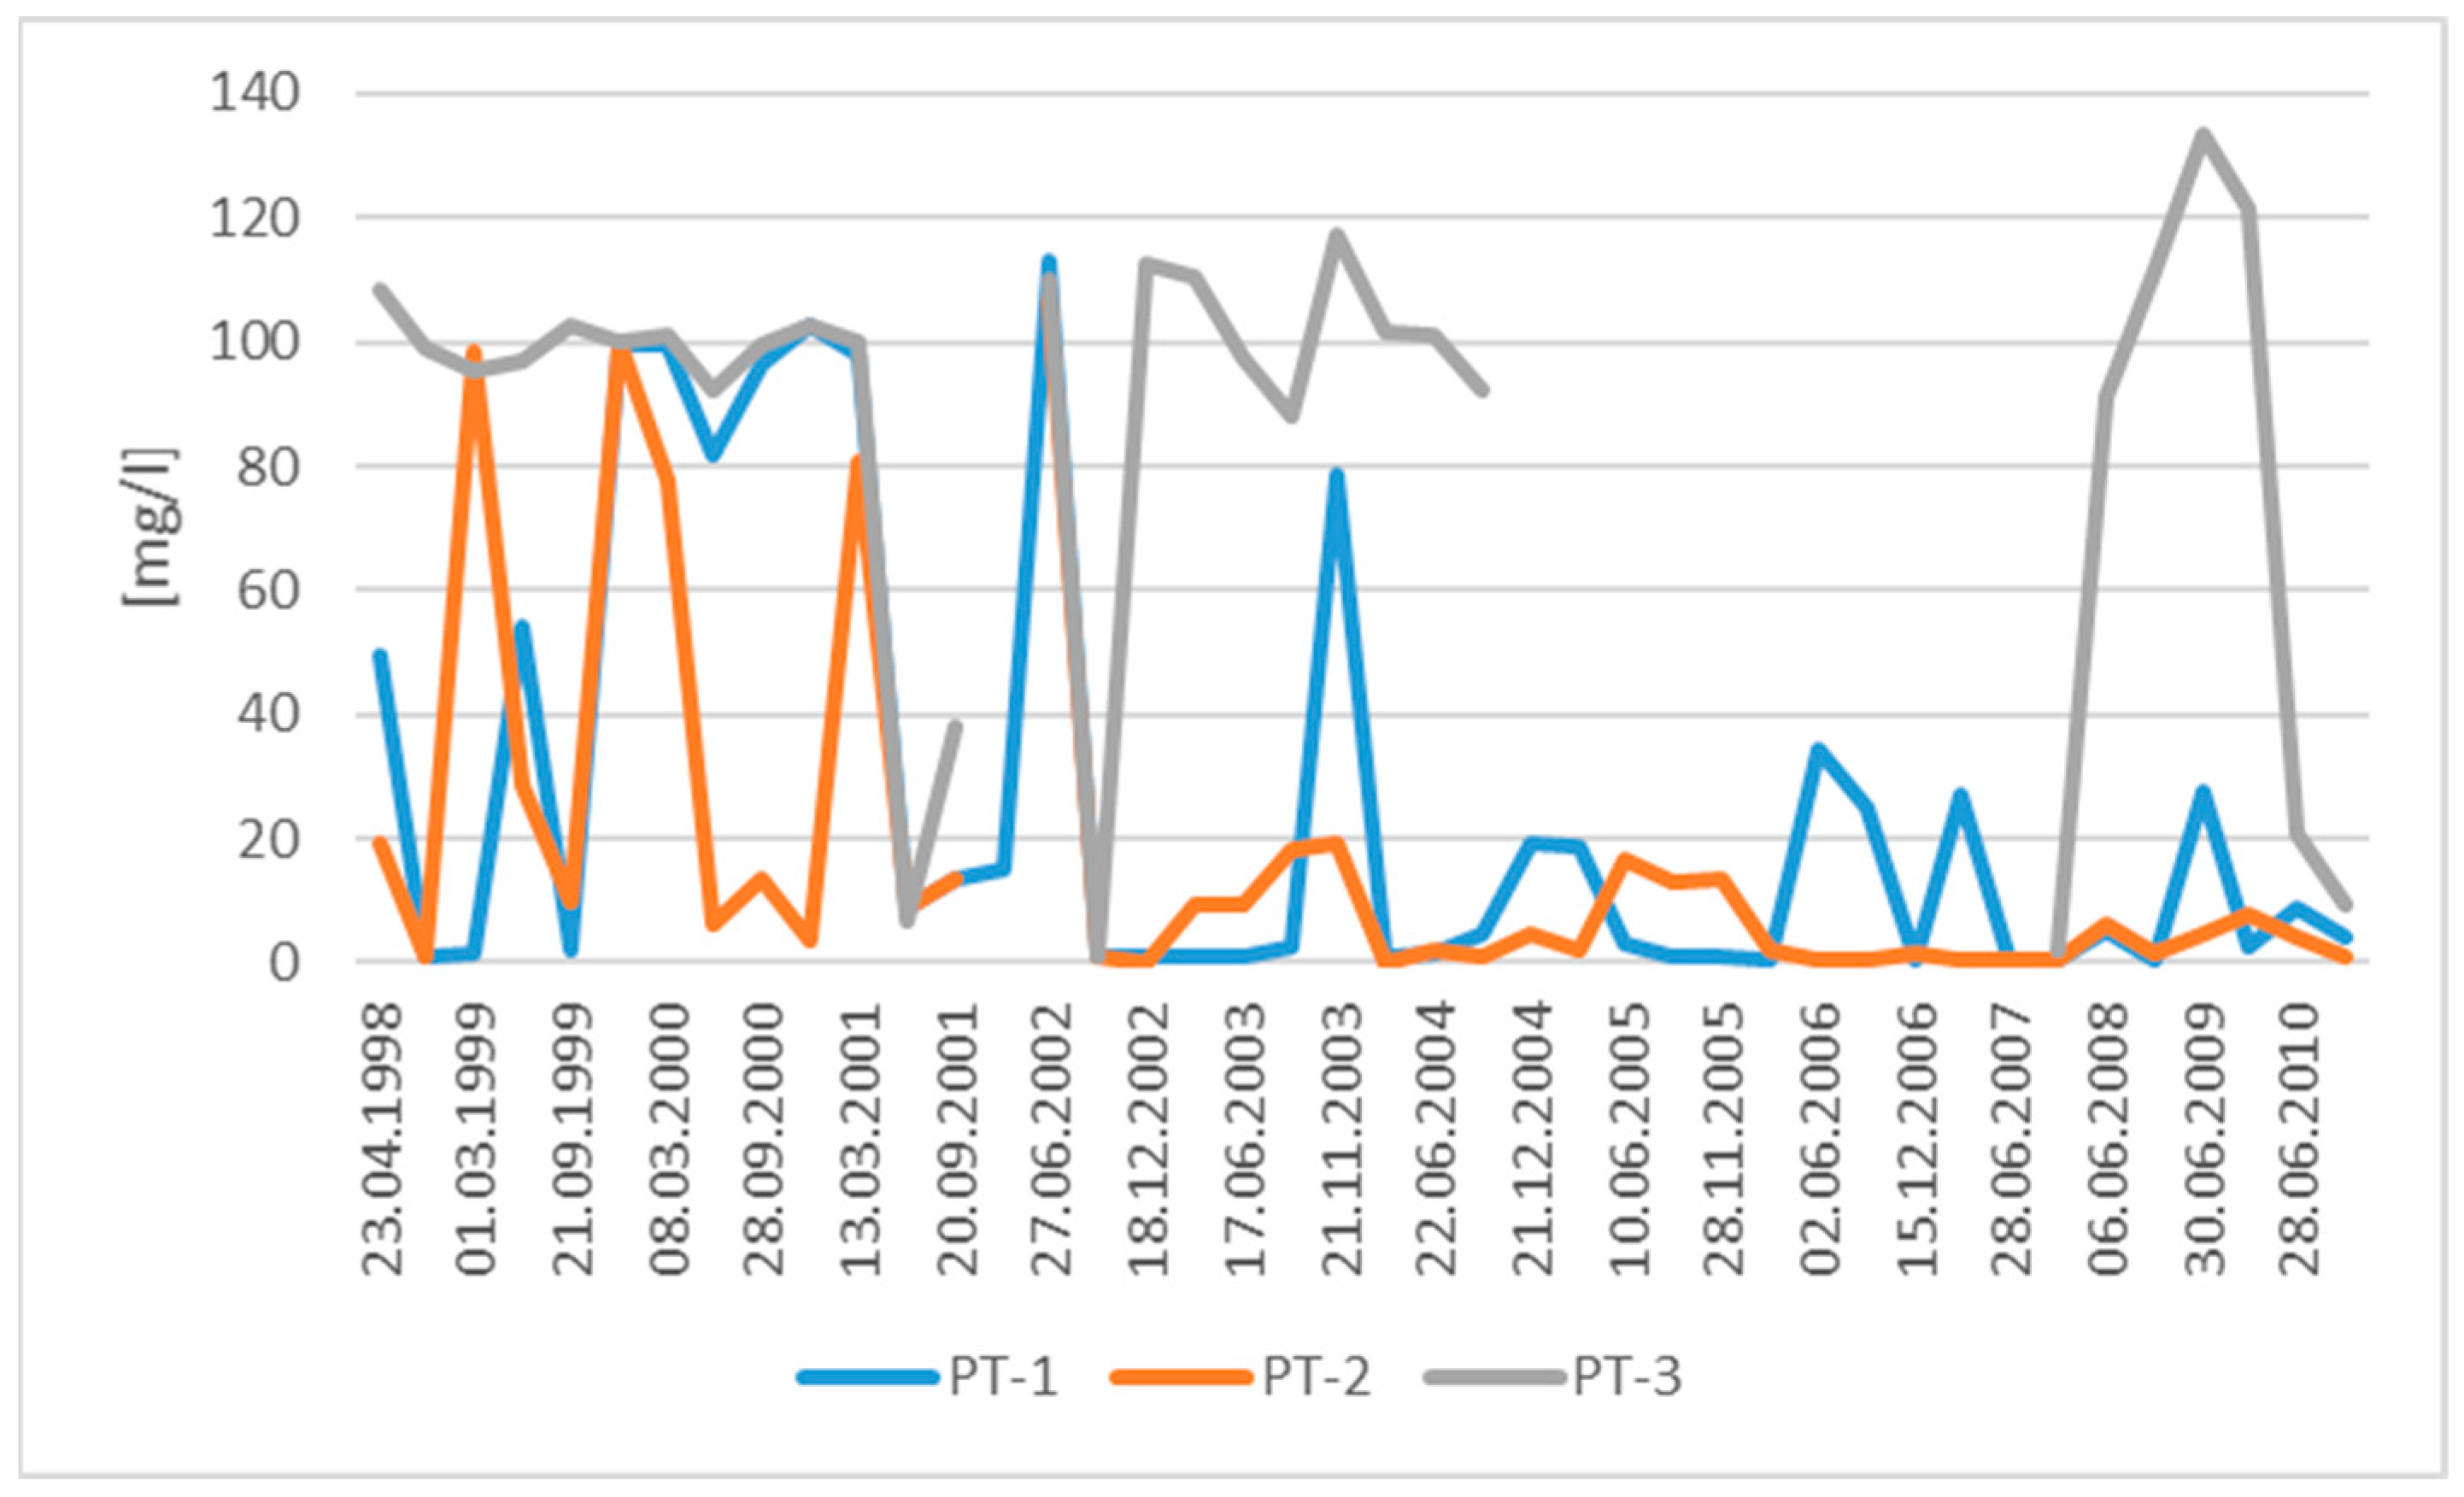
Nitrates in water from piezometers at the inlet were characterized by lower averages than in water at the outflow from the landfill (Figure 4). In PT-1, they were 26.4 mg/L and in PT-2, they were 7.29 mg/L, whereas in PT-3, the average value was much higher and amounted to 86.45 mg/L. The lowest measurement of 0.18 mg/L was recorded in PT-2 and the highest was 133.25 mg/L in PT-3. A decreasing tendency was observed in the water from piezometers at the inlet, but at the measuring point at the outflow, the values remained at a high level. Since 2004, the results of monitoring nitrates in waters at the inflow from PT-1 have been within the limit for good chemical status of waters, with PT-2 it has been the case since mid-2001. In the case of outflow waters, most measurements were more than 50 mg/L and were above the permissible concentration for good chemical status of water.
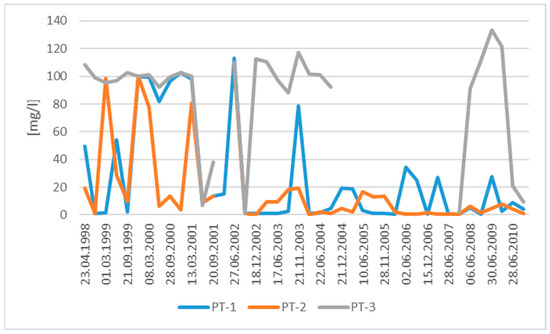
Figure 4.
Changes in NO3 values in piezometers.
The chloride content in groundwater ranged from 9.22 mg/L to 1132 mg/L. The lowest value was recorded at the water inlet zone, whereas the highest was recorded in the water in the PT-2 piezometer. The analysis of the average chloride concentration values showed that the results in the water inflow to the landfill were lower than in the outflow, where the average was twice as high and amounted to 615.07 mg/L. In Figure 5, which shows the variability of the chloride content in water from individual piezometers, it can be seen that a large number of measurements significantly exceeded the value for good chemical status of water. In particular, water in piezometers PT-2 and PT-3 showed increased values. Water results in the PT-1 piezometer since mid-2005 were within the limit of 250 mg/L for good chemical status of water.
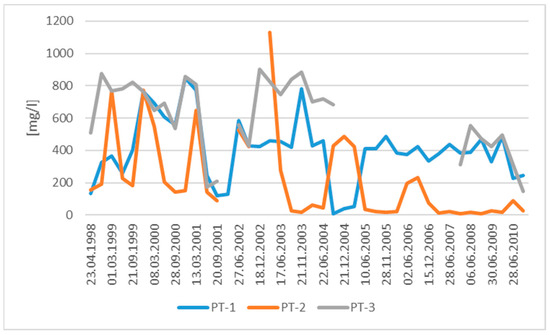
Figure 5.
Changes in Cl values in piezometers.
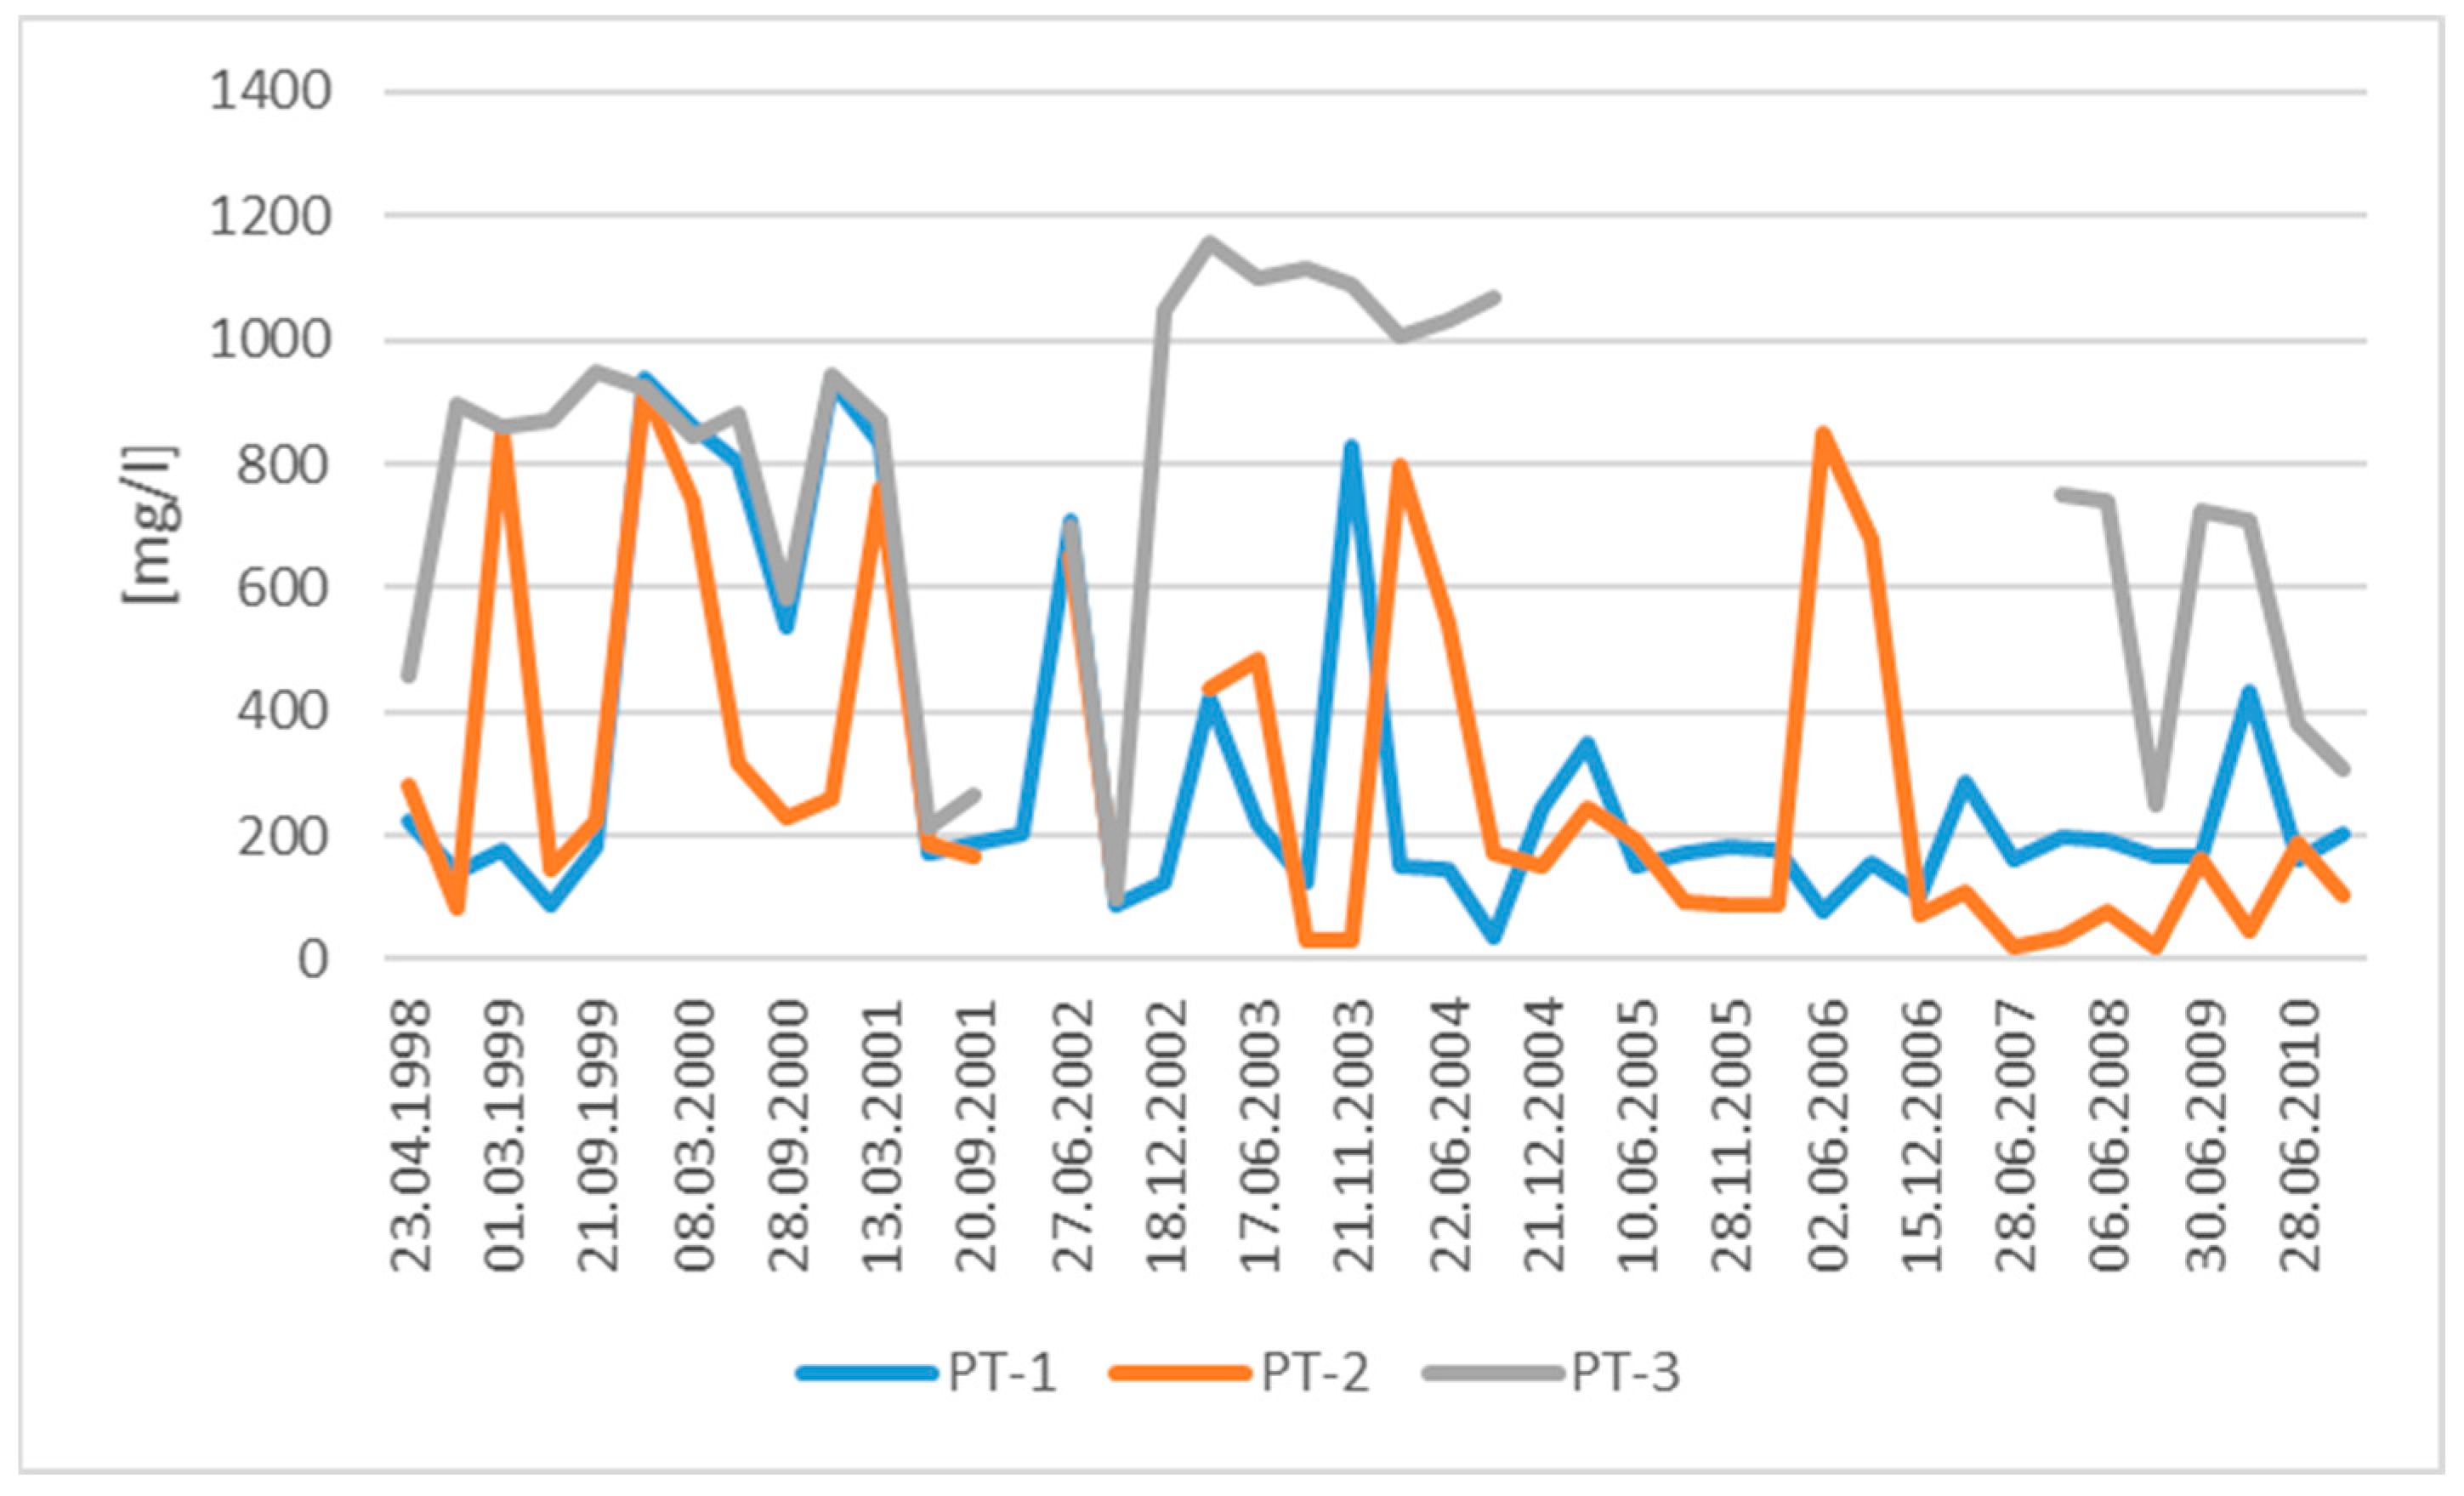
Analyzing the concentration of sulfates, it can be seen that the lowest value of 19.76 mg/L was recorded in the water from the piezometer at the inflow of water to the landfill, and the highest—1158 mg/L—in the water at the outflow. The average concentrations in water in piezometers at the inflow were 291.73 mg/L and 302.88 mg/L. However, in the outflow of water from the landfill they amounted to 761.37 mg/L. The limit value for good chemical status of water has been exceeded many times (Figure 6). Most often, water in the PT-3 piezometer showed values above 250 mg/L. Since 2004, the sulfate content in water in the inflow piezometers has decreased, with exceptions in 2005, 2006, 2007 and 2010.

Figure 6.
Changes in SO4 values in piezometers.
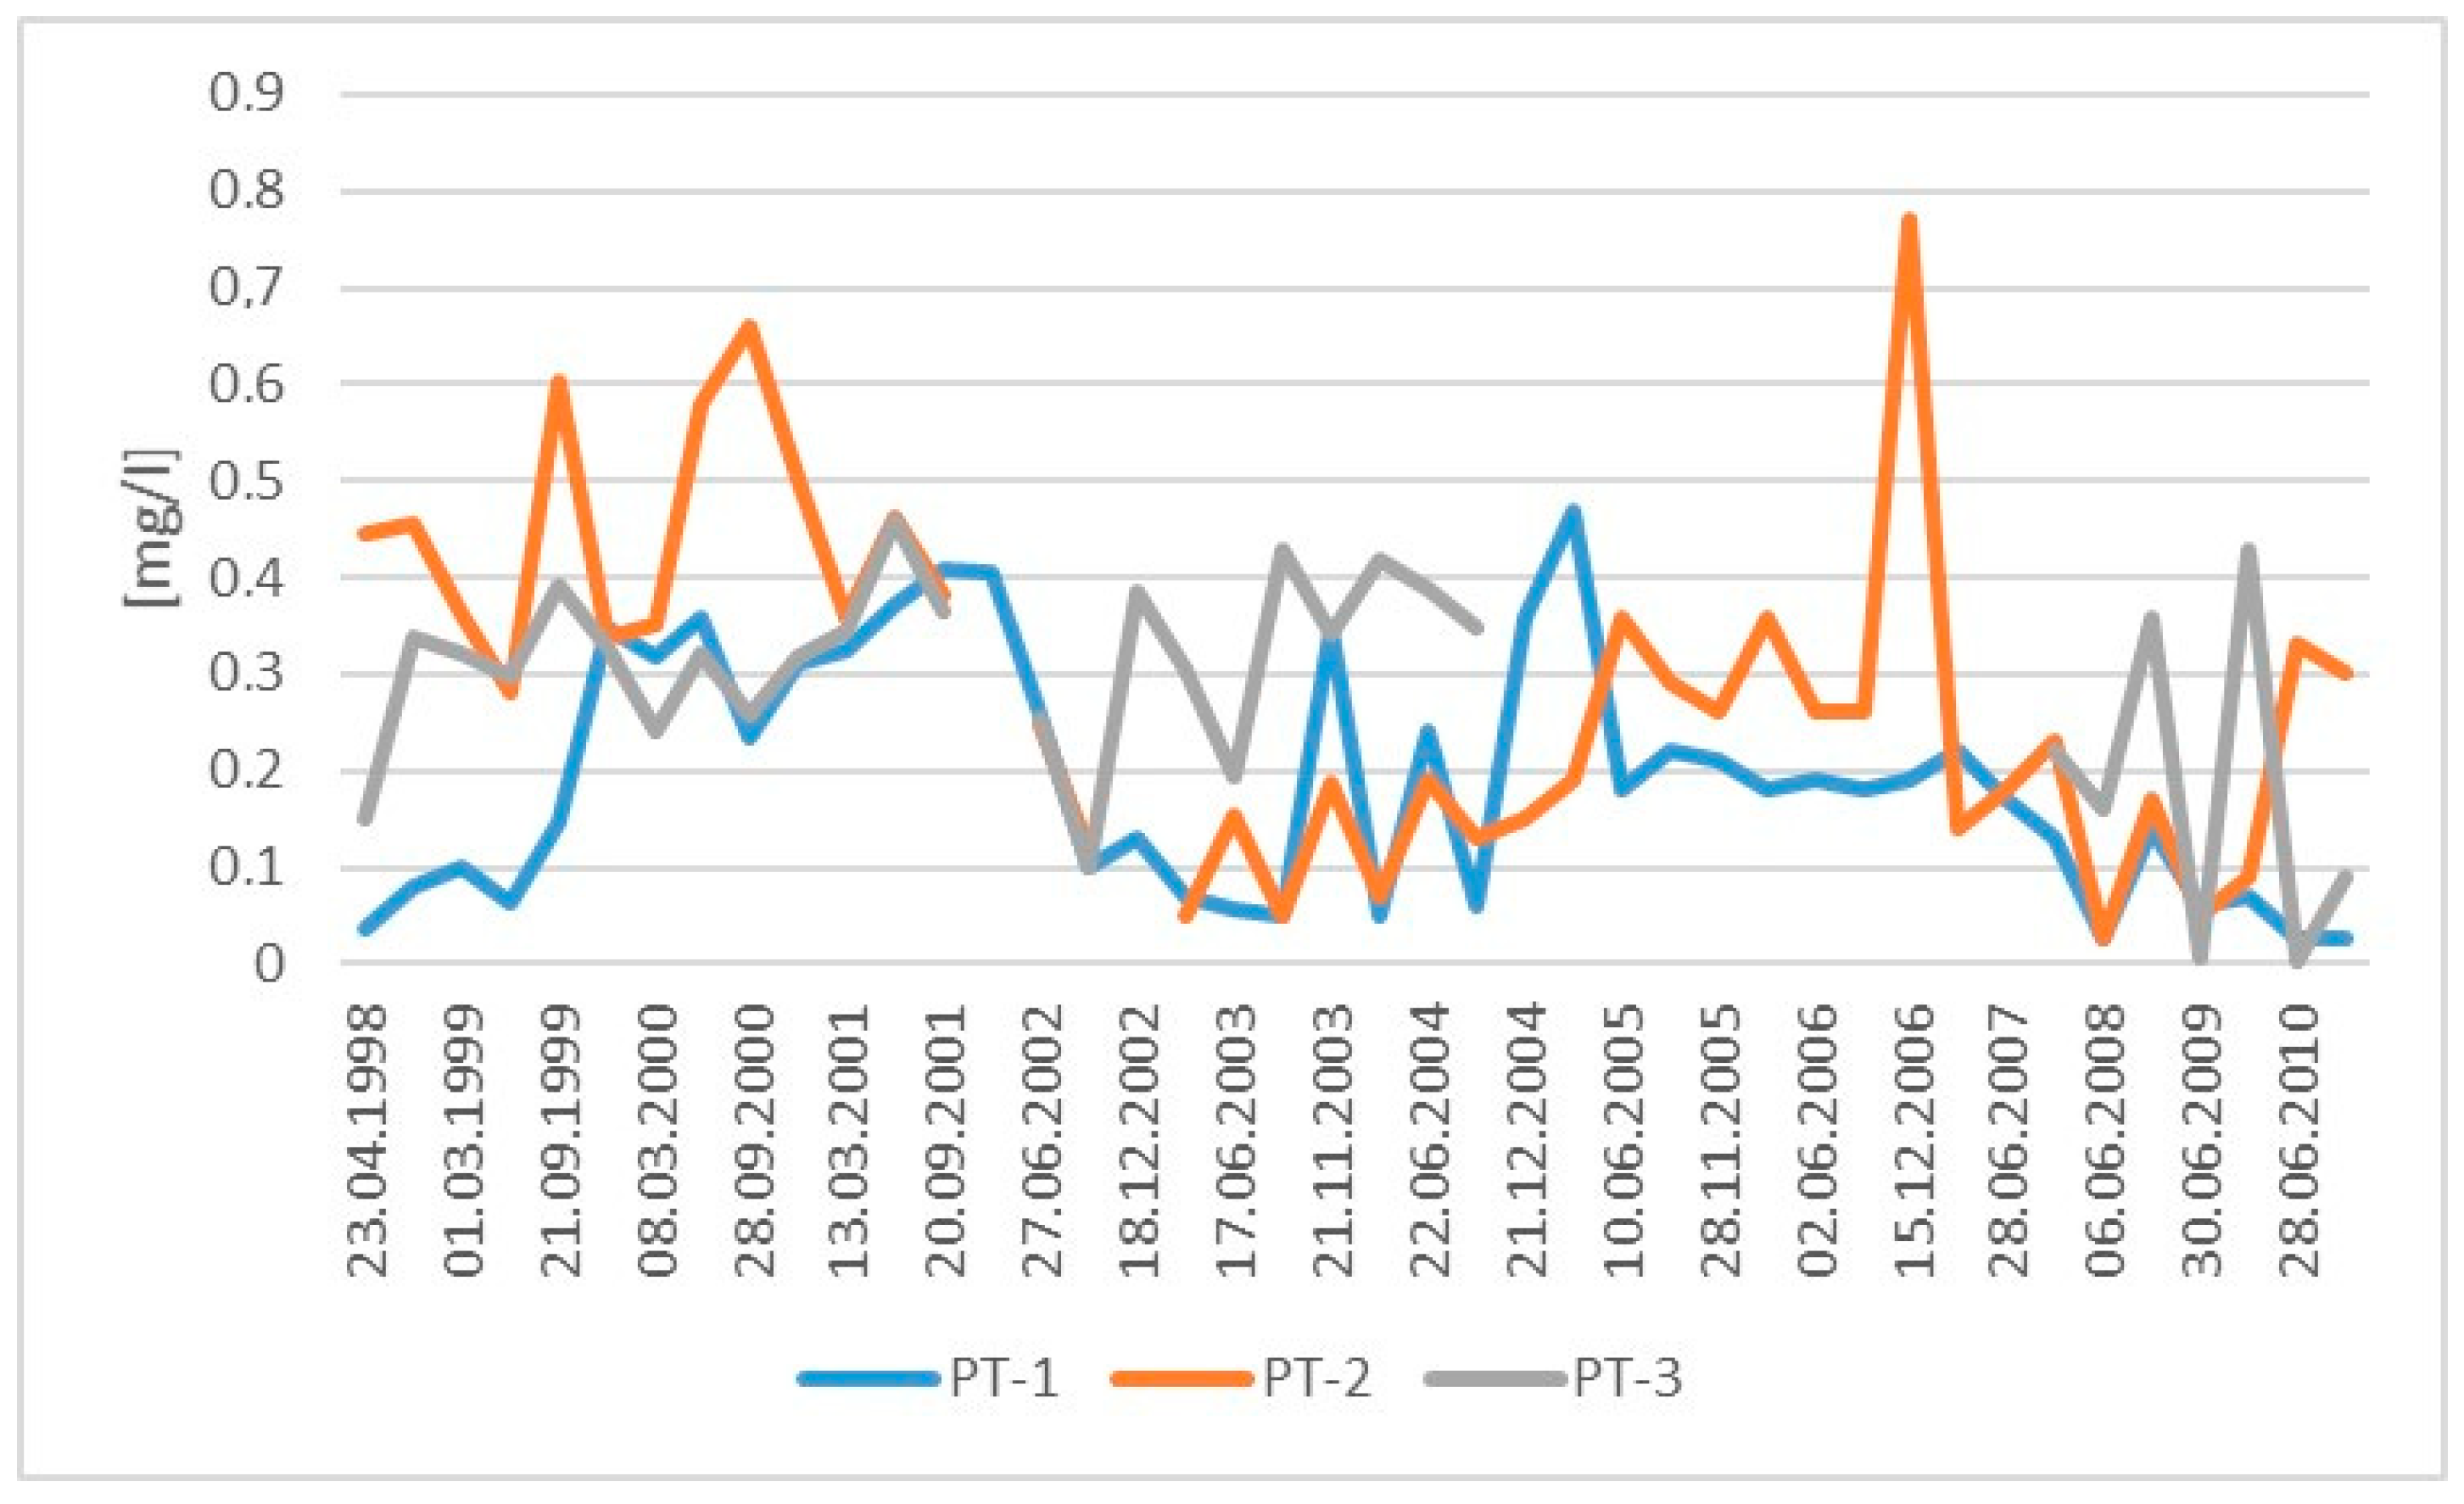
The boron concentration did not show much variability. The value <0.005 mg/L was observed as the lowest in water in piezometers PT-1 and PT-3, whereas the highest was observed in water in piezometer PT-2 and was equal to 0.77 mg/L. The average concentrations in the inflow waters were 0.19 mg/L and 0.28 mg/L, respectively, and in the landfill outflow waters, the concentration was 0.28 mg/L. The boron concentration did not exceed the limit value of good chemical status of waters (Figure 7).
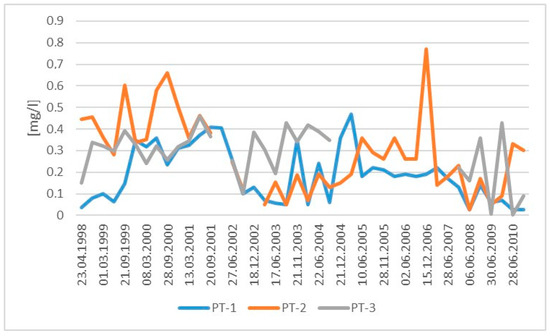
Figure 7.
Changes in B values in piezometers.
In the analysis of changes in the quality of selected physicochemical parameters, seasonal variability is visible for most of the analyzed parameters. Increased ammonium ion values were observed in the summer and autumn periods. In other cases, higher values were observed in the spring months. Based on the results of chemical analyses, it is not possible to determine whether changes in water quality over time were influenced by potential failures or changes in neighboring facilities. It should be noted that various biological, chemical and physical processes take place in the landfill body, which cause quality changes, such as gradual changes from oxidizing to reducing conditions or the gradual washing out of pollutants from the waste.
The LWPI was calculated based on average values from the monitoring data. The final values for this index were 164.64, 118.29 and 320.58 for piezometers PT-1, PT-2 and PT-3, respectively. The classification of values for the LWPI index indicates that moderately polluted waters are waters for which the index is between one and two, waters with a very visible landfill impact are waters for which the index is greater than two but less than or equal to five, and heavily polluted waters are characterized by an index greater than five [43]. Based on the calculations for this index from the analyzed three piezometers, it is clear that the waters are heavily polluted. The largest share in water pollution in the PT-1 piezometer, using calculations for this index, is the sulphate content. This is approximately 41% of the total value. Approximately 54% of the index value is due to the chloride content. This is related to the high importance of these parameters for water and the content in water itself. In the case of water from the PT-2 piezometer, approximately 55% of the total LWPI value is due to sulphates and 42% to chlorides. In the PT-3 piezometer the situation is similar, because sulfates account for 53% and chlorides, 43%. The remaining parameters are of secondary importance.
The construction of the NPI index does not take into account weights for individual parameters. Therefore, the values of this indicator are lower compared to LWPI. For water from the analyzed piezometers, the values were 43.82, 19.91 and 35.76 for piezometers PT-1, PT-2 and PT-3, respectively. The classification for this index suggests that when the values of the indices for individual parameters are lower than or equal to one, it means that the water is within the acceptable range for class III water quality and there is no visible impact of the landfill. The index values for these piezometers exceed one many times.
In the case of the PT-1 piezometer, the ammonium ion content has the largest share in the final index value (approximately 66%). In this case, the share of chlorides and sulfates is comparable—15 and 11%, respectively. For the PT-2 piezometer, 45% of the total index value falls on the ammonium ion. Chlorides constitute approximately 19% and sulfates, 24%. The share of individual components for water in the PT-3 piezometer is the most diverse. About 35% of the content is sulfates, 29% chlorides, 24% nitrates, and only about 10% ammonium ion. In all piezometers, boron is the least important.
NPI values have already been calculated for landfills in Tychy and Dąbrowa Górnicza [14,43]. In the case of the first research area, the values of this index even exceeded the value of 2000. However, this value is difficult to compare with the results obtained in this analysis due to the fact that the result concerned one piezometer located on the top of an inactive landfill with a different range of analyzed parameters. In the case of the second landfill, the values of this index exceeded 100, but here the limit values for the first class of water quality were considered as the hydrochemical background value, and the range of analyzed parameters was also different.
The LWPI index values indicate that the most polluted waters occur in the area of the PT-3 piezometer, which is also confirmed by the high conductivity value (as an indicator reflecting pollution), which for the years 2003–2017 always remained at a level higher than 1000. In the case of the NPI index, the highest the value was recorded for the PT-1 piezometer. In this piezometer, water with a conductivity of less than 600 was observed. If the values of this index were related to the value of specific electrical conductivity, the first index would be more reliable.
The LWPI index was used in the works [44,45]. In the first case, changes in the quality of groundwater in the area of the municipal waste landfill in Sosnowiec were investigated. Five physicochemical indicators were used to monitor quality, including conductivity, sulfates, chlorides, sodium and iron from 2014 to 2019. The values of these indicators were comparable to those obtained in this study (approximately 300). It should be noted that in the case of the landfill in Sosnowiec, the observation network was much larger.
The second article was based on the assessment of water quality based on 23 different parameters. The results obtained in this study cannot therefore be compared in any way. However, the highest LWPI value was approximately 42.
However, there may be doubts as to the final value of this indicator regarding the weights used. Due to the fact that the share of chlorides and sulfates will always be greater than the content of ammonium ion, it is impossible to obtain a large share of this parameter in the final value of the indicator.
The value of the NPI shows that the main ions have a significant impact on high index values, and what is more, it highlights the contribution of other selected ions. The ammonium ion is one of the most important pollution indicators in the area of municipal waste landfills [46]. In this context, it is important to emphasize the increased content of this parameter in groundwater. This, in turn, gives grounds to believe that the NPI is more reliable.
5. Conclusions
The non-hazardous and neutral waste landfill in Chorzów is located in an area of strong anthropopressure. There are many pollution hotspots within the landfill that may affect the environment. To analyze the course of variability of the chemical composition of the shell limestone level, the following parameters were selected: electrolytic conductivity, ammonium ion, nitrates, chlorides, sulphates and boron. Most parameters in the monitored mussel limestone waters significantly exceeded the permissible value of a given concentration for good chemical status of water. Only the boron content did not exceed the permissible limit throughout the entire test period. Chemical parameters were taken into account to determine the values of LWPI and NPI.
The obtained index values ranged from approximately 118 to approximately 320 in the case of LWPI and from approximately 20 to 44 in the case of the NPI index. The results obtained revealed that the quality of the groundwater in the region of the landfill in Chorzów has been impacted by this pollution source. However, these values are much lower than the analyzes performed for similar waste landfills located in the southern part of Poland.
The research results indicate that both indices can be used to assess the quality of groundwater in the vicinity of this landfill, but they give a different assessment of the degree of threat to water in different piezometers. In the case of the indicator taking into account weights for individual parameters, the most polluted waters are in the PT-3 piezometer, whereas for the NPI indicator, the worst water quality was recorded in the PT-1 piezometer. The first index emphasizes the importance of the main ions and their concentration in groundwater. The NPI index indicates other sources of pollution, such as ammonium ion.
LWPI values exceeding 320 suggest a very high threat to groundwater in this region. It is also worth mentioning that only a few parameters were taken into account for the threat assessment. Adding further indicators would increase the value of the indices and thus highlight the threat more. In addition to typical inorganic parameters, more and more attention is being paid to the content of herbicides and pesticides that are used in agricultural activities to combat agricultural pests, increase productivity and prevent financial losses, and which may enter the aquatic environment. Therefore, when conducting extended monitoring of water or soil quality, these parameters should be added.
In the current study, limit values for water quality class III were considered as a hydrochemical background. In order to be able to compare the obtained results with other values for other facilities, it would be necessary to create a database for municipal waste landfills and refer the results to the same hydrochemical background for identical parameters.
Author Contributions
Conceptualization, M.L. and D.D.; methodology, D.D.; software, M.L.; validation, D.D.; writing—original draft preparation, M.L.; writing—review and editing, D.D. All authors have read and agreed to the published version of the manuscript.
Funding
This research received no external funding.
Institutional Review Board Statement
Not applicable.
Informed Consent Statement
Not applicable.
Data Availability Statement
Data are contained within the article.
Conflicts of Interest
The authors declare no conflicts of interest.
References
- Dabrowska, D.; Witkowski, A.; Sołtysiak, M. Application of pollution indices for the assessment of the negative impact of a municipal landfill on groundwater (Tychy, southern Poland). Geol. Q. 2018, 62, 496–508. [Google Scholar] [CrossRef]
- Šourková, M.; Adamcová, D.; Zloch, J.; Skutnik, Z.; Vaverková, M. Evaluation of the Phytotoxicity of Leachate from a Municipal Solid Waste Landfill: The Case Study of Bukov Landfill. Environments 2020, 7, 111. [Google Scholar] [CrossRef]
- Koda, E.; Miszkowska, A.; Sieczka, A.; Osinski, P. Heavy metal contamination within a restored landfill site. Environ. Geotech. 2018, 7, 512–521. [Google Scholar] [CrossRef]
- Wdowczyk, A.; Szymanska-Pulikowska, A. How to Choose Pollution Indicators for Monitoring Landfill Leachates. Proceedings 2020, 51, 23. [Google Scholar]
- Vaverková, M.; Elbl, J.; Koda, E.; Adamcová, D.; Bilgin, A.; Lukas, V.; Podlasek, A.; Kintl, A.; Wdowska, M.; Brtnický, M.; et al. Chemical Composition and Hazardous Effects of Leachate from the Active Municipal Solid Waste Landfill Surrounded by Farmlands. Sustainability 2020, 12, 4531. [Google Scholar] [CrossRef]
- Li, Y.; Li, J.; Chen, S.; Diao, W. Establishing indices for groundwater contamination risk assessment in the vicinity of hazardous waste landfills in China. Environ. Pollut. 2012, 165, 77–90. [Google Scholar] [CrossRef]
- Singh, P.; Verma, P.; Tiwari, A.; Sharma, S.; Purty, P. Review of various contamination index approaches to evaluate groundwater quality with Geographic Information System (GIS). Int. J. ChemTech Res. 2015, 7, 1920–1929. [Google Scholar]
- Shivasharanappa, P.; Huggi, M. Assessment of ground water quality characteristics and water quality index (WQI) of Bidar city and its industrial area, Karnataka state, India. Int. J. Environ. Sci. 2011, 2, 965–976. [Google Scholar]
- Bhuiyan, M.; Bodrud-Doza, M.; Islam, A.; Rakib, M.; Rahman, M.; Ramanathan, A. Assessment of groundwater quality of Lakshimpur district of Bangladesh using water quality indices, geostatistical methods, and multivariate analysis. Environ. Earth Sci. 2016, 75, 1020. [Google Scholar] [CrossRef]
- Clark, T.; Piskin, R. Chemical quality and indicator parameters for monitoring landfill leachate in Illinois. Environ. Geol. 1977, 1, 329–340. [Google Scholar] [CrossRef]
- Nielsen, D. Practical Handbook of Environmental Site Characterization and Ground-Water Monitoring, 2nd ed.; CRC Press: Boca Raton, FL, USA; Taylor & Francis Group: Abingdon, UK, 2006. [Google Scholar]
- Quevauviller, P.; Fouillac, A.; Grath, J.; Ward, R. Groundwater Monitoring; Water Quality Measurements Series; John Willey & Sons, Ltd.: Hoboken, NJ, USA, 2009. [Google Scholar]
- El-Bindarya, M.; Shahat, A.; El-Deen, I.; Khalil, M.; Hassan, N. Dual colorimetric and fluorometric monitoring of Cd2+ and Hg2+ ions in water using functionalized Zrmetal–organic frameworks chemosensors. Appl. Organomet. Chem. 2023, 37, e7070. [Google Scholar] [CrossRef]
- Dąbrowska, D.; Witkowski, A.J. Groundwater and Human Health Risk Assessment in the Vicinity of a Municipal Waste Landfill in Tychy, Poland. Appl. Sci. 2022, 12, 12898. [Google Scholar] [CrossRef]
- Phan, K.A.; Phihusut, D.; Tuntiwiwattanapun, N. Preparation of rice husk hydrochar as an atrazine adsorbent: Optimization, characterization, and adsorption mechanisms. J. Environ. Chem. Eng. 2022, 10, 107575. [Google Scholar] [CrossRef]
- Gogu, R.; Hallet, V.; Dassargues, A. Comparison of aquifer vulnerability assessment techniques. Application to the Néblon river basin (Belgium). Environ. Geol. 2003, 44, 881–892. [Google Scholar] [CrossRef]
- Masocha, M.; Dube, T.; Owen, R. Using an expert-based model to develop a groundwater pollution vulnerability assessment framework for Zimbabwe. Phys. Chem. Earth Parts A/B/C 2020, 115, 102826. [Google Scholar] [CrossRef]
- Misi, A.; Gumindoga, W.; Hoko, Z. An assessment of groundwater potential and vulnerability in the Upper Manyame Sub-Catchment of Zimbabwe. Phys. Chem. Earth, Parts A/B/C 2018, 105, 72–83. [Google Scholar] [CrossRef]
- Oke, S.; Vermeulen, D.; Gomo, M. Aquifer vulnerability assessment of the Dahomey Basin using the RTt method. Environ. Earth Sci. 2016, 75, 964. [Google Scholar] [CrossRef]
- Troiano, J.; Spurlock, F.; Marade, J. Update of the California Vulnerability Soil Analysis for Movement of Pesticides to Groundwater; Department of Pesticide Regulation: Sacramento, CA, USA, 2009. [Google Scholar]
- Singh, R.; Venkatesh, A.S.; Syed, T.H.; Reddy, A.; Kumar, M.; Kurakalva, R.M. Assessment of potentially toxic trace elements contamination in groundwater resources of the coal mining area of the Korba Coalfield, Central India. Environ. Earth Sci. 2015, 76, 566. [Google Scholar] [CrossRef]
- Horton, R.K. An index number system for rating water quality. J. Water Pollut. Control. Fed. 1965, 37, 300–305. [Google Scholar]
- Abbasi, T.; Abbasi, S. Water Quality Indices; 2012; pp. 353–356. Available online: https://www.semanticscholar.org/paper/Water-Quality-Indices-Abbasi-Abbasi/467f384dc2c4ac24fb12a9517f2ff525e173e3ba (accessed on 18 December 2023). [CrossRef]
- Adimalla, N.; Qian, H. Groundwater quality evaluation using water quality index (WQI) for drinking purposes and human health risk (HHR) assessment in an agricultural region of Nanga-nur, South India. Ecotoxicol. Environ. Saf. 2019, 176, 153–161. [Google Scholar] [CrossRef]
- Backman, B.; Bodis, D.; Lahermo, P.; Rapant, S.; Tarvainen, T. Application of a contamination index in Finland and Slovakia. Environ. Geol. 1998, 36, 55–64. [Google Scholar] [CrossRef]
- Alam, R.; Ahmed, Z.; Howladar, M.F. Evaluation of heavy metal contamination in water, soil and plant around the open landfill site Mogla Bazar in Sylhet, Bangladesh. Groundw. Sustainability 2020, 10, 100311. [Google Scholar] [CrossRef]
- Mohan, S.; Nithila, P.; Reddy, S. Estimation of heavy metal in drinking water and development of heavy metal pollution index. J. Environ. Sci. Health 1996, 31, 283–289. [Google Scholar] [CrossRef]
- Rezaee, H.; Asghari, O.; Yamamoto, J. On the reduction of the ordinary kriging smoothing effect. J. Min. Environ. 2011, 2, 25–40. [Google Scholar]
- Sarhat, A.R.; Al-Obaidi, B.S. Contamination by Heavy Metals in the Sediments of Sirwan/Diyala River, Garmian Region. IOP Conf. Ser. Earth Environ. Sci. 2023, 1158, 022010. [Google Scholar] [CrossRef]
- Talalaj, I.; Biedka, P. Use of the Landfill Water Pollution Index (LWPI) for Groundwater Quality Assessment Near the Landfill Sites. Environ. Sci. Pollut. Res. 2016, 23, 24601–24613. [Google Scholar] [CrossRef]
- Xu, L.; Dai, H.; Skuza, L.; Wei, S. Comprehensive exploration of heavy metal contamination and risk assessment at two common smelter sites. Chemosphere 2021, 285, 131350. [Google Scholar] [CrossRef] [PubMed]
- Zhang, Q.; Feng, M.; Hao, X. Application of Nemerow Index Method and Integrated Water Quality Index Method in Water Quality Assessment of Zhangze Reservoir. IOP Conf. Ser. Earth Environ. Sci. 2018, 128, 012160. [Google Scholar] [CrossRef]
- Civita, M. The combined approach when assessing and mapping groundwater vulnerability to contamination. Water Resour. Prot. 2010, 2, 14–28. [Google Scholar] [CrossRef]
- Cudak, J.; Wantuch, A. Chorzów. Groundwater in Polish Cities; Countries Geological Institute: Warsaw, Poland, 2009; pp. 58–71. [Google Scholar]
- Gruszczyńska, E. (Ed.) Explanations to the Detailed Geological Map of Poland 1:50,000; Zabrze Sheet Geological Institute: Warsaw, Poland, 2015. [Google Scholar]
- Dulias, R. Geological Structure [in]; Hibszer, A., Runge, J., Eds.; Geographical Environment T.1: Chorzów; Museum of Chorzów: Chorzów, Poland, 2017. [Google Scholar]
- Biernat, S. Explanations to the Detailed Geological Map of Poland 1:50,000; Katowice Sheet: Warsaw, Poland, 1970. [Google Scholar]
- Żero, E. Explanations to the Detailed Geological Map of Poland 1:50,000; Sheet Bytom Geological Institute: Warsaw, Poland, 1968. [Google Scholar]
- Paczyński, B. (Ed.) Hydrogeological Atlas of Poland 1:500,000; States Geological Institute: Warsaw, Poland, 1995. [Google Scholar]
- Michalik, J. (Ed.) Environmental Protection Program with a Waste Management Plan for the City of Chorzów, Arch; City Hall in Chorzów: Chorzów, Poland, 2003. [Google Scholar]
- Bielewicz, R.; Nocoń, J. Report on Research in the Area of the Municipal Waste Landfill in Chorzów; Archive of the Katowice Geological Enterprise: Katowice, Poland, 2007. [Google Scholar]
- Talalaj, I. Assessment of groundwater quality near the landfill site using the modified water quality index. Environ. Monit. Assess 2014, 186, 3673–3683. [Google Scholar] [CrossRef]
- Łukasik, M.; Dąbrowska, D. Groundwater quality testing in the area of municipal waste landfill sites in Dąbrowa Górnicza (southern Poland). Environ. Socio-Econ. Stud. 2022, 10, 13–21. [Google Scholar] [CrossRef]
- Knopek, T.; Dabrowska, D. The Use of the Contamination Index and the LWPI Index to Assess the Quality of Groundwater in the Area of a Municipal Waste Landfill. Toxics 2021, 9, 66. [Google Scholar] [CrossRef] [PubMed]
- Baghanam, A.; Nourani, V.; Aslani, H.; Taghipour, H. Spatiotemporal variation of water pollution near landfill site: Application of clustering methods to assess the admissibility of LWPI. J. Hydrol. 2020, 591, 125581. [Google Scholar] [CrossRef]
- Witkowski, A.J.; Dąbrowska, D.; Wróbel, J. Groundwater Quality Assessment in the Area of the Zinc Smelter in Miasteczko Śląskie (Poland) Using Selected Metal Indices. Water 2024, 16, 279. [Google Scholar] [CrossRef]


Disclaimer/Publisher’s Note: The statements, opinions and data contained in all publications are solely those of the individual author(s) and contributor(s) and not of MDPI and/or the editor(s). MDPI and/or the editor(s) disclaim responsibility for any injury to people or property resulting from any ideas, methods, instructions or products referred to in the content. |
© 2024 by the authors. Licensee MDPI, Basel, Switzerland. This article is an open access article distributed under the terms and conditions of the Creative Commons Attribution (CC BY) license (https://creativecommons.org/licenses/by/4.0/).