Article

Study on the Mechanism of Safety Risk Propagation in Subway Construction Projects

1
Management Science and Engineering, Tianjin University, Tianjin 300072, China
2
College of Civil Engineering, Lanzhou Jiaotong University, Lanzhou 730070, China
3
Key Laboratory of Road and Traffic Engineering of the Ministry of Education, Tongji University, Shanghai 201804, China
*
Author to whom correspondence should be addressed.
Sustainability 2024, 16(2), 796; https://doi.org/10.3390/su16020796
Submission received: 22 November 2023 / Revised: 29 December 2023 / Accepted: 9 January 2024 / Published: 17 January 2024

Abstract

:
Under the development trend of complexity and systematization of metro construction, there is an increasing number of risk factors potentially affecting construction safety, which has led to frequent accidents in metro construction projects, and the road to high-quality and sustainable development of metro construction is full of challenges. One of the essential reasons is that the propagation mechanism of safety risk factors in metro construction under hidden and delayed effects is not yet clear. This paper combines the theory of complex network and propagation dynamics and constructs a subway construction safety risk propagation model based on considering the hidden and delayed characteristics of construction safety risk propagation, which reveals the dynamic propagation law of subway construction safety risk and puts forward feasible coping strategies. The findings evince that the delay time T significantly affects the propagation behavior of risk and the achievement of the equilibrium state in the network. The transmissibility of the risk factor within the hidden state holds a pivotal sway over the entirety of risk propagation, and the latency in transmission significantly expedites the propagation of risk throughout the network. It is recommended that project managers monitor and warn safety state nodes and hidden state nodes to block the spread of risk in the network and control the delay time of risk in the network in time to reduce the probability of risk occurrence. This study significantly promotes the resilient management of safety risks in metro construction.

1. Introduction

1.1. Background

With the continuous progress of urbanization, the metro, as an efficient and fast urban transport mode, has gradually become an indispensable part of modern cities [1]. However, the rapid development of metro construction is accompanied by a high accident rate. Once an accident occurs, it not only poses a significant threat to the progress, cost, and corporate reputation of the metro project but may even have a far-reaching impact on the city’s transport system, environment, and society [2]. For example, on 1 December 2019, a subsidence accident occurred in the construction area of the Shaha Station of Line 11 of the Guangzhou Metro, resulting in three deaths and a direct economic loss of about CNY 2004.7 million. On 10 September 2021, during the construction of the metro project of Line 17 in Chengdu City, Sichuan Province, part of the dust and noise reduction shed collapsed, resulting in four deaths, 14 injuries, and a direct economic loss of more than CNY 6.5 million. As an essential element of sustainable construction management, Metro construction safety must be reduced to achieve sustainable management of metro construction safety.
Construction accidents can involve complex technical, people management, and environmental factors. According to the theory of accident causation, accidents can be ascribed to a combination of many factors [3]. Therefore, it is essential to proactively analyze and manage construction safety risk factors, namely, the triggers and origins of construction safety accidents [3]. Numerous studies have identified potential risk factors affecting metro construction safety regarding technology, environment, management, and stakeholders [4]. At the same time, some scholars have confirmed that these risk factors are interrelated and form a complex network structure. They have provided strategies for responding to risk based on the interactions and causal links of safety risk factors in subway construction [5]. However, this does not eliminate safety risks during metro construction because the interrelation among safety risk factors increases the possibility and path of risk propagation. The appearance of an unfavorable factor may not only affect itself but also interact with and propagate risk to the associated risk factors [6]. In addition, the systematic complexity and environmental complexity of the subway construction process make the correlation between the safety risk factors increase, the mutual influence is enhanced, and the small unfavorable factors may be significantly amplified by the feedback structure in the network, triggering the “domino” effect in the network, which is transformed into a significant safety hazard, so that the frequency of safety accidents multiplies [7]. However, few studies have focused on the mechanisms of propagation of safety risks in metro construction, which is equally crucial for risk prevention of similar accidents.
Propagation dynamics is a theoretical method to study infectious diseases quantitatively. With its continuous development, many scholars have improved the classical model, and its application scope has been gradually extended from medical to engineering. Wang combines epidemic modeling with complex networks to explore the risk propagation mechanism in the supply chain of assembly construction projects [8]. Chen combines stakeholders’ risk resilience and risk mitigation capabilities to analyze the risk propagation of delayed payments in large hydropower projects based on an improved SIS model [9]. Because of the similarity between virus propagation and metro construction safety risk propagation in terms of propagation object, propagation process, and propagation environment, the infectious disease model can be borrowed to reveal the propagation mechanism of metro construction safety risk.

1.2. Point of Departure

Due to the hidden and delayed nature of the propagation of safety risks in metro construction, risks in the hidden state do not have apparent characteristics and can be easily overlooked, thus underestimating the harm caused by risks in the hidden state. However, hidden risks can still continuously propagate risks and accumulate risks. In addition, the outbreak of a particular risk or certain risks will not directly lead to the mutation of other related risks because the threshold of its related risk cordon has not been reached, and it is necessary to reach the point of the outbreak of risk through continuous accumulation to lead to the propagation of construction safety risks. However, the two characteristics of the hidden and delayed nature of safety risk propagation have yet to be considered in metro construction safety.
Given this, this study takes the hidden and delayed nature of metro construction safety risk propagation as the entry point, based on the complex network perspective, applies the relevant theoretical methods of the SEIR model to conduct in-depth research, and constructs a subway construction safety risk propagation dynamics model to provide influential theories. This allows further exploring of the characteristics of subway construction safety risk propagation, which will help to propose effective prevention and control measures for possible safety risks in metro construction, better decrease the occurrence of subway construction safety accidents, and promote the sustainable development of the subway construction.
The remainder of this paper is organized as follows: Section 2 constructs a metro construction safety risk network and its topological characterization; Section 3 makes a subway construction safety risk propagation dynamics model; Section 4 performs numerical simulation to simulate and analyze the process of subway construction safety risk propagation; and Section 5 summarizes the key conclusions and limitations of this study.

2. Literature Review

2.1. Construction Safety in Sustainability

Metro construction accidents have seriously impacted the sustainable management of metro construction safety. For example, on 12 October 2021, an under-construction project in the southern section of Tianjin Metro Line 4 suffered a collapse accident resulting in four deaths, one minor injury, and a direct economic loss of RMB 6.676 million. The casualties and high financial loss caused by this accident directly affected the progress and feasibility of the project and simultaneously hurt the company’s reputation. In summary, metro construction accidents are multidimensional to the sustainable management of construction safety. Once an accident occurs, the most direct impact is the threat to the safety and health of personnel, which may lead to injuries or life-threatening injuries to workers and bring substantial legal liabilities and heavy financial burdens to the company [10]. Secondly, accidents often lead to serious legal consequences for the company, bringing with them legal liability and reputational damage that can hurt the business in the long term [11]. Thirdly, construction activities such as pollution and noise may adversely impact the environment, threatening the ecological balance and land availability [12]. In addition, social responsibility issues are significant, causing dissatisfaction among workers and communities and affecting social support. Finally, the economic impact is also essential, as safety issues can lead to project delays and additional costs. Scholars have also realized the importance of construction safety for the sustainable management of engineering construction, and a series of related studies have been conducted. Kim derived the priority of accident causes for each crane type as an example of tower crane type construction accidents in Korea and used it for sustainable management of construction sites [13]. Dong emphasized that construction safety management is as important as financial, schedule, and quality management and included construction safety management in the sustainable performance evaluation system [14]. Ensuring metro construction safety and minimizing construction accidents are essential to achieving sustainable management of metro construction safety.

2.2. Metro Construction Safety Risks

Metro projects have the characteristics of hidden, complex engineering technology, complex hydrogeological conditions, and an uncertain surrounding environment, which makes it difficult for the construction process; there are many unstable risk factors. Once a safety accident occurs, it will not only cause economic losses, casualties, loss of time, environmental damage, and so on, but it will also bring a terrible social impact. Many scholars have paid extensive attention to underground construction safety from different angles. Xu developed an improved text mining method to identify safety risk factors from many metro accident reports to identify better typical metro construction safety risk factors [5]. Xing developed a domain ontology (SRI-Onto) to formalize the knowledge of safety risks in metro construction, which lays the foundation for safety risk identification by all involved parties [15]. Based on risk identification, Wang proposed a systematic decision support method based on the Fuzzy Comprehensive Bayesian Network for safety risk analysis of metro construction projects under uncertainty, which provides a tool for engineers to systematically assess and mitigate the risks associated with metro construction [16]. Yan combined fuzzy set and object element theory to propose a fuzzy object element model for risk assessment [17]. Ding proposed a safety risk management system for the whole process of metro tunnel construction and applied it to the Wuhan Yangtze River Metro [18]. Ding combined the work decomposition structure with three-dimensional technology to construct a visual risk management system for metro construction [19]. Existing studies mainly focus on identifying, assessing, and managing safety risk factors in metro construction. At the same time, it has also been argued that the results of existing studies often deviate from the actual situation to a certain extent due to the failure to consider the coupling and interaction between safety risks [20]. In recent years, this issue has attracted more and more attention. To scientifically analyze the key causal factors of existing metro collapse accidents and their interaction coupling mechanism, Fang constructed the FTA-24 Model accident cause analysis framework based on the Fault Tree Analysis and Behavioral Safety “2–4” Model, combining their respective characteristics [21]. Fu established a general risk interaction modeling and analysis procedure based on association rule mining and weighted network theory and studied the interaction between the safety risks of metro-deep foundation pit projects with China as an example [22]. The above findings illustrate that various risk factors in metro construction are intertwined and superimposed to form a complex network structure. In the metro construction safety risk network, risks can spread to each other through the path of action between factors. When risks are undetected and not controlled in time, the risk sources will propagate in a chain reaction, which may lead to metro construction safety accidents. However, the existing research mainly focuses on static analysis and lacks the mechanism of metro construction safety risk propagation from a dynamic perspective.

2.3. Risk Propagation Models

Infectious disease models in communication dynamics models are often used to study the propagation mechanism of risk, and standard infectious disease models include the susceptible-infected (SI) model, susceptible-infected-susceptible (SIS) model, susceptible-infected-recovered (SIR) model and susceptible-exposed-infected-recovered (SEIR) model [23]. Based on various considerations, numerous researchers have improved the classic models mentioned above, and their applications have been gradually extended from the medical field to other fields, such as opinion communication [24] and engineering risk [25]. Tchavdar presented and applied a method for resolving an Adaptive Susceptible-Infected-Removed (A-SIR) epidemic model with time-varying propagation and removal rates of COVID-19 in Latin America [26]. He Huang developed a two-layered network to simulate the interaction between spreading epidemic and competitive information spreading to reduce the negative impact of rumors [27]. Wang established a risk propagation model that considered a recurrent Susceptible–Exposed–Asymptomatic–Infectious–Recovered (abbr. SEAIR) model based on considering asymptomatic infections and relapse, systematically analyzing the risks in the supply chain and calculating the risk equilibrium point to find that the risks can exist in the supply chain for a long period [28]. Previous studies have investigated the improvement of infectious disease modeling and its application in different fields from different perspectives, and many research results have been achieved. However, during the COVID-19 outbreak, researchers found that people do not show symptoms at the first sign of infection and that the spread of the virus tends to be somewhat insidious and delayed. To more accurately describe the transmission mechanism of the virus, some scholars have considered the effect of delay on the spread of the outbreak. Kang investigated a SEIR model with delays on scale-free networks that more accurately modeled the space of real epidemics [29]. Kiselev, to reproduce observable infection dynamics, proposes a new approach to modeling epidemic dynamics based on a system of differential equations with time lags and transient transitions, which is used in the development of the COVID-19 pandemic delay model for Germany and France, where the results show more accurate predictions [30]. Similarly, the occurrence of metro construction accidents is not synchronized with risk factors, and risks tend to be hidden and delayed in their propagation. For example, the negligence of on-site management personnel and the work errors of supervision personnel can infect workers, causing them to engage in illegal operations and threaten the construction safety of subway projects. For example, when the safety education and training of the construction unit are insufficient, it can lead to the immaturity of workers’ professional skills. In the short term, during the construction process, when other construction conditions are good, the operational errors of workers may not lead to construction safety risks. However, over time, the accumulation of worker error experiences can directly cause a sudden change in construction safety risks from a stable state to an unstable state at a particular moment; this leads to the occurrence of subway construction safety accidents. This indicates that the transmission of subway construction safety risks and virus transmission have similarities regarding transmission targets, processes, and environments. Therefore, infectious disease models can be used to reveal the transmission mechanism of subway construction safety risks. However, currently, there are few studies on the spread of subway construction safety risks based on considering the concealment and delay of risks.

3. Generation and Attributes Analysis of the Subway Construction Safety Risk Network (SCSRN)

3.1. Identification of Safety Risks in Subway Construction

According to the definition of “causal event” in GB6441-1986, construction safety risk factors are any major, unplanned, or unexpected factors that lead to accidents [31]. Accidents can be prevented if these factors are eliminated, or their severity or frequency can be reduced. Usually, construction safety accident case reports provide an in-depth discussion of the accident and give the direct or indirect causes of the accident to warn similar projects to take preventive measures in advance to avoid accidents. The accident data published by the Occupational Safety and Health Administration (OSHA) in the United States includes detailed processes and accident attributes of the accident [32]. Aneurin studied the risks associated with truss installation in construction projects using the OSHA database [33]. Therefore, the causes in accident reports can be used as risk factors affecting metro construction safety [3]. This study extracted a preliminary list of construction safety risks by organizing subway construction safety accident reports in the past ten years. Then, the initial list was supplemented and enriched by combining a literature review, laws, and standards related to subway construction safety management (GB6441-1986 and GB/T15236-2008) [31,34]. On this basis, on 17 June 2023, 10 employees from the metro construction project in Tianjin, China, were invited to partake in semi-structured interviews to optimize and adjust the preliminary list. The fundamental information of the interviewees is shown in Table 1. It is summarized that there is a complex coupling relationship between the four elements of metro engineering construction safety: human factors, management factors, material/equipment factors, and environmental factors. Unsafe human behavior and unsafe conditions of materials/machinery are usually the two types of direct causes of injury or damage [5]. Indirect causes can be traced back to inadequate managerial policies, methodologies, and decisions that may influence unsafe behaviors or conditions. Notably, given that the success of a metro project relies more on the deep involvement and cooperation of various stakeholders, this paper considers safety risk factors associated with a wide range of project stakeholders, including design, supervision, monitoring, and surveying [7]. In addition, harsh environmental factors such as hydrogeology, gales, and rainstorms may add to the uncertainty of site management or working practices. Table 2 summarizes the finalized list of safety risks in metro construction.

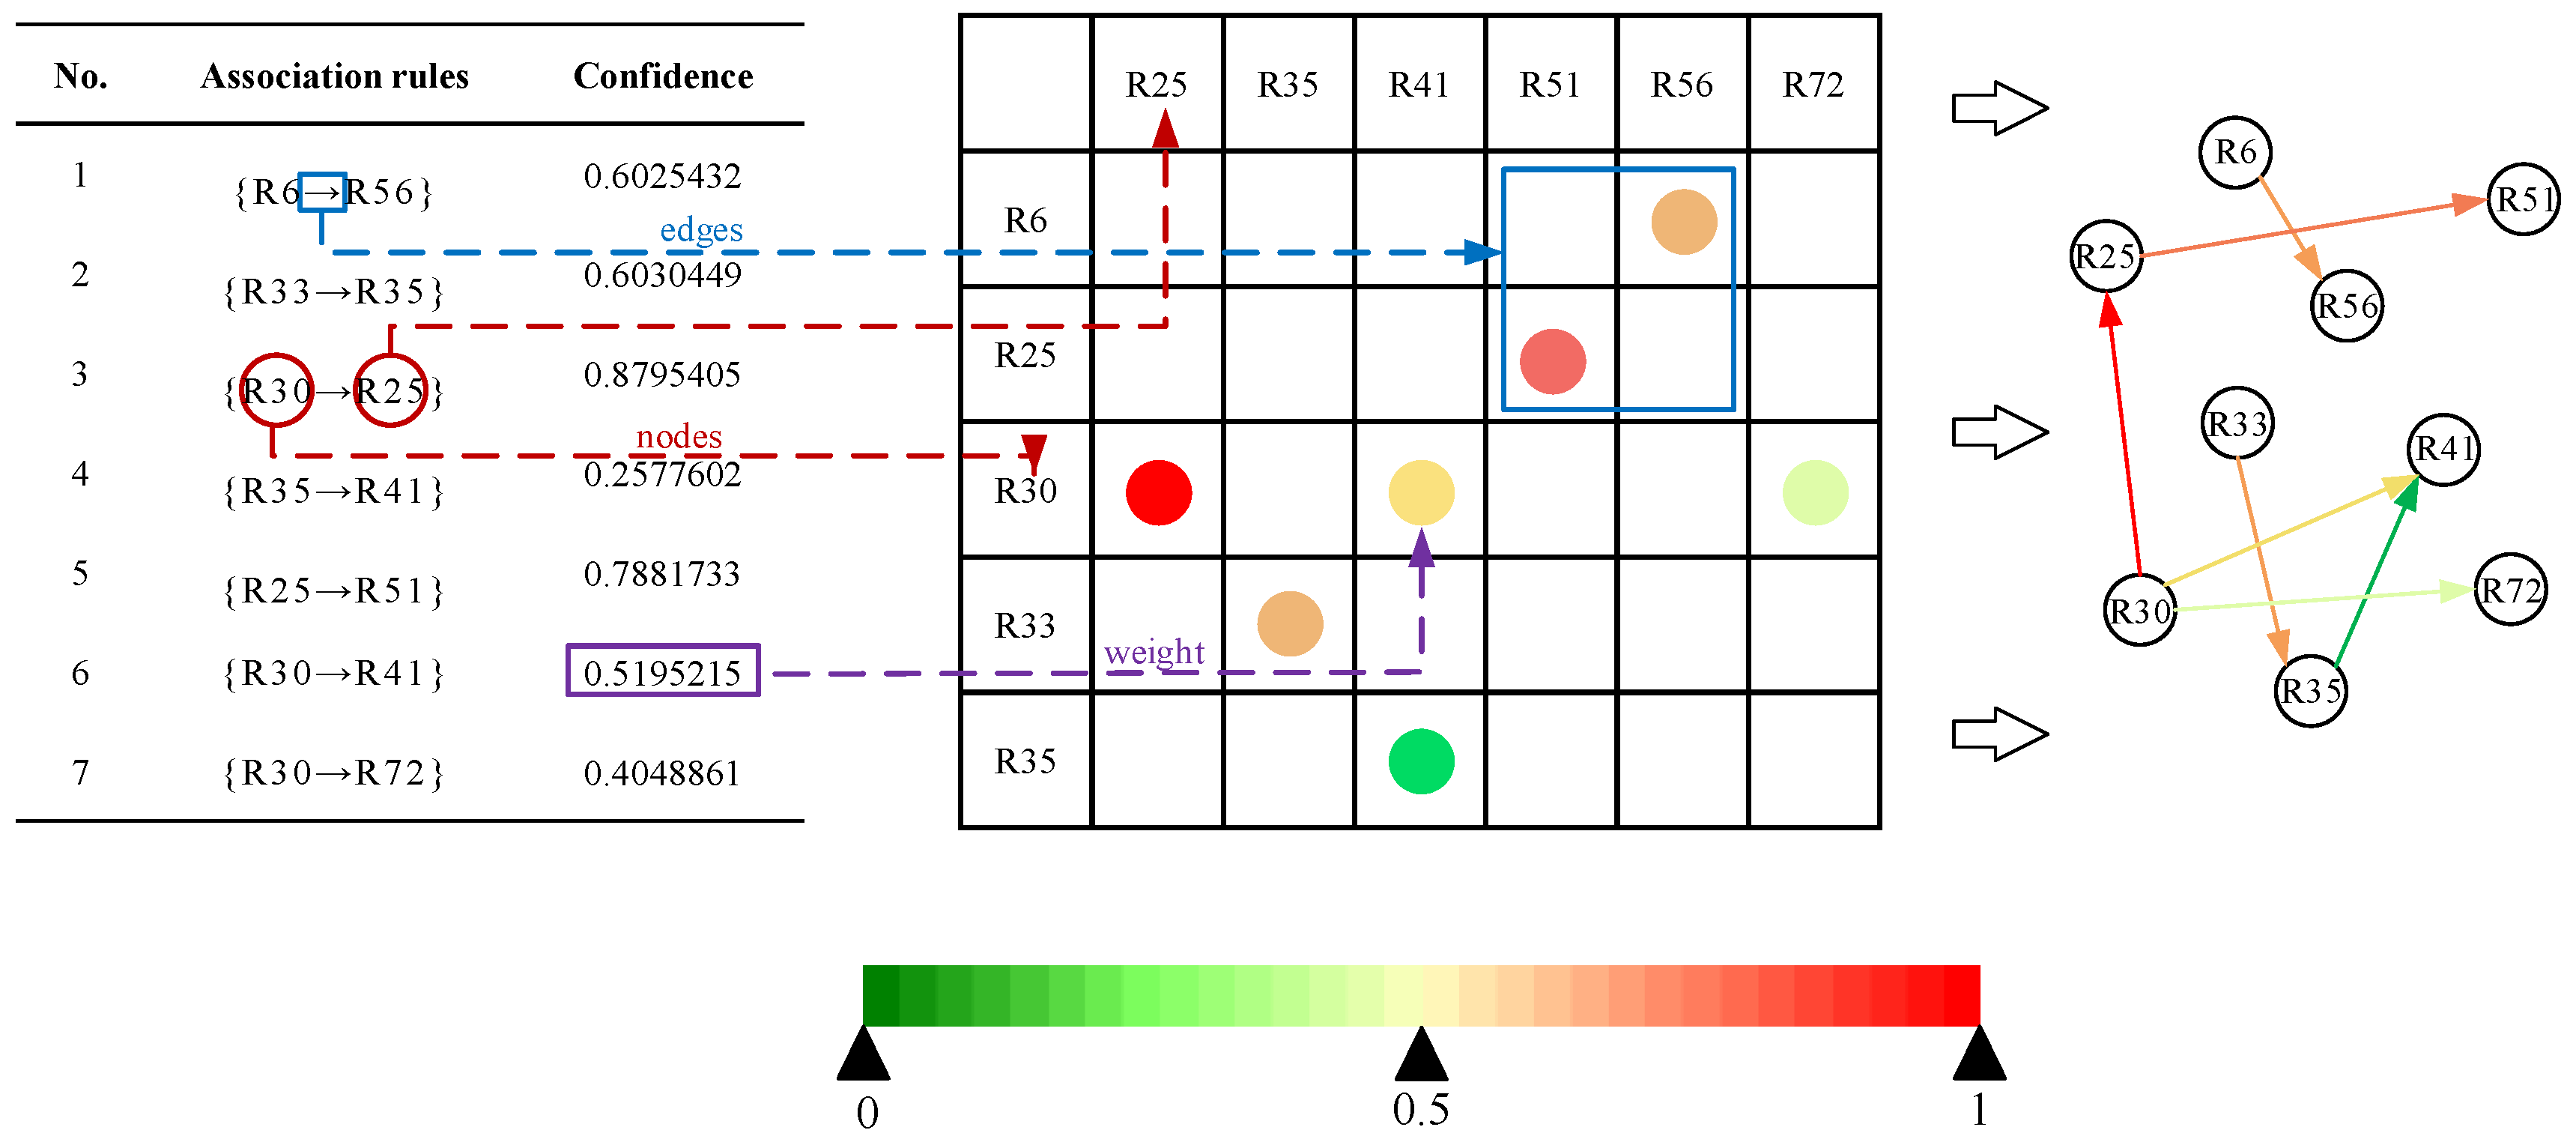
3.2. Identification of Relationships among Safety Risks in Subway Construction

Complex networks, as a method to study many individuals and their interactions, provide a possibility for studying subway construction safety risk networks. In a complex network, nodes, directed edges, and their strengths represent the factors, the correlations between elements and their directions, and the power of the correlations, respectively. However, the construction safety of construction projects is often affected by many human and organizational factors, which leads to the determination of parameters in the modeling process, which is often plagued by the lack of available data. The decision to correlate relationships among factors and their strength assessment relies heavily on the experience of domain experts, which is accompanied by a significant degree of subjectivity and uncertainty that may lead to less valid results. Association rule mining, as an extensive data analysis technique, can mine inter-factor association relationships from massive and disordered data information and has found comprehensive application across diverse domains, including finance, healthcare, and engineering construction [35]. Therefore, this paper introduces association rule mining technology to improve the complex network modeling method.
The ARM is calculated as follows:
Given that I = {I1, I2, …, In} be a set of items, where Ik (k = 1, 2, 3, …, n) represents the items in the itemset. The database D (Database) consists of transactions T (Transaction), i.e., D = {T1, T2, T3, …, Tm}, where each specific transaction Tj (j = 1, 2, 3, …, m) is a non-empty subset of I. The association rule is represented as X Y, where itemset X is the antecedent and itemset Y is the consequent, reflecting the correlation between the antecedent and the consequent, where XY = ∅. Support, confidence, and lift are commonly used metrics to measure the strength of association rules [36]. Support and lift indicate the frequency and validity of an association, respectively, while confidence indicates the conditional probability of Y occurring in the presence of X. The support of an association rule that meets the minimum thresholds of support and lift and has a lift greater than one is often called a valid association rule. Usually, an association rule that satisfies the minimum thresholds of support and confidence and has a lift value greater than one is called a valid strong association rule. In this study, this paper utilizes the Apriori algorithm to mine such rules in subway construction safety risk.
S u p p o r t ( X Y ) = σ ( X , Y ) D
C o n f i d e n c e ( X Y ) = σ ( X , Y ) σ ( X ) = S u p p o r t ( X , Y ) S u p p o r t ( X )
L i f t ( X Y ) = P ( Y | X ) P ( Y ) = C o n f i d e n c e ( X Y ) S u p p o r t ( Y )
Specifically, the first step is to standardize the collected accident reports. Based on safety risks and codes detailed in Table 2, each report’s relevant causes and consequences are extracted to form a standardized accident database, as shown in Table 3, which lists two examples. Then, the Apriori algorithm removes the effective association rules among subway construction safety risks, which are converted into the association relationships linking nodes within the network, with the confidence level serving as the intensity of association among subway construction safety risk factors. Figure 1 shows the modeling process of part of the network.

3.3. Visualization of the SCSRN

The network’s visualization model was achieved using the software Gephi 0.10.1, as shown in Figure 2. Different colors are used to differentiate different types of construction safety risk factors. The degree of each risk factor determines the size of the node.

3.4. Attributes Analysis of the SCSRN

To further explore the topological properties of the SCSRN, nodes, edges, the network density (D), the average path length (L), the clustering coefficient (C), and the degree (k) of SCSRN are computed based on the essential statistical characteristics of complex networks (detailed information and computational formulas of each parameter can be found in the literature [37]).
Table 4 shows that the network has a density of 0.058, which exceeds Fang et al.’s risk interaction network density for large construction projects (0.031) [38], indicating a significant interaction between the safety risk factors associated with the construction of subways. The diameter of the SCSRN is 5.62, suggesting that it takes at most 5 to 6 steps for risk to be transmitted from one element to another. This reflects the high connectivity of the SCSRN.
The L of the SCSRN is 1.997, which indicates that only 1–2 steps are needed to complete the transfer between most risk factors, indicating a high efficiency of risk transfer. The C of the network is 0.114, exceeding the C values of random networks with an equivalent count of nodes (0.064, 0.086, and 0.078), indicating a tendency for nodes in the network to cluster together. In addition, shorter L and higher C are the judgment criteria to measure whether the network has small-world characteristics [39]. Intuitively, we cannot judge the size of these two values. We use Gephi software to generate three random networks the same size as the SCSRN and compute their L and C , which are 2.591 and 0.076, respectively. Since the L < L and C > C of the SCSRN, the SCSRN has small-world properties. Construction safety risks tend to congregate around central risks characterized by elevated clustering coefficients, giving rise to indirect risk interactions through these central nodes. Simultaneously, since L is small, risks also tend to propagate to the entire network via these central risks.
Figure 3 shows the degree distribution P(k) of nodes in the SCSRN. As can be seen from the figure, it obeys a power law distribution, which indicates that the SCSRN is scale-free [38]. This further indicates that SCSRN nodes have varying connectivity. Only a small number of central nodes significantly impact other nodes, so when a hub node fails, it is more likely to affect the whole network.
In summary, the SCSRN has both scale-free and small-world features. It shows that subway construction safety incidents are not random events but the outcome of strong interaction between multiple safety risks.

4. Modeling the Subway Construction Safety Risk Propagation

4.1. Model Assumptions

Since the categorization of nodes in the network by the SEIRS model is more similar to the different states where the actual subway construction safety risks are located, this paper constructs the SHOIS model of subway construction safety risk propagation based on the traditional SEIRS model. It improves it from the following four aspects. First, based on the four categories of subjects in the traditional SEIRS model, this paper classifies the subjects of the subway construction safety risk propagation model into four categories, including Safe (S), Hidden (H), Outbreak (O), and Immune (I). Second, the subway construction safety risk propagation is delayed. The influence of the safety risk factors (whether safe or hidden state) will not immediately show the characteristics of the risk outbreak and will not directly lead to other related safety risk mutation. But the need to reach the safety risk outbreak threshold through the continuous accumulation of construction safety risk outbreaks can only lead to the outbreak of the risk of construction safety. Third, there is a hidden nature of safety risk propagation in metro construction, and safety risks that have been affected but have no obvious characteristics also can propagate with sustained impacts and cumulative impacts on neighboring nodes. Finally, the subway construction safety risk spreads over the topology of the complex network, which is introduced into the model by combining the mean-field theory in statistical physics and considering the influence of the average degree of the network on the propagation model.
Based on the above-improved analyses, the metro construction safety risk factors are classified into four states in the SHOIS model, including Safe (S), Hidden (H), Outbreak (O), and Immune (I). The transfer rules between states are as follows: (1) A risk factor in the safe state (S) is susceptible to a gradual transition to the hidden state (H) with probability a when it receives a strong shock from the risk. (2) Risk factors in the hidden state (H), after a continuous accumulation of unfavorable factors, mutate into the outbreak state (O) with probability b at a certain point when the risk outbreak threshold is breached. In this process, the hidden state (H) risk can continuously influence the risk factors associated with it. At the same time, the time-delayed process increases the likelihood of continued proliferation of metro construction safety risks and their effective management. (3) Risk factors in the outbreak state (O) can transmit their unstable state to other nodes connected to them. Some can autonomously recover to the safe state (S) with probability d through self-repairing ability, especially for risk factors caused by unsafe human behaviors. The other part is transformed into the immune state (I) with some immunity through effective control measures by the manager with probability c. (4) Risk factors in the immune state (I) are risk factors that are recovered from the outbreak state (O). They acquire a certain level of immunity, but over time this immunity disappears and transforms into the susceptible security state (S) with probability h. The risk propagation mechanism of the SHOIS model is illustrated in Figure 4.
The following basic assumptions are given in the SHOIS model:
Assumption 1.
Sk(t), Hk(t), Ok(t), Ik(t) denote the proportion of the four types of risk factors with degree k at time t to the proportion of all risk factors, which are continuously differentiable functions concerning time t. The risk factors of the four types of risk factors with degree k at time t are all continuously differentiable functions concerning time t and satisfy Sk(t) + Hk(t) + Ok(t) + Ik(t) = 1 and  0 S k ( t ) , H k ( t ) , O k ( t ) , I k ( t ) 1
.
Assumption 2.
The exposure rate a denotes the probability that the safe state transforms into the hidden state, the burst rate b denotes the possibility that the hidden state transforms into the burst state, the governance rate c denotes the probability that the burst state transforms into the immune state, the self-healing rate d represents the possibility that the hidden state self-heals into the safe state, and the immunization failure rate h indicates the probability that the immune state changes into the safe state, where a, b, c, d, and h are all between 0 and 1 constants.
Assumption 3.
ρ1 and ρ2 denote the contagion rate of hidden state risk and outbreak state risk, respectively, θ1(t) and θ2(t) represent the likelihood of linking safety state risk with hidden state risk and the possibility of linking safety state risk with outbreak state risk at time t, respectively, and the values of these parameters are all in the range of 0–1.
Assumption 4.
T represents the delay time for risk propagation, with the assumption that the propagation delay time is the same for hidden state risk and outbreak state risk within the network.

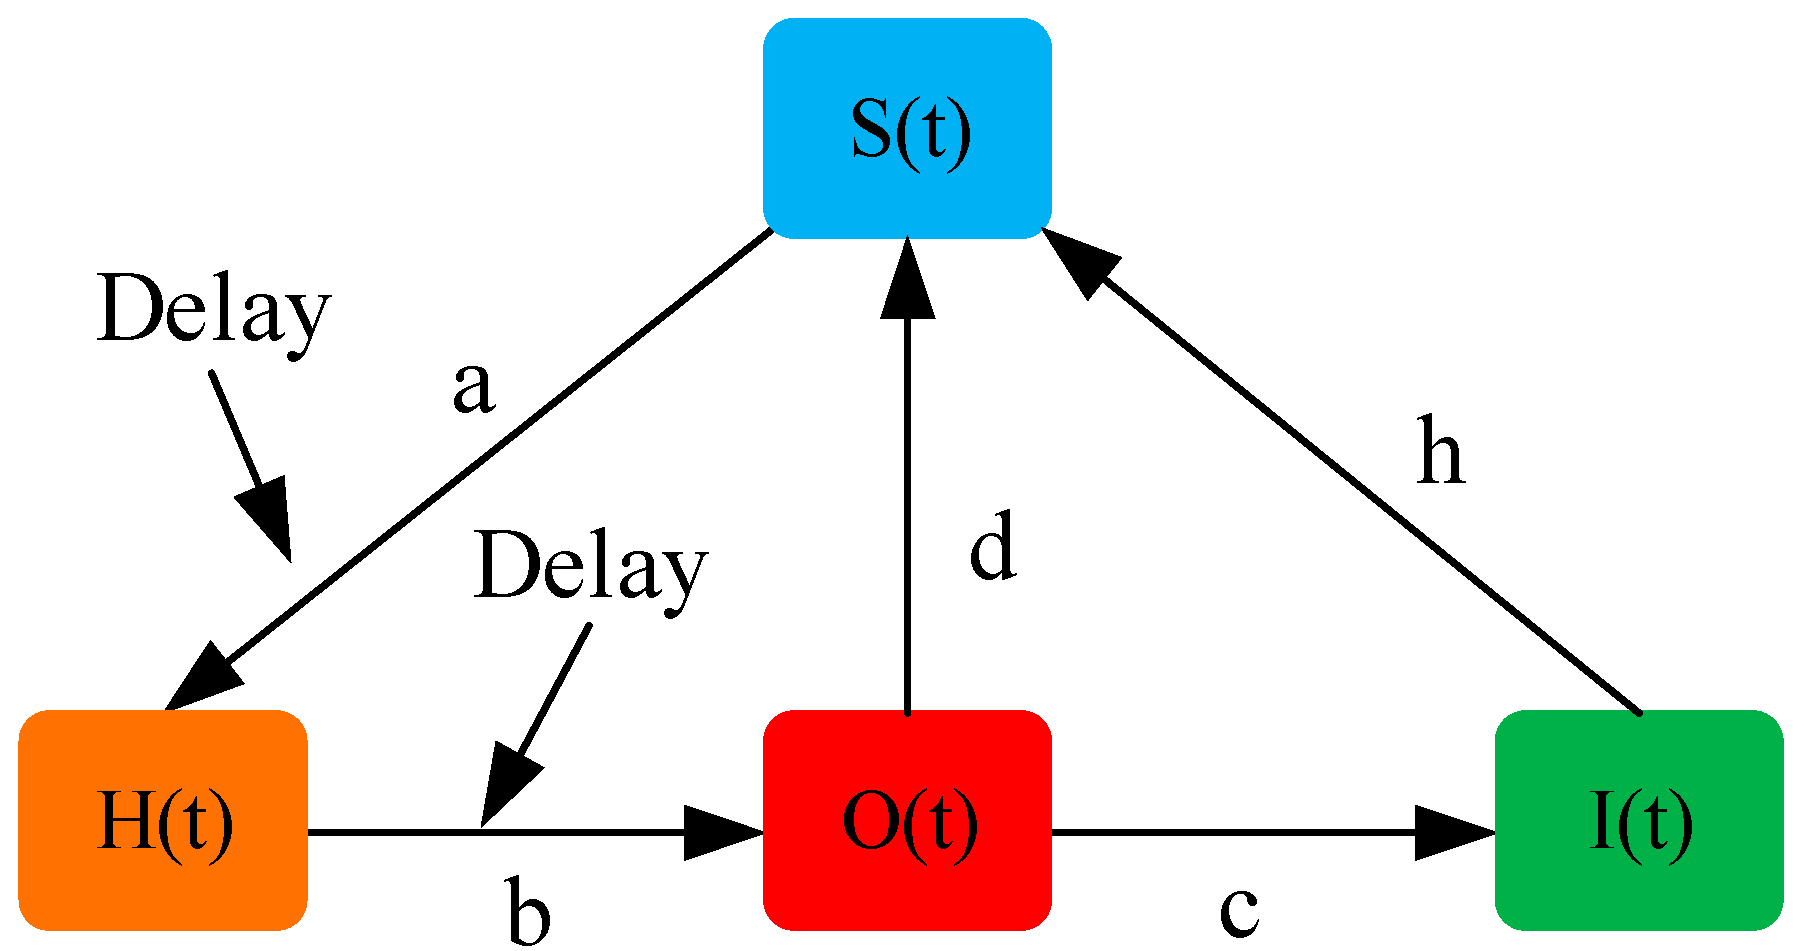
4.2. Construction of the SHOIS Model

As a simplified and effective method for risk propagation analysis in large-scale networks, mean field theory can describe the evolution of node states throughout the network by establishing differential equations [40]. Therefore, based on the assumptions above, the following kinetic equations for the SHOIS model are obtained using the mean-field theory:
{ d S k ( t ) d t = a k ( ρ 1 Θ 1 ( t ) + ρ 2 Θ 2 ( t ) ) S k ( t ) + d O k , T ( t ) + h I k ( t ) d H k , 0 ( t ) d t = a k ( ρ 1 Θ 1 ( t ) + ρ 2 Θ 2 ( t ) ) S k ( t ) b H k , 0 ( t ) d H k , 1 ( t ) d t = b H k , 0 ( t ) + b H k , 0 ( t ) d H k , T ( t ) d t = b H k , T ( t ) + b H k , T 1 ( t ) d O k , 0 ( t ) d t = ( c + d ) O k , 0 ( t ) + b H k , T ( t ) d O k , 1 ( t ) d t = ( c + d ) O k , 1 ( t ) + ( c + d ) O k , 0 ( t ) d O k , T ( t ) d t = ( c + d ) O k , T ( t ) + ( c + d ) O k , T 1 ( t ) d I k ( t ) d t = c O k , T ( t ) h I k ( t )
where: H k , τ ( t ) and O k , τ ( t ) are the densities of the hidden and erupting points of degree k at a time t τ , respectively, and satisfy H k ( t ) = τ = 0 T H k , τ ( t ) , O k ( t ) = τ = 0 T O k , τ ( t ) , θ 1 ( t ) = k P ( k ) H k ( t ) < k > , and θ 2 ( t ) = k P ( k ) O k ( t ) < k > .
Let the right-hand side of Equation (4) be equal to 0. It can be deduced that H k , 0 = H k , 1 = = H k , T , O k , 0 = O k , 1 = = O k , T . Let ρ = ρ1θ1(t) + ρ2θ2(t), Equation (4) can be simplified to the following:
{ d S k ( t ) d t = a k ρ S k ( t ) + d T + 1 O k ( t ) + h I k ( t ) d H k ( t ) d t = a k ρ S k ( t ) b T + 1 H k ( t ) d O k ( t ) d t = b T + 1 H k ( t ) c + d T + 1 O k ( t ) d I k ( t ) d t = c T + 1 O k ( t ) h I k ( t )

4.3. Equilibrium and Stability Analysis

4.3.1. Risk Aversion Equilibrium and Stability Analysis

Making the right side of Equation (5) equal to 0, combined with Sk(t) + Hk(t) + Ok(t) + Ik(t) = 1, gives a smooth solution to Equation (5):
{ S k ( t ) = c + d a k ρ ( T + 1 ) O k ( t ) H k ( t ) = c + d b O k ( t ) I k ( t ) = c h ( T + 1 ) O k ( t ) O k ( t ) = a b h k ρ ( T + 1 ) b h ( c + d ) + [ b ( c + h ( T + 1 ) ) + h ( c + d ) ( T + 1 ) ] a k ρ
Substituting the result of the above equation into ρ = ρ1θ1(t) + ρ2θ2(t), we obtain the following:
ρ = 1 < k > ( ρ 1 ( c + d ) b + ρ 2 ) k 2 P ( k ) a b h ρ ( T + 1 ) b h ( c + d ) + [ b ( c + h ( T + 1 ) ) + h ( c + d ) ( T + 1 ) ] a k ρ
It follows that there is a trivial solution ρ = 0 in Equation (7): the risk-free equilibrium points Sk = 1, Hk = Ok = Ik = 0.
At this point, the Jacobi matrix at the risk aversion equilibrium point (H, O, I) = (0, 0, 0) is as follows:
J ( 0 , 0 , 0 ) = [ b T + 1 0 0 b T + 1 ( c + d ) T + 1 0 0 c T + 1 h ]
The characteristic equation of this matrix is ( x + b T + 1 ) ( x + c + d T + 1 ) ( x + h ) = 0 . From the Routh–Hurwitz discriminant, all the characteristic roots have negative real parts. Therefore, the system equilibrium point (1, 0, 0, 0) is globally asymptotically stable.

4.3.2. Risk Outbreak Equilibrium and Stability Analysis

Let f(ρ) = ρ and derive f(ρ) to ρ, yielding:
f ( ρ ) = < k 2 > < k > ( ρ 1 ( c + d ) b + ρ 2 ) a b 2 h 2 ( T + 1 ) ( c + d ) [ b h ( c + d ) + a k ρ [ b ( c + h ( T + 1 ) ) + h ( c + d ) ( T + 1 ) ] ] 2
It follows that f’(ρ) > 0 and f”(ρ) < 0, according to the properties of the derivative. It can be seen that f(ρ) is a continuous monotonically increasing convex function. If you want to obtain a nontrivial solution of f(ρ), then the condition f ( ρ ) | ρ = 0 1 0 must be satisfied. The critical condition at this point is f ( ρ ) | ρ = 0 = 1 , that is as follows:
< k 2 > < k > ( ρ 1 ( c + d ) b + ρ 2 ) a ( T + 1 ) c + d = 1
Define the basic regeneration number R 0 = < k 2 > < k > ( ρ 1 ( c + d ) b + ρ 2 ) a ( T + 1 ) c + d .
When R0 < 1, the risk disappears, and a risky outbreak equilibrium point (1, 0, 0, 0) emerges, which is the risky outbreak equilibrium point discussed above. It shows that in the subway construction safety risk contagion system, with the increase in time, the impact of the construction safety risk on the system is gradually weakened and eventually effectively avoided.
When R 0 1 , the risk is stabilized with some control, and the system reaches a unique equilibrium point for risky outbreak ( S * , H * , O * , I * ) . Substituting the basic regeneration number R0 into the formula for ρ yields S * = 1 R 0 O * , H * = c + d b O * , I * = c h ( T + 1 ) O * . At this point, the Jacobian matrix at the risky outbreak equilibrium point ( H , O , I ) = ( H * , O * , I * ) is as follows:
J ( H * , O * , I * ) = [ R 0 ( c + d ) T + 1 O * β T + 1 R 0 ( c + d ) T + 1 ( S * O * ) R 0 ( c + d ) T + 1 O * b T + 1 c + d T + 1 0 0 c T + 1 h ]
The characteristic equation of this matrix is x 3 + λ 1 x 2 + λ 2 x + λ 3 = 0 , where
λ 1 = R 0 ( c + d ) T + 1 O * + b T + 1 + c + d T + 1 + h > 0
λ 2 = h ( c + d T + 1 + R 0 ( c + d ) T + 1 O * + b T + 1 ) + c + d T + 1 ( R 0 ( c + d ) T + 1 O * + b T + 1 ) b T + 1 R 0 ( c + d ) T + 1 ( S * O * ) > 0
λ 3 = h ( c + d T + 1 ( R 0 ( c + d ) T + 1 O * + b T + 1 ) b T + 1 R 0 ( c + d ) T + 1 ( S * O * ) > 0
λ 1 λ 2 λ 3 > 0
According to the Routh–Hurwitz criterion, all characteristic roots possess negative real components. Therefore, the system equilibrium point ( S * , H * , O * , I * ) is locally asymptotically stable.

4.4. Propagation Threshold Analysis

Let [41]:
φ = ( ρ 1 ( c + d ) b + ρ 2 ) a c + d
Then:
φ c = < k > < k 2 > ( T + 1 )
where φ is the network’s effective rate of risk propagation, and φc is the risk propagation threshold.
It follows that φc is linked to the network’s degree <k>, <k2> and delay time T. When φ > φc, the risk in the network can propagate and spread on a large scale, while when φ < φc, the risk does not spread.
According to the nature of complex networks, it is known [38] that when the network size is large enough to satisfy:
< k > 2 m ,
< k 2 > 2 m 2 ln K c / m ,
K c m N 1 / 2 ,
where Kc is the maximum value of the degree in the network; m represents the minimum number of connected edges within the network; and N denotes the total count of nodes.
Thus, substituting for φc yields that:
φ c = 1 m ( T + 1 ) ln N 1 / 2
It follows that φc is affected by the network size N and delay time T. When N → ∞, φc → 0, which means that a very low contagion rate in the subway construction safety risk network can also make the risk persistent.

4.5. Steady-State Density Analysis

It is known that <k> and P(k) of the scale-free network satisfy:
P ( k ) = 2 m 2 k 3 ,
< k > = m k P ( k ) = 2 m .
Substituting into Equation (7) yields that,
ρ = ( ρ 1 ( c + d ) b + ρ 2 ) m m a b h ( T + 1 ) ρ [ b h ( c + d ) + [ b ( c + h ( T + 1 ) ) + h ( c + d ) ( T + 1 ) ] a k ρ ] k d k
Integrating k from the above equation yields:
ρ = b h ( c + d ) m a [ b ( c + h ( T + 1 ) ) + h ( c + d ) ( T + 1 ) ] ( e b ( c + d ) [ ρ 1 ( c + d ) + ρ 2 b ] m a ( T + 1 ) 1 )
It is known that the proportion of the entire network at risk of an outbreak state is O = P ( k ) O k ( t ) , where Ok(t) represents the ratio of nodes with degree of k that transform from a safety state to an outbreak state. From this, it can be obtained:
O = 2 b h [ m a ( ρ 1 ( c + d ) + ρ 2 b ) ( e b ( c + d ) ( ρ 1 ( c + d ) + ρ 2 b ) m a ( T + 1 ) 1 ) ( T + 1 ) b ( c + d ) ] m a ( e b ( c + d ) ( ρ 1 ( c + d ) + ρ 2 b ) m a ( T + 1 ) 1 ) 2 ( ρ 1 ( c + d ) + ρ 2 b ) [ b ( c + h ( T + 1 ) ) + h ( c + d ) ( T + 1 ) ]
Further, the steady-state densities of safe state risk nodes, hidden state nodes, and immune state risk nodes can be found according to Equation (17) and derived separately (see Equation (18)).
{ S = c + d a k ρ ( T + 1 ) O H = c + d b O I = c h ( T + 1 ) O

5. Simulation Analysis of Subway Construction Safety Risk Propagation Model

5.1. Parameter Setting

Combining with the actual construction operation of the subway project, due to the construction process being subject to strict construction safety regulations, the possibility of risk emergence is often slight, so a value is small; a = 0.3. Risks in the hidden state have been in contact with the risk source. There is a greater possibility of transformation into an outbreak state, so the value of b is set higher; b = 0.7. Once the risk breaks out, the insecurity event occurs, its control measures will be strictly recorded, and the second outbreak can be quickly responded to, so c = 0.9. Once a risk erupts and an unsafe event occurs, its control measures will be strictly documented, and a quick response can be made to the secondary outbreak, so the value of c is larger; c = 0.9. Once a risk occurs, it is not easy to heal itself into a safe state, and in most cases, it will continue to deteriorate. Therefore, the value of d is small, d = 0.1. Due to the subway project’s changing environment and the construction process’s complexity, the risk is prone to variability, so the value of h is large; h = 0.4.

5.2. Simulation Results Discussion and Analysis

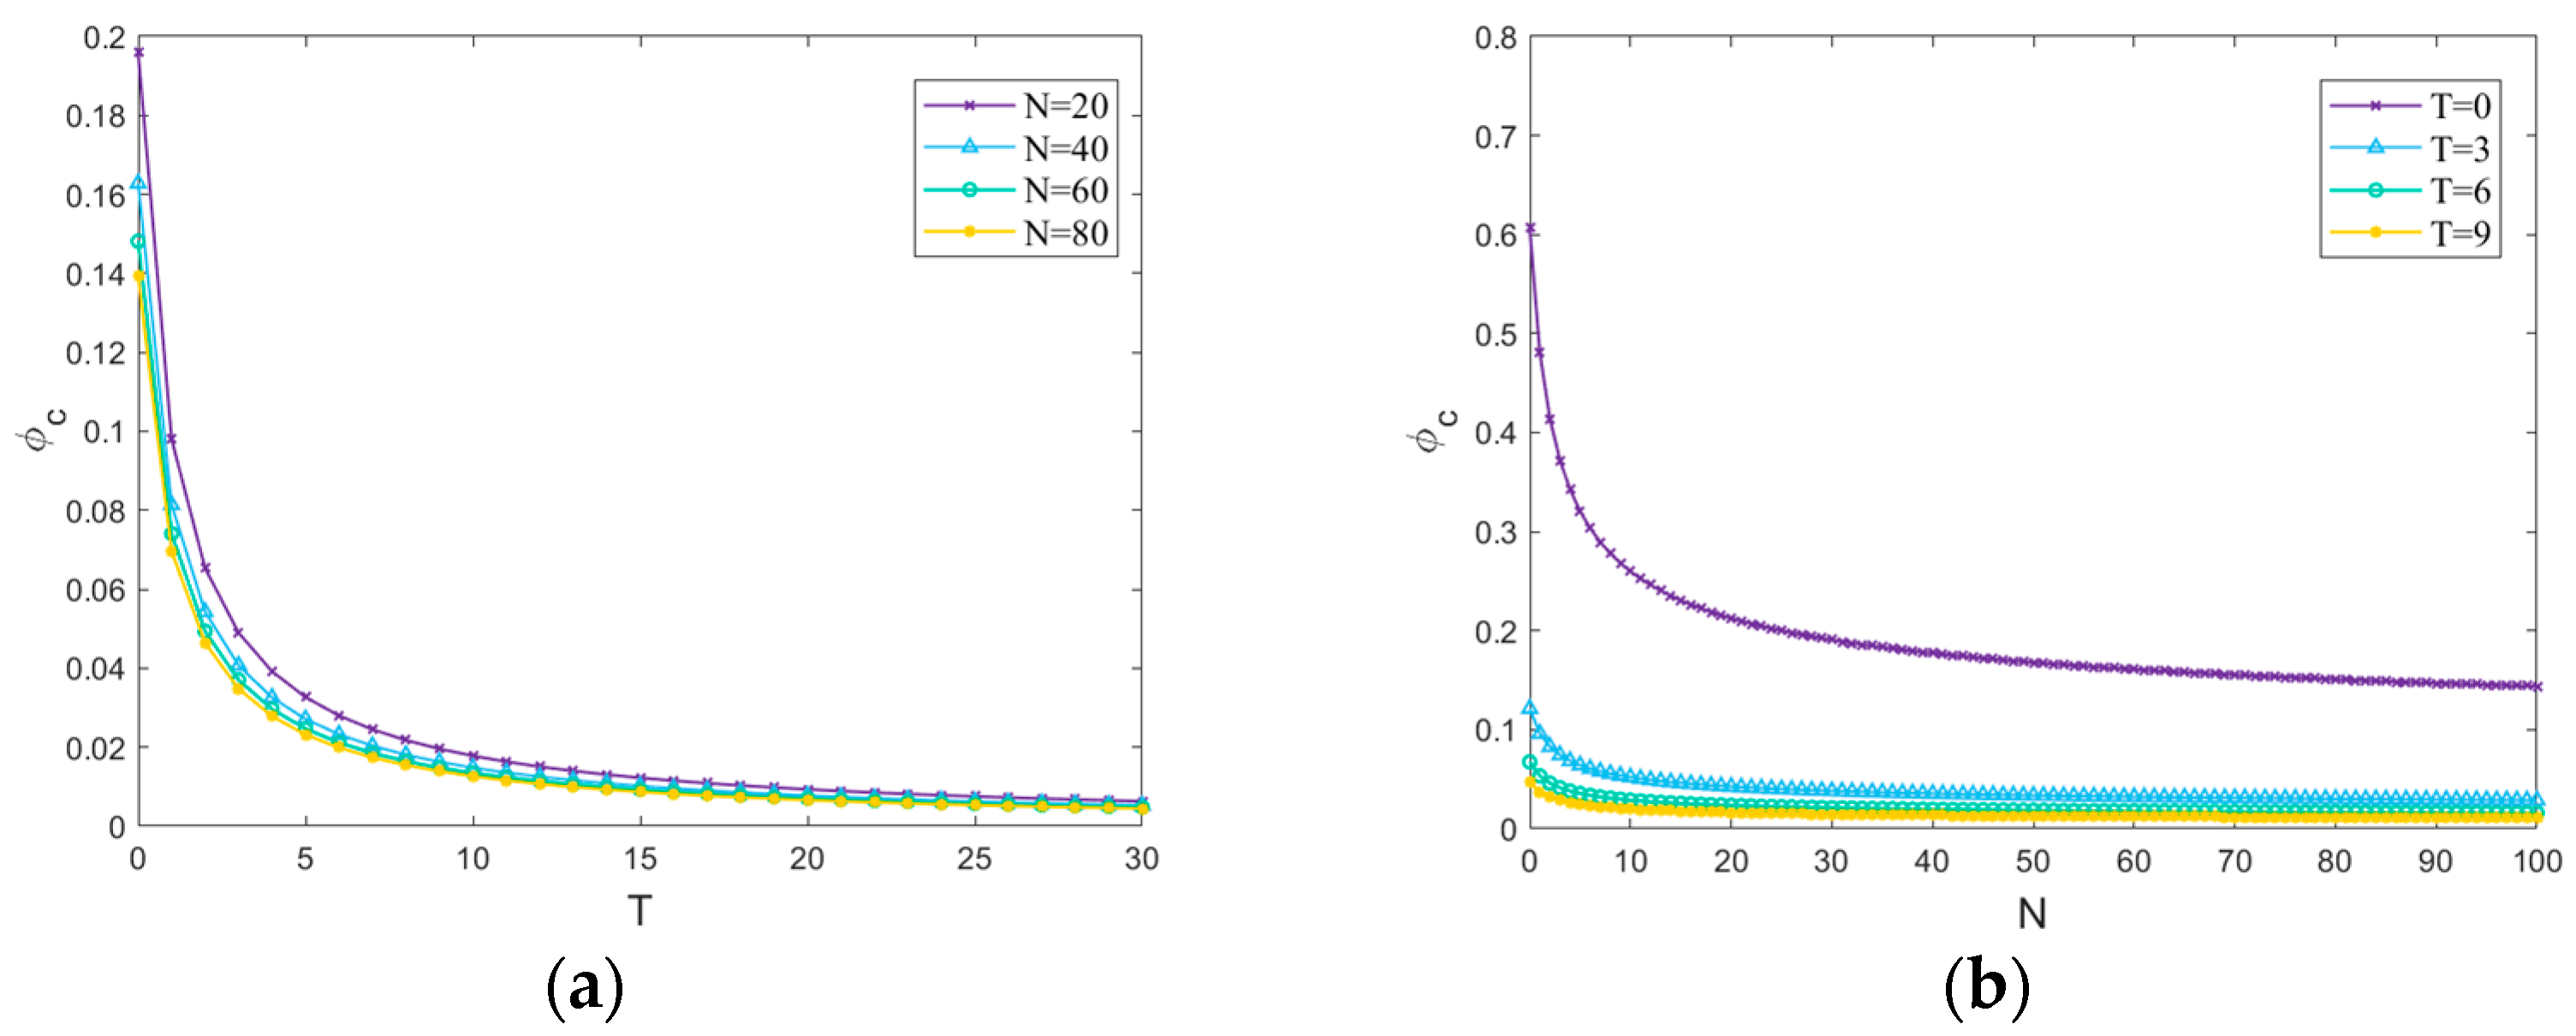
5.2.1. Influence of T on Propagation Thresholds

According to Equation (14), φc is affected by the network size N and delay time T. Taking < k > 4.342 in Table 4, then m = 2.171; the relationship between φc and T and N is analyzed, as depicted in Figure 5.
Figure 5a presents the effect of risk propagation delay time on the propagation threshold at different network sizes. From the figure, it can be seen that the propagation threshold gradually decreases as the delay time gradually increases. This implies that the likelihood of risk transmission is significantly higher when the delay time of risk transmission is sufficiently long. This may be because longer delay times seem to provide more opportunities for propagation, thus intensifying the spread of risk in the network.
Figure 5b presents the effect of network size on the propagation threshold at different delay times. The results show network sizes have different propagation thresholds at a brief risk transmission delay time. As the network size increases, the propagation threshold gradually decreases, but still presents that the longer the delay time, the smaller the propagation threshold in the network. However, as the delay time extends, the propagation threshold of networks of different sizes begin to converge, which means that at longer delay times, the network size is no longer the dominant factor influencing the propagation thresholds. The delay time becomes a greater influencing factor.
Further analysis reveals that the risk propagation delay time exerts a more pronounced influence on the propagation threshold compared to alterations in network size, and it has a greater sensitivity to change. This reveals that the time element is more decisive than the size of the network when it comes to the transmission of risks.

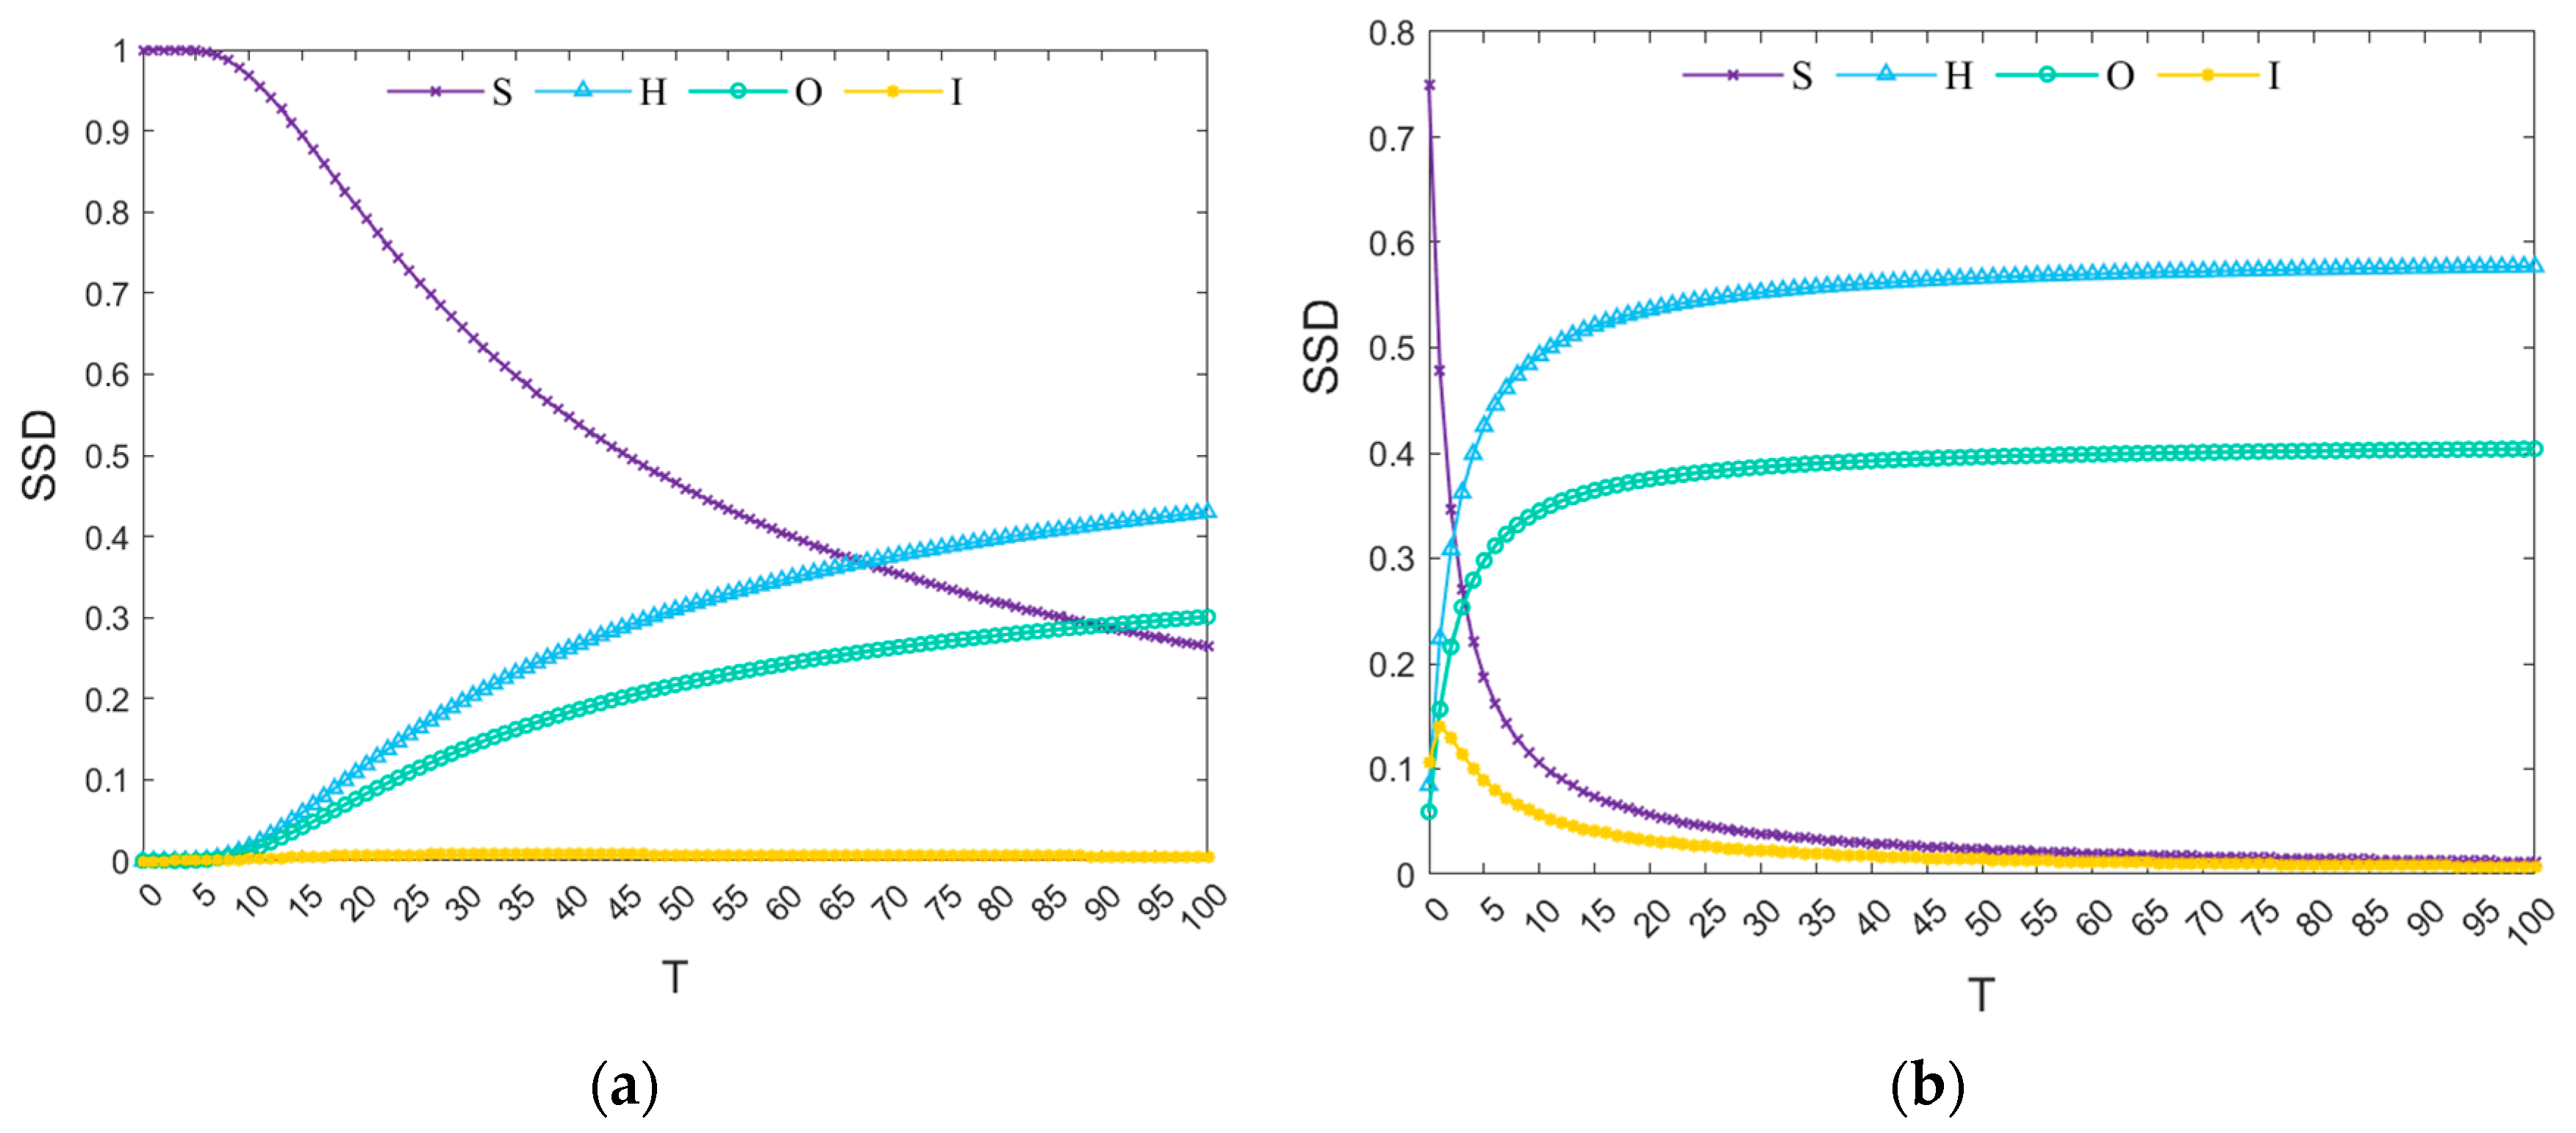
5.2.2. Influence of T on Steady-State Density

According to Equation (14), given the network’s size, the propagation threshold of the network is maximized without delay, and φc(max) = 0.2309. At this time, the effective risk propagation rate φ = 0.43ρ1 + 0.3ρ2. According to Equations (17) and (18), with all other parameters determined, ρ1 = 0.01, ρ2 = 0.02 and ρ1 = 0.3, ρ2 = 0.4 are taken, respectively, to analyze the delay time T versus the steady state density at the initial moments φ < φc(max) and φ > φc(max), i.e., R < 1 and R > 1 cases. The results are shown in Figure 6.
As shown in Figure 6a, the delay time increase significantly affects the network’s steady-state density when ρ1 = 0.01, ρ2 = 0.02, i.e., φ < φc(max). At the initial moment, T is 0, only risky nodes in the safe state exist in the network, and the densities of risky nodes in other states (hidden, outbreak, and immune) are all zero. With the gradual increase in T, the network still maintains the equilibrium state (S, H, O, I) = (1, 0, 0, 0) when T < 8; when T > 8, the risk outbreak phenomenon occurs in the network. At this time, the safety state risk node gradually reduces to 0, while the hidden state and the outbreak state risk node gradually increases. This is due to the increase in T and leads to the propagation threshold gradually decreasing. T in 8 or less, the effective propagation rate of the construction safety risk has been less than the propagation threshold, that is, R < 1, at this time reflects the delayed risk propagation, and at this time there is no propagation process. When T exceeds 8, the effective propagation rate of construction safety risk surpasses the propagation threshold, i.e., R > 1, and the risk will explode and finally reach equilibrium. Eventually, the steady-state densities of the hidden state risk nodes and the outbreak state risk nodes converge to 0.5 and 0.4, respectively, and the immune state risk nodes slightly increase, then decrease, and converge to 0. It can be seen that when the equilibrium is finally reached, the hidden state risk nodes have the most significant steady-state densities.
From Figure 6b, when ρ1 = 0.3, ρ2 = 0.4, i.e., φ > φc(max), the risk propagates within the network from the very beginning (T = 0). The steady-state densities of the risky nodes in the safety, hidden, outbreak, and immune states are about 0.75, 0.09, 0.05, and 0.10, respectively. With the emergence of T, the delayed effect of risk propagation accelerates the propagation process, leading to a rapid decrease in the density of safe state risk nodes to 0, a convergence of hidden state risk nodes and outbreak state risk nodes to 0.5 and 0.4, respectively, and an increase in the density of immune state risk nodes followed by a rapid decrease in the density of immune state risk nodes to 0. Therefore, project managers should pay attention to the delayed nature of risk propagation when developing safety risk control programs for metro construction.
In summary, it can be seen that T has a significant influence on the propagation behavior of risk and the achievement of an equilibrium state in the network. For the case of φ < φc(max), a longer T is needed to transition the steady-state density of various nodes from the risk-averse state to the risk-bursting state. While in the case of φ > φc(max), only a shorter T is needed to reach the equilibrium state, and T speeds up the equilibrium state achievement.

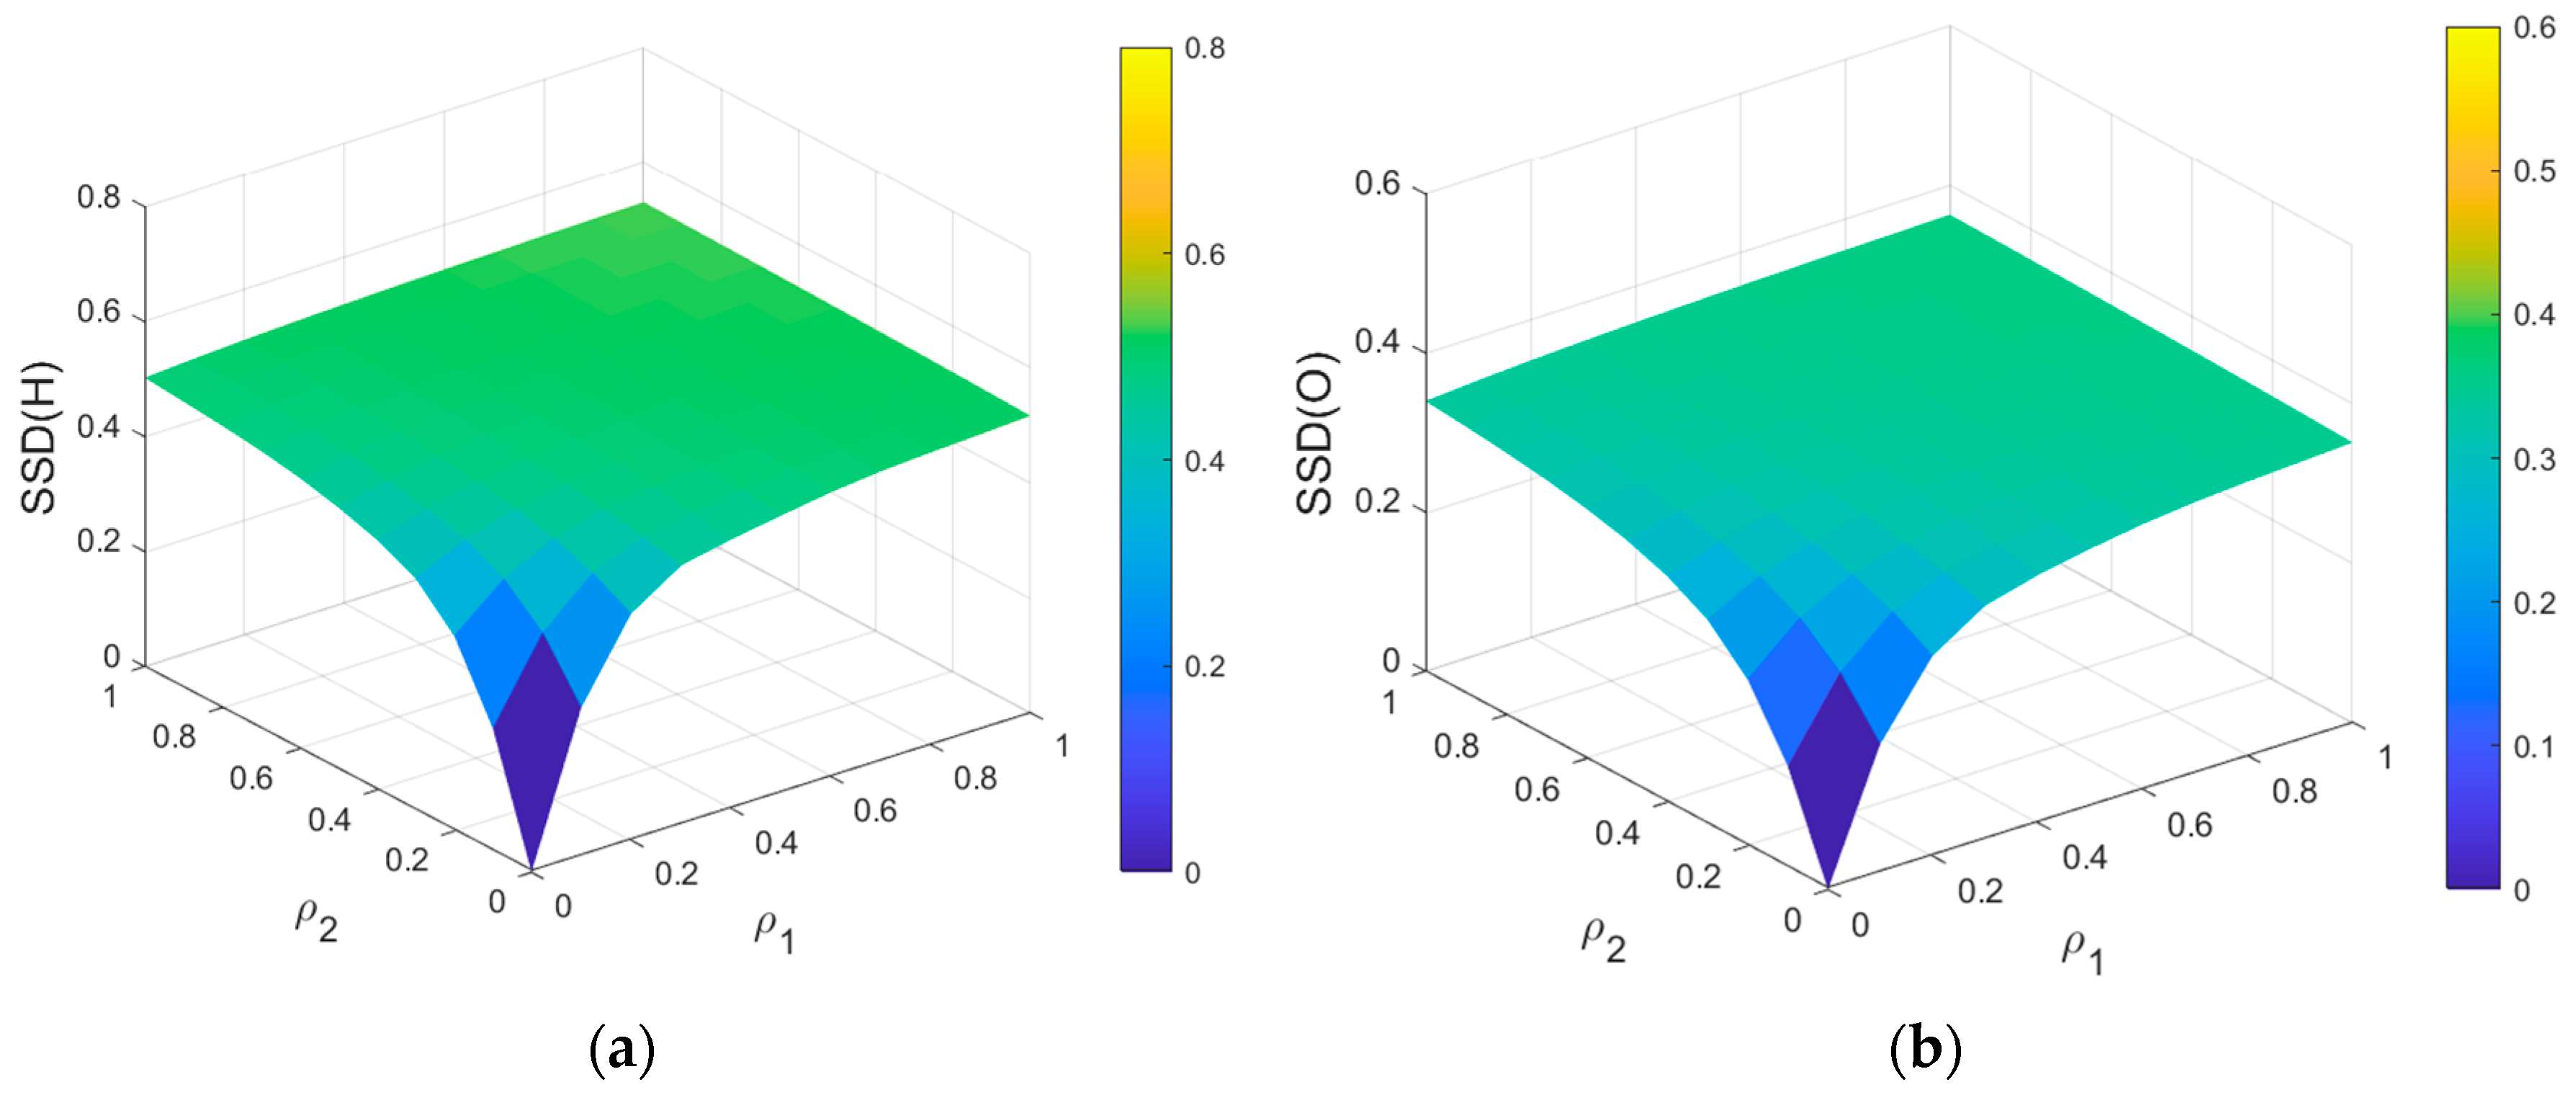
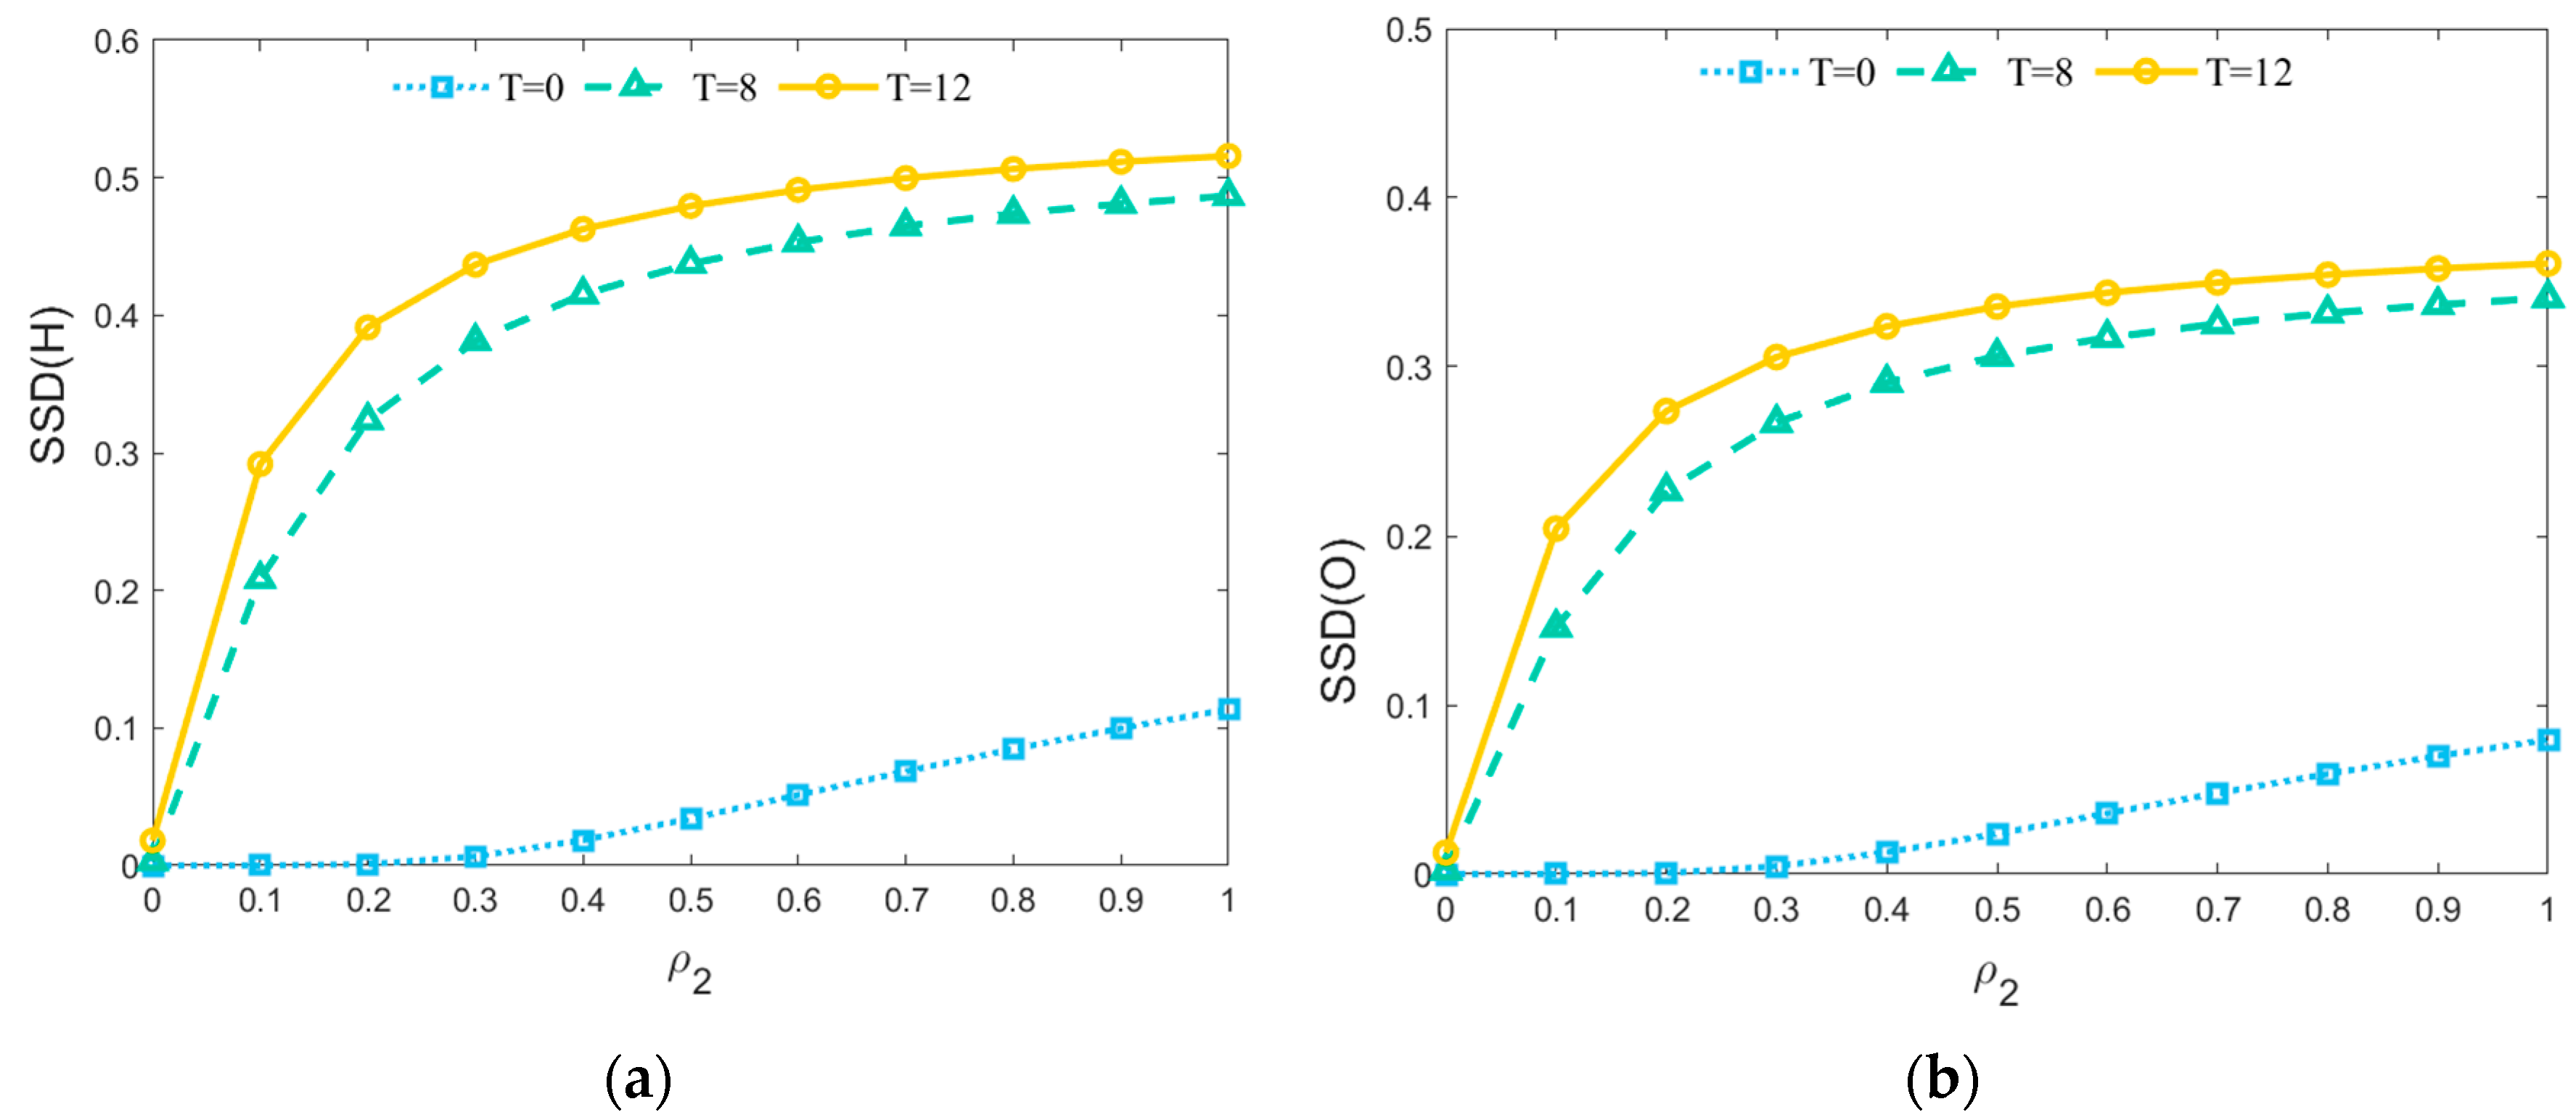
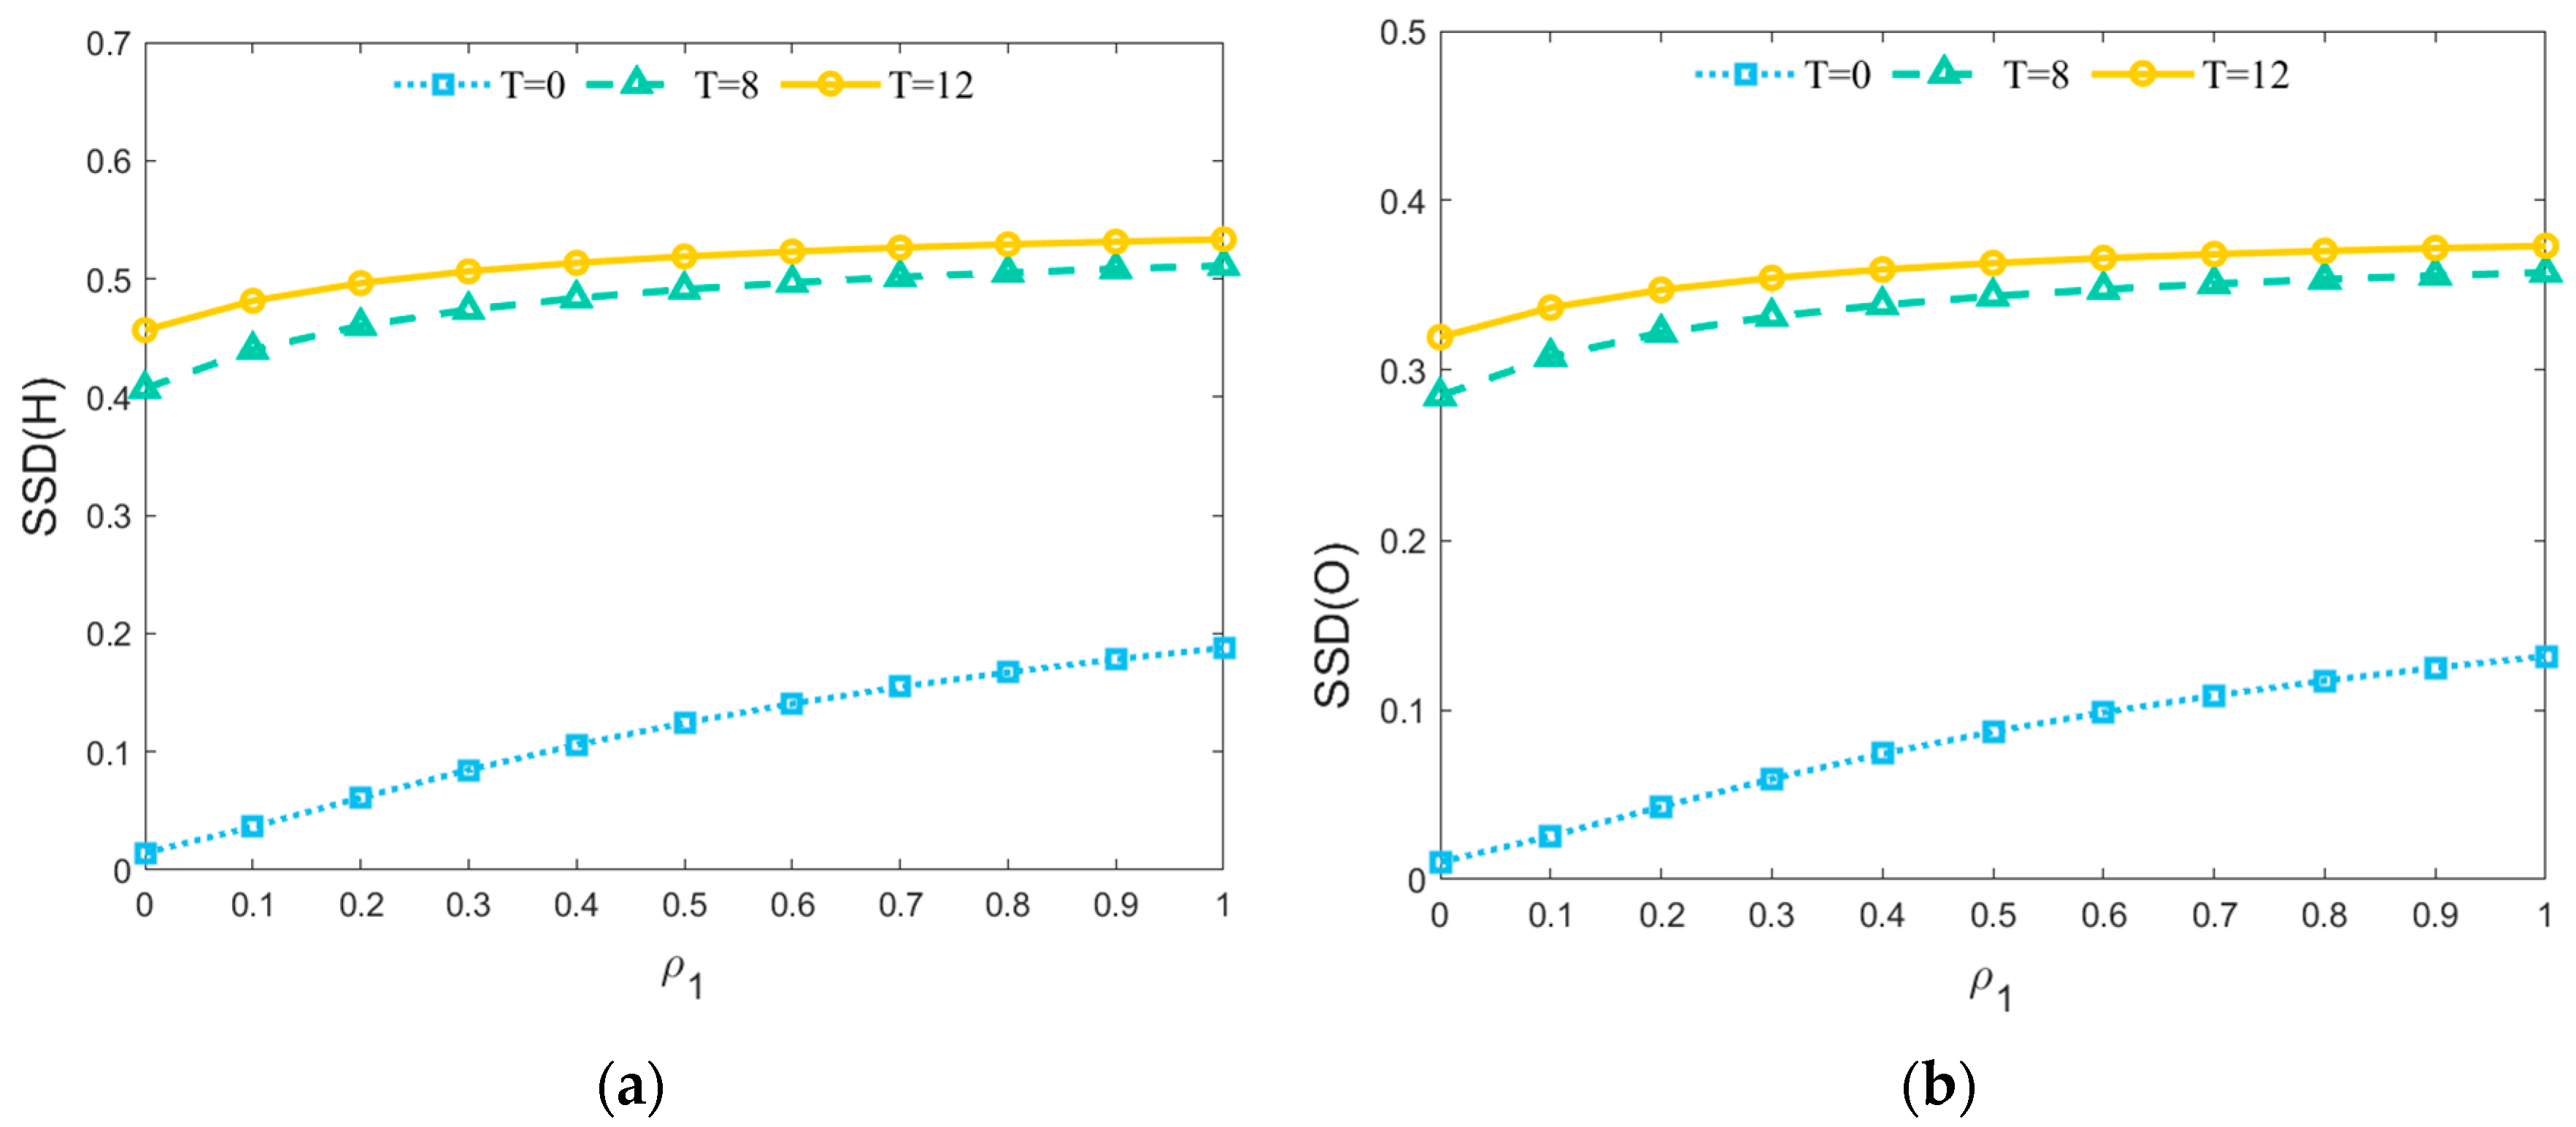
5.2.3. Influence of ρ1, ρ2 on Steady-State Density

MATLAB (R2022b) simulation was used to analyze the variation trend of hidden state risk nodes and burst state risk nodes with ρ1, ρ2, assuming that the delay time of risk propagation T = 10. The results are presented in Figure 7.
As seen from Figure 7, when ρ1 and ρ2 are small in the risk propagation network, the steady-state density of hidden-state and outbreak-state risk nodes is relatively low. This is because when T is constant, φc is also constant according to the calculation result of Equation (14). At this point, smaller ρ1 and ρ2 lead to φ < φc, and the construction safety risk does not spread in the network. However, when ρ1 and ρ2 gradually increase, φ rises accordingly and progressively becomes larger than φc, causing the steady-state density of nodes to increase rapidly. In this process, the hidden state risk nodes and the burst state risk nodes show more sensitive responses to the change of parameter ρ1.
To further explore the relationship between the variation of steady-state density of hidden state risk node and burst state risk node with ρ1, ρ2 and T, take the delay time T = 0, 8, 12, respectively. To analyze the fixed ρ1 = 0.01, 0.02, hidden state risk nodes, outbreak state risk nodes steady-state density change rule with the ρ2 change rule: fixed ρ2 = 0.3, 0.4, hidden state risk nodes, outbreak state risk nodes steady-state density change rule with ρ1 change rule. The results are shown in Figure 8, Figure 9, Figure 10 and Figure 11.
From Figure 8, Figure 9, Figure 10 and Figure 11, regardless of whether ρ1 takes a constant value or ρ2 takes a constant value, the steady-state densities of hidden-state risk nodes and outbreak-state risk nodes are positively correlated with ρ2 or ρ1. Similarly, it can be concluded that the longer the delay time of risk propagation, the faster the propagation of risk in the network. At the risk burst equilibrium point, the steady-state density of hidden-state risk nodes is larger than that of burst-state risk nodes, consistent with the conclusion in Figure 6. Comparing Figure 8 and Figure 10 (and the same for Figure 9 and Figure 12), it can be seen that the steady-state density at which equilibrium is finally reached is unaffected by the different values of ρ1 and ρ2, regardless of whether ρ1 = 0.01, 0.02 or ρ2 = 0.3, 0.4. However, these values do affect the steady-state density at the beginning.
In summary, it can be seen that the propagation of risk factors in hidden states in the subway construction safety risk network plays a crucial role in the whole process of risk diffusion, and the delayed effect of propagation accelerates the spread of risk in the network. Different values of ρ1 and ρ2 have almost no impact on the importance of steady-state density that finally reaches equilibrium. Therefore, construction enterprises need to focus on the propagation of the hidden state risk nodes and the delay of risk contagion when formulating the subway construction safety risk control program.

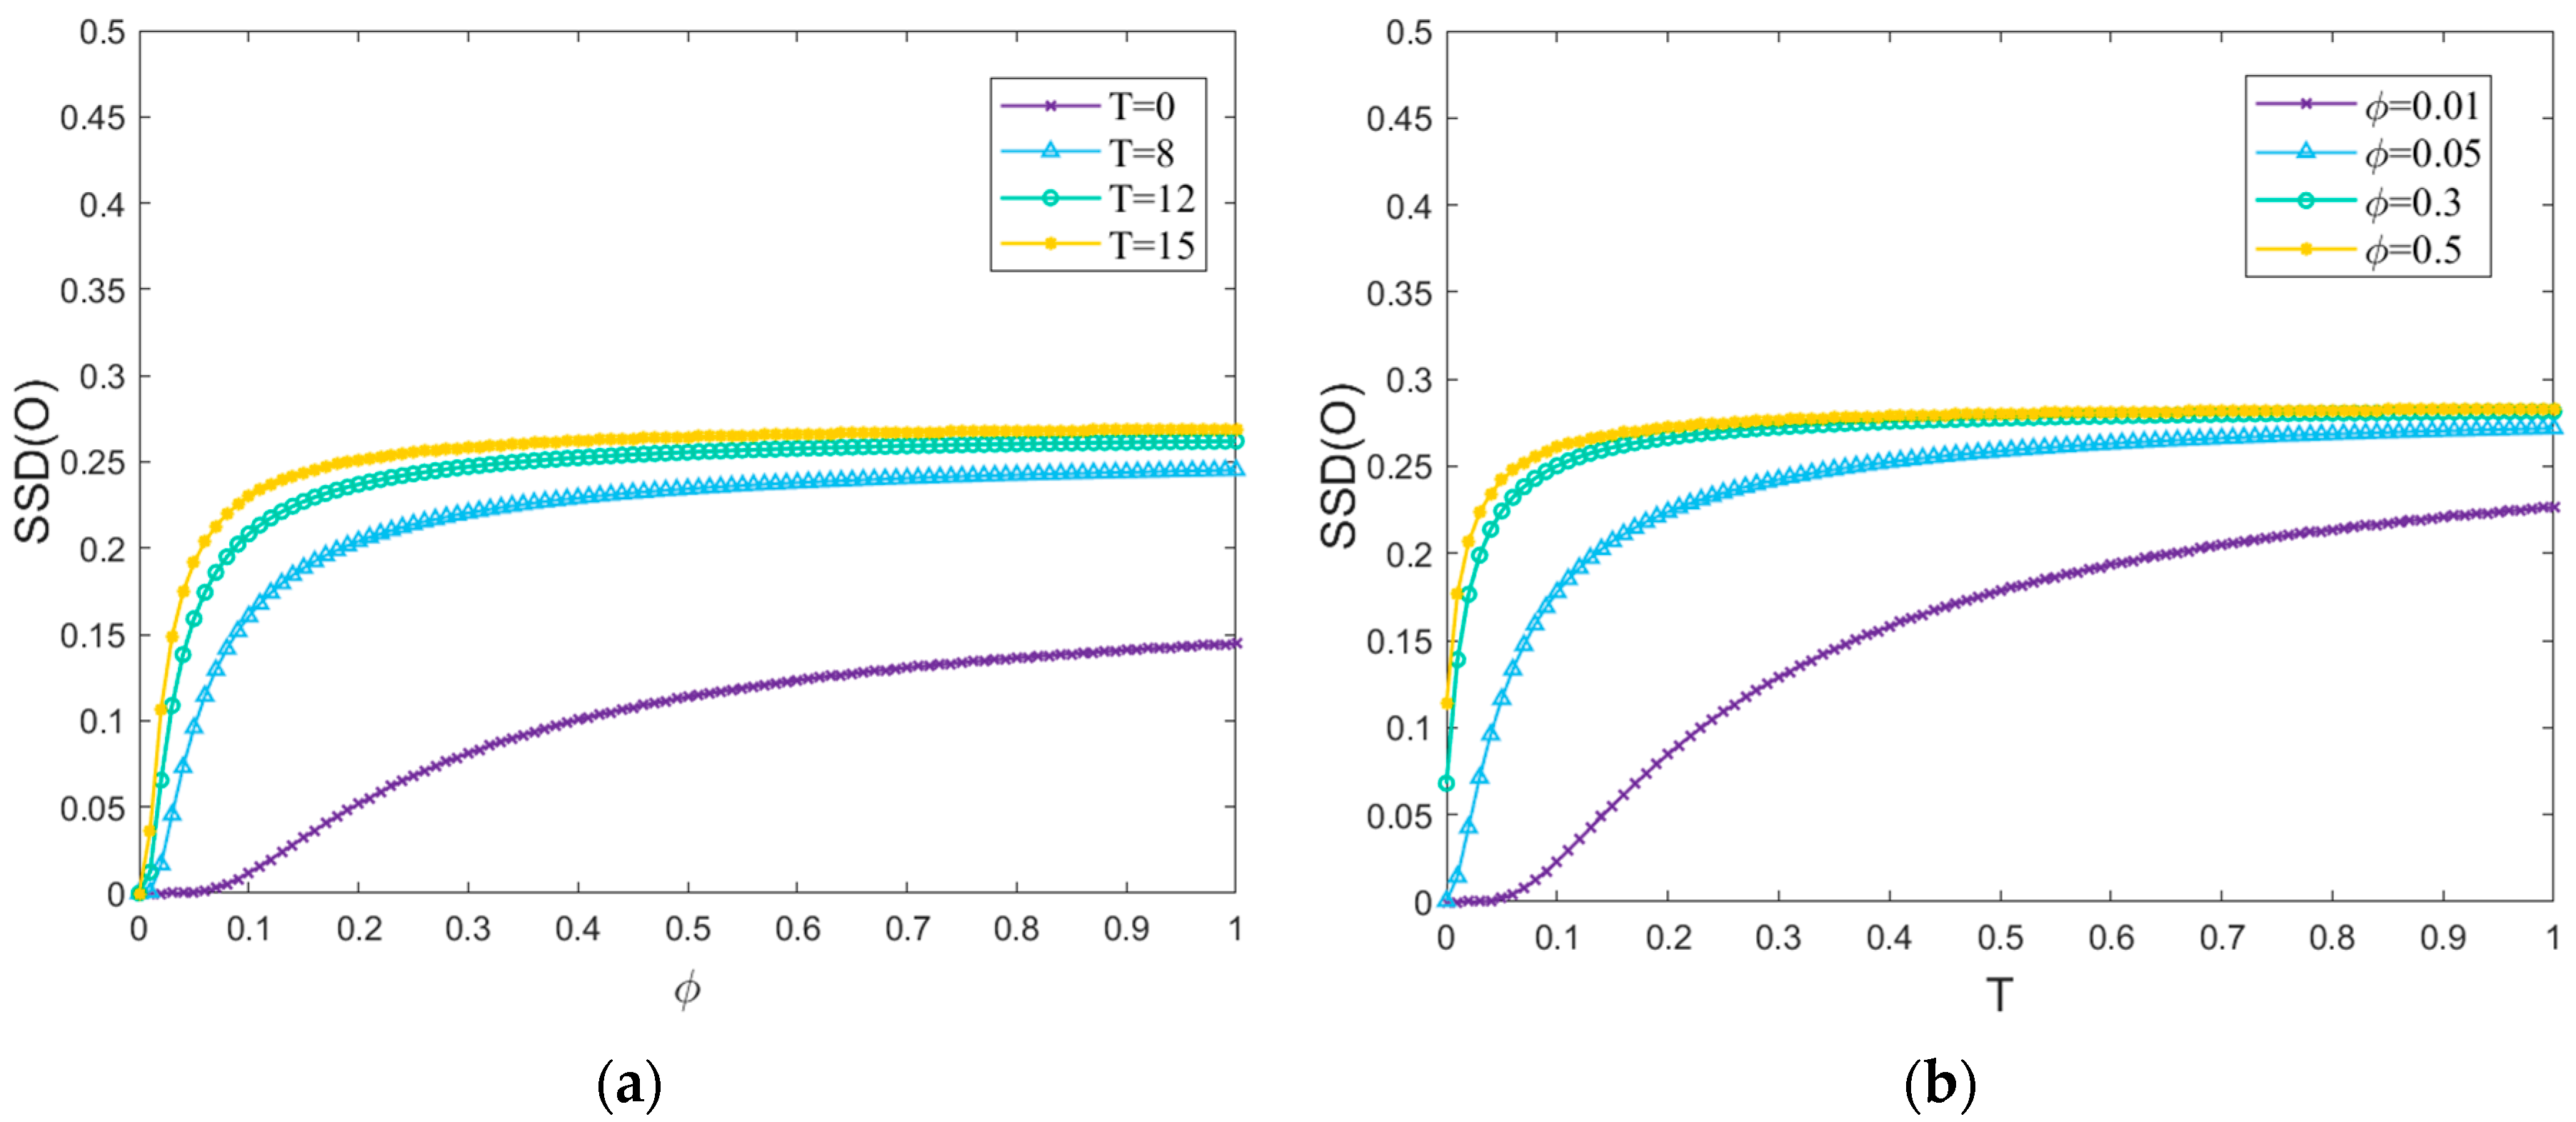
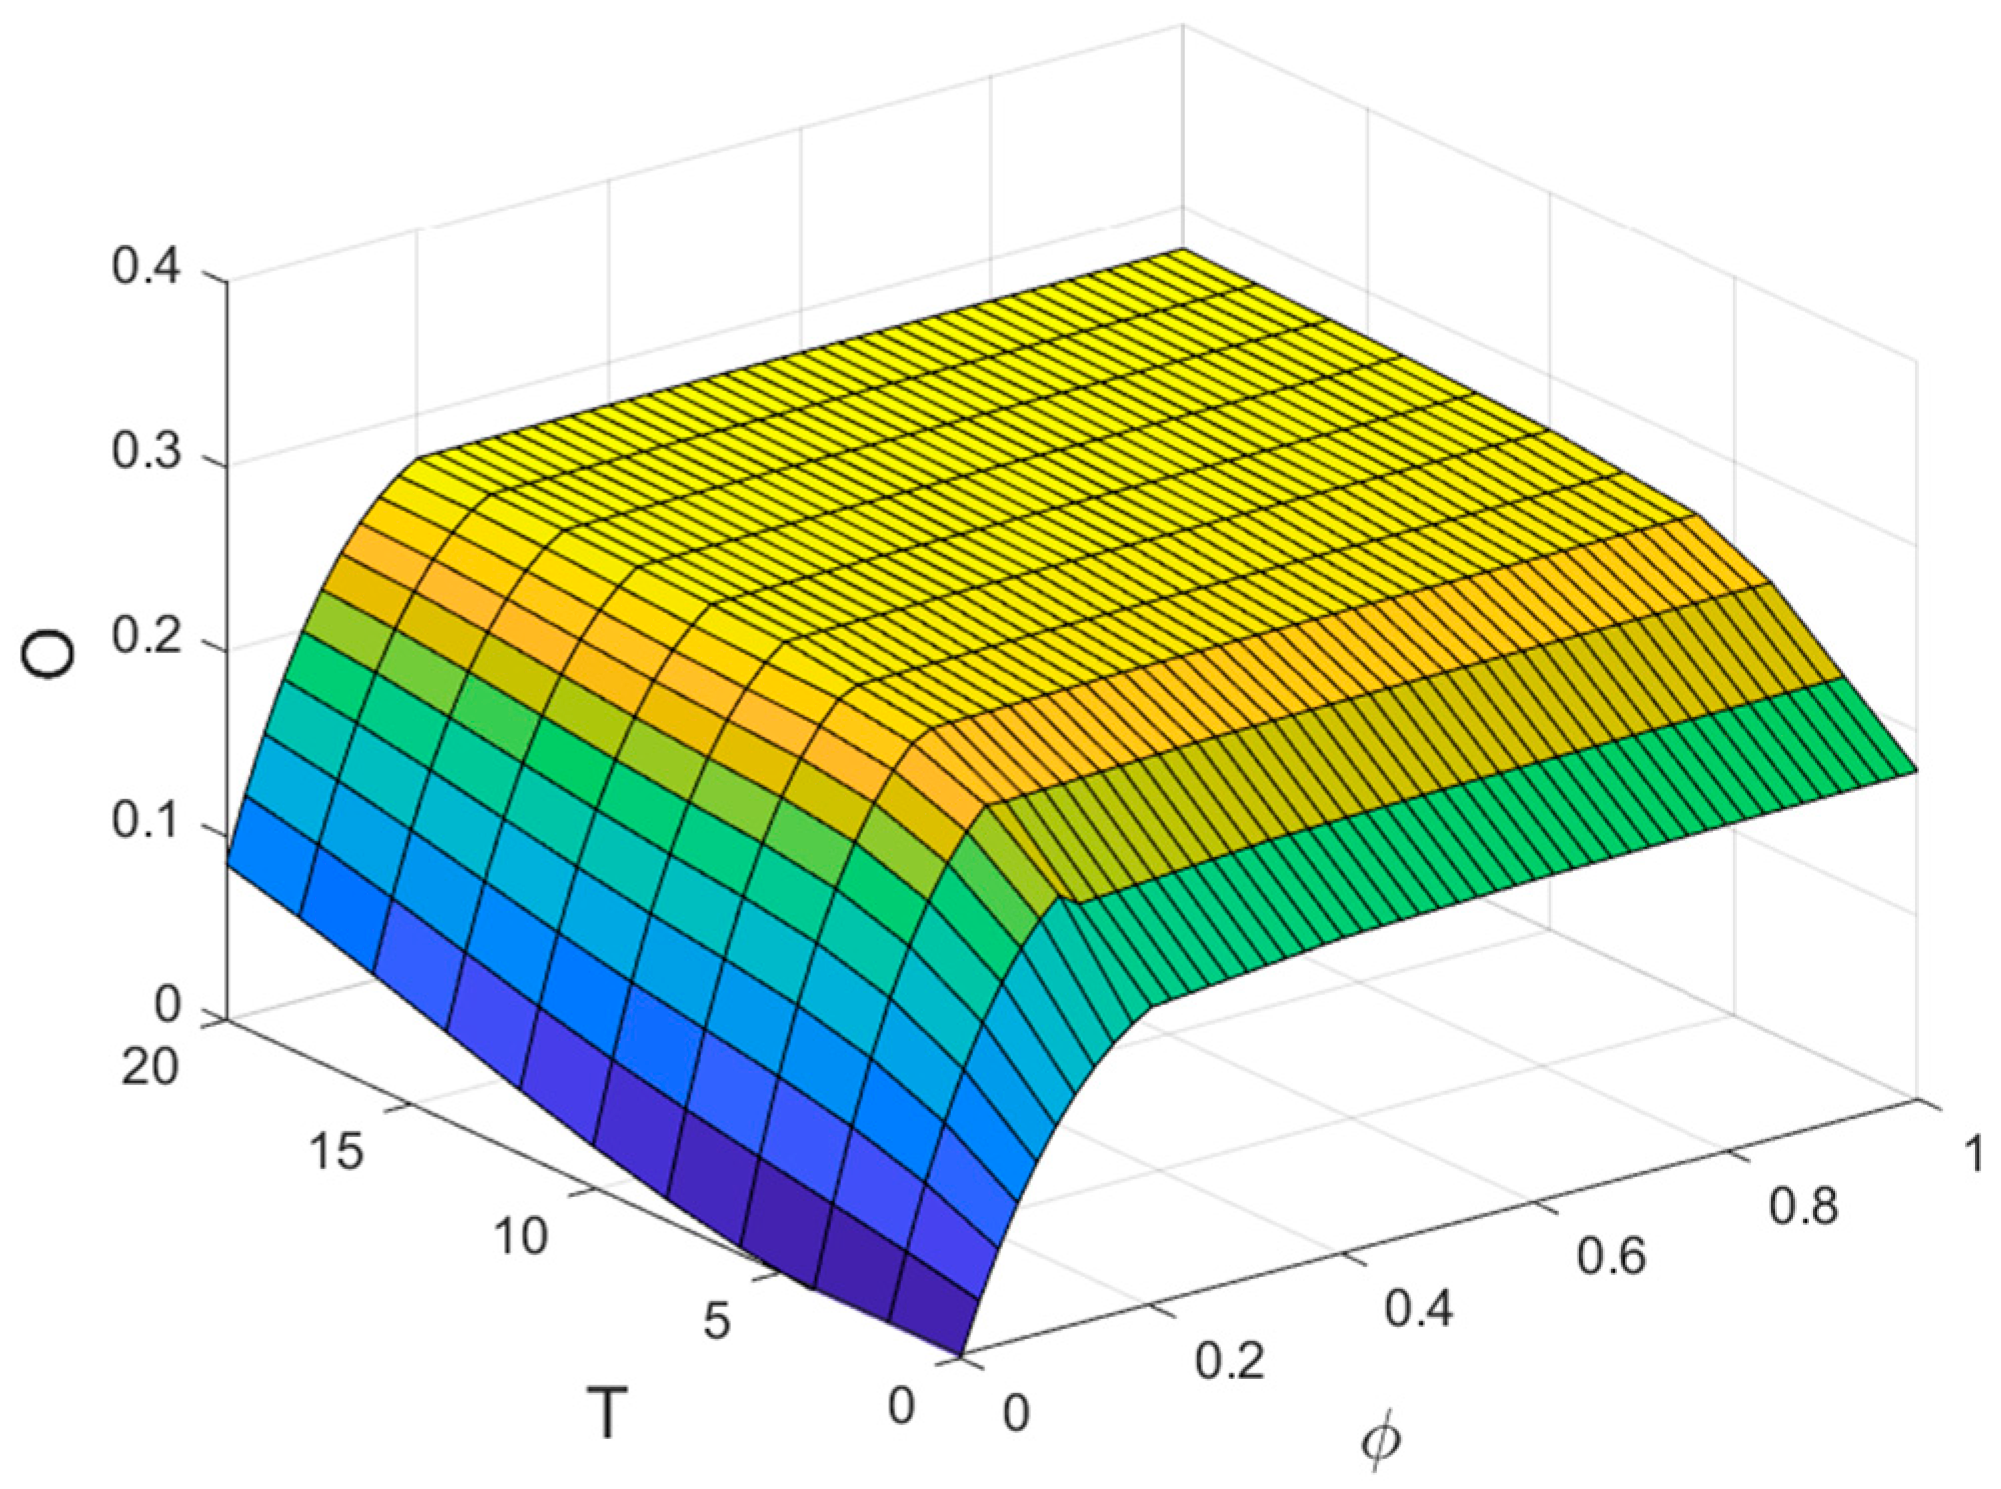
5.2.4. Impact of φ on the Proportion of Risk Outbreak

Combining Equations (12) and (17) yields:
O = 12 φ ( e 1 3 φ ( T + 1 ) 1 ) ( T + 1 ) 4 3 φ ( e 1 3 φ ( T + 1 ) 1 ) 2 ( 7 T + 11 )
It can be seen from Equation (19) that the proportion of the risk outbreak is affected by the efficient spreading rate of the risk within the network, φ, and the delay time, T, when all other parameters are determined. Using MATLAB numerical simulations, the variation rule of the steady-state density of the outbreak state nodes was analyzed using φ and T, as shown in Figure 12.
As shown in Figure 12a, increasing the efficient risk-spreading rate will increase the steady-state density of risk nodes in the outbreak state. This increase effect is especially significant when there is a time delay. In addition, Figure 12b shows that under a fixed propagation rate, the steady-state density of outbreak state risk nodes gradually rises as the delay time increases. When the delay time is large enough, the steady-state densities of outbreak-state risk nodes under different effective transmission rates slowly converge.
Figure 13 shows that the outbreak state risk node steady-state density is more sensitive to the marginal variation in the effective transmission rate φ, over and above the response to the delay time. This highlights the significant dominance of the efficient transmission rate on the steady-state density of infectious nodes.

5.3. Impact of Relevant Parameters on the Proportion of Risk Outbreaks

Assuming that the relevant parameters are T = 0, 8, 12; ρ1 = 0.01,0.3; ρ2 = 0.02,0.4, analyze the influence of the relevant parameters such as a, b, c, d, h on the proportion of the subway construction safety risk outbreak, and the results are shown in Figure 14.
As shown in Figure 14a,e,f, the proportion of safety risk outbreaks in subway construction is roughly positively correlated with the parameter exposure rate a, governance rate h, and the number of least contiguous edges m. The number of safety risk outbreaks in subway construction is approximately equal to the number of nodes in the node. This is consistent with the fact that when the probability of a safe state node being impacted is higher, the number of safe risks will also increase. A particular possibility exists for nodes with immunity to be transformed into a safe state, thus increasing the base of risk exposure and indirectly enlarging the proportion of safety risk outbreaks. The more paths in the network model formed by the safety risk of subway construction, the stronger the network’s connectivity, and the easier the risk spreads, increasing the proportion of the safety risk outbreak. Compared with Figure 14a,e,f, the longer the propagation delay time and the larger the effective propagation rate, the more obvious the influence of the change of parameters a, h, and m on the proportion of safety risk outbreak.
Figure 14c,d shows that the proportion of safety risk outbreaks in metro construction correlates roughly negatively with the parameters cure rate c, self-cure rate d. This is because when managers find the problem through effective interventions, they can significantly curb the continued spread of safety risks, thus reducing the proportion of safety risk outbreaks. A comparison of Figure 14c,d shows that it is more effective by way of interventions than by self-healing capability.
Figure 14b shows that the proportion of subway construction safety risk outbreaks is positively correlated with b when T > 8 and the efficient spreading rate is greater than the threshold value. The proportion of subway construction safety risk outbreaks is positively correlated with b and then negatively correlated with b when T < 8 or the efficient spreading rate is lower than the threshold value. The main reason is that after the risk of safety status is affected, the risk impact will be hidden in the short-term construction process when other construction conditions are better, which may not lead to safety risks. However, over time, the continuous accumulation of risk shocks will lead to a sudden change in safety risks from a hidden state to an outbreak state at a certain moment, and even a domino effect will lead to construction safety accidents. In this process, the greater the delay in transmission, the greater the likelihood that the risk will spread, which validates the conclusion that the delay effect lowers the transmission threshold. But when the transmission delay time is short and the efficient spreading rate is low, even if the risk outbreak rate is high, the risk will be quickly detected and effectively controlled.

6. Conclusions

To explore the mechanism of safety risk propagation in subway construction projects and reduce the occurrence of safety accidents, this study, starting from the hidden and delayed nature of safety risk propagation in subway construction, constructed a dynamic model based on complex networks and propagation dynamics theory. This provides a new perspective for researching the safety risk propagation in subway construction. The main conclusions are as follows:
(1)
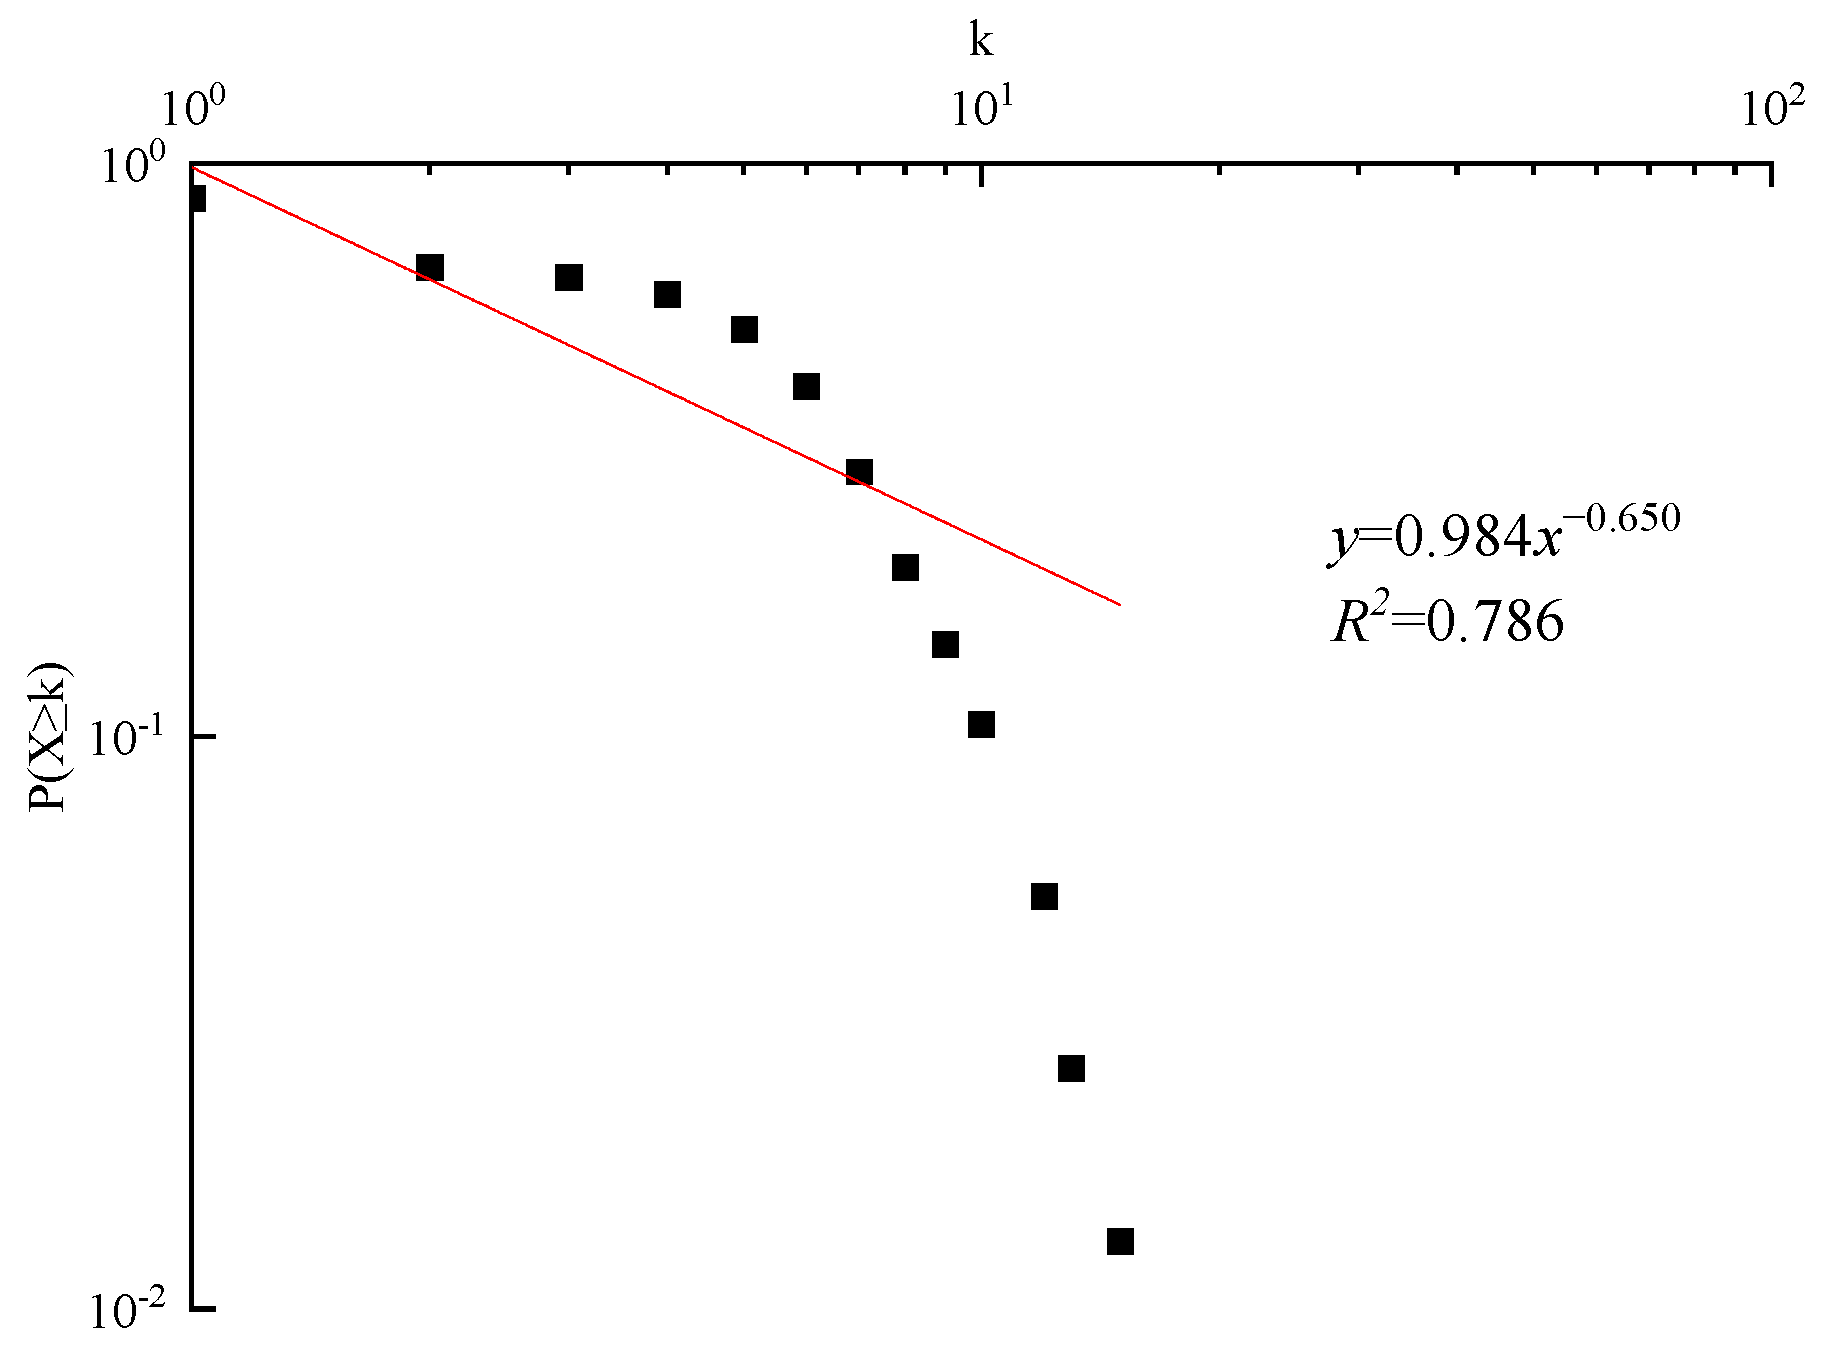
The subway construction safety risk network has the dual characteristics of scale-free and small world. This means that safety accidents in the subway construction industry are not random events but rather the result of a strong correlation between different safety risk factors.
(2)
The delay time T significantly affects the propagation behavior of risk and the achievement of the equilibrium state in the network. For the case of φ < φc (max), a longer T is required to transition the steady-state density of various nodes from the risk-averse state to the risk-bursting state. While in the case of φ > φc (max), only a shorter T is needed to reach the equilibrium state, and T speeds up the equilibrium state achievement.
(3)
In the process of risk propagation, the time element is more decisive than the network size. The transmissibility of risk factors in the hidden state plays a critical role in the whole process of risk diffusion, and the delay effect of propagation accelerates the diffusion of risk in the network. When the parameters are certain, the steady-state densities of all risk nodes within the network are related to the contagion rates ρ1 and ρ2 and the delay time T. However, the different values of ρ1 and ρ2 have almost no effect on the values of steady-state densities that eventually reach the equilibrium state.
(4)
Construction enterprises need to focus on the propagation of hidden state risk nodes and the delay of risk contagion when developing subway construction safety risk control programs. The safety state nodes and hidden state nodes should be monitored and warned to block the spread of risk in the network promptly and to control the delay time of risk in the network to reduce the probability of risk occurrence.
These findings are essential for regulating the safety of the subway construction process and should be highly emphasized. However, this study has several limitations. First, the selected variables and parameters were determined using expert judgments, which are inevitably subject to uncertainty and bias. Second, to simplify the model, this paper assumes that the probability of change of shocks to different risk nodes and their propagation delay times are the same. However, in practice, they may be a function of time. These limitations should be further explored in future research.

Author Contributions

Conceptualization, Y.H. and X.Z.; methodology, Y.H. and F.L.; software, Y.H.; validation, B.A., J.S. and X.B.; formal analysis, Y.H.; investigation, X.Z.; resources, F.L.; data curation, F.L.; writing—original draft preparation, Y.H.; writing—review and editing, X.Z.; visualization, B.A.; supervision, J.S.; project administration, J.S.; funding acquisition, X.B. All authors have read and agreed to the published version of the manuscript.

Funding

This work was supported by the National Natural Science Foundation of China [Grant No. 51768034].

Institutional Review Board Statement

Not applicable.

Informed Consent Statement

Not applicable.

Data Availability Statement

All data and models generated and used to support the results of this study are available from the corresponding author upon reasonable request.

Conflicts of Interest

The authors declare no conflicts of interest.

References

  1. Qi, H.A.; Zhou, Z.P.; Yuan, J.F.; Li, N.; Zhou, J.L. Accident pattern recognition in subway construction for the provision of customized safety measures. Tunn. Undergr. Space Technol. 2023, 137, 105157. [Google Scholar] [CrossRef]
  2. Zhou, Z.; Goh, Y.M.; Shi, Q.; Qi, H.; Liu, S. Data-driven determination of collapse accident patterns for the mitigation of safety risks at metro construction sites. Tunn. Undergr. Space Technol. 2022, 127, 104616. [Google Scholar] [CrossRef]
  3. Deng, Y.; Liu, Z.; Song, L.; Ni, G.; Xu, N. Exploring the metro construction accidents and causations for improving safety management based on data mining and network theory. Eng. Constr. Arch. Manag. 2023, 1–25. [Google Scholar] [CrossRef]
  4. Zhou, Z.P.; Irizarry, J.; Guo, W.Y. A network-based approach to modeling safety accidents and causations within the context of subway construction project management. Saf. Sci. 2021, 139, 105261. [Google Scholar] [CrossRef]
  5. Xu, N.; Ma, L.; Liu, Q.; Wang, L.; Deng, Y. An improved text mining approach to extract safety risk factors from construction accident reports. Saf. Sci. 2021, 138, 105216. [Google Scholar] [CrossRef]
  6. Chen, F.Y.; Wang, H.W.; Xu, G.Y.; Ji, H.C.; Ding, S.L.; Wei, Y.C. Data-driven safety enhancing strategies for risk networks in construction engineering. Reliab. Eng. Syst. Saf. 2020, 197, 106806. [Google Scholar] [CrossRef]
  7. Chen, Y.; Zhu, L.P.; Hu, Z.G.; Chen, S.; Zheng, X.Z. Risk Propagation in Multilayer Heterogeneous Network of Coupled System of Large Engineering Project. J. Manage. Eng. 2022, 38, 13. [Google Scholar] [CrossRef]
  8. Wang, L.; Cheng, Y.; Zhang, Y. Exploring the risk propagation mechanisms of supply chain for prefabricated building projects. J. Build. Eng. 2023, 74, 106771. [Google Scholar] [CrossRef]
  9. Chen, Y.; Hu, Z.; Liu, Q.; Zhao, M. Risk Propagation of Delayed Payment in Stakeholder Network of Large Hydropower Project Construction considering Risk Resistance and Mitigation. Math. Probl. Eng. 2018, 2018, 8013207. [Google Scholar] [CrossRef]
  10. Halabi, Y.; Xu, H.; Long, D.; Chen, Y.; Yu, Z.; Alhaek, F.; Alhaddad, W. Causal Factors and Risk Assessment of Fall Accidents in the U.S. Construction Industry: A Comprehensive Data Analysis (2000–2020). Saf. Sci. 2022, 146, 105537. [Google Scholar] [CrossRef]
  11. Mohandes, S.R.; Zhang, X. Developing a Holistic Occupational Health and Safety Risk Assessment Model: An Application to a case of Sustainable Construction Project. J. Clean. Prod. 2021, 291, 125934. [Google Scholar] [CrossRef]
  12. Zuo, J.; Rameezdeen, R.; Hagger, M.; Zhou, Z.; Ding, Z. Dust Pollution Control on Construction Sites: Awareness and self-responsibility of Managers. J. Clean. Prod. 2017, 166, 312–320. [Google Scholar] [CrossRef]
  13. Kim, J.Y.; Lee, D.S.; Kim, J.D.; Kim, G.H. Priority of Accident Cause Based on Tower Crane Type for the Realization of Sustainable Management at Korean Construction Sites. Sustainability 2020, 13, 242. [Google Scholar] [CrossRef]
  14. Dong, N.; Fu, Y.; Xiong, F.; Li, L.; Ao, Y.; Martek, I. Sustainable Construction Project Management (SCPM) Evaluation—A Case Study of the Guangzhou Metro Line-7, PR China. Sustainability 2019, 11, 5731. [Google Scholar] [CrossRef]
  15. Xing, X.; Zhong, B.; Luo, H.; Li, H.; Wu, H. Ontology for Safety Risk Identification in Metro Construction. Comput. Ind. 2019, 109, 14–30. [Google Scholar] [CrossRef]
  16. Wang, Z.; Chen, C. Fuzzy Comprehensive Bayesian Network-Based Safety Risk Assessment for Metro Construction Projects. Tunn. Undergr. Space Technol. 2017, 70, 330–342. [Google Scholar] [CrossRef]
  17. Yan, H.; Gao, C.; Elzarka, H.; Mostafa, K.; Tang, W. Risk Assessment for Construction of Urban Rail Transit Projects. Saf. Sci. 2019, 118, 583–594. [Google Scholar] [CrossRef]
  18. Ding, L.; Zhang, L.; Wu, X.; Skibniewski, M.J.; Qunzhou, Y. Safety Management in Tunnel Construction: Case Study of Wuhan metro Construction in China. Saf. Sci. 2014, 62, 8–15. [Google Scholar] [CrossRef]
  19. Ding, L.; Zhou, Y.; Luo, H.; Wu, X. Using nD Technology to Develop an Integrated Construction Management System for City rail Transit Construction. Autom. Constr. 2012, 21, 64–73. [Google Scholar] [CrossRef]
  20. Li, Y.; Xiang, P.; You, K.; Guo, J. Dynamic Network Analysis of the Risks of Mega Infrastructure Projects from a Sustainable Development Perspective. Buildings 2022, 12, 434. [Google Scholar] [CrossRef]
  21. Fang, M.; Zhang, Y.; Zhu, M.; Chen, S. Cause Mechanism of Metro Collapse Accident Based on Risk Coupling. Int. J. Environ. Res. Public Health 2022, 19, 2102. [Google Scholar] [CrossRef] [PubMed]
  22. Fu, L.; Wang, X.; Zhao, H.; Li, M. Interactions among Safety Risks in Metro Deep Foundation Pit Projects: An Association Rule Mining-Based Modeling Framework. Reliab. Eng. Syst. Saf. 2022, 221, 108381. [Google Scholar] [CrossRef]
  23. Almeida, R. Analysis of a fractional SEIR model with treatment. Appl. Math. Lett. 2018, 84, 56–62. [Google Scholar] [CrossRef]
  24. Jung, H.; Phoa, F.K.H. On the effects of capability and popularity on network dynamics with applications to YouTube and Twitch networks. Physica A 2020, 571, 125663. [Google Scholar] [CrossRef]
  25. Chen, Y.; Hu, Z.; Liu, Q. Exploring the properties of cost overrun risk propagation network (corpn) for promoting cost management. J. Civ. Eng. Manag. 2019, 25, 1–18. [Google Scholar] [CrossRef]
  26. Marinovg, T.T.; Marinovag, R.S. Inverse problem for adaptive SIR model: Application to COVID-19 in Latin America. Infect. Dis. Model. 2021, 7, 134–148. [Google Scholar] [CrossRef]
  27. Huang, H.; Chen, Y.; Ma, Y. Modeling the competitive diffusions of rumor and knowledge and the impacts on epidemic spreading. Appl. Math. Comput. 2020, 388, 125536. [Google Scholar] [CrossRef]
  28. Wang, Y.C.; Sun, R.; Ren, L.Y.; Geng, X.X.; Wang, X.M.; Lv, L. Risk Propagation Model and Simulation of an Assembled Building Supply Chain Network. Buildings 2023, 13, 981. [Google Scholar] [CrossRef]
  29. Kang, H.; Sun, M.; Yu, Y.; Fu, X.; Bao, B. Spreading Dynamics of an SEIR Model with Delay on Scale-Free Networks. IEEE Trans. Netw. Sci. Eng. 2018, 7, 489–496. [Google Scholar] [CrossRef]
  30. Kiselev, I.N.; Akberdin, I.R.; Kolpakov, F.A. Delay-Differential SEIR Modeling for Improved Modelling of Infection Dynamics. Sci. Rep. 2023, 13, 1–15. [Google Scholar] [CrossRef]
  31. GB6441-1986; Classification for Casualty Accidents of Enterprise Staff and Workers. Standardization Administration of the P.R.C.: Beijing, China, 1986.
  32. Suh, Y. Sectoral Patterns of Accident Process for Occupational Safety Using Narrative Texts of OSHA Database. Saf. Sci. 2021, 142, 105363. [Google Scholar] [CrossRef]
  33. Grant, A.; Hinze, J. Construction worker fatalities related to trusses: An analysis of the OSHA fatality and catastrophic incident database. Saf. Sci. 2014, 65, 54–62. [Google Scholar] [CrossRef]
  34. GB/T15236-2008; General Administration of Quality Supervision, Inspection and Quarantine and Standardization Administration. Occupational Safety and Health Glossary: Beijing, China, 2008.
  35. Telikani, A.; Gandomi, A.H.; Shahbahrami, A. A survey of evolutionary computation for association rule mining. Inf. Sci. 2020, 524, 318–352. [Google Scholar] [CrossRef]
  36. Czibula, G.; Czibula, I.G.; Miholca, D.L.; Crivei, L.M. A novel concurrent relational association rule mining approach. Expert Syst. Appl. 2019, 125, 142–156. [Google Scholar] [CrossRef]
  37. Han, Y.; Bao, X. Topological mapping of complex networks from high slope deformation time series for landslide risk assessment. Expert Syst. Appl. 2022, 206, 117816. [Google Scholar] [CrossRef]
  38. Fang, C.; Marle, F.; Zio, E.; Bocquet, J.-C. Network theory-based analysis of risk interactions in large engineering projects. Reliab. Eng. Syst. Saf. 2012, 106, 1–10. [Google Scholar] [CrossRef]
  39. Fang, X.; Yang, Q.; Yan, W. Topological characterization and modeling of dynamic evolving power distribution networks. Simul. Model. Pract. Theory 2012, 31, 186–196. [Google Scholar] [CrossRef]
  40. Zhang, M.; Qin, S.; Zhu, X. Information Diffusion under Public Crisis in BA Scale-Free Network Based on SEIR Model—Taking COVID-19 as an Example. Phys. A Stat. Mech. Its Appl. 2021, 571, 125848. [Google Scholar] [CrossRef]
  41. Li, R.; Wang, W.; Shu, P.; Yang, H.; Pan, L.; Cui, A.; Tang, M. Review of Threshold Theoretical Analysis About Epidemic Spreading Dynamics on Complex Networks. Complex Syst. Complex. Sci. 2016, 13, 1–39. [Google Scholar] [CrossRef]
Figure 1. Modeling steps of subway construction safety risk network.
Sustainability 16 00796 g001
Figure 2. Subway construction safety risk network.
Sustainability 16 00796 g002
Figure 3. P(k) of nodes in the SCSRN.
Sustainability 16 00796 g003
Figure 4. SHOIS model propagation process (a: exposure rate; b: burst rate; c: governance rate; d: self-healing rate; h: immunization failure rate).
Sustainability 16 00796 g004
Figure 5. Changing pattern of propagation threshold with T and N: (a) the pattern of change of φc with T; (b) the pattern of change of φc with N.
Sustainability 16 00796 g005
Figure 6. The Impact of T on steady-state density: (a) ρ1 = 0.01, ρ2 = 0.02; (b) ρ1 = 0.3, ρ2 = 0.4.
Sustainability 16 00796 g006
Figure 7. The influence of the infection rate ρ1, ρ2 on the steady-state density of nodes: (a) hidden state risk nodes; (b) outbreak state risk nodes.
Sustainability 16 00796 g007
Figure 8. The influence of ρ2 on the steady-state density of hidden nodes and outbreak nodes when ρ1 = 0.01: (a) hidden state risk nodes and (b) outbreak state risk nodes.
Sustainability 16 00796 g008
Figure 9. The influence of ρ1 on the steady-state density of hidden nodes and outbreak nodes when ρ2 = 0.02: (a) hidden state risk nodes and (b) outbreak state risk nodes.
Sustainability 16 00796 g009
Figure 10. The influence of ρ2 on the steady-state density of hidden nodes and outbreak nodes when ρ1 = 0.3: (a) hidden state risk nodes and (b) outbreak state risk nodes.
Sustainability 16 00796 g010
Figure 11. The influence of ρ1 on the steady-state density of hidden nodes and outbreak nodes when ρ2 = 0.4: (a) hidden state risk nodes and (b) outbreak state risk nodes.
Sustainability 16 00796 g011
Figure 12. Changing the law of the ratio of nodes in the outbreak state with φ and T: (a) Outbreak state node ratio versus φ and (b) Outbreak state node ratio versus T.
Sustainability 16 00796 g012
Figure 13. 3D plot of the proportion of risky nodes in the outbreak state versus the efficient spreading rate and delay time.
Sustainability 16 00796 g013
Figure 14. The properties of subway construction safety risk outbreak proportion under the influences of a, b, c, d, h, and m: (a) The exposure rate is dependent on the outbreak proportion; (b) The burst rate is dependent on the outbreak proportion; (c) The governance rate is dependent on the outbreak proportion; (d) The self-healing rate is dependent on the outbreak proportion; (e) The immunization failure rate is dependent on the outbreak proportion; (f) The number of least contiguous edges is dependent on the outbreak proportion.
Sustainability 16 00796 g014
Table 1. Information about interviewees.
ExpertPositionExperience (Year)RoleEducational BackgroundProfessional
1Project manager15–20OwnerMEMCivil Engineering
2Project manager15–20ContractorMEMProject Management
3Safety officer10–15ContractorMaster’s degreeSafety management
4Safety officer>15ContractorMaster’s degreeSafety management
5Project manager15–20ContractorPHDCivil Engineering
6Engineer10–15Supervisory unitPHDUrban railway transportation
7Safety officer>20SubcontractorUndergraduateSafety management
8Safety officer15–20ContractorUndergraduateSafety management
9Safety officer10–15ContractorMaster’s degreeSafety management
10Safety officer10ContractorMaster’s degreeSafety management
Table 2. Safety risk factors for subway construction.
Risk Factors (Code)Description
Human and organizational factors
Owner
High pressure on schedule (R1)Inadequate owner preparation leads to schedule pressure, e.g., financing and land acquisition.
Supervision unit
Unqualified supervisory qualifications, skills, and experience (R2)The supervision agency lacks professional certificates, professional skills, and work experience.
Oversight programs and responsibilities not implemented (R3)The supervisory personnel did not execute the supervision plan or fulfill their obligations.
Inadequate supervisory safety education and training (R4)Supervisors did not receive appropriate education and training to improve their work abilities.
Weak supervisory safety awareness and responsibility (R5)Supervisors lack safety awareness and a sense of responsibility.
Inadequate supervisory oversight, inspection, and documentation (R6)The supervisory personnel did not conduct necessary supervision, review, and recording by the work requirements.
Survey unit
Unsatisfactory survey qualifications, skills, and experience (R7)Survey agencies lack professional certificates, professional skills, and work experience.
Inadequate surveys or remedial surveys (R8)Insufficiently detailed investigation of hydrological, geological, environmental, and other factors
Weak awareness and responsibility for survey safety (R9)Survey personnel lack safety awareness and a sense of responsibility.
Measuring specifications not implemented (R10)Failure to operate by regulatory requirements during the survey process.
Insufficient survey accuracy (R11)The survey accuracy of crucial information such as geology, hydrology, and environment makes it challenging to meet construction requirements.
Survey security plan not engaged (R12)The survey personnel did not fully participate in the design and implementation of the safety plan.
Monitoring unit
Unqualified monitoring qualifications, skills, and experience (R13)Monitoring institutions lack professional certificates, professional skills, and work experience.
Inadequate monitoring programs and their implementation (R14)Monitoring personnel did not implement the monitoring plan.
Weak awareness and responsibility for monitoring security (R15)Monitoring personnel lack safety awareness and a sense of responsibility.
Monitoring equipment inspection and maintenance (R16)Regular calibration, cleaning, sensor replacement, and maintenance.
Inaccurate monitoring (R17)Inaccurate monitoring data on surface subsidence, deformation of surrounding buildings and structures, and pipeline subsidence.
Monitoring and early warning processing and reporting (R18)Inadequate detection, reporting, and emergency response measures for abnormal monitoring data.
Designer
Unqualified design qualifications, skills, and experience (R19)The design unit lacks a professional certificate, professional skills, and work experience.
Flawed design solutions (R20)The design scheme does not meet the expected construction standards.
Weak design security awareness and responsibility (R21)Designers lack safety awareness and a sense of responsibility.
Design Changes (R22)Changes in engineering content due to design errors, omissions, and modifications in process technology
Design specifications not implemented (R23)Failure to design by regulatory requirements during the design process.
Design of security plans without participation (R24)Designers did not fully participate in the design and implementation of the safety plan.
Contractor
Unauthorized work by construction workers (R25)Improper use of personal protective equipment, non-compliance with workplace safety operating procedures, and failure to comply with safety production instructions.
Improper handling by construction personnel (R26)Poor behavior or incorrect operation of workers.
Construction workers without a license (R27)Workers participate in construction without obtaining relevant operation or professional qualification certificates for their respective occupations.
Insufficient specialized skills and experience of construction personnel (R28)Insufficient professional knowledge, experience, and skills of workers.
Directing against the rules (R29)Improper or non-compliant direction of construction operations by personnel in violation of relevant statutes, rules, and regulations or safety operating procedures.
Poor security awareness among contractors (R30)Neglect of safety equipment and facilities by contractors, failure to implement safety standards and procedures, and pursuit of speed at the expense of safety.
Inadequate or unfulfilled safety management system (R31)Incomplete safety system procedures or failure to strictly follow safety regulations.
Failure to implement the primary responsibility for production safety (R32)The management has not fully assumed the primary responsibility for safety production.
Failure to implement safety specifications (R33)Failure to follow safety regulations during the construction process.
Inadequate contractor safety education and training (R34)The contractor did not provide sufficient safety training to the workers.
Incomplete technical disclosure (R35)The construction party’s disclosure of engineering technical details, operating methods, and safety regulations is insufficient or comprehensive.
Unreasonable construction plan (R36)Unreasonable construction schedule, irrational resource allocation, and construction plan not meeting construction requirements.
Inadequate safety supervision of on-site workers by management personnel (R37)Insufficient supervision and guidance of workers by construction site management personnel.
Inadequate safety management organization (R38)Chaotic organizational structure in security management.
Improper management of subcontractors and suppliers (R39)The contractor failed to effectively supervise and control the work and behavior of subcontractors and suppliers.
Insufficient emergency plans and drills (R40)Inadequate emergency response plans, measures, and drills.
Inadequate identification of hidden dangers (R41)Failure to fully identify, identify, and resolve potential safety hazards.
Chaotic construction site management (R42)Including unclear construction processes and chaotic division of labor among personnel.
Poor construction organization and coordination (R43)Lack of effective communication and coordination in terms of resources, progress, and safety plans, and inadequate communication and coordination in terms of safety plans.
Improper use of mechanical equipment (R44)Continue using a specific device when it is not suitable for use.
Worker fatigue work (R45)The workers were in a high-intensity working state for several consecutive hours.
Insufficient investment in funds, materials, and personnel (R46)The acquisition of funds, materials, and personnel cannot meet the safety requirements of subway construction.
Safety culture and atmosphere (R47)The company lacks an atmosphere emphasizing a safety culture, and staff are indifferent to safety issues.
Improper remedial measures (R48)After problems or dangerous situations arise, the measures taken are not effective, inappropriate, or appropriate enough to solve the problem or prevent risks effectively.
Safety protection measures not implemented (R49)Although there are prescribed safety measures, in reality, these measures have not been effectively implemented.
Lack of safety signs (R50)Dangerous areas not indicated.
Not following the construction plan for construction (R51)The construction process was not carried out according to the established construction plan or plan.
Failure to construct according to design requirements (R52)The construction process was not carried out according to the design requirements.
Inaccurate hydrogeological survey (R53)There are errors or deficiencies in the hydrogeological survey conducted before construction.
Insufficient exploration and maintenance of surrounding buildings (structures) (R54)Insufficient exploration or protection of adjacent or crossing existing or protective buildings (structures) may cause settlement, cracks, deformation, and other impacts.
Improper construction reinforcement measures (R55)The structure of tunnels, stations, and track systems has not been strengthened using high-strength concrete, fiber-reinforced materials, rock anchor support, and other methods.
Improper construction of deep foundation pits (R56)Failure to take adequate support measures, failure to control the groundwater level during excavation, and failure to effectively protect the surrounding buildings and underground pipelines.
Improper construction of manually excavated and poured piles (R57)Significant deviation in aperture, uneven quality of pile concrete pouring, steel reinforcement not meeting design requirements, and unqualified verticality of pile body.
Improper construction of steel reinforcement engineering (R58)Wrong binding of steel bars, misalignment, weak connection of steel bars, insufficient concrete cover layer.
Improper construction of bridge high piers (R59)Uneven concrete pouring and improper foundation treatment.
Improper construction of bridge superstructure (R60)Uneven pouring of the beam body, improper control of prestressed tension, improper setting of expansion joints, and unstable connection of the beam body.
Improper installation and removal of templates, brackets, and arches (R61)The unstable support structure, incorrect template positioning, inconsistent support height, and insufficient overall stability of the arch.
Improper installation and removal of temporary facilities (R62)Installation and removal of tower cranes, gantry cranes, dormitories, office areas.
Improper construction of tunnel entrance slope engineering (R63)Poor stability of the entrance slope.
Improper excavation and construction of tunnel body (R64)Unreasonable excavation methods.
Improper construction of support lining system (R65)Lining void, lining cracking, leakage, cracks.
Structural construction quality defects (R66)Insufficient strength of engineering structure and improper construction technology.
Machine and material
Unreasonable stacking of materials and equipment (R67)The stacking method of materials and equipment does not comply with the principles of safety, order, and efficiency
Mechanical equipment failure (R68)Machine equipment fails or encounters problems during operation due to various reasons.
Insufficient inspection and maintenance of machines and materials (R69)The machinery, equipment, and materials used were not inspected and maintained in a timely and appropriate manner
Overload operation of machines and equipment (R70)Equipment operates beyond its design load and capacity
Improper selection of materials and equipment (R71)Incorrect choice of materials that do not meet engineering requirements or pieces of equipment with inappropriate specifications and performance mismatch
Improper operation of machinery and equipment (R72)Not following the operating manual or manufacturer’s instructions for mechanical equipment
Environment
Bad weather (R73)Persistent gale and rainstorms
Unknown underground hydrological conditions (R74)Unknown water level and unclear water quality characteristics
Complex geological conditions (R75)Underground cavities, complex strata, soil conditions, different types, hardness, and stability of rocks
Narrow, messy, and overlapping work environment (R76)The construction site is limited, chaotic, and overlapping, which affects construction efficiency and safety
Table 3. Structured expression case of an accident report.
Accident name“2.20” Qingdao Metro Line 5 Shilaoren Bathing Station Choking Accident
Accident time20 February 2023
Analysis of causesDirect cause: ➀ Maintenance personnel have a weak sense of safety and discipline when repairing rotary drilling rigs, do not comply with the company’s safety management rules and regulations, disobey the company’s maintenance instructions. ➁ Workers do not identify the safety risks, risk entering the rotary drilling rig drill pipe inside (narrow, limited space) work. ➂ The operator did not implement safety specifications, used a hand-held electric angle grinder in violation of the law, and improperly operated the equipment. ➃ Sparks generated during the operation of an angle grinder ignited combustible materials. They produced a large amount of smoke, which caused the safety rope to break and trap the person, resulting in death by asphyxiation. ➄ Management personnel did not supervise the safety of the construction site, hidden dangers were not investigated, and combustible materials were piled up randomly, posing a potential safety hazard.
Indirect causes: ➀ Inadequate control of the construction site by managers. ➁ The operator did not identify the risk in place. It did not recognize that after the rotary drilling rig malfunctioned, the lifting device fell off, forming a narrow space inside the drill pipe. ➂ Work safety education and training are not in place. Practitioners fail to truly grasp the knowledge and skills of production safety, resulting in a weak sense of production safety, compliance with rules and regulations, the complexity of limited space operations, and an insufficient understanding of the dangers and risky operations.
Accident data sets{R25, R26, R30, R33, R34, R37, R41, R42, R68, R72, R76}
Table 4. Topological properties of the SCSRN.
NetworkNodesEdgesDensityDiameterLCk
SCSRN763300.0585.621.9970.1144.342
Disclaimer/Publisher’s Note: The statements, opinions and data contained in all publications are solely those of the individual author(s) and contributor(s) and not of MDPI and/or the editor(s). MDPI and/or the editor(s) disclaim responsibility for any injury to people or property resulting from any ideas, methods, instructions or products referred to in the content.

