Article

Dynamics of Link Importance through Normal Conditions, Flood Response, and Recovery

Glenn Department of Civil Engineering, Clemson University, Clemson, SC 29634, USA
*
Author to whom correspondence should be addressed.
Sustainability 2024, 16(2), 819; https://doi.org/10.3390/su16020819
Submission received: 2 November 2023 / Revised: 8 January 2024 / Accepted: 10 January 2024 / Published: 17 January 2024
(This article belongs to the Special Issue Transport Planning and Governance for Resilient Cities)

Abstract

:
As climate change influences flood frequency, transportation damage and disruptions will become more common. Given the network’s expanse and cost of construction, communities’ mitigation efforts should be informed by analyses that span normal conditions and disaster management phases. This paper analyzes road segment criticality in normal, flood response, and recovery phases in Anderson County, South Carolina, considering impacts on emergency services, healthcare, industry, education, recreation, and transit. A 100-year event provides context for analyzing flood impacts to the time-based shortest paths, determined using ArcGIS Pro 3.1.3. Local and secondary roads were especially affected, with rerouting concentrating around the Anderson City area. Blocked road sections identified potentially vulnerable roads, and normalized betweenness centrality metrics identified community dependence on road segments for daily and emergency operations. While the quantity and dispersion of parks and grocery stores mitigated rerouting distance, other purposes faced challenges from impassable routes. The analysis revealed the southeastern and southern regions as most impacted across purposes, suggesting targeted mitigation. I-85, State Routes 28 and 81, and Federal Routes 29, 76, and 178 were the most critical roads before, during, and after the flood. This study highlights commonalities in road criticality across phases to support resilient transportation planning and sustainability.

1. Introduction

Transportation is a lifeline infrastructure [1] essential for sustainable and resilient communities. It facilitates access to key locations (e.g., hospitals, schools, and workplaces) and supports disaster management, including evacuation and disaster recovery. With climate-induced changes in flood frequency [2,3], strategic investments are needed. Transportation resilience planning and investment should consider the multi-faceted uses of transportation in conjunction with the hazards.
Floods impact various sectors of a community [4], along with the transport infrastructure. Flooding can cause submerged or debris-blocked roads; destroy pavements, bridges, or tunnels; isolate communities; and impact the environment and quality of life [5]. Such disruptions affect people’s livelihoods, health, shelter, education, and mobility [6], highlighting the importance of sustainable and resilient transportation systems. The interruption of transportation impacts safety, hampers searches and rescue efforts, hinders survivor evacuation, impedes access to critical facilities [7], and challenges disaster relief operations [8], thereby hindering disaster management. The nature and severity of disruptions vary from place to place, ranging from complete accessibility obstruction to partial network disruption, increasing travel distances and times, and challenging traffic management.
The frequency and severity of floods are projected to increase due to climate change [2,3]. In addition to climate change, abrupt changes in land use and land cover over time play a role in increasing the severity of floods [9]. Repeated flooding, along with the lack of a proper disaster response plan, can be more problematic, leading to poor disaster management and delayed recovery [10].
In light of the extreme impacts of floods and the importance of transportation, the necessity of transportation system resilience is clear. Resilience encompasses the ability to anticipate, prepare for, and adapt to changing conditions and rapidly respond to and recover from disruptions [11]. To improve resilience, one must first identify the hazard and the nature of disruptions that the hazard can have on the system. However, the resilience decisions and approaches for various disasters can be different [12]. In the case of flooding, time is of the essence to respond to and repair the impacted road networks, since the longer the recovery time, the higher the cost to the community [13]. Given the expansive nature of road networks and the time, effort, and resources required for comprehensive repairs, it is pragmatic to identify and prioritize critical road locations serving multiple purposes. This approach increases the safety and management of the community by facilitating an efficient response strategy, minimizing disruption, and thereby enabling the recovery of normal community function in these critical areas.
Criticality analysis is a technique for determining how dependent a community is on key infrastructure for its daily [14] and emergency operations. Transportation network criticality measures a road section’s significance within the context of an entire system or region [15]. The criticality is dependent on the function that a particular road fulfills for a community [16]. For instance, a road can be of higher criticality if it supports access to key facilities such as hospitals, power supplies, and evacuation facilities than other major roads that merely augment general mobility.
This paper analyzes the criticality of road segments across normal, flood response, and recovery conditions and how this criticality changes from one phase to another, with a focus on maintaining resilient and sustainable transportation networks. The normal condition assessment includes access to major shipping corridors for light to major industry, employment locations, educational institutions, recreational facilities, and stores. Public transit routes are also considered. For the response phase, we examine the connectivity of residential areas to major corridors and to emergency shelters for evacuation purposes. For the recovery phase, we examine the connectivity of major shipping corridors to the flood-impacted areas. Across phases, we also consider access to emergency services and access from residential areas to healthcare, particularly hospitals and urgent care. GIS supports the analysis to determine the shortest path time and the change in this time when the road system is subject to flooding. This study area is Anderson County, South Carolina, in which all trip types are potentially impacted by a 100-year flood of the Savannah River. The assessment can provide stakeholders with critical roadways and the information needed to plan for transportation resilience and prioritize the allocation of limited resources.
The remainder of this paper is divided into four sections. The next section provides a review of flood impacts on transportation, a survey of research utilizing criticality metrics, and their relevance to resilience. This is followed by the analysis methodology employed in this study. Next, the results for Anderson County are presented. The final section provides a summary, conclusions, limitations, and directions for future research.

2. Literature Review

Floods have direct and indirect impacts on transportation [8,17]. The direct impacts are damage to infrastructure due to direct contact with floodwater, and the indirect impacts are changes in route, congestion, economic losses, social and psychological losses, etc. Roads and bridges may be blocked, necessitating the use of alternative routes, if available. Due to the blockage, the effects are not confined to the directly inundated area; distant locations dependent on the inundated areas may also be affected. In urban environments, the rerouting distance might be less due to the availability of many alternatives [18]. Conversely, in regions with limited transportation alternatives, the rerouting is excessive, resulting in massive delays and economic, temporal, and efficiency losses. For instance, Affleck et al. [19] mentioned that a journey that took only fifteen minutes took two hours due to disruption and congestion caused after several bridges were temporarily closed. Rerouting processes indirectly impact businesses by escalating transportation costs.
When business-critical highways are closed, companies may suffer due to the unavailability of raw materials, export challenges, or workforce inaccessibility. For example, flooding in Thailand in 2011 caused a shortage of auto parts, causing automobile manufacturing to halt both inside and outside the flood zone. Bubeck et al. [20] calculated $4.17 million in indirect economic losses due to commuting delays from Storm Desmond. These losses, shouldered by society, underscore the economic toll of floods. While losses can never be wholly eliminated, they can be reduced.
Floods significantly disrupt various aspects of community life. Research on accessibility impacts due to floods mainly focuses on emergency response services [21,22,23,24]. Ensuring accessibility to emergency facilities like hospitals and urgent care is important before, during, and after a disaster. Increased travel time to reach care can be detrimental for patients in need of immediate medical attention. In a study on 100-year return period floods in Delaware’s coastal areas, Gangwal et al. [25] found an average increase in travel time of 2.23 min to reach critical facilities. Considering the urgency of such trips, even a marginal delay can have grave consequences. Floods can also make hospitals inaccessible in some areas, leading to even more severe outcomes. Gangwal et al. [25] found dense pockets of communities losing access to hospitals.
Floods also pose challenges to public transit systems, causing obstructions that disproportionately affect households of lower socio-economic status, who often lack alternative means of transportation. A study on Kinshasa’s urban transit system showed that flood-induced disruptions led to increased public transit headway, decreased speed, and necessitated rerouting [26]. These changes resulted in travel delays and reduced work accessibility, inflicting a considerable societal impact. The economic loss due to such commuter delays was estimated to be $1.2 million per day [26].
Evacuation is a vital component of the response phase and can be difficult when faced with floods that render evacuation routes inaccessible. Thorough analyses of the evacuation route in flood scenarios are necessary [27,28,29]. This involves understanding the flood conditions of the evacuation routes and rerouting consequences of blockages.
One often overlooked indirect impact of floods is a loss of social connectedness, a feeling of attachment towards people’s place of living. The feeling of people that keeps them attached to their locality is particularly important for the health and happiness of a community. Cox and Perry [30] found that loneliness and isolation can arise due to the physical and social effects of disasters [31]. Access to natural features like parks and recreational facilities can help establish a sense of home and community [31]. Floods have the potential to create new social exclusion areas due to disrupting access to those places [6], compounding the psychological impact on the population.
These studies are important, but to build community resilience, they might not be enough. There are many important travel purposes, such as education, the economy, and recreation. Studying all these purposes can provide a better understanding of the overall needs of community operations. Prior studies typically focused on one phase, mostly the response phase, but they did not answer questions about the recovery phase, which is critical for returning the community to the pre-disaster phase with added resilience.
To add resilience, we must first identify the vulnerable locations or most critical sections in the network. It is difficult to predict how well the system will operate when there are disruptions by evaluating the roadways’ efficiency under normal conditions [32]. Prioritizing and optimizing pre- and post-disaster investments are part of disaster management, which aims to improve the system’s ability to cope with shocks, cut down on losses from catastrophes, and restore performance [33]. Understanding the nature and scope of disaster impacts and performing criticality analysis considering those impacts can help build resilience in the transportation network.

2.1. Qualitative and Quantitative Approaches

The assessment of criticality can be carried out using qualitative or quantitative methods. Qualitative assessments are elaborate descriptions that help one understand the impacts and management techniques. Croope et al. [34] proposed a decision-support system framework to lower the vulnerability of locations and infrastructure systems through stress-mitigation techniques for disasters. Quantitative assessment can be mathematical models for assessment [35], models for management [36], or decision support tools [37] that can provide direct measurements or suggest decisions that help analysts assess or predict disaster impacts [33]. These assessments can be of component- and system-level performance [33]. To perform a quantitative assessment of criticality in transportation, metrics are required. Almotahari et al. [38] mention various criticality metrics, which can be broadly classified as topological analysis and the development of indices.

2.2. Topological Analysis

The topological properties of a network can be useful for assessing risks [39]. The accessibility of the origin-destination pairs can change by increasing the travel distance, travel time, or isolating the origin and destination. The topological network properties can be used to quantify the resilience and performance of a transportation network, e.g., by determining the contribution of each component to the network before and after any network link fails [40]. One indicator of network topology analysis is the shortest path. If a link fails, connectivity can still exist if there is redundancy in the road network.
Betweenness centrality, a measure proposed by Freeman [41] to understand the importance of links or nodes, is calculated as the number of times a road section or a node is used to access facilities in a community. Gangwal et al. [25] measured criticality using a modified betweenness centrality metric. The number of times a link appeared on the node-facility shortest path was normalized. The betweenness centrality can be weighed with the traffic flow as well. However, if travel demand and travel time are not available, Gauthier et al. [42] suggest the use of betweenness centrality as a metric.

2.3. Development of the Analysis Index

Indices can help in criticality assessments. For instance, the Network Robustness Index (NRI) for a road segment is computed as the change in travel-time resulting from rerouting traffic in the system should that segment fail [43]. This method is helpful when the travel time can be uniformly computed. Sullivan et al. [44] used the NRI to compute the capacity-disruption values for critical road segment identification and the trip robustness index for system-wide robustness. However, if link disconnectivity occurs, the index cannot evaluate the impacts of isolation. Jenelius et al. [45] provided an importance score for network links based on the difference in cost before and after the link has failed. This score was based on two weighting options: equal weighting of all origins and destinations, referred to as “global importance”, or weighting based on traffic, referred to as “demand-weighted importance” [45]. The importance score can be calculated with and without disconnectivity; however, both values cannot be compared directly [46]. Nagurney et al. [47] introduced the efficiency measure for calculating the criticality of transportation links and nodes, which includes travel behavior information along with network topology. The efficiency measure assumes that the performance of the transportation network is directly proportional to the traffic handling capacity of the network at a given price-which can be travel time [47]. The criticality metric is indirect in that the change in efficiency is considered as criticality [46]. Another metric based on marginalized cost, which is the increase in travel time on a link due to an increase in unit flow, is the Link Criticality Index (LCI), developed by [46]. The LCI is a single traffic assignment measure and depends on the OD demand and the travel time of the link in the network. For smaller networks, LCI can be effective, but for larger transportation networks, processing takes a long time [38].

2.4. Flood Analysis

The flood analysis required for the identification of the potentially impacted road sections can be carried out by various methods. Some researchers use hydraulic and hydrologic models where rainfall runoff and streamflow are used to estimate flood flow rates and create flood maps. This approach requires extensive data, which might not be readily available. Some researchers [48] use simulated flood data to study the effects of flooding on road networks. This method alone is not very effective due to the lack of consideration for network robustness [25]. Another method is used when the depth of the flood is unavailable but the flood extent data are present. Tools that can calculate flood depth based on the flood extent and digital elevation models are used to model the flood for analysis [49].
The flood model or map is overlayed with the road network. The analysis can be based on binary failure criteria, which assigns a road section as passable or unpassable due to disruption, or the depth of the water above the road surface [50], or the depth can be used to calculate the delay. For instance, Gangwal et al. [25] used the depth disruption function provided by Pregnolato et al. [51] to identify the delay in the flooded sections where the depth was less than 30 cm.

2.5. Transportation Purpose Impact Analysis

Some prior research analyzed criticality across various transportation purposes. Colon et al. [13] combined a supply chain model and transport model to investigate the dependency of criticality on users and supply chains on Tanzanian roads. They calculated business losses due to supply disruptions to combine economic and transport modeling. Kasmalkar et al. [52] analyzed the disruption in commuter traffic flow due to sea level rise to understand the impacts of employee delay and absence. They focused on assessing the changes in workforce accessibility due to disasters only. Gangwal et al. [25] measured the criticality of the roads to access facilities like hospitals, emergency medical care, and emergency shelters. Gangwal et al. [53] assessed the accessibility of hospitals, grocery stores, and pharmacies for 500-year flooding. Alabbad et al. [50] measured the disruptions in accessing hospitals, fire departments, and police stations due to 100- and 500-year return period floods in Iowa. Shen et al. [54] analyzed the vulnerabilities regarding trips to work, school, grocery stores, recreation activities, and emergency services in the coastal area of Honolulu, Hawaii. However, this study was conducted in coastal areas for sea level rise, not for fluvial flooding. Anderson et al. [55] prioritized network restoration based on the change in equitable access from block group centroids to supermarkets, medical clinics, and primary schools for liquefaction, tsunamis, and hurricanes.
Transportation resilience research addresses railways [56], roads [57], freight [58], or transportation in general [59]. However, assessments tend to ignore the network’s larger objective, which is to enable people to travel across it for a variety of needs [55] before, during, and after a flood. Therefore, an approach is needed to understand the individual and overall impacts on these trips to better incorporate resilience into planning.

3. Methodology

Our goal is to understand the criticality of roads across different trips that help the community function before, during, and after a flood. Figure 1 outlines our study’s methodology. We assess the impact by analyzing changes in the shortest paths from residential areas to key destinations like hospitals, workplaces, grocery stores, and more. Census block group centroids and major corridor locations serve as origin points, while the destination depends on the purpose. For post-flood analysis, we calculated flood depth, as we consider roads under more than 30 cm of water as closed. We also employ betweenness centrality to identify crucial roads in both pre- and post-flood conditions. Our analysis encompasses not only the movement of people but also the transportation of goods, using the nearest major cities as origins for goods movement. Additionally, we categorize transportation needs according to different disaster management phases. Maps illustrate these analyses. Further details are provided below.

3.1. Route Choice in ArcGIS

Using ArcGIS Pro 3.1.3’s network analysis with business analyst 2022 data, we identified the shortest time paths from origins to their destinations. The route selection consisted of several factors and was based on Dijkstra’s algorithm. The costs applied here reflect the road class, turning availability, avoiding hazardous materials routes, and choosing the car or truck as the mode of travel based on the purpose of travel. The data includes the speed/time taken to travel through the section. Also, the hierarchy of the roads, i.e., local roads, highways, or freeways, was considered; the software looks for higher-capacity roads to reach the destination. If high-capacity roads are available nearby, the algorithm chooses such roads, even if the local roads can have less travel time. After a flood, people may try to use the high-capacity roads to avoid flood-induced barriers and reach their destinations faster. The choice of high-capacity roads can also be valid for normal operations.
Once the regular paths were mapped, we included the flood data in the analysis. We noted if any of the destinations were inside the flood area. For the destinations that do not directly fall under the flood hazard, we first checked if they were accessible from the origins. The trips were again calculated to find the shortest path, considering the flood locations (barriers). We then compared the before-flood and after-flood travel times to determine the trip’s additional rerouting time.

3.2. Criticality Metric

The choice of metric depends on this study’s needs and the metric’s effectiveness within the provided data. Jafino et al. [60] divided 17 metrics into two categories, i.e., derived from transport studies and derived from network theory. We considered time as our travel cost and identified the criticality based on the change in unweighted travel cost. The additional travel time can show the impacts of the flood across various purposes, but it fails to identify the locations that cause such changes. The significance of a node is determined by its use rather than its physical location [61], and the same applies to links. We selected the unweighted link betweenness centrality metric from network theory, assuming all trip purposes have equal importance. This allows identification of which links play an essential role for all purposes or the change across purposes. The equation for the link betweenness centrality measure ( B r ) for road section r is provided by Equation (1) [25].
B r = t T C t , r ,
where T is the total number of trip purposes from various origins to destinations, t is the index of trip type, and C t , r is the count of trips of type t passing through road section r.
For the importance of the links before and after the flood, we applied the normalized betweenness centrality value (Br%) as follows:
B r % = t T C t , r M a x C t , r ,
where Max(C(t,r)) is the maximum number of trip overlaps.
Along with the frequency of use of the road section, we consider rerouting additional time based on individual transportation purposes. The roads with high betweenness centrality are more critical. We also note that access to facilities such as hospitals is critical if the rerouting distance exceeds a threshold. The threshold time is calculated based on the critical ambulance delay.

3.3. Threshold Time

It is assumed that the facilities should be accessible within the threshold value of delay in an emergency. The allowable delay was associated with a 20% decrease in survival rate, extrapolated from the survival rate per minute delay provided by [62]. We performed a nonlinear interpolation to calculate the time for a 20% decrease in survival chance because the linear change suggests that after 12.5 min of delay, the survival chance is 0%. The formula used to extrapolate the existing 8% decrease in survival rate per minute delay during an emergency to calculate a 20% decrease in survival rate is provided in Equation (3):
S r d % = 1 1 R p m M
where S r d is the reduction in percentage of survival, R p m is the survival rate decrease per minute, and M is the time in minutes delay.
The threshold time was calculated at 2.7 min and was considered for all purposes due to the lack of threshold values for individual purposes and for consistency.

3.4. Flood Depth Identification

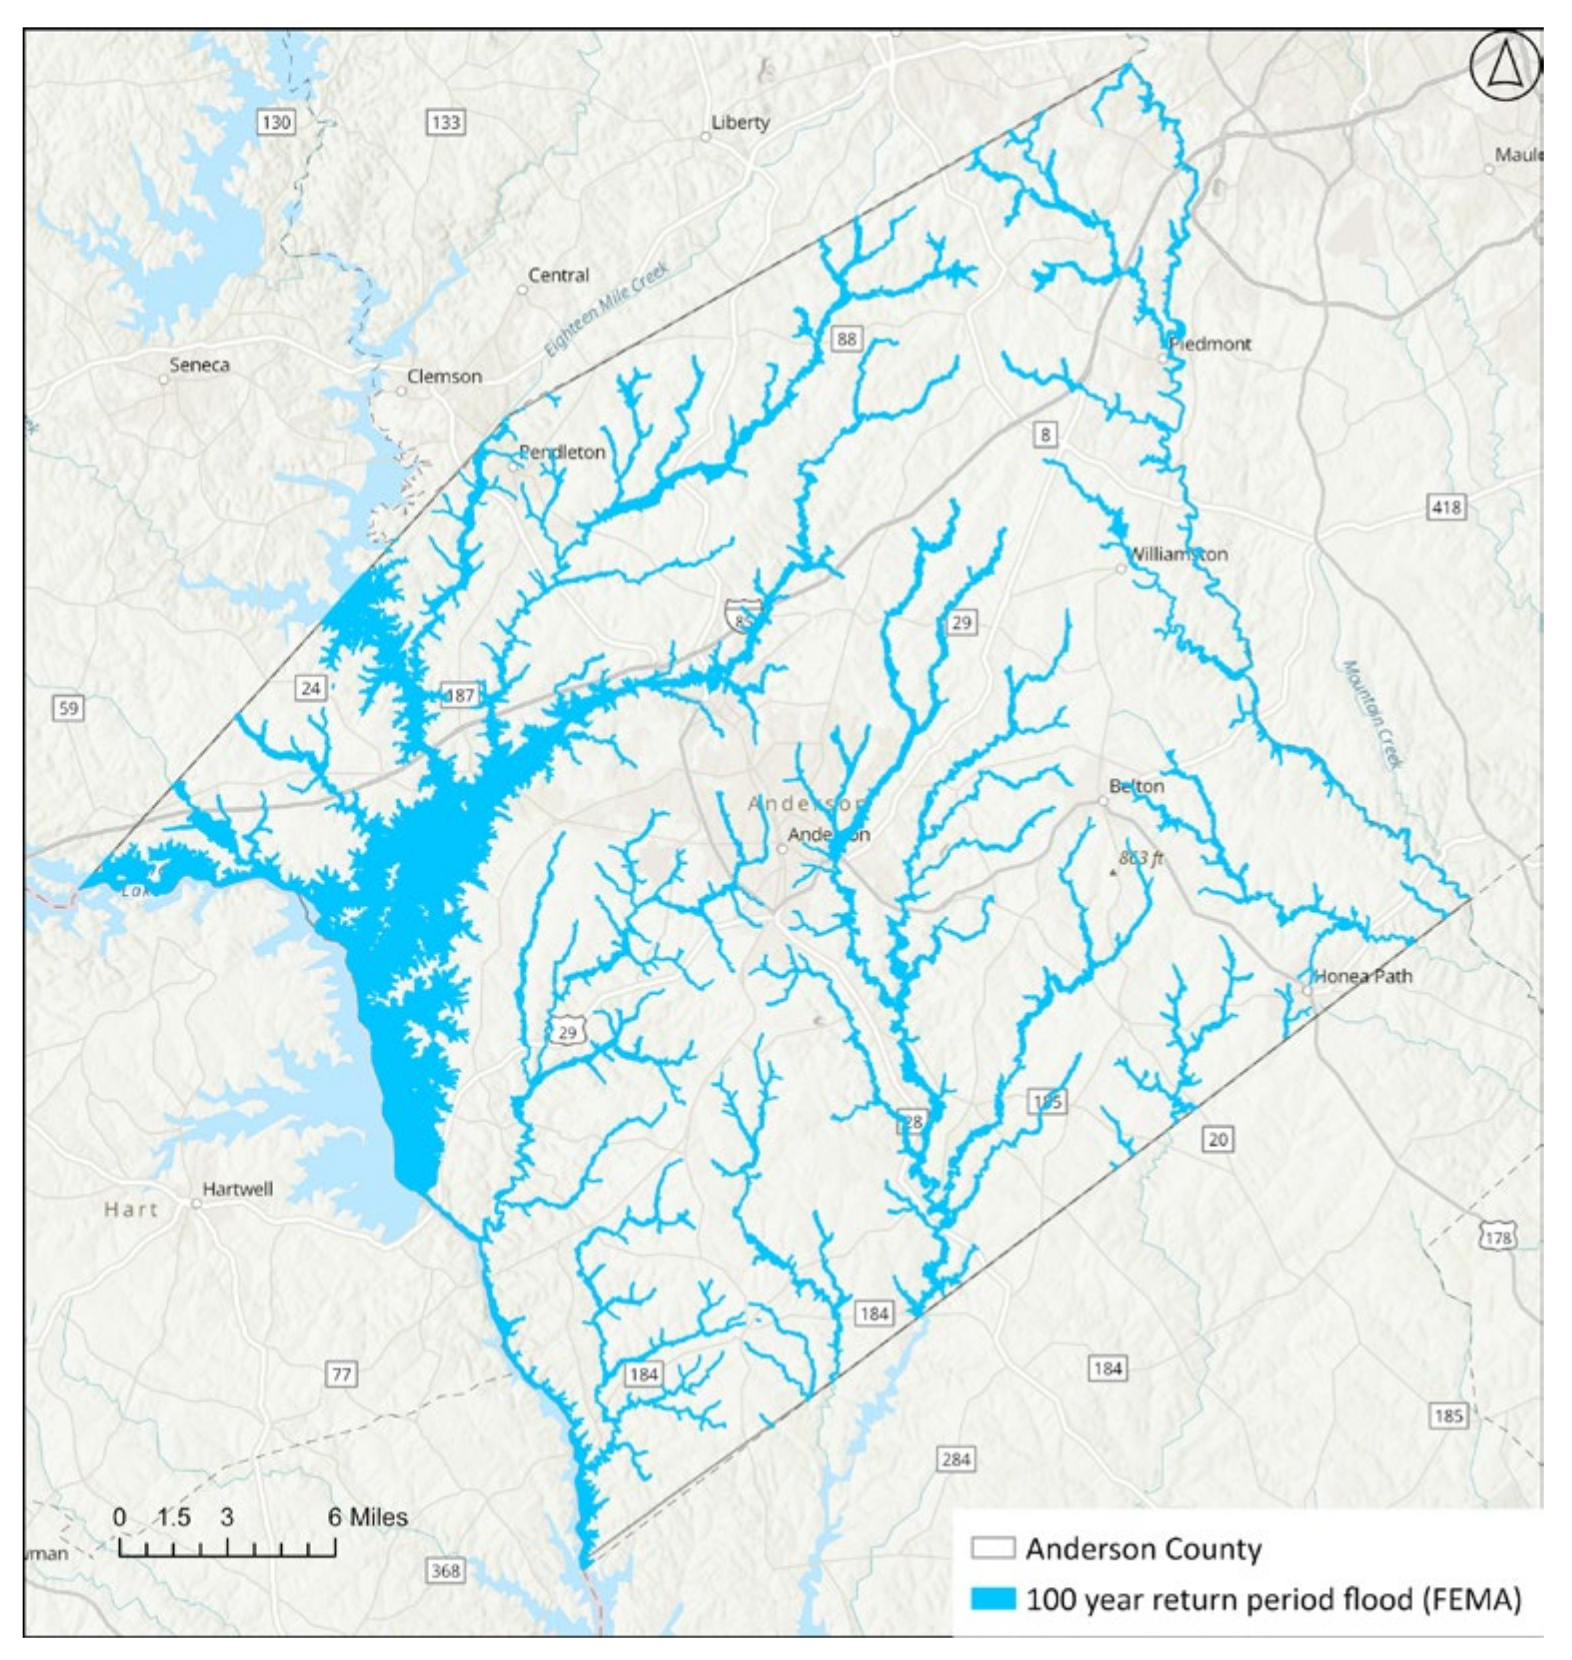
Our analysis relied on the 100-year return period flood data from the Federal Emergency Management Agency (FEMA). This FEMA flood data uses detailed hydrologic and hydraulic modeling that considers elements like rainfall, watershed characteristics, land cover, terrain slope (for hydrology), and water flow velocity and elevation (for hydraulics) [63]. However, the flood data only provides the flood extent (area covered), not the flood depth information we needed for our analysis (Figure 2).
To calculate the 100-year flood depth, we used the Floodwater Depth Estimation Tool (FwDET) [49]. The process requires the flood extent map and digital elevation model [49] (see Figure 3). The DEM data provides the elevation of the normal water level on the water body along with the topographical elevation. The idea is to identify the elevations of the flood extent points and assign them to the raster cells inside the water body. The flood inundation polygon is converted to a polyline, and the line layer is converted to a raster layer with the same grid size as the DEM. The elevation data for the flood extent boundary are extracted by the tool from the DEM, and then the boundary elevation is assigned to the cells within the hazard boundary. Afterward, the topographic elevation of the cells inside the flood hazard boundary is subtracted from the generated elevation inside the flood hazard boundary, providing the depth of flood water in the hazard area. We used 1 m resolution DEMs. The tool’s output is a raster file with the flood depth (d) along the flood hazard area.
After the depth raster was generated, we found gaps inside the flood hazard area. FwDET codes cells where the elevation generated by the tool is less than the topographic elevation as “no data”. Some of the sections were in the middle of the stream or near the boundary. To find the depth of the empty cells, we interpolated using Focal Statistics in ArcGIS Pro 3.1.3 and circular search criteria with an interpolation zone of 3 cells. We used 10 iterations to fill the gaps, generating the final depth (D) raster file. This file was overlayed with the road network to identify potentially flooded portions of the road.
FwDET provides the flood water depth from the existing water level or the ground surface. If the section is a bridge, then the bridge deck elevation is needed, given that the bridge does not fail structurally. The depth of water above the bridge surface was calculated based on Equation (4):
d b = E D E M + D E b ,
where, d b is the depth of floodwater above the bridge surface, E D E M is the elevation data of the bridge provided by the DEM, D is the depth of the floodwater provided by the FwDET, and E b is the elevation of the bridge surface provided by the LiDAR data.
The LiDAR data provided by the USGS did not include the classification of bridges in certain locations. Out of 484 bridges in Anderson County, we could not calculate the bridge deck elevation of 112 bridges, out of which 49 fell inside the FEMA flood hazard area. For these locations, we manually assessed the access roads to those bridges, reasoning that the bridges are unlikely to be lower than the approach roads.
We measured the depth of the flood water on the road surface due to the 100-year return period flood. The depth data were then overlayed with the road network and road elevation data. If the flood depth above the road surface was greater than 30 cm or one foot, then the road section was considered impassable [17], otherwise the road was considered passable (Equation (5)). The threshold value of 30 cm is considered for two primary reasons. Firstly, it accounts for the interaction of traction and buoyancy forces on a vehicle in still water. Hydrodynamic force analysis conducted by [64] established 30 cm as the critical water depth for small passenger vehicles. Secondly, the elevation of the car’s air inlet is positioned between 25 and 35 cm above ground level, as identified by [65]:
R o a d   s e c t i o n = P a s s a b l e                 ,     D < 30   cm I m p a s s a b l e       ,     D 30   cm   ,
where D is the depth of the water above the road surface.

3.5. Purpose-Based Trip Pairs

The purpose and the trip’s origin and destination are provided in Table 1. We took the Census block groups to represent residential areas.

3.6. Study Area and Data Collection

According to the US Census Bureau, Anderson County, SC, has a population of 209,581 as of 1 July 2022, with significant employment in manufacturing [66]. Fifty-nine major manufacturing businesses [67] and one general hospital [68] serve as major employers. The data about the destinations for all purposes is mentioned in the process in the results section for each trip purpose, which is an elaborate description of Table 1. The sources of data required for the analysis are shown in Table 2.

3.7. Public Transit

The public transit system was also analyzed for potential impacts due to the flood. If the roads were blocked or the bus stops were inaccessible, then new stops were suggested, along with a new route serving all the areas it previously served. The stops should be placed at a walkable distance from the service area, which is 10 min [69], and the new route was selected based on the service area of the existing impacted bus stops. New routes were provided closer to the existing bus routes so that change would be lower, and the new routes would not have any flood barriers. When providing new bus stops, if the stops are placed closer to each other, people can get to the stops by walking less, but the transit time increases as the bus must slow down at each of those stops. The stop locations were suggested based on the following guidelines:
  • Since the new stops will be for a short period, curbside stops are allowed.
  • The bus stops will be placed on the far side (of the intersection) in-lane [70].
  • The bus stop spacing will be in accordance with the Transportation Research Board (TRB) guidelines [71].
Table 2. Data and Sources.
DataSource
Roads for Anderson CountySouth Carolina Department of Transportation [72] and Georgia Department of Transportation website [73]
Bridges in Anderson CountyNational Bridge Inventory 2023 data [74]
Digital Elevation Model and LiDAR DataUnited States Geological Survey, 1 m resolution digital elevation model [75]
Flood hazard extent mapFederal Emergency Management Agency (FEMA) [76]
Census block groupsUS Census Bureau [77]
Major manufacturing company locationAnderson Chamber of Commerce website [67]
Hospitals and urgent care facilitiesResilience Analysis Planning Tool [68]
Emergency medical serviceResilience analysis planning tool [68]
Public ParksCity of Anderson website, Anderson Recreation Division [78]
Recreation area around Hartwell DamUnited States Army Corps of Engineers (USACE) website [79]
Grocery stores, fire stationsResilience analysis planning tool [68]
Emergency sheltersHIFLD [80]
Schools and collegesResilience analysis planning tool [68]
School district boundaries in AndersonNational Center for Education Statistics [81]

4. Results and Discussion

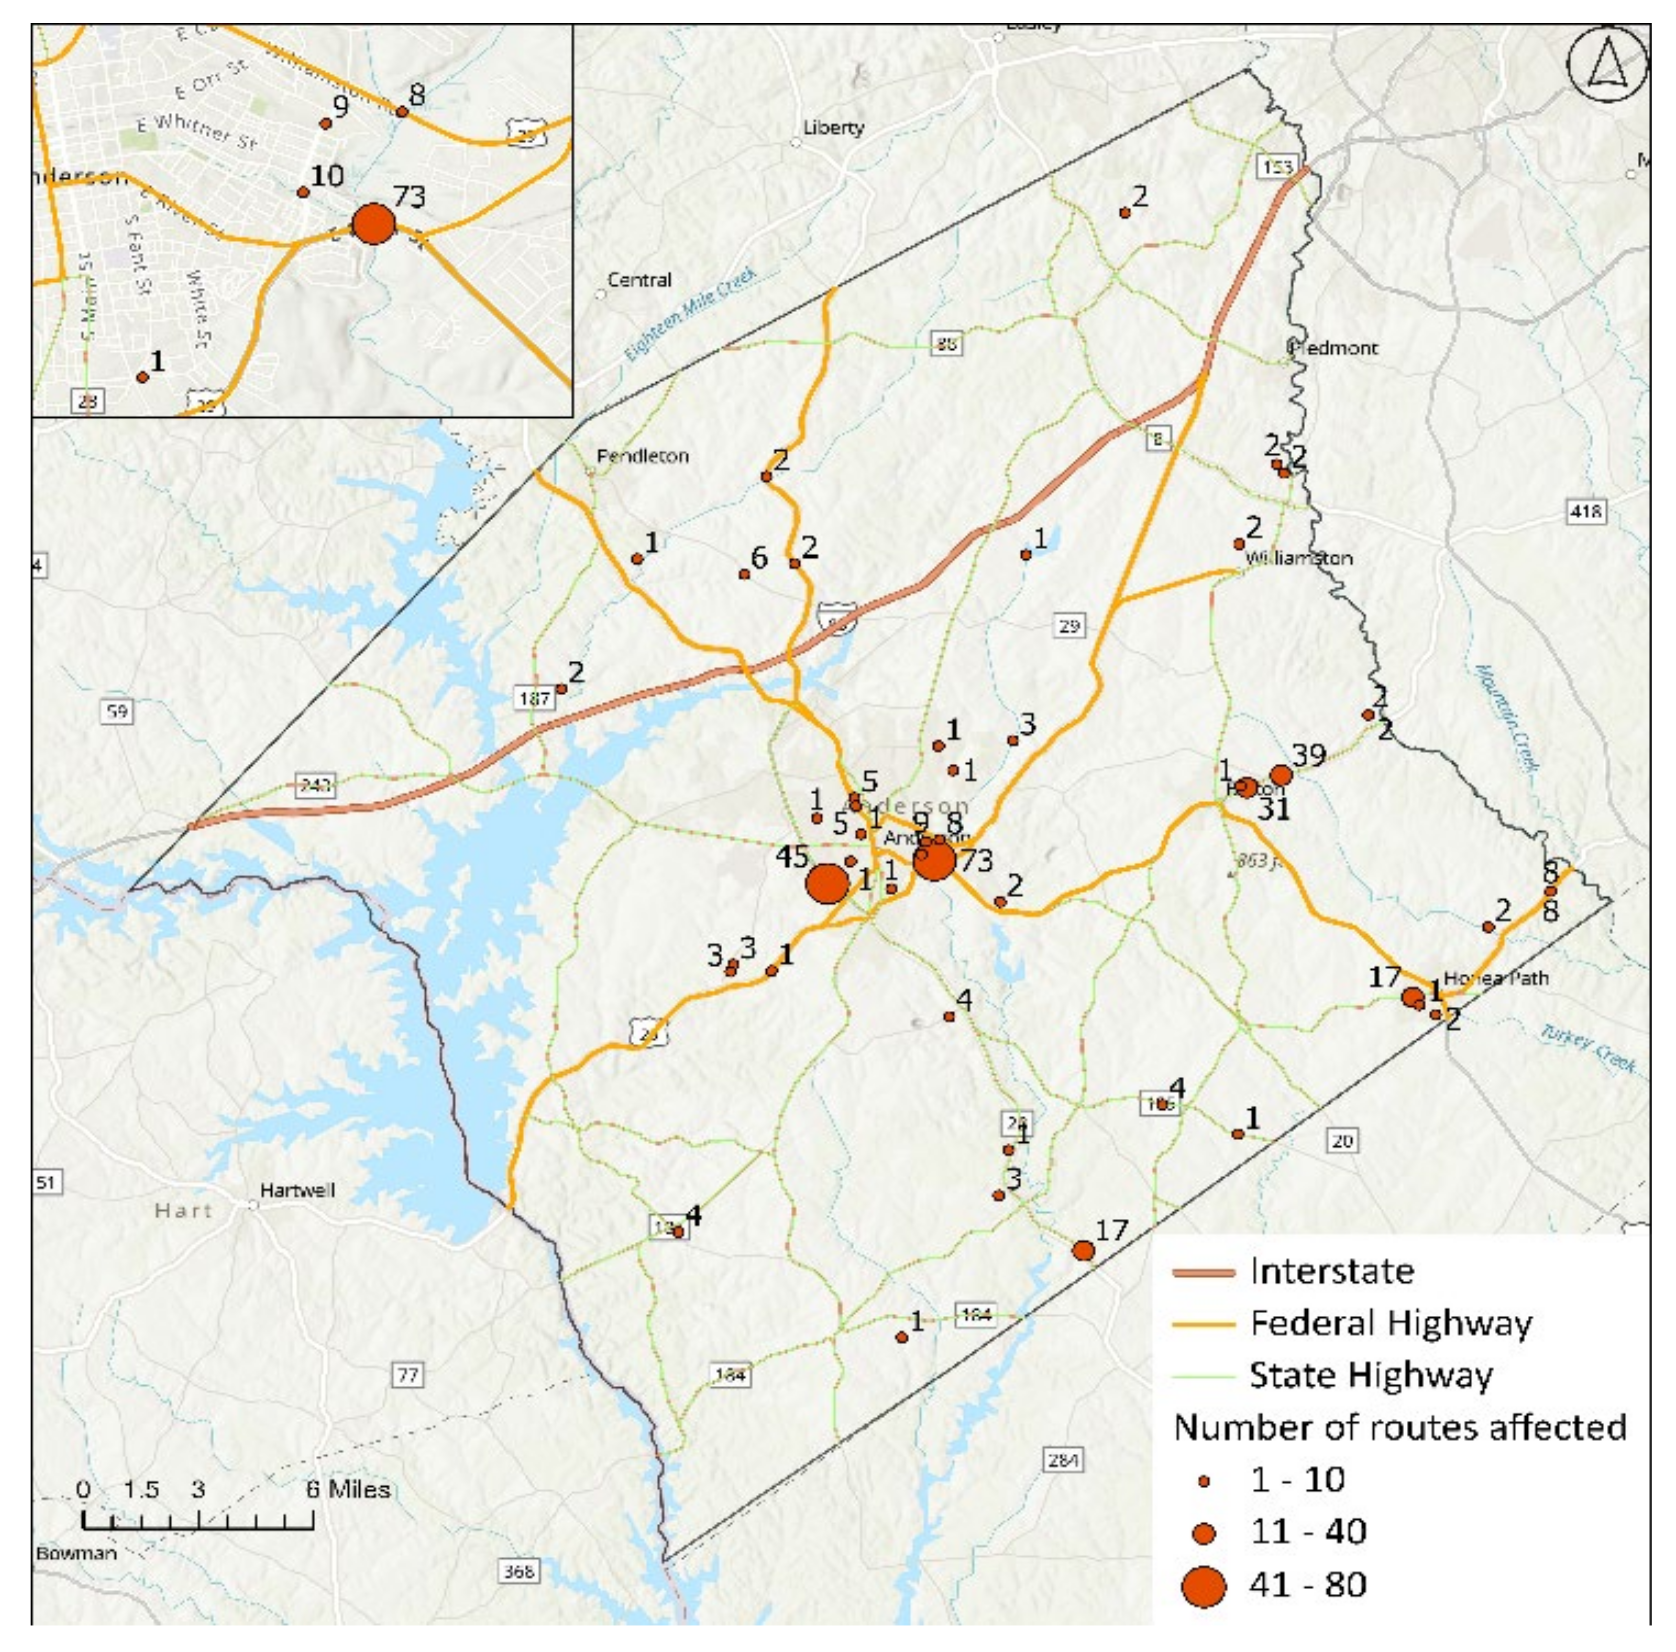
The data (Table 2) were mapped in ArcGIS Pro 3.1.3. Then, the road segments potentially impacted by the 100-year return period flood were determined. Because of the variability of roadway elevations, tenth-mile (approx. 161 m) segments were created, and the low point of that segment was considered its elevation. The total road sections impacted were 384 tenth-mile sections inside Anderson County (see Figure 4a), including 134 on highways, 250 on local roads, and 12 bridges (see Figure 4b) on local and highway roads.
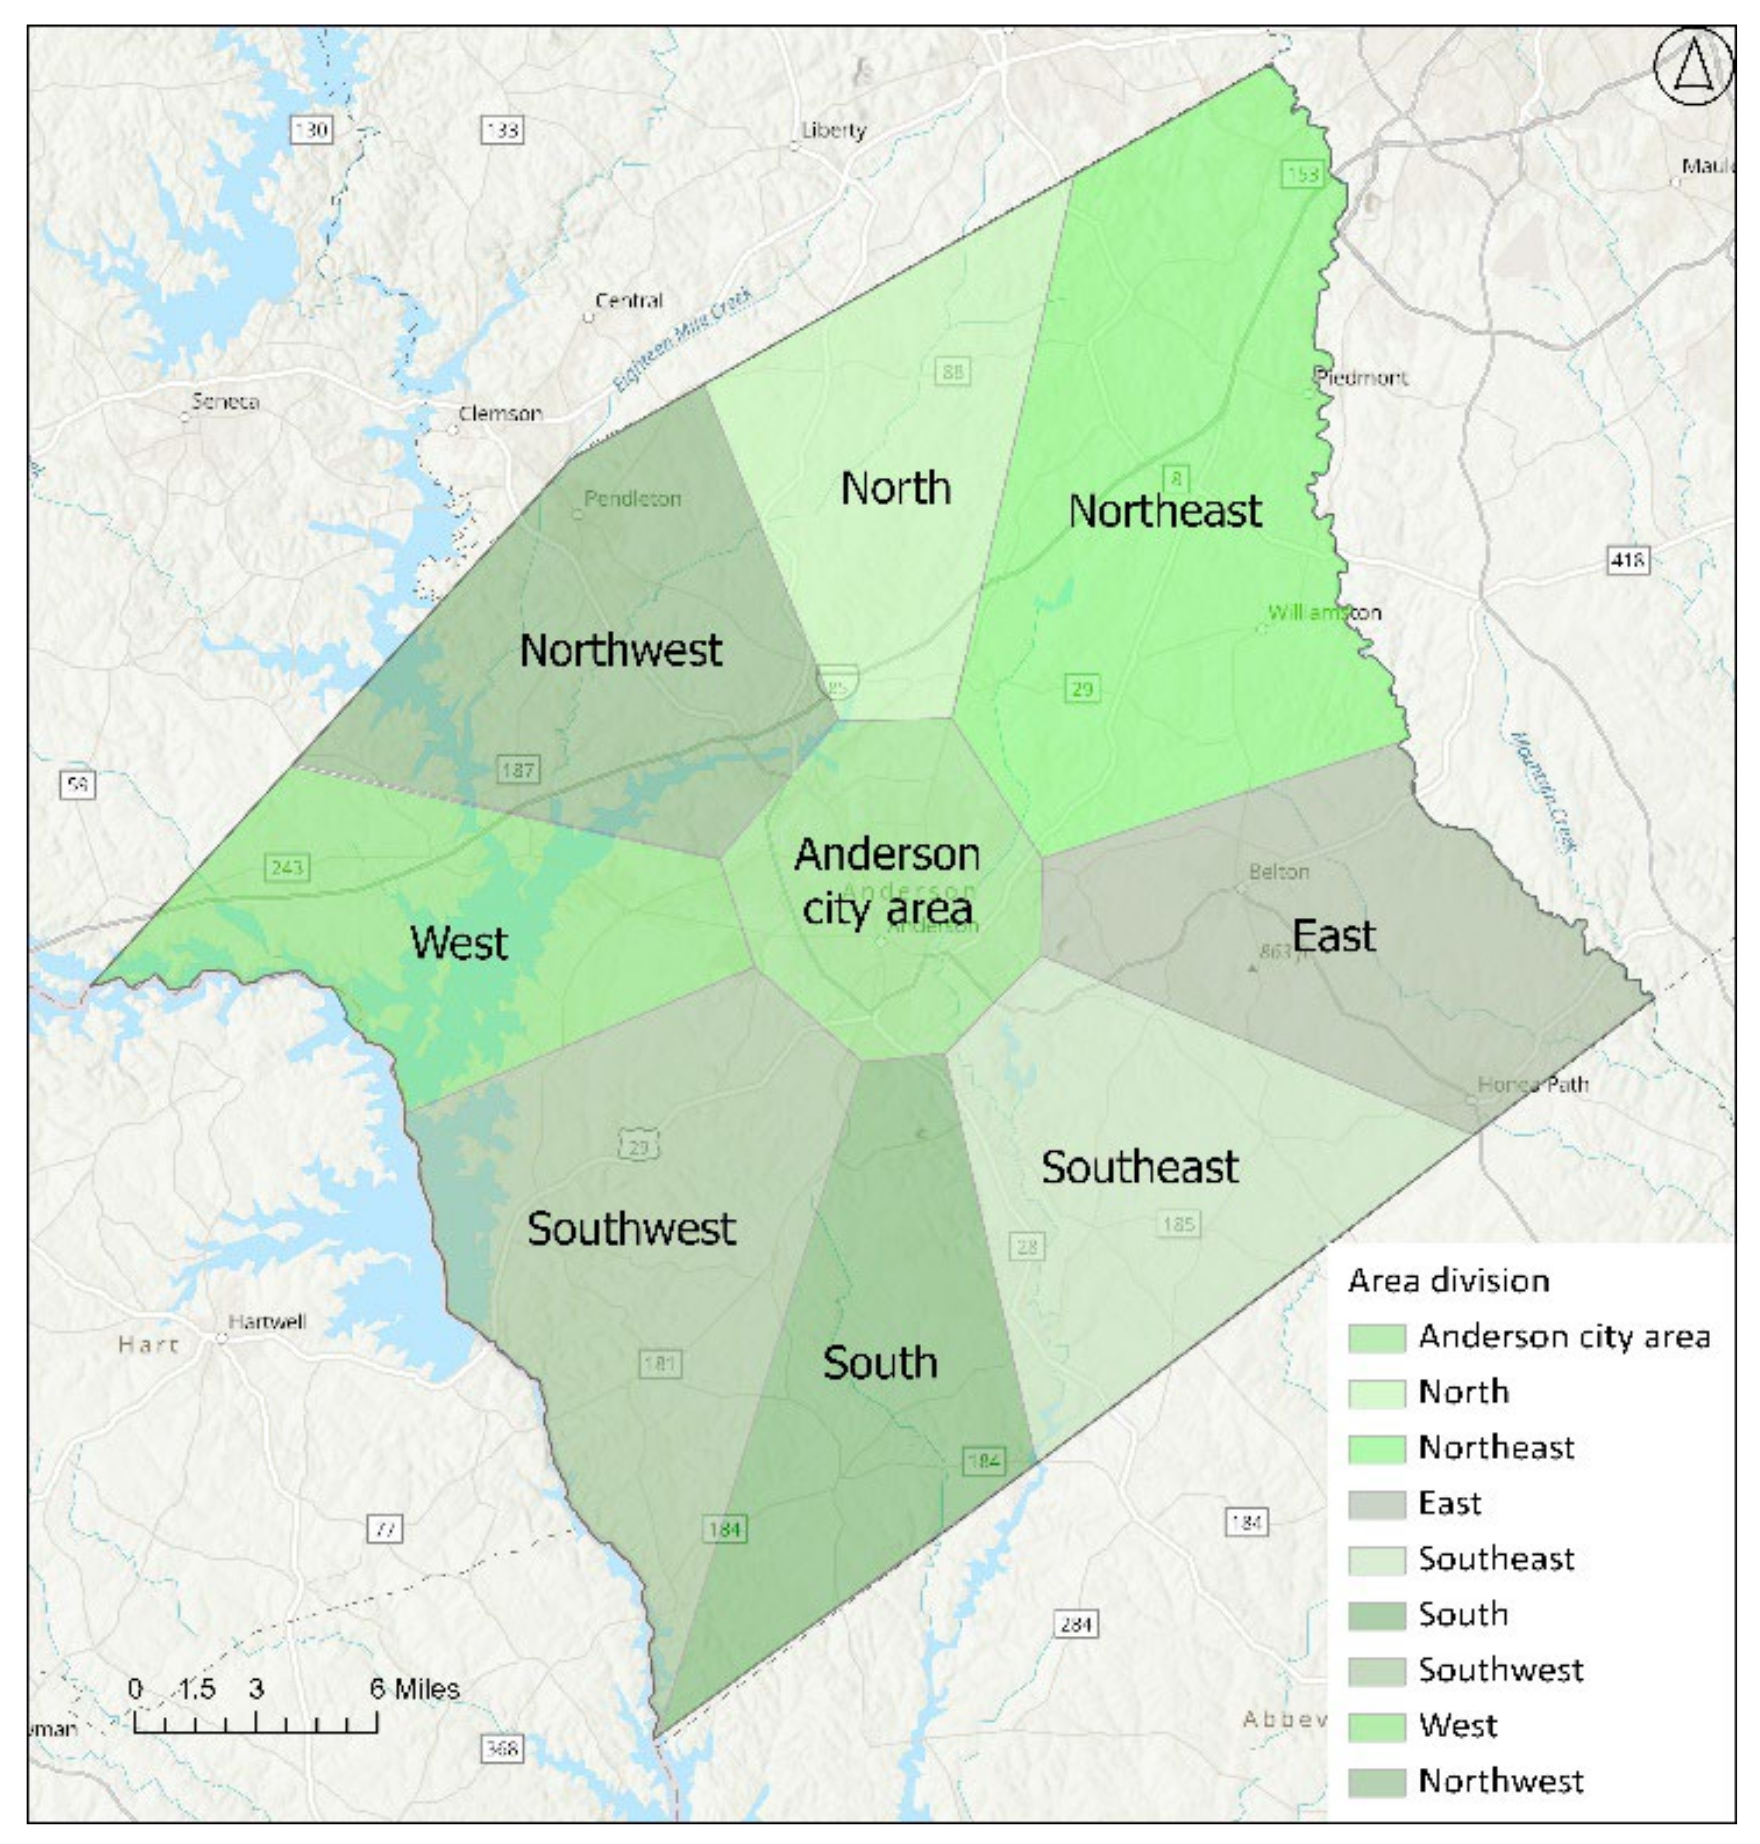
After identifying the unpassable road sections, we considered them barriers and calculated the routes for the purposes shown in Table 1. The travel times before and after the flood were compared to determine the difference in travel time due to the flood. The additional time was categorized as above or below the threshold. For discussion purposes, Figure 5 shows Anderson County divided based on direction for the analysis.

4.1. Phases

The analysis is presented in three phases: the un-flooded condition, the response phase, and the recovery phase.

4.1.1. Un-Flooded (before) Condition

The trips mentioned in Table 1 in the unflooded phase are required for the normal operations of the community. The road sections that were used most frequently by trips from the different Census block groups to the destinations were identified with the use of betweenness centrality. The trip purpose, road sections, and their betweenness centrality value depicting criticality are provided in Figure 6, Figure 7, Figure 8, Figure 9 and Figure 10.
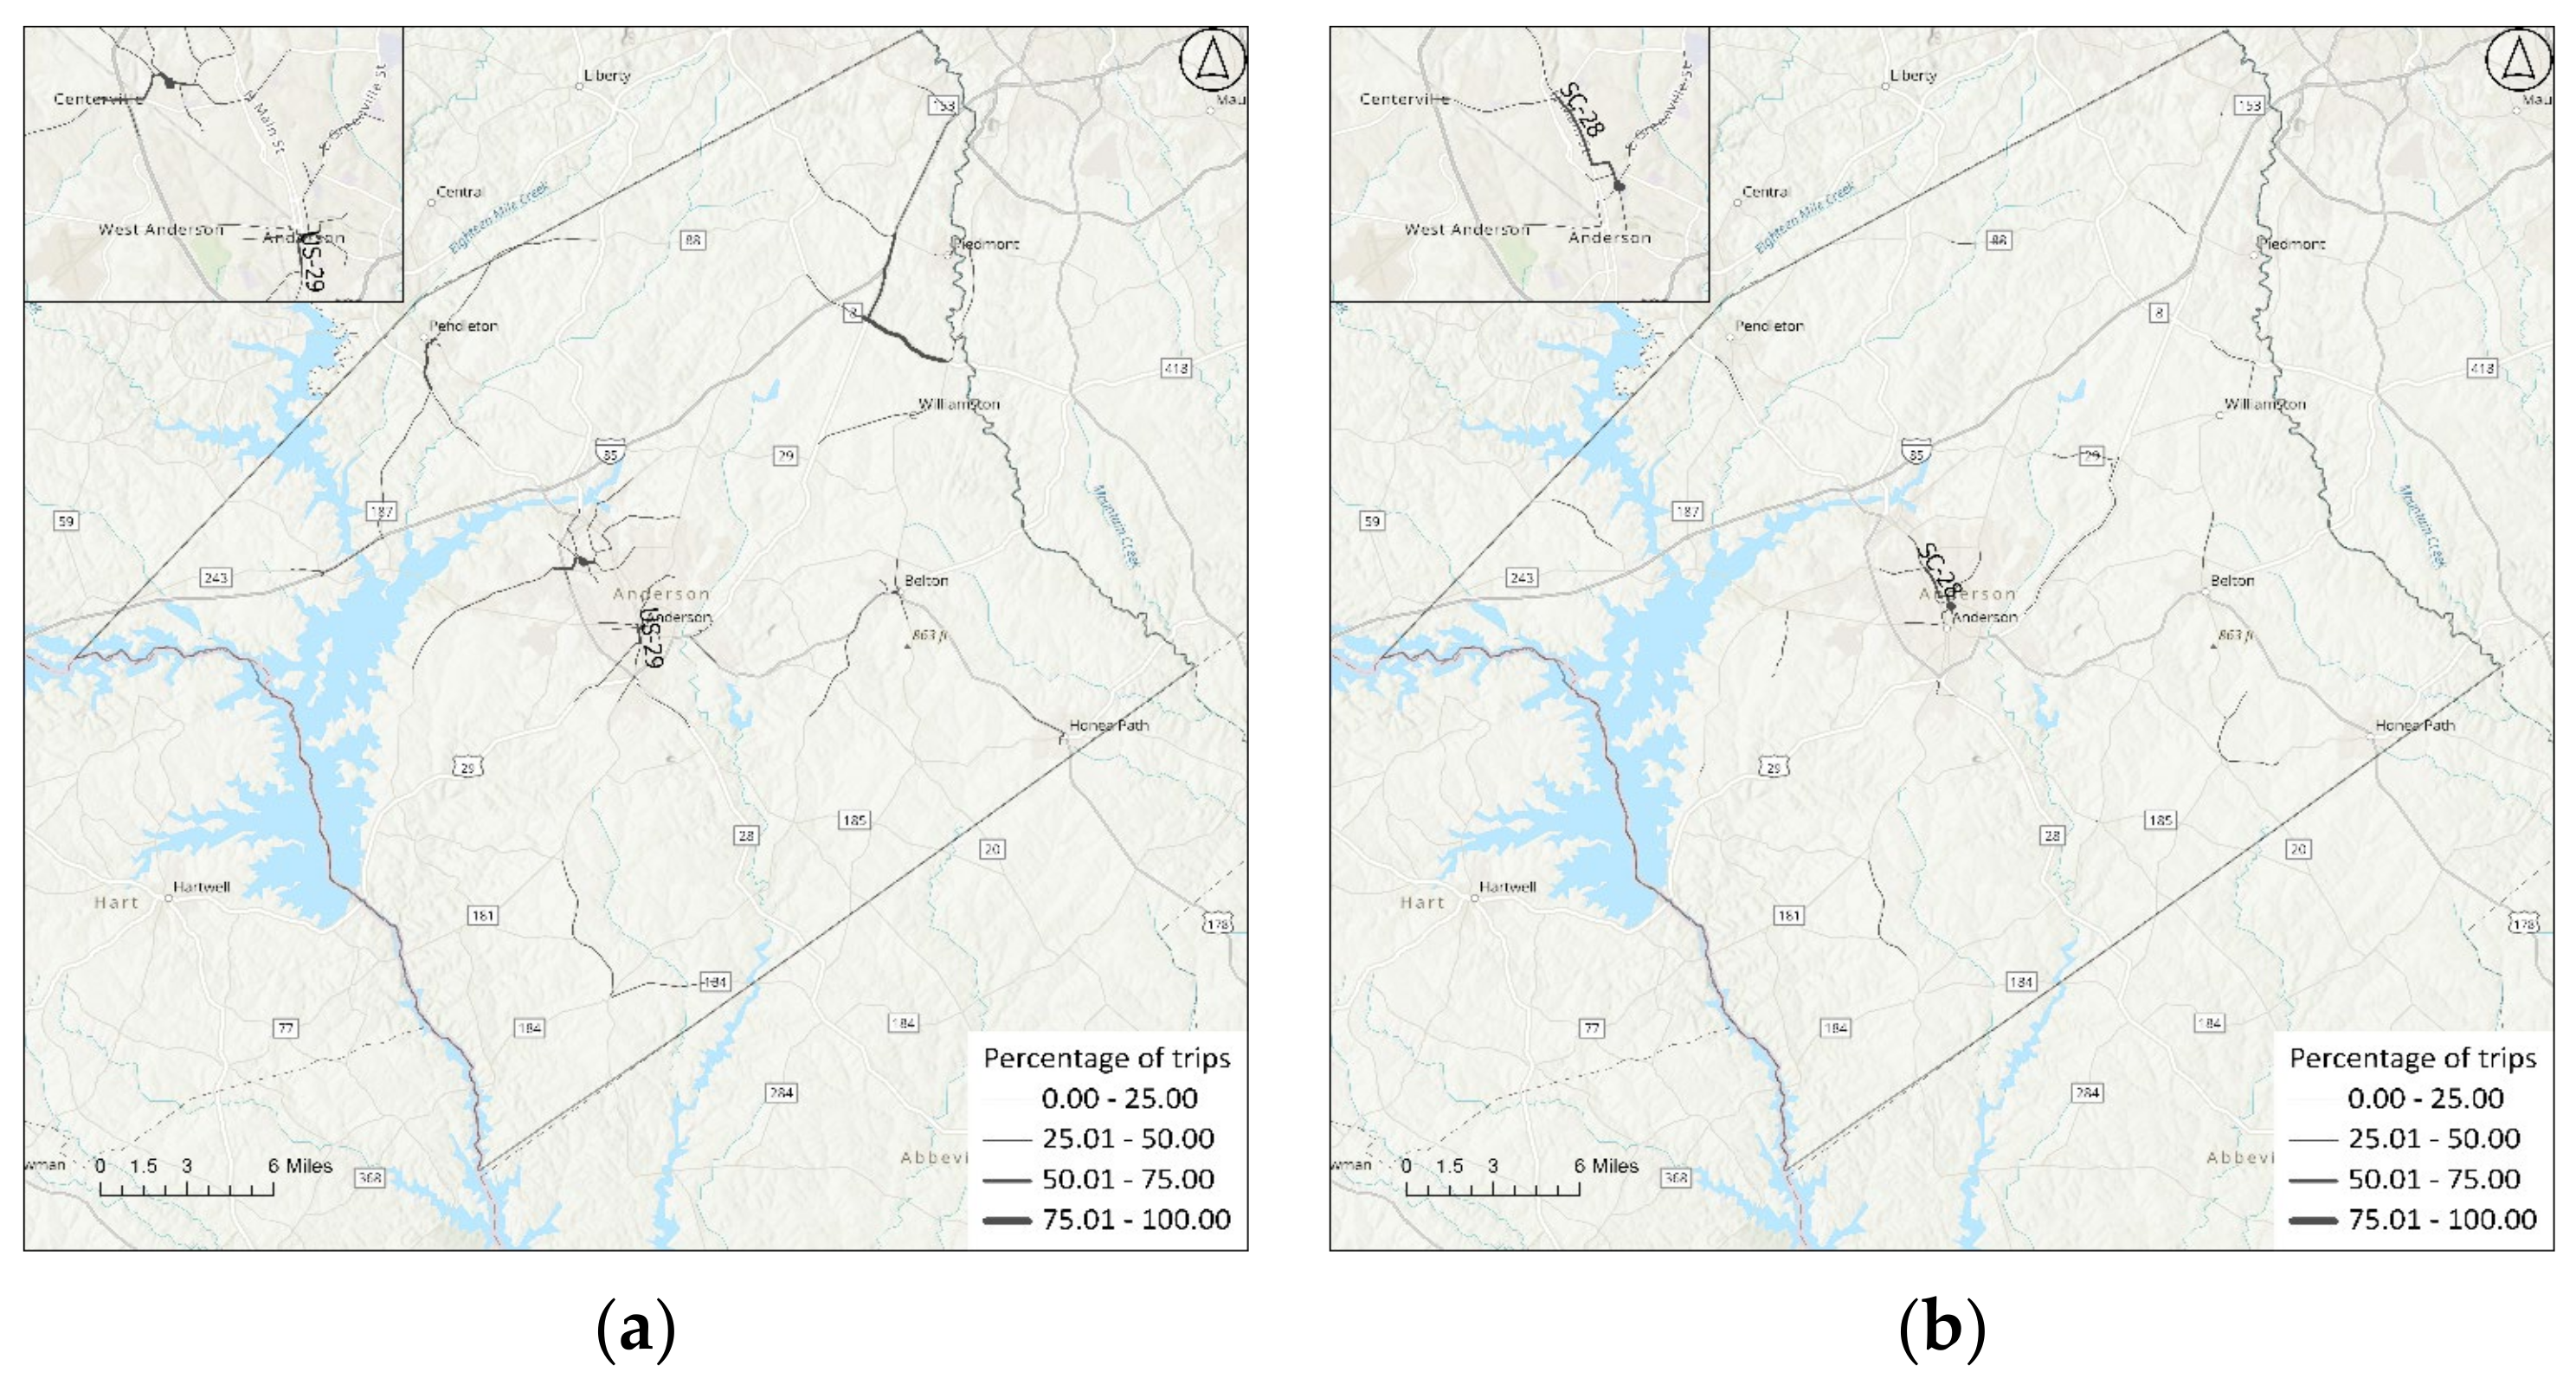
For accessing workplaces (Figure 6a), the routes used most frequently were I-85, State Highway 28, and Federal Highway 29, connecting the interstate and Anderson City. The State Highway shows high betweenness centrality, connecting the highway with Anderson City. Federal Highway 178, connecting Honea Path and Belton, was also important. Since the companies are spread around the county, local roads are also important, but the major highways are the most important for the normal day’s accessibility to various workplaces. For the accessibility of the materials (Figure 6b), I-85 and State Highway 28 connecting the interstate and neighboring county of Abbeville had high betweenness centrality.
For hospital accessibility, the roads in Anderson City had more importance (Figure 7a) as the general care hospital is located near the city. For urgent care accessibility (Figure 7b), I-85, along with Federal Highway 29 and State Highway connecting the interstate with Anderson City, had high importance.
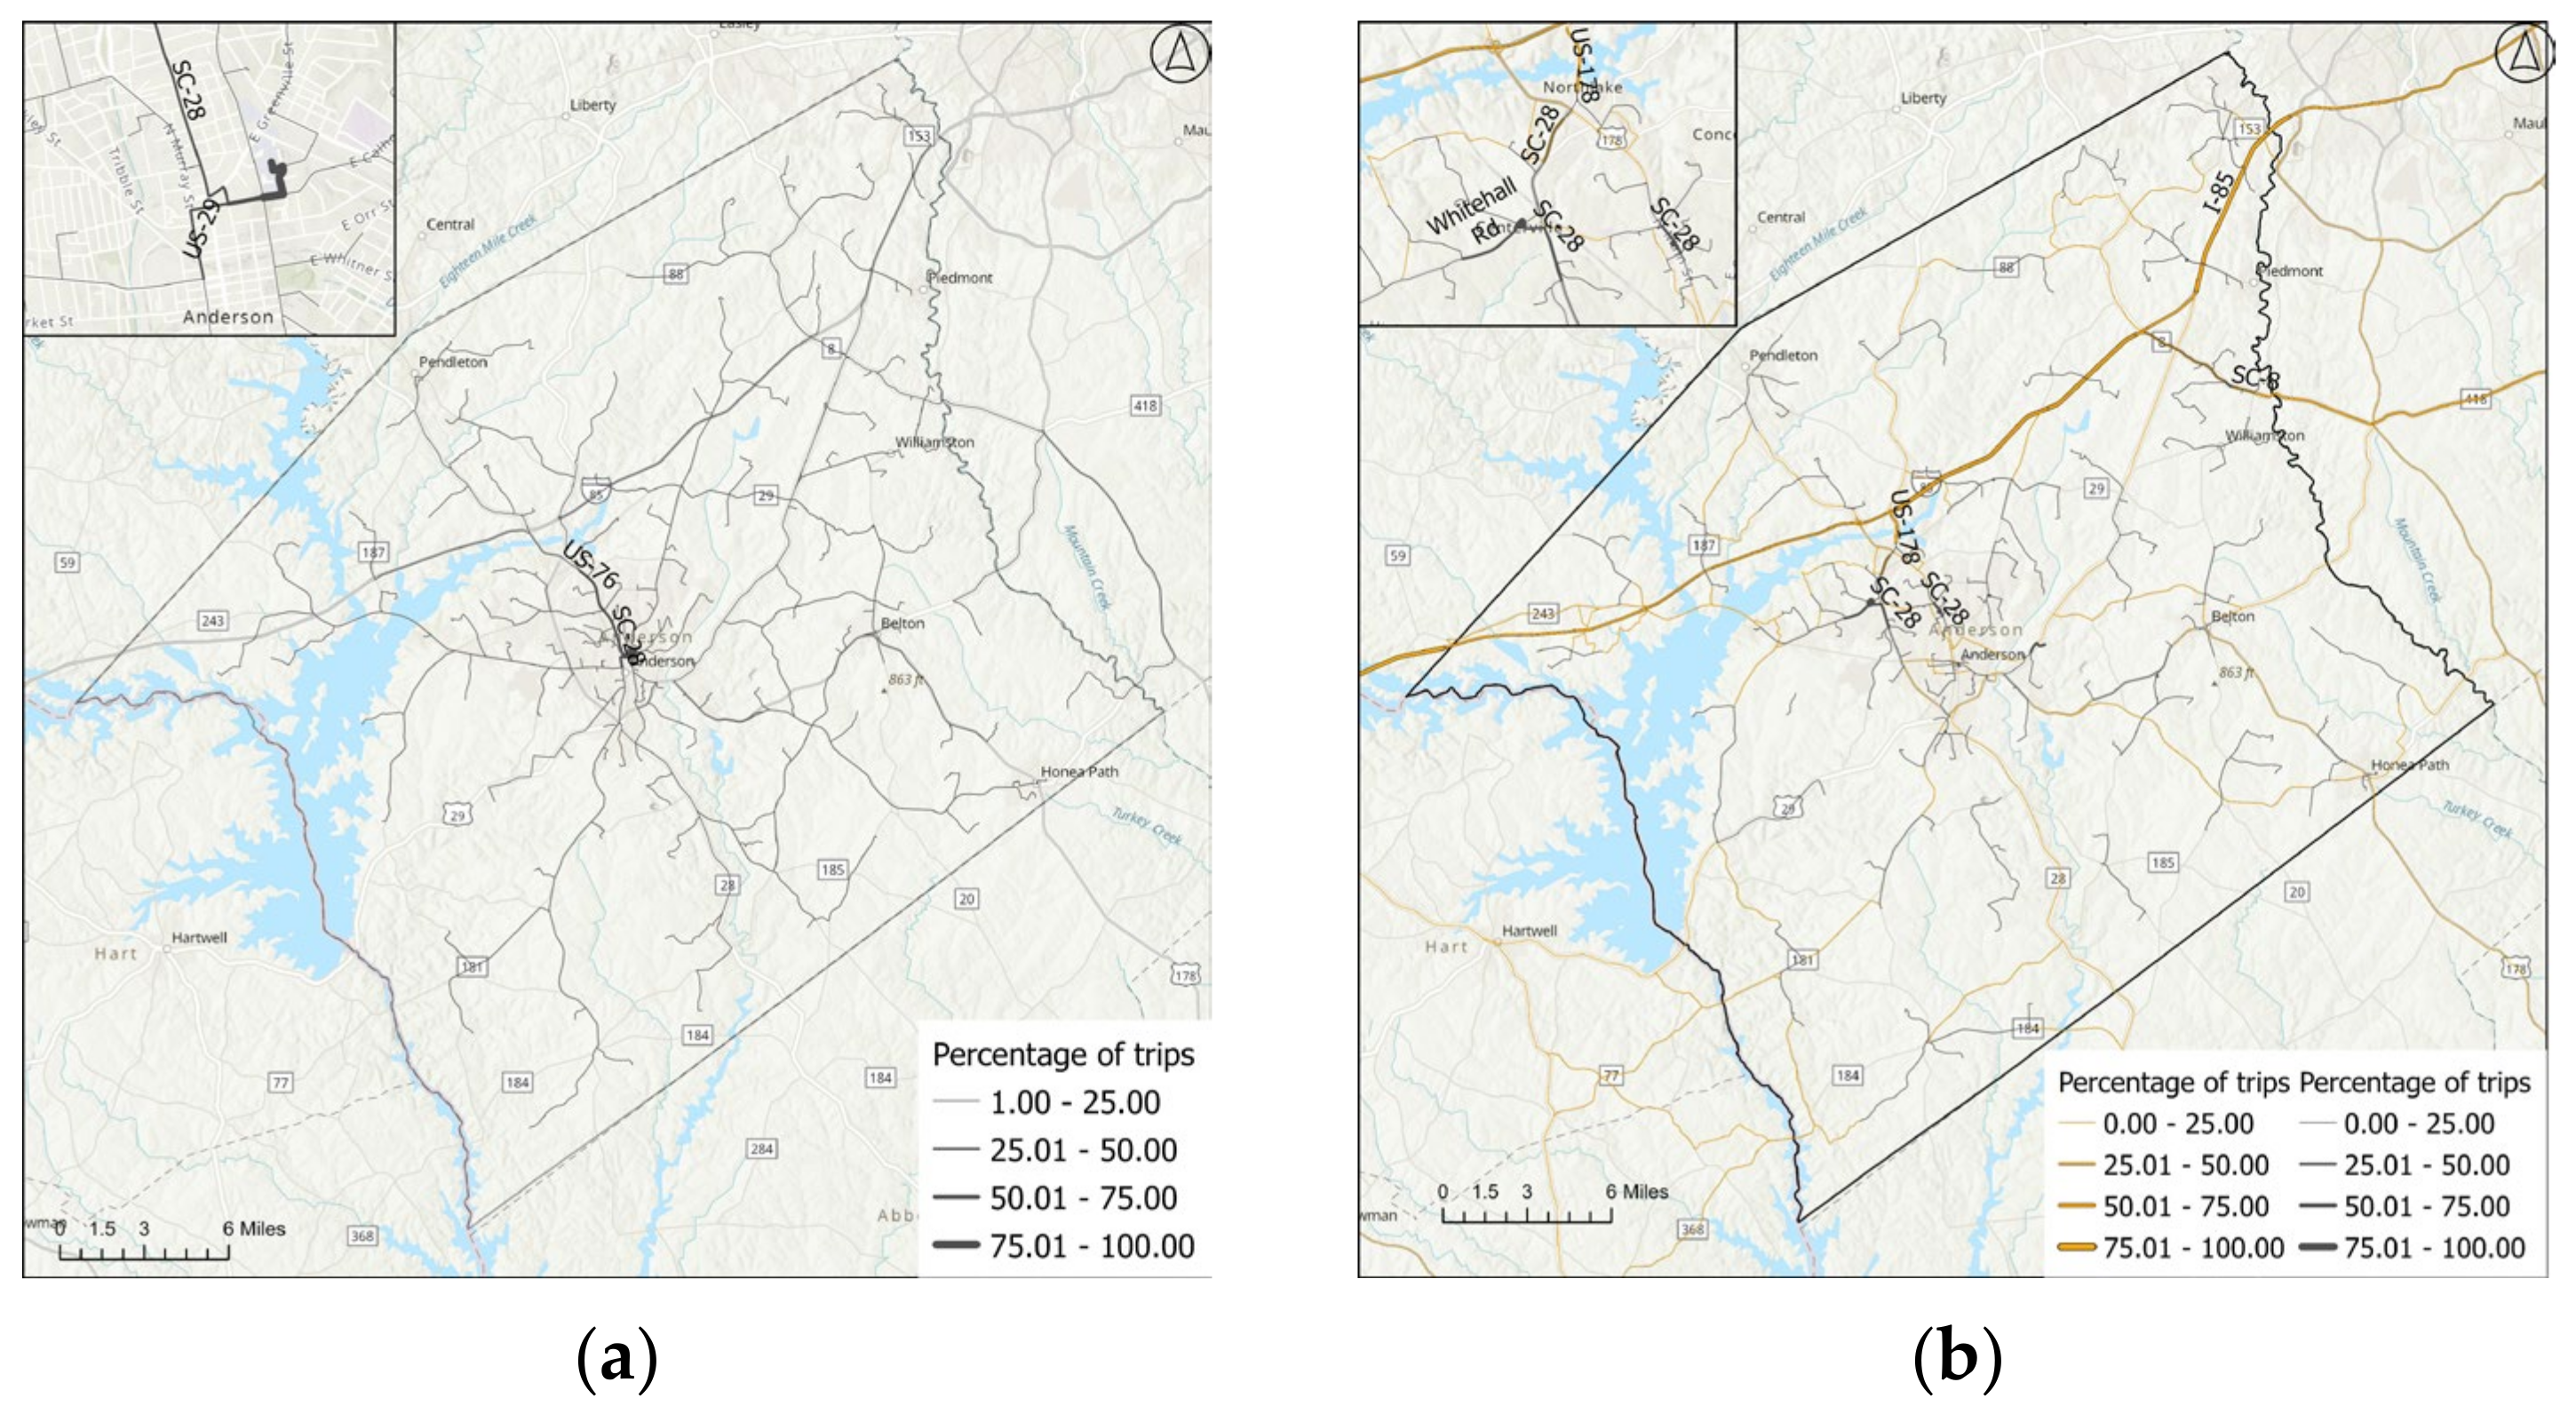
For general school accessibility for each school district, the critical roads are presented in Figure 8a. The most important roads were State Highway 28 and State Highway 81, connecting the Anderson City area with other areas in School District 5. For school district 4, I-85 and State Highway 187; for school district 3, State Highway 81; for school district 2, Federal Highway 178; and for school district 1, I-85, Federal Highway 29, and State Highway 8 were more important and represented by thicker lines in Figure 8a. For college accessibility, Federal Highway 76, crossing I-85, and connecting Pendleton to Anderson City were more important and were represented by thicker lines in Figure 8b.
For grocery accessibility (Figure 9a), roads had low betweenness centrality because the grocery stores are spread throughout the county, allowing shorter trips. For the accessibility of materials to the grocery stores, I-85 had high betweenness centrality (Figure 9b). Along with the interstate, State Highways 181 and 187 were more critical as they connected the interstate to Anderson City, where a higher number of grocery stores are located.
For accessibility to the parks in Anderson County, Federal Highway 29, State Highway 81, and State Highway 28 had high importance (Figure 10a). For ambulance accessibility, a State Highway 28 section in Anderson City had high importance (Figure 10b). Since ambulances and paramedics are located mostly at fire stations, the results were similar.

4.1.2. Response Phase

During the flood, rescue operations may be needed in the impacted area. Here, the accessibility of the fire rescue services to the various Census block groups is needed. The accessibility of the ambulances to the impacted Census block groups is also essential to transporting flood victims to hospitals as well as other medical emergencies. Also, the accessibility of law enforcement to all the Census block groups is needed to maintain security during disaster times. Evacuation from the probable evacuating regions is the final element of the response phase considered in this study. We assumed the Census block groups sharing the border with Lake Hartwell and the Savannah River (since the flood is riverine) as the probable evacuation regions. Figure 11a through Figure 12b show the criticalities of road sections for the response phase.
Figure 11a represents the critical roads for accessibility of the police stations from the Census block groups in Anderson County. Road sections in Anderson City had high importance, along with the section of State Highway 8 connecting with Federal Highway 29 and the section of State Highway 28 connecting Pendleton with Federal Highway 76 (see Figure 11a). Since the police stations are spread throughout the county, the availability of the police near the Census block groups is high. For the accessibility of ambulances/paramedics (Figure 11b), the importance of road sections was similar to the un-flooded condition (Figure 10b). One important change was that Federal Highway 29 was used more often, as suggested by its increase in betweenness centrality after the flood (Figure 11b).
For accessibility to hospitals in the response phase (Figure 12a), due to the flood-created blockage on some roads, I-85 and the highways connecting I-85 to the hospitals had more importance (State Highway 28 and Federal Highway 178). The roads in Anderson City also play a great role because of the location of the hospital, which is in Anderson City. The criticality of roads for hospitals in the response and recovery phases was the same. So, in the recovery phase, we skipped the discussion on hospitals. For evacuation (green in Figure 12b), I-85 had high importance, along with State Highway 28. For fire station accessibility (brown legend in Figure 12b), due to the stations’ spread in Anderson County, most of the roads close to the facility showed equal importance.

4.1.3. Recovery Phase

During the recovery phase, evacuees return to the community. Importing recovery materials to the impacted areas is also an important trip. As facilities and infrastructure are restored, people start to resume their normal activities. Accessibility to hospitals and urgent care areas, grocery stores, workplaces, parks, schools, and colleges is needed. Also, the accessibility of the materials to the Census block groups for the repair and restoration of possible damage in each Census block group is needed. The change in route due to flood impacts and the change in the betweenness centrality of the roads are mapped in Figure 13, Figure 14, Figure 15 and Figure 16 for various purposes. This analysis pertains to the beginning of the recovery phase; as recovery progresses, conditions return to the pre-flood phase.
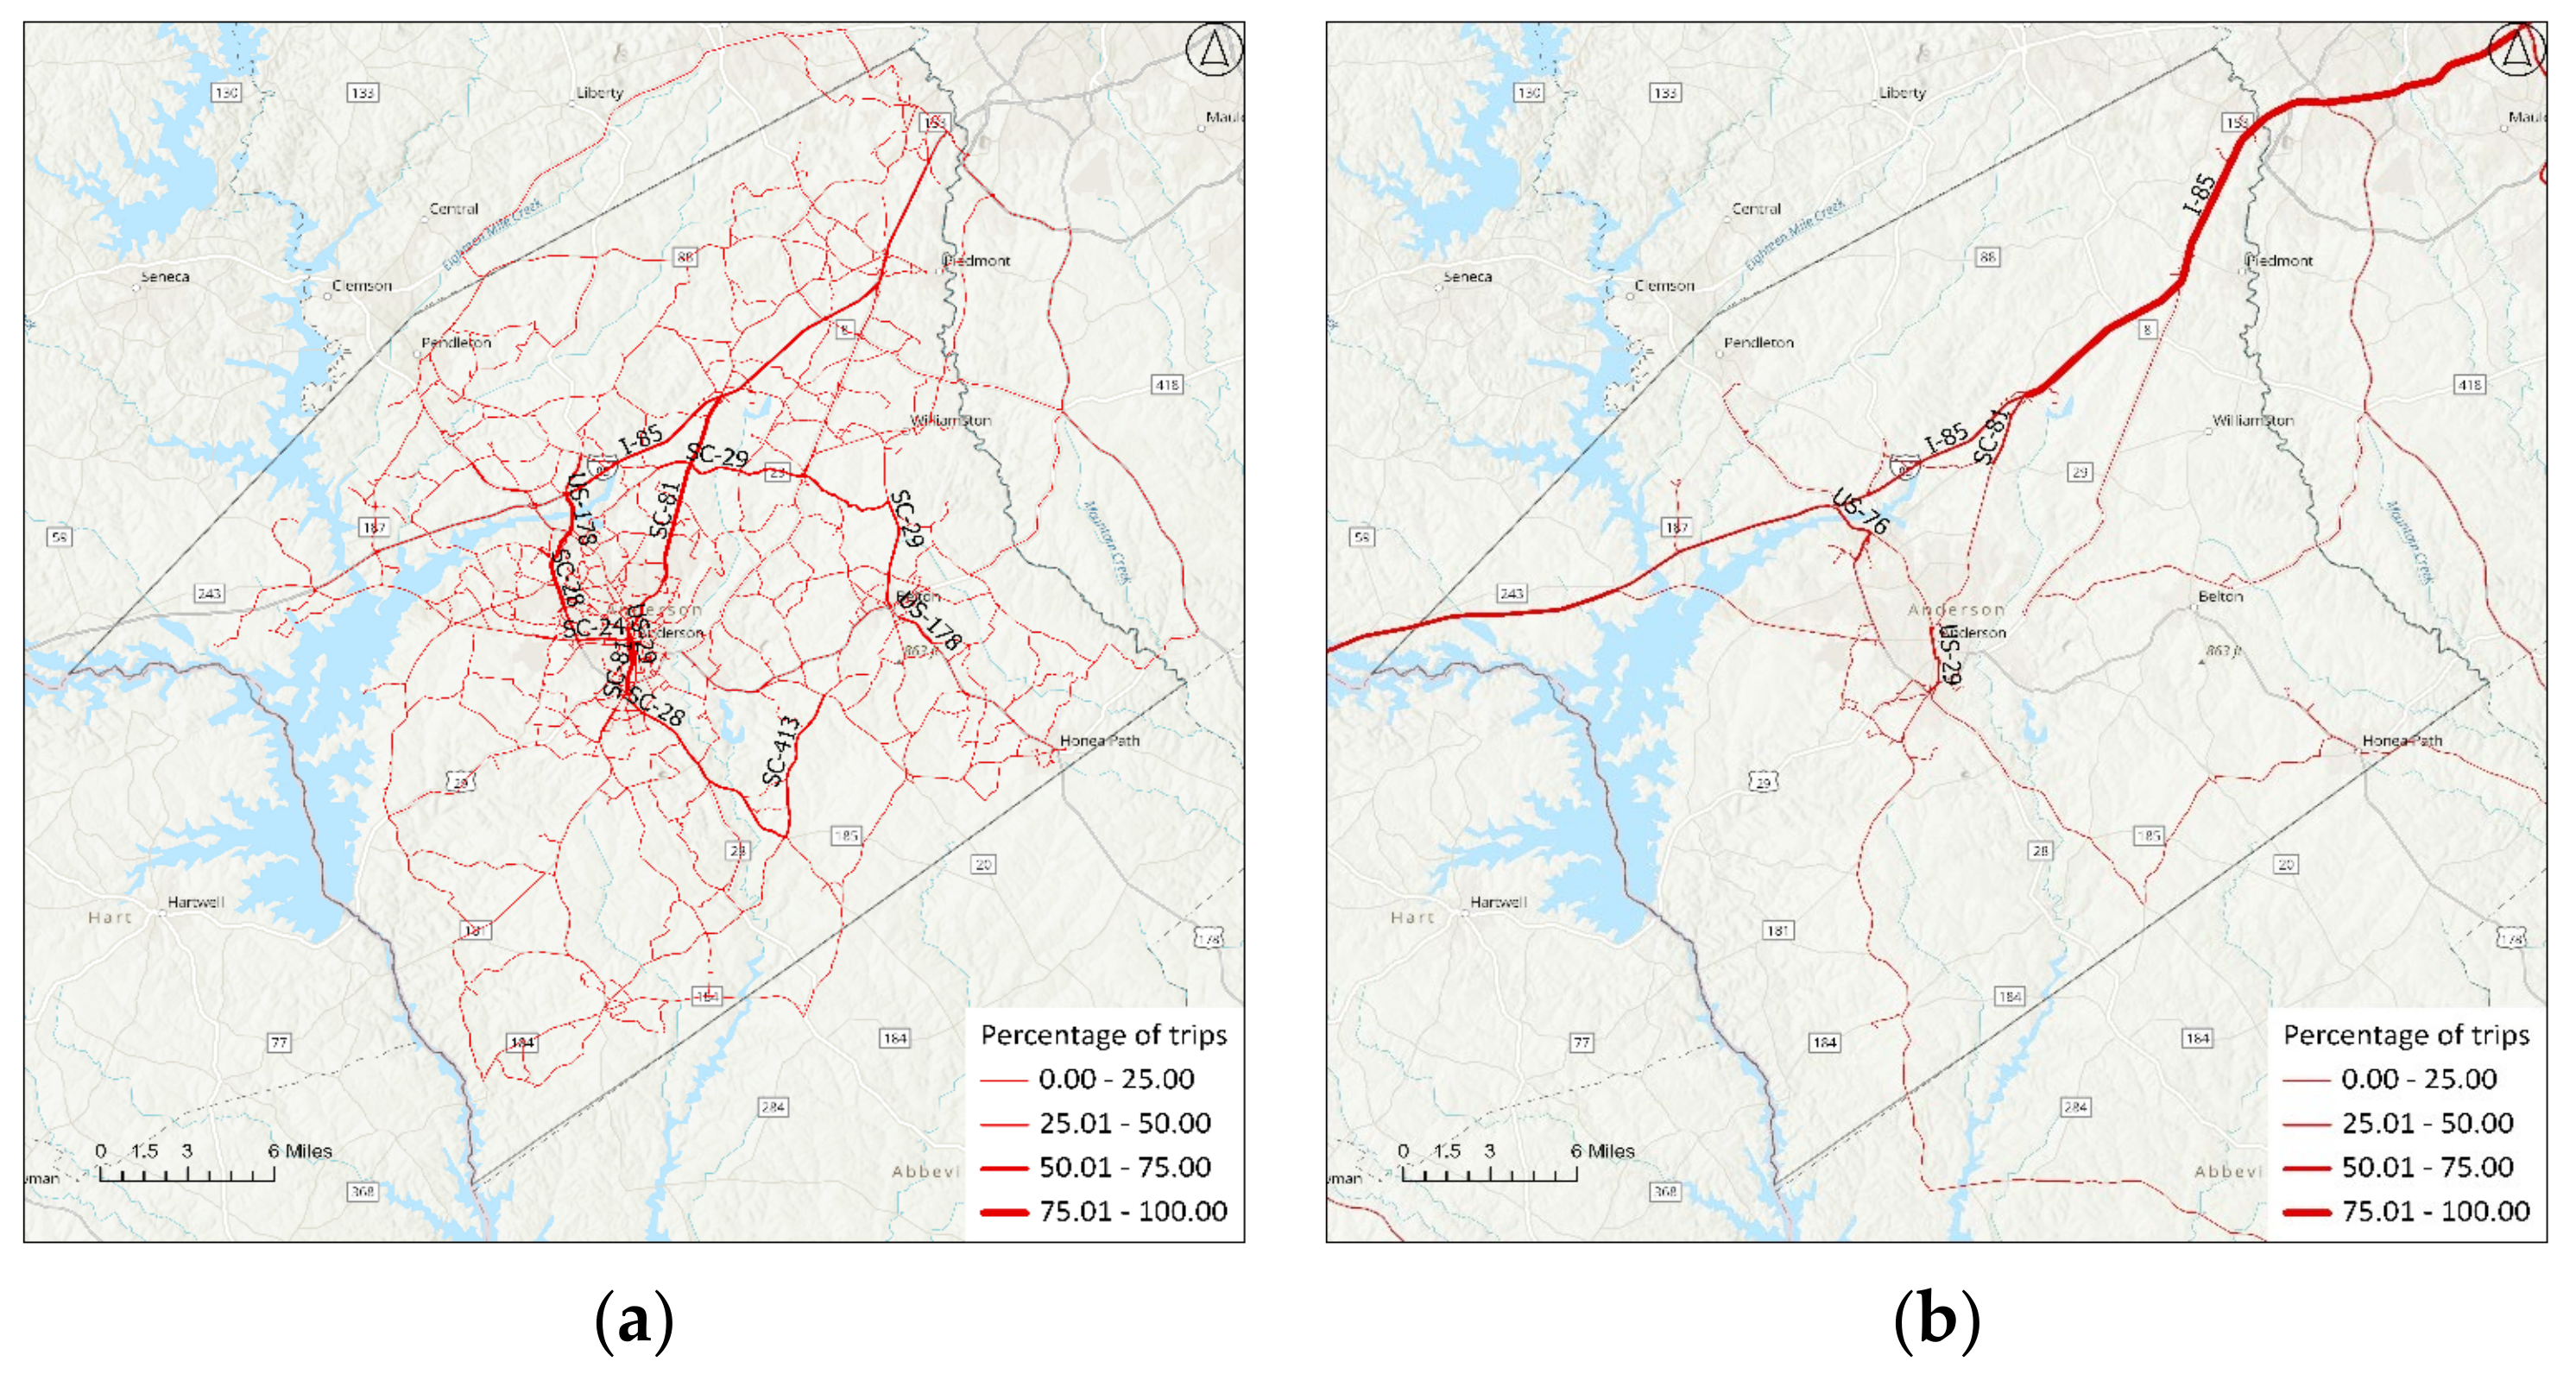
For workforce accessibility (Figure 13a), I-85, State Highway 81 connecting the interstate to Anderson City, State Highway 29, and two sections of State Highway 28 had high betweenness centrality. For material accessibility to the workplaces, I-85 played a great role along with State Highway 28, connecting Anderson City with the interstate. Another important road with high normalized betweenness centrality is a small section of State Highway 81 (Figure 13b).
The importance of roads stayed almost the same before and after the flood for grocery store accessibility by customers (Figure 9a). For material accessibility to grocery stores, I-85 and State Highway 28, connecting the interstate and neighboring Abbeville County, had high criticality. For park accessibility in the recovery phase (Figure 14b), the important roads were State Highway 81, State Highway 28, and I-85. The previous critical road, Highway 29, had less importance after the flood.
The major roads after the flood for school accessibility (Figure 15a) remained almost the same as before the flood (Figure 8a), with minor changes in the local and secondary roads being rerouted due to the blockage. For college campus accessibility (Figure 15b), the road sections that were important before the flood also have high criticality after the flood, with the addition of Highway 178 connecting Anderson City with Highway 76.
Federal Highway 178, State Highway 8, and I-85 had high criticality for the accessibility of the materials to the Census block groups after the flood (Figure 16). For evacuees returning home, I-85, along with federal highway 178, was highly critical (Figure 16). Since the evacuees return from major corridor routes, the materials for repair and the evacuees’ route choice have remained almost the same. In this context, the origin for repair and recovery supplies is the same as that for returning evacuees, but since the destination for the former is a subset of the latter, we only display the map for repair and recovery supplies.

4.2. Flood Impacts and Prioritization of the Road Sections

4.2.1. Hospitals

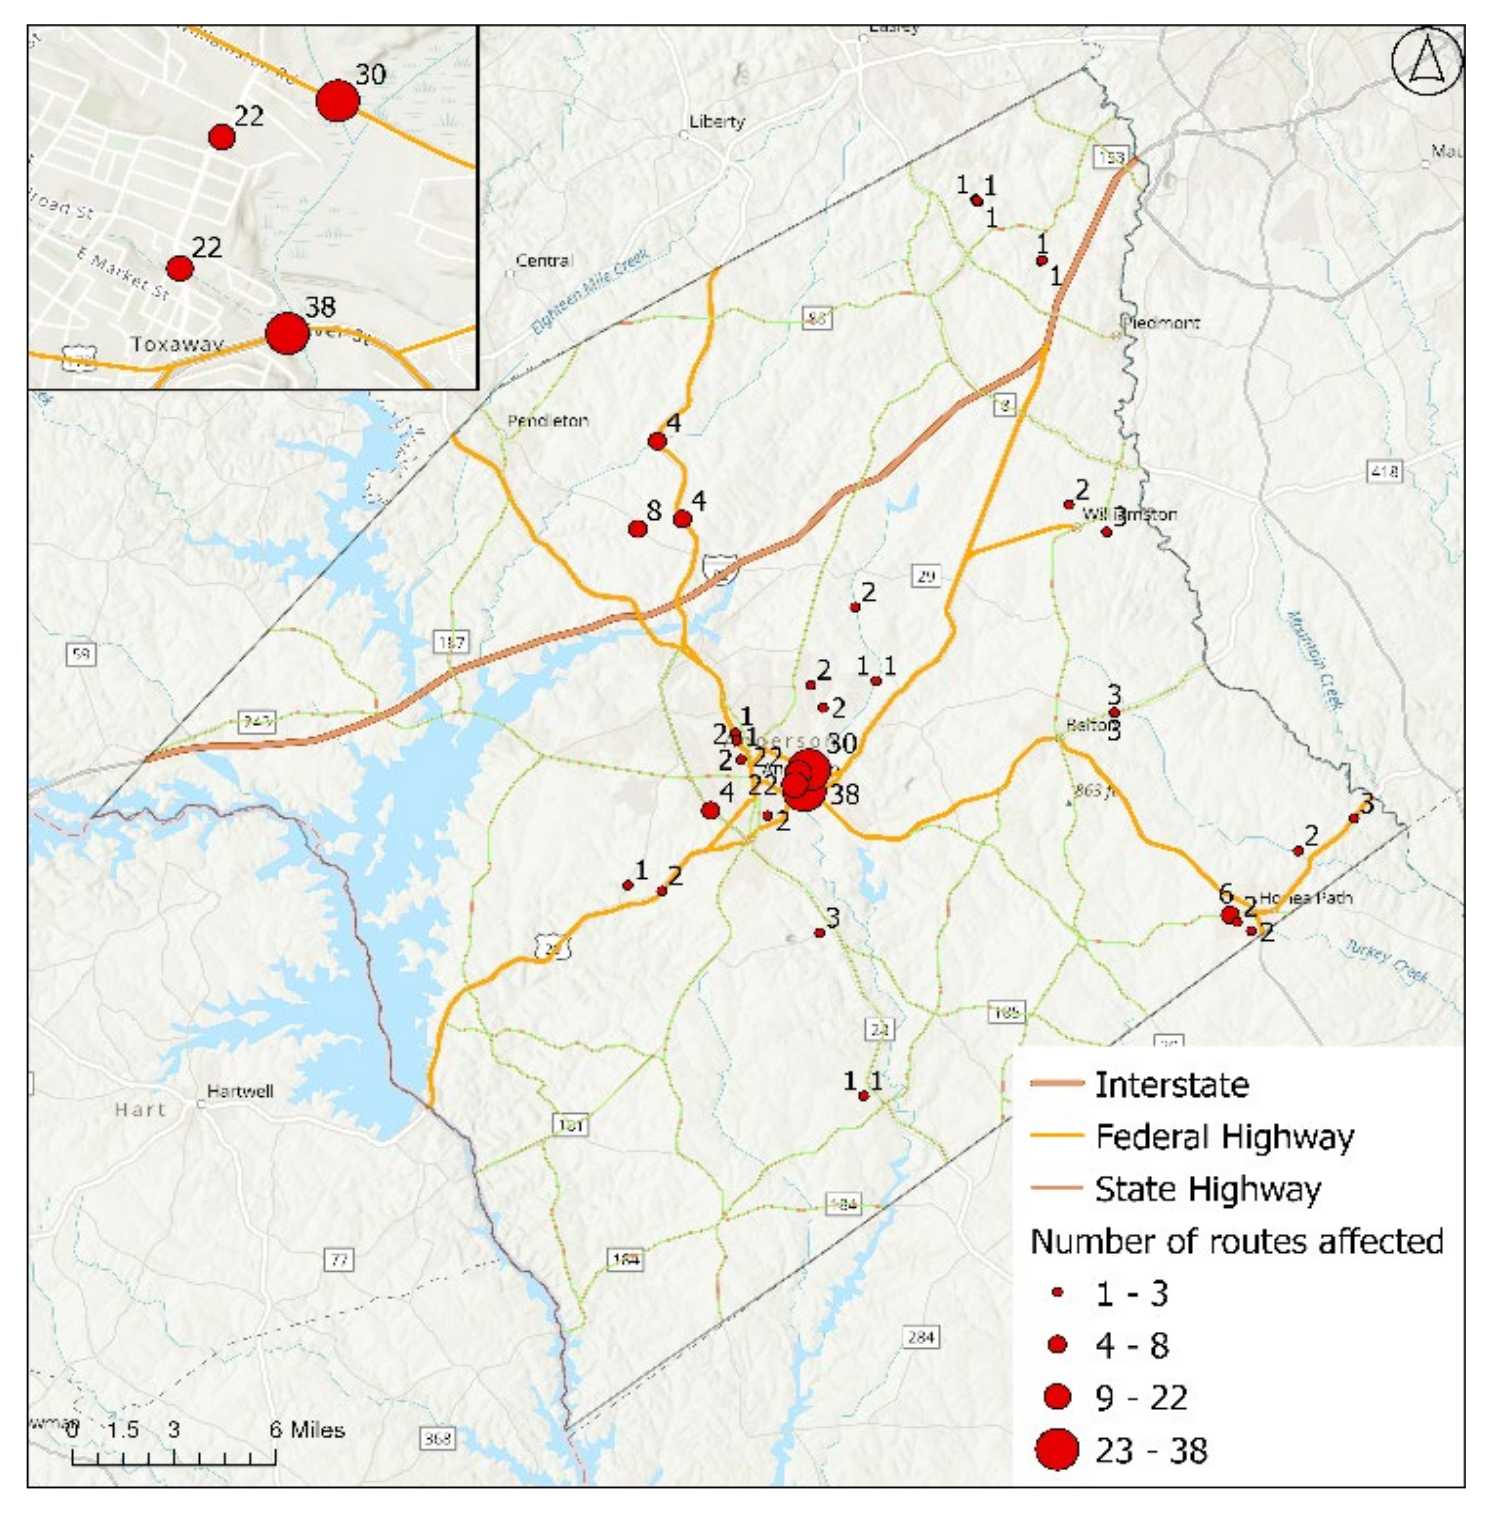
There is only one general-care hospital. The additional time it takes for people from various Census block groups to reach the hospital is presented in Figure 17a. The Census block groups of the county’s eastern, southeastern, and northeastern portions are more impacted and have a higher rerouting time to access the hospitals. The maximum additional time due to rerouting to access hospitals was 41.61 min, situated on the southeastern side of the county, as shown in Figure 17a. This high rerouting time is due to the blockage of a bridge near Anderson City, labeled as 16 in Figure 17b. For most of the high additional travel time areas in Figure 17a, this road section (labeled 16 in Figure 17b) plays a great role, implying that this section is highly important for hospital accessibility.
Not all road sections and bridges that are impacted (Figure 4) play a role in the change in hospital travel time. The betweenness centrality provided in Figure 17b suggests the highly critical road sections are nearer to the hospital (points labeled as 35 and 16).

4.2.2. Urgent Care Centers

Three urgent care facilities are in Anderson County, and to examine the impacts of the flood, we checked the accessibility of each facility from all Census block groups. The accessibility changes of urgent care facilities 1 and 2 were similar because they are located close to each other—one map is provided in Figure 18a. To access these two facilities, the maximum impact falls upon the Census block groups lying in the eastern, northern, and northeastern areas of the county (see Figure 18a). The maximum additional travel time was also from the southeastern location, with a maximum value of more than 14 min which is because of the potential blockage of the bridge labeled 38 in Figure 19. This section is the same as the section labeled 16 in Figure 17b. This similarity is because the hospital and the urgent care facilities 1 and 2 are located close to each other.
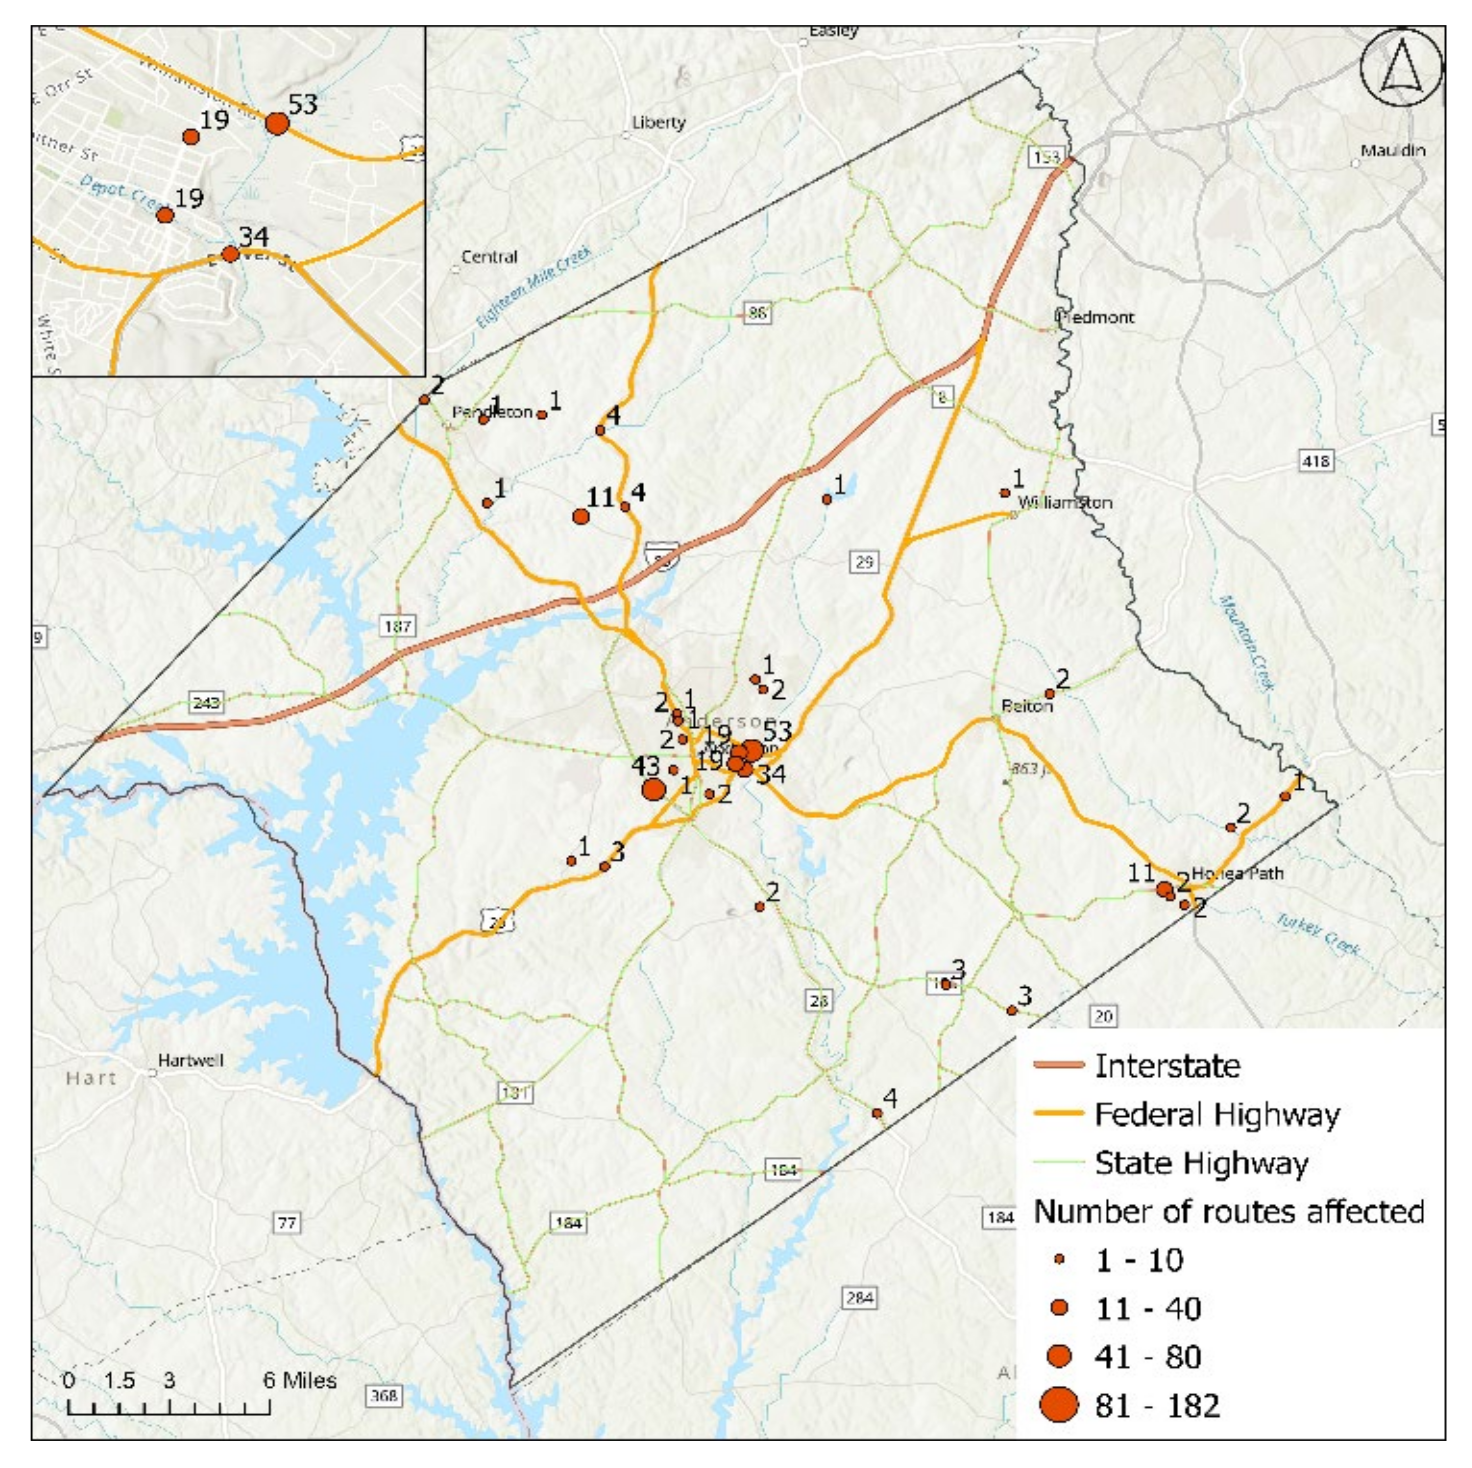
For the third urgent care facility, since the facility is located on the northeastern corner of Anderson County, the southwestern Census block groups must travel longer and face many barriers in between. The highest additional time required was 55 min from the Census block group nearer to Anderson City (Figure 18b). This high additional time is because more barriers are situated near the city and rerouting is involved using I-85 (see Figure 19). To access the interstate within less time, the route leads out of Anderson County and to the western neighbor (i.e., Hart County), which has no barriers in consideration. Using the interstate as the route was common for most of the high additional travel time Census block groups in the southern part of the county. Therefore, because the route goes through a neighboring county without taking flood barriers into consideration, the maximum additional travel time for accessing urgent care facility 3 can be even greater if Hart County is also flooded. Figure 19 shows the locations of blockages and the impact on various Census block groups while accessing the urgent care centers after the flood. The labels are cumulative for all three urgent care centers. The highest impact location was a bridge over the Rocky River on highway US 178 (labeled 38 in Figure 19).

4.2.3. Evacuation Shelters

The maximum additional time to access the nearest evacuation shelter during the flood is 7.47 min. This is because the shortest route to the nearest shelter is blocked due to flooding, and there are no nearby shelters, so the route takes longer to access the same shelter. Other than a few (seven) of the Census block groups showing additional travel time above the threshold, no high impact was seen for accessing the evacuation shelters. Since many evacuation shelters exist in Anderson County, residents have options when access to the closest shelter is blocked.
The evacuation from the Census block groups to the major corridors to leave the county during the disaster is also analyzed. Four major corridors lead to the larger cities of Columbia, Charlotte, Augusta, and Atlanta. The impacts would have been higher if the barriers outside Anderson County were also considered.
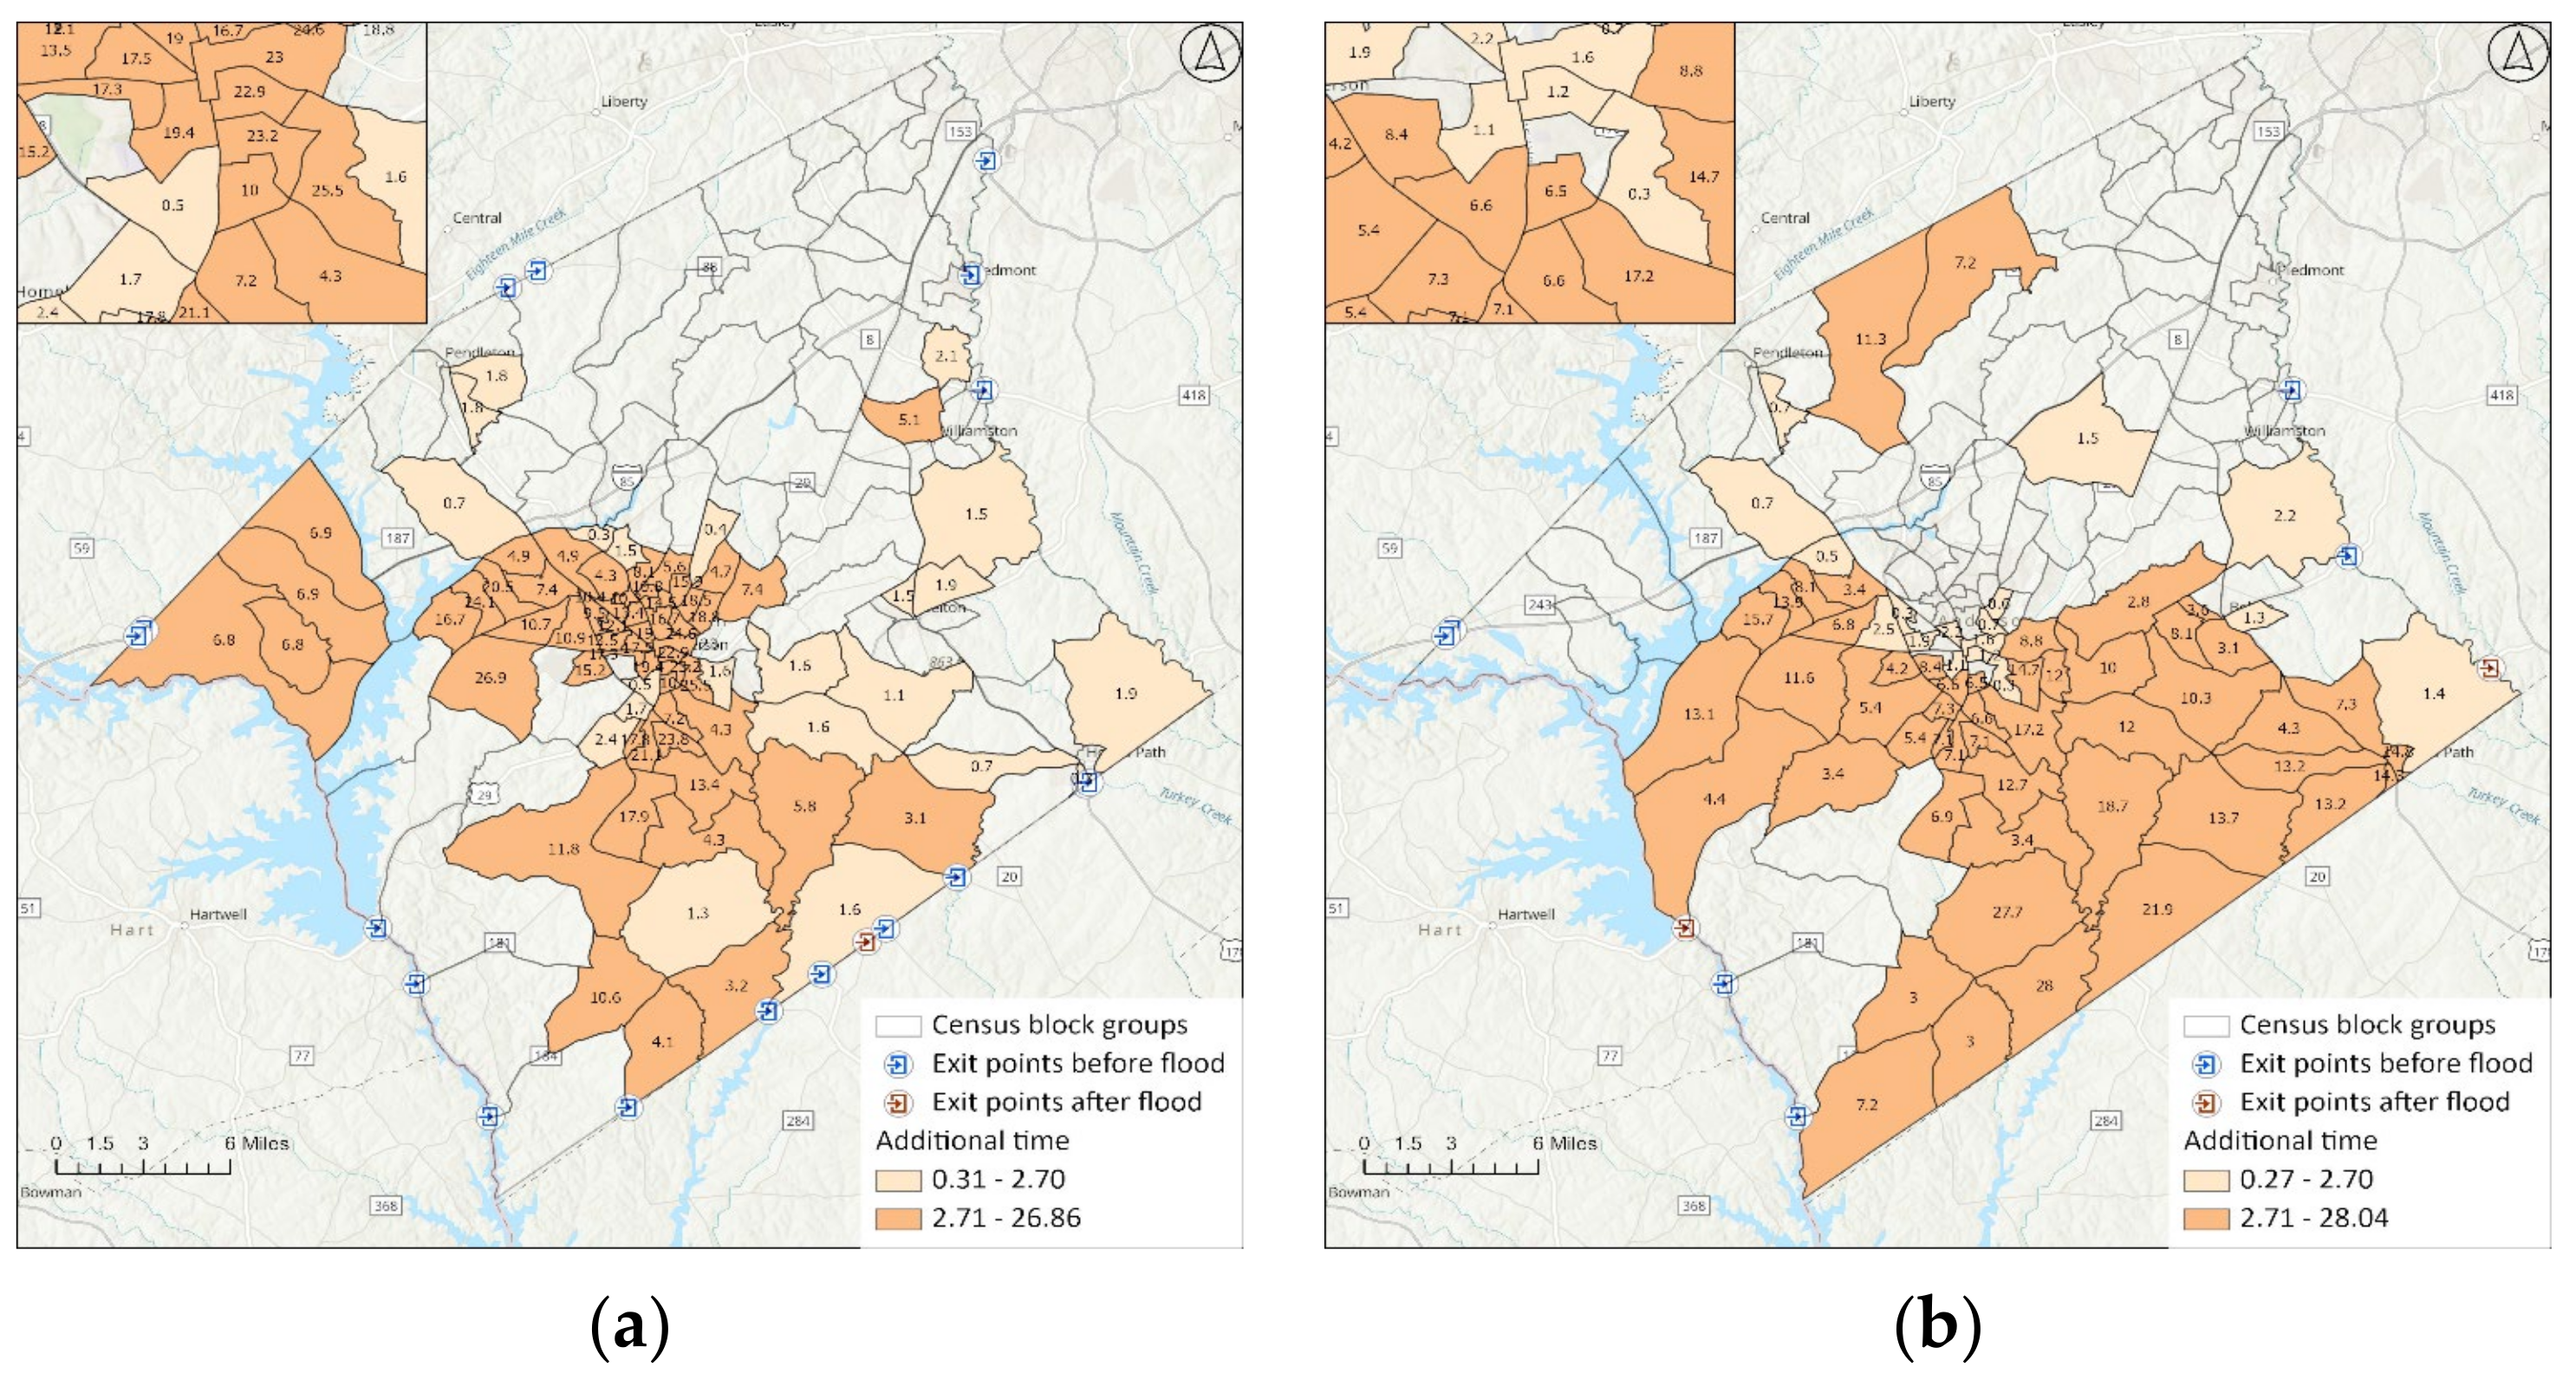
Columbia: To travel to Columbia from each of the Census block groups in Anderson County, the maximum additional time needed because of blockages in this county was 64 min. This high additional time is related to the discussion for urgent care facility 3, i.e., more barriers are situated near the city, because of which the best route considering high-capacity roads after the flood for accessing Columbia becomes the interstate (Figure 20a). To access the interstate, the route leads out of Anderson County back to the western neighbor (i.e., Hart County). Most of the Census block groups on the southern side accessed the interstate after the flood. For the Census block groups in the southeastern part of the county, the high additional time was mostly influenced by the blockage of the section labeled 73 in Figure 21. For evacuation, more Census block groups in the county’s southern and southeastern regions took more than 2.7 min (see Figure 20a).
Charlotte: Access to Charlotte faced less severe impacts than Columbia. The Census block groups on the southern side were impacted more. The maximum estimated additional time was 55.52 min (see Figure 20b) from the same Census block group having the most additional time to access Columbia, i.e., 64 min (see Figure 20a,b) due to the high number of blockages in the Anderson city area.
Augusta: The change in accessibility to Augusta for evacuating was different from that of Columbia and Charlotte. Columbia, Charlotte, Atlanta, and Augusta all fall on the interstate network; the travel time to get to Columbia, Charlotte, and Atlanta is the shortest using the interstate network. However, for Augusta, the shortest travel is not through the interstate network but through highways between Anderson and Augusta, i.e., US-25 and US-178. The southern, northeastern, and Anderson City areas were impacted. The maximum additional time was 26.86 min for the block group near Anderson City (see Figure 22a). The route choice before the flood was through major highways, but after the flood, the route involved accessing the interstate. The interstate was used by choosing the route out of the county to avoid barriers, causing a shift in before and after flood routes. The city has many barriers due to flooding, which results in a higher additional time concentration in the Anderson City area. The routes on the southern side initially went to the western neighboring county, and then travel proceeded from there, avoiding barriers.
Atlanta: Before and after the flood, the general trend was to access the interstate and then go to the city. The most impacted Census block groups are in the southern, southeastern, and western areas of Anderson County. Most of the Census block groups had additional time to access the interstate. The southern and southwestern areas traveled to neighboring Hart County and went to I-85 from that county. The maximum additional time needed for evacuating to Atlanta was 28.04 min (see Figure 22b) because of the blockage of a bridge labeled 73 in Figure 21. Since Atlanta is on the western side of the county, the route for the Census block groups on the northern side leads them to the interstate, causing minimal additional travel time. The Census block groups on the southwestern side must travel on several local roads before getting to the interstate, which along with barriers, causes the additional time.
No barriers existed on the interstate, and the number of barriers was usually high for the lower-class roads (i.e., local roads). The more a vehicle is on higher-class roads, the less the chance of encountering a barrier. The choice of route and the impacts of certain barriers on accessing the major corridors are provided in Figure 21.

4.2.4. Grocery Stores

The impact on access to the nearest grocery stores was measured before and after the flood, and the travel time change was noted for each Census block group. Given the proximity of existing stores and multiple alternative grocery options, rerouting to either the current closest store or the nearest alternative store does not incur a significant additional time cost following a flood. The maximum additional travel time to access the nearest grocery store was 3.3 min.

4.2.5. Recreation

Because of the higher number of parks and their distribution around the county, the flood did not have a major impact on most Census block groups’ access to the nearest park facility. The highest additional travel time was 13.7 min after the flood because there was only one park nearby for the Census block group. The road leading from the Census block group with the 13.7 label was blocked. Recreation based on the Hartwell Dam was not considered because the lake would not be safe during the flood phase.

4.2.6. Workforce Accessibility

There were 59 major employers in Anderson County [67] with more than 100 employees, and none of them were directly inside the flood hazard area. We identified the routes from Census block group centroids to major employment locations and the routes from major transportation corridors to major employment locations before and after the flood. To consider out-of-county workers, we took the entry points to Anderson County from all directions and analyzed the accessibility of these points to the workplaces in the county.
The average travel time increased by 4.24 min after the flood, with the median of the change being 3.28 min and a standard deviation of 3.67. The range was from 0 to 25.84 min. For all 3675 changed routes from 141 Census block groups to 59 workplaces, the additional travel time frequency is provided by Figure 23. However, the histogram did not indicate which area was more vulnerable or which workplace would endure more impact. Answering such questions required an analysis of the individual workplaces.
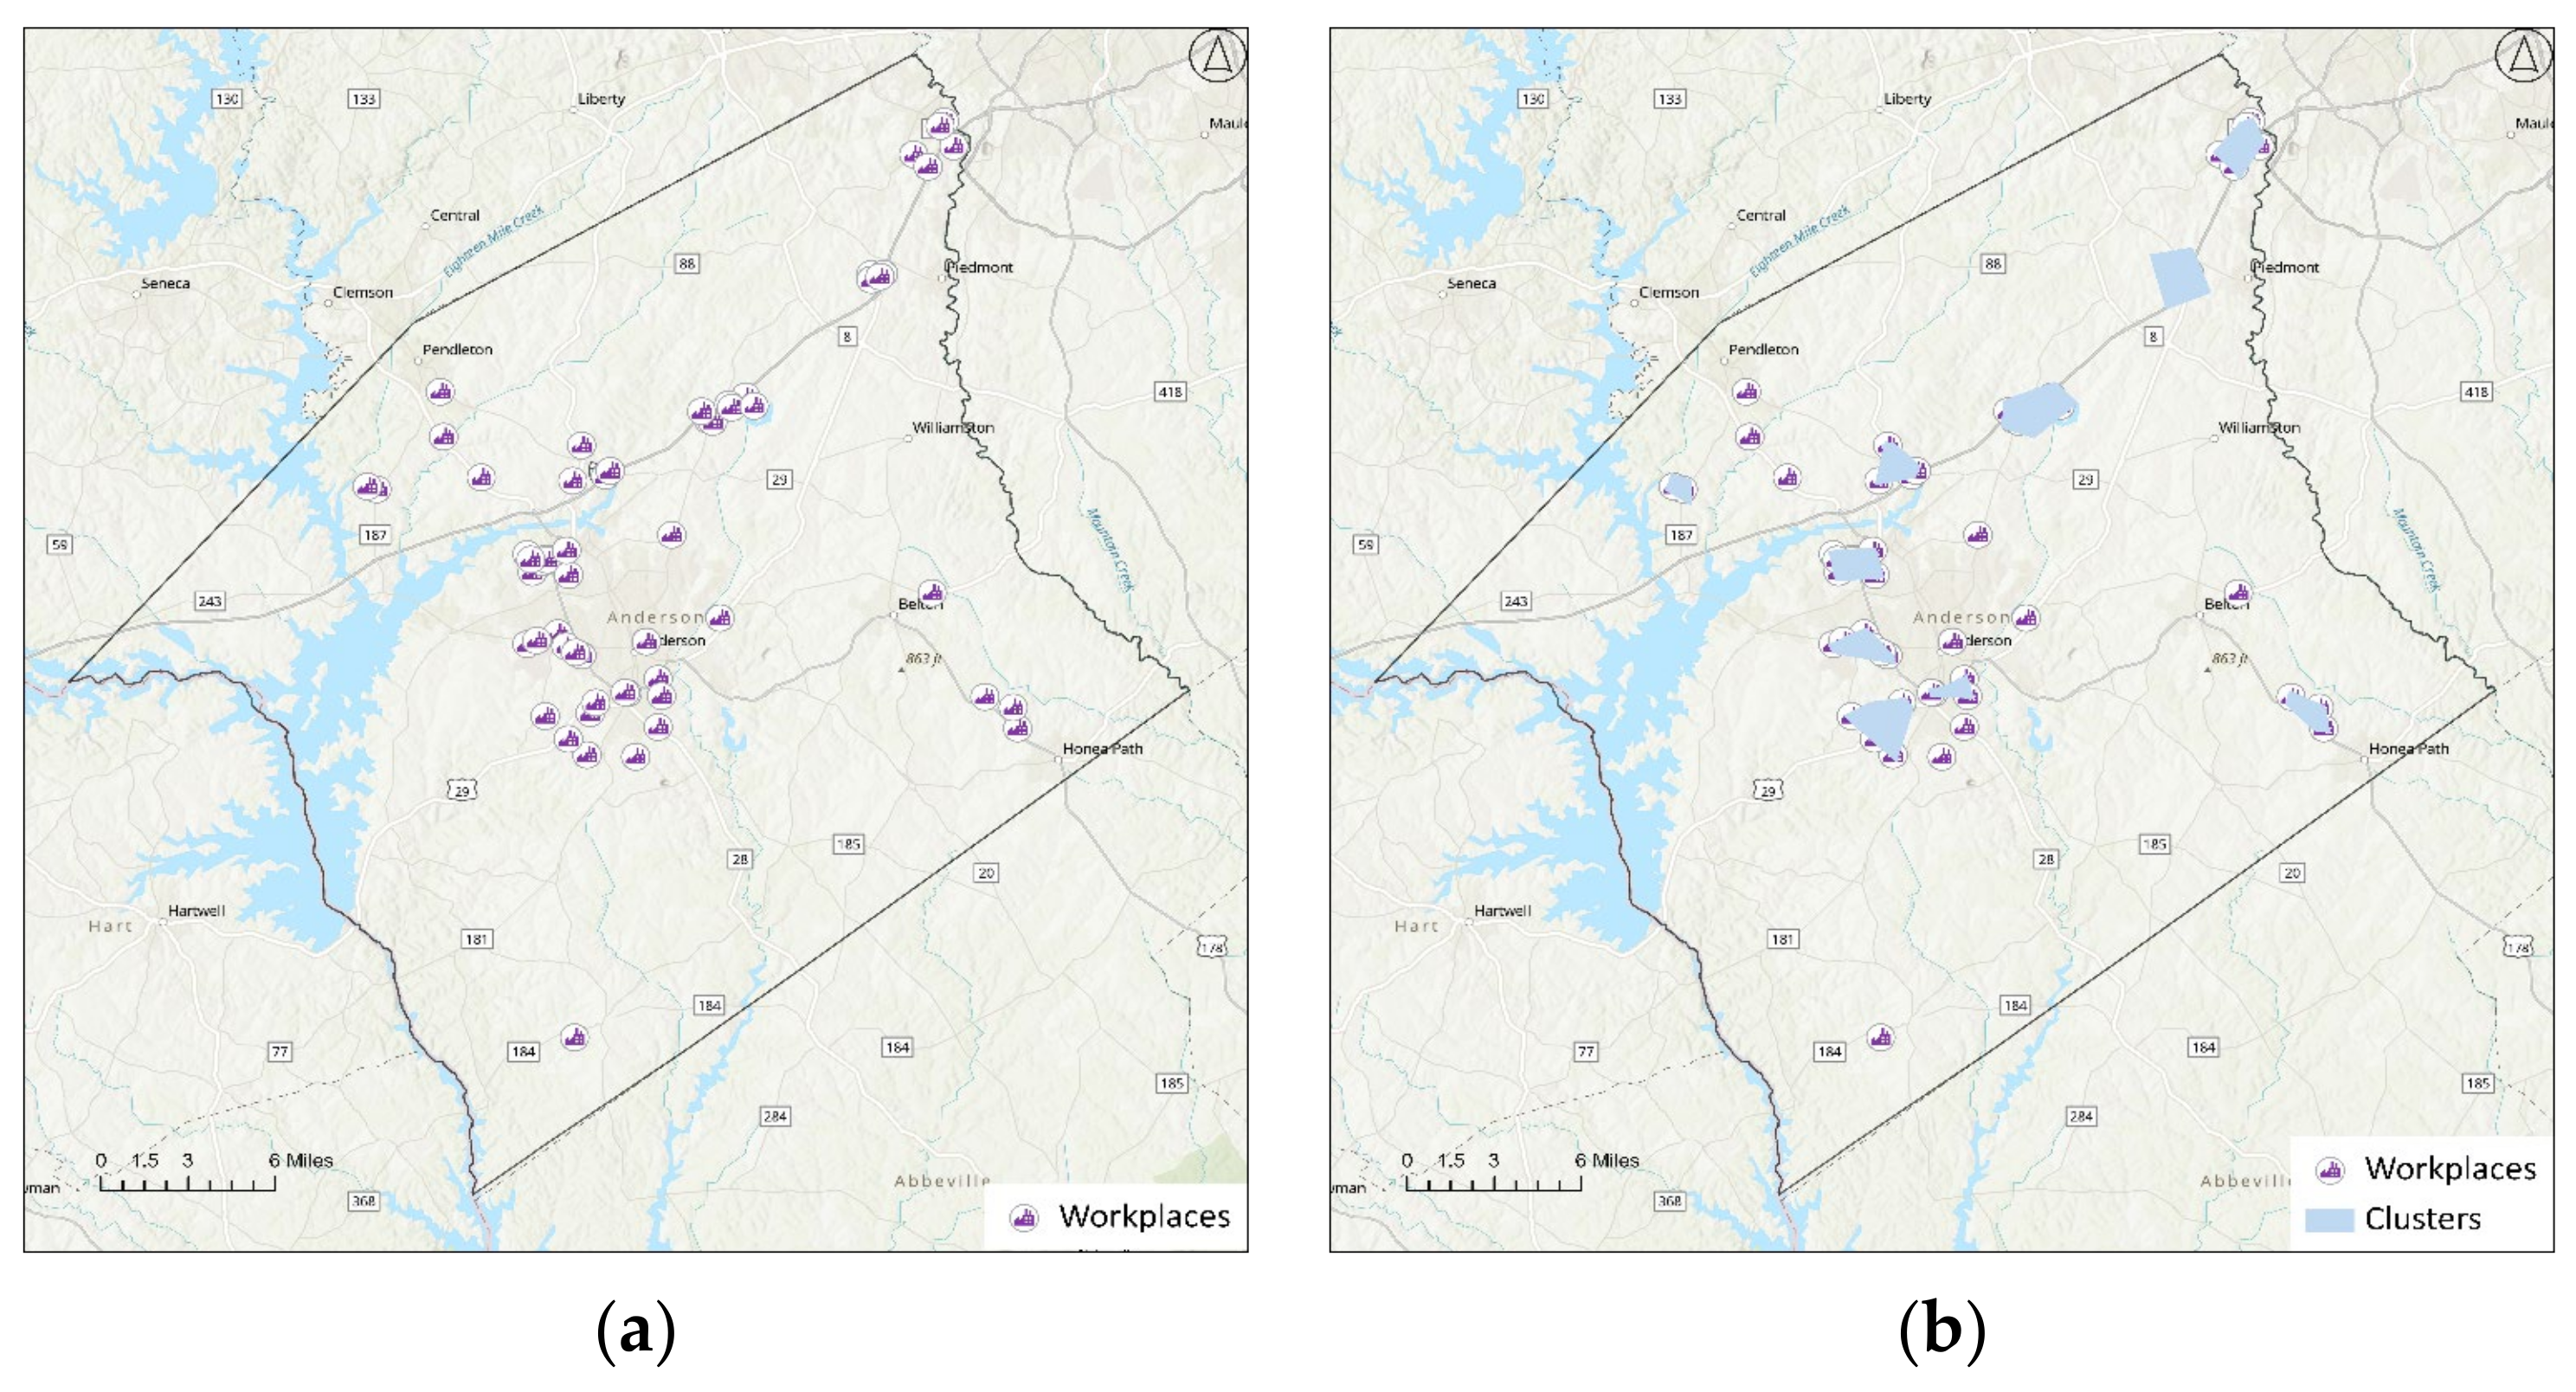
We grouped the workplaces into 19 clusters to facilitate discussion. The clustering was conducted for the workplaces that were close to each other and did not have any barriers in the enclosing boundary polygon (see Figure 24a,b). The labels in the clusters in Figure 24b represent the number of workplaces in that cluster.
To illustrate the analysis, a map for Anderson Industries, Anderson, SC, USA (workplace 2) and Taylor and Pallets Recycling Inc., Anderson, SC, USA (workplace 18) is presented in Figure 25a and Figure 25b, respectively. These two employers are in different directions from Anderson City and show varied results for the Census block groups’ accessibility. The Anderson City area played a great role in the accessibility of the workplaces. Anderson Industries is in the north of the Anderson city area, which resulted in the high additional travel time for the Census block groups on the opposite side of the city, i.e., the southern and southwestern sides (see Figure 25a). Similarly, workplace 18 is located on the southern side, and an impact was seen on the northern, northeastern, and northwestern Census block groups (see Figure 25b).
Figure 25a,b show that the additional time for the entry or exit points is similar to their adjacent Census block groups. The variation in the Census block groups being highly impacted is largely dependent on the location of the workplace.
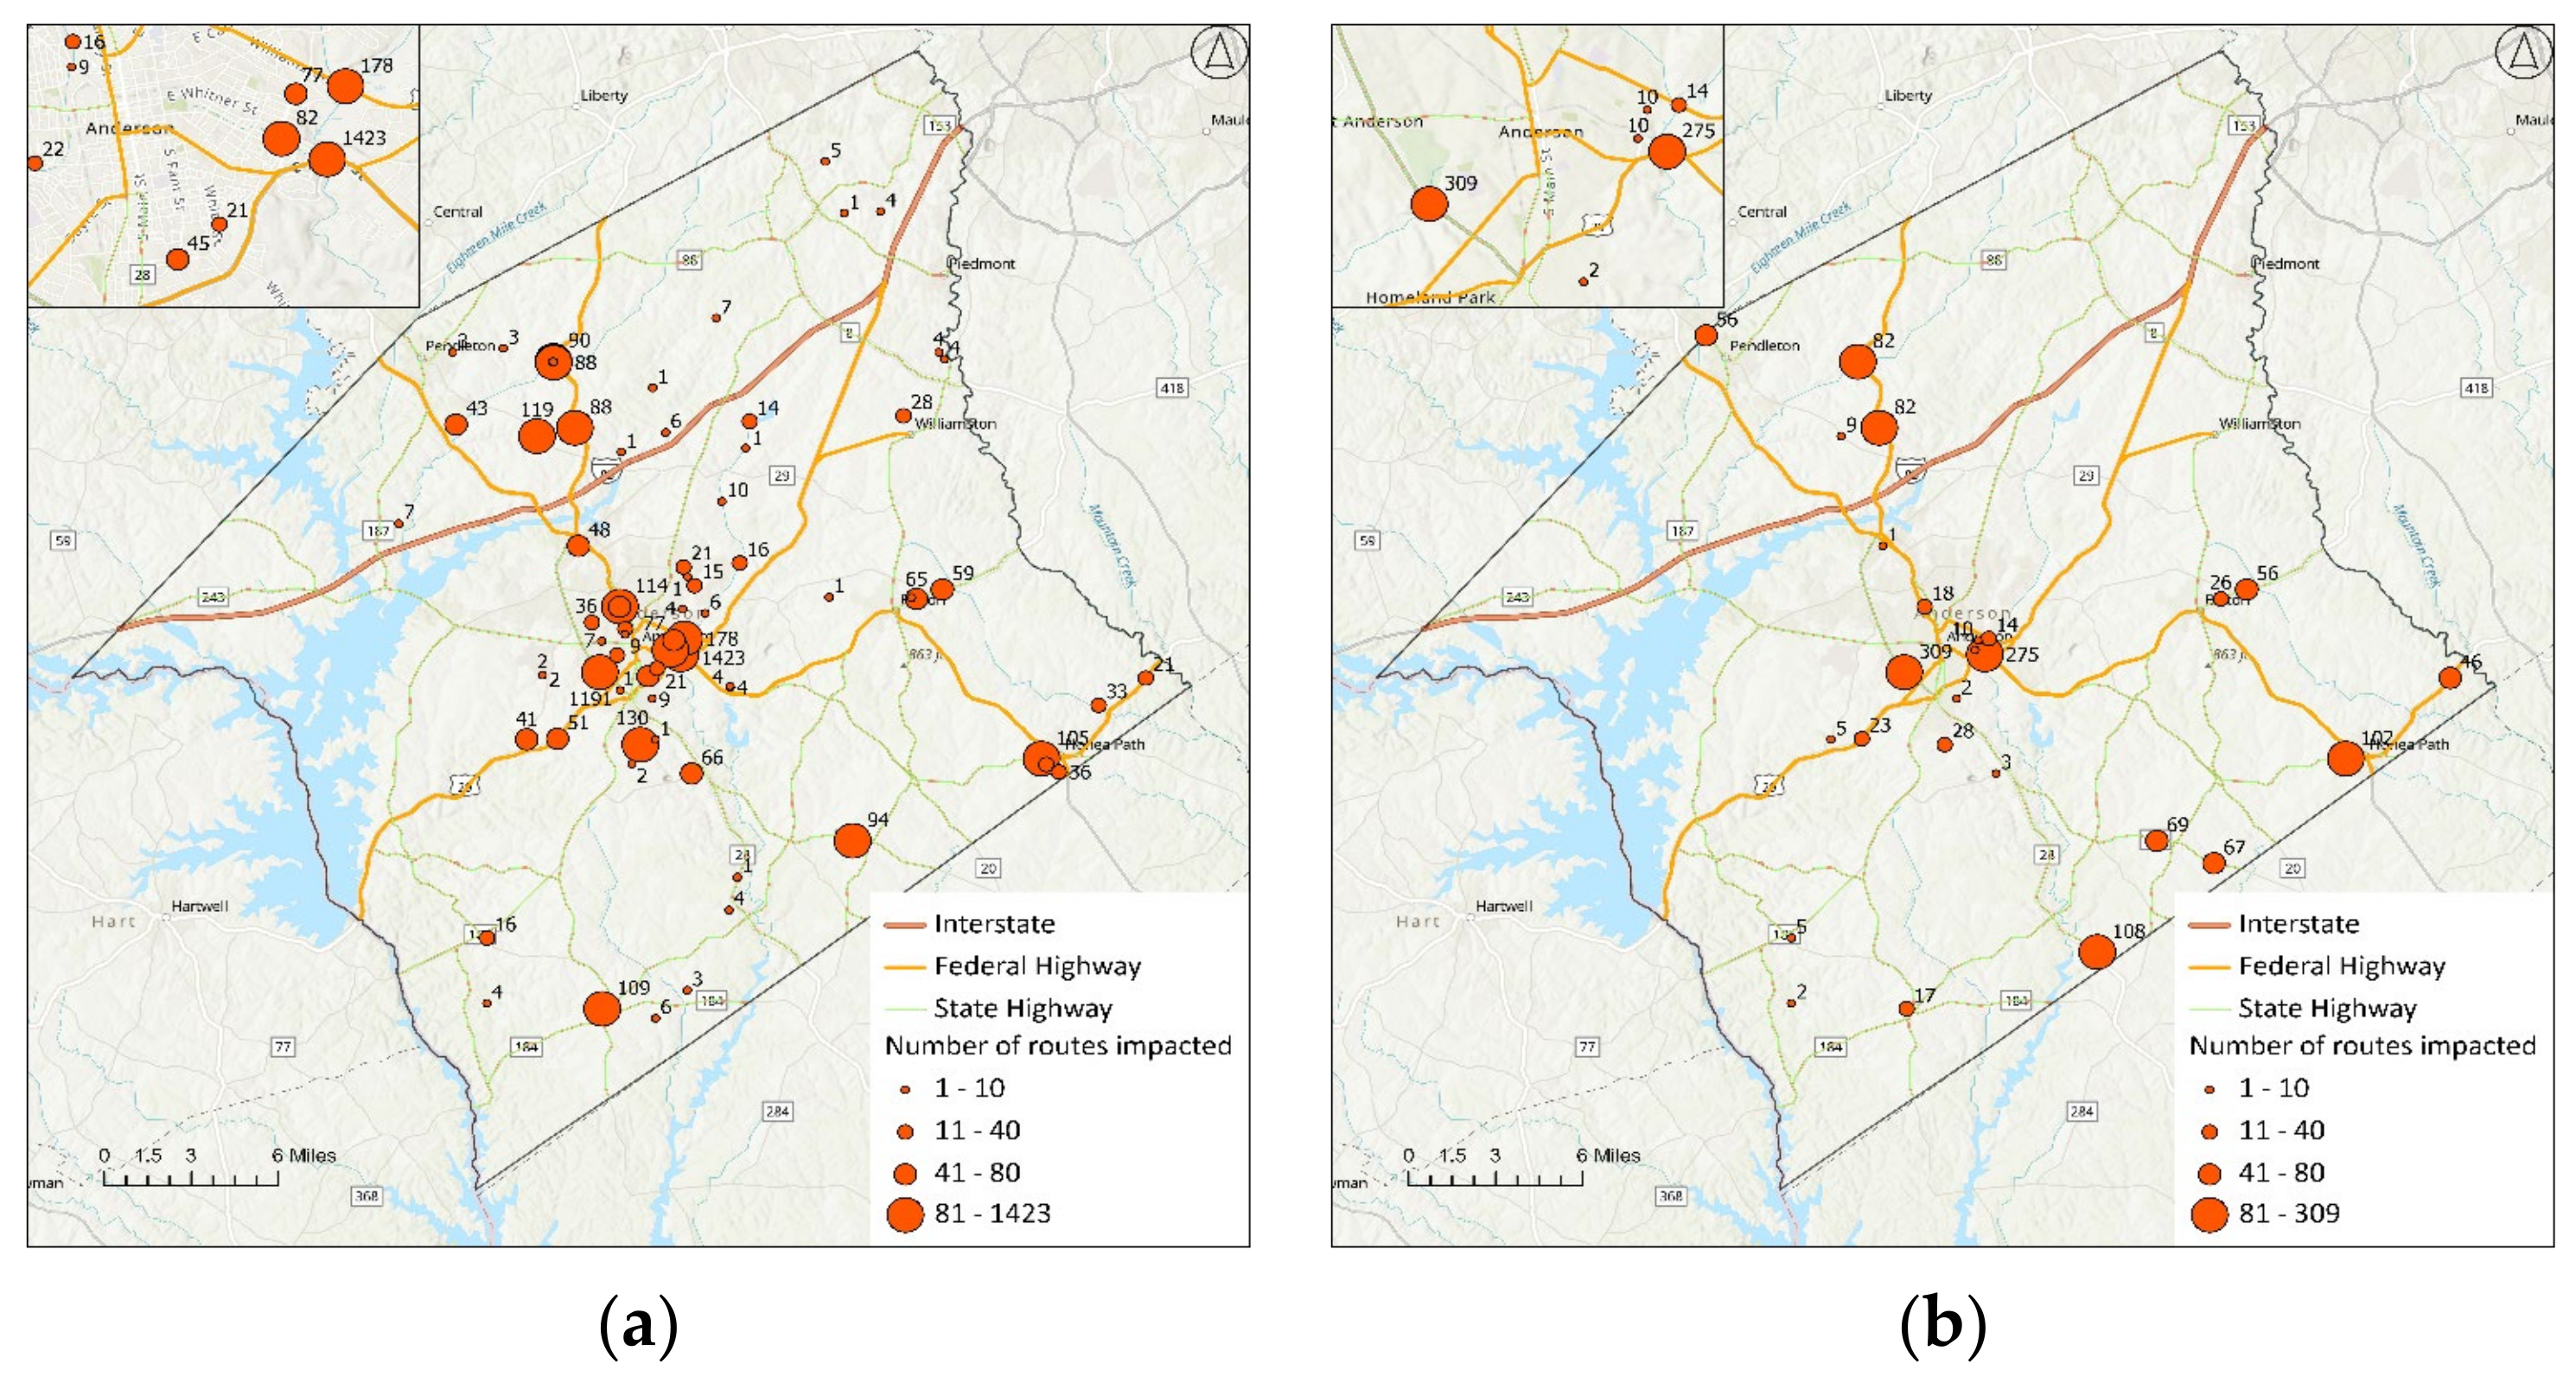
For workplace accessibility, the betweenness centrality value of road barriers after the flood from Census block groups and entry and exit points is provided in Figure 26a,b. The higher values indicate that points have a higher criticality. Most of these barriers important for workforce accessibility were concentrated in Anderson City (Figure 26).
From the individual workplace analysis, the general trend of impacts on each Census block group showed the southern and southeastern regions as the most impacted, and the least impacted was the northeastern region. The impact on the entry and exit locations, as marked by circles in Figure 25a,b, follows the general trend of impact in the Census block groups.

4.2.7. Materials Accessibility to Workplaces

The accessibility of materials is very important to companies, whether that is raw materials for manufacturing or the shipping of final products. To understand the impact of the flood, we conducted a truck accessibility analysis from major corridors to/from Atlanta, Augusta, Columbia, and Charlotte (see Figure 27b) to the workplaces in Anderson County. The additional travel time for each workplace from Columbia is provided by Figure 27a. The points are the companies, and the labels are the additional travel time. Companies closer to I-85 were less impacted compared to the companies farther from the interstate because no barriers were on the interstate. The companies in Anderson City also have a large amount of additional travel time associated with them because of the high density of flood-impacted roads and bridges (see Figure 27a and Figure 28). The maximum additional travel times from each of these cities to the workplaces were 17.05 min from Columbia for a workplace situated on the southern side of the county (see Figure 27a), 11.72 min from Charlotte for a workplace located away from I-85 in the northern corner of the county, 15.21 min from Atlanta for a workplace near Anderson city, and 20.87 min from Augusta for a workplace near Anderson city.
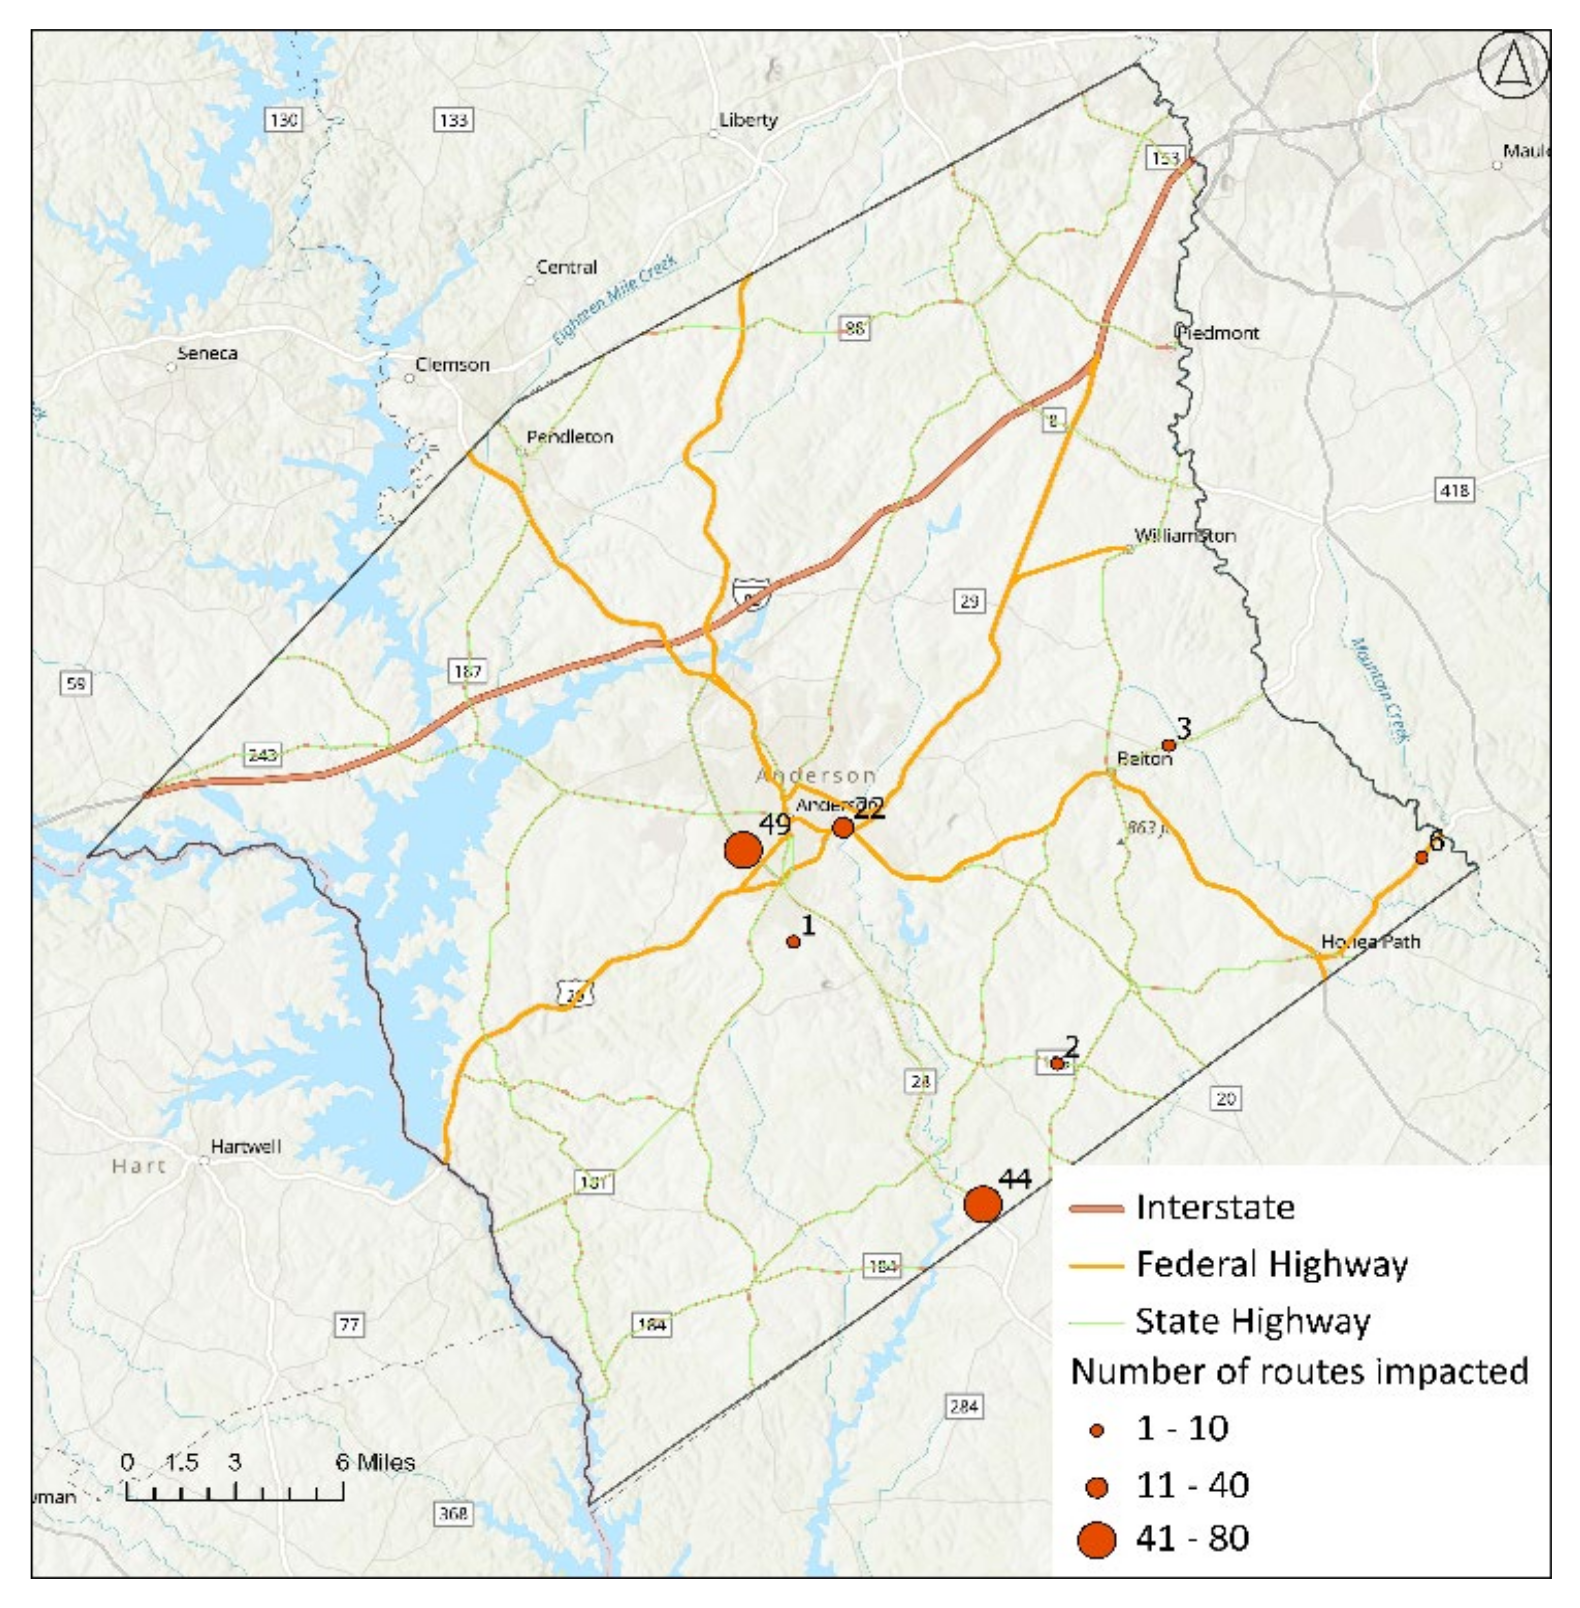
Figure 28 shows the road sections blocked by the flood and the number of routes that use those sections. A greater number of routes were impacted near Anderson City and far away from the interstate (see labels 49, 22, and 44). Figure 28 shows that the barriers near Anderson City are important for material accessibility to the workplaces as well.

4.2.8. Education

Flood-related increases in travel time can lead to more student absences.
  • Colleges
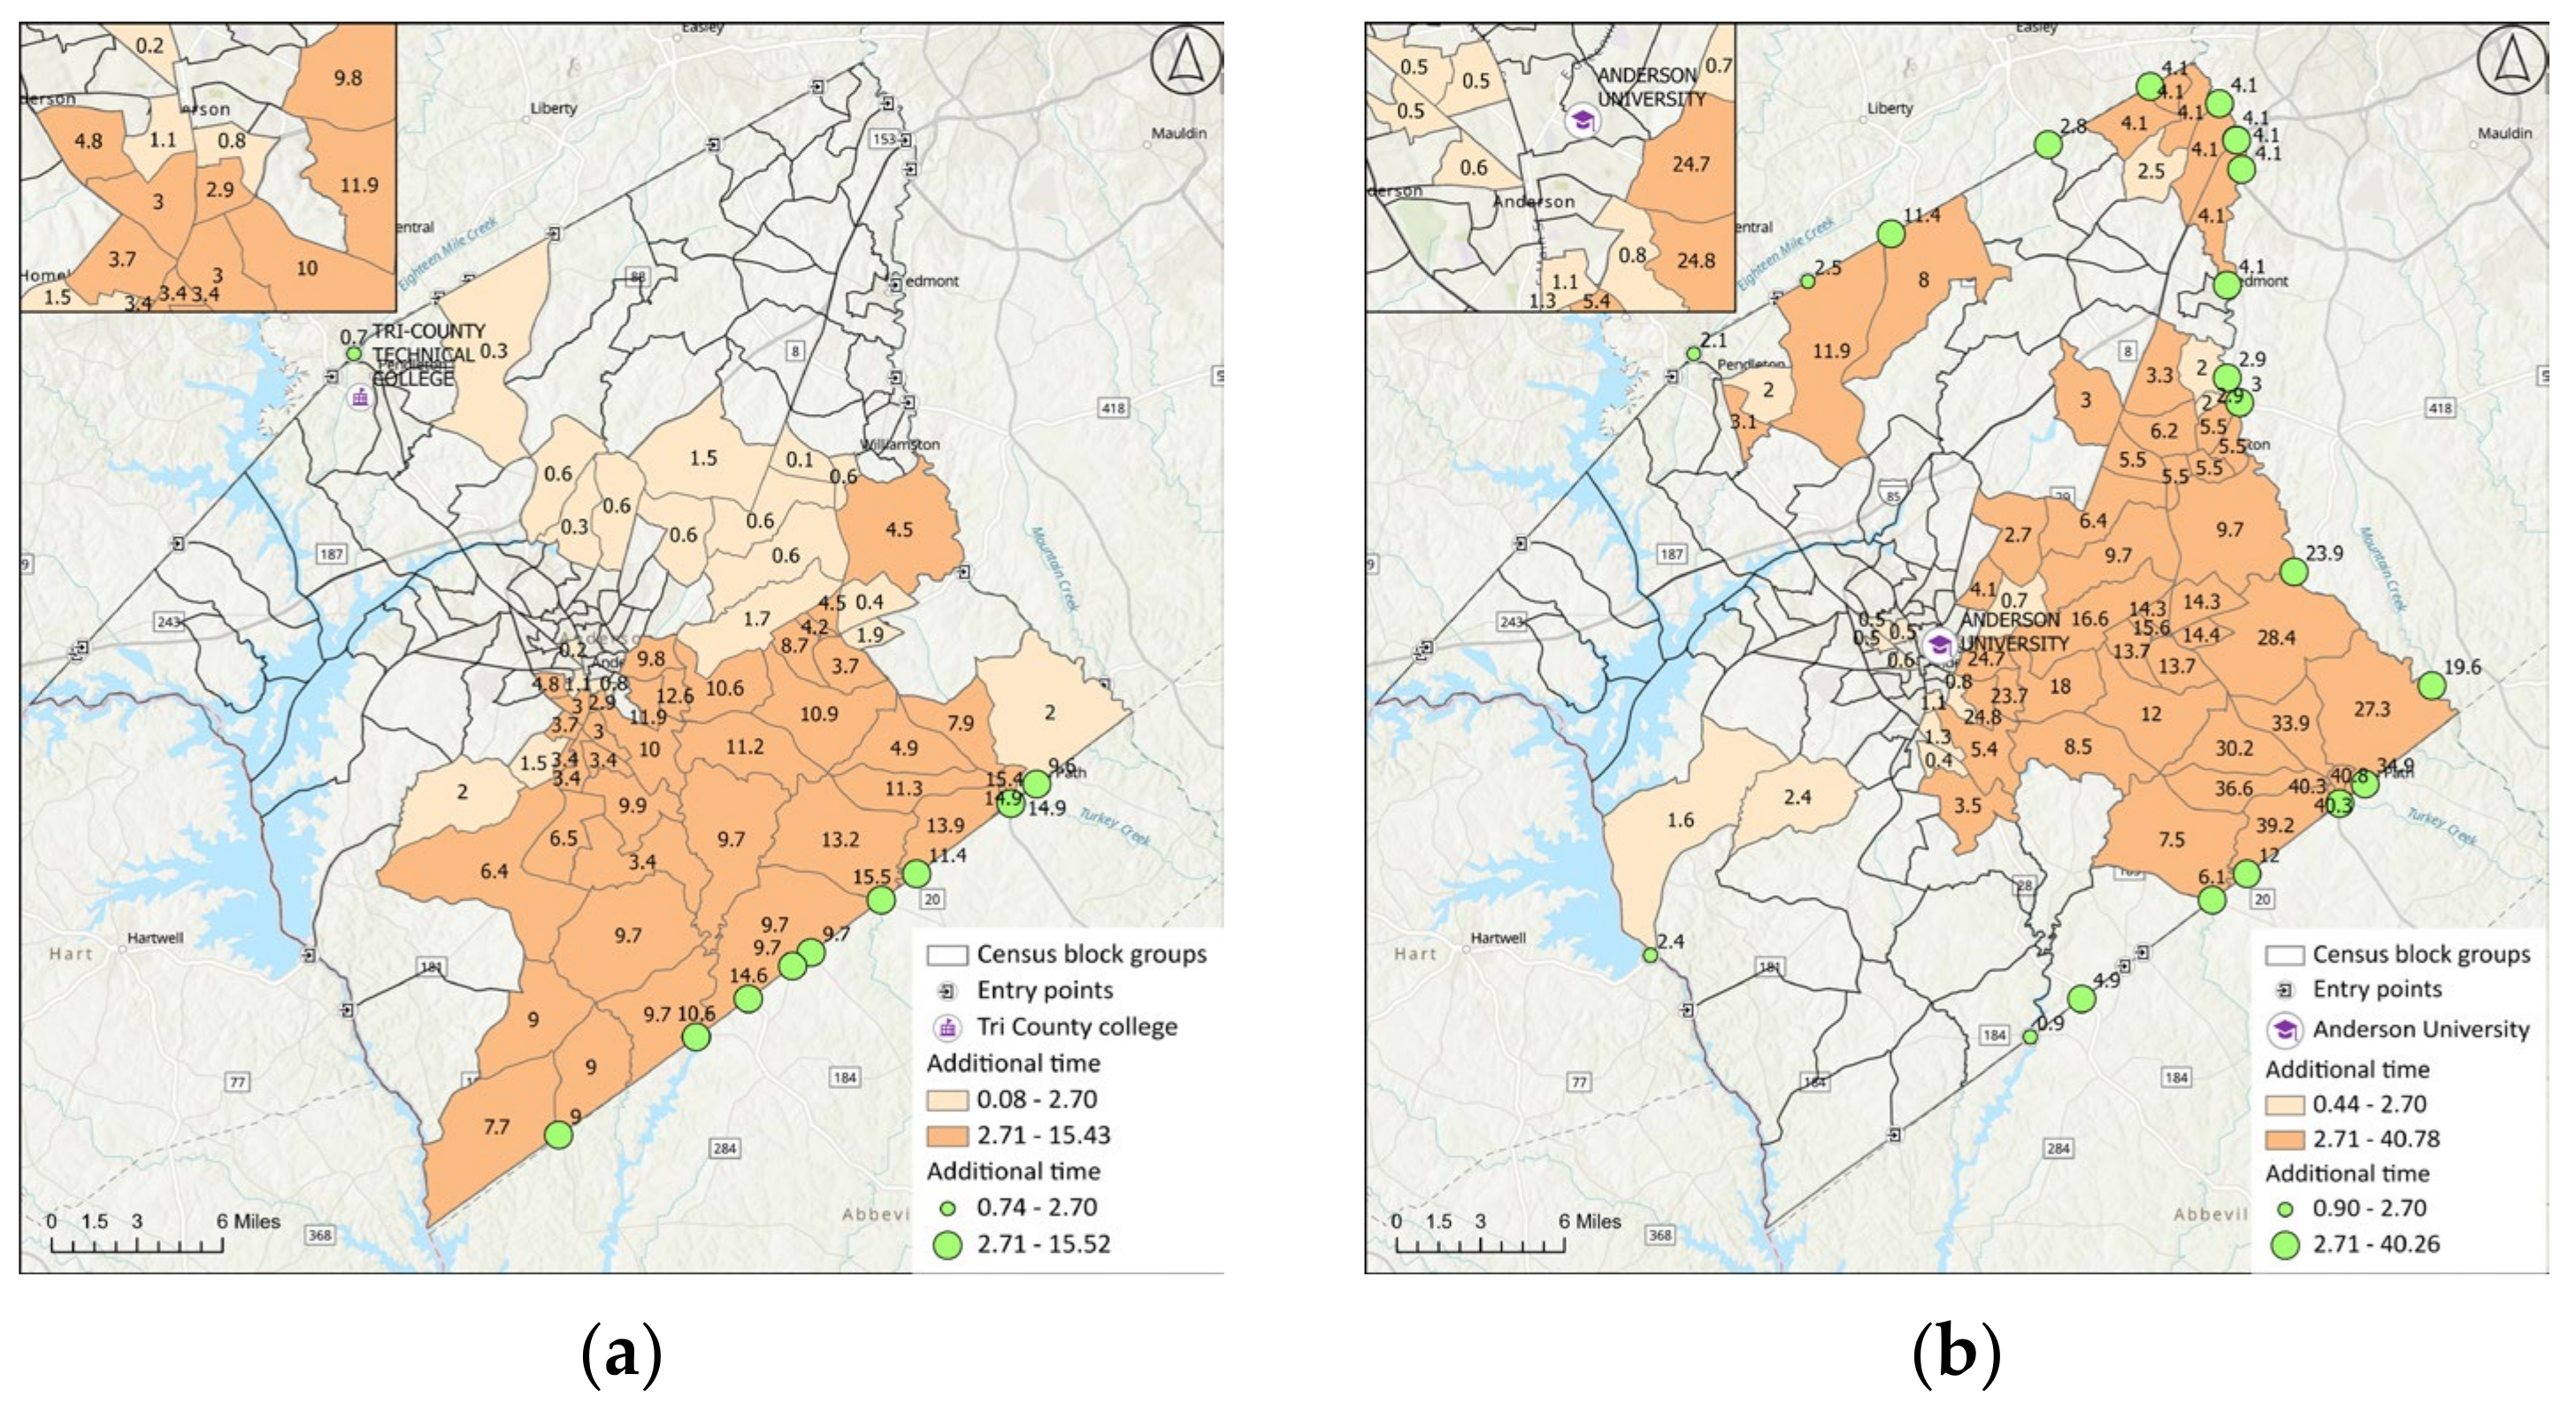
There are five colleges in Anderson County, but two (Tri-County College and Anderson University) have enrollments of more than 500 [68]. For Tri-County College accessibility, the southern and southeastern parts of the county were highly impacted (see Figure 29a). Most of the Census block groups and entry points with additional time higher than the 2.7 min threshold lie on the eastern, southeastern, and southern sides. The maximum additional time was 15.43 min (see Figure 29a). To access Anderson University, the maximum additional time was 40.78 min, which is greater than Tri-County College because of the college’s location (see Figure 29b). Anderson University is located near Anderson City, which has many barriers (see Figure 30). Hence, routes traveling to Anderson University must change near the university. The sections most impacted were the eastern, northeastern, and northern parts of the county (see Figure 29b).
  • Schools
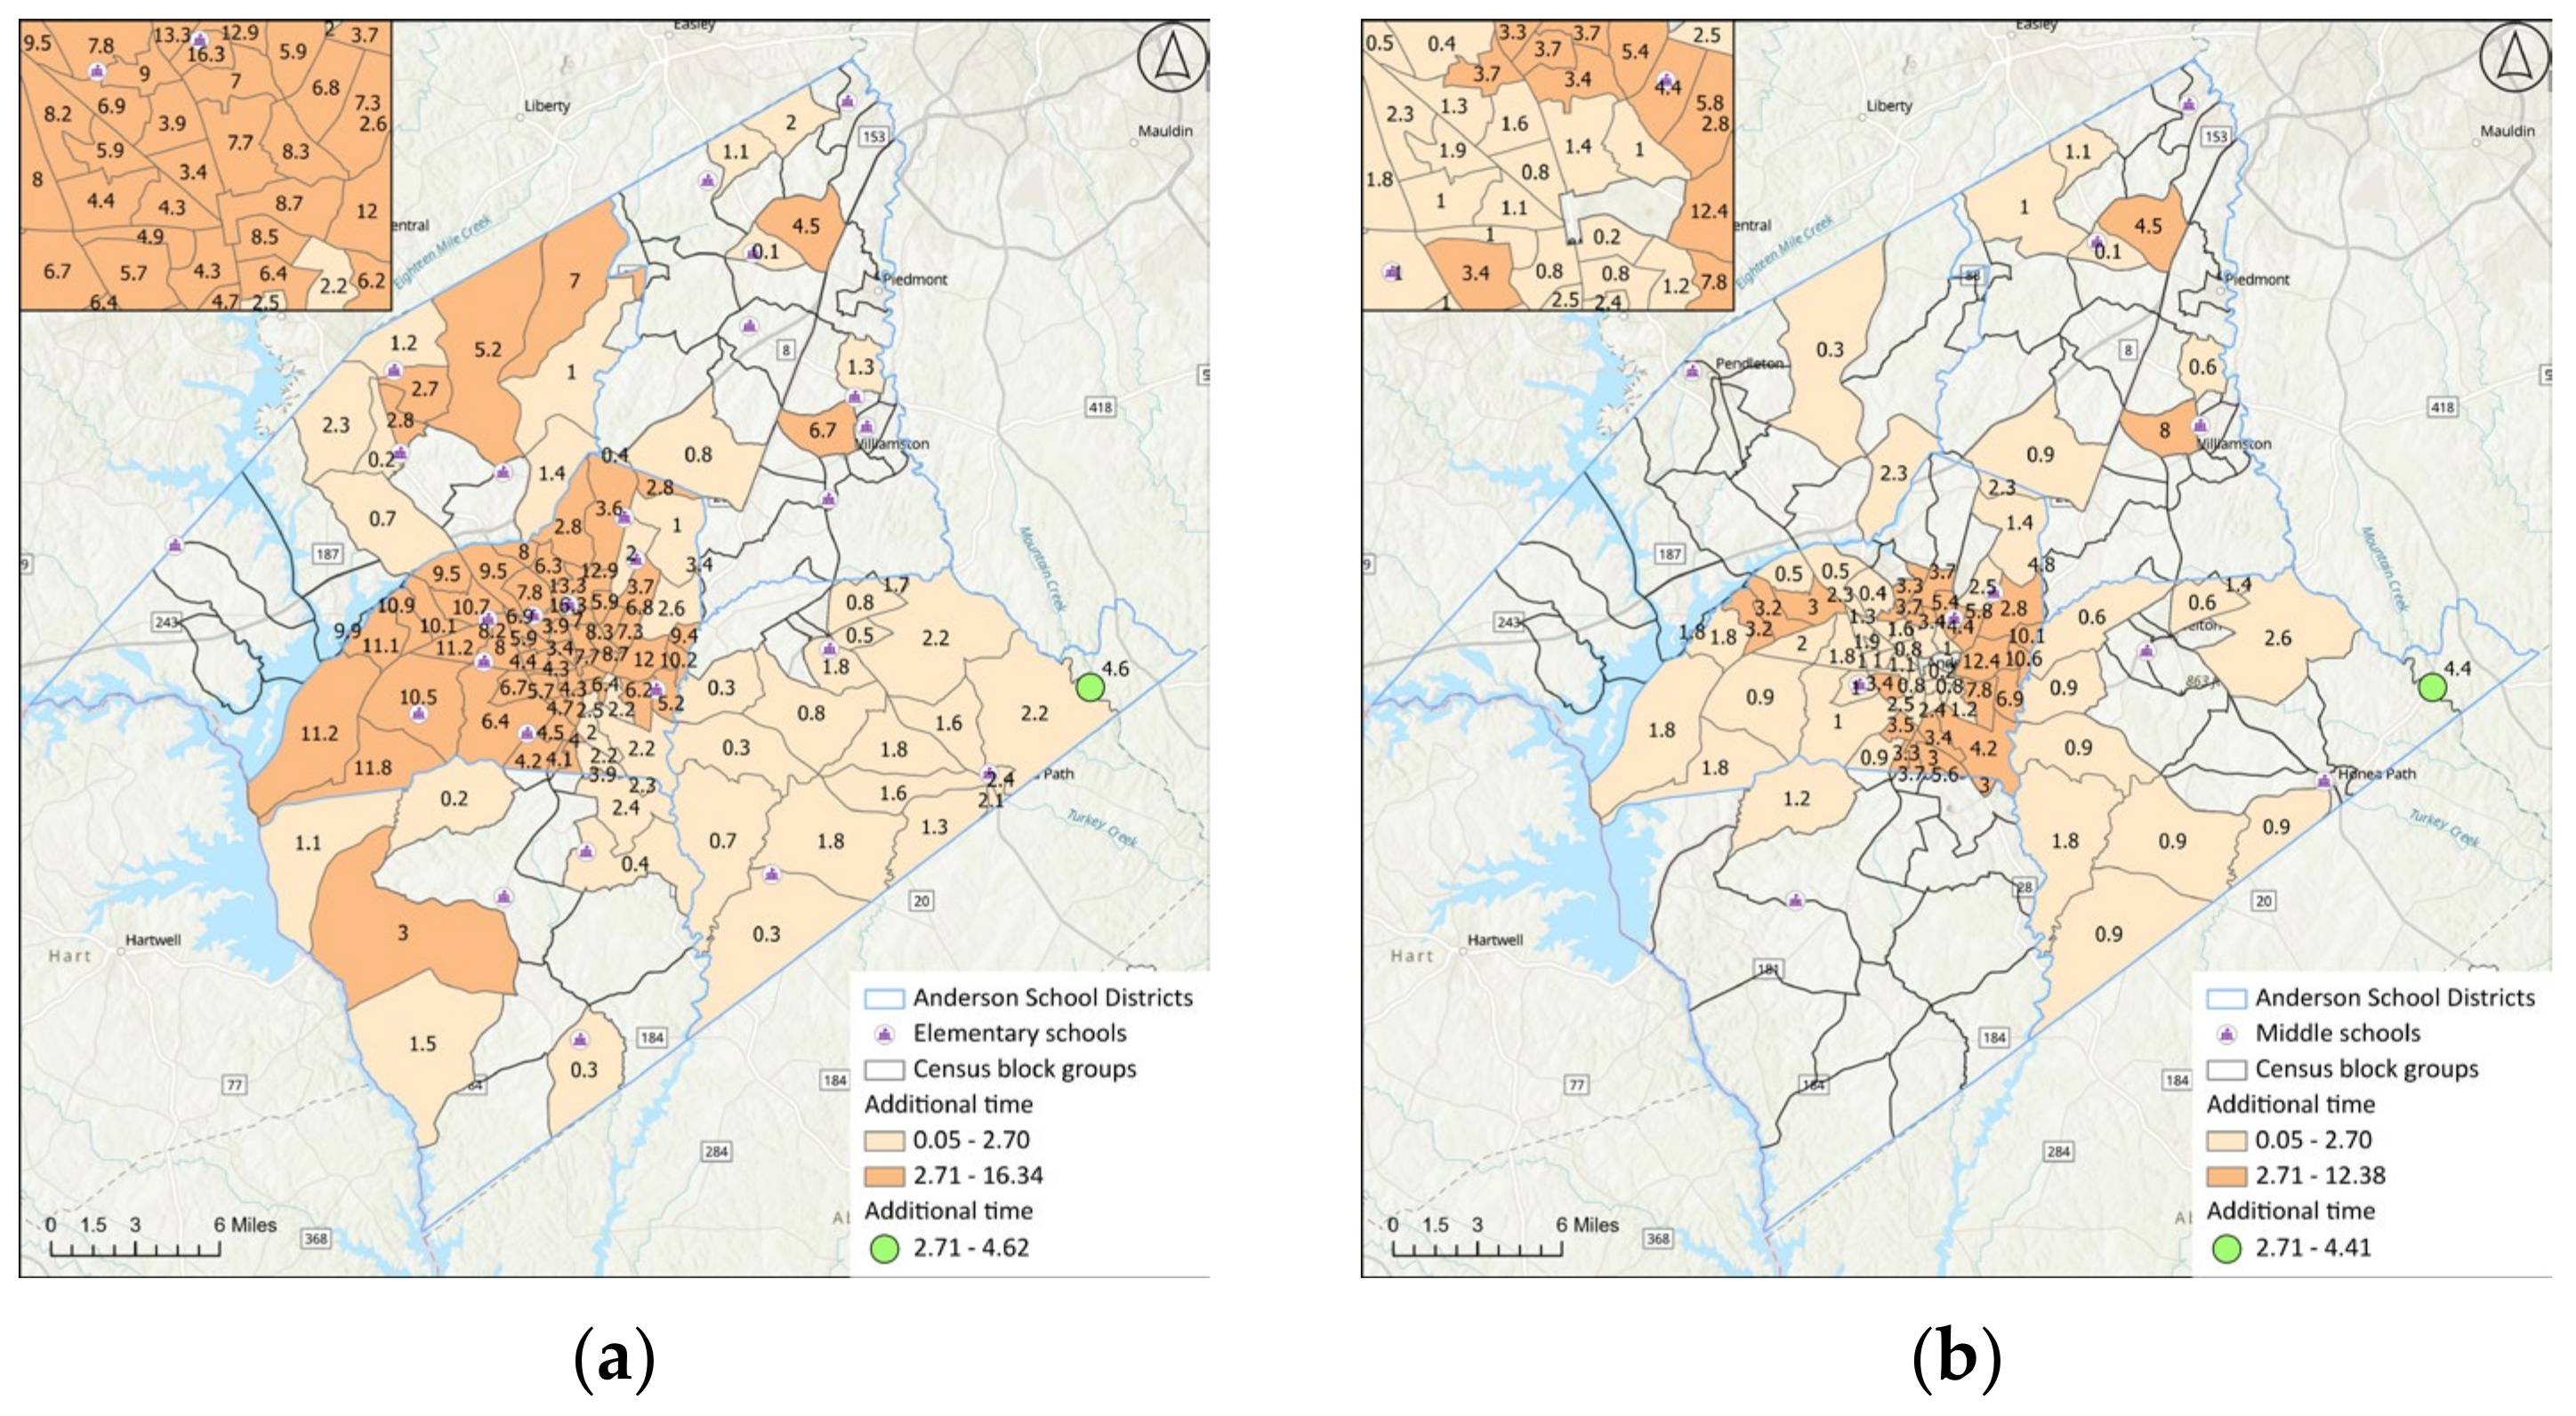
The accessibility to elementary, middle, and high schools from each school district had a higher additional travel time in the Anderson City area. The maximum value of additional travel time for accessing elementary schools was 16.3 min in school district 5 (see Figure 31a); for middle school, it was 12.38 min in school district 5 (see Figure 31b); and for high school, it was 9.38 min in school district 5 (see Figure 32a). School district 5 was the most impacted. Figure 32b shows the locations and the number of routes passing through the blocked sections before the flood. One entry point is also considered because of the extension of that school district to adjacent Greenville County. There was a barrier near the entry point (see Figure 32b), causing a greater amount of travel after the flood.

4.3. Public Transit

4.3.1. Before Flood

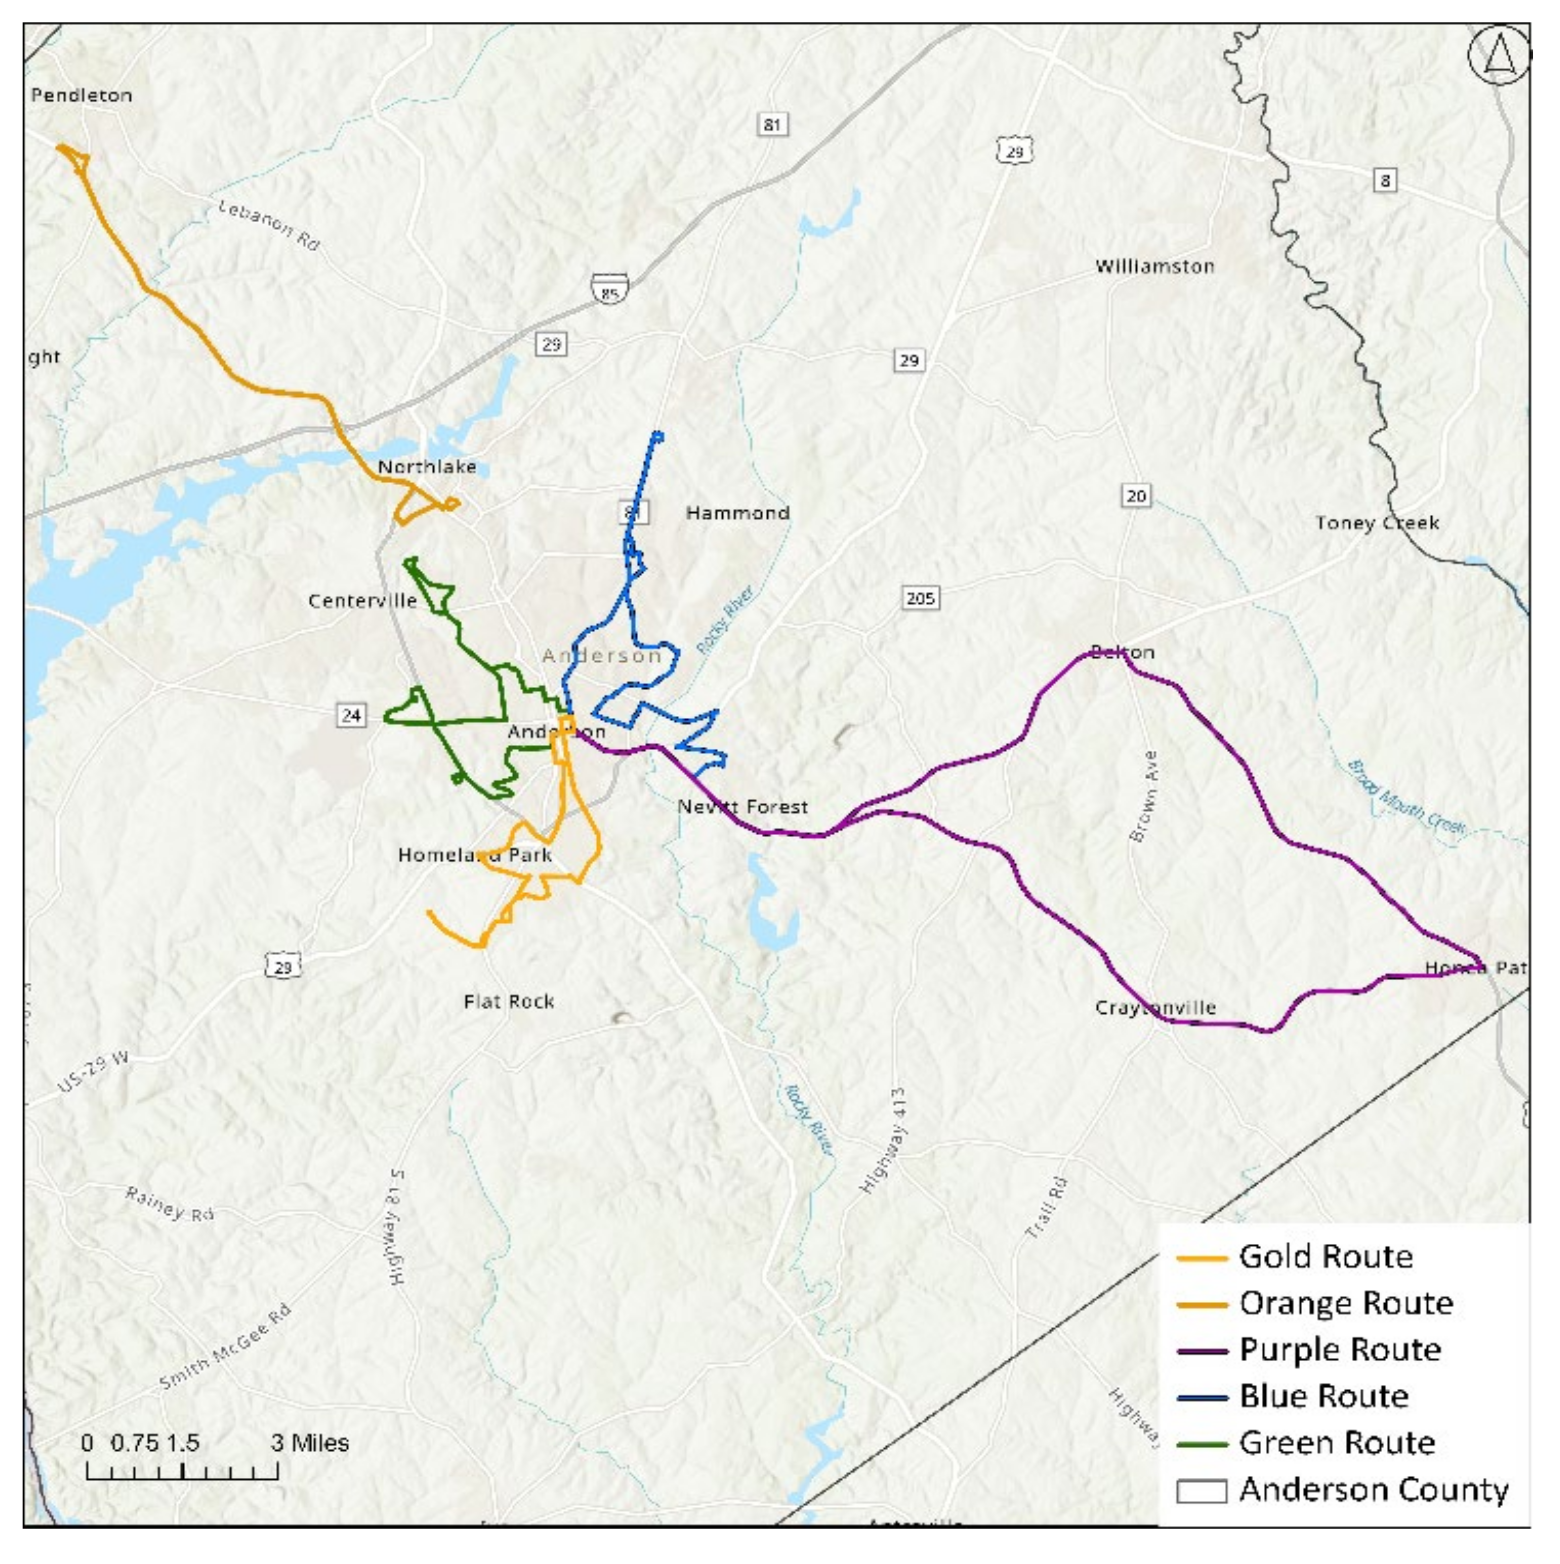
Public transportation is essential for people who do not own cars or other means of transport. Public transportation routes are predetermined, and buses operate along these fixed routes within their scheduled timeframes. The six public transit routes—gold route; orange route; purple route; red route; blue route; and green route—in Anderson County are shown in Figure 33.

4.3.2. Flood Response and Recovery

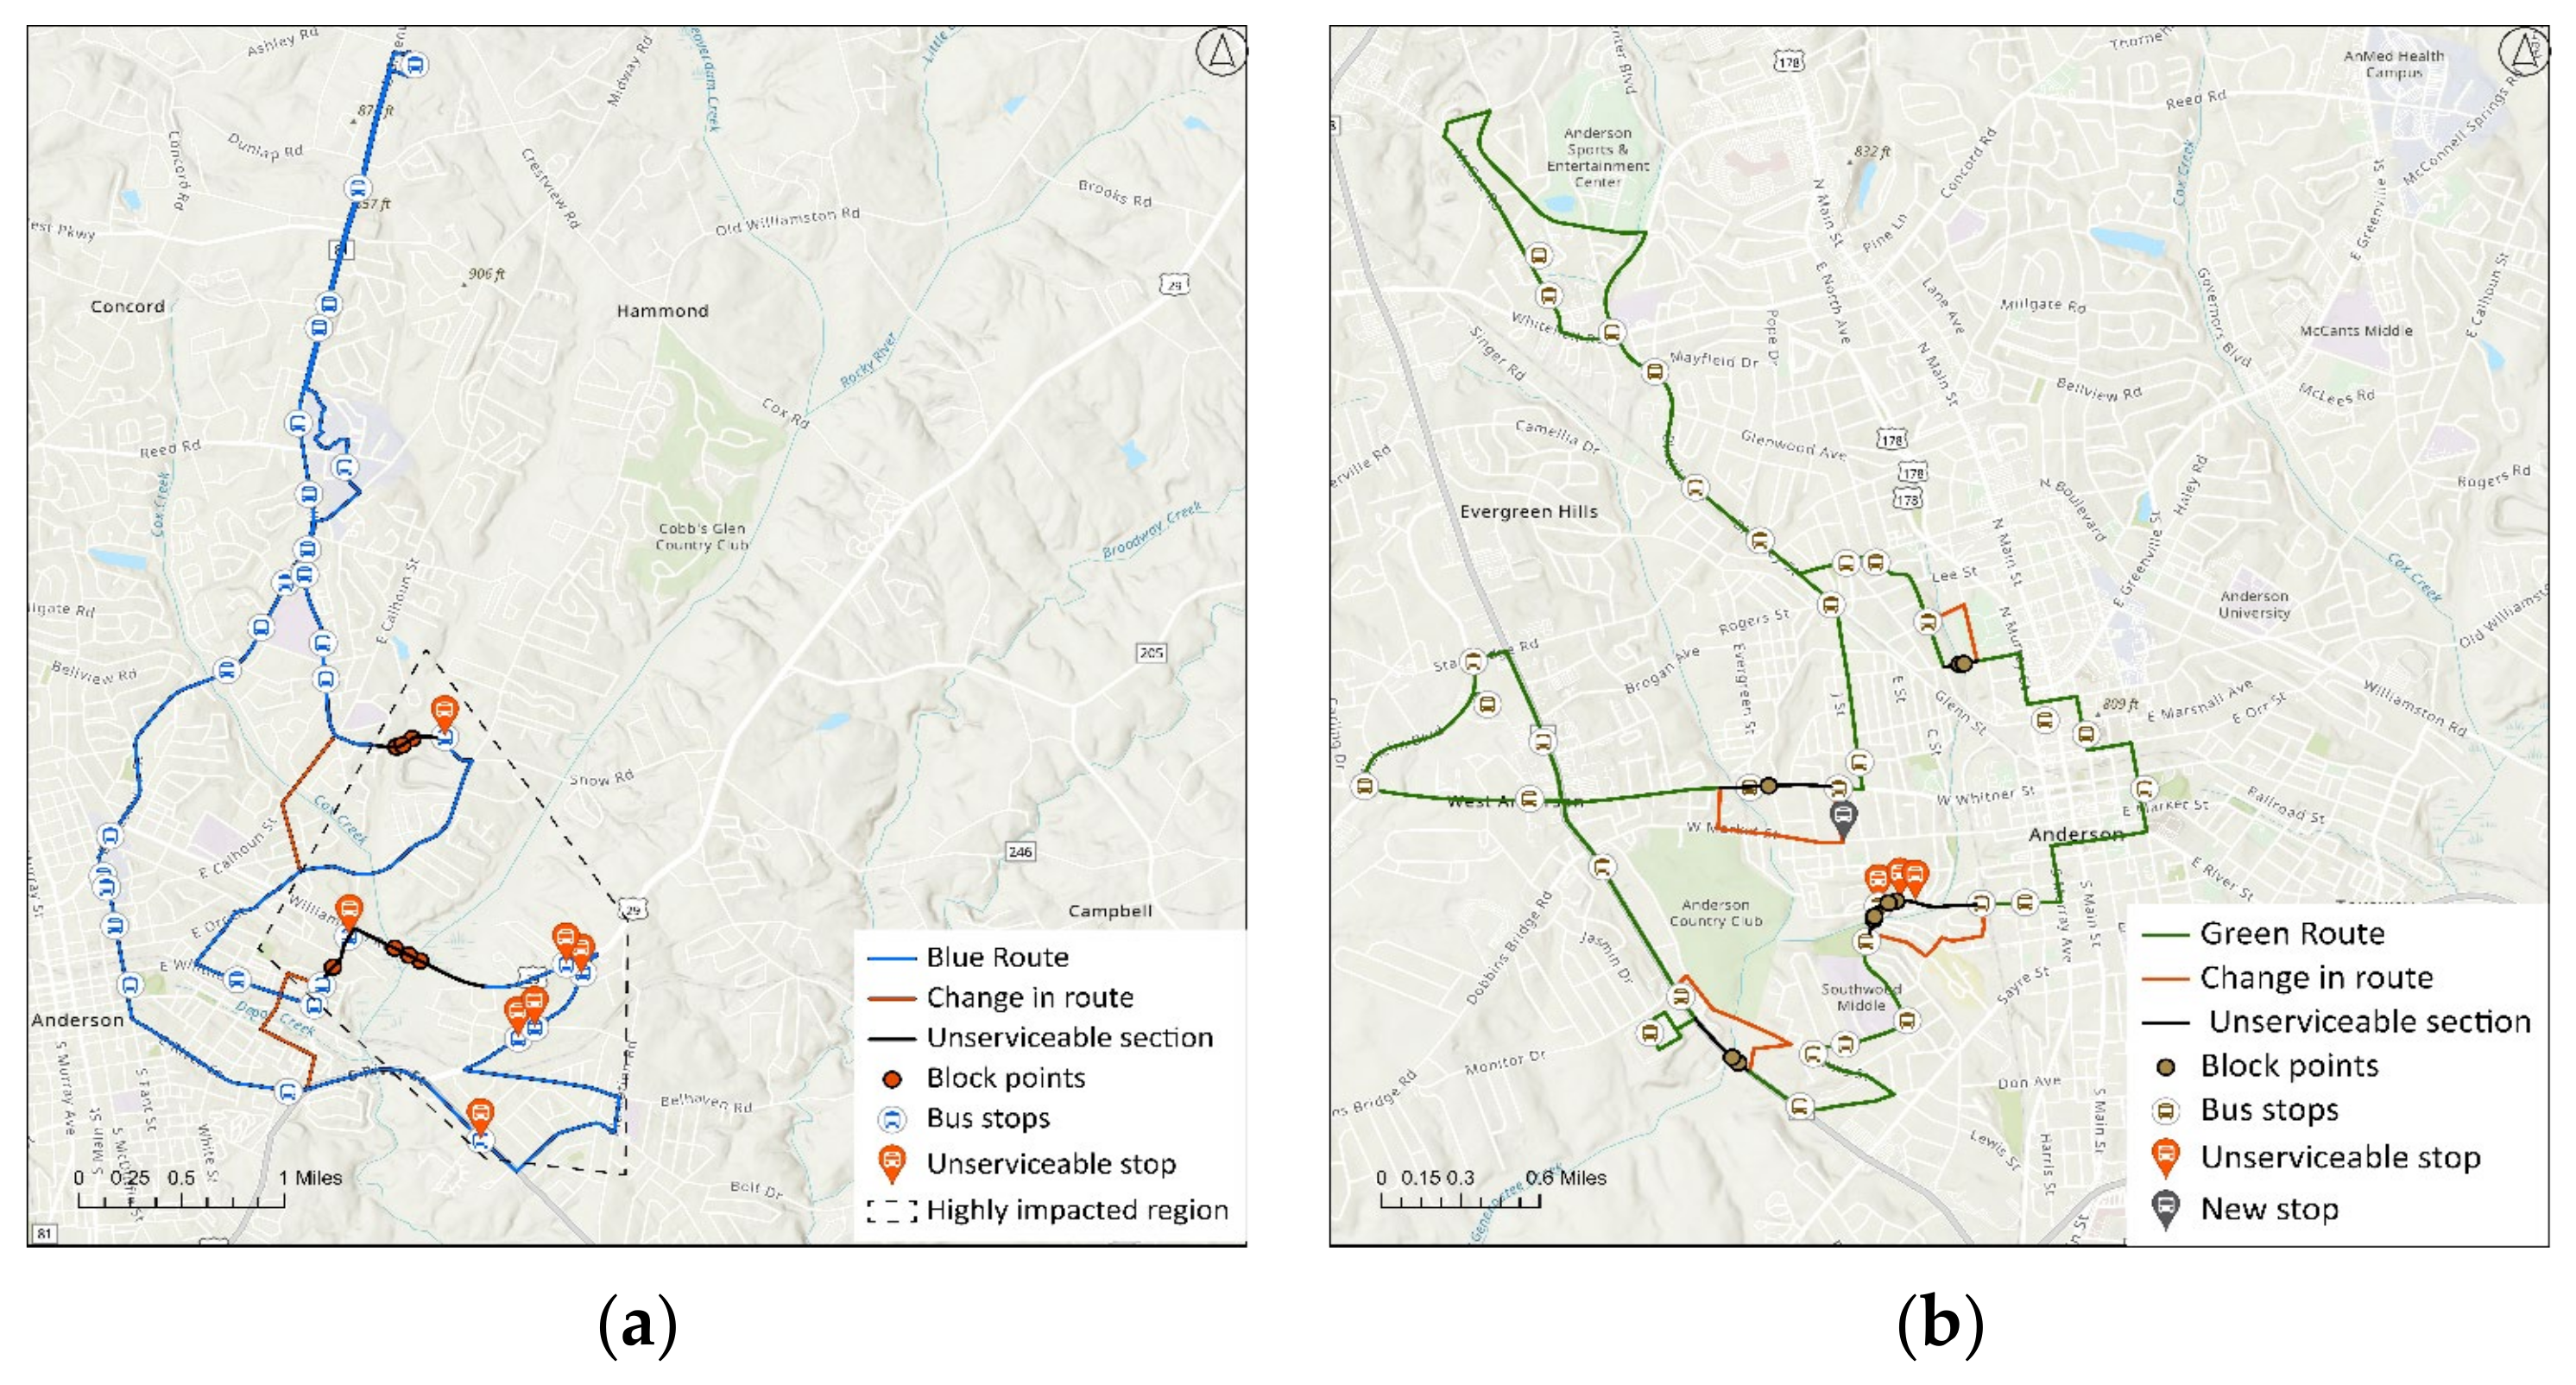
The routes were impacted differently based on the barriers on the individual routes. Orange and red routes were not affected by the flood. Figure 34a,b, Figure 35a and Figure 36b show how the bus routes were impacted and how the stops can be served by changing the route.
To serve all the stops on the gold route, the existing route can be changed, as shown in Figure 34a. No new bus stops need to be introduced. The existing population can be served by the addition of a segment of 1.90 miles (3.06 km).
Two barriers on the purple route caused the change in route. Due to the blockage, a route segment of 5.44 miles (8.75 km) should be taken instead of 1.88 miles (3.02 km) for the first barrier, increasing the route by 3.56 miles (5.73 km). For the second barrier, the route segment could be changed from 1.13 miles (1.82 km) to 2.65 miles (4.26 km) (increment of 1.52 miles (2.44 km)) to serve all bus stops (see Figure 34b). New bus stops can also be incorporated into these newly added route sections to serve even more of the population.
While the blue route can be changed to serve most of the existing bus stops, seven stops cannot be served by the existing route or minor changes in the route (see Figure 35a). To serve the bus stops other than those seven, a new length of 2.05 miles (3.30 km) was introduced to avoid the potentially impacted region and serve the existing servable bus stops. The area on the eastern side of the Rocky River was highly impacted because of the barriers near the Rocky River. If these barriers are removed, most of the area can be served except the bus stop on the northern side of the highly impacted region (see Figure 35a).
The green route faces the most challenges in rerouting around the barriers. Even then, three bus stops were unserviceable due to the barriers marked by a dark orange pin in Figure 35b. To accommodate people near the bus stops, a new bus reroute is suggested, and the new bus stop is noted by a dark green pin (see Figure 35b). An addition of 2.67 miles (4.30 km) of new road sections is needed to serve all the serviceable bus stops.

4.4. Change in the Criticality of Roads

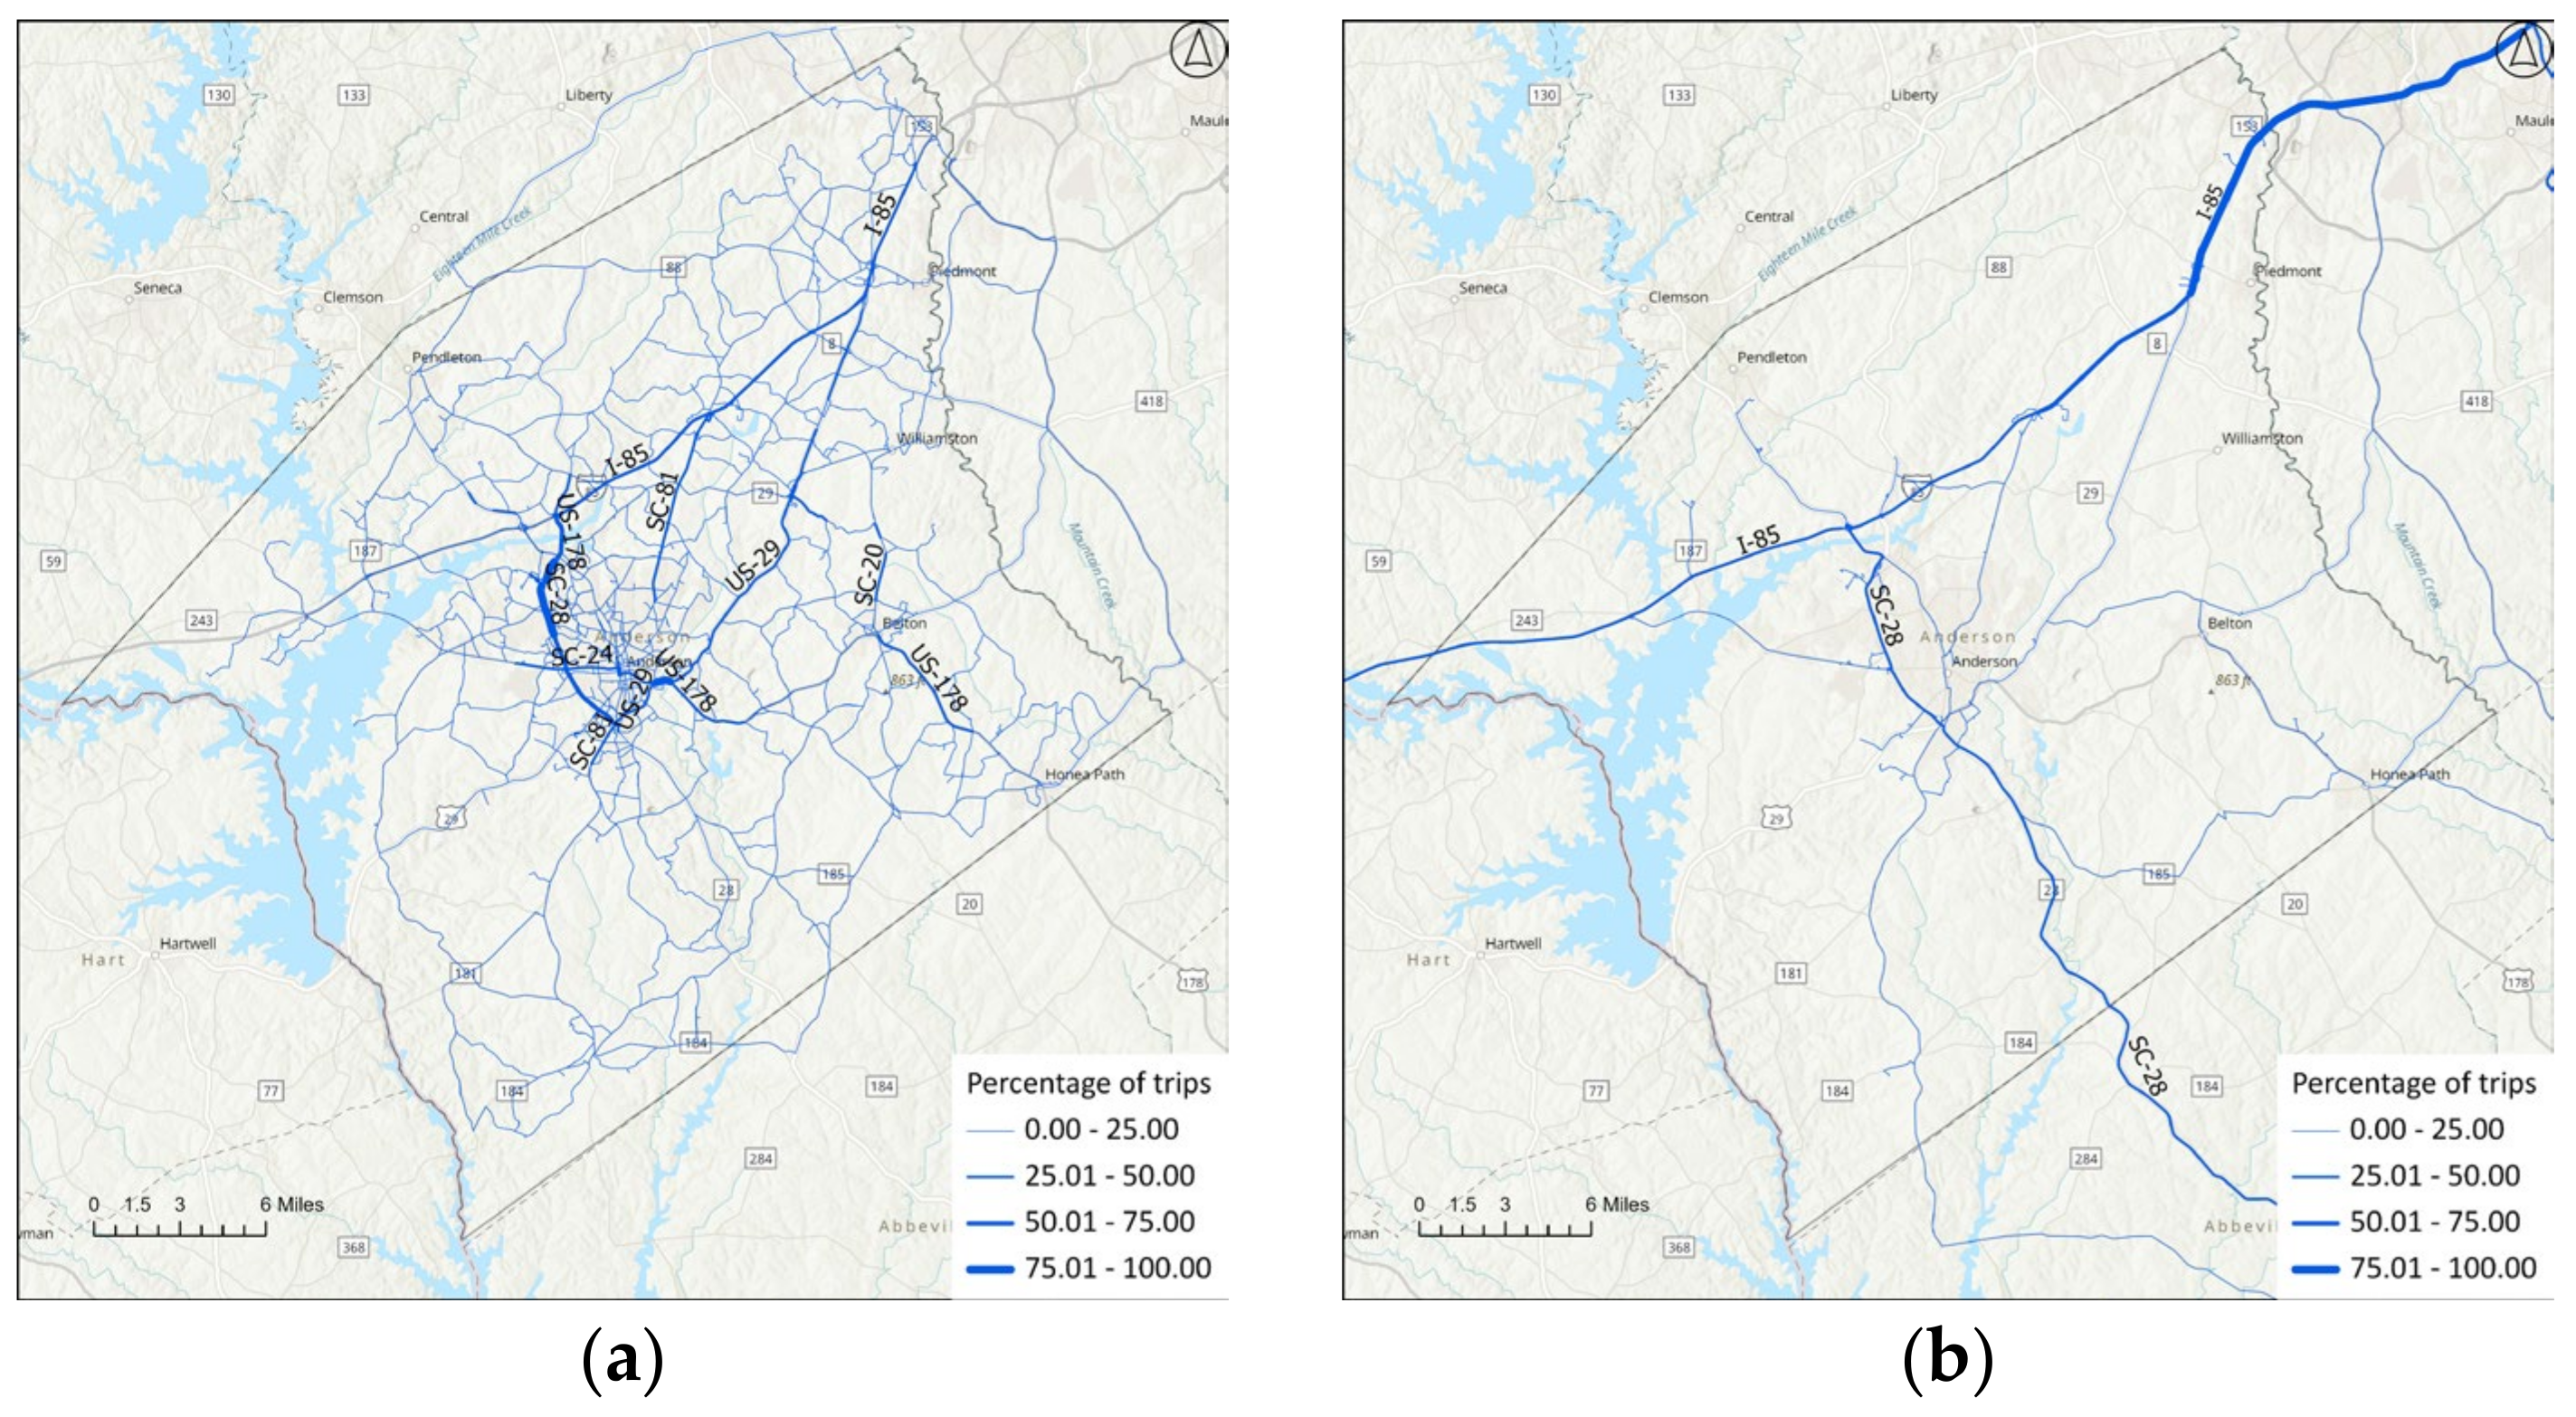
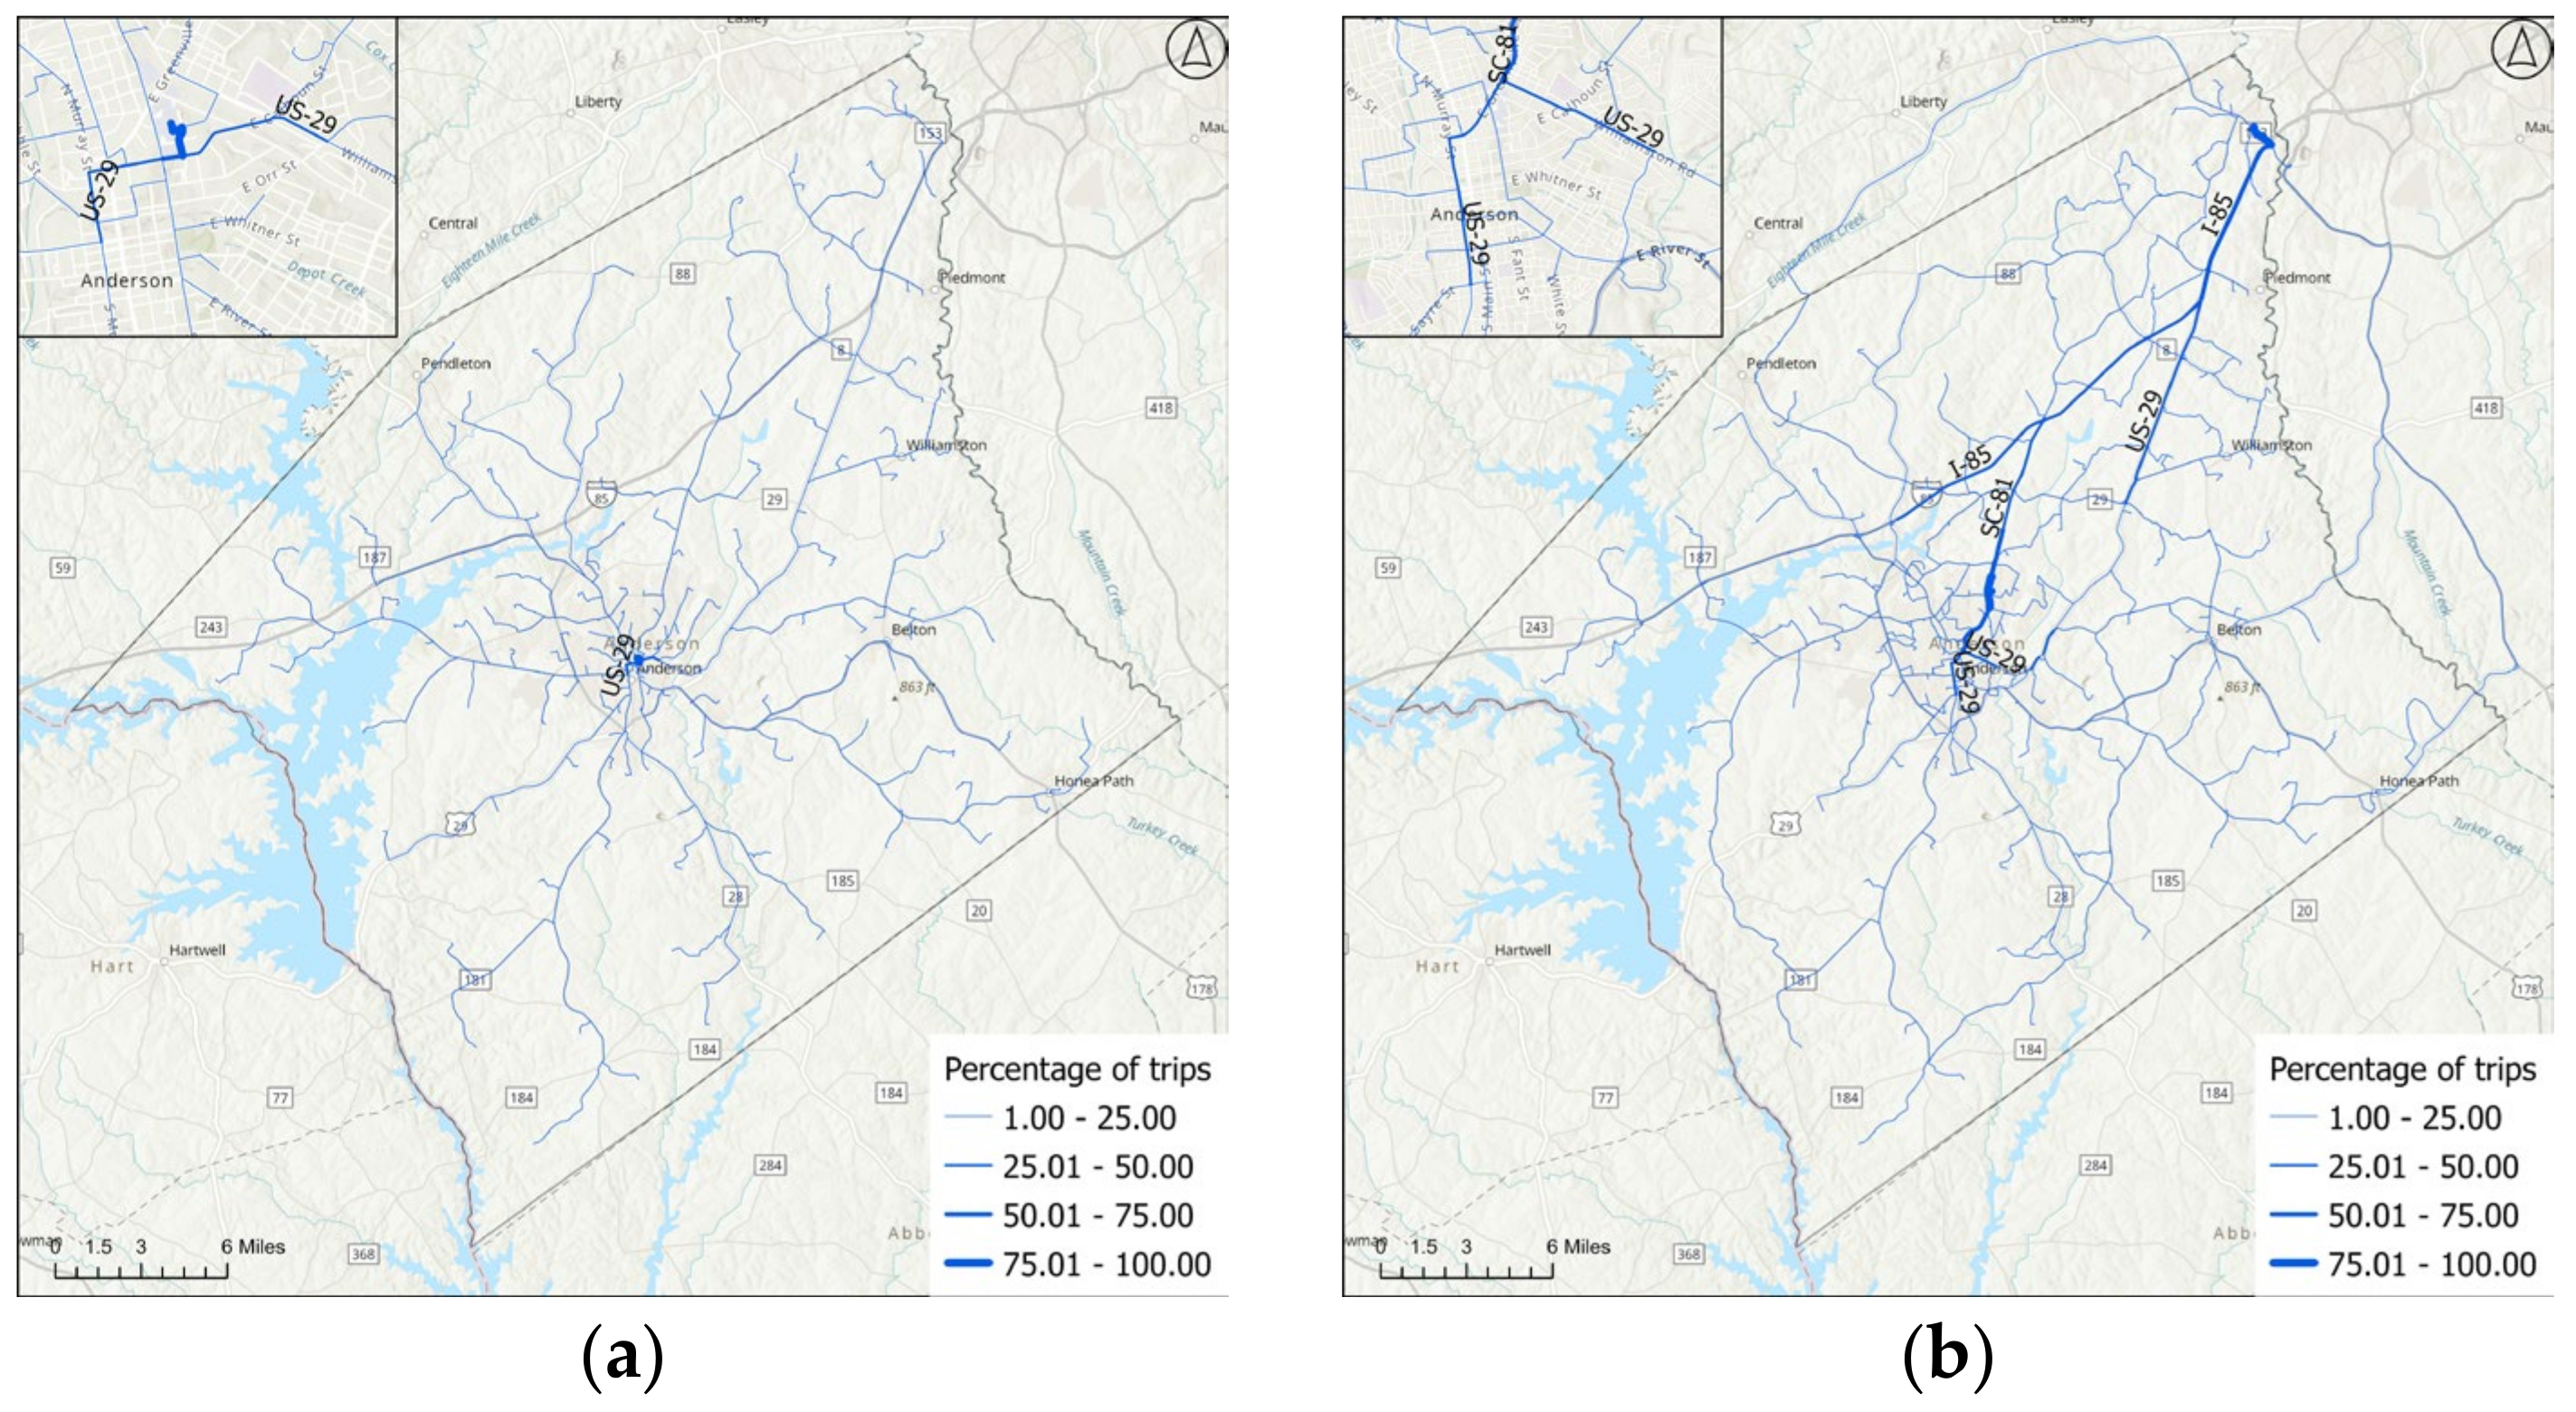
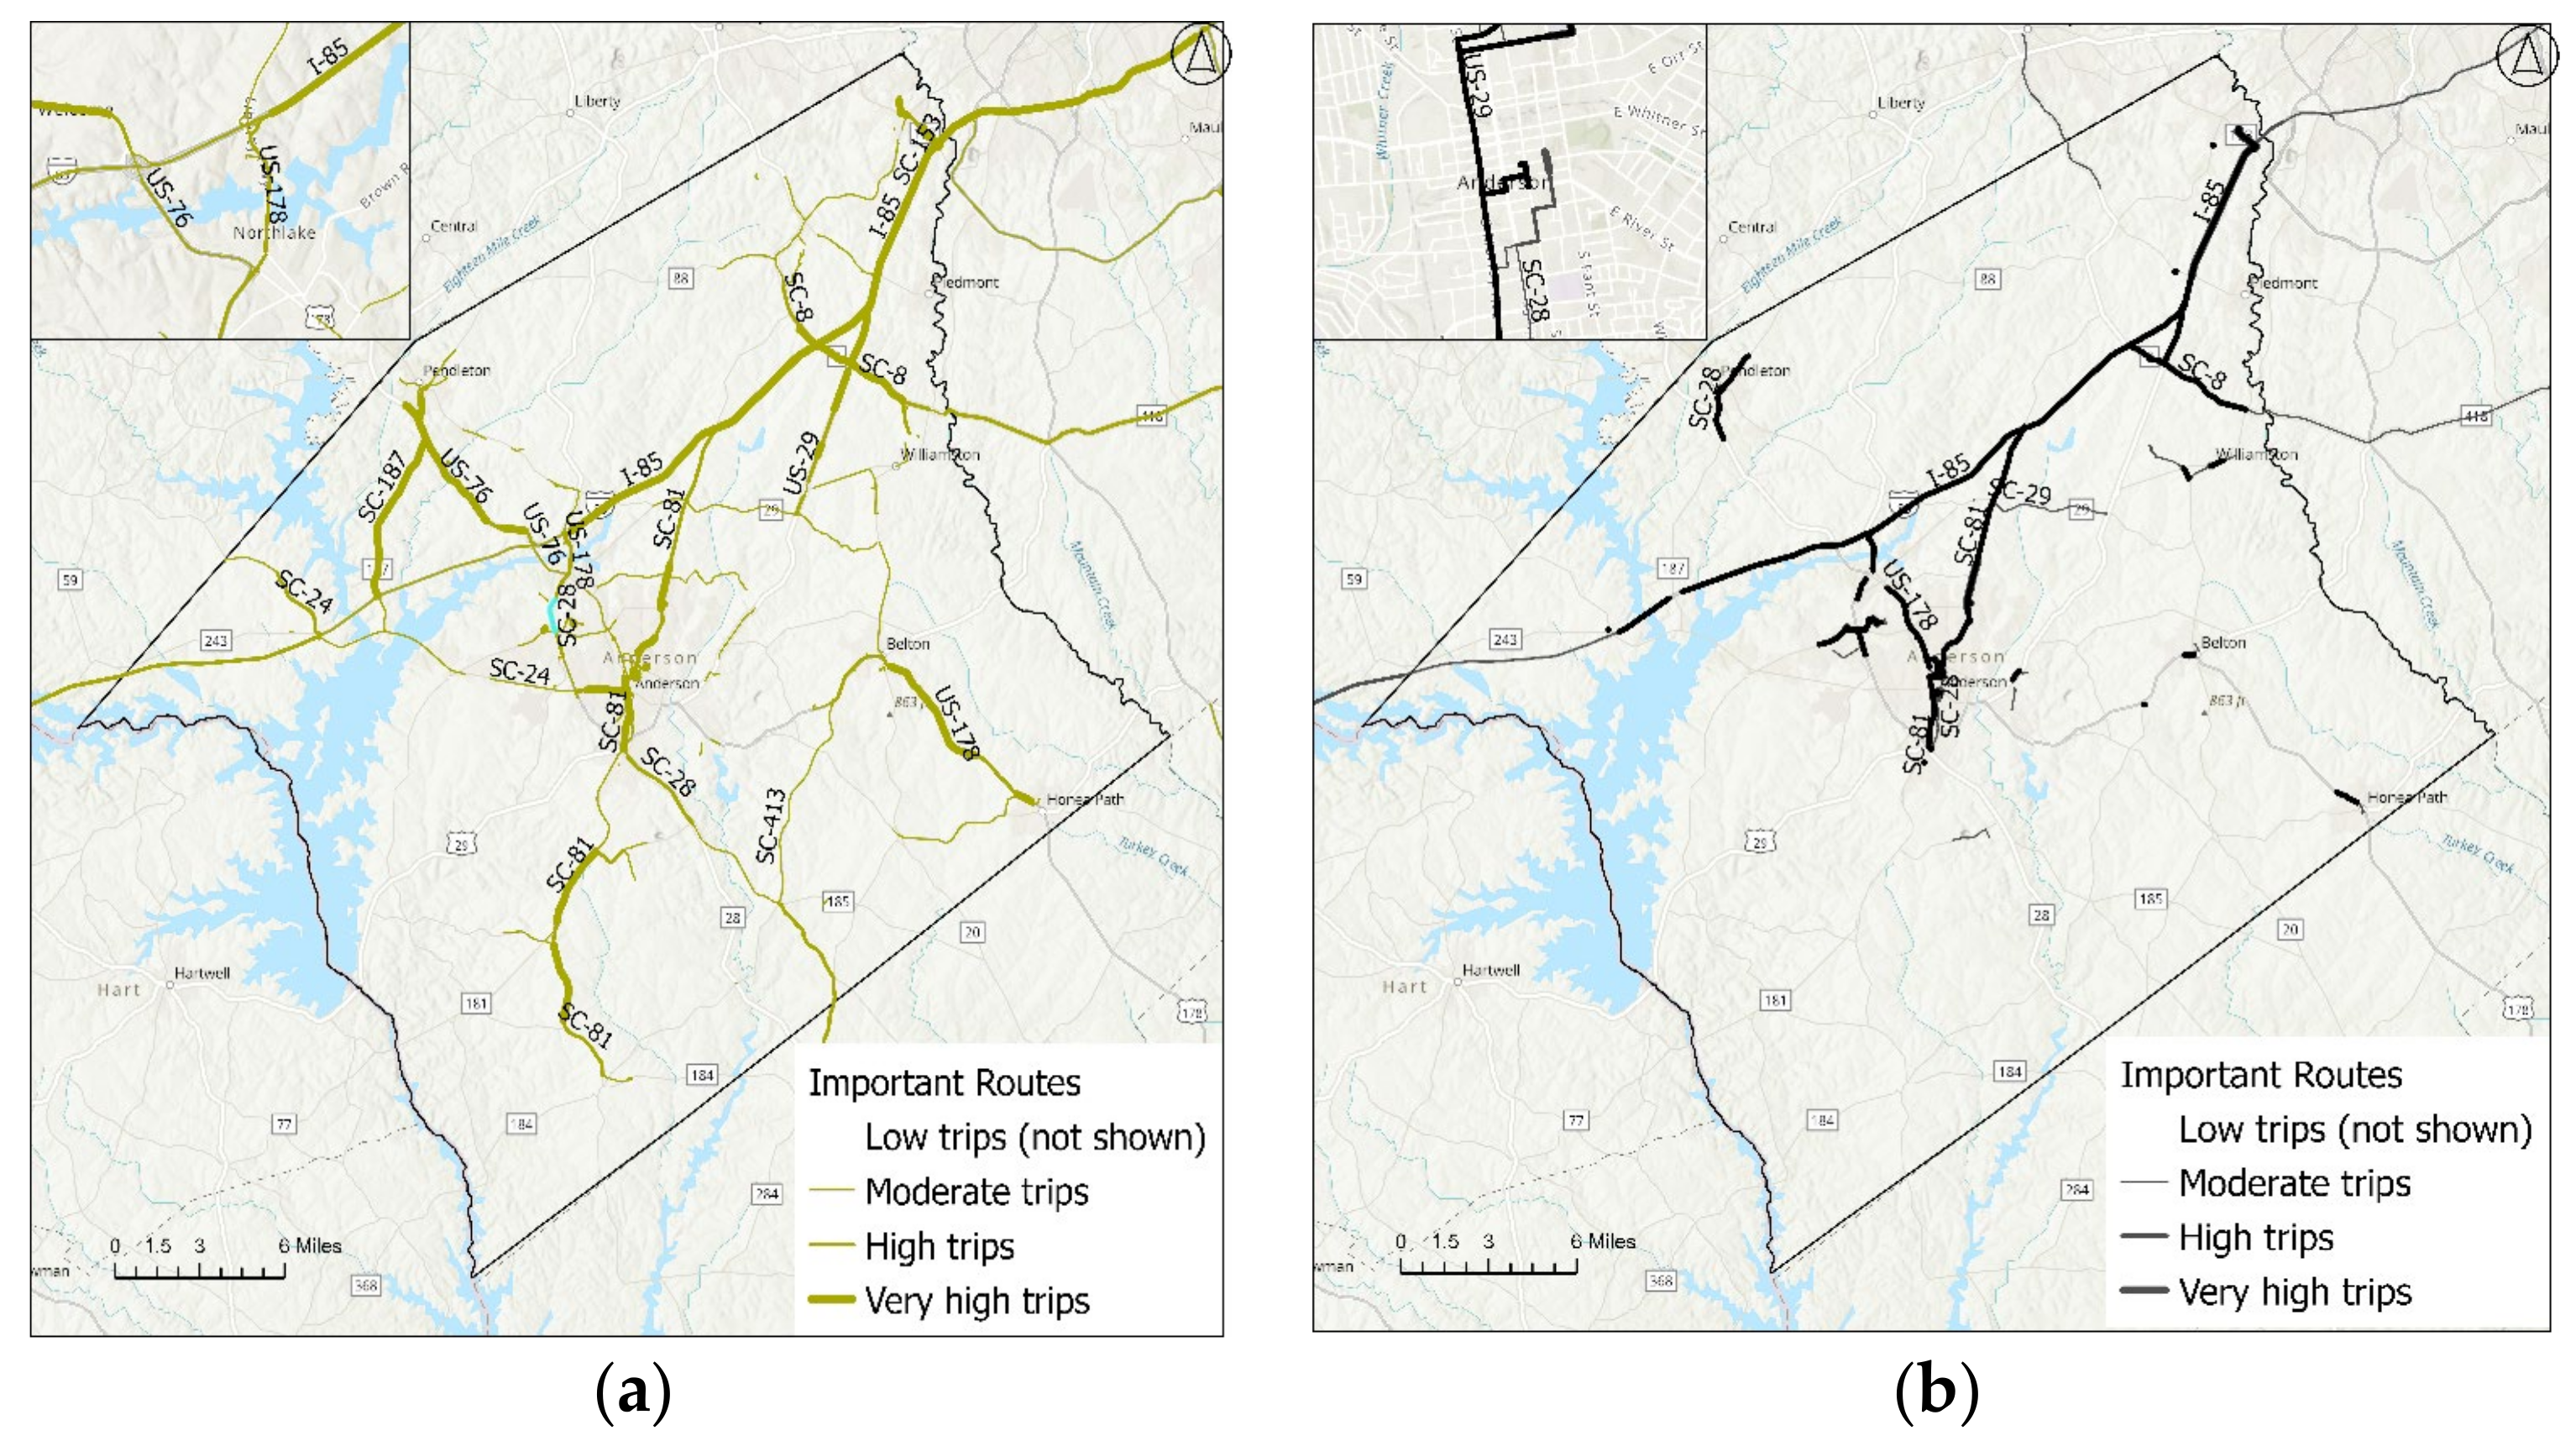
To visualize the critical roads across various phases of disaster management, we merged the important roads for all the purposes in each phase. We show only normalized betweenness centrality values greater than 25 for each phase (see the legend “Low trips” in Figure 36a,b and Figure 37a). For identifying critical roads, we merged those from each trip purpose’s analysis: for un-flooded conditions (Figure 36a), we combined roads from Figure 5, Figure 6, Figure 7, Figure 8 and Figure 9; for response conditions (Figure 36b), we combined Figure 11, Figure 12 and Figure 13; and for recovery conditions (Figure 37a), we combined Figure 14, Figure 15, Figure 16, Figure 17, Figure 18 and Figure 19.
Figure 36a illustrates the un-flooded routes, showcasing the typical daily route choices for community operations. In this context, major highways, including state and federal highways, as well as interstates, take on a significant role.
In the response phase, since the local and secondary roads were mostly impacted by the flood, the route choice diverted mostly to the major highways. I-85 became important, and the routes leading from the interstate to Anderson City were also critical (Figure 36b).
In the recovery phase, most of the high-capacity roads that were previously being used before the flood in high numbers were being used in the recovery phase as well. Also, since Anderson City has many barriers, the route choices to enter the city decreased, which can be seen by comparing Figure 36a and Figure 37a. The thicker routes in the Anderson City area are less visible in Figure 37a than in Figure 36a because of the barriers present on those other roads. Because of the limited choices, the few roads that let people enter the city were critical. Also, comparing Figure 36a and Figure 37a shows how the flood impacts the normal routes of people or material delivery.
Figure 36a,b, and Figure 37a show the criticality of road sections changing across the flood phases. As the common roads for all the phases are very critical for a community, we identified the common roads that have high normalized betweenness centrality values across all three phases, which were found to be I-85, SC-81, SC-28, US-178, and SC-8. Figure 37b shows the roads that have high criticality across all phases.

5. Discussion and Conclusions

This study analyzed road criticality for diverse transportation purposes across un-flooded, flood response, and recovery phases. Road usage and rerouting needs differ by trip purpose within each stage of the disaster. A 100-year flood served as an illustrative hazard to model network disruption.
Flooding affects various road sections, rendering them impassable and causing traffic to reroute, incurring additional travel time. The additional travel time varies depending on the trip’s purpose and the number of routes from the origin to the destination. The availability of alternate routes helps reduce the rerouting distance. However, the severity of impacts on major arterials and highways like interstates and federal or state highways can significantly increase the rerouting distance, especially if options are limited.
The criticality of roads in our study area changes across the un-flooded, response, and recovery phases. In the un-flooded phase, major highways like I-85, State Highway 28, State Highway 81, and Federal Highway 29 are most critical for regular activities like accessing workplaces and material movement. The roads in Anderson City are critical for hospital accessibility. For the response phase, the criticality shifts slightly—roads within Anderson City also become very important for police accessibility and ambulances; routes like Highway 29 increase in criticality. Evacuation routes like I-85 have also become more critical. Major highways like Highway 178 and State Highway 8, connecting to hospitals, are essential for medical access. In the recovery phase, accessibility needs change again. While I-85 and major highways like Highway 29 remain critical for activities like work commutes, roads like Highways 81, 29, 76, 178, and sections of Highway 28 become more important for school, workforce, and park access. Throughout the phases, I-85 stands out as consistently highly critical as a major interstate facilitating movement. Some local roads fluctuate in importance, depending on needs. Roads facilitating evacuation and hospital access are most critical in the response phase, specifically.
This analysis can also help identify the critical roads that are common during the un-flooded, response, and recovery phases of a disaster. These roads should ideally be in operating condition during any of the disaster phases to support efficient traffic management. If these road sections are blocked or unpassable, then the community will be highly impacted in terms of the rerouting time. Based on the criticality of the roads, the high-capacity roads coming to Anderson City or going out of the city were more critical. The major highways connecting the central business districts to the other regions are critical for either the normal functioning of the community or the response and recovery of the disaster. The criticality of roads also depends on the spread of the facilities. As we found for grocery stores and fire stations, as the facilities are distributed across the county, the roads start to show almost equal criticality. The interstate (I-85) was critical to the functioning of this study area. Various highways, such as SC-81, US-29, US-178, and US-76 to SC-28, connecting the interstate to Anderson City, were also critical across all phases.
The analysis for parks and grocery stores indicated that the spread and higher number of facilities significantly reduced the additional travel time due to the availability of more choices. The Anderson City area, southeastern, and southern areas seem to contain the highly impacted Census block groups for multiple purposes.
For public transit, the impacts can be such that some bus stops could be unserviceable and the routes non-traversable. The change in routes can be small (gold route) or larger with greater impact (green and blue route). This study can help identify such disruptions beforehand and plan to improve the transit line’s resilience.
There are commonalities in the impact area for transportation purposes; these commonalities are more crucial for building resilience in the community. Maintaining and rebuilding (if needed) the roads that are common to most of the trip purposes based on the high betweenness centrality value can provide a broader benefit to the community for a given investment level. Also, by identifying the blocked locations for each purpose, we can prioritize the locations for recovery actions so that most of the trip purposes benefit. For instance, the bridge on the Rocky River near Anderson City impacted most of the trips and caused high rerouting times in our analysis. If that bridge is disrupted, then the priority of repairing that bridge should be high so that the community can recover faster. Making such prioritization decisions can help manage transportation disruptions efficiently. Also, in the event that any community chooses to prioritize one purpose over another, a similar analysis can help them locate the sections critical for their focused transportation purpose. This overall methodology, with consideration of limitations, can be replicated to see the impacts of flooding on transportation in a community to aid in making plans and resilient decisions.
Cutter [82,83] mentioned that for society to be sustainable, disaster risk management and resilience play an important role [83]. This study supports sustainable transportation and planning for community resilience by identifying the critical road links for a community. The analyses can inform traffic management during flooding and the prioritization of recovery at disrupted locations.
Some limitations to the analysis exist. The first is that during a disaster, the roads might be crowded, causing traffic to diverge to reduce congestion. Congestion was not considered in this analysis. Another limitation is that only barriers in Anderson County were considered, due to which the full picture of the impacts was not shown. Another limitation is that we considered the cutoff depth for road blockage to be 30 cm, but some of the vehicles could be higher than 30 cm. In the case of larger vehicles, the road blockage might not be applicable, given that the road is not destroyed in some way. Another limitation is the use of a uniform threshold value of 2.7 min for all transportation purposes. This decision was made due to the absence of research establishing specific thresholds for individual purposes and being consistent. Future studies could enhance the accuracy of the analysis by determining purpose-specific thresholds. A final limitation is the assumption that the driver will have prior knowledge about the barriers, which might not be true for the first few trips when people tend to use their original routes and change based on the barriers faced.
In the future, travel demand could be added to the analysis to consider congestion. The whole river basin could be analyzed to provide more accurate results about the materials and out-of-county trips. The depth disruption function provided by [51] can be used to decrease the speed of vehicles while traveling on a flooded road section with a depth less than 30 cm. This threshold can be adjusted for goods and passenger movement, considering the higher ground clearance of trucks. Furthermore, research could investigate the potential for road destruction due to flooding, considering factors like the existing design and quality of the road. Additionally, exploring rerouting behavior in the first few trips after a flood, starting from the initial blockage, can shed light on how traffic adapts during the critical flood response phase.

Author Contributions

Conceptualization, all; methodology, all; formal analysis, N.B.; resources, P.M.-T.; data curation, N.B.; writing—original draft preparation, N.B.; writing—review and editing, S.H.T. and P.M.-T.; visualization, N.B. and S.H.T.; supervision, P.M.-T. and S.H.T.; project administration, P.M.-T.; funding acquisition, P.M.-T. All authors have read and agreed to the published version of the manuscript.

Funding

This research was partially funded by the U.S. Army Engineer Research and Development Center, number W912HZ2220034, for which the authors are grateful; however, the content of this paper is solely the responsibility of the authors. The APC was waived.

Institutional Review Board Statement

Not applicable.

Informed Consent Statement

Not applicable.

Data Availability Statement

Data are available from the original providers—see Table 2.

Acknowledgments

The authors extend sincere thanks to Kevin Autry for his help and support in calculating the road and bridge elevations in Anderson County.

Conflicts of Interest

The funders had no role in the design of this study, in the collection, analysis, or interpretation of data, in the writing of this manuscript, or in the decision to publish these results.

References

  1. Community Lifelines|FEMA.gov. Available online: https://www.fema.gov/emergency-managers/practitioners/lifelines (accessed on 24 July 2023).
  2. Stocker, T.F.; Intergovernmental Panel on Climate Change. Working Group I. Climate Change 2013: Summary for Policymakers, a Report of Working Group I of the IPCC; WMO: Geneva, Switzerland; UNEP: Nairobi, Kenya, 2013. [Google Scholar]
  3. Ji, T.; Yao, Y.; Dou, Y.; Deng, S.; Yu, S.; Zhu, Y.; Liao, H. The Impact of Climate Change on Urban Transportation Resilience to Compound Extreme Events. Sustainability 2022, 14, 3880. [Google Scholar] [CrossRef]
  4. Watson, G.; Ahn, J.E. A Systematic Review: To Increase Transportation Infrastructure Resilience to Flooding Events. Appl. Sci. 2022, 12, 12331. [Google Scholar] [CrossRef]
  5. Jakubcová, A.; Grežo, H.; Hrešková, A.; Petrovič, F. Impacts of Flooding on the Quality of Life in Rural Regions of Southern Slovakia. Appl. Res. Qual. Life 2016, 11, 221–237. [Google Scholar] [CrossRef]
  6. Boakye, J.; Guidotti, R.; Gardoni, P.; Murphy, C. The role of transportation infrastructure on the impact of natural hazards on communities. Reliab. Eng. Syst. Saf. 2022, 219, 108184. [Google Scholar] [CrossRef]
  7. Ulusan, A.; Ergun, O. Restoration of services in disrupted infrastructure systems: A network science approach. PLoS ONE 2018, 13, e0192272. [Google Scholar] [CrossRef] [PubMed]
  8. Tachaudomdach, S.; Upayokin, A.; Kronprasert, N.; Arunotayanun, K. Quantifying Road-Network Robustness toward Flood-Resilient Transportation Systems. Sustainability 2021, 13, 3172. [Google Scholar] [CrossRef]
  9. Zope, P.E.; Eldho, T.I.; Jothiprakash, V. Hydrological impacts of land use–land cover change and detention basins on urban flood hazard: A case study of Poisar River basin, Mumbai, India. Nat. Hazards 2017, 87, 1267–1283. [Google Scholar] [CrossRef]
  10. Alexander, D. Disaster and Emergency Planning for Preparedness, Response, and Recovery; Oxford University Press: Oxford, UK, 2015. [Google Scholar] [CrossRef]
  11. FHWA. FHWA Order 5520: Transportation System Preparedness and Resilience to Climate Change and Extreme Weather Events. Available online: https://www.fhwa.dot.gov/legsregs/directives/orders/5520.cfm (accessed on 30 June 2023).
  12. Crutchfield, M. Phases of Disaster Recovery: Emergency Response for the Long Term—World|ReliefWeb,” UMCOR. Available online: https://reliefweb.int/report/world/phases-disaster-recovery-emergency-response-long-term (accessed on 25 July 2023).
  13. Colon, C.; Hallegatte, S.; Rozenberg, J. Criticality analysis of a country’s transport network via an agent-based supply chain model. Nat. Sustain. 2021, 4, 209–215. [Google Scholar] [CrossRef]
  14. Oh, E.H.; Deshmukh, A.; Hastak, M. Criticality Assessment of Lifeline Infrastructure for Enhancing Disaster Response. Nat. Hazards Rev. 2013, 14, 98–107. [Google Scholar] [CrossRef]
  15. SEMCOG. Climate Resiliency and Flooding Mitigation Study Climate Resiliency and Flooding Mitigation Study. 2020. Available online: www.semcog.org (accessed on 1 November 2023).
  16. Hallegatte, S.; Rentschler, J.; Rozenberg, J. Lifelines: The Resilient Infrastructure Opportunity; World Bank: Washington, DC, USA, 2019; ISBN 9781464814303. [Google Scholar]
  17. Pyatkova, K.; Chen, A.S.; Butler, D.; Vojinović, Z.; Djordjević, S. Assessing the knock-on effects of flooding on road transportation. J. Environ. Manag. 2019, 244, 48–60. [Google Scholar] [CrossRef]
  18. Suarez, P.; Anderson, W.; Mahal, V.; Lakshmanan, T. Impacts of flooding and climate change on urban transportation: A systemwide performance assessment of the Boston Metro Area. Transp. Res. Part D Transp. Environ. 2005, 10, 231–244. [Google Scholar] [CrossRef]
  19. Affleck, A.; Gibbon, J. Workington: A case study in coordination and communication. Proc. Inst. Civ. Eng. Munic. Eng. 2016, 169, 109–117. [Google Scholar] [CrossRef]
  20. Bubeck, P.; Otto, A.; Weichselgartner, J. Societal Impacts of Flood Hazards. In Oxford Research Encyclopedia of Natural Hazard Science; Oxford University Press: Oxford, UK, 2017. [Google Scholar] [CrossRef]
  21. Yin, J.; Yu, D.; Liao, B. A city-scale assessment of emergency response accessibility to vulnerable populations and facilities under normal and pluvial flood conditions for Shanghai, China. Environ. Plan. B Urban Anal. City Sci. 2021, 48, 2239–2253. [Google Scholar] [CrossRef]
  22. Tsang, M.; Scott, D.M. An integrated approach to modeling the impact of floods on emergency services: A case study of Calgary, Alberta. J. Transp. Geogr. 2020, 86, 102774. [Google Scholar] [CrossRef]
  23. Yu, D.; Yin, J.; Wilby, R.L.; Lane, S.N.; Aerts, J.C.J.H.; Lin, N.; Liu, M.; Yuan, H.; Chen, J.; Prudhomme, C.; et al. Disruption of emergency response to vulnerable populations during floods. Nat. Sustain. 2020, 3, 728–736. [Google Scholar] [CrossRef]
  24. Dong, S.; Esmalian, A.; Farahmand, H.; Mostafavi, A. An integrated physical-social analysis of disrupted access to critical facilities and community service-loss tolerance in urban flooding. Comput. Environ. Urban Syst. 2020, 80, 101443. [Google Scholar] [CrossRef]
  25. Gangwal, U.; Siders, A.R.; Horney, J.; Michael, H.A.; Dong, S. Critical facility accessibility and road criticality assessment considering flood-induced partial failure. Sustain. Resilient Infrastruct. 2023, 8, 337–355. [Google Scholar] [CrossRef]
  26. He, Y.; Thies, S.; Avner, P.; Rentschler, J. Flood impacts on urban transit and accessibility—A case study of Kinshasa. Transp. Res. Part D Transp. Environ. 2021, 96, 102889. [Google Scholar] [CrossRef]
  27. Burnside, R.; Miller, D.S.; Rivera, J.D. The impact of information and risk perception on the Hurricane evacuation decision-making of greater New Orleans residents. Sociol. Spectr. 2007, 27, 727–740. [Google Scholar] [CrossRef]
  28. Trumbo, C.; Meyer, M.A.; Marlatt, H.; Peek, L.; Morrissey, B. An Assessment of Change in Risk Perception and Optimistic Bias for Hurricanes Among Gulf Coast Residents. Risk Anal. 2014, 34, 1013–1024. [Google Scholar] [CrossRef] [PubMed]
  29. Tanim, S.H.; Tobin, G.A. Social Factors and Evacuation Vulnerability: An Application in Pinellas County, Florida. Pap. Appl. Geogr. 2018, 4, 123–136. [Google Scholar] [CrossRef]
  30. Cox, R.S.; Perry, K.-M.E. Like a Fish Out of Water: Reconsidering Disaster Recovery and the Role of Place and Social Capital in Community Disaster Resilience. Am. J. Community Psychol. 2011, 48, 395–411. [Google Scholar] [CrossRef] [PubMed]
  31. Silver, A.; Grek-Martin, J. “Now we understand what community really means”: Reconceptualizing the role of sense of place in the disaster recovery process. J. Environ. Psychol. 2015, 42, 32–41. [Google Scholar] [CrossRef]
  32. Ganin, A.A.; Kitsak, M.; Marchese, D.; Keisler, J.M.; Seager, T.; Linkov, I. Resilience and efficiency in transportation networks. Sci. Adv. 2017, 3, e1701079. [Google Scholar] [CrossRef]
  33. Faturechi, R.; Miller-Hooks, E. Measuring the Performance of Transportation Infrastructure Systems in Disasters: A Comprehensive Review. J. Infrastruct. Syst. 2015, 21, 04014025. [Google Scholar] [CrossRef]
  34. Croope, S.V.; McNeil, S. Improving Resilience of Critical Infrastructure Systems Postdisaster. Transp. Res. Rec. J. Transp. Res. Board 2011, 2234, 3–13. [Google Scholar] [CrossRef]
  35. Murray-Tuite, P.M. A comparison of transportation network resilience under simulated system optimum and user equilibrium conditions. In Proceedings of the 2006 Winter Simulation Conference, Monterey, CA, USA, 3–6 December 2006; pp. 1398–1405. [Google Scholar]
  36. Faturechi, R.; Miller-Hooks, E. A Mathematical Framework for Quantifying and Optimizing Protective Actions for Civil Infrastructure Systems. Comput. Civ. Infrastruct. Eng. 2013, 29, 572–589. [Google Scholar] [CrossRef]
  37. Adams, T.M.; Bekkem, K.R.; Toledo-Durán, E.J. Freight Resilience Measures. J. Transp. Eng. 2012, 138, 1403–1409. [Google Scholar] [CrossRef]
  38. Almotahari, A.; Yazici, A. A computationally efficient metric for identification of critical links in large transportation networks. Reliab. Eng. Syst. Saf. 2021, 209, 107458. [Google Scholar] [CrossRef]
  39. Zhang, N.; Alipour, A. Integrated Framework for Risk and Resilience Assessment of the Road Network under Inland Flooding. Transp. Res. Rec. J. Transp. Res. Board 2019, 2673, 182–190. [Google Scholar] [CrossRef]
  40. Testa, A.C.; Furtado, M.N.; Alipour, A. Resilience of Coastal Transportation Networks Faced with Extreme Climatic Events. Transp. Res. Rec. J. Transp. Res. Board 2015, 2532, 29–36. [Google Scholar] [CrossRef]
  41. Freeman, L.C. A Set of Measures of Centrality Based on Betweenness. Sociometry 1977, 40, 35–41. [Google Scholar] [CrossRef]
  42. Gauthier, P.; Furno, A.; El Faouzi, N.-E. Road Network Resilience: How to Identify Critical Links Subject to Day-to-Day Disruptions. Transp. Res. Rec. J. Transp. Res. Board 2018, 2672, 54–65. [Google Scholar] [CrossRef]
  43. Scott, D.M.; Novak, D.C.; Aultman-Hall, L.; Guo, F. Network Robustness Index: A new method for identifying critical links and evaluating the performance of transportation networks. J. Transp. Geogr. 2006, 14, 215–227. [Google Scholar] [CrossRef]
  44. Sullivan, J.; Novak, D.; Aultman-Hall, L.; Scott, D. Identifying critical road segments and measuring system-wide robustness in transportation networks with isolating links: A link-based capacity-reduction approach. Transp. Res. Part A 2010, 44, 323–336. [Google Scholar] [CrossRef]
  45. Jenelius, E.; Petersen, T.; Mattsson, L.-G. Importance and exposure in road network vulnerability analysis. Transp. Res. Part A 2006, 40, 537–560. [Google Scholar] [CrossRef]
  46. Almotahari, A.; Yazici, M.A. A link criticality index embedded in the convex combinations solution of user equilibrium traffic assignment. Transp. Res. Part A 2019, 126, 67–82. [Google Scholar] [CrossRef]
  47. Nagurney, A.; Qiang, Q. A Transportation Network Efficiency Measure that Captures Flows, Behavior, and Costs with Applications to Network Component Importance Identification and Vulnerability. SSRN Electron. J. 2007. [Google Scholar] [CrossRef]
  48. Wang, W.; Yang, S.; Stanley, H.E.; Gao, J. Local floods induce large-scale abrupt failures of road networks. Nat. Commun. 2019, 10, 2114. [Google Scholar] [CrossRef]
  49. Cohen, S.; Brakenridge, G.R.; Kettner, A.; Bates, B.; Nelson, J.; McDonald, R.; Huang, Y.-F.; Munasinghe, D.; Zhang, J. Estimating Floodwater Depths from Flood Inundation Maps and Topography. J. Am. Water Resour. Assoc. 2017, 54, 847–858. [Google Scholar] [CrossRef]
  50. Alabbad, Y.; Mount, J.; Campbell, A.M.; Demir, I. Assessment of transportation system disruption and accessibility to critical amenities during flooding: Iowa case study. Sci. Total Environ. 2021, 793, 148476. [Google Scholar] [CrossRef]
  51. Pregnolato, M.; Ford, A.; Wilkinson, S.M.; Dawson, R.J. The impact of flooding on road transport: A depth-disruption function. Transp. Res. Part D 2017, 55, 67–81. [Google Scholar] [CrossRef]
  52. Kasmalkar, I.G.; Serafin, K.A.; Miao, Y.; Bick, I.A.; Ortolano, L.; Ouyang, D.; Suckale, J. When floods hit the road: Resilience to flood-related traffic disruption in the San Francisco Bay Area and beyond. Sci. Adv. 2020, 6, eaba2423. Available online: https://www.science.org (accessed on 1 November 2023). [CrossRef] [PubMed]
  53. Gangwal, U.; Dong, S. Critical facility accessibility rapid failure early-warning detection and redundancy mapping in urban flooding. Reliab. Eng. Syst. Saf. 2022, 224, 108555. [Google Scholar] [CrossRef]
  54. Shen, S.; Kim, K. Assessment of Transportation System Vulnerabilities to Tidal Flooding in Honolulu, Hawaii. Transp. Res. Rec. J. Transp. Res. Board 2020, 2674, 207–219. [Google Scholar] [CrossRef]
  55. Anderson, M.; Kiddle, D.; Logan, T. The underestimated role of the transportation network: Improving disaster & community resilience. Transp. Res. Part D Transp. Environ. 2022, 106, 103218. [Google Scholar] [CrossRef]
  56. Jin, J.G.; Tang, L.C.; Sun, L.; Lee, D.-H. Enhancing metro network resilience via localized integration with bus services. Transp. Res. Part E Logist. Transp. Rev. 2014, 63, 17–30. [Google Scholar] [CrossRef]
  57. Osogami, T.; Imamichi, T.; Mizuta, H.; Suzumura, T.; Ide, T. Toward simulating entire cities with behavioral models of traffic. IBM J. Res. Dev. 2013, 57, 6.1–6.10. [Google Scholar] [CrossRef]
  58. Miller-Hooks, E.; Zhang, X.; Faturechi, R. Measuring and maximizing resilience of freight transportation networks. Comput. Oper. Res. 2011, 39, 1633–1643. [Google Scholar] [CrossRef]
  59. Gonçalves, L.; Ribeiro, P. Resilience of urban transportation systems. Concept, characteristics, and methods. J. Transp. Geogr. 2020, 85, 102727. [Google Scholar] [CrossRef]
  60. Jafino, B.A.; Kwakkel, J.; Verbraeck, A. Transport network criticality metrics: A comparative analysis and a guideline for selection. Transp. Rev. 2020, 40, 241–264. [Google Scholar] [CrossRef]
  61. Derrible, S. Network Centrality of Metro Systems. PLoS ONE 2012, 7, e40575. [Google Scholar] [CrossRef]
  62. Wilde, E.T. Do emergency medical system response times matter for health outcomes? Health Econ. 2013, 22, 790–806. [Google Scholar] [CrossRef] [PubMed]
  63. FEMA. UNIT 3: NFIP FLOOD STUDIES AND MAPS. 2024. Available online: https://www.fema.gov/pdf/floodplain/nfip_sg_unit_3.pdf (accessed on 3 January 2024).
  64. Smith, G.P.; Modra, B.D.; Tucker, T.A.; Cox, R.J. Vehicle Stability Testing for Flood Flows; Water Research Laboratory, University of New South Wales: Sydney, Australia, 2017. [Google Scholar]
  65. Yin, J.; Yu, D.; Yin, Z.; Liu, M.; He, Q. Evaluating the impact and risk of pluvial flash flood on intra-urban road network: A case study in the city center of Shanghai, China. J. Hydrol. 2016, 537, 138–145. [Google Scholar] [CrossRef]
  66. SC Department of Employment and Workforce. Community Profile. 2023. Available online: www.SCWorkforceInfo.com (accessed on 1 November 2023).
  67. Anderson Area. Chamber of Commerce. Available online: https://www.andersonscchamber.com/manufacturing-in-anderson-county (accessed on 30 July 2023).
  68. FEMA. Resilience Analysis and Planning Tool (RAPT). Available online: https://fema.maps.arcgis.com/apps/webappviewer/index.html?id=90c0c996a5e242a79345cdbc5f758fc6 (accessed on 30 July 2023).
  69. FHWA. Pedestrians and Transit—Safety|Federal Highway Administration. Available online: https://safety.fhwa.dot.gov/ped_bike/ped_transit/ped_transguide/ch4.cfm (accessed on 30 July 2023).
  70. National Association of City Transportation Officials (NACTO), “Transit Street Design Guide”, 260p. 2016. Available online: https://trid.trb.org/view/1420198 (accessed on 7 August 2023).
  71. T. Research Board. The Federal Transit Administration Guidelines for the Location and Design of Bus Stops; Texas Transportation Institute, Texas A&M University: College Station, TX, USA, 1996. [Google Scholar]
  72. SC DoT. Transportation Data, ArcGIS Online. Available online: https://scdot.maps.arcgis.com/home/index.html (accessed on 30 July 2023).
  73. GDoT. Georgia Traffic Counts & Traffic Report Data—GDOT. Available online: https://www.dot.ga.gov/GDOT/Pages/RoadTrafficData.aspx (accessed on 30 July 2023).
  74. FHWA. National Bridge Inventory—Management and Preservation—Bridges & Structures—Federal Highway Administration. Available online: https://www.fhwa.dot.gov/bridge/nbi.cfm (accessed on 30 July 2023).
  75. USGS. National Map Downloader. 2018. Available online: https://apps.nationalmap.gov/downloader/#/ (accessed on 15 January 2018).
  76. FEMA. FEMA Flood Map Service Center|Search All Products. Available online: https://msc.fema.gov/portal/advanceSearch (accessed on 30 July 2023).
  77. US Census Bureau. TIGER/Line Geodatabases. Available online: https://www.census.gov/geographies/mapping-files/time-series/geo/tiger-geodatabase-file.html (accessed on 30 July 2023).
  78. A. Recreation Department. Parks Department—Anderson County South Carolina. Available online: https://www.andersoncountysc.org/work-live/for-residents/parks/ (accessed on 30 July 2023).
  79. USACE. Hartwell Dam and Lake. Available online: https://www.sas.usace.army.mil/About/Divisions-and-Offices/Operations-Division/Hartwell-Dam-and-Lake/Plan-A-Visit/Brochures-Maps/ (accessed on 30 July 2023).
  80. HIFLD Open Data. National Shelter System Facilities|National Shelter System Facilities|. Available online: https://hifld-geoplatform.opendata.arcgis.com/datasets/geoplatform::national-shelter-system-facilities/explore?location=34.490781%2C-82.648668%2C12.00 (accessed on 30 July 2023).
  81. NCES. School District Boundaries. Available online: https://nces.ed.gov/programs/edge/Geographic/DistrictBoundaries (accessed on 30 July 2023).
  82. Cutter, S.L. Building Disaster Resilience: Steps toward Sustainability. Chall. Sustain. 2014, 1, 72–79. [Google Scholar] [CrossRef]
  83. Cutter, S.L.; Ismail-Zadeh, A.; Alcántara-Ayala, I.; Altan, O.; Baker, D.N.; Briceño, S.; Gupta, H.; Holloway, A.; Johnston, D.; McBean, G.A.; et al. Global risks: Pool knowledge to stem losses from disasters. Nature 2015, 522, 277–279. [Google Scholar] [CrossRef]
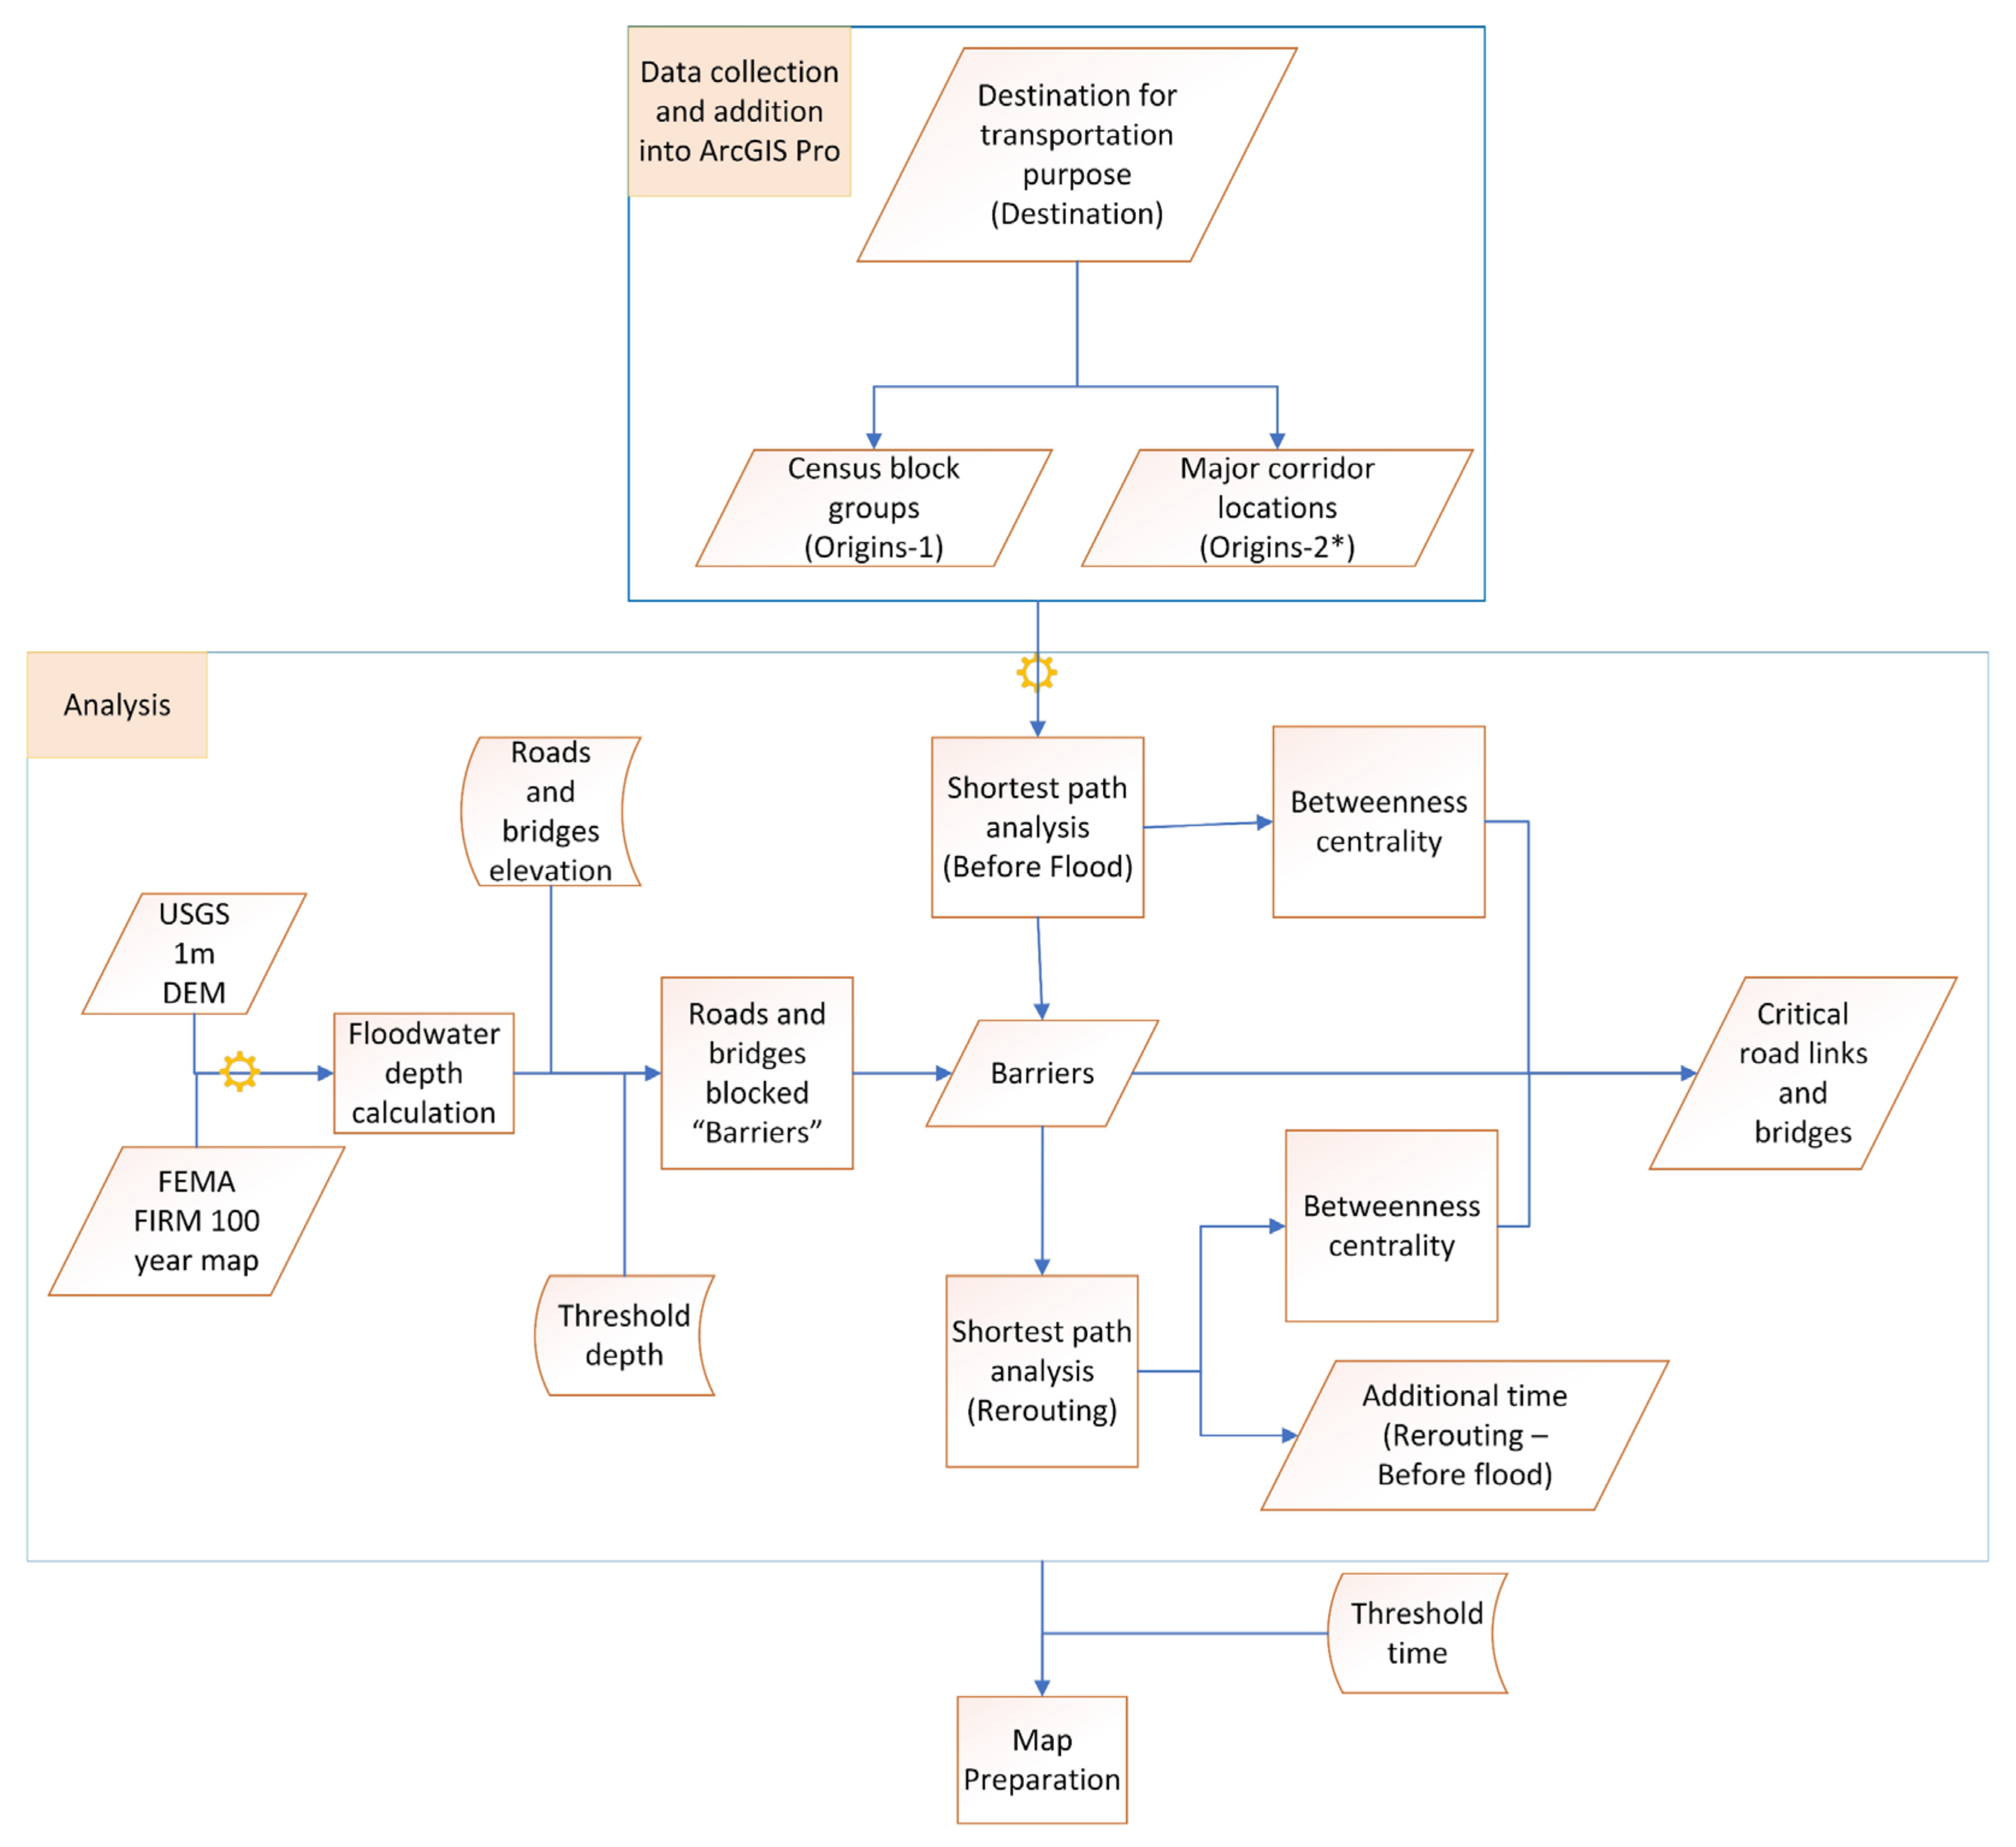
Figure 1. Overview of the methodology. * The origin is acting as the destination for evacuation. The gear sign represents the first run of the geoprocessing tool for shortest path or flood barrier calculations.
Sustainability 16 00819 g001
Figure 2. 100-Year Return Period Flood Area of the Study Area (Based on FEMA).
Sustainability 16 00819 g002
Figure 3. Cross-section illustrating depth calculation approach (based on [49]).
Sustainability 16 00819 g003
Figure 4. (a) Potentially blocked roads and bridges in Anderson County; (b) Potentially impacted bridges in Anderson County along with high-capacity roads.
Sustainability 16 00819 g004
Figure 5. Reference map for the division of Anderson County based on direction.
Sustainability 16 00819 g005
Figure 6. Critical roads for: (a) Workplace accessibility from Census block groups; (b) Material accessibility to the workplaces from major corridors.
Sustainability 16 00819 g006
Figure 7. Critical roads for: (a) Hospital accessibility; (b) Urgent care facility accessibility.
Sustainability 16 00819 g007
Figure 8. Critical roads for: (a) School accessibility in school districts; (b) College accessibility.
Sustainability 16 00819 g008
Figure 9. Critical roads for: (a) Grocery accessibility; (b) Material accessibility from major corridors to the grocery stores.
Sustainability 16 00819 g009
Figure 10. Critical roads for: (a) Park accessibility; (b) Accessibility of the paramedics/ambulances to the Census block groups.
Sustainability 16 00819 g010
Figure 11. Critical roads for: (a) Accessibility from the police station to the Census block groups, avoiding the flood barriers; (b) Accessibility of the ambulances/paramedics to the Census block groups, avoiding the flood barriers.
Sustainability 16 00819 g011
Figure 12. Critical roads for: (a) Accessibility of the hospital from Census block groups avoiding flood-barriers; (b) Evacuation from evacuation-prone areas (green) and the fire rescue team’s accessibility (brown).
Sustainability 16 00819 g012
Figure 13. Critical roads for: (a) Workplace accessibility, avoiding flood barriers; (b) Materials accessibility to workplaces from major corridors, avoiding flood barriers.
Sustainability 16 00819 g013
Figure 14. Critical roads for: (a) Materials accessibility to grocery stores avoiding flood barriers; (b) Parks accessibility avoiding flood barriers.
Sustainability 16 00819 g014
Figure 15. Critical roads for: (a) School accessibility in school districts avoiding flood barriers; (b) College accessibility avoiding flood barriers.
Sustainability 16 00819 g015
Figure 16. Materials for Repair/Recovery supplies avoiding flood barriers/evacuees returning home.
Sustainability 16 00819 g016
Figure 17. (a) Additional time to be traveled after the flood to access the hospital from Census block group centroids. (All labeled values are time in minutes); (b) Blocked locations requiring changing routes for hospital accessibility.
Sustainability 16 00819 g017
Figure 18. (a) Change in accessibility from various Census block groups for urgent care facility 1—Anmed Urgent Care; (b) Change in accessibility from various Census block groups for urgent care facilities 3—Crossroads Urgent Care.
Sustainability 16 00819 g018
Figure 19. Blocked locations changing routes for urgent care accessibility.
Sustainability 16 00819 g019
Figure 20. (a) Change in accessibility from various Census block groups to Columbia; (b) Change in accessibility from various Census block groups to Charlotte.
Sustainability 16 00819 g020
Figure 21. Number of routes affected while accessing the major corridors from various Census block groups.
Sustainability 16 00819 g021
Figure 22. (a) Change in accessibility from various Census block groups to Augusta; (b) Change in accessibility from various Census block groups to Atlanta.
Sustainability 16 00819 g022
Figure 23. Histogram for the additional time of changed routes while accessing various workplaces from Census block groups in Anderson County.
Sustainability 16 00819 g023
Figure 24. (a) Workplaces in Anderson County (59 locations); (b) Clustering of the nearby companies (19 locations).
Sustainability 16 00819 g024
Figure 25. (a) Change in accessibility of workplace 2 in Anderson County from Census block groups and various county entry and exit points; (b) Change in accessibility of workplace 18 in Anderson County from Census block groups and various county entry and exit points.
Sustainability 16 00819 g025
Figure 26. (a) Number of routes impacted due to flood for accessibility from Census block groups to various companies in the county; (b) Number of routes impacted due to flood for accessibility from entry points to workplaces in the county.
Sustainability 16 00819 g026
Figure 27. (a) Additional time is needed to arrive at the workplaces in Anderson County from various corridor locations (Columbia); (b) Major corridors.
Sustainability 16 00819 g027
Figure 28. Critical blocked sections for material access to workplaces.
Sustainability 16 00819 g028
Figure 29. (a) Additional travel time to access Tri-County College in Anderson County after the 100-year flood; (b) Additional travel time to access Anderson University in Anderson County after the 100-year flood.
Sustainability 16 00819 g029
Figure 30. Number of routes being impacted due to the blocked locations for college accessibility.
Sustainability 16 00819 g030
Figure 31. (a) Additional travel time to access an elementary school in Anderson County after the 100-year flood; (b) Additional travel time to access middle schools in Anderson County after the 100-year flood.
Sustainability 16 00819 g031
Figure 32. (a) Additional travel time to access high schools in Anderson County after the 100-year flood; (b) Blocked locations and the routes impacted for accessing schools from school districts.
Sustainability 16 00819 g032
Figure 33. Public transit routes in Anderson County.
Sustainability 16 00819 g033
Figure 34. (a) Gold route impacts due to 100-year flood; (b) Purple route impacts due to 100-year flood.
Sustainability 16 00819 g035
Figure 35. (a) Blue route impacts due to 100-year flood; (b) Green route impacts due to 100-year flood.
Sustainability 16 00819 g034
Figure 36. Critical roads for (a) Un-flooded phase; (b) Response phase.
Sustainability 16 00819 g036
Figure 37. Critical roads for (a) Recovery phase and (b) all three phases.
Sustainability 16 00819 g037
Table 1. O-D pairs.
Table 1. O-D pairs.
Transportation PurposeOriginDestinationPhase
Hospital AccessibilityCensus block group centroidHospitalsUn-flooded, Response, Recovery
Emergency servicesFire stations, Ambulances/Paramedics, Police stationsCensus block groupsUn-flooded, Response, Recovery
EducationCensus block group centroidSchools and colleges: elementary schools, high schools in the school districts, colleges, and universitiesUn-flooded, Recovery
Daily needsCensus block group centroidSupermarkets-Walmart and other grocery storesUn-flooded, Recovery
CommuteCensus block group centroidsMajor employersUn-flooded, Recovery
Import and exportMajor corridors-Major cities nearbyMajor employersUn-flooded, Recovery
Recreation and social connectednessCensus block group centroidParks Un-flooded, Recovery
EvacuationCensus block groups (Possible evacuation, near the river, and having a larger flood extent area)Major corridors Response
Return of evacueesMajor corridorsCensus block groups (Possible evacuation, near the river, and having a larger flood extent area)Recovery
Disclaimer/Publisher’s Note: The statements, opinions and data contained in all publications are solely those of the individual author(s) and contributor(s) and not of MDPI and/or the editor(s). MDPI and/or the editor(s) disclaim responsibility for any injury to people or property resulting from any ideas, methods, instructions or products referred to in the content.