Article

Resilience Assessment and Enhancement Strategies for Urban Transportation Infrastructure to Cope with Extreme Rainfalls

1
College of Jilin Emergency Management, Changchun Institute of Technology, Changchun 130012, China
2
Institute of Natural Disaster Research, School of Environment, Northeast Normal University, Changchun 130024, China
*
Author to whom correspondence should be addressed.
Sustainability 2024, 16(11), 4780; https://doi.org/10.3390/su16114780
Submission received: 29 April 2024 / Revised: 19 May 2024 / Accepted: 30 May 2024 / Published: 4 June 2024
(This article belongs to the Special Issue Transport Planning and Governance for Resilient Cities)

Abstract

:
As climate change intensifies, urban transportation infrastructure faces unprecedented challenges from extreme weather events, such as floods. This study investigates the resilience and vulnerability of such infrastructure under extreme rainfall conditions in Changchun City. Utilizing Multi-Criteria Decision-Making Analysis (MCDM) and Geographic Information System (GIS) techniques, we comprehensively assess the physical, functional, and service vulnerabilities of the transportation network. Our analysis reveals that only 3.57% of the area is classified as highly resilient, demonstrating effective flood management capabilities. In contrast, a significant 61.73% of the area exhibits very low resilience, highlighting substantial vulnerabilities that could impact urban operations. Based on our findings, we propose specific strategies to enhance resilience, including optimizing drainage systems, upgrading infrastructure standards, implementing green infrastructure initiatives, and integrating disaster risk factors into urban planning. These strategies and insights provide valuable references for global cities facing similar climatic challenges.

1. Introduction

As global climate change intensifies, urban areas are increasingly subjected to extreme weather events, including heavy rainfall, high temperatures, and droughts [1,2,3,4]. These phenomena significantly impact urban ecology and infrastructure, challenging the resilience of essential systems such as transportation. In this context, adapting urban transportation infrastructure to withstand extreme rainfall events is crucial for maintaining city functions and ensuring public safety [5]. Extreme weather events, particularly intense rainfall, can quickly lead to urban flooding, damaging transportation infrastructure such as roads and bridges. These events may disrupt the normal operation of transportation systems and, in severe cases, impede emergency rescue operations and other critical city functions, profoundly affecting economic activities and residents’ well-being [6,7,8]. As a vital transportation hub and industrial center in Northeast Asia, Changchun’s development and the well-being of its residents are heavily reliant on the resilience of its transportation infrastructure [9,10]. In the face of this challenge, scientifically assessing and improving the resilience of urban transportation infrastructures under extreme rainfall conditions is not only crucial for ensuring the stability of urban transportation operations, but also important for enhancing the overall resilience of cities to extreme rainfall events [11,12]. Resilience, in this context, refers not only to the ability of transportation infrastructure to resist natural disasters, such as extreme rainfall, but also the ability to quickly return to normal operations after a disaster. Therefore, enhancing the resilience of transportation infrastructure is of great significance in protecting people’s lives and properties, maintaining social stability, and promoting sustainable development [13].
As global climate change intensifies, extreme rainfall events and other natural disasters present unprecedented challenges to urban transportation infrastructure [14]. Researchers have shifted from merely identifying and assessing risks towards seeking integrated resilience enhancement strategies [15]. Sharma provides a comprehensive assessment of urban green infrastructure resilience for flood risk mitigation from the perspective of social, ecological, and economic impacts on urban resilience [16]. Barzaman presents an integration of resilience indicators of extreme climate change through various datasets, field surveys, and questionnaires based on ANP modeling and states that increasing resilience is the best way to reduce urban vulnerability [17]. Fernández and Lutz offer an in-depth analysis of the impacts of multiple storm flooding events on Argentinean cities, highlighting deficiencies in planning and management while proposing improvement solutions [18]. Ainuddin and Routray introduced an interdisciplinary perspective and proposed a comprehensive resilience assessment framework, which takes socio-economic factors into account and provides new ideas for subsequent research [19]. Travis’ analysis reveals how weather and climate extremes may drive adaptation to a stable climate and its inherent extremes, highlighting the importance of infrastructure planning and community engagement [20]. Rochas investigates how cities can bolster infrastructure resilience through adaptive management, analyzing Salaspils (Latvia) to highlight the value of optimal recovery strategies and disaster risk management [21]. Gouda examines the utilization of smart technologies in monitoring and early warning systems, specifically their role in enhancing the response speed and efficiency to extreme rainfall events [22]. Ng explores the role of green infrastructure in aiding cities to mitigate the impacts of natural disasters across various climate zones, thus bolstering the resilience of urban transportation systems [23]. The global impact of natural disasters on urban transportation infrastructure has garnered widespread attention. Recent studies have increasingly focused on multidimensional resilience assessment frameworks and the interdisciplinary approach application. Song proposed a spatial equilibrium and adaptive model for exploring vulnerability and resilience patterns from a spatial equilibrium perspective, asserting that balancing resilience and vulnerability is crucial for city flood resilience [24]. Thakur and Mohanty introduced a comprehensive resilience assessment model incorporating physical vulnerability and socio-economic factors to guide urban infrastructure planning and construction [25].
Recent research has increasingly focused on multidimensional resilience assessment frameworks and interdisciplinary approaches. For instance, studies have utilized GIS technology to assess urban flood risks, highlighting the need for targeted resilience measures [26]. Similarly, integrating MCDM with GIS provides a robust framework for evaluating both the physical and socio-economic aspects of infrastructure resilience, leading to more effective planning and management strategies [27]. Despite significant research into urban infrastructure resilience, there remains a gap in studies that comprehensively analyze specific climate characteristics and their impact on transportation systems [28]. This study aims to fill that gap by offering a detailed analytical perspective on transportation infrastructure resilience in Changchun, uniquely combining the system’s disaster resilience capabilities with support for urban services and broader socio-economic impacts. These strategies are designed to prepare Changchun for current and future extreme rainfall events and provide valuable insights for other cities facing similar challenges. The recommendations offered are crucial for enhancing urban resilience and adaptability in the face of global climate change. This study develops an integrated framework using Geographic Information Systems (GIS) and Multi-Criteria Decision Making (MCDM) to integrate and assess for the first time the resilience capacity of urban transportation infrastructure in Changchun across four dimensions: physical, functional, service vulnerability, and sustainability. This approach allows for a detailed analysis of the system’s robustness, efficiency, and service reliability in extreme rainfall and its contribution to sustainability. By integrating qualitative and quantitative data into a systematic spatial statistical procedure, the framework allows the identification of critical nodes under extreme rainfall conditions and the development of targeted recovery strategies. These strategies aim to increase the resilience of infrastructure and maintain service continuity under adverse conditions, thereby enhancing the overall resilience of cities under extreme rainfall. This innovative model provides actionable insights for urban planners and policy makers, lays the groundwork for future research, and provides guidance for enhancing infrastructure in cities facing similar challenges.

2. Materials and Methods
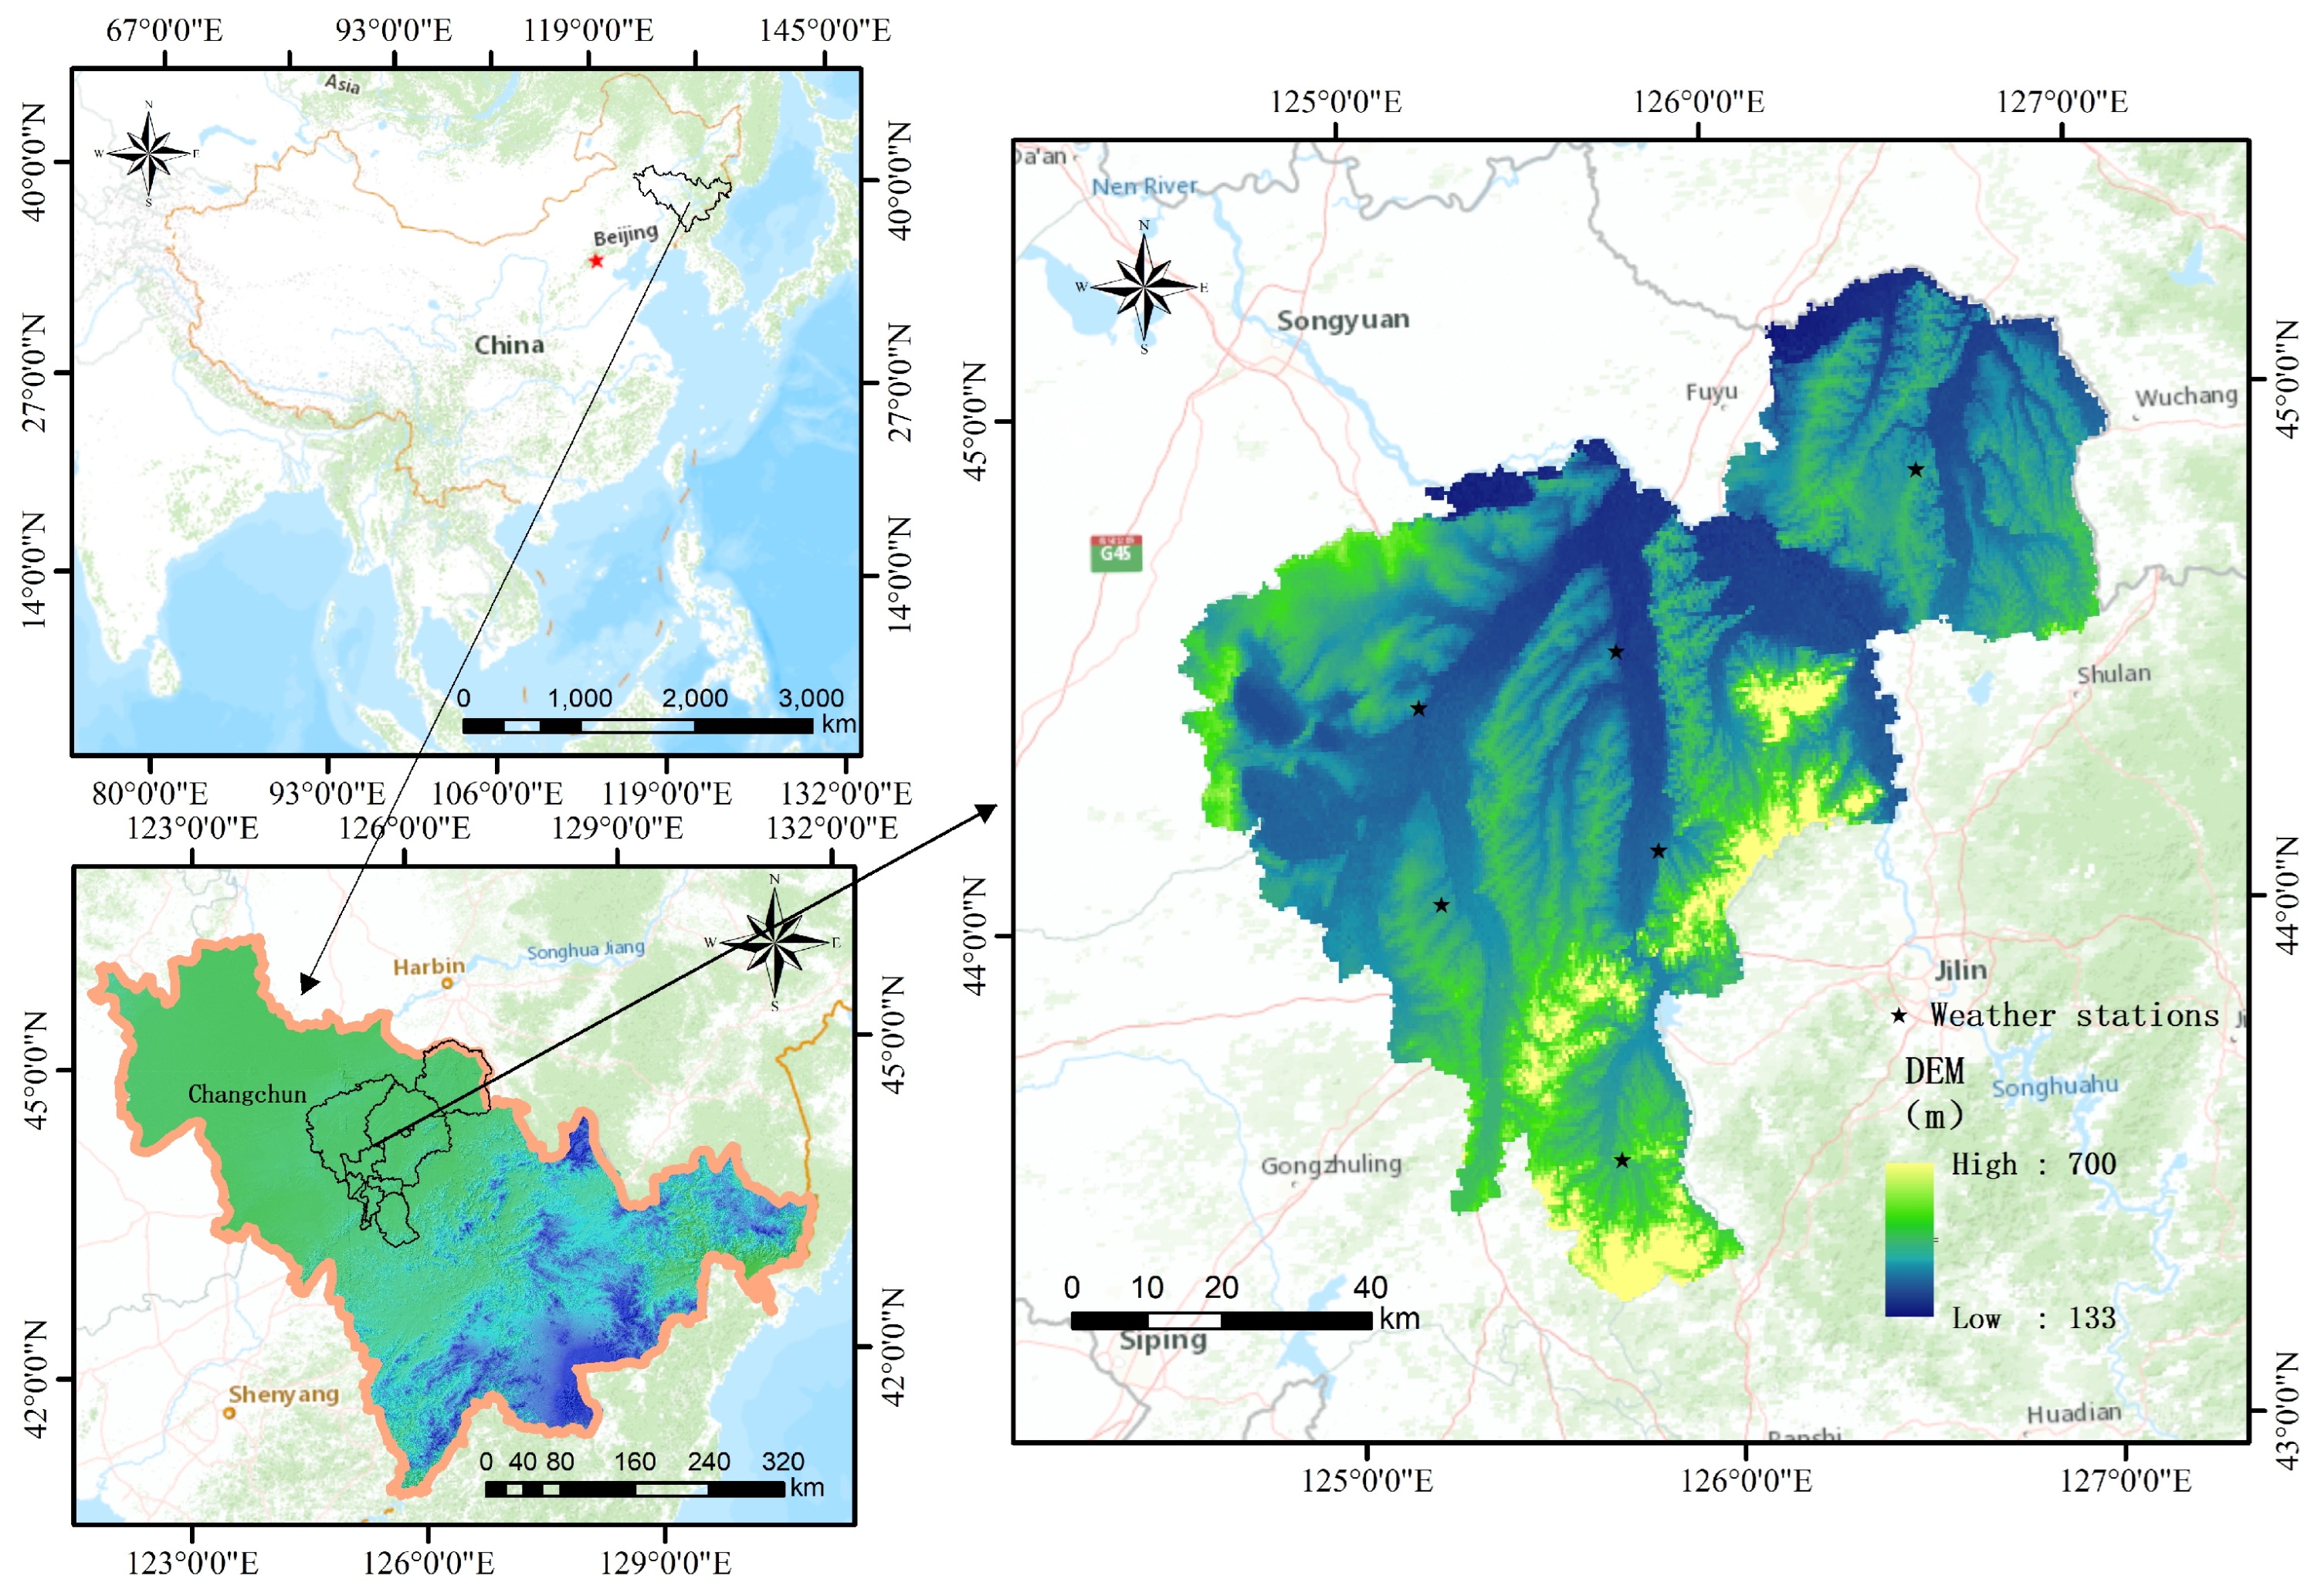
2.1. Study Area

Changchun, situated in Northeast China and serving as the capital of Jilin Province, lies on the northeastern edge of the Middle Liaohe Plain. Being an essential industrial hub in Northeast China, Changchun boasts not only rich historical and cultural resources but also a significant economic stance. Recently, the city has encountered frequent extreme rainfall events, particularly during the summer months of June through August, marked by a significant increase in rainfall. Such extreme rainfall events have presented severe challenges to the city’s transportation infrastructure. Waterlogged roads and traffic jams have become commonplace, significantly distressing residents and hindering the transportation of goods. During these months of frequent rainfall, Changchun’s transportation system often grinds to a halt, with traffic congestion becoming typical, thereby impacting the city’s routine operations and economic growth. The study area is depicted in Figure 1.

2.2. Indicator System Construction and Data Sources

In this study, we developed a multidimensional assessment framework combining Geographic Information System (GIS) and Multi-Criteria Decision Making (MCDM) to comprehensively assess the resilience of transportation infrastructure in Changchun under extreme rainfall conditions. The construction of our indicator system was grounded in a thorough analysis of relevant literature and extensive discussions with field experts, ensuring both the scientific rigor and practicality of our assessments. In selecting indicators, we focused on factors that comprehensively reflect the infrastructure’s response to extreme rainfall. These include the infrastructure’s design adaptability, functional continuity, service efficiency, and the overall sustainability of the system [29,30]. All chosen indicators are highly relevant and measurable, obtainable either from existing data sources or through specialized data collection procedures. To enhance the accuracy and utility of our assessment model, we applied the Analytic Hierarchy Process (AHP) and CRITIC methods to assign weights and priorities to these indicators. Additionally, to validate the scientific validity of our indicator system, we conducted practical application tests in Changchun City. These tests involved examining the predictive effectiveness and applicability of the indicators through specific case studies. This comprehensive and systematic approach not only bolsters the scientific foundation of our study but also provides urban planners and policy makers with an effective tool. This tool aids in assessing and enhancing the adaptive capacity and resilience of urban infrastructures to withstand extreme rainfall events. To accurately present the analysis results, the paper utilized ArcGIS 10.8 software for spatial processing and data visualization (See Section S1 for the data calculation process). Through evaluations and analyses, the aim is to improve Changchun’s transportation infrastructure’s resilience and adaptive capacity against future extreme climate events. Specific evaluation indicators and data sources are shown in Table 1.

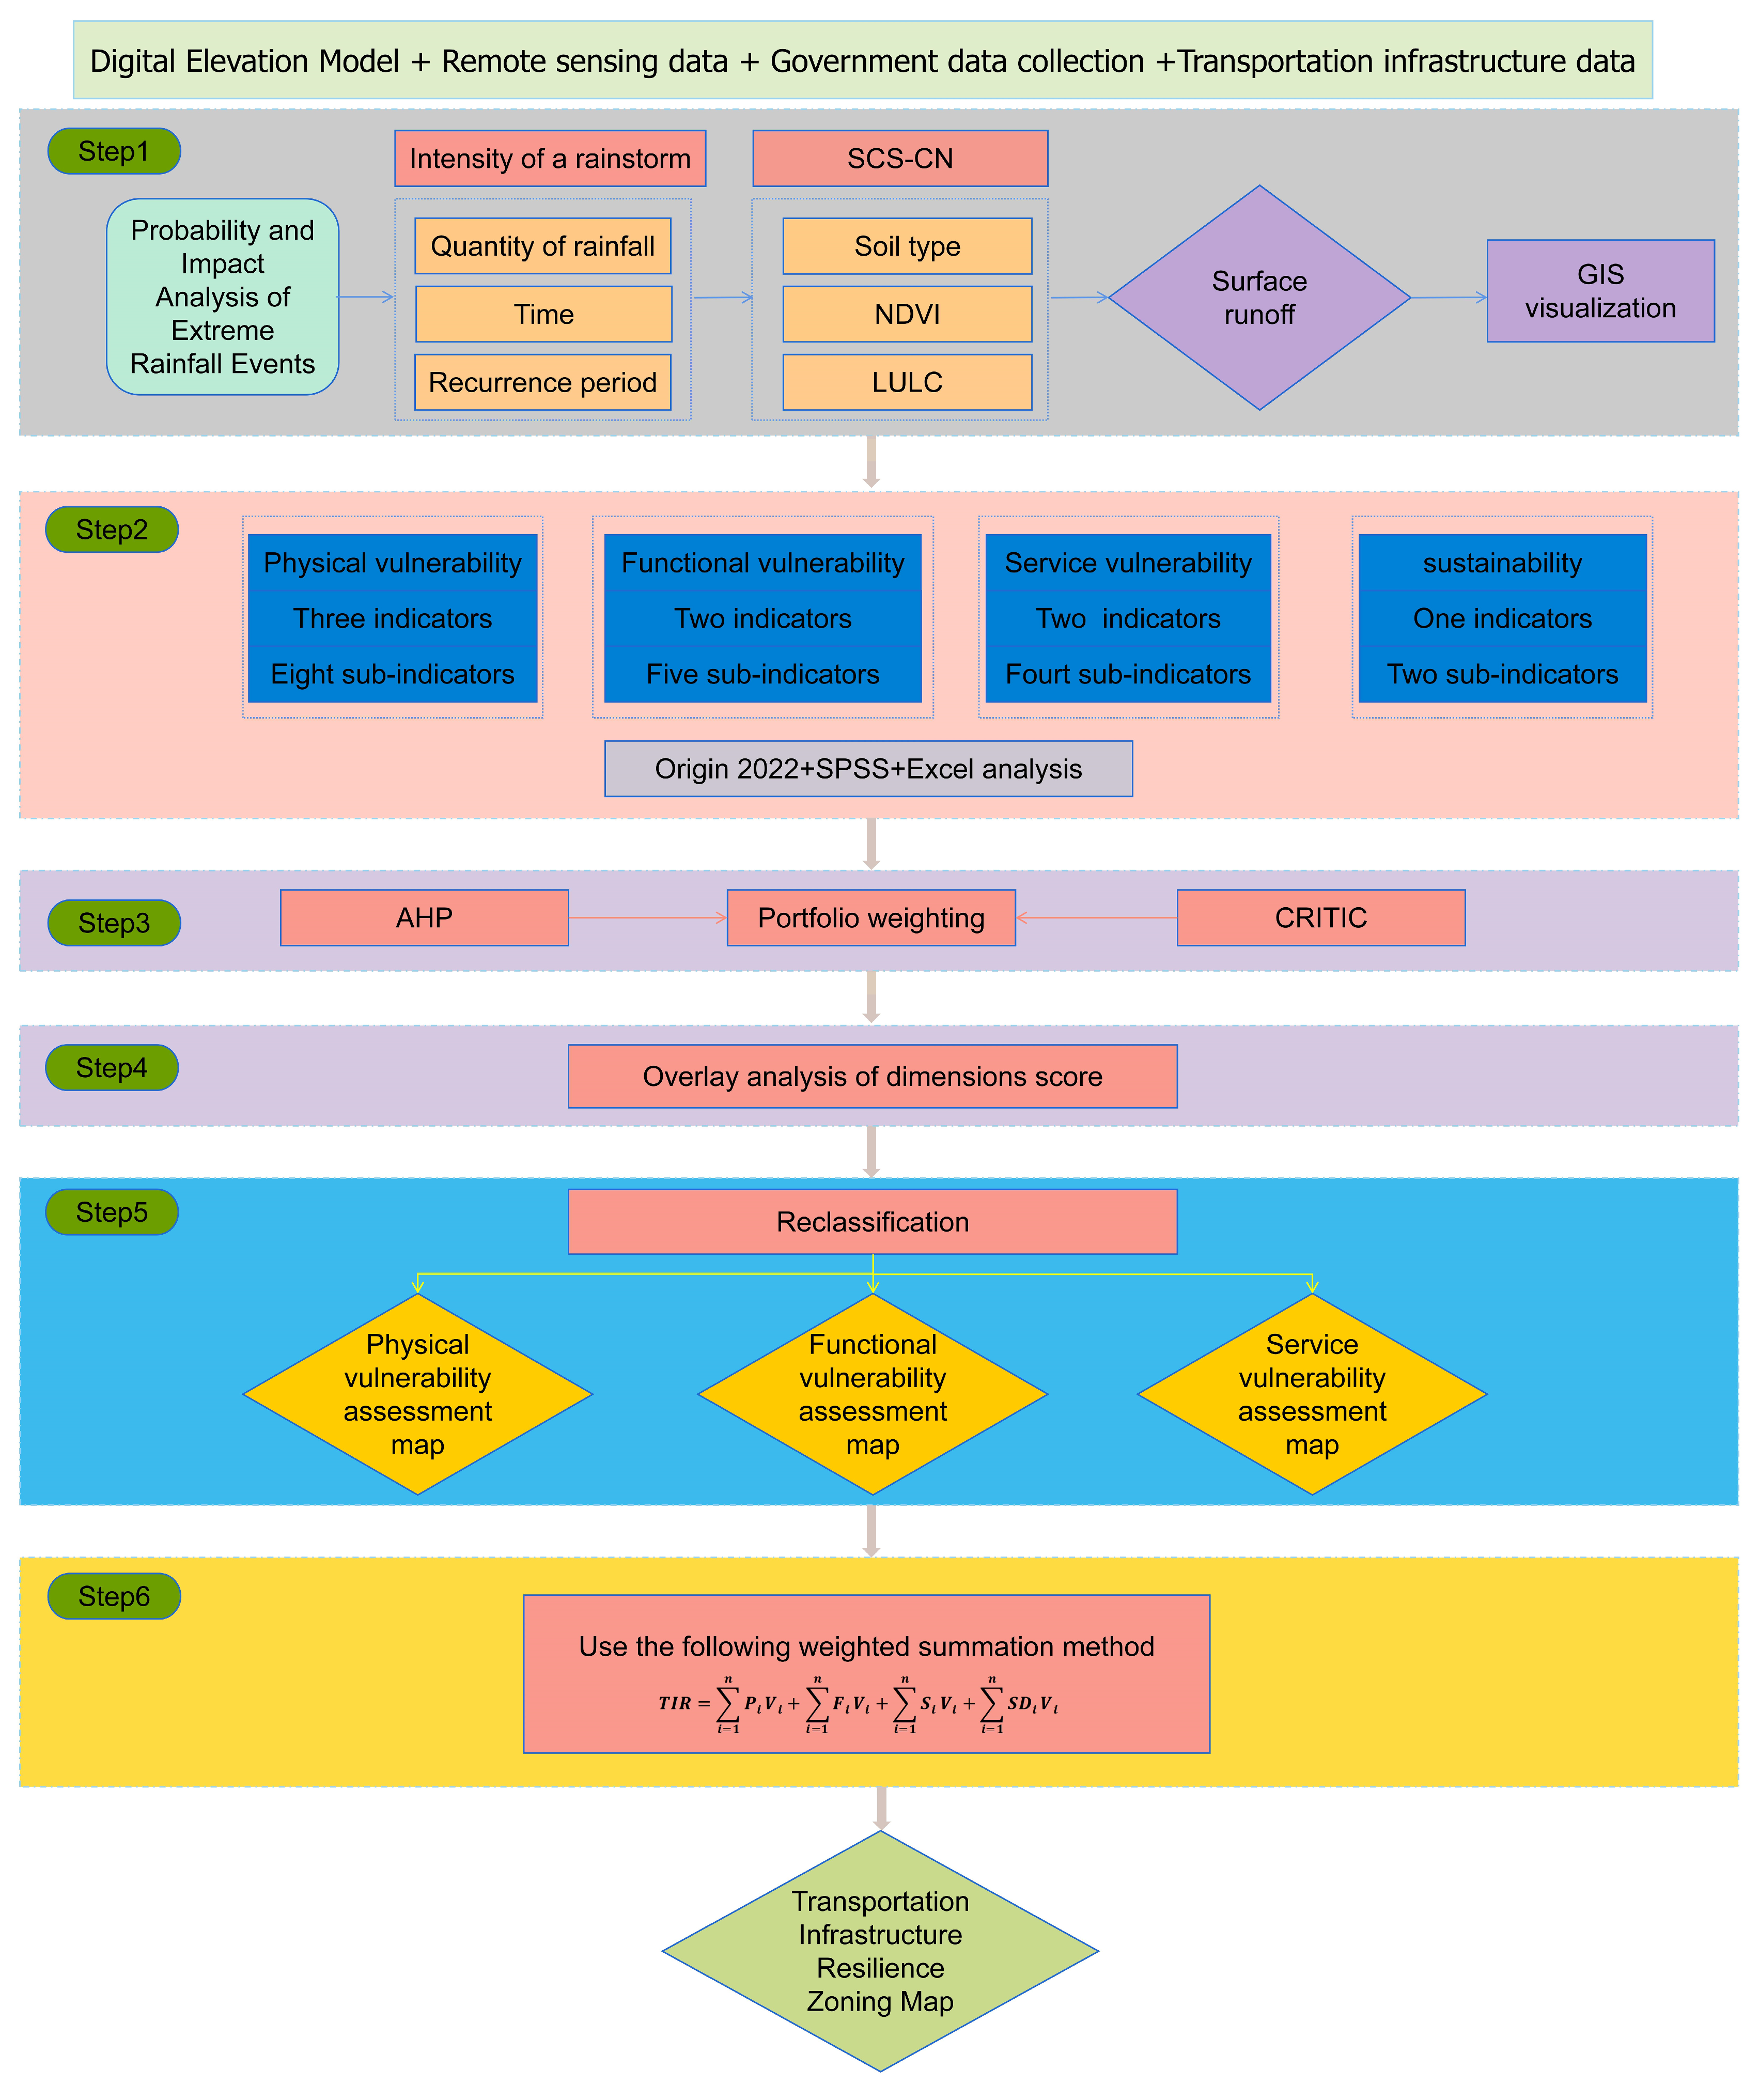
2.3. Multi-Criteria Decision Analysis (MCDM) Modeling

2.3.1. Analysis of Hierarchy (AHP)

The Analytic Hierarchy Process (AHP), introduced by Thomas L. Saaty in the early 1970s, is used as a quantitative method for solving complex decision-making challenges. Through pairwise comparisons, the AHP subdivided the problem into objectives, criteria, and options, ultimately resulting in a distribution of weights for each factor [31]. One of the main strengths of the AHP is its ability to quantify qualitative judgments, obtaining objective and reliable weights through pairwise comparison matrices and consistency tests, which in turn provides systematic decision support [32]. In this study, the AHP was used to assess the need to enhance the resilience of Changchun City’s transportation infrastructure under extreme rainfall conditions (See Figure 2), to construct a hierarchical structure, and to optimize the assessment indicators to ensure the scientific and objective integrity of the assessment.
(1)
Establishment of a hierarchy
With enhancing the resilience of transportation infrastructure under extreme rainfall as the target layer, physical vulnerability, functional vulnerability, service vulnerability, and sustainability were used as the indicators, and the specific indicators are the sub-indicators (See Section S2 for specific steps).
(2)
Constructing a pairwise comparison judgment matrix
This study synthesized the views of five experts in the fields of climate change and environmental sciences and emergency management and disaster response to systematically assess the relative importance of indicators at various levels using a pairwise comparison method. In this method, the relative importance of indicators is quantified on a scale of 1 to 9 (Table 2), with 1 indicating that two indicators are of equal importance and 9 reflecting very high importance compared to another indicator.
The judgment matrix is
A = s 11 s 12 s 1 n s 21 s 22 s 2 n s n 1 s n 2 s n n
where s i j is the importance of the ith element with respect to the jth element.
(3)
Consistency check
In order to ensure the rationality of weight allocation, the following formula was used in this study for the matrix consistency test to assess the accuracy and consistency of weight allocation:
C I = λ m a x n n 1
C R = C I R I
In this process, λ m a x   represents the maximum eigenvalue of the matrix, and n represents the total number of indicators being compared. C I represents the consistency index, which is the key index for assessing the degree of consistency of the matrix. R I refers to the average value of the random consistency index, which can be obtained by referring to Table 3. C R is the consistency ratio, which is used to finalize whether the consistency of the matrix is acceptable or not. When C R < 0.1, it indicates that the consistency of the matrix is acceptable, i.e., it passes the consistency test.
(4)
Indicator weights
w j a = 1 n i = 1 n s i j i = 1 n s i j

2.3.2. CRITIC Weighting Method

The CRITIC method, as an improvement of the entropy weighting method, assigns objective weights to the indicators by integrating the standard deviations and correlation coefficients between the indicators to more accurately reflect the strength of the contrasts between the indicators and their conflicting nature [33]. The method has the following main steps:
(1)
Raw matrix dimensionless processing
Z = z i j m × n
z i j = x i j m i n x j m a x x j m i n x j
z i j = m a x x j x i j m a x x j m i n x j
The positive and negative indicators are processed by Equations (6) and (7), respectively, to obtain the matrix Z .
(2)
Calculation of indicator variability
The standard deviation S j is used in the CRITIC method to indicate the fluctuation of the differences in the values taken within each indicator; the larger the standard deviation, the greater the difference in the value of the indicator, the more information that can be screened, and the stronger the evaluation strength of the indicator itself, and the more weight that should be assigned to the indicator. This is calculated using the following formula:
z j = 1 n i = 1 n z i j S j = i = 1 n z i j z j 2 n 1
(3)
Calculation of conflicting indicators
The correlation coefficient is used to indicate the correlation between indicators; the stronger the correlation with other indicators, the less the indicator conflicts with other indicators, reflecting more of the same information, and the more repetitive the content of the evaluations that can be embodied, which to a certain extent weakens the strength of the evaluation of the indicator, and the weight assigned to the indicator should be reduced.
R j = i = 1 p 1 r i j
r i j denotes the correlation coefficient between evaluation indicators i and j .
(4)
Calculation of indicator informativeness and objective weights
The information content C j and objective weight W j of the jth indicator are calculated by the following equation, respectively:
C j = S j i = 1 p 1 r i j = S j × R j
w j b = C j j = 1 p C j

2.3.3. Composite Weight Calculation

Combining the subjective weights of the indicators w j a obtained by AHP and the objective weights of the indicators w j b obtained by the CRITIC method, the subjective–objective composite weights w j c were constructed by linear weighting [34], which means that
w j c = α w j a + β w j b
In examining transportation infrastructure resilience strategies for Changchun City under extreme rainfall, this study employs two linear weighting coefficients, α and β, aimed at balancing the subjective and objective weights within the comprehensive weighting framework. During the assessment, subjective weights are heavily influenced by expert judgments regarding the infrastructure’s resilience to extreme rainfall, thus assigning α a larger weight of 0.6 to underscore the experts’ opinions’ significance. In contrast, objective weights, represented by β at 0.4, mirror the data indicators’ intrinsic characteristics. This weight allocation guarantees that the findings incorporate expert insights while thoroughly accounting for the actual data’s characteristics. Employing the AHP-CRITIC method to amalgamate these weights enhances the study’s methodology scientifically and logically over the traditional AHP approach, thereby offering robust support for devising more accurate and potent strategies to boost Changchun City’s transportation infrastructure resilience. The final combined weights are illustrated in Table 4. This methodological approach not only underlines the study’s commitment to scientific rigor and logical coherence but also ensures that the strategies developed are grounded in a comprehensive understanding of both expert insights and empirical data characteristics, thereby significantly contributing to the field of urban infrastructure resilience.

2.4. Storm Intensity Formula

The rainfall characteristics were calculated using the rainfall intensity of a 100-year storm provided by the Changchun Meteorological Bureau’s website using the following formulas:
q = 4929.84 × 1 + 0.841 lg P t + 13.644 0.718
where q is the storm intensity, P is the return period, and t is the calendar time.

2.5. Soil Conservation Service Curve Number (SCS-CN)

The Soil Conservation Service Curve Number (SCS-CN) method, initiated by the Soil Conservation Service of the U.S. Department of Agriculture (now known as the Natural Resources Conservation Service), quantifies the amount of runoff from precipitation events. The method combines LULC, soil type, and NDVI variables to predict runoff magnitude [35]. The core equation of the SCS-CN method is used to calculate the direct runoff volume ( Q ) for a rainfall event with the following equation:
Q = ( P I a ) 2 P I a + S
where is the direct runoff volume, P is the total rainfall, and I a is the initial drawdown (value S × 0.2), and S is the maximum potential water storage. The specific formula is
S = 25,400 C N 2543
The CN (Curve Number) value serves as a dimensionless indicator of runoff potential for specific land use types and soil conditions. Considering Changchun City experiences short-term heavy rainfall primarily in the summer, and soil exhibits dry conditions in non-rainfall periods, this study assumes drought conditions for antecedent soil moisture condition (AMC) analysis [36]. This approach reflects the soil’s potential infiltration capacity and reduced runoff potential during non-rainfall periods. Considering Changchun’s soil types and seasonal rainfall patterns, the soils’ infiltration rates are generally classified as medium, falling within hydrologic soil group B. This classification accounts for the permeability of various soil types under average conditions and is applicable to determining CN values in the SCS-CN model, as demonstrated in Table 5 for AMC I conditions.
Overlay analysis using GIS based on soil type, LULC, and NDVI data yielded an average CN value of 67.5 for Changchun.

2.6. Multi-Criteria Decision Analysis Model (MCDM)

In this study, in order to comprehensively assess the resilience of transportation infrastructure in Changchun City, we used the Weighted Summation Method (WSM), which is part of Multi-Criteria Decision-Making Analysis (MCDM). This approach allows us to assign appropriate weights to different assessment dimensions in order to assess their collective impact in depth on the resilience of the city’s transportation infrastructure [37]. The key criteria affecting resilience are physical vulnerability (PV), functional vulnerability (FV), service vulnerability (SV), and sustainability (SDV) as the four main dimensions. Weights were assigned to each criterion using the Analytic Hierarchy Process (AHP) and CRITIC methodology by combining expert opinion and data characterization. These weights indicate the relative importance of each criterion in the resilience assessment. Individual metrics for each criterion were calculated using actual data, with scores reflecting the performance of the dimension in a given scenario. Ultimately, the applied formula multiplies the score for each dimension with its corresponding weight to produce a cumulative resilience score:
T I R = i = 1 n P i V i + i = 1 n F i V i + i = 1 n S i V i + i = 1 n S D i V i
where T I R represents the overall resilience index, P i , F i , S i and S D i represent the weights of physical vulnerability, functional vulnerability, service vulnerability and sustainability dimensions, respectively. V i represents the assessment value of the ith dimension.

3. Resilience Assessment of Transportation Infrastructure in Changchun under Extreme Rainfall

3.1. Probability and Impact Analysis of Extreme Rainfall Events

After analyzing the temporal patterns of extreme rainfall events in Changchun over the past decade (2011–2020), our study noted a significant increase in both the frequency and intensity of these meteorological events. This trend not only highlights the inherent vulnerabilities of Changchun’s urban transportation infrastructure but also emphasizes the urgent need to reevaluate and enhance existing resilience strategies in response to these evolving climate challenges. Figure 3 illustrates the variations in daily rainfall in Changchun and its surrounding areas from 2011 to 2020. Despite considerable year-to-year variability in rainfall patterns, the data indicate a clear upward trend in the frequency and intensity of extreme rainfall events. Our analysis identified substantial increases in extreme rainfall in specific years, notably 2013 and 2019, which underscore the potential vulnerabilities of the urban transportation infrastructure in the region. For instance, in Changchun City, the marked increases in both the median and upper quartiles of daily rainfall in these years suggest that the capacity of the drainage systems may be insufficient to manage sudden, intense downpours, potentially causing severe disruptions to urban transportation. These trends and data strongly advocate for the need to focus on the risk of extreme rainfall events in the planning and development of more resilient transportation infrastructure. These findings underscore the crucial nexus between climate change-induced weather patterns and urban infrastructure resilience, calling for a proactive, integrated approach to urban planning that prioritizes adaptive strategies in the face of climate uncertainty. Next, Section 3.2 delves further into the specific impacts of these extreme rainfall events on urban surface runoff and their regional manifestations, providing a scientific foundation for developing subsequent enhancement strategies.

3.2. Surface Runoff Analysis under Extreme Rainfall

In modeling the spatial distribution and relative depth of urban flooding in Changchun, this research utilized the formula for the intensity of a 100-year rainstorm in Changchun (2015). This choice is predicated on the assumption that the entire city is subject to the same rainfall pattern of a 100-year (180 min) major storm. The depth and area of surface runoff were determined using SCS-CN, with simulation results depicted in Figure 4. Figure 4 illustrates the variations in runoff depths across the Changchun area, notably in core urban areas like Kuancheng, Chaoyang, Nanguan, and Luyuan, which exhibit a significant risk of inundation. This differential susceptibility underscores the urgent need for targeted flood prevention strategies in high-risk areas. Additionally, while areas like Erdao and Dewei exhibit low runoff depths, the potential for flood impacts necessitates comprehensive urban planning and resilience measures. Consequently, special consideration must be allocated to countermeasures for these high-risk areas in the planning of urban flood control and drainage facilities. Moreover, despite suburban and peri-urban areas facing lower depths of surface runoff, the lesser infrastructure and emergency response capacity compared to urban areas demand due attention and planning to enhance these areas’ flood protection capacity. A comprehensive flood prevention strategy is advocated, focusing on optimizing the drainage system in core areas, enhancing natural rainwater infiltration through ecological infrastructure development, and constructing flood barriers in vulnerable areas. Furthermore, establishing a comprehensive flood monitoring and early warning system, developing detailed emergency response plans, and elevating citizens’ flood awareness through community education are imperative. Implementing flood-resistant designs in new infrastructure to protect critical facilities and promoting green transportation systems is crucial for bolstering cities’ overall resilience and coping mechanisms against future extreme weather events.

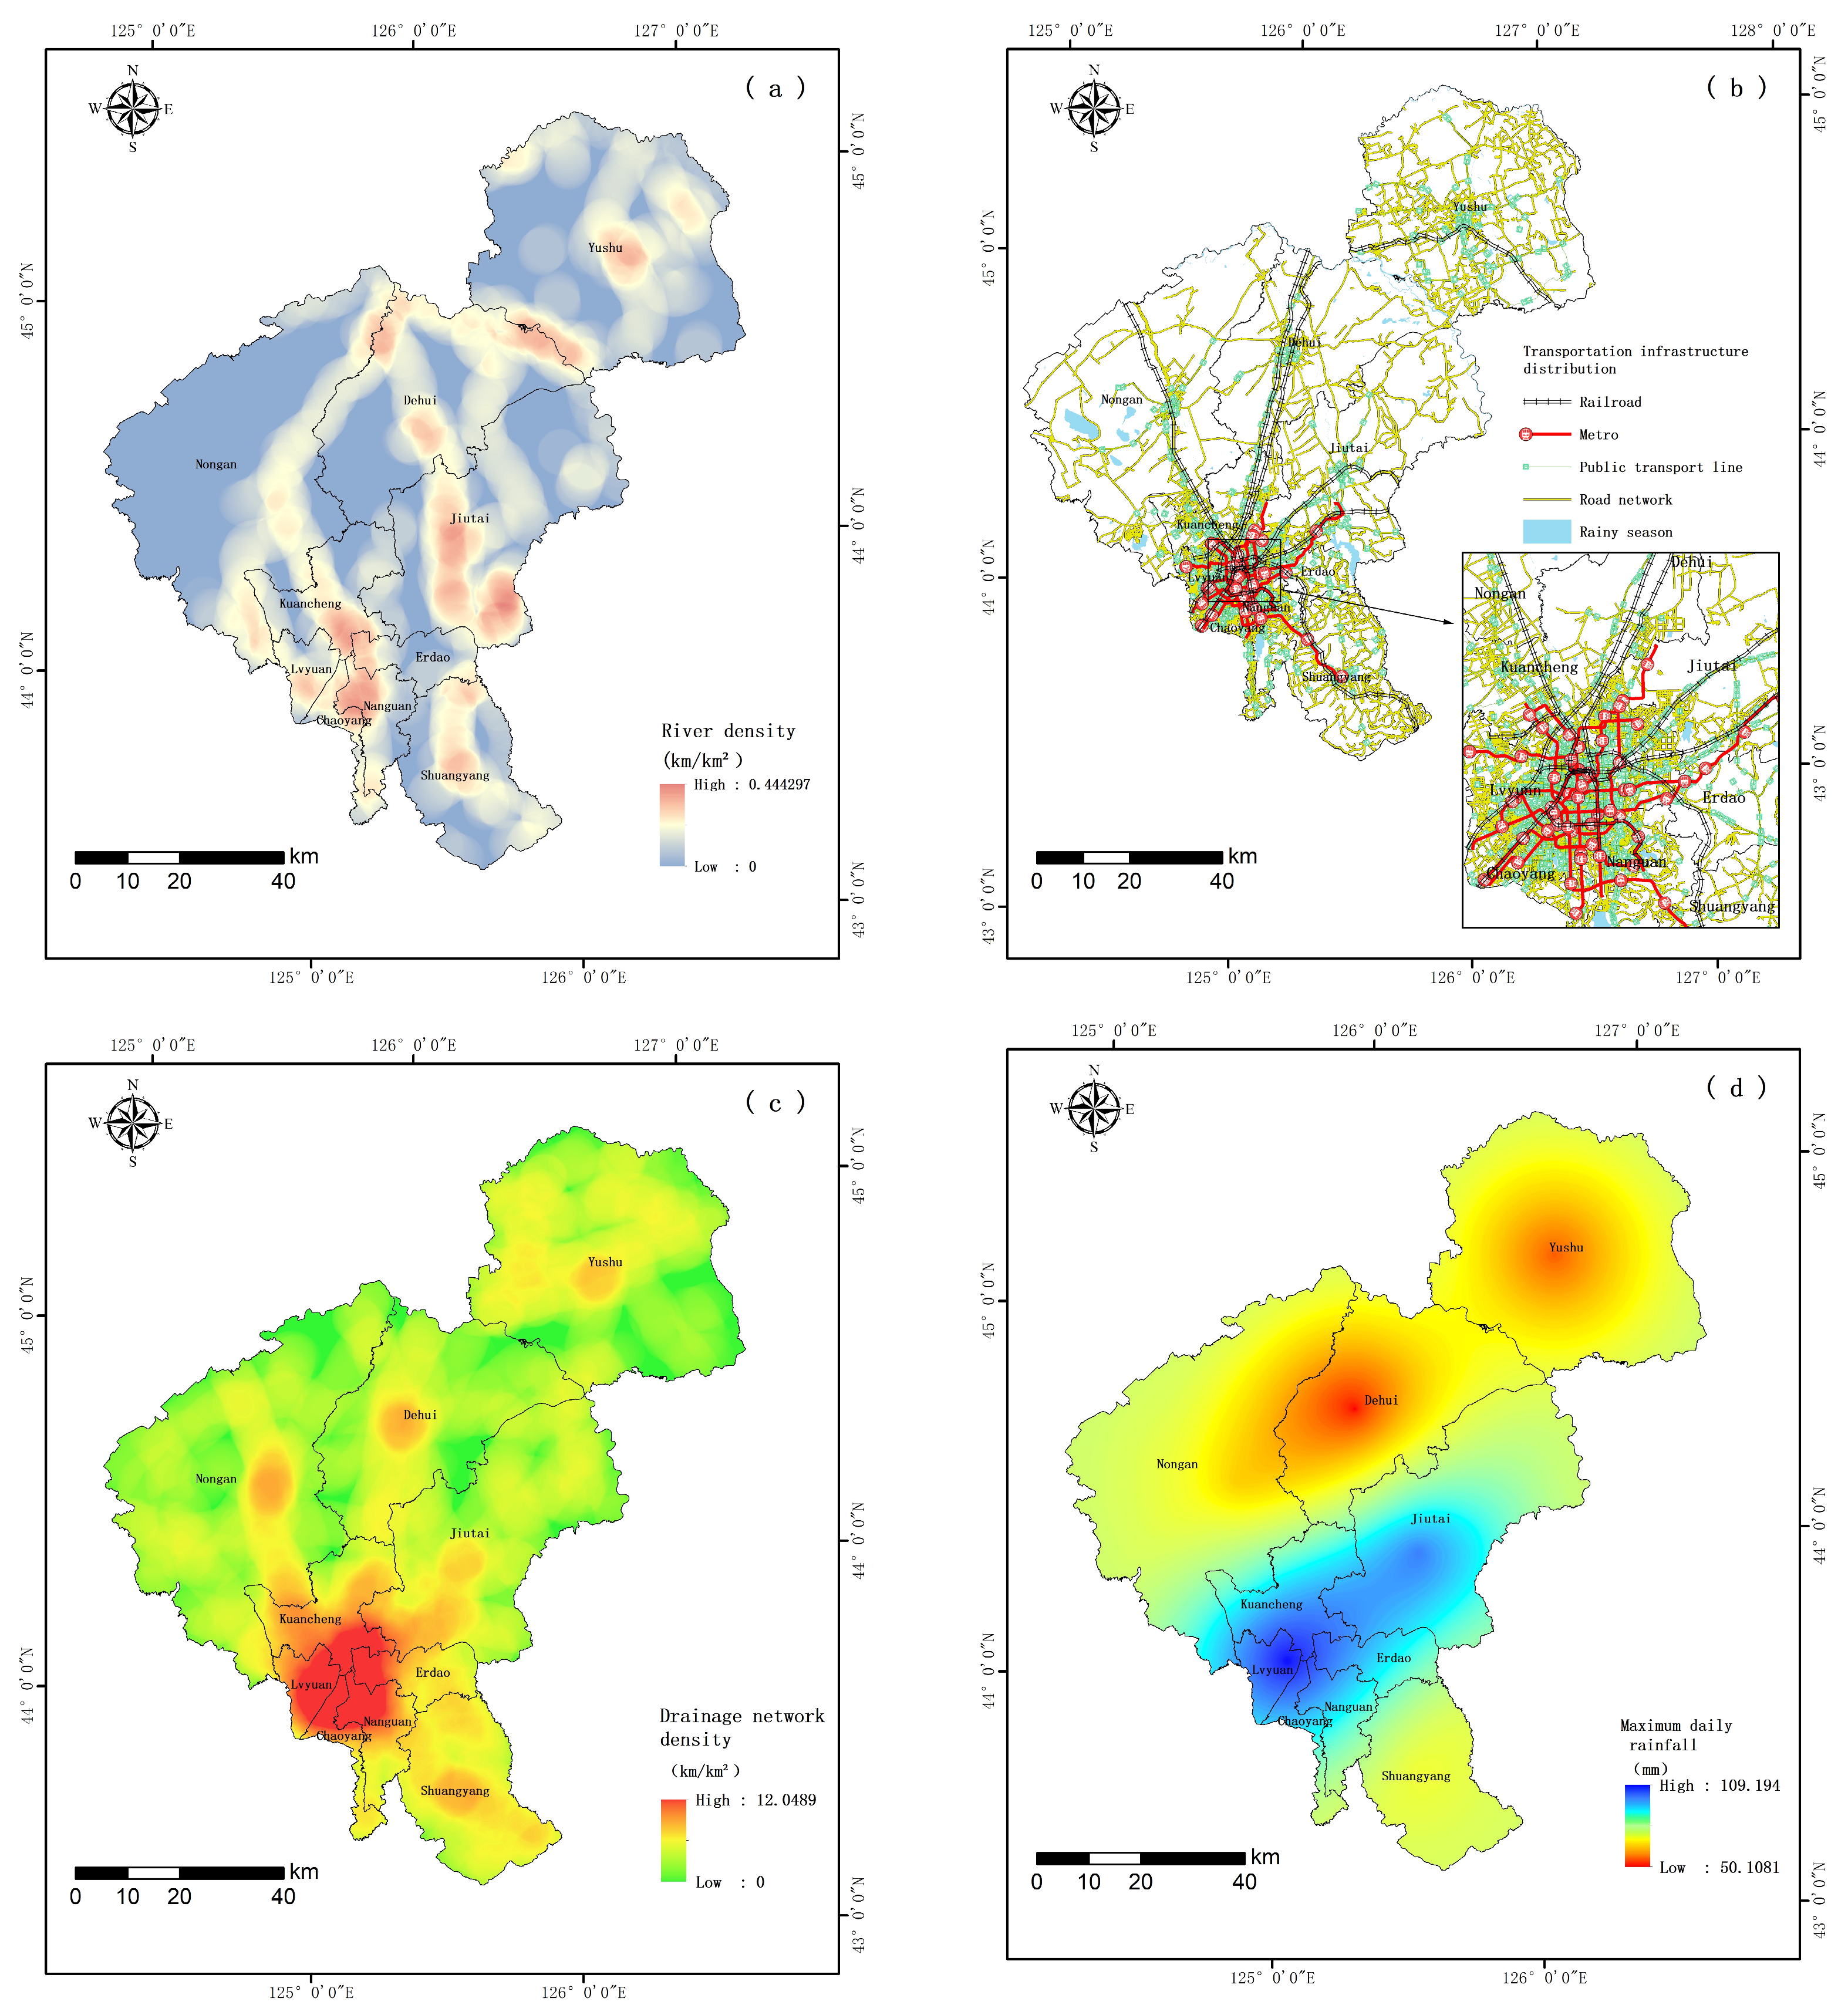
3.3. Physical Vulnerability Assessment

This section focuses on elucidating the physical vulnerability of transportation infrastructure by examining its structural integrity and stability in response to natural environmental factors and extreme rainfall. Understanding how infrastructure physically responds to disaster-induced challenges is crucial for preventing and mitigating damage, and serves as the cornerstone for ensuring the infrastructure’s long-term service provision and safety.
(a) River density: The density of rivers in Evergreen has a direct impact on its ability to cope with extreme rainfall. In areas with many rivers, the risk of flooding increases significantly, which poses a clear threat to transportation infrastructure. Therefore, special design and management measures are urgently needed in these areas to effectively reduce the risk of flooding and protect the city’s transportation from impacts [38].
(b) Transportation infrastructure distribution: The balanced distribution of transportation facilities is the key to enhancing the resilience of the entire system. Even though some facilities may be damaged, a balanced distribution ensures that the basic operational capacity of the network is maintained, thus guaranteeing the continuity and effectiveness of urban mobility [39].
(c) Drainage network density: The design of urban drainage networks is critical to mitigating the waterlogging effects of extreme rainfall. Dense drainage systems can quickly remove water from road surfaces, minimize structural damage, and ensure that roads remain open [40].
(d) Maximum daily rainfall: Estimating the maximum daily rainfall likely to occur under extreme weather conditions is critical to the development of flood protection standards for transportation infrastructure [41]. These standards guide engineering design to ensure that infrastructure can withstand the challenges of future extreme weather conditions.
(e) Number of days with annual rainfall > 50 mm: By analyzing annual rainfall frequency, the flood risk to the transportation system can be quantified. These data provide a scientific basis for the development of long-term flood prevention and control strategies, as well as emergency response plans [42].
(f) Average annual rainfall: Total rainfall in Changchun over the course of a year is critical to understanding the long-term hydrologic cycle and developing durable designs for infrastructure, helping to develop prevention and response strategies for frequent rainfall events, and ensuring the continuous operation and reliability of urban transportation under varying weather conditions [43].
(g) Soil type: Soil type affects the infiltration rate and carrying capacity of surface water and is extremely critical in preventing flood damage to infrastructure [44].
(h) DEM: Topographic features determine the direction of flood flow and areas of water accumulation, and play a decisive role in the layout of transportation infrastructure and the development of flood control measures. This is particularly important in sloping or low-lying areas, where topographic analysis is essential for the development of effective disaster prevention and control strategies [45].
In this section, we assess the physical vulnerability of transportation infrastructure in Changchun City during extreme rainfall events. Utilizing Geographic Information System (GIS) technology, this study conducts a detailed analysis of Changchun’s physical vulnerabilities. We examined key indicators such as river density, the spatial layout of transportation infrastructure, and the city’s drainage network capacity. By mapping the physical vulnerability of each region in Changchun during extreme rainfall events, our results indicate significant vulnerabilities in the city’s core areas. These vulnerabilities are primarily due to high river density and inadequate drainage infrastructure. For these high-risk areas, we recommend strategies to enhance the drainage system and improve the flood protection capabilities of the transportation infrastructure, thereby mitigating the potentially devastating effects of extreme rainfall. A map of the physical vulnerability assessment is displayed in Figure 5.

3.4. Functional Vulnerability Assessment

This study conducts a comprehensive analysis of functional vulnerability, aiming to assess the transportation system’s ability to sustain operational and service capabilities under extreme rainfall conditions. The assessment examines the system’s connectivity, operational efficiency, and emergency response capabilities—crucial factors in evaluating manpower and resource deployment efficiency in disaster situations and ensuring the transportation system’s swift functionality recovery.
(a) Degree of traffic congestion under extreme rainfall: This indicator is key to assessing the impact of extreme weather on urban traffic flows. The high incidence of traffic congestion suggests that the resilience and adaptability of the urban transportation system has decreased in the face of extreme weather events and that strategies are urgently needed to improve its efficiency and responsiveness [46].
(b) Emergency Response Facilities Distribution: The spatial distribution of emergency response facilities significantly affects the speed and effectiveness of urban responses to extreme events. A balanced and strategic spatial distribution facilitates rapid response and recovery, thereby mitigating the long-term impacts of disasters on transportation infrastructure [47].
(c) Transportation node density: This indicator reflects the complexity of connections within the transportation system [48]. High-density transportation nodes can improve the day-to-day efficiency of the system, but can become bottlenecks during recovery from extreme weather events, requiring optimized design to improve flexibility and resilience.
(d) Road network density: The density of the roadway network is related to the ability of cities to provide sufficient alternative routes to maintain traffic flow during extreme weather events [49]. Higher road network density spreads traffic pressure and increases the overall resilience of the system and continuity of service.
(e) Public transportation coverage: The extent of public transportation coverage is a key indicator for assessing the ability of cities to ensure the continued mobility of their inhabitants during extreme events [50]. An extensive public transportation network is essential for the effective evacuation of individuals and the transportation of emergency supplies in emergency situations.
This section analyzes functional vulnerability through a systematic approach, particularly focusing on the challenges of maintaining the transportation system’s operational and service capacities during extreme weather events. The study underscores the importance of enhancing the resilience and adaptive capacity of urban transportation systems to face future climate change challenges. A detailed map showing the functional vulnerability of the transportation system in Changchun was produced through a thorough assessment of traffic congestion, the layout of emergency response facilities, and the density of transportation nodes and road networks. The analysis revealed that while Changchun’s transportation network generally demonstrates resilience to extreme rainfall events, densely populated areas and areas near key transportation hubs are particularly susceptible to severe traffic congestion during such events. Optimized traffic scheduling strategies and improved emergency response mechanisms are recommended for these high-risk areas to ensure smooth traffic flow during extreme weather conditions. The results of the comprehensive assessment of functional vulnerability are displayed in Figure 6.

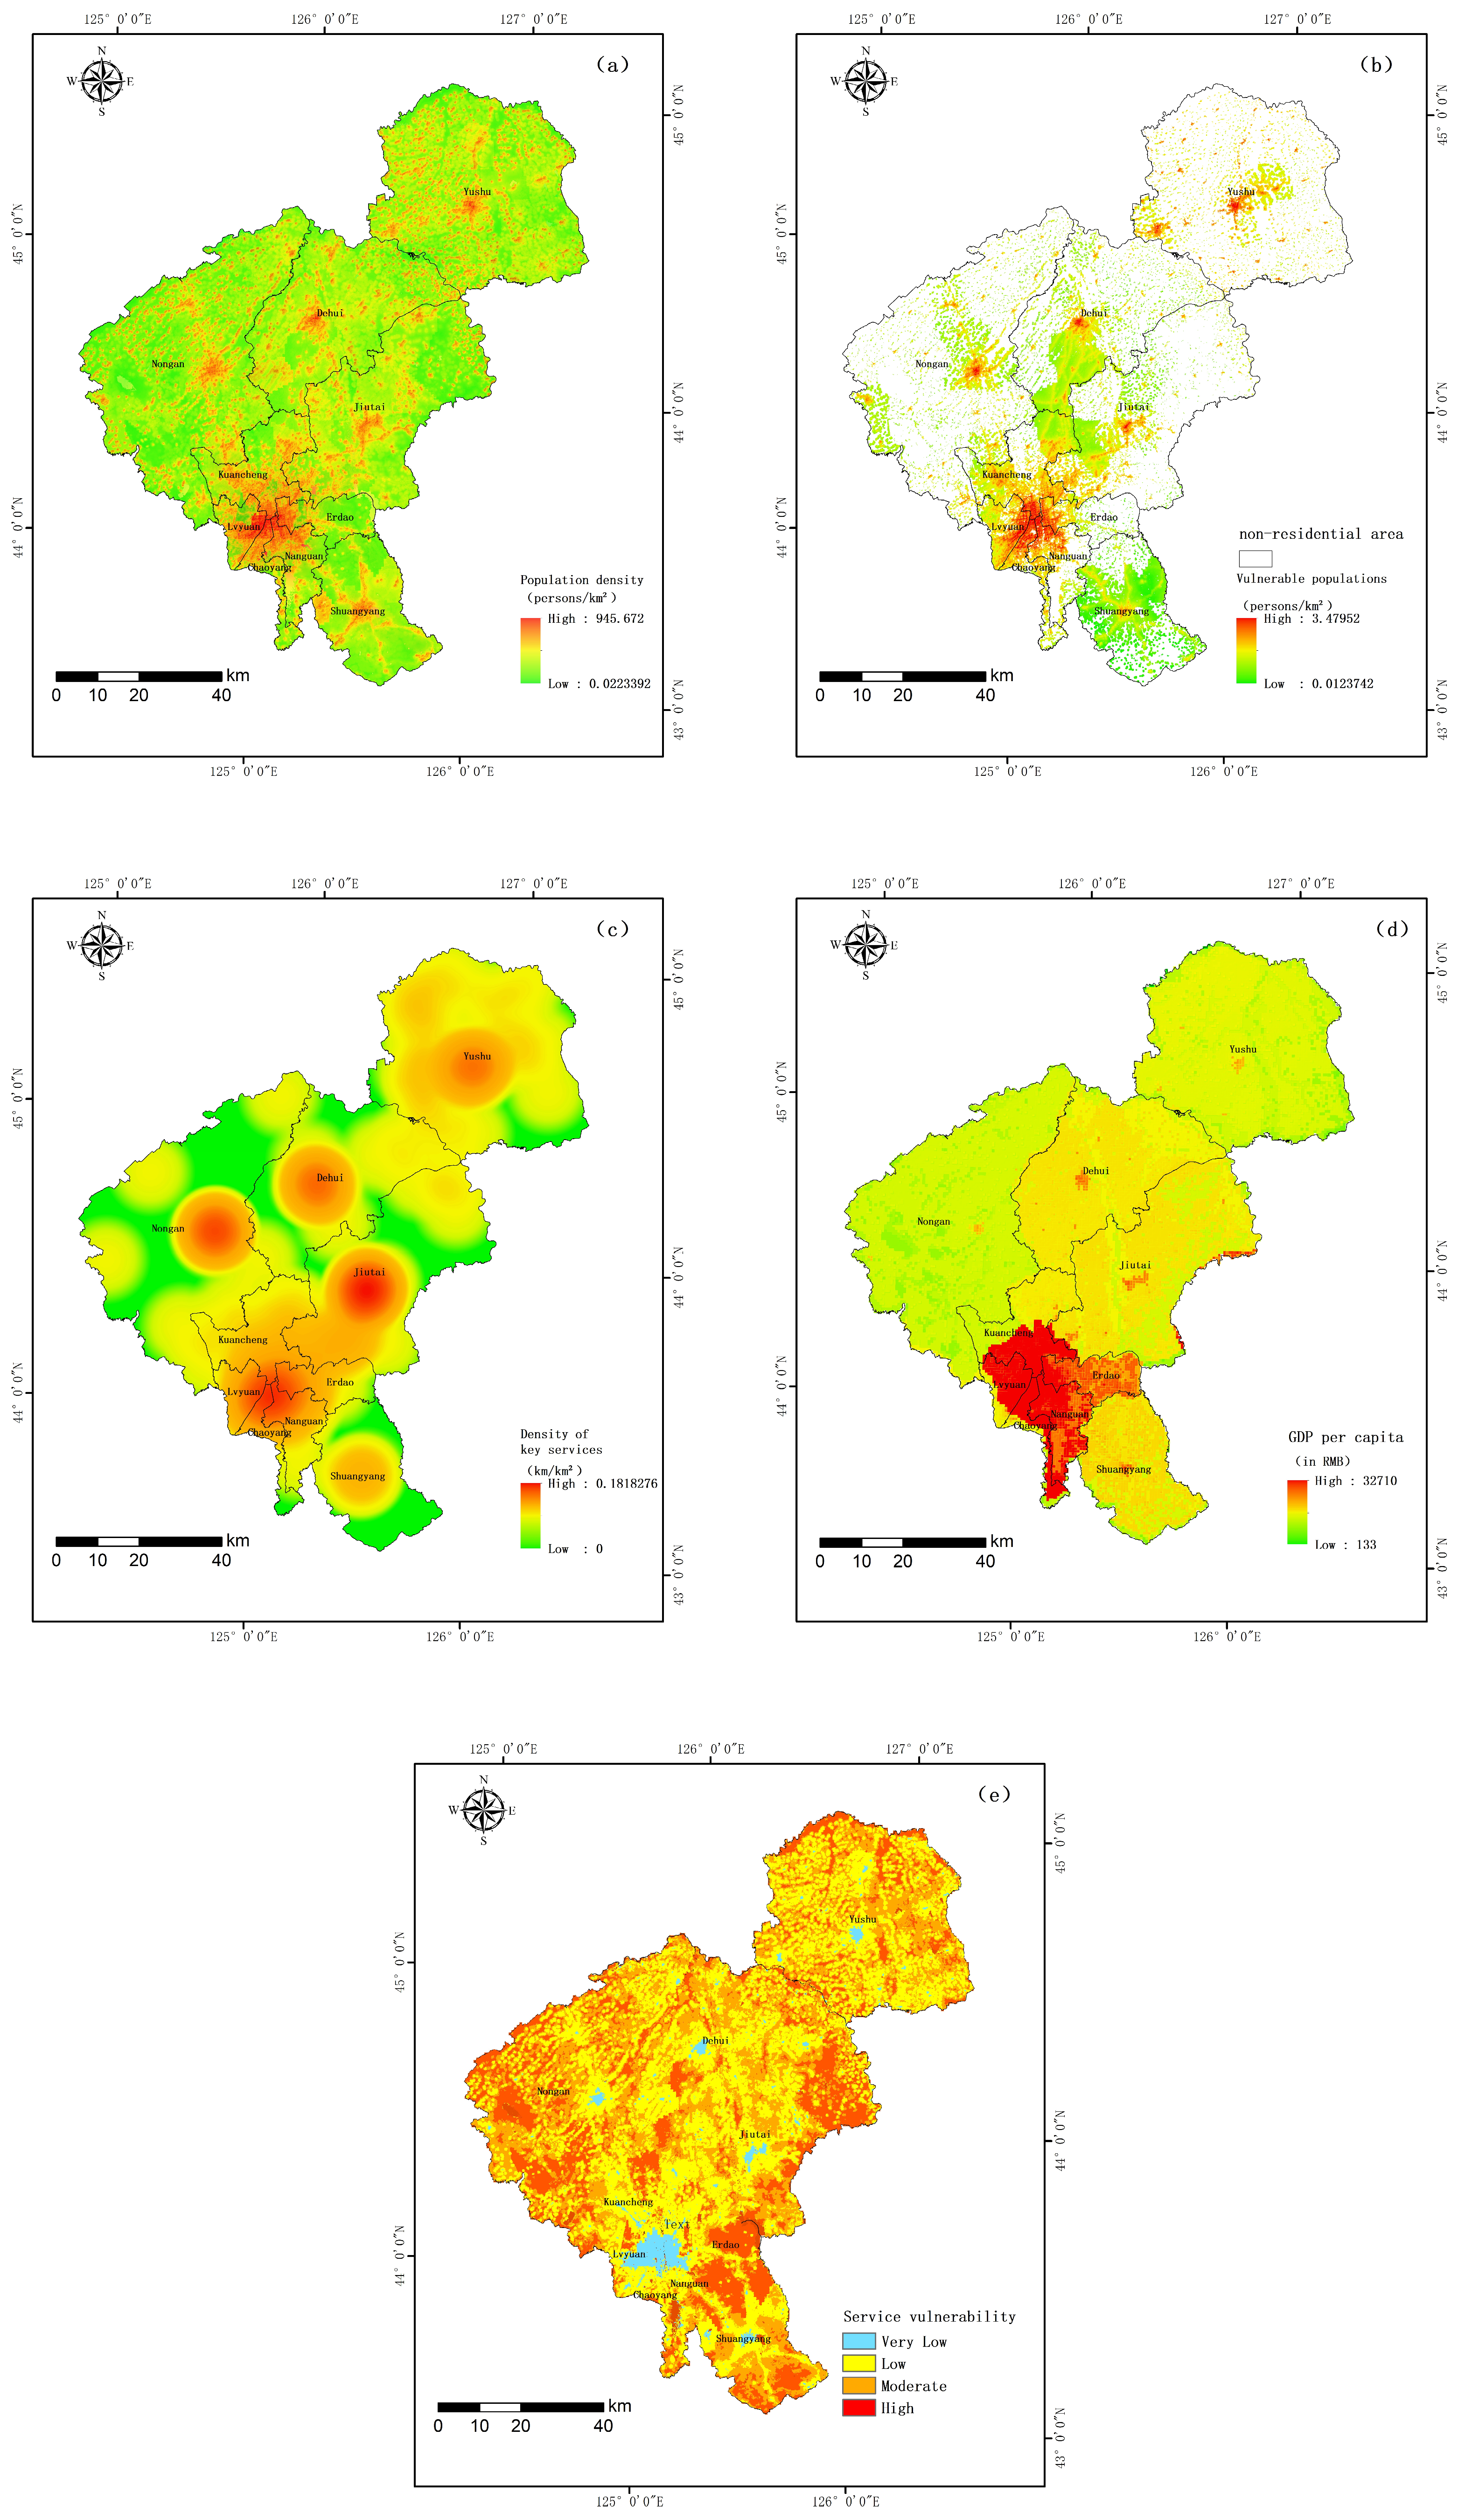
3.5. Service Vulnerability Assessment
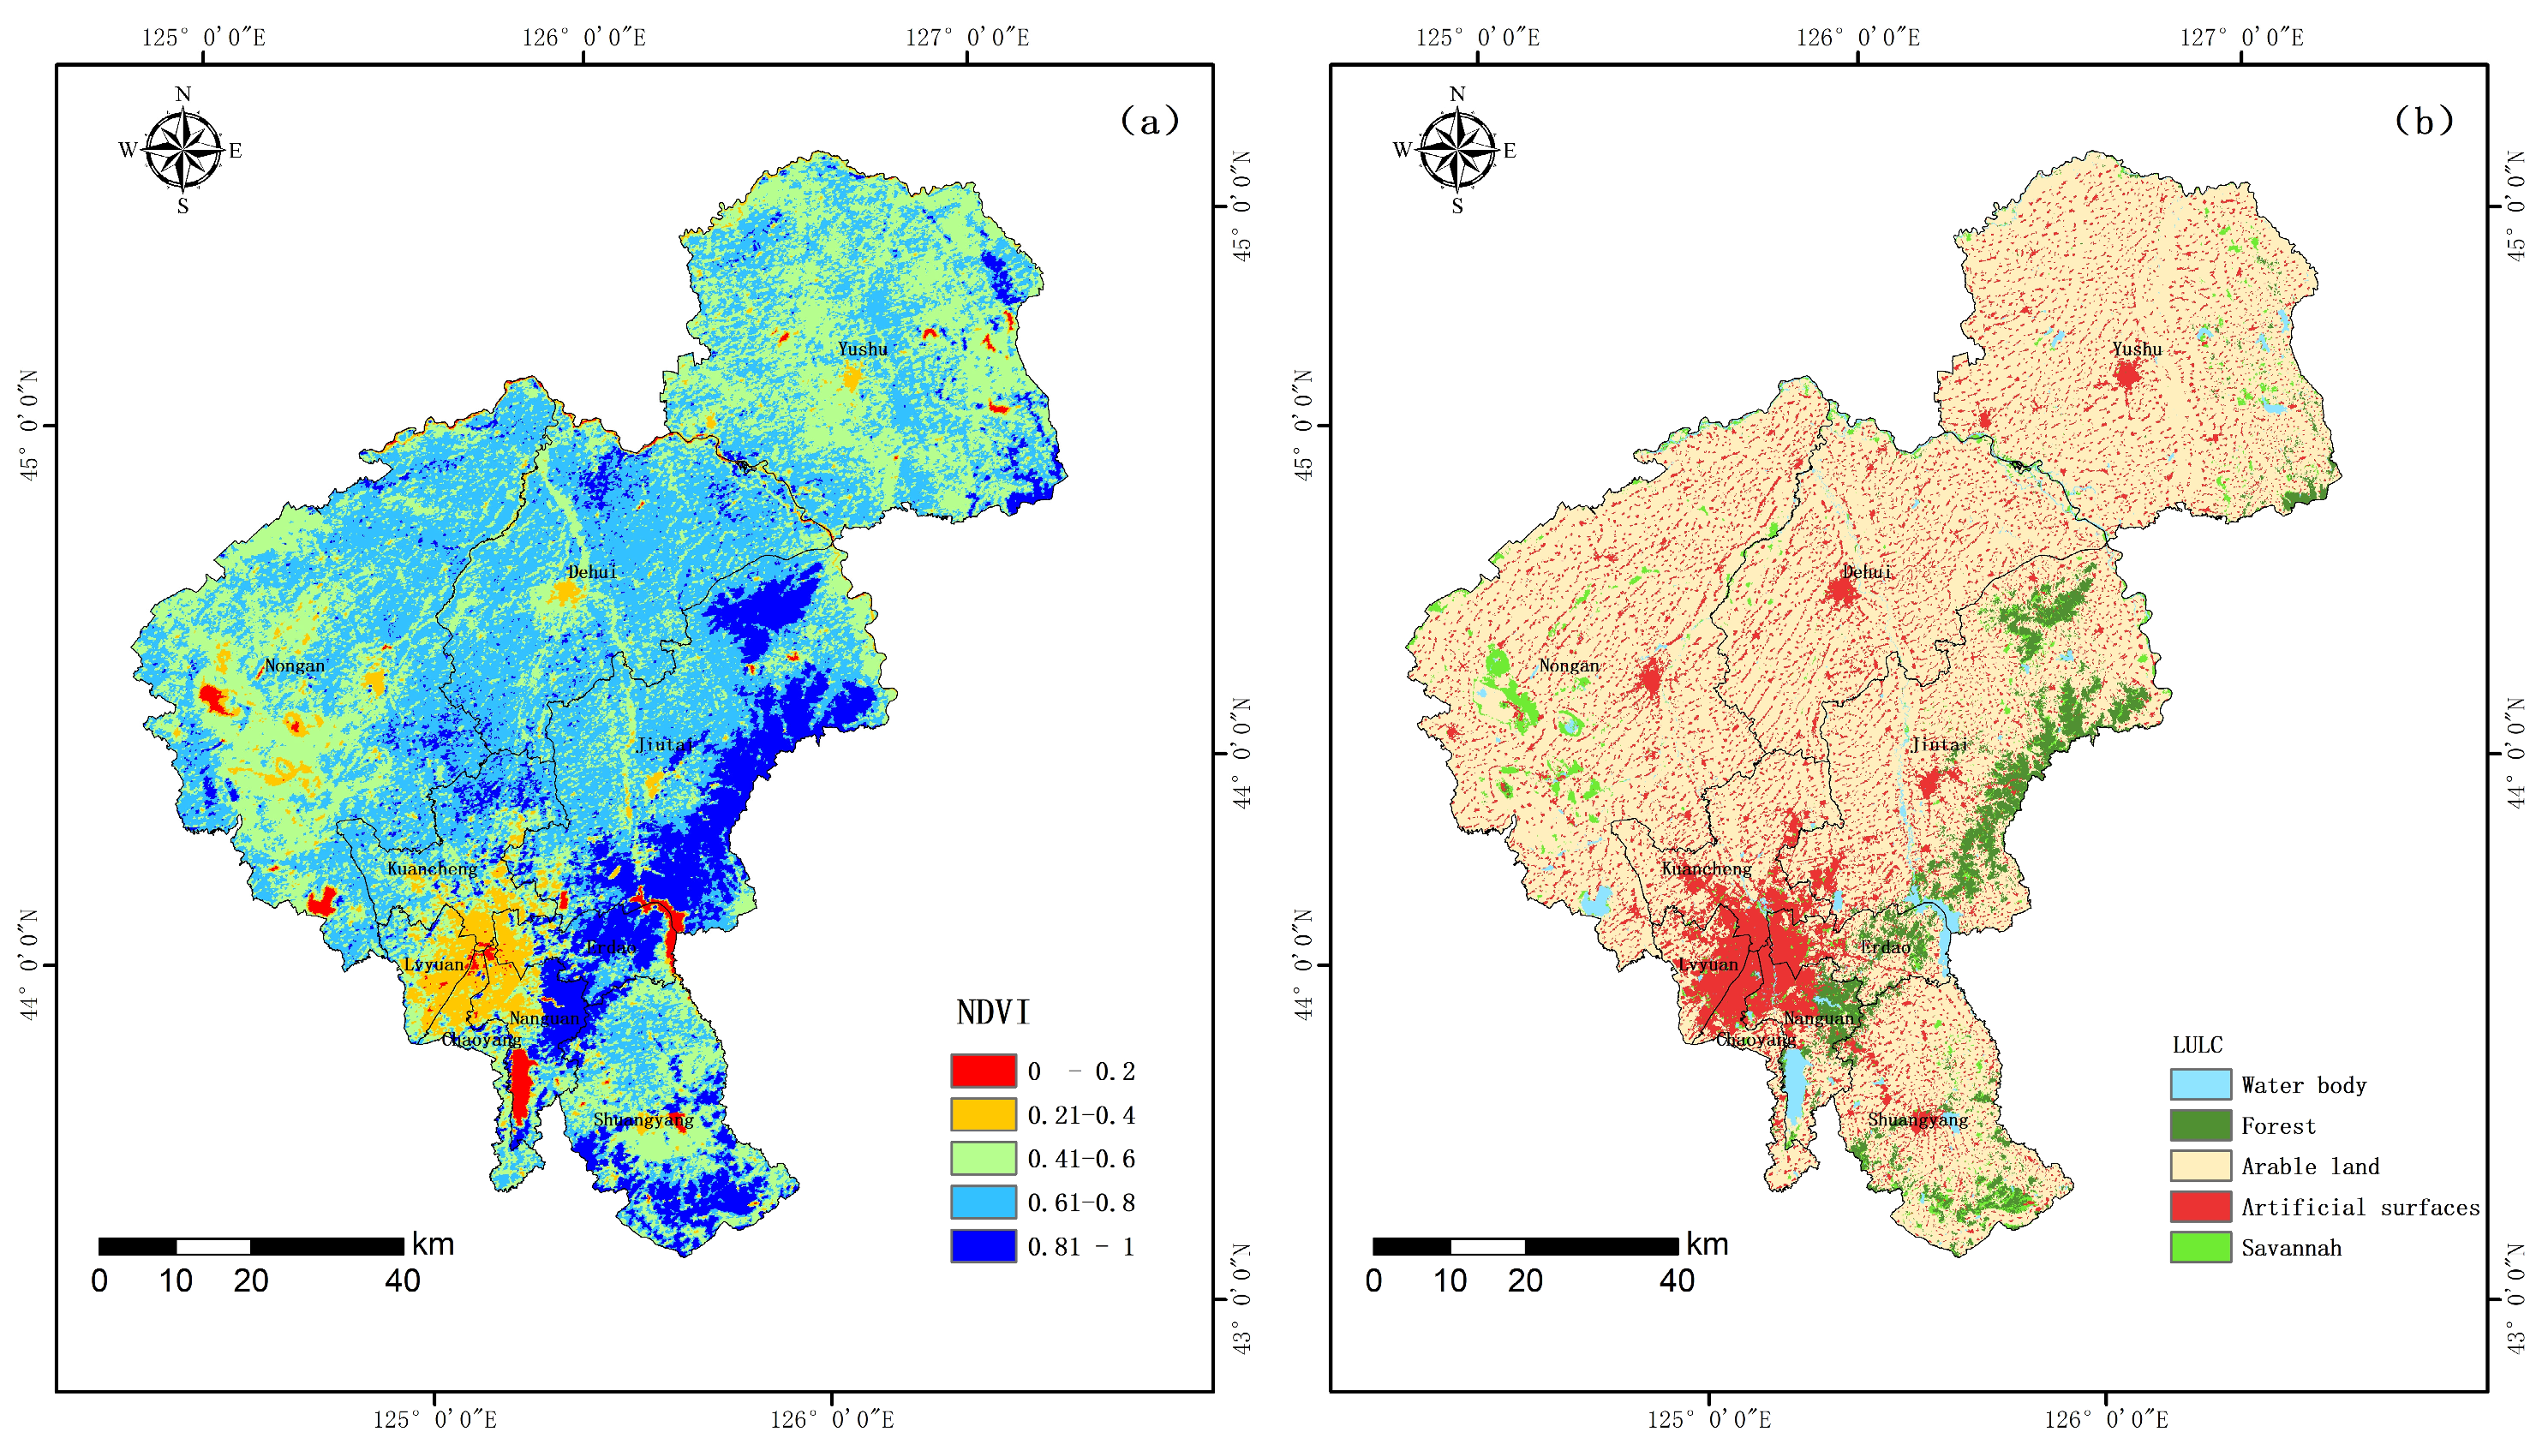
Service vulnerability offers insights into how disruptions in the transportation system affect socio-economic activities and their resilience. This dimension evaluates how well the infrastructure supports the daily lives of the population in emergencies or extreme situations, especially in terms of meeting critical services and needs to ensure the continuity of social functions.
(a) Population density: Residential density, a measure of population concentration in residential areas, is closely related to evacuation efficiency and necessary emergency resources during extreme weather events [51]. Highly populated areas experience increased pressure on services during disasters, which poses a challenge to the allocation of transportation and relief resources.
(b) Vulnerable populations: Identifying the distribution of vulnerable groups, such as children, the elderly, people with disabilities, and the unemployed, is essential to accurately assess the service vulnerability of transportation systems. These groups are particularly vulnerable during extreme weather events and require additional support and attention to ensure their safety and meet their mobility needs [52].
(c) Density of key services: The distribution of basic services, including health care, education and emergency services, significantly affects the ability of cities to respond to emergencies under extreme climatic conditions [53]. Adequate density of services is essential to provide the necessary support to residents during emergencies and to mitigate the social impacts of disasters.
(d) GDP per capita: This indicator reflects the economic capacity of cities to manage disasters and the resilience of their populations [54]. Areas with high GDP per capita typically have stronger resources to build and maintain highly resilient transportation systems, contributing to the rapid restoration of services after a disaster.
By analyzing the service vulnerability indicators described above, this study reveals the ability of urban transportation systems to maintain residents’ basic mobility and emergency needs during extreme weather events, as well as the sensitivity and preparedness of the community as a whole in the face of disasters. These findings provide a solid foundation for developing more humane and inclusive transportation strategies and emergency response plans. In particular, strengthening the resilience of public transportation systems, upgrading the quality of services to vulnerable groups, and guaranteeing accessibility to basic services during emergencies were identified as key strategies for increasing service vulnerability in urban environments. A graphical representation of the service vulnerability assessment is presented in Figure 7.

3.6. Sustainability

Sustainability focuses on the long-term effects on environmental, social, and economic resources in the planning and operation of transportation infrastructure. This dimension is pursued with the goal of promoting transportation solutions that are more environmentally friendly, economically efficient, and socially inclusive, tailored to meet future challenges and contribute to sustainable urban development.
(a) NDVI: Vegetation cover, a crucial aspect of urban greening, significantly contributes to regulating urban climate, reducing stormwater runoff, and enhancing air quality [55]. Optimizing vegetation cover in the planning phase of transportation infrastructure projects not only contributes to creating a more livable urban environment but also aids in mitigating the impacts of extreme weather events and enhancing cities’ adaptability to climate change.
(b) LULC: Land use type indicators demonstrate how land is allocated and utilized in urban planning, a pivotal aspect for optimizing transportation network layouts, minimizing environmental impacts, and fostering sustainable development [56]. Sensible land use planning not only guarantees the harmonious coexistence of transportation infrastructure and natural ecosystems but also enhances green mobility and achieves a win–win for economic development and environmental conservation.
By analyzing and applying two critical indicators—vegetation cover and land use type—the direction of transportation infrastructure development can be steered towards sustainability. This approach not only addresses current transportation needs but also thoroughly assesses the long-term environmental impact and societal well-being, laying a solid foundation for a greener, more efficient, and harmonious urban development blueprint. The spatial distribution of sustainability indicators is shown in Figure 8.

4. Strategies to Enhance the Resilience of Transportation Infrastructure in Changchun City

4.1. Transportation Infrastructure Resilience Zoning in Changchun City and Its Analysis

Utilizing a combination of the Multi-Criteria Decision Analysis (MCDM) model and GIS spatial analysis, this study conducts a comprehensive assessment of the resilience of Changchun City’s transportation infrastructure under extreme rainfall conditions. In this study, we distill a research framework that incorporates key indicators—such as river density, transportation infrastructure layout, drainage network density, and maximum daily rainfall—across four dimensions: physical vulnerability, functional vulnerability, service vulnerability, and sustainability. These indicators were weighted through a combination of subjective and objective approaches, based on their importance in the resilience assessment, to ensure an objective and comprehensive evaluation. Using Geographic Information System (GIS) technology, we were able to spatially present the data on the resilience of the Changchun transportation system, employing a natural breakpoint method to highlight the differences between the data, thus ensuring the accuracy and scientific validity of the assessment [57]. The results of the visual analysis in Figure 9 show the distribution of transportation infrastructure resilience in Changchun, providing valuable spatial decision support for urban planning and infrastructure development. The analysis identifies 3.57% of the area as highly resilient (red area), demonstrating strong flood resilience and recovery potential, which is often characterized by comprehensive infrastructure and effective emergency management systems. Moderately resilient areas (orange areas) comprise 9.14% of the area, demonstrating some resistance, but may require further intervention to improve operational efficiency during extreme events. Low resilience areas (yellow areas) account for 25.56% of the total area, indicating significant vulnerability to flooding and the need to prioritize resilience. Conversely, very low resilience areas (light blue areas) account for 61.73% of the total area, highlighting the urgent need to enhance resilience, such as improving drainage capacity, optimizing roadway design, and establishing a comprehensive disaster response plan. This analysis not only reflects the adaptive capacity of Changchun’s transportation infrastructure in the face of extreme rainfall, but also emphasizes the urgent need to improve the city’s overall resilience and disaster prevention capabilities. Against the backdrop of an increasing number of extreme weather events, these findings provide critical insights for urban planners and policy makers about reinforcing transportation system resilience and promoting sustainable urban development.

4.2. Example Analysis and Validation

To ascertain the reliability of the model employed in this study, this section presents a validation analysis through the examination of 266 flooding points recorded in Changchun City from 2017 to 2021 [58]. The data for these flooding incidents, derived from field surveys and news reports, illustrate waterlogging phenomena in specific city locales during extreme rainfall events, thus underscoring the physical vulnerability of the infrastructure in these areas. Utilizing GIS technology, the spatial distribution of the flooding points (Figure 10) was juxtaposed against the transportation infrastructure resilience areas delineated in this study. This analysis revealed a significant concentration of flooding points in low-resilience areas, particularly in very low resilience areas (light blue areas), aligning closely with the model’s predictions and affirming the heightened flood risks in these locales. In addition, flooding points were observed in areas of medium resilience (orange areas) and even high resilience capacity, highlighting the fact that no area can be completely protected from the risk of flooding during extreme rainfall events and emphasizing the need for integrated urban and infrastructure planning.
The example analysis not only substantiates the model’s validity employed in this study but also accentuates the criticality of fortifying the resilience of urban transportation infrastructure. Specifically, areas identified as possessing low resilience necessitate immediate intervention to mitigate flood risks, primarily through the enhancement of drainage system capabilities and strategic infrastructure retrofitting. These insights offer invaluable direction for urban planning and emergency management practices. It is advocated that the findings and analytical outcomes serve as a crucial reference for informed decision making in future urban infrastructure development and enhancement projects. Moreover, the zoning map introduced by this study, alongside its validation outcomes, promises to significantly bolster the adaptability and resilience of urban transportation networks against the backdrop of increasingly prevalent extreme weather phenomena.

4.3. Transportation Infrastructure Resilience Enhancement Strategies

Given the regional disparities in the resilience of Changchun’s transportation infrastructure under extreme rainfall conditions, this section outlines a series of enhancement strategies designed to boost the overall resilience of the urban transportation system.
First, reinforce key infrastructure by implementing quarterly comprehensive safety inspections of roads and bridges, and monthly evaluations of drainage systems in high and medium resilience areas (red and orange areas). This routine and systematic maintenance ensures timely identification and rectification of potential safety hazards. Second, enhance early warning and emergency response in low and very low resilience areas (yellow and light blue areas) by establishing a sophisticated monitoring and early warning system. For instance, install high-precision rain gauges and water level sensors in Changchun’s low-lying areas to monitor rainfall and waterlogging in real time and disseminate flood risk information instantly to residents’ cell phones and traffic control centers via the city’s early warning system. Third, initiate infrastructure enhancement projects in areas with low resilience, including frequently flooded locales like certain streets in Nanguan District, planning significant improvements in flood protection capacity by raising street elevation, constructing lateral drains, and installing additional removable floodwalls in critical areas. Fourth, public engagement and education aim to heighten public awareness about the critical role of resilience in transportation infrastructure. Conduct outreach activities to schools and communities, and through workshops, drills, and brochures, educate citizens on safety during flooding and participation in resilience-building projects. Lastly, foster cross-sectoral collaboration and funding by establishing a Resilience Building Coordinating Group comprising departments of transportation, urban planning, water resources, and emergency management to develop and implement a comprehensive resilience enhancement action plan. A dedicated fund will finance critical infrastructure projects, sourced from government budgets, private investment, and potential international assistance. This comprehensive strategy significantly advances Changchun’s transportation infrastructure resilience, mitigates the impacts of extreme rainfall, and enhances urban sustainability and security.

5. Discussion

This study comprehensively assesses the resilience of urban transportation infrastructure in Changchun City under extreme rainfall scenarios by developing a novel multidimensional assessment framework that integrates Geographic Information System (GIS) and Multi-Criteria Decision-Making (MCDM) techniques. The framework provides an exhaustive analysis across four key dimensions: physical, functional, service, and sustainability, representing a significant technological advancement in the field of urban infrastructure resilience.
Through GIS technology, this study achieves spatial visualization of infrastructure resilience data. This enhancement not only improves the accuracy of assessments but also provides urban planners with a clear basis for intervention. Meanwhile, MCDM technology was utilized to comprehensively assess and prioritize multiple resilience indicators, deepening the overall understanding of infrastructure resilience.
The study identifies specific vulnerabilities to extreme rainfall events in downtown Changchun and its low-lying areas. These regions are particularly susceptible to flooding due to their lower topography and inadequate drainage systems. This finding underscores the urgent need to strengthen infrastructure and enhance drainage systems in these critically vulnerable areas. Specific improvements, such as strengthening riverbank protections, constructing additional stormwater collection and drainage facilities, and optimizing urban planning to reduce potential flood paths, will directly enhance the resilience of these areas. These measures aim to reduce the direct damages caused by floods and improve the city’s overall emergency response and disaster recovery capacity.
Further analysis revealed that optimizing the configuration of congestion and emergency response facilities is crucial for enhancing the overall resilience of the city’s transportation system. Moreover, it is essential to ensure that all citizens, especially vulnerable groups, receive basic mobility and emergency services during extreme rainfall. Increasing vegetation cover and optimizing land use can mitigate the direct impacts of extreme rainfall and enhance the long-term resilience and disaster resistance of cities.
Through the innovative integration of GIS and MCDM, this study not only enhances the depth and breadth of resilience assessments of urban transportation infrastructure but also provides important insights and strategic recommendations for planners and decision makers in Changchun and beyond. In the context of global climate change, particularly with the increasing frequency of extreme rainfall events, the importance of implementing comprehensive strategies to enhance the resilience of urban transportation systems is emphasized. These strategies should not only focus on reinforcing infrastructure and improving emergency response capabilities but also on enhancing service continuity and incorporating sustainability principles into all aspects of planning. This approach ensures that urban transportation infrastructure can effectively respond to the challenges posed by climate change, thereby safeguarding the continuity and efficiency of urban mobility.

6. Conclusions

In this study, a novel multidimensional framework combining Geographic Information System (GIS) and Multi-Criteria Decision-Making Analysis (MCDM) was used to comprehensively analyze the resilience of Changchun’s transportation infrastructures under extreme rainfall conditions. Our findings highlight key weaknesses, as only 3.57% of the transportation infrastructures exhibit high resilience capacity to effectively cope with the impacts of extreme rainfall, while 61.73% of the transportation infrastructures have very low resilience capacity and are exposed to a significant risk of failure during extreme rainfall events.
The distinguishing feature of this innovative framework is the integration of multiple data types—physical, functional, and service vulnerabilities—providing a holistic approach to the assessment of the resilience capacity of urban infrastructure. By quantifying the impact of these vulnerabilities on sustainable urban development, we provide actionable insights for urban planners and policy makers. This facilitates targeted interventions that significantly increase resilience to extreme rainfall and support the adaptation of urban transportation systems to increasingly more frequent severe weather events. The empirical analysis confirms the effectiveness of the proposed resilience enhancement strategies, which aim not only to improve the robustness and resilience of the transportation system, but also to promote sustainable urban development. These strategies, which emphasize green infrastructure and greater disaster resilience, are essential in our systematic and integrated approach to urban planning.
In addition, this study presents scalable and replicable measures for building resilience that can be applied to other urban environments around the globe, making our findings applicable not only to Changchun, but also to any city facing similar climate and infrastructure challenges. This research advances the field of urban transportation infrastructure resilience by providing a quantifiable and actionable framework for improving infrastructure resilience. It provides a model that is not only applicable to Changchun, but also serves as a blueprint for other cities around the globe, thus signaling progress in the discipline of urban planning and contributing to a broader understanding of sustainable and adaptive urban growth strategies in the face of climate change-induced extreme rainfall.

Supplementary Materials

The following supporting information can be downloaded at: https://www.mdpi.com/article/10.3390/su16114780/s1.

Author Contributions

Z.W.: conceptualization, methodology, software, formal analysis, investigation, writing—original draft, visualization, data curation. Q.L.: methodology, resources, writing—review and editing. J.Z.: formal analysis, validation, supervision, writing—review and editing. Y.Z.: project administration, funding acquisition. D.Z.: resources. G.L.: writing—review and editing, data curation. All authors have read and agreed to the published version of the manuscript.

Funding

The Key Science and Technology Development Program Research and Development Projects of Jilin Province (20220203187SF).

Institutional Review Board Statement

Not applicable.

Informed Consent Statement

Not applicable.

Data Availability Statement

Data are available from the original providers—see Table 1.

Conflicts of Interest

The authors declare that they have no known competing financial interests or personal relationships that could have appeared to influence the work reported in this paper.

References

  1. Asadabadi, A.; Miller-Hooks, E. Assessing strategies for protecting transportation infrastructure from an uncertain climate future. Transp. Res. Part A Policy Pract. 2017, 105, 27–41. [Google Scholar] [CrossRef]
  2. Morsy, M.M.; Goodall, J.L.; O’Neil, G.L.; Sadler, J.M.; Voce, D.; Hassan, G.; Huxley, C. A cloud-based flood warning system for forecasting impacts to transportation infrastructure systems. Environ. Model. Softw. 2018, 107, 231–244. [Google Scholar] [CrossRef]
  3. Boakye, J.; Guidotti, R.; Gardoni, P.; Murphy, C. The role of transportation infrastructure on the impact of natural hazards on communities. Reliab. Eng. Syst. Safe 2022, 219, 108184. [Google Scholar] [CrossRef]
  4. Calle Müller, C.; ElZomor, M. Addressing Post-Disaster Challenges and Fostering Social Mobility through Origami Infrastructure and Construction Trade Education. Sustainability 2024, 16, 3415. [Google Scholar] [CrossRef]
  5. Diakakis, M.; Boufidis, N.; Salanova Grau, J.M.; Andreadakis, E.; Stamos, I. A systematic assessment of the effects of extreme flash floods on transportation infrastructure and circulation: The example of the 2017 Mandra flood. Int. J. Disaster Risk Reduct. 2020, 47, 101542. [Google Scholar] [CrossRef]
  6. Fang, X.; Lu, L.; Li, Y.; Hong, Y. A Driver-Pressure-State-Impact-Response study for urban transport resilience under extreme rainfall-flood conditions. Transp. Res. Part D Transp. Environ. 2023, 121, 103819. [Google Scholar] [CrossRef]
  7. Chen, Y.; Gaspari, J. Exploring an Integrated System for Urban Stormwater Management: A Systematic Literature Review of Solutions at Building and District Scales. Sustainability 2023, 15, 9984. [Google Scholar] [CrossRef]
  8. Iradukunda, P.; Mwanaumo, E.M.; Kabika, J. Modelling the future climate impacts on hydraulic infrastructure development in tropical (peri-)urban region: Case of Kigali, Rwanda. Heliyon 2024, 10, e27126. [Google Scholar] [CrossRef] [PubMed]
  9. Hussain, M.; Tayyab, M.; Ullah, K.; Ullah, S.; Rahman, Z.U.; Zhang, J.; Al-Shaibah, B. Development of a new integrated flood resilience model using machine learning with GIS-based multi-criteria decision analysis. Urban Clim. 2023, 50, 101589. [Google Scholar] [CrossRef]
  10. Borghetti, F.; Marchionni, G. Cross-border critical transportation infrastructure: A multi-level index for resilience assessment. Transp. Res. Procedia 2023, 69, 77–84. [Google Scholar] [CrossRef]
  11. Rahimi-Golkhandan, A.; Aslani, B.; Mohebbi, S. Predictive resilience of interdependent water and transportation infrastructures: A sociotechnical approach. Socio-Econ. Plan. Sci. 2022, 80, 101166. [Google Scholar] [CrossRef]
  12. Mohebbi, S.; Zhang, Q.; Christian Wells, E.; Zhao, T.; Nguyen, H.; Li, M.; Abdel-Mottaleb, N.; Uddin, S.; Lu, Q.; Wakhungu, M.J.; et al. Cyber-physical-social interdependencies and organizational resilience: A review of water, transportation, and cyber infrastructure systems and processes. Sustain. Cities Soc. 2020, 62, 102327. [Google Scholar] [CrossRef]
  13. Kapucu, N.; Hu, Q.; Sadiq, A.; Hasan, S. Building urban infrastructure resilience through network governance. Urban Gov. 2023, 3, 5–13. [Google Scholar] [CrossRef]
  14. Rathnayaka, B.; Robert, D.; Siriwardana, C.; Adikariwattage, V.V.; Pasindu, H.R.; Setunge, S.; Amaratunga, D. Identifying and prioritizing climate change adaptation measures in the context of electricity, transportation and water infrastructure: A case study. Int. J. Disaster Risk Reduct. 2023, 99, 104093. [Google Scholar] [CrossRef]
  15. Bi, W.; MacAskill, K.; Schooling, J. Old wine in new bottles? Understanding infrastructure resilience: Foundations, assessment, and limitations. Transp. Res. Part D Transp. Environ. 2023, 120, 103793. [Google Scholar] [CrossRef]
  16. Sharma, S.; Kumar, S.; Singh, A. Assessment of Green Infrastructure for sustainable urban water management. Environ. Dev. Sustain. 2023, 5, 1–10. [Google Scholar] [CrossRef]
  17. Barzaman, S.; Shamsipour, A.; Lakes, T.; Faraji, A. Indicators of urban climate resilience (case study: Varamin, Iran). Nat. Hazards 2022, 112, 119–143. [Google Scholar] [CrossRef]
  18. Fernández, D.S.; Lutz, M.A. Urban flood hazard zoning in Tucumán Province, Argentina, using GIS and multicriteria decision analysis. Eng. Geol. 2010, 111, 90–98. [Google Scholar] [CrossRef]
  19. Ainuddin, S.; Routray, J.K. Community resilience framework for an earthquake prone area in Baluchistan. Int. J. Disaster Risk Reduct. 2012, 2, 25–36. [Google Scholar] [CrossRef]
  20. Travis, W.R. Weather and climate extremes: Pacemakers of adaptation? Weather Clim. Extrem. 2014, 5, 29–39. [Google Scholar] [CrossRef]
  21. Rochas, C.; Kuzņecova, T.; Romagnoli, F. The concept of the system resilience within the infrastructure dimension: Application to a Latvian case. J. Clean. Prod. 2015, 88, 358–368. [Google Scholar] [CrossRef]
  22. Gouda, K.C.; Nahak, S.; Goswami, P. Evaluation of a GCM in seasonal forecasting of extreme rainfall events over continental India. Weather Clim. Extrem. 2018, 21, 10–16. [Google Scholar] [CrossRef]
  23. Ng, S.T.; Xu, F.J.; Yang, Y.; Lu, M.; Li, J. Necessities and challenges to strengthen the regional infrastructure resilience within city clusters. Procedia Eng. 2018, 212, 198–205. [Google Scholar] [CrossRef]
  24. Song, J.; Chang, Z.; Li, W.; Feng, Z.; Wu, J.; Cao, Q.; Liu, J. Resilience-vulnerability balance to urban flooding: A case study in a densely populated coastal city in China. Cities 2019, 95, 102381. [Google Scholar] [CrossRef]
  25. Thakur, D.A.; Mohanty, M.P. A synergistic approach towards understanding flood risks over coastal multi-hazard environments: Appraisal of bivariate flood risk mapping through flood hazard, and socio-economic-cum-physical vulnerability dimensions. Sci. Total Environ. 2023, 901, 166423. [Google Scholar] [CrossRef] [PubMed]
  26. Dong, X.; Jiang, L.; Zeng, S.; Guo, R.; Zeng, Y. Vulnerability of urban water infrastructures to climate change at city level. Resour. Conserv. Recycl. 2020, 161, 104918. [Google Scholar] [CrossRef]
  27. Roldán-Valcarce, A.; Jato-Espino, D.; Manchado, C.; Bach, P.M.; Kuller, M. Vulnerability to urban flooding assessed based on spatial demographic, socio-economic and infrastructure inequalities. Int. J. Disaster Risk Reduct. 2023, 95, 103894. [Google Scholar] [CrossRef]
  28. de Magalhães, R.F.; Danilevicz, Â.D.M.F.; de Souza, J.S.; Echeveste, M.E. The risk management tools’role for urban infrastructure resilience building. Urban Clim. 2022, 46, 101296. [Google Scholar] [CrossRef]
  29. Morshed, S.A.; Arafat, M.; Mokhtarimousavi, S.; Khan, S.S.; Amine, K. 8R Resilience Model: A stakeholder-centered approach of disaster resilience for transportation infrastructure and network. Transp. Eng. 2021, 4, 100058. [Google Scholar] [CrossRef]
  30. Esmalian, A.; Yuan, F.; Rajput, A.A.; Farahmand, H.; Dong, S.; Li, Q.; Gao, X.; Fan, C.; Lee, C.; Hsu, C.; et al. Operationalizing resilience practices in transportation infrastructure planning and project development. Transp. Res. Part D Transp. Environ. 2022, 104, 103214. [Google Scholar] [CrossRef]
  31. Burayu, D.G.; Karuppannan, S.; Shuniye, G. Identifying flood vulnerable and risk areas using the integration of analytical hierarchy process (AHP), GIS, and remote sensing: A case study of southern Oromia region. Urban Clim. 2023, 51, 101640. [Google Scholar] [CrossRef]
  32. Wu, J.; Chen, X.; Lu, J. Assessment of long and short-term flood risk using the multi-criteria analysis model with the AHP-Entropy method in Poyang Lake basin. Int. J. Disaster Risk Reduct. 2022, 75, 102968. [Google Scholar] [CrossRef]
  33. Mukhametzyanov, I. Specific character of objective methods for determining weights of criteria in MCDM problems: Entropy, CRITIC and SD. Decis. Mak. Appl. Manag. Eng. 2021, 4, 76–105. [Google Scholar] [CrossRef]
  34. Li, C.; Chen, X.; Li, Z.; Zhang, Y.; Yue, K.; Ma, J.; Wang, M.; Zhao, L.; Qi, E. Comprehensive evaluation method of transmission line operating status based on improved combination weighting evaluation model. Energy Rep. 2022, 8, 387–397. [Google Scholar] [CrossRef]
  35. Zhang, X.; Mao, F.; Gong, Z.; Hannah, D.M.; Cai, Y.; Wu, J. A disaster-damage-based framework for assessing urban resilience to intense rainfall-induced flooding. Urban Clim. 2023, 48, 101402. [Google Scholar] [CrossRef]
  36. Gabriels, K.; Willems, P.; Van Orshoven, J. Performance evaluation of spatially distributed, CN-based rainfall-runoff model configurations for implementation in spatial land use optimization analyses. J. Hydrol. 2021, 602, 126872. [Google Scholar] [CrossRef]
  37. Singh, T. Entropy weighted WASPAS and MACBETH approaches for optimizing the performance of solar water heating system. Case Stud. Therm. Eng. 2024, 53, 103922. [Google Scholar] [CrossRef]
  38. Gao, C.; Zhang, B.; Shao, S.; Hao, M.; Zhang, Y.; Xu, Y.; Kuang, Y.; Dong, L.; Wang, Z. Risk assessment and zoning of flood disaster in Wuchengxiyu Region, China. Urban Clim. 2023, 49, 101562. [Google Scholar] [CrossRef]
  39. Foltin, P.D.P.; Nagy, P.D.J.; Ondryhal, P.D.V. Using Big Data Analysis in increasing transportation infrastructure resilience. Transp. Res. Procedia 2023, 74, 1508–1515. [Google Scholar] [CrossRef]
  40. Crimmins, M.; Park, S.; Smith, V.; Kremer, P. A spatial assessment of high-resolution drainage characteristics and roadway safety during wet conditions. Appl. Geogr. 2021, 133, 102477. [Google Scholar] [CrossRef]
  41. Alves, G.J.; Mello, C.R.; Guo, L.; Thebaldi, M.S. Natural disaster in the mountainous region of Rio de Janeiro state, Brazil: Assessment of the daily rainfall erosivity as an early warning index. Int. Soil Water Conserv. Res. 2022, 10, 547–556. [Google Scholar] [CrossRef]
  42. Fofana, M.; Adounkpe, J.; Larbi, I.; Hounkpe, J.; Djan’Na Koubodana, H.; Toure, A.; Bokar, H.; Dotse, S.; Limantol, A.M. Urban flash flood and extreme rainfall events trend analysis in Bamako, Mali. Environ. Chall. 2022, 6, 100449. [Google Scholar] [CrossRef]
  43. Gao, W.; Hu, X.; Wang, N. Resilience analysis in road traffic systems to rainfall events: Road environment perspective. Transp. Res. Part D Transp. Environ. 2024, 126, 104000. [Google Scholar] [CrossRef]
  44. Li, J.; Zhou, J.; Wang, J. Consideration of vegetation interception of rainfall within the SCS-CN model: Application to the west bank of Dianchi Lake. J. Hydrol. Reg. Stud. 2023, 49, 101490. [Google Scholar] [CrossRef]
  45. Yu, S.; Yuan, M.; Wang, Q.; Corcoran, J.; Xu, Z.; Peng, J. Dealing with urban floods within a resilience framework regarding disaster stages. Habitat Int. 2023, 136, 102783. [Google Scholar] [CrossRef]
  46. Zheng, Z.; Wang, Z.; Liu, S.; Ma, W. Exploring the spatial effects on the level of congestion caused by traffic accidents in urban road networks: A case study of Beijing. Travel Behav. Soc. 2024, 35, 100728. [Google Scholar] [CrossRef]
  47. Khayal, D.; Pradhananga, R.; Pokharel, S.; Mutlu, F. A model for planning locations of temporary distribution facilities for emergency response. Socio-Econ. Plan. Sci. 2015, 52, 22–30. [Google Scholar] [CrossRef]
  48. Sullivan, J.L.; Novak, D.C. A method for evaluating accessibility in transportation problems considering social vulnerability. Eur. J. Oper. Res. 2024, 317, 646–659. [Google Scholar] [CrossRef]
  49. Pulugurtha, S.S.; Mathew, S. Modeling AADT on local functionally classified roads using land use, road density, and nearest nonlocal road data. J. Transp. Geogr. 2021, 93, 103071. [Google Scholar] [CrossRef]
  50. Chen, X.; Pei, T.; Song, C.; Shu, H.; Guo, S.; Wang, X.; Liu, Y.; Chen, J.; Zhou, C. Accessing public transportation service coverage by walking accessibility to public transportation under flow buffering. Cities 2022, 125, 103646. [Google Scholar] [CrossRef]
  51. Pascoal, R.; Rocha, H. Population density impact on COVID-19 mortality rate: A multifractal analysis using French data. Phys. A Stat. Mech. Its Appl. 2022, 593, 126979. [Google Scholar] [CrossRef] [PubMed]
  52. Krigel, K.; Benjamin, O.; Cohen, N.; Tchetchik, A. Municipal authorities’ climate change adaptation plans: Barriers to the inclusion of intensified needs of vulnerable populations. Urban Clim. 2023, 49, 101433. [Google Scholar] [CrossRef]
  53. Guo, J.; Brakewood, C. Analysis of spatiotemporal transit accessibility and transit inequity of essential services in low-density cities, a case study of Nashville, TN. Transp. Res. Part A Policy Pract. 2024, 179, 103931. [Google Scholar] [CrossRef]
  54. Huang, L.; Liu, Q.; Tang, Y. Long-term economic impact of disasters: Evidence from multiple earthquakes in China. World Dev. 2024, 174, 106446. [Google Scholar] [CrossRef]
  55. Zhou, Y.; Shao, M.; Li, X. Temporal and Spatial Evolution, Prediction, and Driving-Factor Analysis of Net Primary Productivity of Vegetation at City Scale: A Case Study from Yangzhou City, China. Sustainability 2023, 15, 14518. [Google Scholar] [CrossRef]
  56. Kudas, D.; Wnęk, A.; Hudecová, Ľ.; Fencik, R. Spatial Diversity Changes in Land Use and Land Cover Mix in Central European Capitals and Their Commuting Zones from 2006 to 2018. Sustainability 2024, 16, 2224. [Google Scholar] [CrossRef]
  57. de Moura, R.A.V.; Delgado, J.P.M.; De Freitas Dourado, A.B.; de Andrade, M.O. Exploring the modal integration of bike-sharing and urban rail transit: Multi-Criteria Evaluation in GIS for the city of Salvador (Bahia—Brazil). Case Stud. Transp. Policy 2024, 16, 101182. [Google Scholar] [CrossRef]
  58. Zhang, Z.; Zhang, J.; Zhang, Y.; Chen, Y.; Yan, J. Urban Flood Resilience Evaluation Based on GIS and Multi-Source Data: A Case Study of Changchun City. Remote Sens. 2023, 15, 1872. [Google Scholar] [CrossRef]
Figure 1. Topographic map of the study area with elevation.
Sustainability 16 04780 g001
Figure 2. Flowchart for assessing the resilience of urban transportation infrastructure under extreme rainfall.
Sustainability 16 04780 g002
Figure 3. Changes in daily rainfall over the period 2011–2020.
Sustainability 16 04780 g003
Figure 4. A 100-year storm in Changchun depth of surface runoff.
Sustainability 16 04780 g004
Figure 5. (a) River density, (b) Transportation infrastructure distribution, (c) Drainage network density, (d) Maximum daily rainfall, (e) Number of days with annual rainfall > 50 mm, (f) Average annual rainfall, (g) Soil type, (h) DEM, (i) Physical vulnerability assessment map.
Sustainability 16 04780 g005aSustainability 16 04780 g005b
Figure 6. (a) Degree of traffic congestion under extreme rainfall, (b) Emergency Response Facilities Distribution, (c) Transportation node density, (d) Road network density, (e) Public transportation coverage, (f) Functional vulnerability assessment map.
Sustainability 16 04780 g006
Figure 7. (a) Population density, (b) Vulnerable populations, (c) Density of key services, (d) GDP per capita, (e) Service vulnerability assessment map.
Sustainability 16 04780 g007
Figure 8. Spatial distribution of sustainability indicators (a) NDVI, (b) LULC.
Sustainability 16 04780 g008
Figure 9. Changchun City transportation infrastructure resilience zoning map.
Sustainability 16 04780 g009
Figure 10. Map of waterlogged spots in Changchun City.
Sustainability 16 04780 g010
Table 1. Selection of assessment indicators.
Target LayerIndicatorsSub-IndicatorsData TypeDate DetailsData Source
Physical vulnerabilityEnvironmental factorRiver densityRaster data2024National Data Center for Meteorological Sciences
Transportation infrastructure distributionPOI2024Planning cloud
Drainage network densityRaster data2024Geospatial data clouds
Climatic conditionsMaximum daily rainfallRaster data2011–2020Jilin Meteorological Service
Number of days with annual rainfall > 50 mmRaster data2011–2020Jilin Meteorological Service
Average annual rainfallRaster data2011–2020Jilin Meteorological Service
VulnerabilitySoil typeRaster data2024Geospatial data clouds
DEMRaster data2024Geospatial data clouds
Functional vulnerabilityEmergency response and managementDegree of traffic congestion under extreme rainfallRaster data2011–2022Changchun Statistical Yearbook
Emergency Response Facilities DistributionPOI2024Planning cloud
Transportation node densityRaster data2024Planning cloud
Accessibility and reachabilityroad network densityRoad network
Shape file
2024Geospatial data clouds
Public transportation coverageRaster data2024Planning cloud
Service vulnerabilitySocial impact and responsivenesspopulation densityRaster data2017–2022Geospatial data clouds
Vulnerable populationsRaster data2017–2022Planning cloud
Density of key servicesRaster data2024Planning cloud
GDP per capitaRaster data2017–2022National Bureau of Statistics
sustainabilityEnvironment and ecologyNDVILandsat 8 OLI/TIRS2022Databox
LULCRaster data2022Databox
Table 2. Pairwise comparison judgment matrix.
ScaleMeaning
1Equally important
3Moderately more important
5Strongly more important
7Very strongly more important
9Extremely more important
2, 4, 6, 8Intermediate values
Table 3. Average random consistency indicator values ( R I ) .
Order123456789
RI0.000.580.901.121.241.321.411.451.49
Table 4. Weights of urban transportation infrastructure resilience indicators.
Target LayerTarget Layer WeightIndicatorsSub-IndicatorsSubjective WeightsObjective WeightsPortfolio Weights
Physical vulnerability0.327Environmental factorRiver density0.0880.0930.089
Transportation infrastructure distribution0.0850.0900.086
Drainage network density0.0920.0970.093
Climatic conditionsMaximum daily rainfall0.0940.0990.096
Number of days with annual rainfall > 50 mm0.0760.0810.077
Average annual rainfall0.0740.0790.075
VulnerabilitySoil type0.0790.0840.080
DEM0.0960.1010.098
Functional vulnerability0.264Emergency response and managementDegree of traffic congestion under extreme rainfall0.0710.0760.072
Emergency Response Facilities Distribution0.0690.0740.071
Transportation node density0.0730.0780.074
Accessibility and reachabilityroad network density0.0670.0720.068
Public transportation coverage0.0700.0750.072
Service vulnerability0.211Social impact and responsivenessPopulation density0.0650.0700.067
Vulnerable populations0.0630.0680.065
Density of key services0.0680.0730.070
GDP per capita0.0640.0690.066
Sustainability0.188Environment and ecologyNDVI0.0800.0850.081
LULC0.0820.0870.083
Table 5. Conversion table for CN values.
Land Use TypeAMC I
Water body100
Forest35
Savannah50
Arable land52
Artificial surfaces95
Unused land63
Roads94
Disclaimer/Publisher’s Note: The statements, opinions and data contained in all publications are solely those of the individual author(s) and contributor(s) and not of MDPI and/or the editor(s). MDPI and/or the editor(s) disclaim responsibility for any injury to people or property resulting from any ideas, methods, instructions or products referred to in the content.

