Article

Technical–Economic Analysis for Ammonia Ocean Transportation Using an Ammonia-Fueled Carrier

1
Offshore Industries R&BD Center, Korea Research Institute of Ships & Ocean Engineering, 1350, Geojebuk-ro, Jangmok-myeon, Geoje-si 53201, Republic of Korea
2
Energy and Climate Policy Research Group, Division of Hydrogen Economy, Korea Energy Economics Institute, 405-11, Jongga-ro, Jung-gu, Ulsan 44543, Republic of Korea
3
Department of Mechanical Convergence Engineering, Gyeongsang National University, 48-54 Charyong-ro, Uichang-gu, Changwon 51391, Republic of Korea
*
Author to whom correspondence should be addressed.
Sustainability 2024, 16(2), 827; https://doi.org/10.3390/su16020827
Submission received: 12 December 2023 / Revised: 9 January 2024 / Accepted: 15 January 2024 / Published: 18 January 2024

Abstract

:
This study performed a technical–economic analysis for ship-based ammonia transportation to investigate the feasibility of international ammonia transportation. Ammonia is considered to be a vital hydrogen carrier, so the international trade in ammonia by ship will considerably increase in the future. This study proposed three scenarios for transporting ammonia from the USA, Saudi Arabia, and Australia to South Korea and employed an 84,000 m3 class ammonia carrier. Not only traditional very low sulfur fuel oil (VLSFO)/marine diesel oil (MDO) but also LNG and ammonia fuels were considered as propulsion and power generation fuels in the carrier. A life-cycle cost (LCC) model consisting of capital expenditure (CAPEX) and operational expenditure (OPEX) was employed for the cost estimation. The results showed that the transportation costs depend on the distance. The unit transportation cost from the USA to South Korea was approximately three times higher than that of Australia to South Korea. Ammonia fuel yielded the highest costs among the fuels investigated (VLSFO/MGO, LNG, and ammonia). When using ammonia fuel, the unit transportation cost was approximately twice that when using VLSFO/MDO. The fuel costs occupied the largest portion of the LCC. The unit transportation costs from Australia to South Korea were 23.6 USD/ton-NH3 for the LVSFO/MDO fuel case, 31.6 USD/ton-NH3 for the LNG fuel case, and 42.9 USD/ton-NH3 for the ammonia fuel case. This study also conducted a sensitivity analysis to investigate the influence of assumptions, including assumed parameters.

1. Introduction

In 2022, the world’s electricity production was about 29,000 TWh, of which fossil fuels accounted for about 82% [1,2]. The widespread burning of fossil fuels has enabled rapid industrialization and urbanization around the world. However, it has also led to the deterioration of air quality and accelerated global warming, causing significant environmental issues. Climate change, particularly global warming, is one of the major challenges currently facing humanity [3]. To combat this challenge, the Conference of the Parties to the United Nations Framework Convention on Climate Change, an international organization, signed the Kyoto Protocol in 1997, an international agreement to regulate and prevent global warming. A new climate change agreement (Paris Climate Agreement) was subsequently signed in Paris in 2015 to replace the Transport Protocol, which expired in 2020 [4]. The global community is committed to achieving a decarbonized society and is gradually increasing the use of renewable energy in energy production. Consequently, multiple initiatives are underway to tackle the issue of climate change, and the energy industry is transitioning from fossil fuels to renewable energy sources.
Renewable energy offers benefits such as being eco-friendly and inexhaustible. Additionally, once set up, renewable energy sources do not require further energy inputs like coal, oil, or natural gas, as is the case with thermal power generation [5]. However, due to numerous environmental variables, fully relying on renewable energy for power supply carries significant risks due to mismatches in demand and supply. To address the intermittent supply issue of renewable energy, energy storage technology is essential [6,7]. Energy storage technologies can be categorized based on the duration of storage, response time, and function [7]. However, the most commonly used method is to classify such technologies based on the form of energy stored. This classification system uses five broad categories: mechanical, thermochemical, chemical, electrical, and thermal energy [8]. A graphical representation of this classification scheme is shown in Figure 1.
Power to gas (P2G) is a popular choice for renewable energy storage, gaining significant attention from the international community as an emerging methodology [9]. This method converts excess electricity, typically from intermittent renewable sources, into hydrogen or methane, which are gaseous energy carriers. P2G technology not only bridges the gap between electricity and gas networks but also utilizes existing gas infrastructure for storage and distribution [9,10,11,12]. The core of the P2G system is that the surplus electricity generated by renewable energy can be converted into hydrogen energy and stored to stabilize the power supply. Hydrogen is a suitable energy source for P2G systems because it can be easily converted into other cargoes and can be produced in an environmentally friendly way [3,12,13]. With the goal of achieving a decarbonized society through P2G systems, the international energy policy direction focuses on the R&D of the hydrogen energy supply industry. However, there are many technical limitations to the global supply chain of hydrogen energy, and many studies are underway in various countries to overcome these limitations. One of the most challenging issues is the small storage capacity per volume of hydrogen, which makes it difficult to store hydrogen economically in large quantities and transport it over long distances. To overcome this issue, hydrogen energy carriers are being actively researched to convert hydrogen into other forms of compounds to increase storage capacity and reduce economic costs.
Hydrogen can be transported through pipelines when it is pressurized, or it can be stored in vessels designed for pressurized hydrogen storage and then transported by ship. Another option is to liquefy hydrogen and transport it using specialized ships, or convert it into a liquid organic hydrogen carrier (LOHC) and ammonia and then transport it using dedicated vessels. Pipelines and pressurized hydrogen ships are mostly used for intra-continental transportation, while intercontinental transportation primarily involves the use of liquid hydrogen (LH2), LOHC, and ammonia.
The physical properties, advantages, and disadvantages of LH2, LOHC, and ammonia are presented in Table 1. Volumetric H2 density is the most important factor to consider in transportation. LOHC has the lowest density at 47.1 kg-H2/m3, while ammonia has the highest density at 120.3 kg-H2/m3. Ammonia has a higher volumetric hydrogen density than LH2, which means that more hydrogen can be transported in ammonia for the same size carrier. LH2 does not require a separate process for hydrogen separation like LOHC and ammonia, but it requires significant energy to liquefy at cryogenic temperatures. The boiling point of LH2 is about −253 °C under atmospheric pressure; this is comparable to liquefied natural gas (LNG), which has a boiling point of −163 °C. Depending on the conditions, LH2 requires about 30 times the energy required to liquefy natural gas. LOHC, on the other hand, is a liquid under atmospheric conditions with a boiling point of about 110 °C (TOL)/101 °C (MCH) under atmospheric pressure. LOHC is relatively easy to handle, but energy is required to dehydrogenate it, and additional energy is needed to increase its purity. Ammonia has the advantage of requiring relatively little energy to liquefy, with a boiling point of −33 °C under atmospheric pressure, and is relatively easy to handle. However, ammonia requires energy to crack, and additional energy is needed to increase ammonia’s purity. Ammonia has vast potential in industrial applications, including use as a fuel for fuel cells, as well as applications in turbines, boilers, engines, and other areas.
Techno-economic studies have been made for hydrogen, LOHC, and ammonia as H2 energy carriers. In 2019, Wijayanta et al. [14] examined three different energy carriers: liquid hydrogen (LH2), methylcyclohexane (MCH), and NH3. While LH2 boasts a high energy density and is a well-established technology, it does have some drawbacks, such as requiring cryogenic temperatures and experiencing high energy losses during production and transportation. MCH, on the other hand, can be stored and transported at ambient temperature and pressure and has a high hydrogen content. However, MCH still requires a significant amount of energy for dehydrogenation. Lastly, NH3 has a high hydrogen content, low cost, and established infrastructure for production, transportation, and storage. Nevertheless, NH3 has high energy demands during synthesis and (if required) decomposition, as well as safety concerns that must be addressed. This study’s findings suggest that among the three hydrogen carriers evaluated, NH3 is the most viable option due to its high hydrogen content, cost-effectiveness, and well-established infrastructure for production, transportation, and storage. Several studies have explored the economic feasibility of transporting hydrogen across continents. Moritz Raab et al. [16] performed a comparative assessment to provide valuable insights into the technical and economic aspects of large-scale hydrogen transport for the LH2 pathway and two LOHC pathways. In one scenario, the study assumed a hydrogen production cost of EUR 5/kg. The total transportation cost for export from Australia to Japan was EUR 6.85/kg for DBT LOHC and EUR 7.47/kg for LH2 transportation.
Ishimoto et al. [17] and Sekkesæter [18] analyzed the LH2 and NH3 energy carrier production and transport supply chain. Ishimoto et al. evaluated and compared value chains of hydrogen transport using the LH2 and NH3 chains for transport from Norway to Rotterdam and Japan. The LH2 chains for the transport of hydrogen from northern Norway to Rotterdam and Japan are more energy efficient than the NH3 chain when cracking of NH3 is required to obtain pure H2 for end use. If cracking is not required before end-use, the energy efficiencies of the chains are almost equal. According to Ishimoto et al. [17], the sea transportation cost ranged from 1.2 USD/kg H2 in the conservative case, to 0.4 USD/kg H2 in the optimistic and low-transport CAPEX cases. The LH2 chain was found to be more energy-efficient than the LNH3 chain. Despite the different phase-change temperatures, the BOR of LNH3 storage was assumed to be the same as that of LH2 storage. However, there was significant energy loss in the ammonia cracking process despite applying a high efficiency of 99%. On the other hand, Sekkesæter [18] found that LNH3 has lower energy consumption than LH2 and LOHC. Sekkesæter’s analysis, however, did not account for ocean transport under loading conditions and boil-off gas (BOG) with different ship types.
In a study conducted by Guerra et al. [19], the supply chain of NH3 energy carriers was analyzed from a techno-economic perspective. The study included the transport of NH3 between Chile and Japan and found that the net present value (NPV) was significantly affected by the electricity price under certain technical conditions. The impact of capacity and electricity price on the NPV was also examined. However, it was suggested that further research on technical specifications and transportation means is necessary for the technology to be practically applied. Franco et al. [20] conducted an economic assessment of LNH3 energy carriers that used ship transport. However, the study did not provide a detailed technical analysis of ship types and BOG and their effects on the supply chain.
Based on the literature reviews for the techno-economic assessment of NH3 as an energy carrier, it was found that NH3 has the potential to become the most promising energy carrier. Furthermore, ammonia (NH3) is a highly promising solution for reducing carbon emissions in the maritime sector, as it offers several key advantages, including the absence of carbon atoms in its molecule, high energy density, and relatively simple storage requirements [21,22,23]. However, for NH3 to be successful, it is critical to achieve price competitiveness through large-scale production, transport, and utilization. Although various detailed studies have been conducted on the production and utilization of ammonia, the literature review revealed that there are few in-depth studies on the costs of shipping ammonia over long distances in bulk. Therefore, this study aims to estimate the cost of the intercontinental transportation of NH3, which will be used as a means of transporting hydrogen in the near future.
This paper is structured into several sections. The first section, called the Ammonia Energy Supply Chain and Evaluation Boundary, explains the supply chain and defines the evaluation boundary. The next section describes the ammonia-fueled ammonia carrier. Following that, the evaluation methodology is explained. In the Results and Discussion section, the economic feasibility results are discussed in detail. Finally, the Conclusions section presents a summary of the paper and concluding remarks.

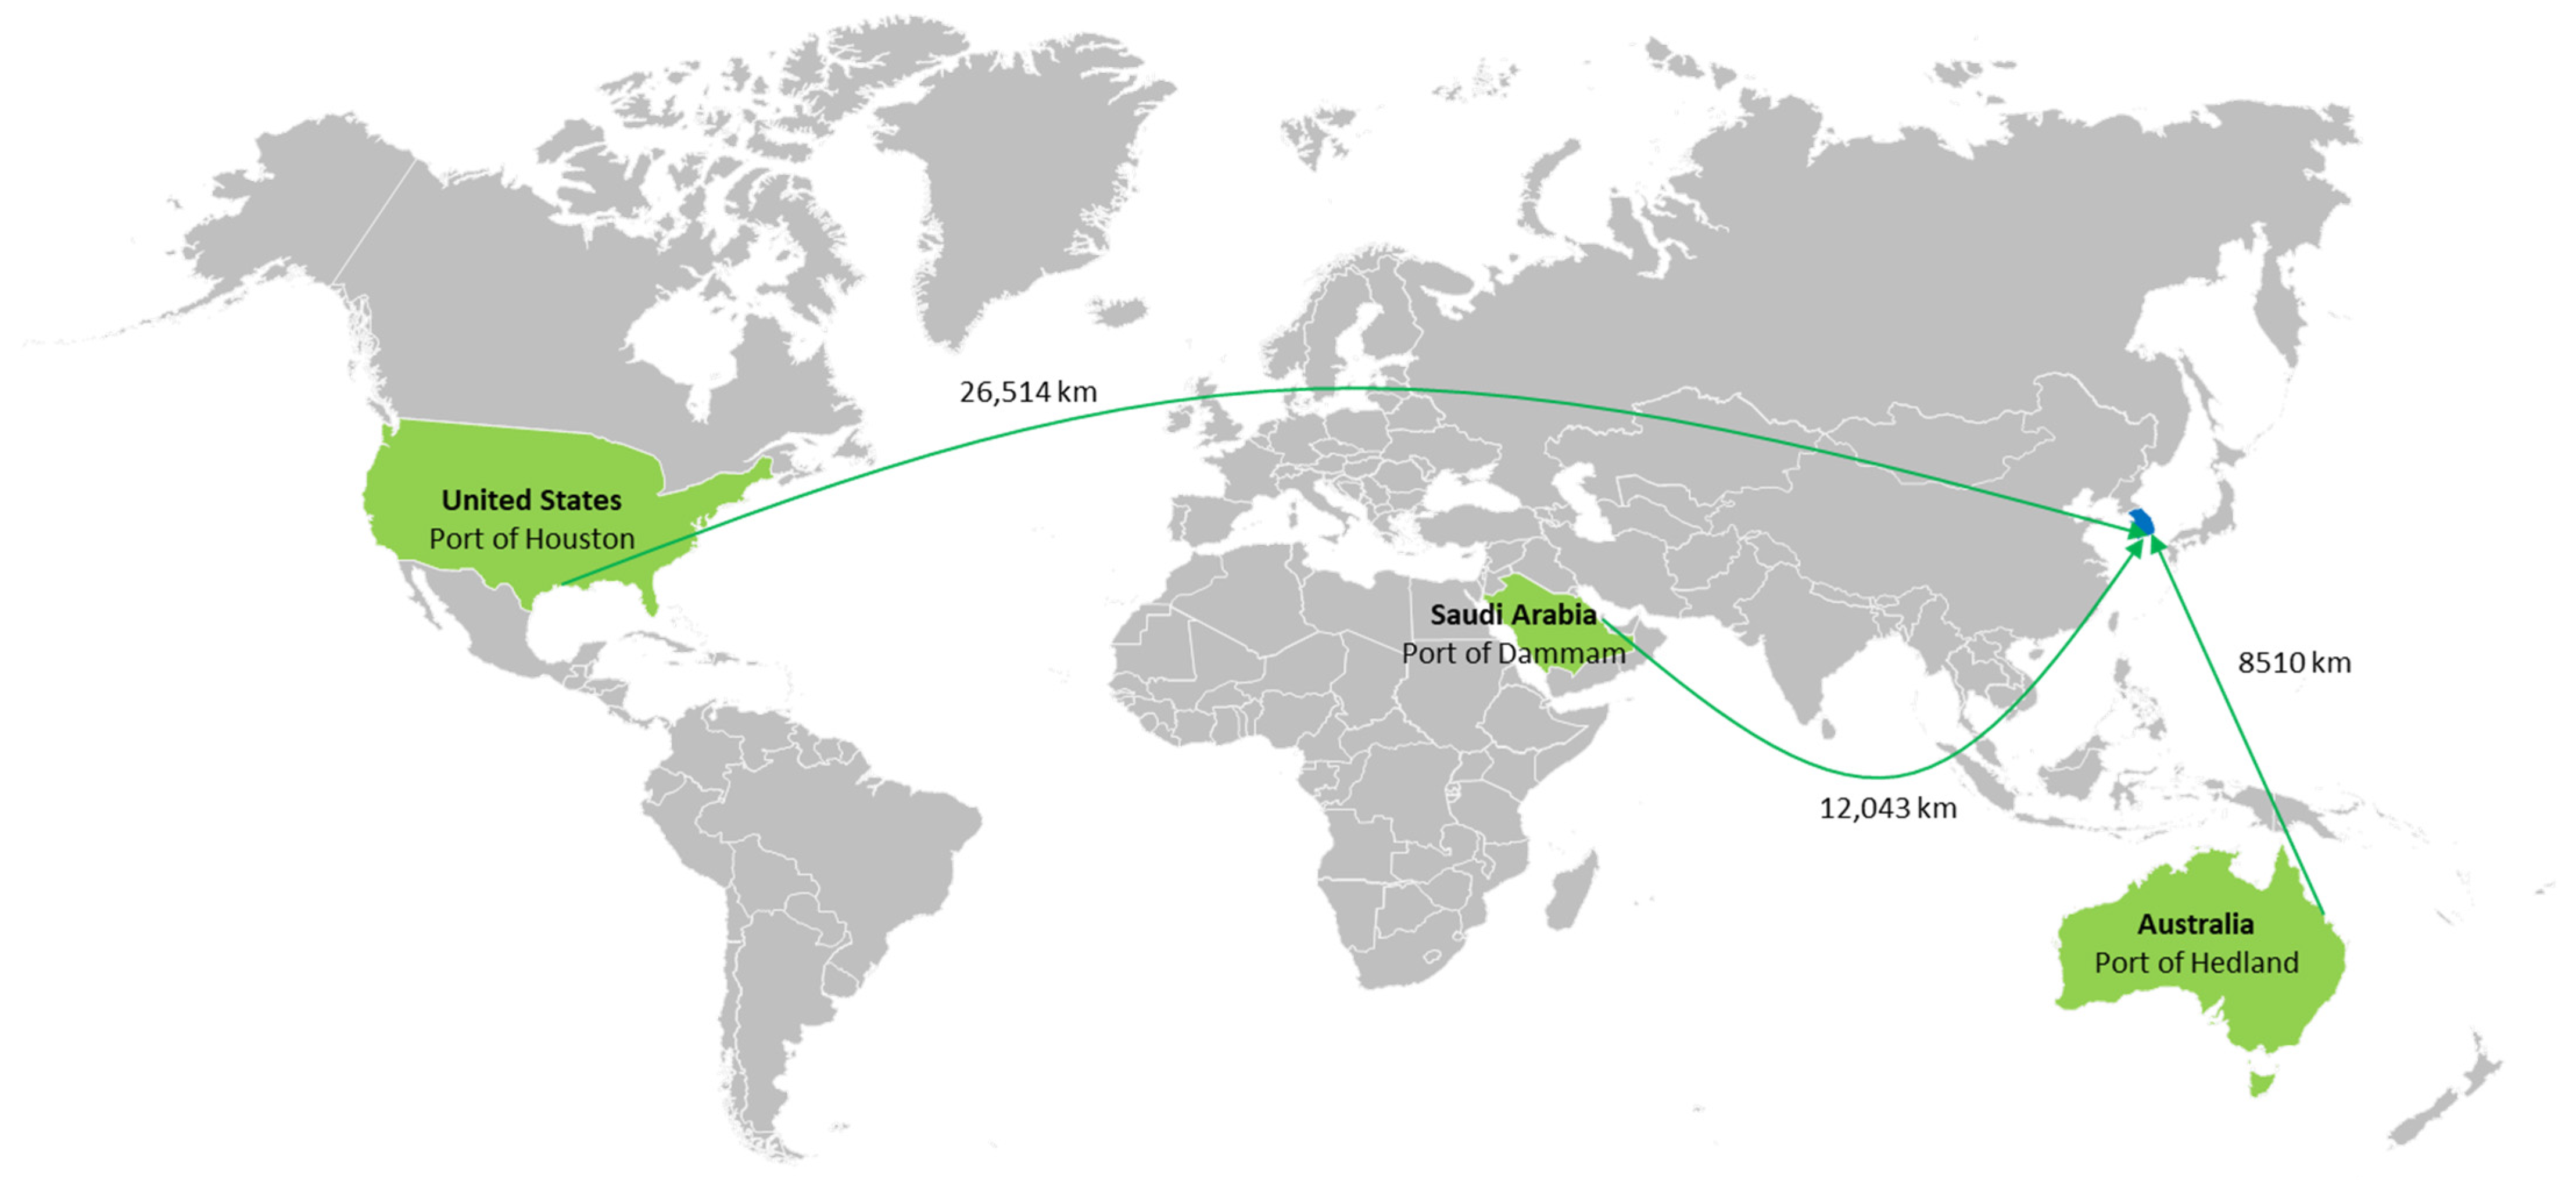
2. Ammonia Energy Supply Chain and Evaluation Boundary

Ammonia is expected to be produced in areas that are rich in resources and renewable energy. It will then be transported in bulk by ships, stored at receiving terminals, and ultimately used as fuel in thermal power generation and industrial heating furnaces, among other applications. The ammonia supply chain primarily consists of (1) production, (2) transportation, and (3) utilization [24]. Ammonia can be produced using either natural gas or renewable energy sources. When produced from natural gas, it is called blue ammonia, and the carbon dioxide emissions are treated with carbon capture and storage (CCS) technology. On the other hand, ammonia produced from renewable energy is referred to as green ammonia. After production, ammonia is transported by ship and used as a raw material in boilers, gas turbines, ship fuel, and fertilizers.
Figure 2 depicts the ammonia supply chain and the scope of the study. In particular, the transportation part can be subdivided into (1) loading, (2) transportation, and (3) unloading. In this study, ammonia transport will be covered. The evaluation boundary extends from the loading to unloading operations.
A variety of factors must be considered when assessing ammonia transport costs. The following key specifications are considered in this study.
  • Ship size;
  • Fuel;
  • Main and auxiliary engine load;
  • Ship speeds;
  • Port in and out times;
  • Loading/unloading times.
Ammonia is already being transported by ship. Figure 3 shows the global volume of ammonia shipped and the ports with ammonia unloading facilities.
Ammonia carriers are available in different sizes depending on the size of the cargo hold (volume). These carriers can be broadly categorized as small, medium, or large. Small tankers are less than 10,000 m3, medium tankers are greater than 10,000 m3 but less than 50,000 m3, and large tankers are greater than 50,000 m3. NH3 tankers with different cargo sizes require different storage methods. Fully pressurized storage is mainly used for small sizes, semi-refrigerated for medium sizes, and fully refrigerated for large sizes. Large ammonia carriers are suitable for long-distance intercontinental transportation. A variety of fuels can be utilized to fuel ammonia carriers. Conventional fuels such as HFO, VLSFO, and MGO can be used, as well as green fuels such as LNG, LPG, methanol, ammonia, and hydrogen. However, ammonia carriers are expected to use ammonia as a fuel [26]. It is more efficient for ships to use the same fuel as their cargo, so LPG carriers are now using LPG as fuel [27,28,29]. However, using ammonia as a fuel requires additional considerations, which will be discussed in detail in the next section. Once these considerations are addressed, appropriate specifications for the main and auxiliary engines must be determined. The main engine is responsible for propelling the ship, while the auxiliary engine generates the electricity that the ship requires. To estimate fuel consumption, reasonable assumptions should be made about the vessel’s speed profile, specific fuel consumption by load, etc. [30]. In general, ship speed is relatively slow for bulk carriers and oil tankers and fast for container ships and LNG carriers [31]. In addition, it should be assumed that the port in/out time, loading/unloading time, ship inspection frequency, and duration, which greatly affect the operation of the ship, are also optimized.

3. Ammonia-Fueled Ammonia Carrier

Figure 4 shows a typical ammonia carrier fueled by conventional fuel. Ammonia carriers are designed to carry both LPG and ammonia rather than only ammonia. While LPG is in high demand for transportation and has dedicated large ships, this is not the case for ammonia. However, as the demand for ammonia transportation increases, it is expected that dedicated ammonia carriers will also be required. Ammonia carriers are equipped with cargo tanks to store ammonia as cargo, re-liquefaction systems to handle the BOG caused by heat penetration into the tanks, a loading and unloading system to unload ammonia, and vent masts to discharge ammonia in an emergency.
Figure 5 shows an ammonia-powered ammonia carrier. In an ammonia-powered ammonia carrier, the conventional HFO/VLSFO/MGO engines used for the main and auxiliary engines are replaced with ammonia-fueled engines. In addition, ammonia fuel tanks or deck tanks, ammonia fuel supply systems, and ammonia catch systems are added [32]. Ammonia engines are being developed by marine engine manufacturers such as MAN E&S, WinGD, Wartsila, and HD Hyundai [33,34,35,36]. The ammonia fuel tank is used for storing ammonia as fuel, and when using ammonia as fuel without a separate ammonia fuel tank, deck tanks (fuel service tanks) are installed to temporarily store ammonia taken from the cargo tanks. The ammonia fuel supply system is a facility for supplying ammonia to meet the requirements of the engines, regulating the pressure and temperature of the ammonia, and removing impurities. The ammonia capture system treats the exhausted ammonia and reduces the concentration of the exhausted ammonia to an acceptable level. There is no standard set by the IMO for allowable emission levels, but the standard set by the Korean classification society, Korean Register of Shipping, requires that the alarm be activated at 25 ppm and that the safety system be activated at 300 ppm [37]. Ammonia leakage is an important issue. When rules and guidelines for ammonia-fueled ships are released by IMO, the requirement to prevent and mitigate ammonia leakage should be followed.

4. Cost Estimation

4.1. Scenario

This study proposes three scenarios in which ammonia is transported from the United States, Saudi Arabia, and Australia to South Korea, as shown in Figure 6. Potential partner countries for ammonia export are selected based on economic feasibility, accessibility, political and economic stability, and clean ammonia production potential. It was assumed that only one ammonia carrier of 84,000 m3 would transport ammonia from each country. This study selected a very large ammonia carrier (VLAC) with 84,000 m3 class for the target carrier because a VLAC will be mainly operated in the future to satisfy the increased demand. The following distances were assumed: USA (Port of Houston)–Korea (Port of Ulsan), 26,514 km; Saudi Arabia (Port of Dammam)–Korea (Port of Ulsan), 12,043 km; Australia (Port Gladstone)–Korea (Port of Ulsan), 8510 km.

4.2. Methodology for Cost Estimation

In this study, the life-cycle cost (LCC) was employed for economic evaluation. There are various methods for economic evaluation, including the LCC, net present value (NPV), internal rate of return (IRR), and profitability index (PI). LCC is the total costs associated with a system over its entire life cycle. It is widely used in capital budgeting for long-term projects. NPV represents the difference between the present values of cash inflows and the present value of cash outflows over a certain period of time. NPV is commonly used to estimate the profitability of an investment. IRR is the discount rate that makes the NPV of all cash flows equal to zero and is widely used for comparing multiple projects. PI is the ratio of the present value of future cash flows to the initial investment and is also known as the cost–benefit ratio. LCC was selected for the economic evaluation because the purpose of this study is to estimate required costs rather than profitability. LCC consists of capital expenditure (CAPEX), related to initial investment costs, and operational expenditure (OPEX), related to operating costs. CAPEX considers direct costs (purchasing materials and installation, comprising all costs for equipment and instrumentation) and indirect costs (engineering and supervision costs, legal expenses, contractor fees, contingency controls, piping, electrical systems, and service facilities). OPEX considers operating labor, direct supervisory and clerical labor, utilities, maintenance and repairs, operating supplies, local taxes, insurance, and overhead costs.
Information on an ammonia carrier and voyage assumed to estimate the LCC of ammonia transportation is provided in Table 2. In this study, three fuels were observed: conventional fuels (VLSFO/MGO), LNG, and ammonia. CAPEX and OPEX items were determined to estimate the LCC of the ammonia carrier. Here, the item considered for CAPEX is the cost of the ammonia carrier. Ammonia carriers can be purchased or chartered. In this study, a purchase was assumed, and 70% of the purchase cost was assumed to be a loan. The loan was assumed to have an annual interest rate of 5% and equal repayment of the principal and interest over 15 years. The price of the ammonia carrier used the Clarkson new building price, which is based on propulsion using conventional fuels (VLSFO/MGO) [38]. Additional fuel tank and fuel supply system costs were taken into account for an ammonia carrier propelled by LNG or ammonia fuels [26,39]. OPEX considers fuel costs, maintenance costs, crew costs, and insurance costs. The fuel cost was estimated by calculating the fuel consumption of the ammonia carrier and then multiplying that cost by the fuel prices. The fuel prices were taken from the average bunkering prices over the past three years, excluding ammonia [40]. There is no bunkering price for ammonia because it has not yet been applied to ships. The cost of green ammonia in the literature was used for the fuel price of ammonia [41]. Additionally, all costs, excluding fuel costs were assumed to be approximately 5% of the ship price annually. The cost for ports and the cost for the Panama Canal were assumed to be 50,000 and 60,000 USD/per, respectively [42]. The costs assumed for the LCC estimation are shown in Table 3.

5. Results and Discussion

5.1. LCC for Ammonia Transportation

Figure 7 shows the LCC for scenarios with different fuels used in the ammonia carrier. As mentioned previously, the ammonia transportation scenarios consider transport from the United States, Saudi Arabia, and Australia to South Korea, and the different fuels are VLFSO/MGO, LNG, and ammonia. In all scenarios, using ammonia as a fuel yielded the highest LCC, and using VLSFO/MGO yielded the lowest LCC. For transportation, the fuel costs of OPEX accounted for the largest portion of the LCC, followed by shipping CAPEX. The proportion of fuel costs in the LCC differed depending on the fuel. In scenario 1 (United States–South Korea), fuel costs accounted for 45.9% when using VLSFO/MGO, 54.5% when using LNG, and 66.6% when using ammonia. The amount that one ammonia carrier (84,000 m3) could transport in one year differed by distance (export countries). This amount was approximately 226,489 tons/year in scenario 1 (United States–South Korea), about 471,837 tons/year in scenario 2 (Saudi Arabia–South Korea), and approximately 641,495 tons/year in the case of scenario 3 (Australia–South Korea). As the distance decreased, more voyages could be undertaken, so the amount that could be transported also increased. Since the amount that one ship could transport was different in each scenario, the unit cost was also different. In the United States, unit costs were approximately 69.7 USD/ton, 93.6 USD/ton, and 128.2 USD/ton for VLSFO/MGO, LNG, and ammonia fuels, respectively. In Saudi Arabia, unit costs were approximately 32.5 USD/ton, 43.6 USD/ton, and 59.5 USD/ton for VLSFO/MGO, LNG, and ammonia fuels, respectively. In Australia, unit costs were approximately 23.6 USD/ton, 31.6 USD/ton, and 42.9 USD/ton for VLSFO/MGO, LNG, and ammonia fuels, respectively. Unit costs varied greatly by importing country and fuel type. The transportation costs from the United States to South Korea were approximately three times higher than those from Australia to South Korea. Additionally, in the case of ammonia fuel, transportation costs were approximately twice as high as those of VLSFO/MGO.

5.2. Sensitivity Analysis

This study performed a sensitivity analysis to investigate the influences of assumptions and assumed parameters. The investigated assumption was the method of ship acquisition, and the investigated parameters were the lifespan of the ship, the ship’s average speed, harbor in/out times, loading/unloading times, annual inspection times, and fuel prices. The following section outlines the results of the sensitivity analysis for the case of scenario 3 (Australia–South Korea).

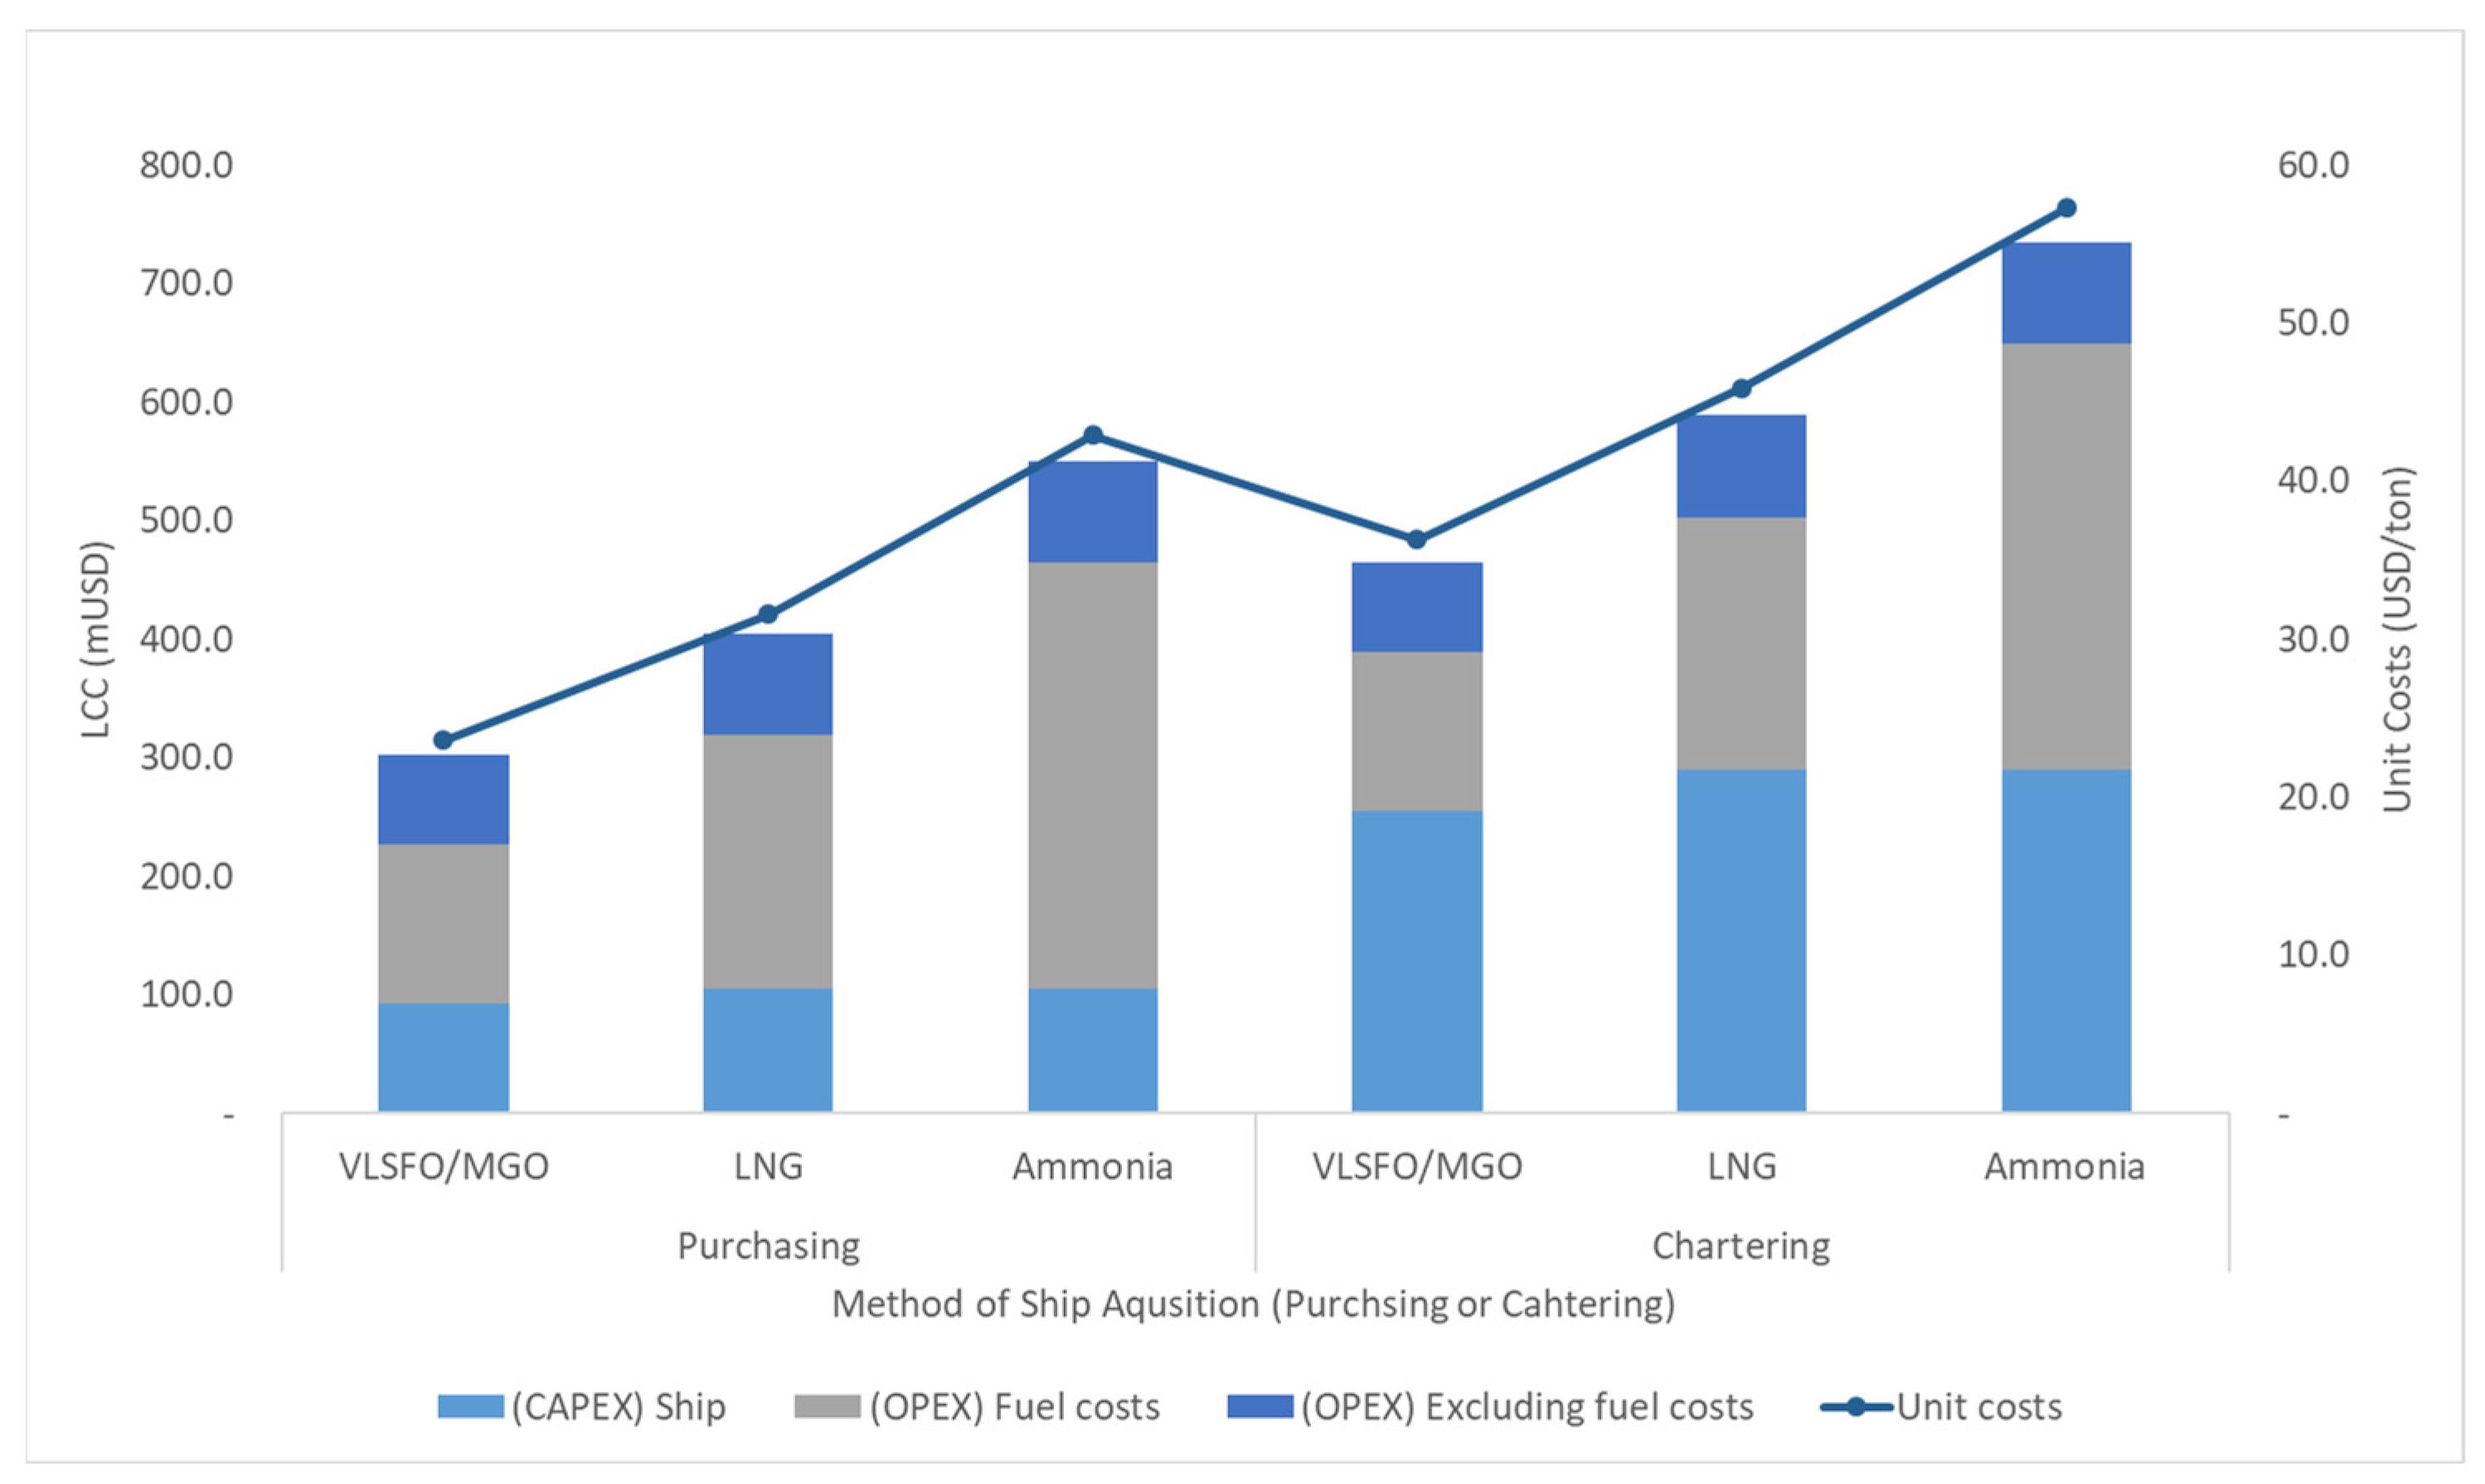
5.2.1. Method of Ship Acquisition

Figure 8 shows the LCC for ammonia transportation depending on the method of ship (ammonia carrier) acquisition. This study assumed that the ammonia carrier would be acquired by purchasing, as mentioned before. However, the ammonia carrier may be chartered by the operator depending on the market situation and strategy. The charter cost was assumed to be 35,000 USD/d, based on Clarkson’s data [43]. In the case of ammonia and LNG fuel rather than VLSFO/MGO fuel, it was assumed that the charter cost would increase in proportion to the increased ship price. Purchasing or chartering ships affected CAPEX. In the case of chartering, CAPEX was approximately 2.7 times higher than purchasing. Unit transportation costs were approximately 53.6% higher for chartering than for purchasing in the case of VLSFO/MGO fuel. From a cost perspective, purchasing was more attractive than chartering.

5.2.2. Lifespan

Figure 9 shows the LCC for ammonia transportation depending on the lifespan of the ammonia carrier. This study assumed that the lifespan of the ammonia carrier was 20 years. However, the lifespan may differ depending on the operating environment and management strategy. The transportation costs for 15- and 25-year lifespans were also estimated. In the case of VLSFO/MGO, assuming the lifespan of the ammonia carrier to be 15 years, the cost increased by approximately 10.4% compared to 20 years. However, assuming a lifespan of 25 years, the cost decreased by about 6.2% compared to 20 years. As the lifespan of the ship increased, more ammonia could be transported by one ammonia carrier, so unit transportation costs decreased.

5.2.3. Average Speed

Figure 10 shows the LCC for ammonia transportation depending on the ship’s average speed of the ammonia carrier. This study assumed that the ship’s average speed of the ammonia carrier was 14.8 knots. However, this speed may vary depending on the operating environment and management strategy. The transportation costs for ship average speeds of 13 and 17 knots were also estimated. In the case of VLSFO/MGO, assuming the ship’s average speed to be 13 knots, the cost was reduced by about 1.1% compared to the cost at 14.8 knots. However, assuming a ship’s average speed of 17 knots, the cost increased by about 7.1% compared to that of 14.8 knots. As the ship speed increased, the unit transport cost of ammonia increased. At 14.8 knots, the reduction in transportation costs was relatively small when the ship speed was reduced, but as the ship speed increased, the transportation costs increased relatively significantly. This result indicates that a ship’s average speed of 14.8 knots is optimal for the cost of ammonia transportation and the corresponding management strategy.

5.2.4. Harbor In/Out Time

Figure 11 shows the LCC for ammonia transportation depending on the harbor in/out times of the ammonia carrier. This study assumed that the harbor in/out times of the ammonia carrier were 12 h each. However, these times may be different depending on the harbor conditions. The transportation costs for harbor in/out times of 6 and 18 h were also estimated. When VLSFO fuel was used and the harbor in/out times were reduced from 12 h to 6 h, unit transportation costs decreased by about 2.0%. When the harbor in/out times increased from 12 h to 18 h, the costs increased by about 2.0%. As the harbor in/out times increased, costs increased.

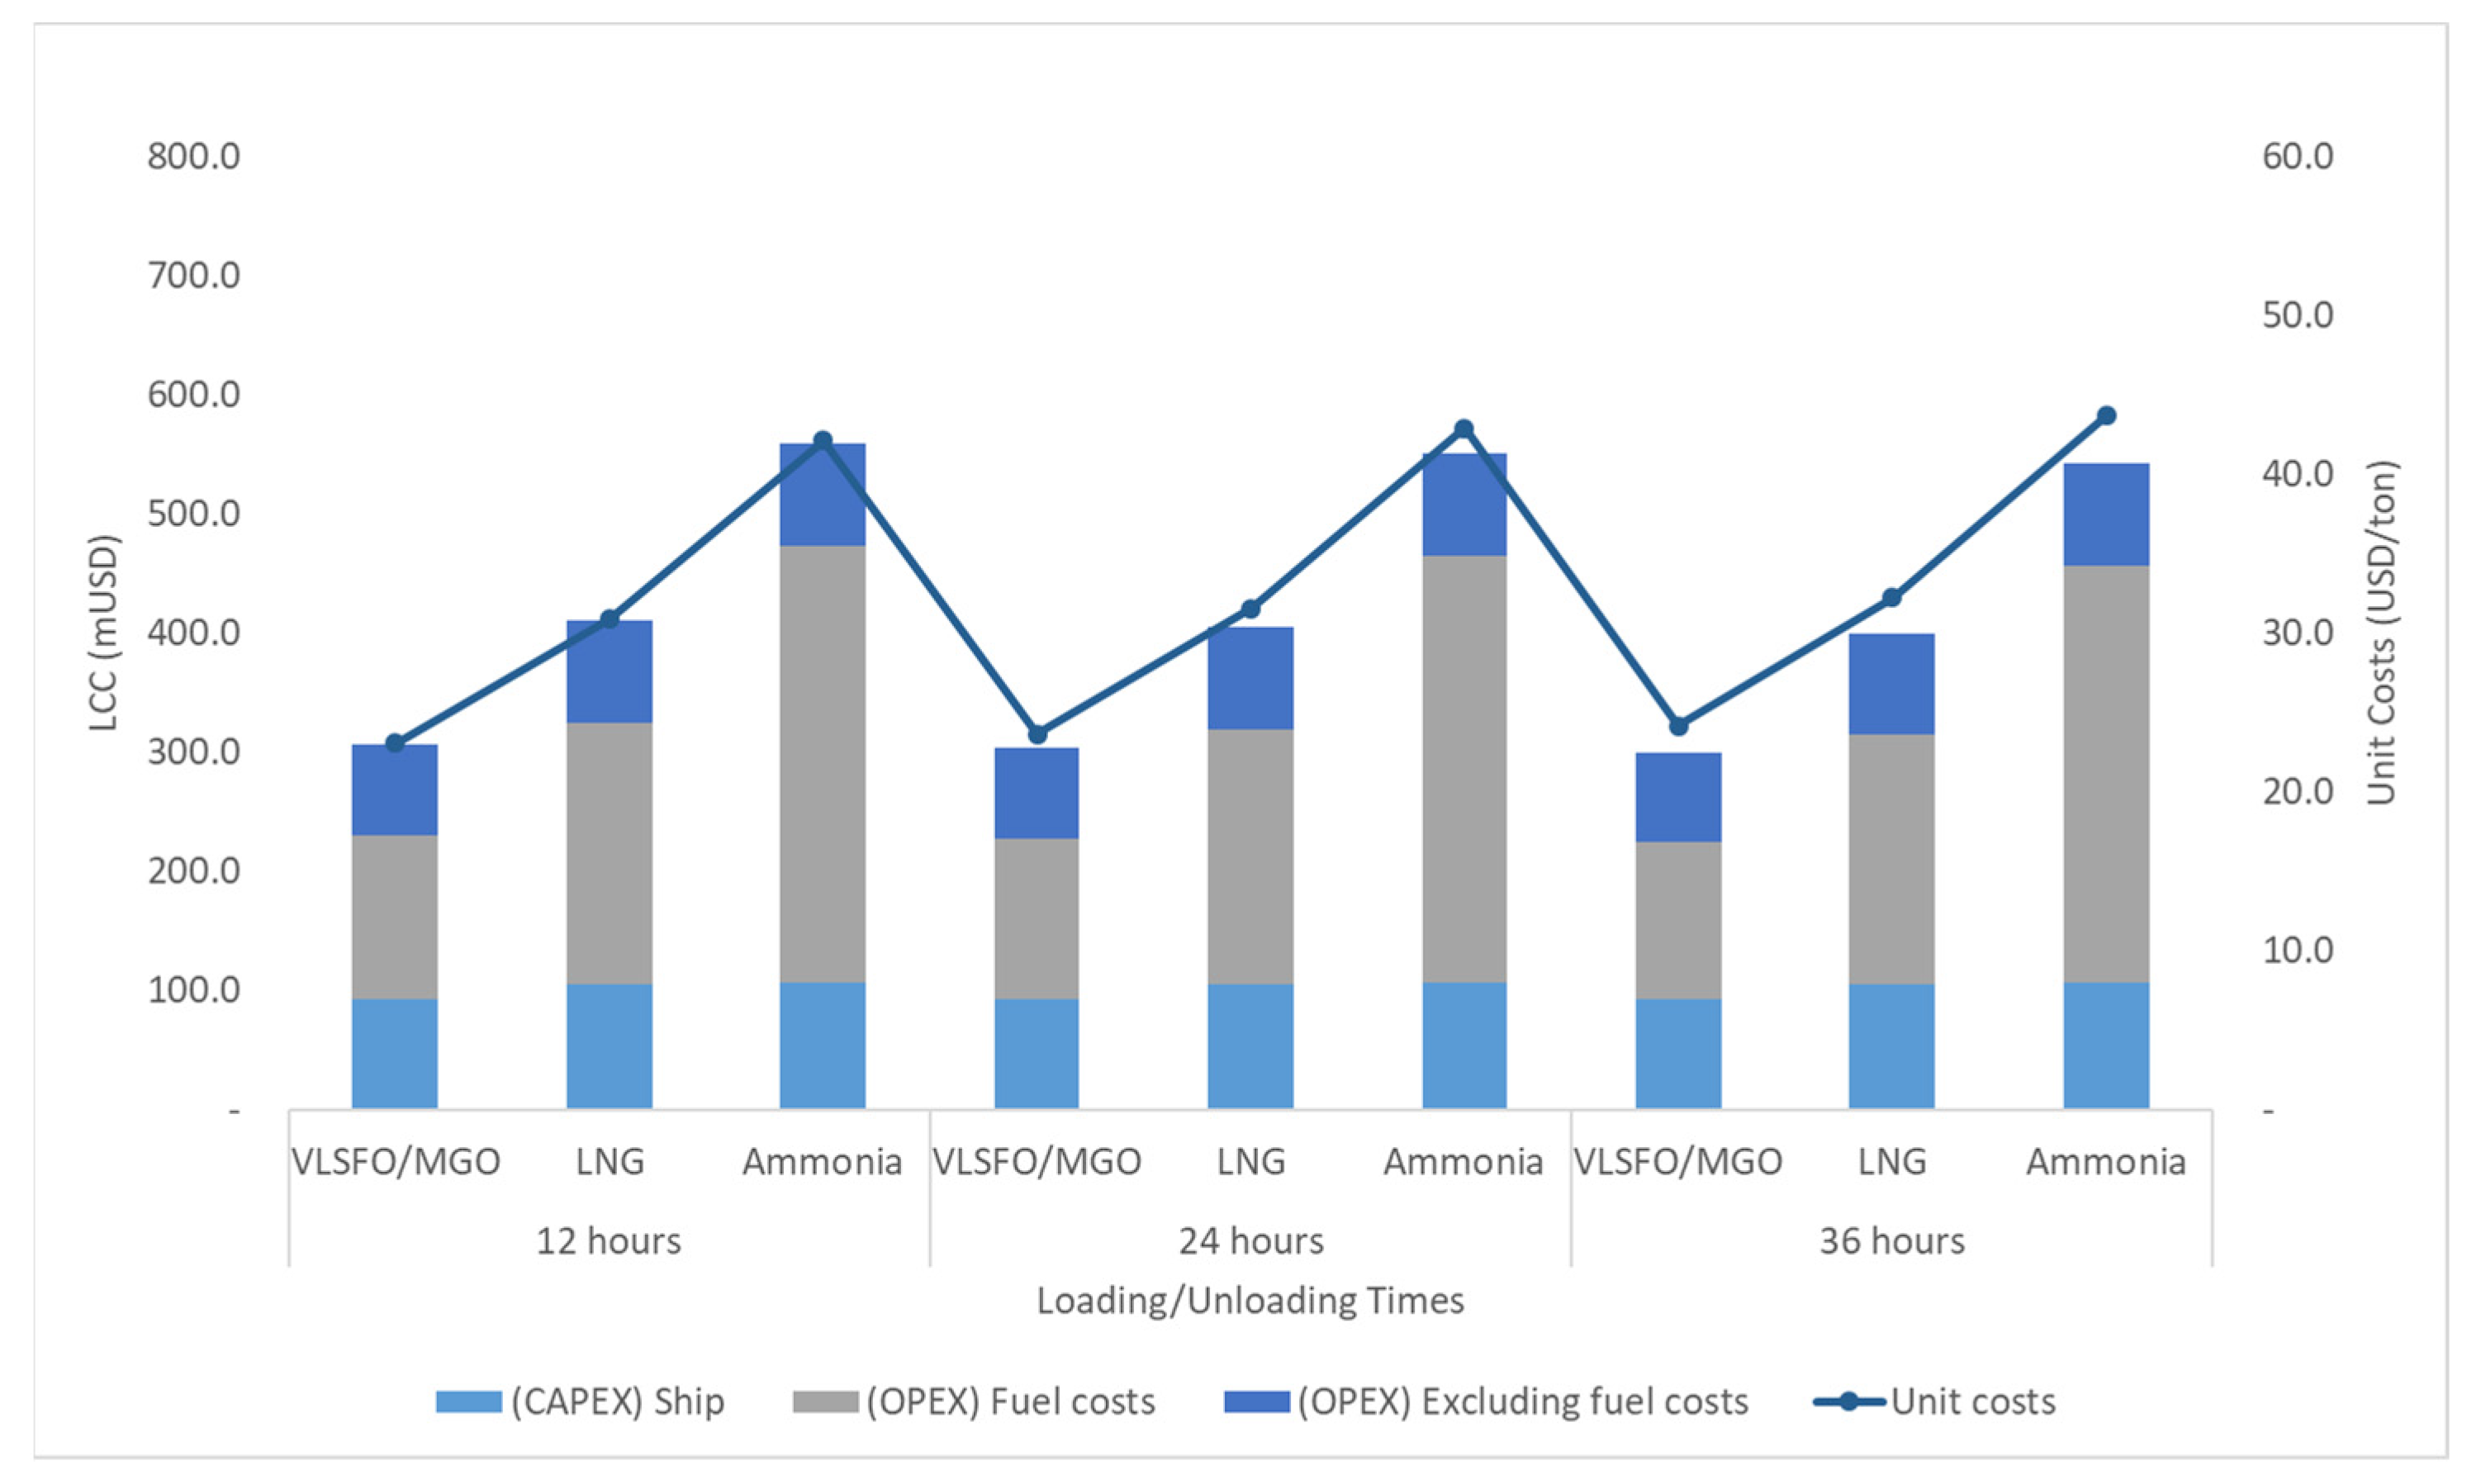
5.2.5. Loading/Unloading Time

Figure 12 shows the LCC for ammonia transportation depending on the loading/unloading times of the ammonia carrier. This study assumed that the loading/unloading times of the ammonia carrier were 24 h each. However, these times may vary depending on the loading/unloading facilities of the harbor and the carrier. The transportation costs for harbor in/out times of 12 and 36 h were also estimated. When VLSFO/MGO fuel was used, and the loading/unloading times were reduced from 24 h to 12 h, unit transportation costs decreased by about 2.3%. When the loading/unloading times increased from 24 h to 36 h, the costs increased by about 2.3%. As the loading/unloading times increased, costs increased.

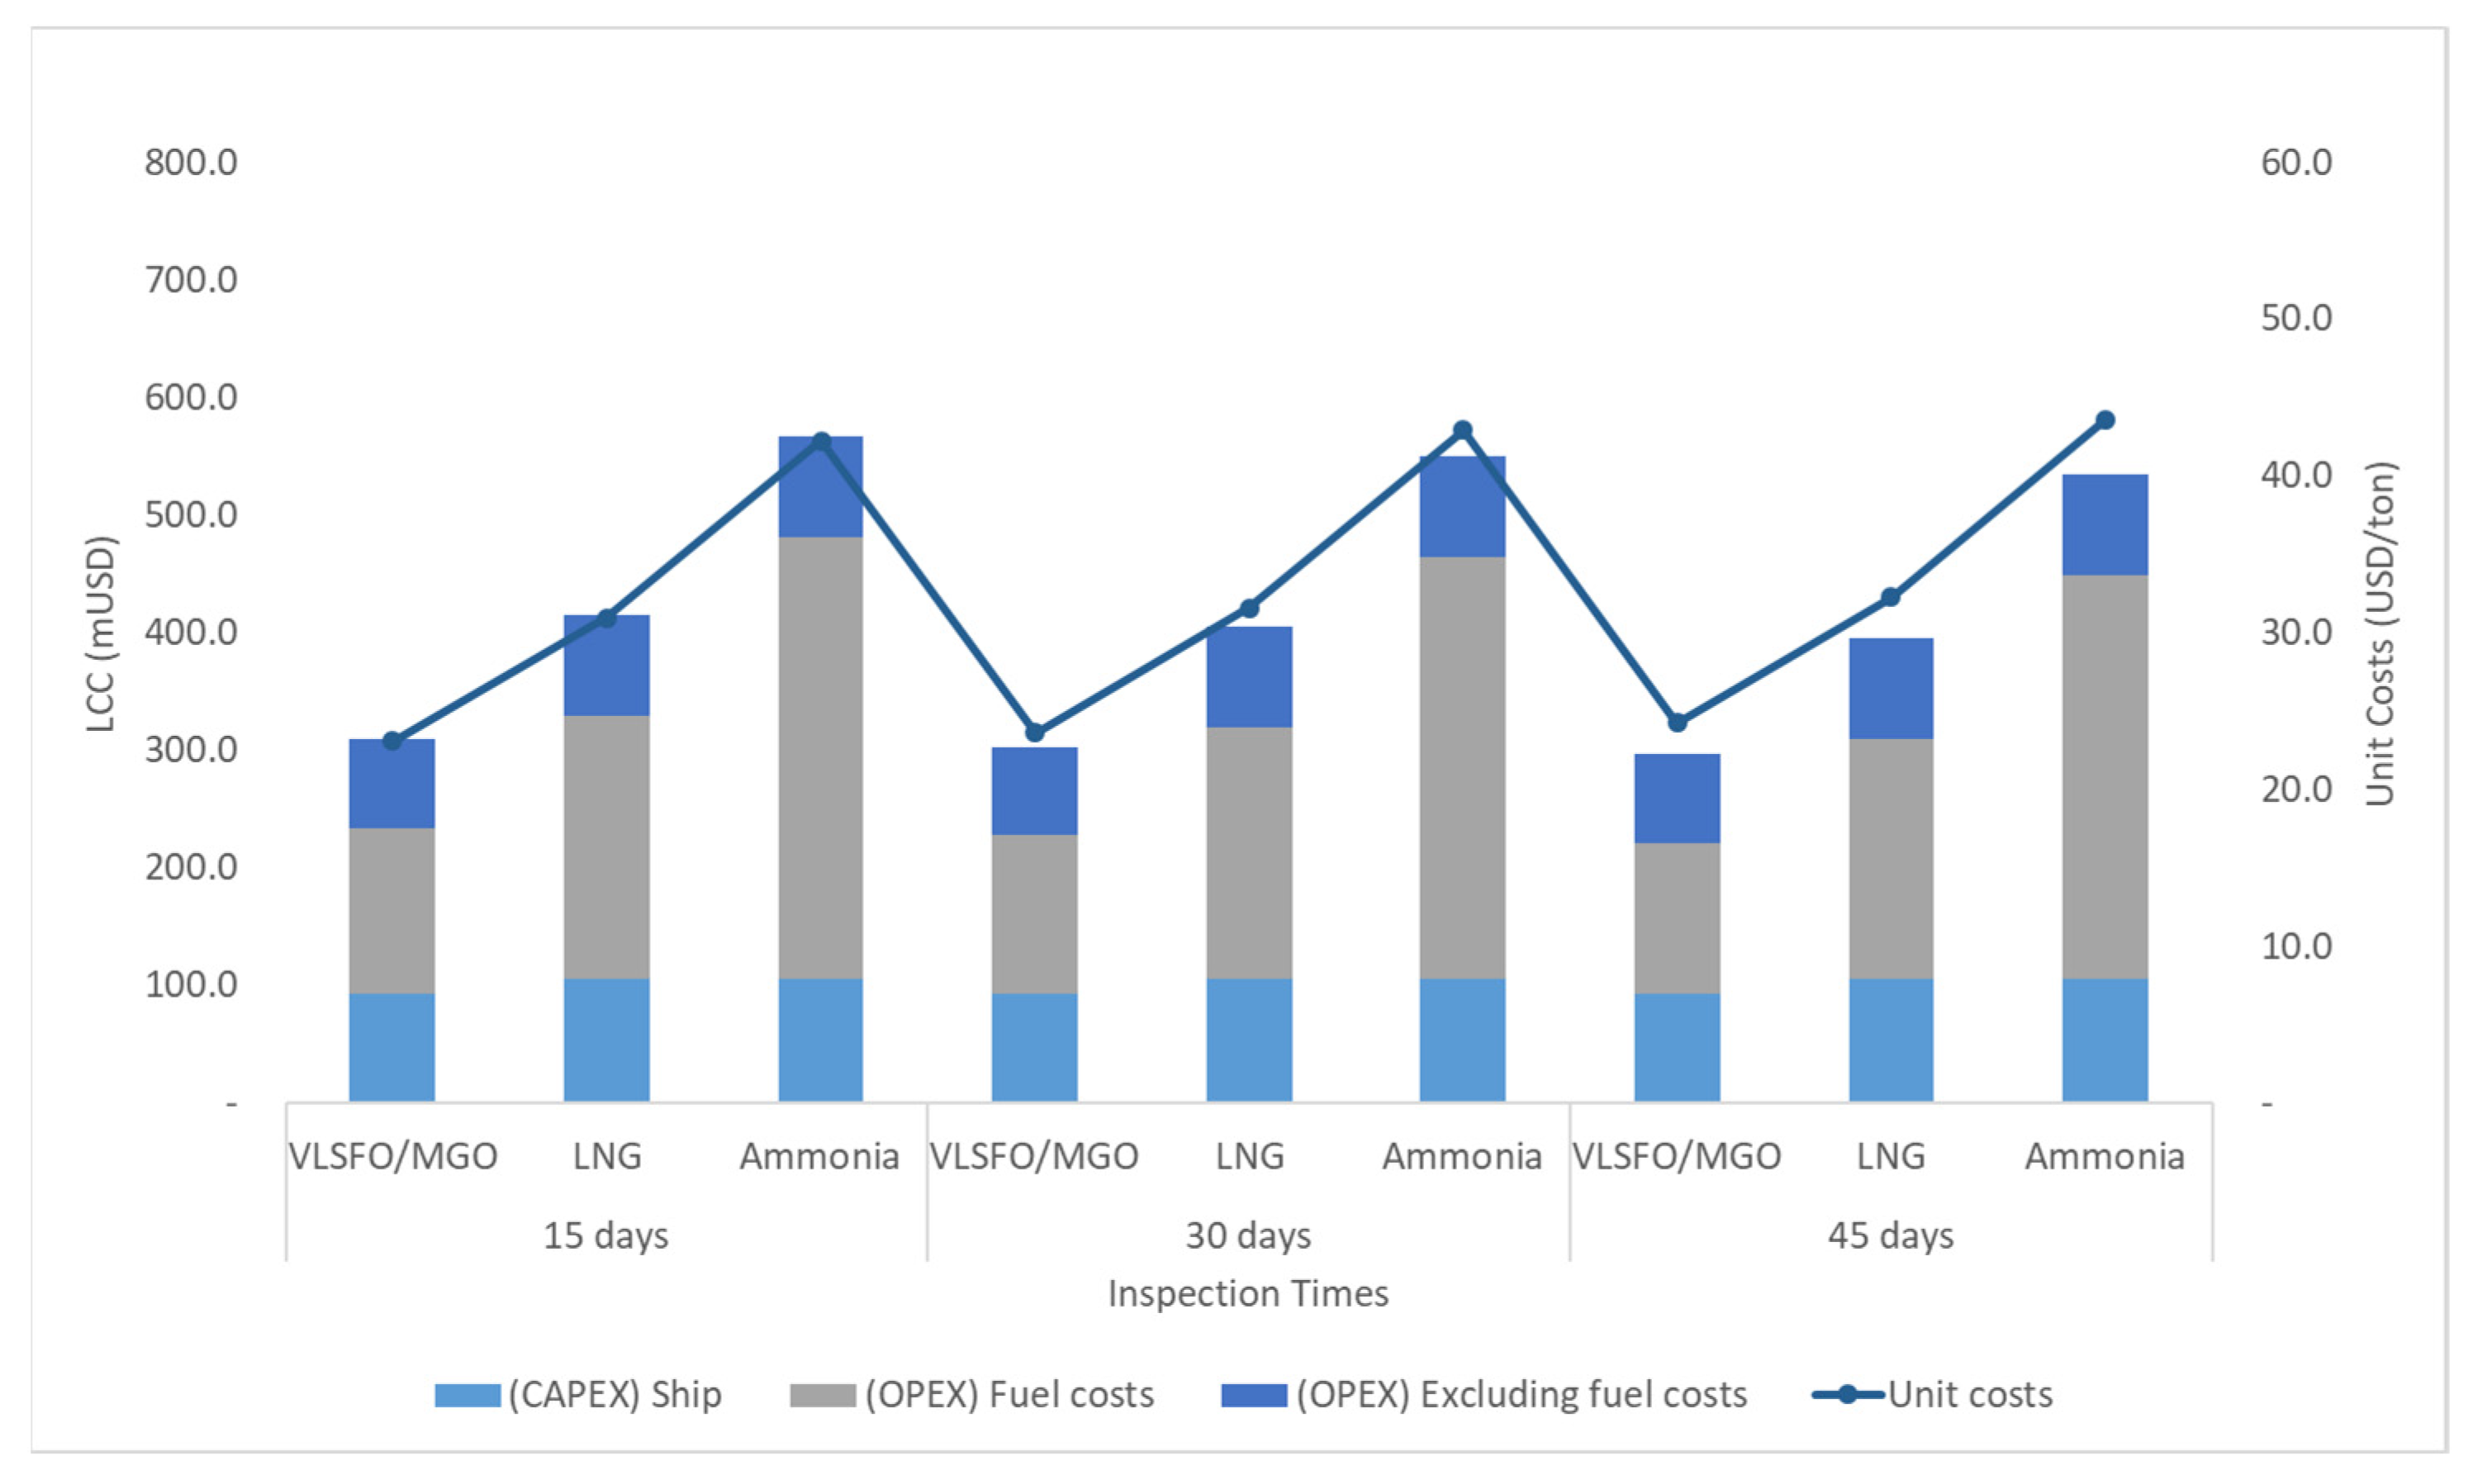
5.2.6. Annual Inspection Time
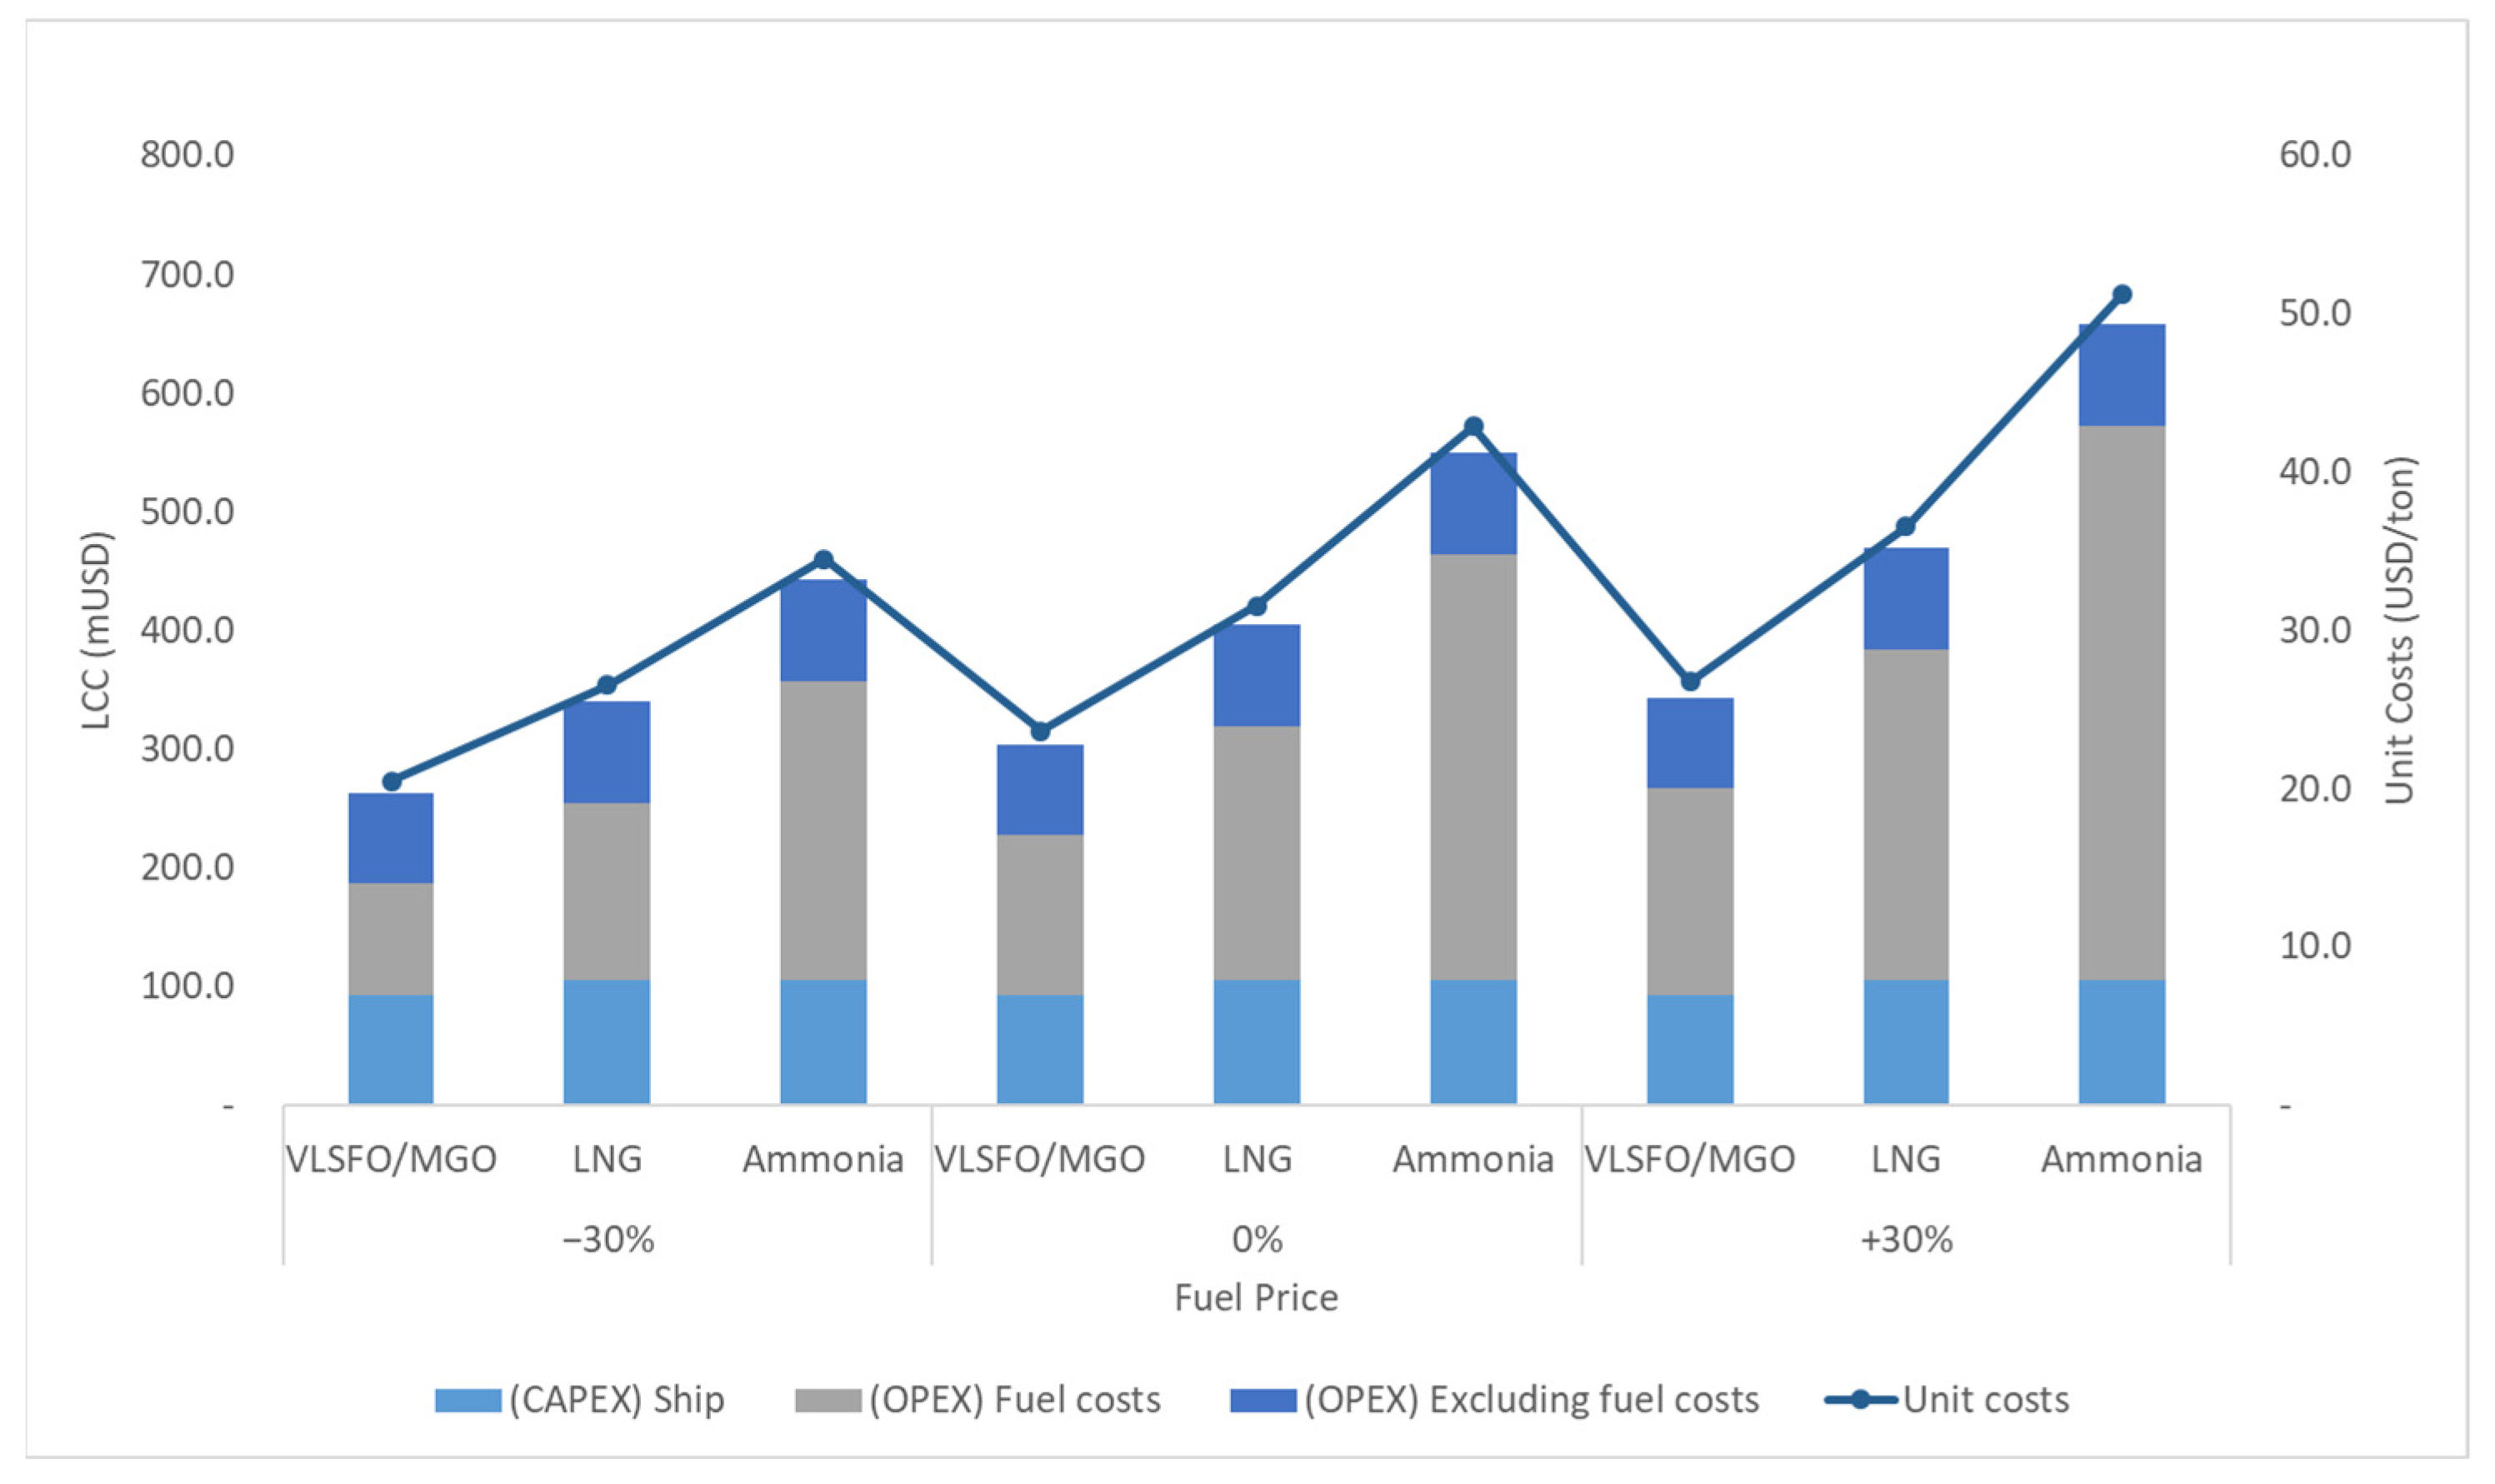
Figure 13 shows the LCC for ammonia transportation depending on the annual inspection time of the ammonia carrier. This study assumed that the annual inspection time of the ammonia carrier was 30 days. However, this time may be different depending on ship conditions and regulations. The transportation costs for annual inspection times of 15 and 45 days were also estimated. When VLSFO/MGO fuel was used, and the annual inspection time was reduced from 30 days to 15 days, unit transportation costs decreased by about 2.4%. When the annual inspection time increased from 30 days to 45 days, the costs increased by about 2.6%. As the annual inspection time increased, costs increased.

5.2.7. Fuel Price

Figure 14 shows the LCC for ammonia transportation depending on the fuel price of the ammonia carrier. In this study, the fuel prices were assumed based on the bunkering fuel price in the last three years, as mentioned previously. However, these prices may vary depending on the energy market situation. The transportation costs for fuel prices ±30% were also estimated. When the fuel price was reduced by 30%, the unit transportation costs decreased by about 13.3%, 19.5%, and 15.8%, respectively, for VLSFO/MGO, ammonia, and LNG. In contrast, the unit transportation costs increased by about 13.3%, 19.5%, and 15.8%, respectively, for VLSFO, ammonia, and LNG, when the fuel price was increased by 30%. As the fuel price increased, costs increased.

6. Conclusions

Ammonia is expected to play a significant role in the sustainable growth of humanity. The energy market is transitioning from a fossil energy-based market to a renewable energy-based market for sustainability. Renewable energy is infinite and environmentally friendly, but it has the disadvantage of being intermittent in production. To compensate for the intermittent production, hydrogen, which can be stored in large quantities over a long period of time of renewable energy, is receiving a lot of attention. As hydrogen is considered a major energy source for industry, countries lacking hydrogen due to a lack of renewable energy resources are considering importing hydrogen, and countries with sufficient hydrogen due to abundant renewable energy resources are considering exporting hydrogen. For intercontinental hydrogen transportation, various hydrogen transportation methods such as liquefied hydrogen, LOHC, and pressurized hydrogen are being considered, with ammonia emerging as a feasible and efficient means. In other words, hydrogen is emerging for the sustainability of the energy market, and ammonia is being considered as a major transportation method to address the hydrogen imbalance between countries.
This study estimated ammonia transportation costs to investigate the feasibility of the international ammonia trade. The proposed scenarios to transport ammonia included transport from the USA, Saudi Arabia, and Australia to South Korea. The employed carrier was an 84,000 m3 class ammonia carrier, and the assumed fuels were not only VLSFO/MGO (traditional) but also LNG and ammonia, which will be utilized in the near future. The LCC, consisting of CAPEX and OPEX, was employed for the cost estimation. The results showed that the USA, which was the furthest from the destination, entailed the highest unit transportation costs, while the closest country, Australia, had the lowest transportation costs. The cost of importing fuel from the USA was approximately three times higher than that of importing fuel from Australia. Overall, ammonia fuel yielded the highest cost, and VLSFO/MGO yielded the lowest cost. When using ammonia fuel, the unit transportation cost was approximately twice that of VLSFO, and the largest cost in the LCC was the fuel cost. In the Australian scenario, fuel costs were about 44.3% for VLSFO/MGO, about 65.2% for LNG, and about 52.8% for ammonia.
This study also performed a sensitivity analysis to investigate the influence of assumptions and assumed parameters. The investigated factors were ship purchasing or chartering, lifespan, ship average speed, harbor in/out times, loading/unloading times, inspection time, and fuel prices. The results of the sensitivity analysis showed that ship purchasing or chartering, lifespan, ship average speed, and fuel prices considerably affected the unit transportation cost. When the ship was acquired by chartering rather than purchasing, the unit transportation cost was increased by 53.6% in the case of VLSFO/MGO fuel. When the lifespan of the ammonia carrier was shortened by 5 years, the unit transportation cost increased by about 10.4%. In contrast, the unit transportation cost decreased by about 6.2% when the life of the ship was extended by 5 years. In terms of ship speed, when decreasing from the currently assumed speed of 14.8 knots to 13 knots, the unit transportation cost decreased by about 1.1%, but when increasing from 14.8 knots to 17 knots, the unit transportation cost increased by about 7.1%. This result indicated that the ship’s average speed of 14.8 knots is quite reasonable. Moreover, for every ±30% change in the VLSFO/MGO fuel price, the unit transportation cost changed by about 13.3%. Although this study considered the costs of transporting ammonia by ship excluding ammonia production and ammonia storage, this study’s results could be used as fundamental data for the cost estimation of ammonia, whose international trade is expected to increase.
Techno-economic analysis will be performed for the ammonia supply chain, including ammonia production, storage, and utilization, in the future study. Additionally, the effect of vessel characteristics on the costs will be also investigated, and the ways to increase the efficiency of the ammonia carrier (to reduce the costs) will be studied. This study shows that using ammonia as fuel is the most expensive fuel among proposed fuels. However, the results may change if the environmental impacts and associated costs are considered. The techno-economic analysis will be performed by considering the costs (for SCR, carbon tax, OCCS, etc.) required by using VLSFO/MGO and LNG under strengthened regulations on carbon emission.

Author Contributions

Conceptualization, methodology, and writing—original draft preparation, Y.S.; conceptualization and investigation, J.A.; data curation, J.K., E.P., and M.C.; supervision S.H.; writing—review and editing, J.L. All authors have read and agreed to the published version of the manuscript.

Funding

This research was supported by a grant from the National R&D Project “Development of 2100 PS LNG-Ammonia Dual Fuel Engine”, funded by the Ministry of Oceans and Fisheries (1525013755).

Institutional Review Board Statement

Not applicable.

Informed Consent Statement

Not applicable.

Data Availability Statement

Data is contained within the article.

Conflicts of Interest

The authors declare no conflict of interest.

References

  1. Enerdata_World Energy Climate Statistics Yearbook 2023. Available online: https://yearbook.enerdata.net/electricity/world-electricity-production-statistics.html (accessed on 21 November 2023).
  2. BP. Statistical Review of World Energy 2021. BP Energy Outlook 2021 2021, 70, 8–20. [Google Scholar]
  3. Lee, S.; Lee, H.J. Potential applicabilities of ammonia in future hydrogen energy supply industries. Appl. Chem. Eng. 2019, 30, 667–672. [Google Scholar] [CrossRef]
  4. Joung, T.H.; Kang, S.G.; Lee, J.K.; Ahn, J. The IMO initial strategy for reducing Greenhouse Gas(GHG) emissions, and its follow-up actions towards 2050. J. Int. Marit. Saf. Environ. Aff. Shipp. 2020, 4, 1–7. [Google Scholar] [CrossRef]
  5. Pali, B.S.; Vadhera, S. Renewable energy systems for generating electric power: A review. In Proceedings of the 2016 IEEE 1st International Conference on Power Electronics, Intelligent Control and Energy Systems (ICPEICES), Delhi, India, 4–6 July 2016; pp. 1–6. [Google Scholar] [CrossRef]
  6. Al-Ghussain, L.; Abubaker, A.M.; Darwish Ahmad, A. Superposition of Renewable-Energy Supply from Multiple Sites Maximizes Demand-Matching: Towards 100% Renewable Grids in 2050. Appl. Energy 2021, 284, 116402. [Google Scholar] [CrossRef]
  7. Rahman, M.M.; Oni, A.O.; Gemechu, E.; Kumar, A. Assessment of energy storage technologies: A review. Energy Convers. Manag. 2020, 223, 113295. [Google Scholar] [CrossRef]
  8. Evans, A.; Strezov, V.; Evans, T.J. Assessment of utility energy storage options for increased renewable energy penetration. Renew. Sustain. Energy Rev. 2012, 16, 4141–4147. [Google Scholar] [CrossRef]
  9. Wulf, C.; Linßen, J.; Zapp, P. Review of power-to-gas projects in Europe. Energy Procedia 2018, 155, 367–378. [Google Scholar] [CrossRef]
  10. Vandewalle, J.; Bruninx, K.; D’Haeseleer, W. Effects of large-scale power to gas conversion on the power, gas and carbon sectors and their interactions. Energy Convers. Manag. 2015, 94, 28–39. [Google Scholar] [CrossRef]
  11. Lewandowska-Bernat, A.; Desideri, U. Opportunities of power-to-gas technology in different energy systems architectures. Appl. Energy 2018, 228, 57–67. [Google Scholar] [CrossRef]
  12. Sterner, M.; Specht, M. Power-to-Gas and Power-to-X—The History and Results of Developing a New Storage Concept. Energies 2021, 14, 6594. [Google Scholar]
  13. Ozturk, M.; Dincer, I. A comprehensive review on power-to-gas with hydrogen options for cleaner applications. Int. J. Hydrogen Energy 2021, 46, 31511–31522. [Google Scholar] [CrossRef]
  14. Wijayanta, A.T.; Oda, T.; Purnomo, C.W.; Kashiwagi, T.; Aziz, M. Liquid hydrogen, methylcyclohexane, and ammonia as potential hydrogen storage: Comparison review. Int. J. Hydrogen Energy 2019, 44, 15026–15044. [Google Scholar] [CrossRef]
  15. Lee, J.; Choi, Y.; Choi, J. Techno-Economic Analysis of NH3 Fuel Supply and Onboard Re-Liquefaction System for an NH3-Fueled Ocean-Going Large Container Ship. J. Mar. Sci. Eng. 2022, 10, 1500. [Google Scholar] [CrossRef]
  16. Raab, M.; Maier, S.; Dietrich, R.U. Comparative techno-economic assessment of a large-scale hydrogen transport via liquid transport media. Int. J. Hydrogen Energy 2021, 46, 11956–11968. [Google Scholar] [CrossRef]
  17. Ishimoto, Y.; Voldsund, M.; Nekså, P.; Roussanaly, S.; Berstad, D.; Gardarsdottir, S.O. Large-scale production and transport of hydrogen from Norway to Europe and Japan: Value chain analysis and comparison of liquid hydrogen and ammonia as energy carriers. Int. J. Hydrogen Energy 2020, 45, 32865–32883. [Google Scholar] [CrossRef]
  18. Sekkesaeter, Ø. Evaluation of Concepts and Systems for Marine Transportation of Hydrogen. Master’s Thesis, Norwegian University of Science and Technology, Trondheim, Norway, 2019. [Google Scholar]
  19. Fúnez Guerra, C.; Reyes-Bozo, L.; Vyhmeister, E.; Jaén Caparrós, M.; Salazar, J.L.; Clemente-Jul, C. Technical-economic analysis for a green ammonia production plant in Chile and its subsequent transport to Japan. Renew. Energy 2020, 157, 404–414. [Google Scholar] [CrossRef]
  20. Franco, B.A.; Baptista, P.; Neto, R.C.; Ganilha, S. Assessment of offloading pathways for wind-powered offshore hydrogen production: Energy and economic analysis. Appl. Energy 2021, 286, 116553. [Google Scholar] [CrossRef]
  21. Voniati, G.; Dimaratos, A.; Koltsakis, G.; Ntziachristos, L. Ammonia as a Marine Fuel towards Decarbonization: Emission Control Challenges. Sustainability 2023, 15, 15565. [Google Scholar] [CrossRef]
  22. Machaj, K.; Kupecki, J.; Malecha, Z.; Morawski, A.W.; Skrzypkiewicz, M.; Stanclik, M.; Chorowski, M. Ammonia as a potential marine fuel: A review. Energy Strateg. Rev. 2022, 44, 100926. [Google Scholar] [CrossRef]
  23. Hansson, J.; Brynolf, S.; Fridell, E.; Lehtveer, M. The potential role of ammonia as marine fuel-based on energy systems modeling and multi-criteria decision analysis. Sustainability 2020, 12, 3265. [Google Scholar] [CrossRef]
  24. Ammonia Energy Value Chain for Carbon Neutrality from Production to Utilization. Available online: https://www.ihi.co.jp/en/technology/techinfo/contents_no/1199389_13586.html (accessed on 21 November 2023).
  25. Egerer, J.; Grimm, V.; Niazmand, K.; Runge, P. The economics of global green ammonia trade—“Shipping Australian wind and sunshine to Germany”. Appl. Energy 2023, 334, 120662. [Google Scholar] [CrossRef]
  26. Seo, Y.; Han, S. Economic evaluation of an ammonia-fueled ammonia carrier depending on methods of ammonia fuel storage. Energies 2021, 14, 8326. [Google Scholar] [CrossRef]
  27. Wartsila Provides LFSS Solution to BW LPG’s VLGC Vessels. Available online: https://www.ship-technology.com/news/wartsila-lfss-bw-lpg-vessels/?cf-view (accessed on 21 November 2023).
  28. Growing Orders for Alfa Laval FCM LPG Fuel Supply Systems Reflect Strength in Alfa Laval’s Broad LPG Offering. Available online: https://www.alfalaval.kr/media/news/2022/growing-orders-for-alfa-laval-fcm-lpg-fuel-supply-systems-reflect-strength-in-alfa-laval-s-broad-lpg-offering/ (accessed on 21 November 2023).
  29. Seo, Y.; Kim, J.; Park, E.; Lee, J.; Cho, M.; Han, S. Analysis of Energy Consumption of Novel Re-Liquefaction System Integrated with Fuel Supply System (FSS) for LPG-Fuelled LPG Carrier to Conventional Systems. Energies 2022, 15, 9384. [Google Scholar] [CrossRef]
  30. Berthelsen, F.H.; Nielsen, U.D. Prediction of ships’ speed-power relationship at speed intervals below the design speed. Transp. Res. Part D Transp. Environ. 2021, 99, 102996. [Google Scholar] [CrossRef]
  31. Statista. Average Speed of Vessels in the World Merchant Fleet in 2018, by Ship Type. Available online: https://www.statista.com/statistics/1268217/average-speed-of-ships-by-ship-type/ (accessed on 21 November 2023).
  32. Aabo, K. Ammonia-fuelled MAN B&W 2-Stroke Dual-fuel Engines. J. JIME 2020, 55, 62–69. [Google Scholar]
  33. MAN Energy Solutions. MAN B&W Two-Storke Engine Operting on Ammonia; Man Energy Solutions: Augsburg, Denmark, 2021. [Google Scholar]
  34. Wartsil Test-Runs 90 Percent Ammonia-Fueled Engine. Available online: https://shippingwatch.com/regulation/article15928061.ece (accessed on 21 November 2023).
  35. WinGD on Track to Deliver Ammonia Engines in 2025. Available online: https://www.wingd.com/en/news-media/press-releases/wingd-on-track-to-deliver-ammonia-engines-in-2025/ (accessed on 21 November 2023).
  36. WinGD and HHI to Partner on Development of NH3 Engine. Available online: https://www.ship-technology.com/news/wingd-hyundai-ammonia-engine/ (accessed on 21 November 2023).
  37. KR. Guidelines for Ships Using Ammonia as Fuels; Korean Regist: Busan, Republic of Korea, 2021. [Google Scholar]
  38. Clarksons Research. World Shipyard Monitor; Clarkson Research Services Limited: London, UK, 2021; Volume 28. [Google Scholar]
  39. SEA/LNG. LNG as a Marine Fuel—The Investment Opportunity; SEA/LNG Ltd.: Oxford, UK, 2019. [Google Scholar]
  40. World Bunker Prices. Available online: https://shipandbunker.com/prices (accessed on 14 August 2023).
  41. Green Ammonia Fuel Faces Three Big Challenges. (Posted 17 February 2022). Available online: https://sustainability.crugroup.com/article/green-ammonia-fuel-faces-three-big-challenges (accessed on 21 November 2023).
  42. Clarksons Research. Clarksons Research, Shipping Review and Outlook March 2022; Clarksons Research: London, UK, 2022. [Google Scholar]
  43. Fuel ammonia supply chain public-private task force. Fuel ammonia supply cost analysis (Interim report). In Proceedings of the Second International Conference on Fuel Ammonia, Online, 28 September 2022. [Google Scholar]
Figure 1. Classification of energy storage systems [8].
Sustainability 16 00827 g001
Figure 2. Research scope.
Sustainability 16 00827 g002
Figure 3. Global ammonia trade flows and balances larger than 0.1 Mt per year in 2019 [25].
Sustainability 16 00827 g003
Figure 4. Ammonia carriers propelled by conventional fuels.
Sustainability 16 00827 g004
Figure 5. Ammonia-fueled ammonia carrier.
Sustainability 16 00827 g005
Figure 6. Three scenarios proposed for ammonia transportation.
Sustainability 16 00827 g006
Figure 7. LCC for ammonia transportation.
Sustainability 16 00827 g007
Figure 8. LCC depending on the method of ship acquisition.
Sustainability 16 00827 g008
Figure 9. LCC depending on lifespan (ship purchasing case).
Sustainability 16 00827 g009
Figure 10. LCC depending on the ship’s average speed.
Sustainability 16 00827 g010
Figure 11. LCC depending on the harbor in/out times.
Sustainability 16 00827 g011
Figure 12. LCC depending on loading/unloading times.
Sustainability 16 00827 g012
Figure 13. LCC depending on annual inspection time.
Sustainability 16 00827 g013
Figure 14. LCC depending on fuel price.
Sustainability 16 00827 g014
Table 1. Physical properties of LH2, LOHC, and ammonia.
PropertyUnitLH2LOHC
(TOL-MCH)
Liquid NH3Reference
Molecular weight-2.01692.14/98.1917.03[14]
Densitykg/m370.8867/769682[14,15]
Boiling temperature at 1 bar°C−252.9110/101−33.34[14,15]
Gravimetric H2 densitywt%1006.1617.8[14,15]
Volumetric H2 densitykg-H2/m370.847.1120.3[14]
Advantages-High pure H2Easy handlingEasy handling[14]
Disadvantages-Liquefaction, BOGDehydrogenationCracking, toxic[14]
Table 2. Assumptions for ammonia carrier.
ItemValue
Capacity84,000 m3 (57,000 tons)
Fuel (main/auxiliary)VLSFO/MGOLNG/LNGAmmonia/Ammonia
Capacity of main engineSMCR 13,300 kW (7770 kW at average speed 14.8 knots)
Capacity of main engine1400 kW × 3 + 800 kW × 1
Average speed14.8 knots
Port in/out time each12 h
Loading/unloading time each24 h
Inspection time per year30 days
Lifespan20 years
Table 3. Assumptions for the LCC estimation.
ItemPriceRemark and References
New building price for a propulsor using conventional fuelsUSD 71.0 m[38]
New building price for a propulsor using ammoniaUSD 80.7 m[38,39]
New building price for a propulsor using LNGUSD 80.4 m[26,38]
New building price for a propulsor using conventional fuels (70% loan)USD 93.1 m[26,38,39]
annual interest rate of 5% and equal repayment of the principal and interest over 15 years
New building price for a propulsor using ammonia (70% loan)USD 105.8 m
New building price for a propulsor using LNG (70% loan)USD 105.5 m
VLSFO bunkering price631 USD/t[40]
MGO bunkering price816 USD/t[40]
Ammonia fuel price777 USD/t[41]
LNG bunkering price1366 USD/t[40]
Cost for ports (loading or discharging)55,000 USD/per[42]
Cost for Panama Canal (laden and ballast)700,000 USD/per[42]
Disclaimer/Publisher’s Note: The statements, opinions and data contained in all publications are solely those of the individual author(s) and contributor(s) and not of MDPI and/or the editor(s). MDPI and/or the editor(s) disclaim responsibility for any injury to people or property resulting from any ideas, methods, instructions or products referred to in the content.

