Abstract
The maritime economy is gradually becoming a new engine for the high-quality development of the economic and social sectors. However, due to factors such as geographical location and natural endowments, there are significant regional disparities, making it challenging for the national maritime economy to achieve balanced development. Therefore, this paper constructs an index evaluation system for the high-quality development of the maritime economy. It calculates the comprehensive index and subsystem indices of the high-quality development of the maritime economy in 11 coastal provinces (cities and districts) in China from 2008 to 2020 and examines their regional disparities and dynamic evolution. The study reveals the following: (1) The high-quality development levels of the maritime economy in coastal provinces show a fluctuating upward trend, with different dimensions of advantages in each province. (2) The overall regional disparities exhibit a development trajectory of expansion followed by contraction, with a general trend in narrowing disparities. Currently, the southern maritime economic zone has the greatest internal differences, and the gap between the southern and northern maritime economic zones is relatively pronounced. (3) Significant fluctuations are observed in the disparities in high-quality development of the maritime economy between China and the three major maritime economic zones. The internal gaps within the northern and southern maritime economic zones have expanded to varying degrees, whereas the gaps within the eastern maritime economic zone have shown some convergence. (4) Inter-group mobility among provinces in different states of high-quality development of the maritime economy is low, and provinces in a low-level state exhibit a noticeable “low-end lock-in” phenomenon. This paper, through a timely spatial and temporal analysis of China’s high-quality development process of the maritime economy, aims to provide policy guidance for advancing the high-quality development of the maritime economy.
1. Introduction
In today’s world, the development and utilization of the oceans by humans are central to global progress, with the marine economy gradually becoming a crucial topic for economic and social development worldwide. However, the global COVID-19 pandemic has significantly impacted countries, leading to various degrees of lockdowns and a surge in anti-globalization sentiments. As a result, the predominantly outward-oriented marine economy has suffered more severe disruptions compared to other economic sectors. Taking the maritime transportation industry, a pillar of the marine economy, as an example: in August 2022, shipping prices from China to the US West Coast experienced an 80% sharp decline from the previous year’s peak, and, within three months, freight rates on routes to Central and South America dropped by over 70%. In July 2023, the container trade volume through the nine largest ports in the United States reached its lowest level since 2017, signaling a prolonged downturn in cross-border shipping and the global marine economy.
Against this backdrop, China, as a key participant in the global marine industry chain, is facing numerous challenges in marine economic development, including insufficient raw materials, technological bottlenecks, and sluggish exports. In 2022, China’s marine gross production value was 9.4628 trillion yuan, a 1.9% increase from the previous year, accounting for 7.8% of the national gross domestic product (GDP). However, both the growth rate and the proportion have exhibited a noticeable downward trend compared to before the outbreak of the global pandemic. Simultaneously, 70.83% of China’s 24 typical marine ecosystems are in a sub-healthy state, and the proportion of marine areas not meeting first-class water quality standards has increased, highlighting persistent issues in marine ecology. The challenges now are how to restore China’s marine economic development, significantly increase the marine economy’s proportion in the national GDP, coordinate efforts for marine ecological protection and restoration projects, and transform the marine economy into a new sustainable growth driver for the country. Addressing this situation, Chinese President Xi Jinping has emphasized multiple times in guiding marine strategy: “The ocean is a strategic focus for high-quality development.” This assertion not only clarifies the crucial role of marine affairs in the high-quality development of the national economy but also provides effective solutions to a series of development issues faced by China’s marine economy, making “high-quality development of the marine economy” a prominent and widely discussed topic across various sectors of society.
In recent years, scholars have made exploratory attempts around the theme of “high-quality development of the marine economy”, addressing aspects such as defining its connotation, assessing its levels, and exploring implementation paths. It is commonly acknowledged that due to the unique attributes of the marine economy, the connotation of high-quality development cannot be directly applied to it [1]. Scholars have thus focused on the overall factors and processes of marine economic development [2,3], emphasizing the systemic coordination among marine economy, marine ecology, and marine technology [4,5,6]. While some studies have used the Data Envelopment Analysis (DEA) to quantify the high-quality development of the marine economy [7], the mainstream approach involves constructing an indicator system and using objective weighting methods like entropy and Technique for Order Preference by Similarity to an Ideal Solution (TOPSIS) to measure scores [8,9,10]. These studies have revealed significant disparities in the level of high-quality development of the marine economy among coastal regions. Scholars have also explored paths for achieving high-quality development from various perspectives, including ecological environmental protection [11], national security strategies [12], building a modern marine industry system [13,14], optimizing spatial layout [15], and enhancing efficiency through factors such as technology [16], funds [17], and policies [18,19].
Despite these valuable contributions to deepening the understanding of high-quality development of the marine economy, some shortcomings are apparent. Firstly, there is a lack of consensus among scholars regarding the definition of the connotation of high-quality development, leading to the current confusion in existing indicator systems that often mix process and outcome indicators, making it challenging to accurately assess the status of high-quality development of the marine economy. Secondly, the predominant use of objective weighting methods assesses high-quality development as a whole, with limited analysis of its subsystems. Thirdly, there is insufficient systematic investigation of regional differences in the high-quality development of the marine economy, and existing paths do not adequately reflect the spatially coordinated development requirements for the marine economy in the new era.
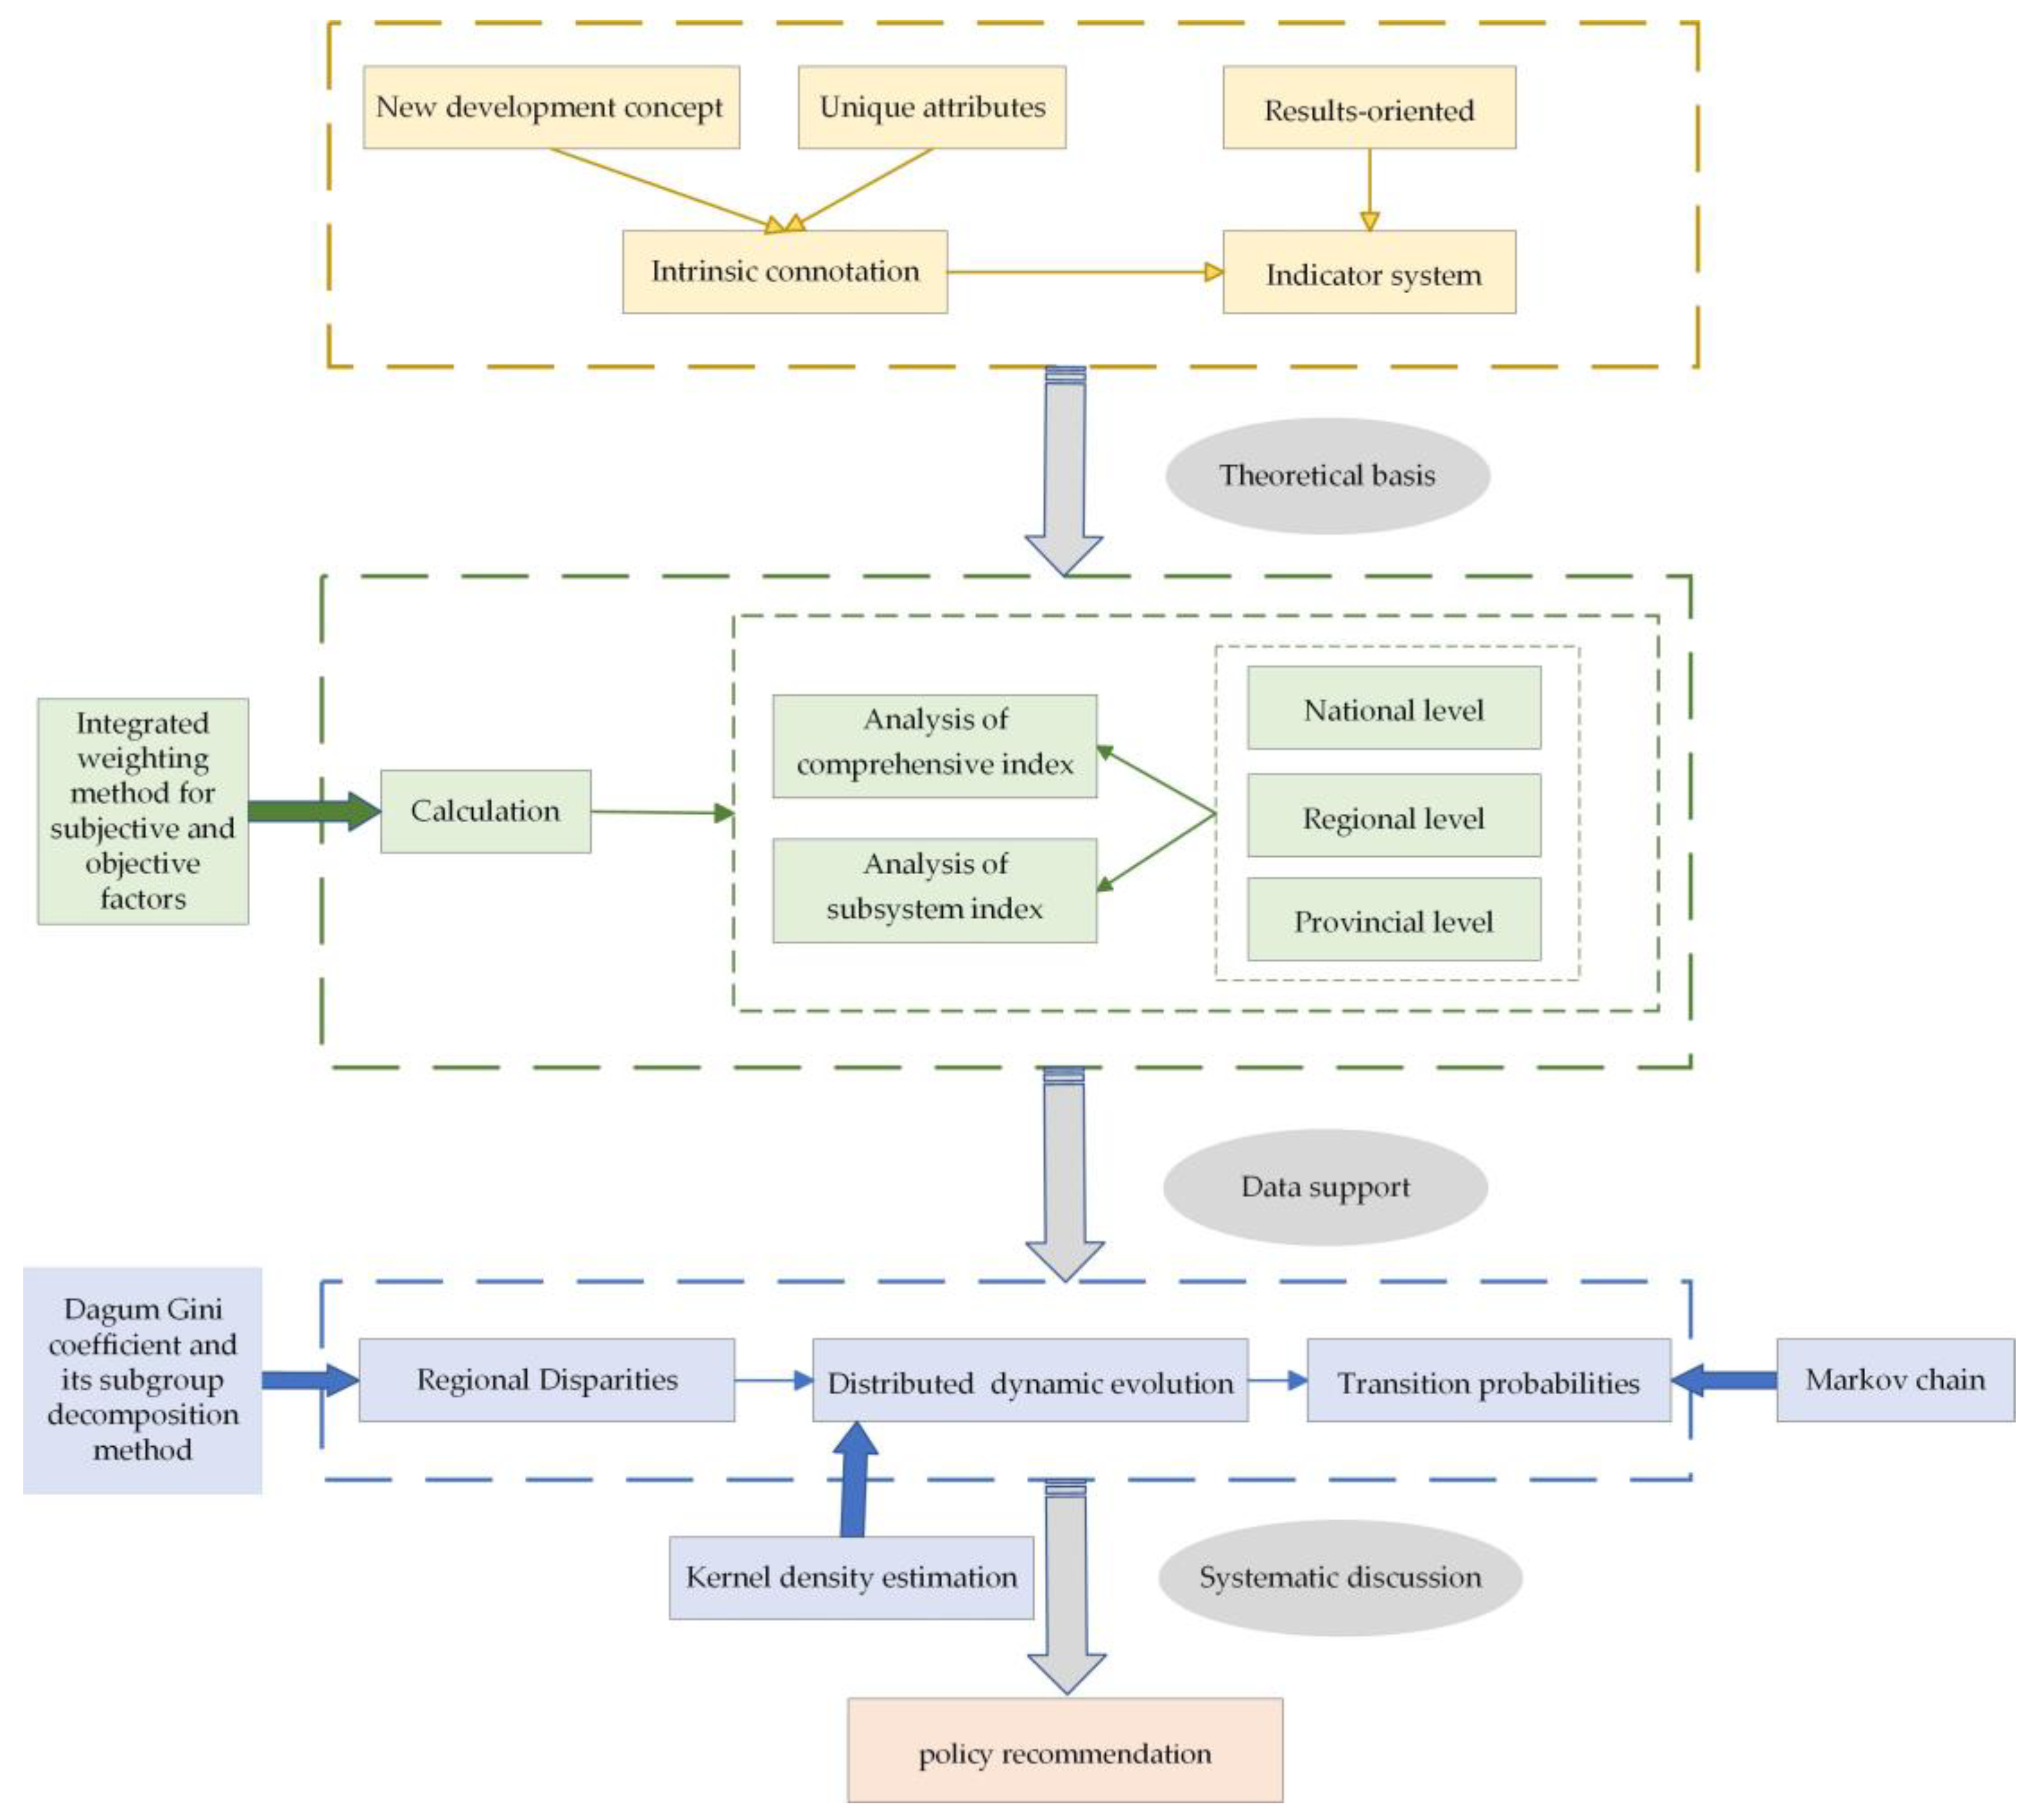
Therefore, as shown in Figure 1, this paper constructs a results-oriented indicator system for the high-quality development of the marine economy. It employs a comprehensive weighting method, combining both subjective and objective aspects, to measure and analyze composite and subsystem indices at different levels, including national, regional, and provincial scales. Additionally, the paper employs methods such as Dagum’s Gini coefficient decomposition, Kernel density estimation, and Markov chains to systematically examine regional disparities and dynamic evolution in the distribution of high-quality development of the marine economy. The breakthroughs in this paper include: (1) integrating the new development concept with the unique attributes of the marine economy, selecting “result” indicators to construct the indicator system, thereby avoiding the confusion of process and outcome indicators seen in previous studies; (2) using a comprehensive weighting method to determine indicator weights, overcoming the issue of ignoring human will in objective weighting methods and enhancing the scientific assessment of the level of high-quality development of the marine economy; (3) conducting a detailed analysis of subsystem indices for high-quality development of the marine economy, clarifying internal differences in high-quality development across different periods and regions; (4) applying methods such as Dagum’s Gini coefficient decomposition, Kernel density estimation, and Markov chains to systematically discuss regional disparities and dynamic evolution in the distribution of high-quality development of the marine economy at different levels, specifying the transition probabilities of different states in response to the spatially coordinated development of the marine economy and providing relevant policy recommendations.
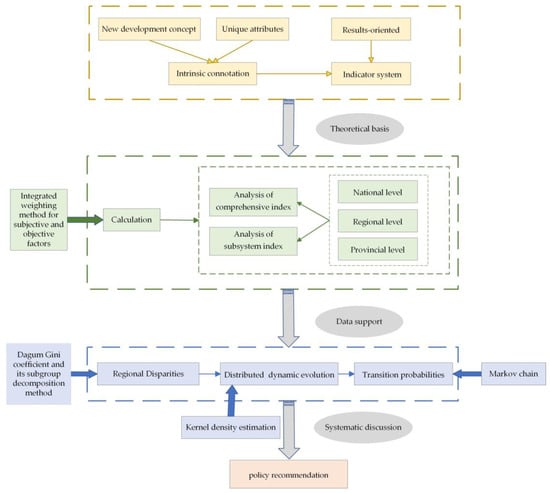
Figure 1.
Technology Roadmap.
2. Materials and Methods
This paper employs a comprehensive weighting method, incorporating both subjective and objective factors, to assign weights to various indicators of high-quality development in the maritime economy. It scientifically measures the level of high-quality development in China’s coastal regions. Using the Dagum Gini coefficient and its subgroup decomposition method, the paper examines regional disparities in the high-quality development of the maritime economy in China. The Kernel density estimation method is applied to reveal the distribution dynamics of absolute differences in high-quality development among different coastal regions in China, summarizing their evolutionary patterns and trends. Additionally, the Markov chain is utilized to clarify the state transition probabilities of high-quality development in the maritime economy, further predicting the future trajectory of China’s high-quality development in the maritime economy.
2.1. Integrated Weighting Method for Subjective and Objective Factors
Before calculating the index, it is necessary to determine the weight of each indicator in the indicator system. This paper adopts the method of integrated weighting for both subjective and objective considerations to overcome the respective drawbacks of subjective and objective weighting. In this method, the Analytic Hierarchy Process (AHP) is chosen for subjective weighting, whereas the Entropy Value Method (EVM) [20,21] is employed for objective weighting. The paper first applies AHP and EVM separately to determine subjective and objective weights and then utilizes the multiplication synthesis normalization method to obtain the comprehensive weights for each indicator in the system. This is Equation (1):
The comprehensive weight of each indicator is denoted as wi, with the subjective weights obtained by the Analytic Hierarchy Process (AHP) represented as w1i, and the objective weights obtained by the Entropy Value Method (EVM) is represented as w2i. In the following sections, wi will be used as the final indicator to assess the high-quality development level of the marine economy in coastal areas across different periods and regions.
2.2. Dagum Gini Coefficient and Its Subgroup Decomposition Method
In comparison to the Theil index method and Gini coefficient method with subgroup decomposition, the Dagum Gini coefficient method exhibits significant advantages in regional disparity research. Therefore, this paper adopts this method to calculate and decompose the regional disparities in the high-quality development level of the marine economy [22]. This is Equation (2):
Among them, G is the overall Gini coefficient, n is the number of provinces, k is the number of subgroups, Rji (Rhr) is the high-quality development index of any coastal province j(h), and R represents the average value of the high-quality development index for all coastal provinces. A larger value of the Dagum Gini coefficient indicates a higher degree of regional imbalance in the high-quality development of China’s marine economy. This is Equations (3)–(5):
2.3. Kernel Density Estimation
Unlike the Gini coefficient, which primarily characterizes the relative differences in phenomena, kernel density estimation focuses on analyzing the absolute differences and dynamic distribution evolution of phenomena. The sequential application of these two methods contributes to a more scientific and comprehensive analysis of the spatial imbalance issues in the high-quality development of the marine economy. As a non-parametric estimation method, kernel density estimation examines the distribution characteristics of samples at different time points by smoothing continuous curves. It depicts the distribution pattern and evolutionary trend in phenomena and finds wide applications in the study of spatial distribution across various fields [23]. The probability density function at point x is given by Equation (6):
where N is the number of observed values, K is the kernel function, h is the bandwidth, Xi represents independently and identically distributed observed values, and x is the mean. The kernel density estimation function needs to satisfy Equation (7).
This paper employs the commonly used Gaussian kernel function to present the spatial distribution patterns, evolutionary trends, and expansibility of China’s major marine economic zones and the high-quality development of the marine economy in coastal provinces (Equation (8)).
2.4. Markov Chain
This model assumes that the state at a certain moment is independent of its past states and depends solely on its preceding state. As the probability of a particular state depends only on the previous state, obtaining the transition probabilities between any two states in the model is sufficient to determine the entire model [24] (Equation (9)).
Assuming the state at time t + 1 is Xt+1, when the transition matrix is known, starting from samples of any probability distribution can lead to obtaining samples that conform to the corresponding stable probability distribution after undergoing N steps of the Markov process. Similarly, for any specified transition matrix P, its nth power also converges. Based on this, the Markov chain analysis method can depict the entire dynamic evolution process of high-quality development in the marine economy.
Using the comprehensive index measured in the previous sections, we obtain the transition probability matrix for the high-quality development of the marine economy (Equation (10)). Therefore, the Markov chain model can be used to examine the transition probabilities of the high-quality development states for various coastal provinces (cities and regions) during the sample period, thereby determining their mobility among different categories of high-quality development levels in the marine economy.
3. Intrinsic Connotation and Indicator System
3.1. The Intrinsic Connotation of High-Quality Development in the Marine Economy
Clarifying the scientific essence of high-quality development in the marine economy is not only the starting point for researching relevant issues but also a crucial foundation for constructing a related indicator system. The following analysis delves into the intrinsic connotation of high-quality development in the marine economy, starting from the perspective of “marine economy” and integrating the concept of “high-quality development” under the new development philosophy.
On one hand, the marine economy represents a distinct economic category separate from the land-based economy. It is closely related to the ocean and its elements, involving the first, second, and third industries and possessing unique attributes such as resourcefulness, interdisciplinarity, public nature, risk, and openness. On the other hand, as China enters a new development stage and faces a new development environment, the pursuit of high-quality development has become a primary task in the comprehensive construction of a socialist modernized country. This task bears a distinct contemporary character and serves as a strategic guideline for resolving the major contradictions in Chinese society and promoting high-quality development. Consequently, the intrinsic connotation of high-quality development in the marine economy is closely tied to its characteristics and the new development philosophy.
Guided by Xi Jinping’s Thoughts on Socialism with Chinese Characteristics for a New Era, the high-quality development of the marine economy is an application of the five development philosophies in the field of the marine economy. Simultaneously, considering the unique attributes of the marine economy, the application of the new development philosophy to it is further expanded. Therefore, this article defines high-quality development in the marine economy as an initiative that, driven by innovation, enhances the efficiency of marine production factors, optimizes the structure of marine industries, promotes coordinated development between land and sea, continually improves the marine ecological environment, and deepens cooperation in international maritime affairs. It is dedicated to elevating the standard of living for the people. This definition encompasses five main aspects: innovation-driven efficiency, stable coordination, green ecology, open inclusivity, and shared achievements.
- (1)
- Innovation-Driven Efficiency Development: In the process of high-quality development in the marine economy, there is a shift from traditional factors to innovative factors. This not only maximizes the multiplier effect and positive externalities of innovation but also leads to increased production efficiency and optimization of the marine modernization production model.
- (2)
- Stable Coordination Development: High-quality development in the marine economy is not a short-term goal for a specific stage or region. It is a long-term process that requires coordinated and sustained efforts on a global scale, emphasizing stability and coordination in diverse development aspects, including economic foundations, internal structures, professional levels, and land–sea coordination.
- (3)
- Green Ecology Development: Emphasis is placed on addressing the harmonious coexistence of humans and the ocean, driving ecological civilization construction. This involves reducing energy consumption in marine production activities and protecting the marine ecological environment and biodiversity.
- (4)
- Open Inclusivity Development: Advocating openness by using the ocean as a window to promote global maritime industry chain advantages and attract more international resources. This strategic choice reflects China’s commitment to accelerating the construction of a maritime power and establishing a new development pattern, particularly in areas such as transportation, international trade, and foreign attraction.
- (5)
- Shared Achievement Development: The fundamental goal of high-quality development in the marine economy is people-oriented, focusing on improving people’s lives. It encompasses aspects related to basic livelihoods, public services, marine disasters, and endowment utilization, striving to ensure that the benefits of development are widely shared among the people.
3.2. Construction of Indicator System
Based on the interpretation of the intrinsic connotations of high-quality development in the marine economy in the previous section, this paper, after thoroughly reviewing similar evaluation indicator systems, follows four principles: comprehensiveness, hierarchy, operability, and goal orientation. The aim is to construct an evaluation indicator system for assessing the high-quality development level of China’s marine economy (as shown in Table 1) [25,26,27,28].

Table 1.
Evaluation index system for high-quality development of marine economy.
4. Index Calculation and Analysis
4.1. Calculation of the High-Quality Development Index for the Marine Economy
4.1.1. Scope of Calculation
Taking into account the international context of China’s marine economy development and the support policies in place, this paper limits the measurement of China’s high-quality development in the marine economy to the years 2008–2020. The research region is confined to 11 coastal provinces (including municipalities and regions) in China, excluding Hong Kong, Macau, and Taiwan. Specifically, the included regions are Tianjin, Hebei, Liaoning, Shandong, Shanghai, Jiangsu, Zhejiang, Fujian, Guangdong, and the South China Sea region. This geographical scope forms the basis for the calculation of China’s high-quality development index in the marine economy in this paper.
4.1.2. Data Sources
The data required for the calculation of indicators are sourced from the respective annual publications, including “China Ocean Statistical Yearbook”, “China Fisheries Statistical Yearbook”, “China Environmental Statistical Yearbook”, as well as the statistical yearbooks of each province (municipality, region), “China Ocean Economic Statistics Bulletin”, and other government bulletins. Data are also obtained from the China Ocean Economic Information Network.
Due to limitations in data availability, certain indicators undergo appropriate adjustments. Additionally, employing multiple imputation methods, missing data are smoothed based on actual circumstances. The indicators rationalized through these processes are then subjected to the dimensionless treatment mentioned earlier.
4.1.3. Calculation Formulas
After processing the data for each indicator as described above, resulting in Yi, and combining it with the calculated comprehensive weights, we can use the following formulas (Equations (2) and (3)) with a linear weighting method to obtain subsystem indices (Yi) for different dimensions of high-quality development in the marine economy. Additionally, the overall index (Y) can be obtained, representing the full connotation of high-quality development in the marine economy. The subsystem indices represent the levels of the five dimensions: innovation-driven efficiency, stable coordination, green ecology, open inclusivity, and shared achievements. Therefore, for a specific region in a given year, after calculating the subsystem indices based on the five dimensions, the comprehensive index encompassing the full connotation of high-quality development in the marine economy can be further calculated (Equations (11) and (12)).
4.2. Analysis of High-Quality Development Index in the Marine Economy
4.2.1. Comprehensive Index Analysis
The comprehensive index for high-quality development in China’s marine economy at different levels (national, regional, and provincial) and different years is calculated, as shown in Table 2.
Table 2.
Comprehensive Index of High-quality Development of China’s marine economy from 2008 to 2020.
(1) National Level. As shown in Table 2, the comprehensive index for high-quality development in China’s marine economy has exhibited an overall upward trend from 2008 to 2020. Over the twelve-year period, it increased from 0.43 in 2008 to 0.70 in 2020, marking a significant leap in the development of the marine economy. Particularly since 2013, with the deepening national emphasis on the marine economy, the comprehensive index for high-quality development has consistently increased year by year. In 2020, influenced by the global pandemic, the overall socioeconomic impact resulted in negative effects, particularly impacting the outward-oriented marine economy and causing a decline in the comprehensive index for high-quality development.
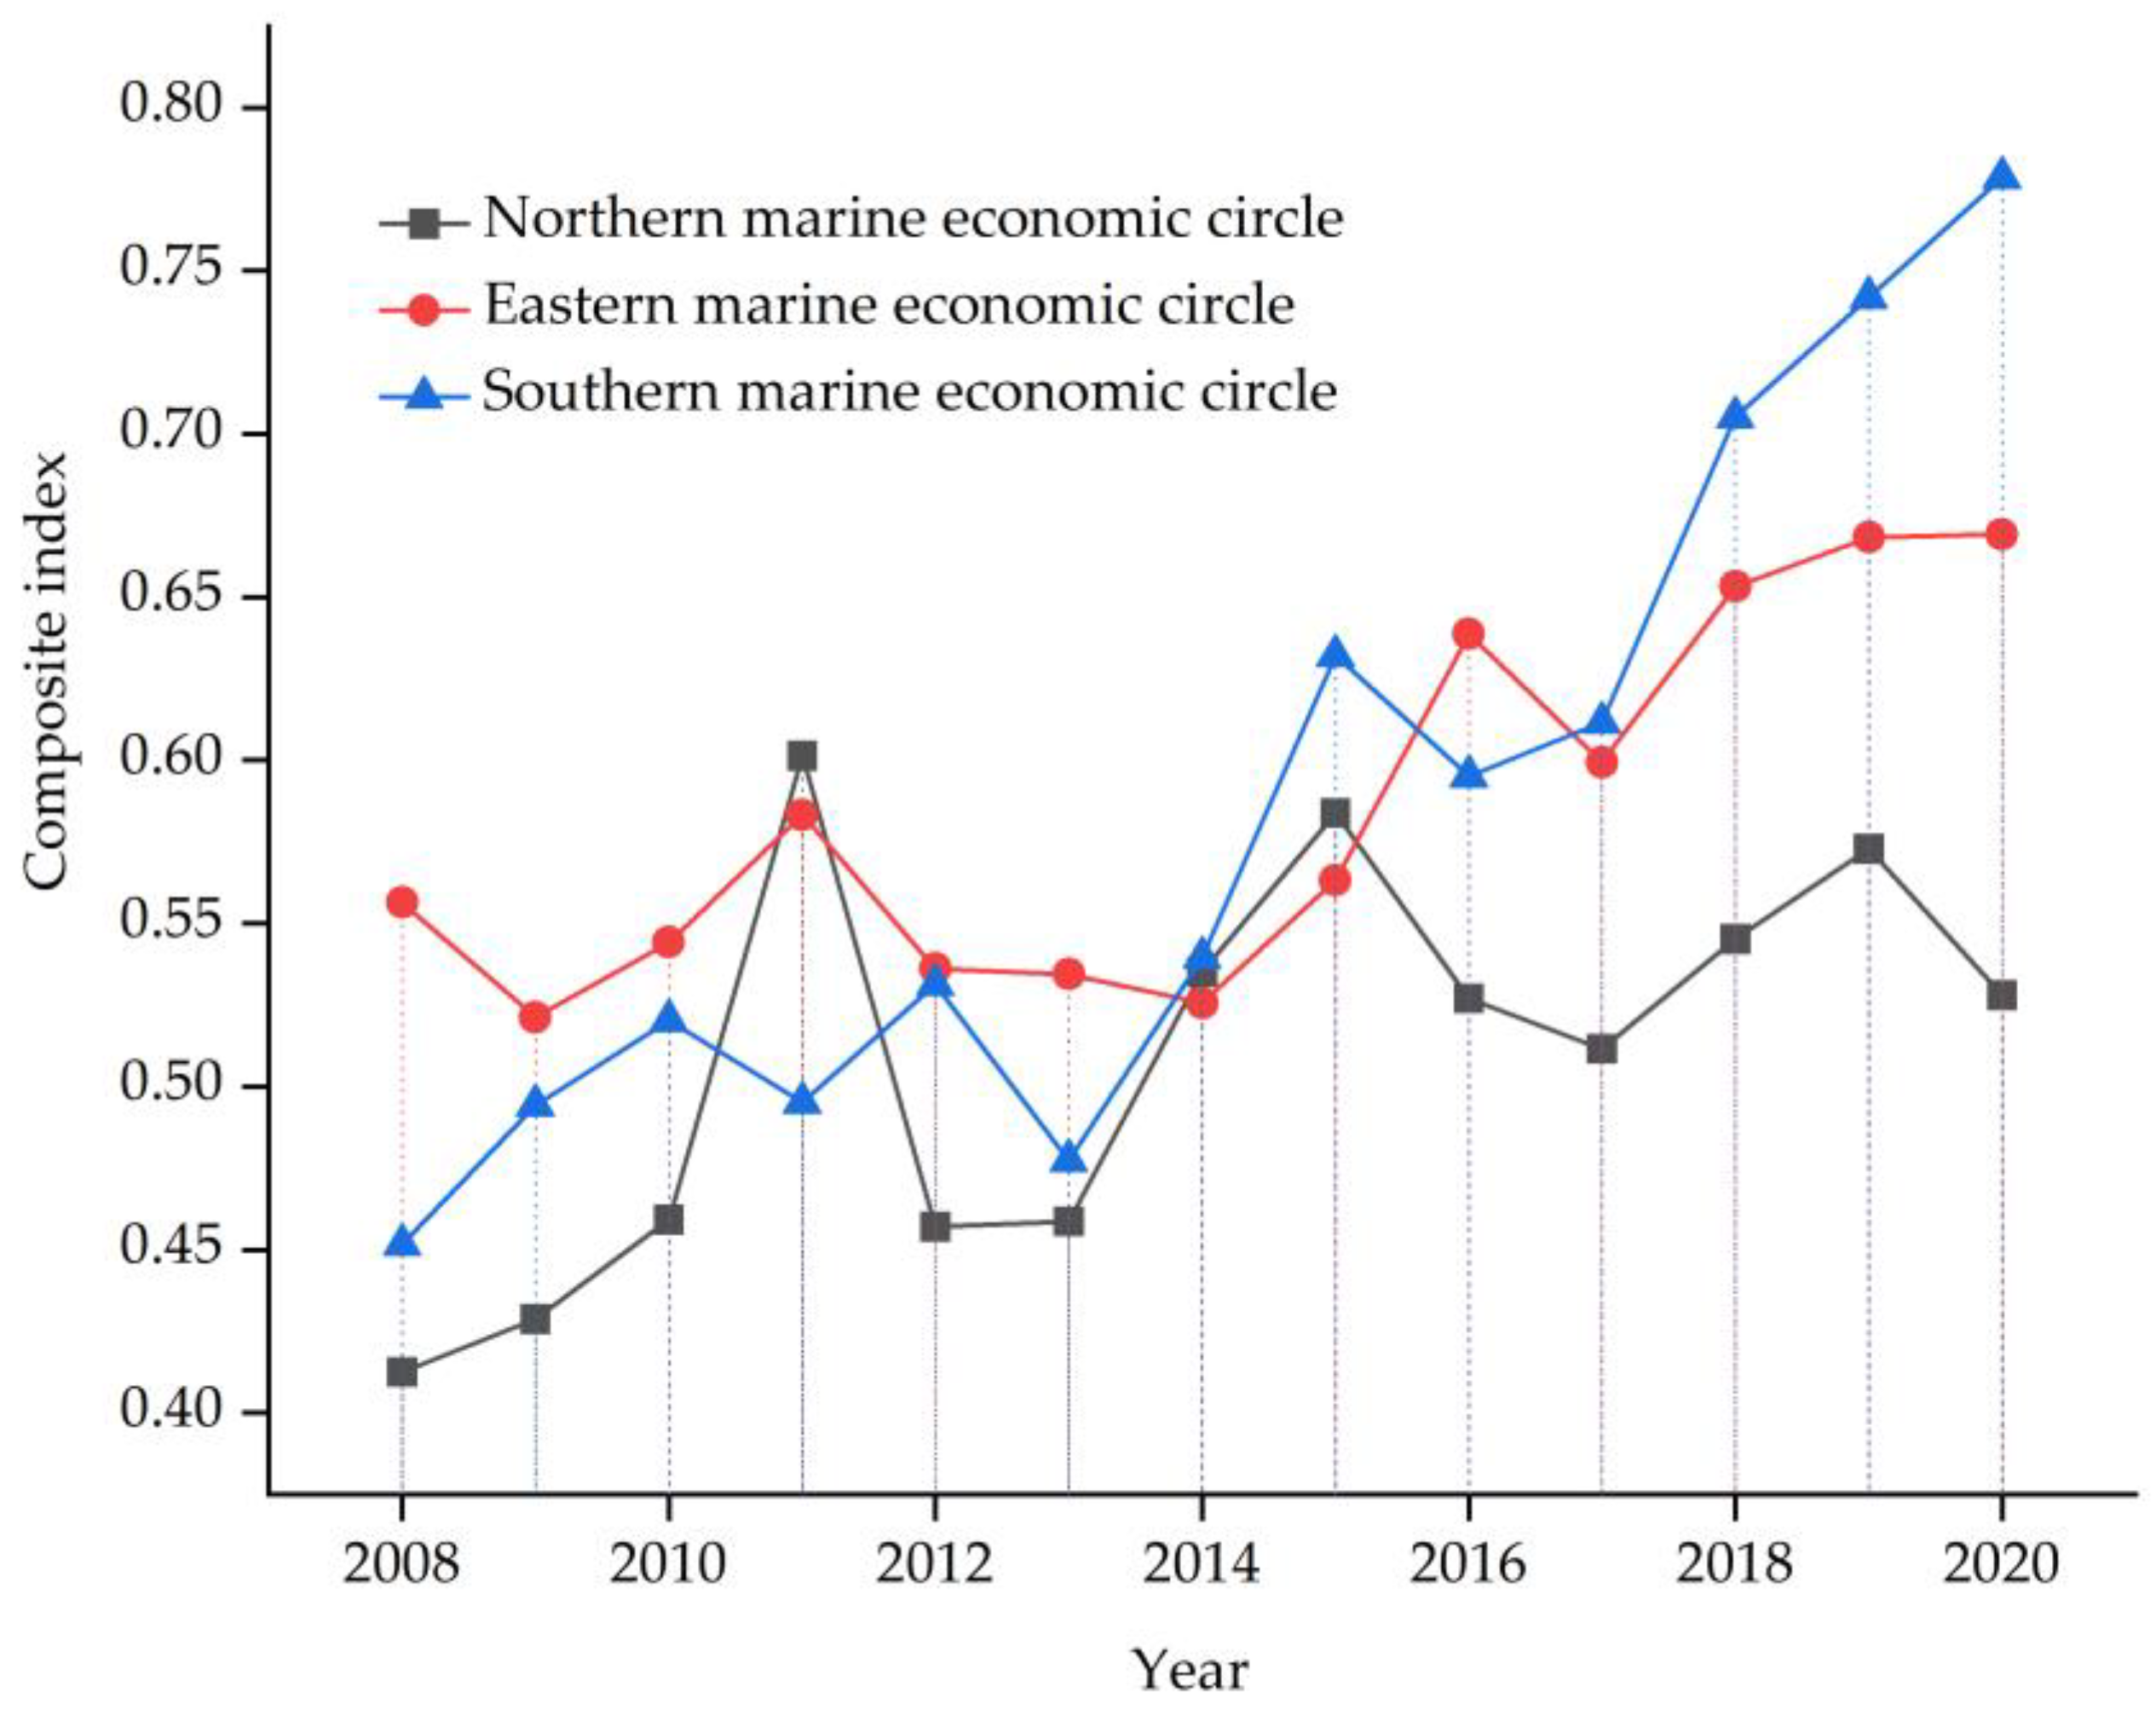
(2) Regional Level. With the gradual development of China’s marine economy, the layout of the marine economy has further optimized, forming three marine economic circles in the north, east, and south. The northern marine economic circle includes Liaoning Province, Hebei Province, Tianjin City, and Shandong Province; the eastern marine economic circle includes Jiangsu Province, Shanghai City, and Zhejiang Province; and the southern marine economic circle includes Fujian Province, Guangdong Province, Guangxi Zhuang Autonomous Region, and Hainan Province. The “14th Five-Year Plan” explicitly states the need to “comprehensively improve the development level of the three major marine economic circles in the north, east, and south” and emphasizes the requirement for “coordinated promotion” in the marine economic layout.
As shown in Figure 2, from 2008 to 2020, the high-quality development level of the three major marine economic circles has improved to varying degrees. During this period, the comprehensive indices of the northern, eastern, and southern marine economic circles increased by 28.01%, 20.28%, and 72.39%, respectively. As the fastest-growing marine economic circle in terms of development level, the southern marine economic circle, with its vast and abundant resources, achieved a comprehensive index of 0.78 in 2020, surpassing the national index by 11 percentage points, demonstrating strong development momentum. The eastern marine economic circle, with the second-highest development speed, continuously improved its port and shipping system over the past decade, showing a development trajectory similar to that of the southern marine economic circle. In contrast, the development of the northern marine economic circle has been relatively slow, with the comprehensive index for high-quality development increasing only from 0.41 to 0.53 over the twelve-year period.
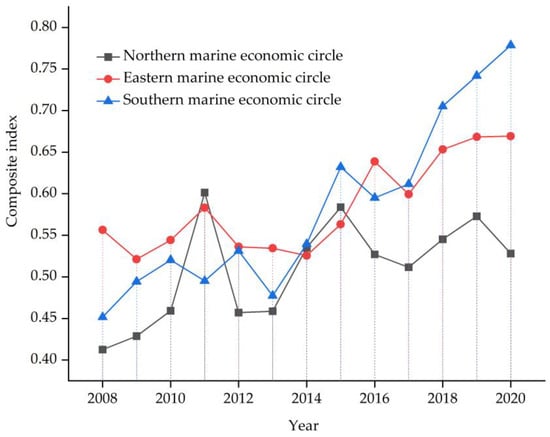
Figure 2.
Trend in the comprehensive index of high-quality Marine economy development in different regions from 2008 to 2020.
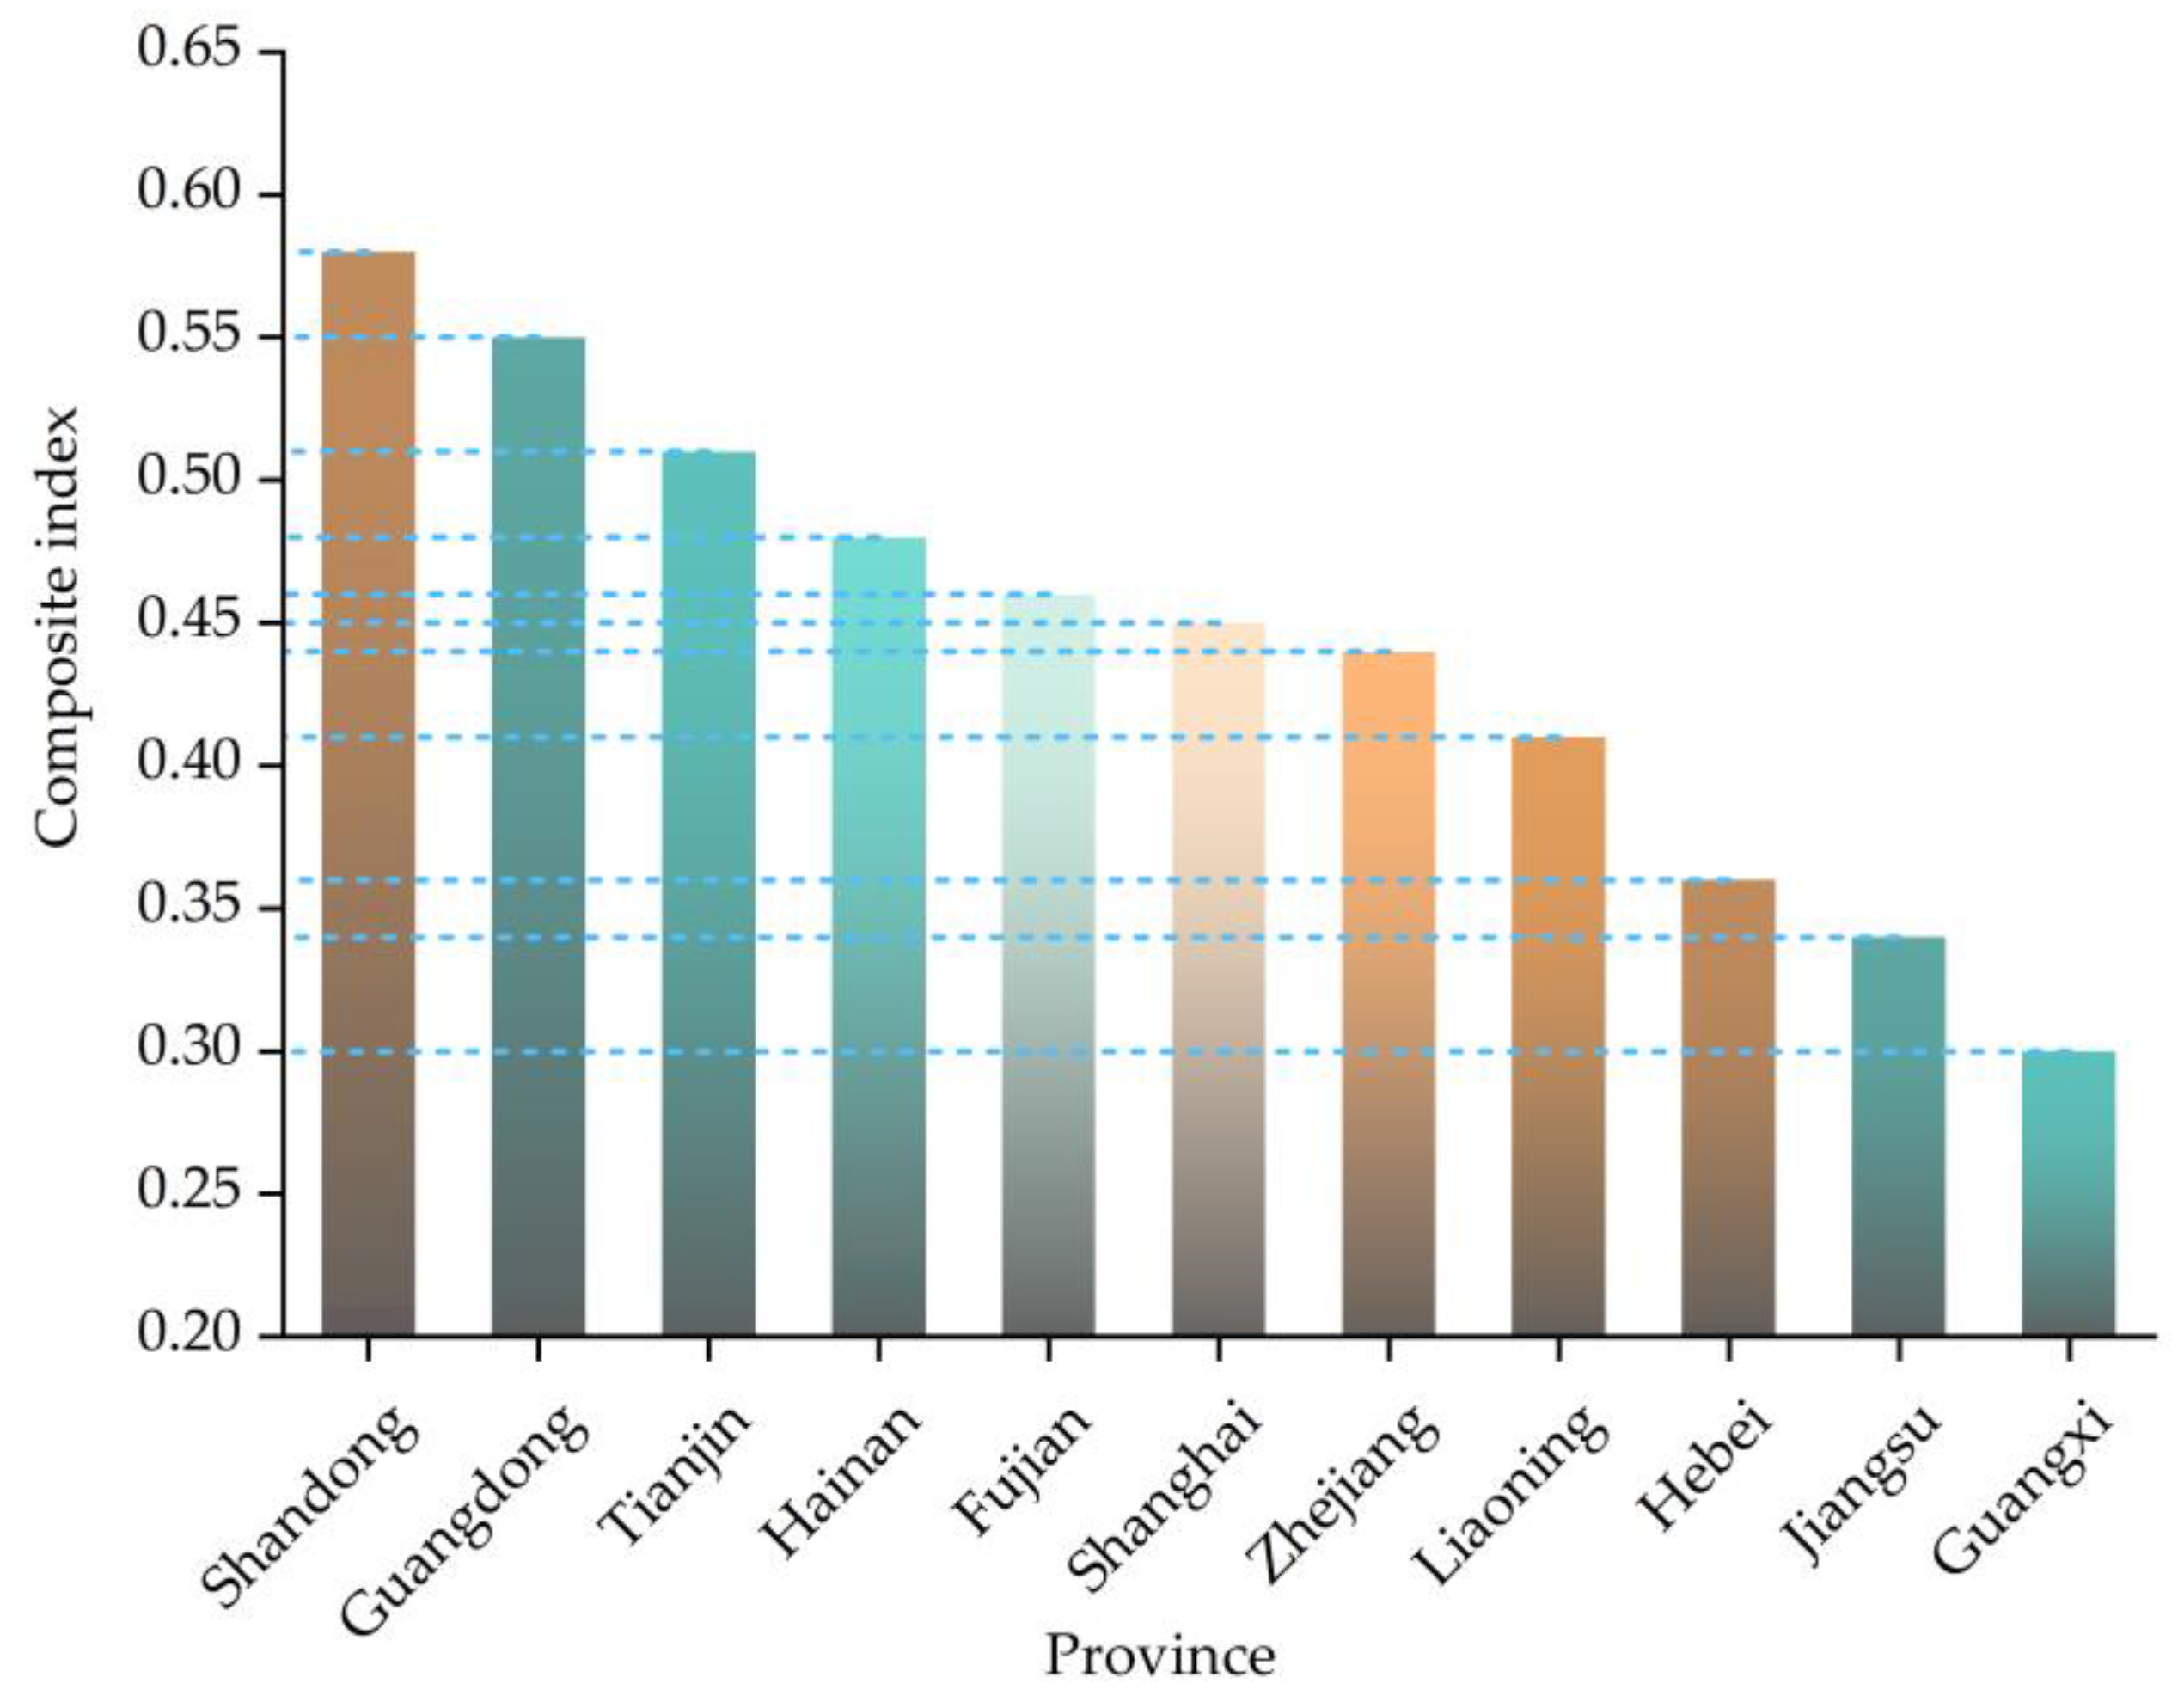
(3) Provincial level. As shown in Figure 3, the levels of high-quality development in the marine economy vary among the 11 coastal provinces (municipalities, regions) in China, presenting a distinct pattern of differentiation. In 2020, Shandong Province was ranked first with a comprehensive index for high-quality development in the marine economy of 0.577, surpassing Guangxi Zhuang Autonomous Region, which ranked last, by 0.273. Meanwhile, the provinces in the middle, namely, Fujian, Shanghai, and Zhejiang, had relatively close indices of 0.461, 0.447, and 0.441, indicating a similar level of high-quality development in their marine economies.
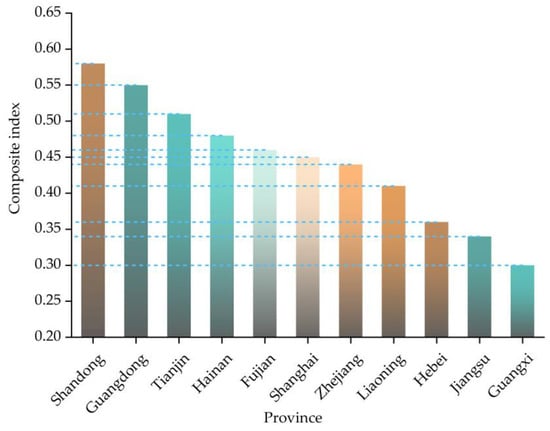
Figure 3.
Ranking of Comprehensive Index for High Quality Marine Development in Various Provinces in 2020.
Furthermore, using M ± 0.5SD as the critical point, China’s 11 coastal provinces are classified into three types (where M is the mean, and SD is the standard deviation): provinces with a comprehensive index greater than 0.483 are classified as star-type; those with an index less than 0.401 are classified as mediocre-type; and provinces with an index between these two values are classified as backward-type. As calculated, the types of provinces for the year 2020 in China’s high-quality development of the marine economy are shown in Table 3, revealing a spatial feature of regional imbalance. Among them, there are no mediocre-type provinces in the northern marine economic circle, no star-type provinces in the eastern marine economic circle, and the southern marine economic circle is the only one with provinces of all three types.
Table 3.
Distribution of high-quality development types of Marine economy in China’s coastal provinces in 2020.
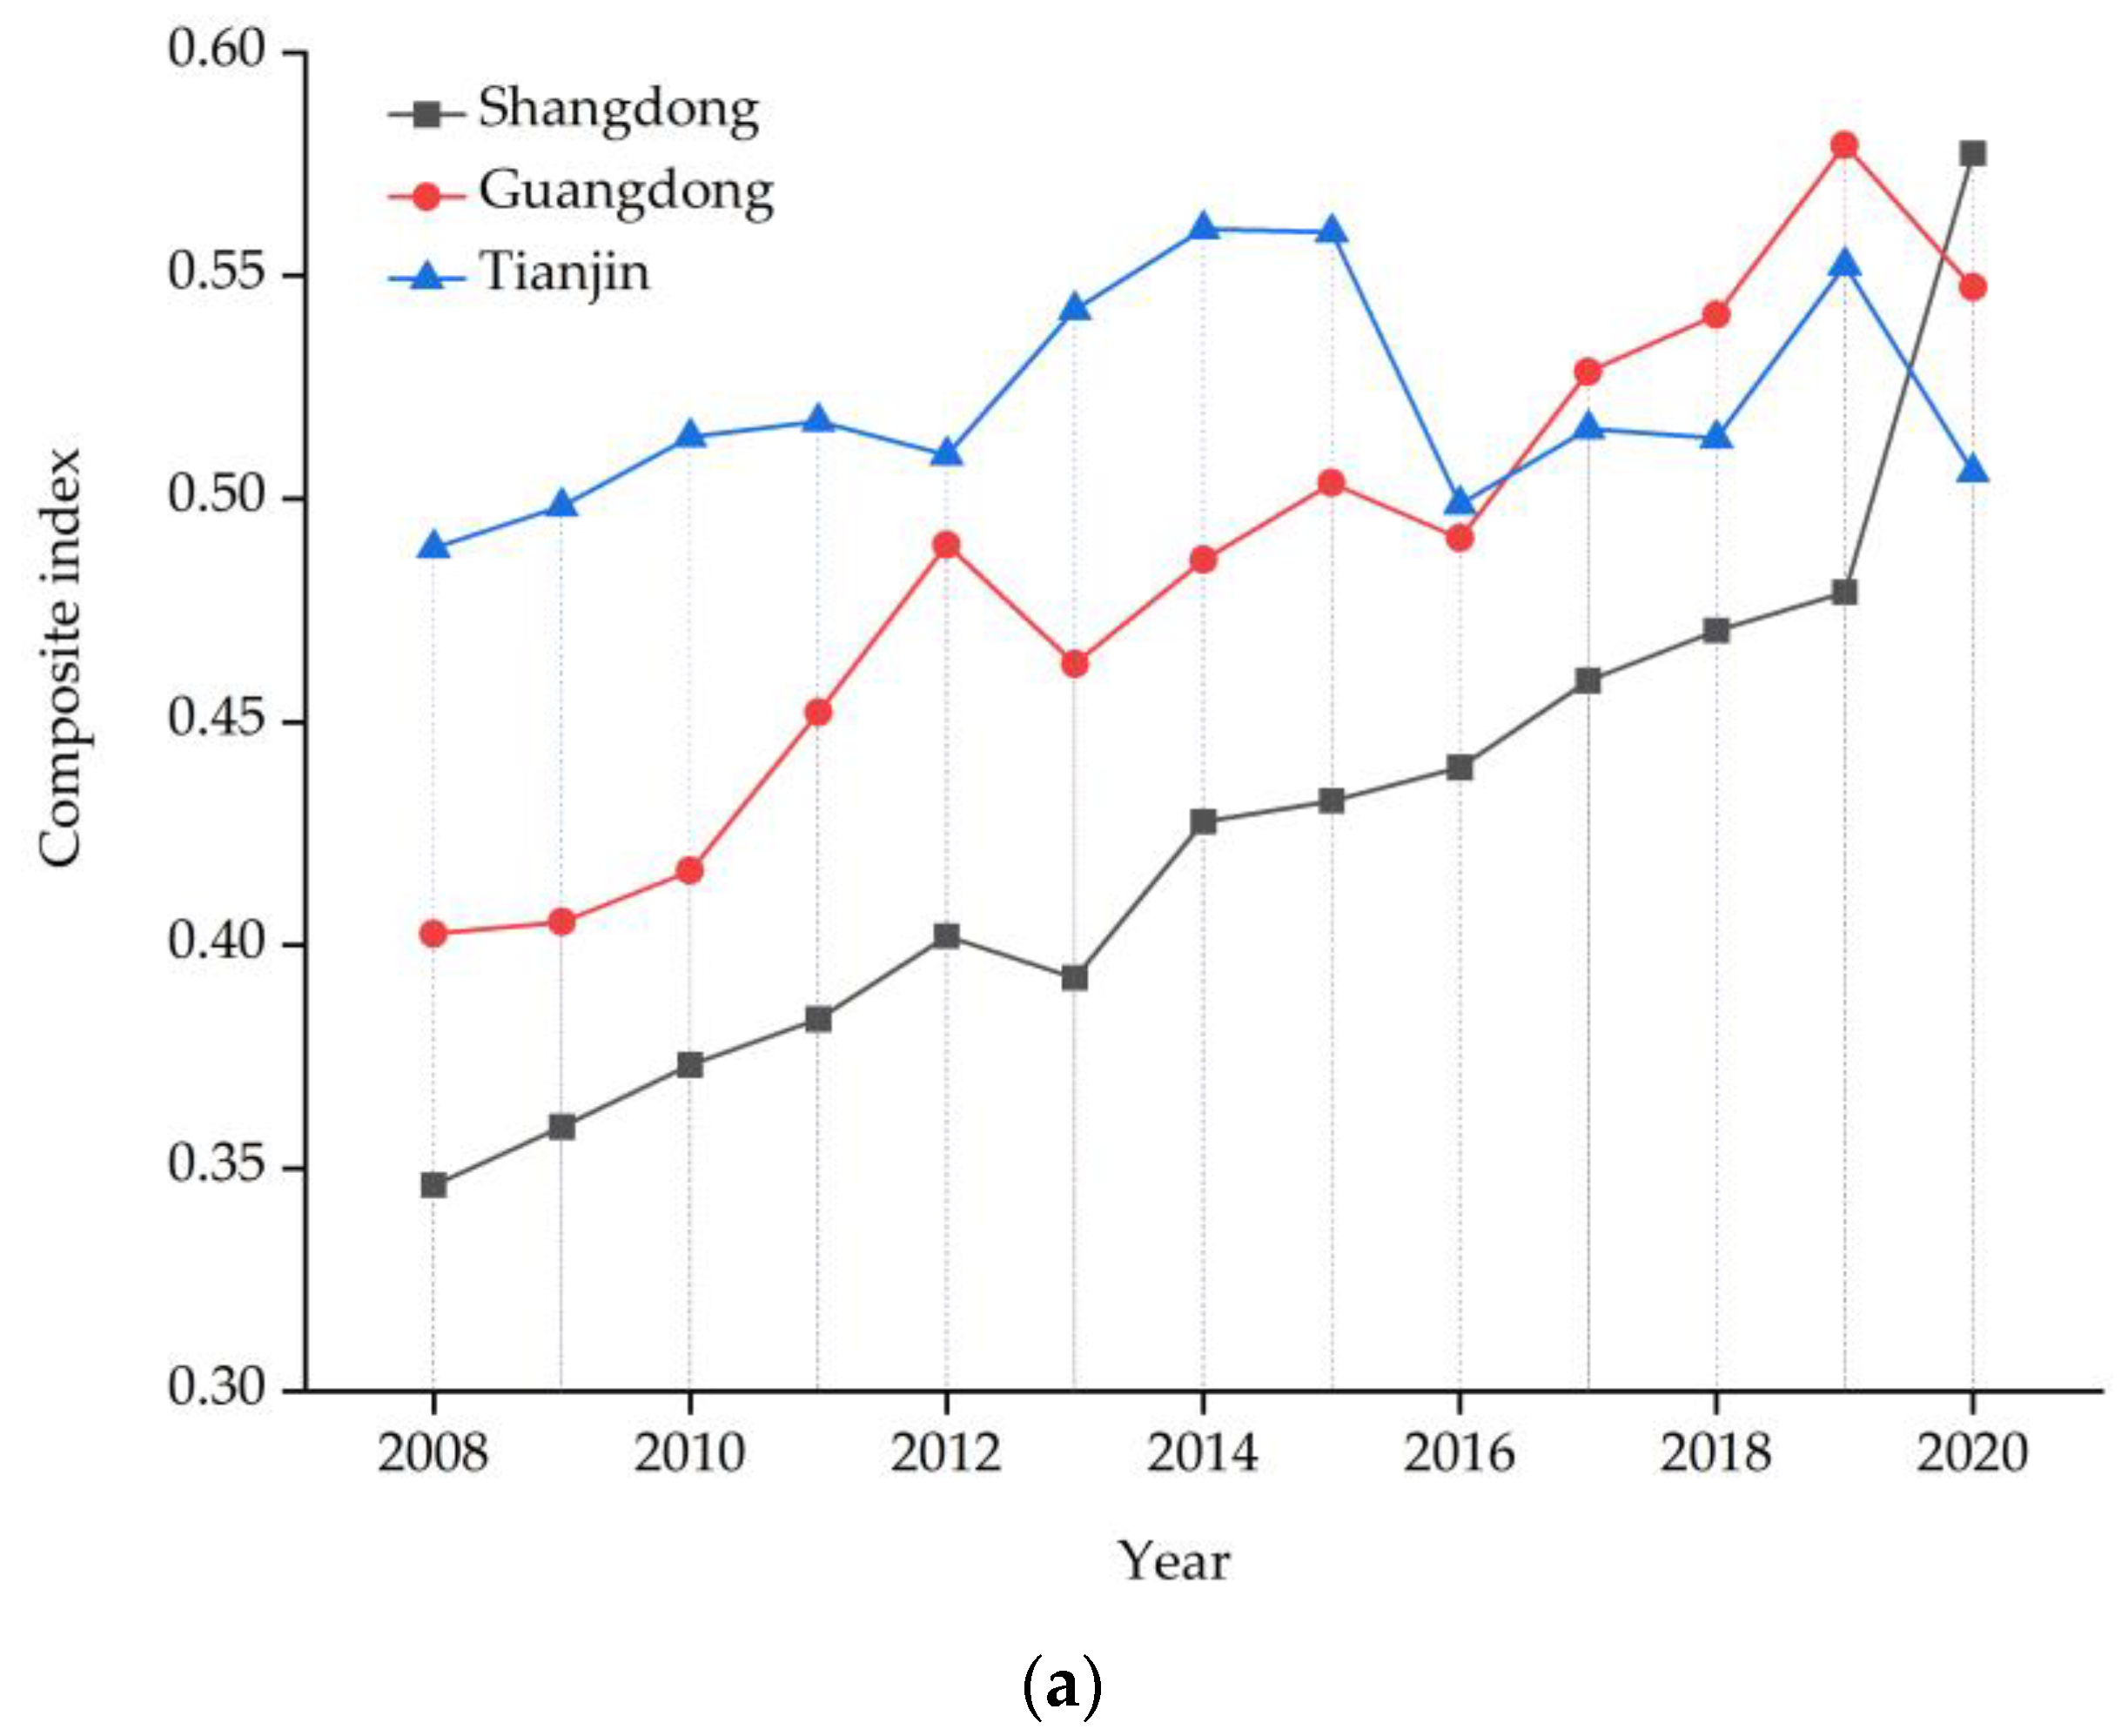
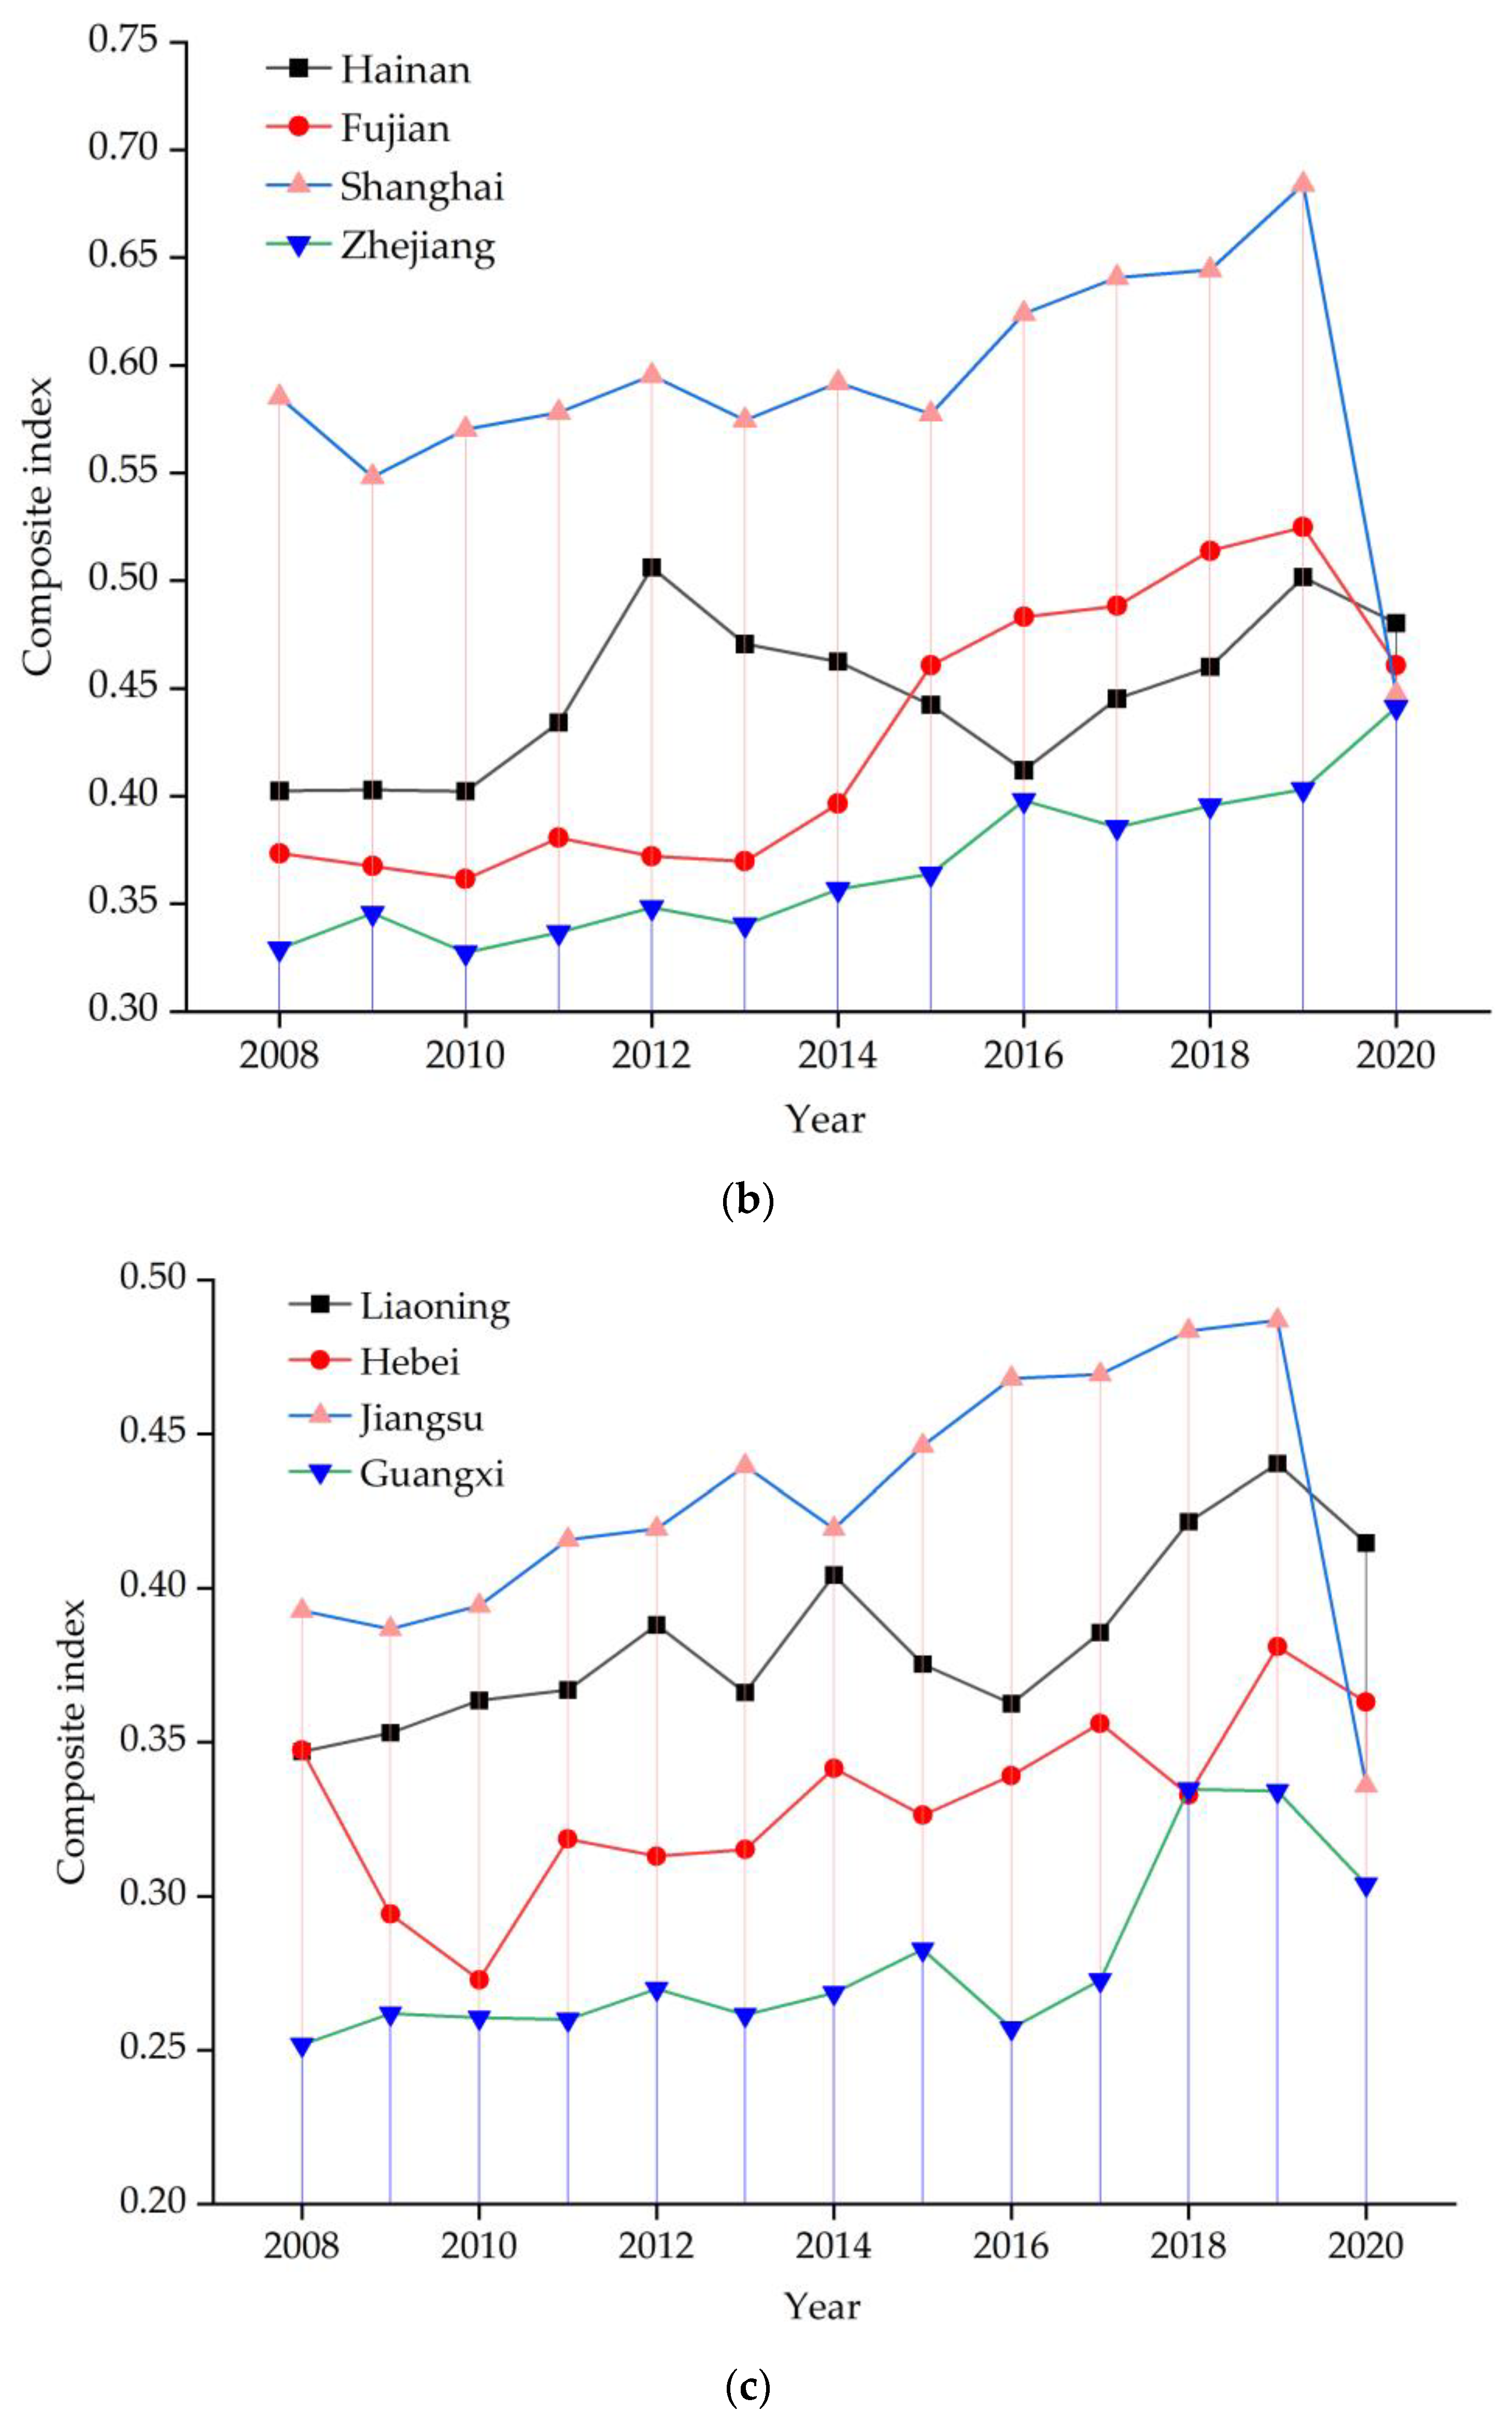
Figure 4a–c depicts the trend in high-quality development levels in the marine economy for different types of provinces from 2008 to 2020. In terms of star-type provinces, Shandong Province, which ranked first in the comprehensive index in 2020, had a marine economy’s high-quality development level consistently lower than Tianjin and Guangdong before 2019. Among the mediocre-type provinces, the trajectories and levels of high-quality development in the marine economy in Fujian, Hainan, and Zhejiang are relatively similar, whereas Shanghai’s overall level is significantly higher than the other three provinces. Regarding backward-type provinces, the differences among the four provinces are relatively equal, and their comprehensive indices for high-quality development in the marine economy have all exceeded 0.5 over the twelve years. Among them, Jiangsu has relatively better development in the marine economy and is most likely to soon exit the backward category.
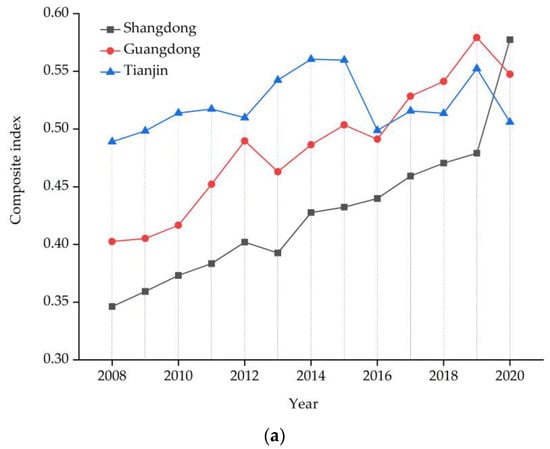
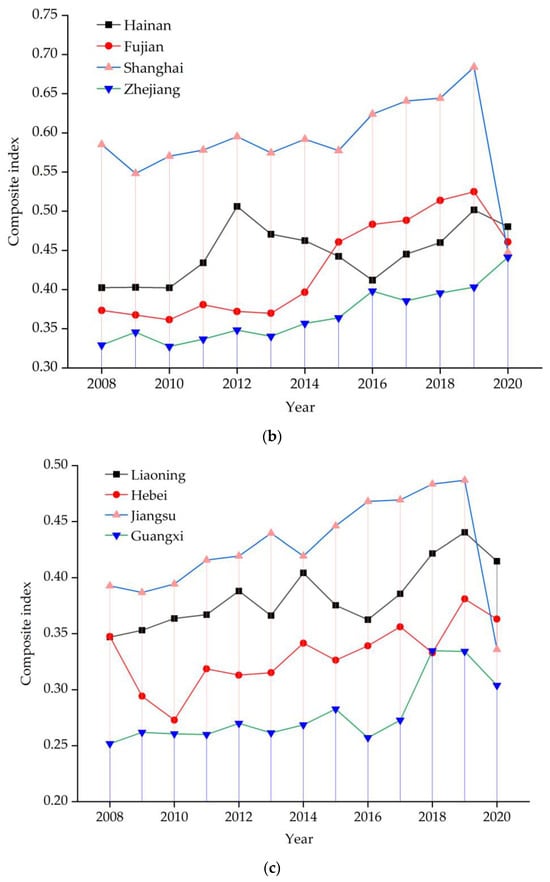
Figure 4.
Trend in the comprehensive index of high-quality development of Marine economy in different types of provinces: (a) Star provinces; (b) Mediocre provinces; (c) Backward provinces.
4.2.2. Analysis of Subsystem Indices
Building upon the analysis of the comprehensive index of high-quality development in the maritime economy in different periods in the previous section, this section further investigates the characteristics of five subsystem indices: innovation-driven efficiency, stable coordination, green ecology, open inclusivity, and shared achievements. The analysis is conducted at three levels: national, regional, and provincial.
- (1)
- National Level
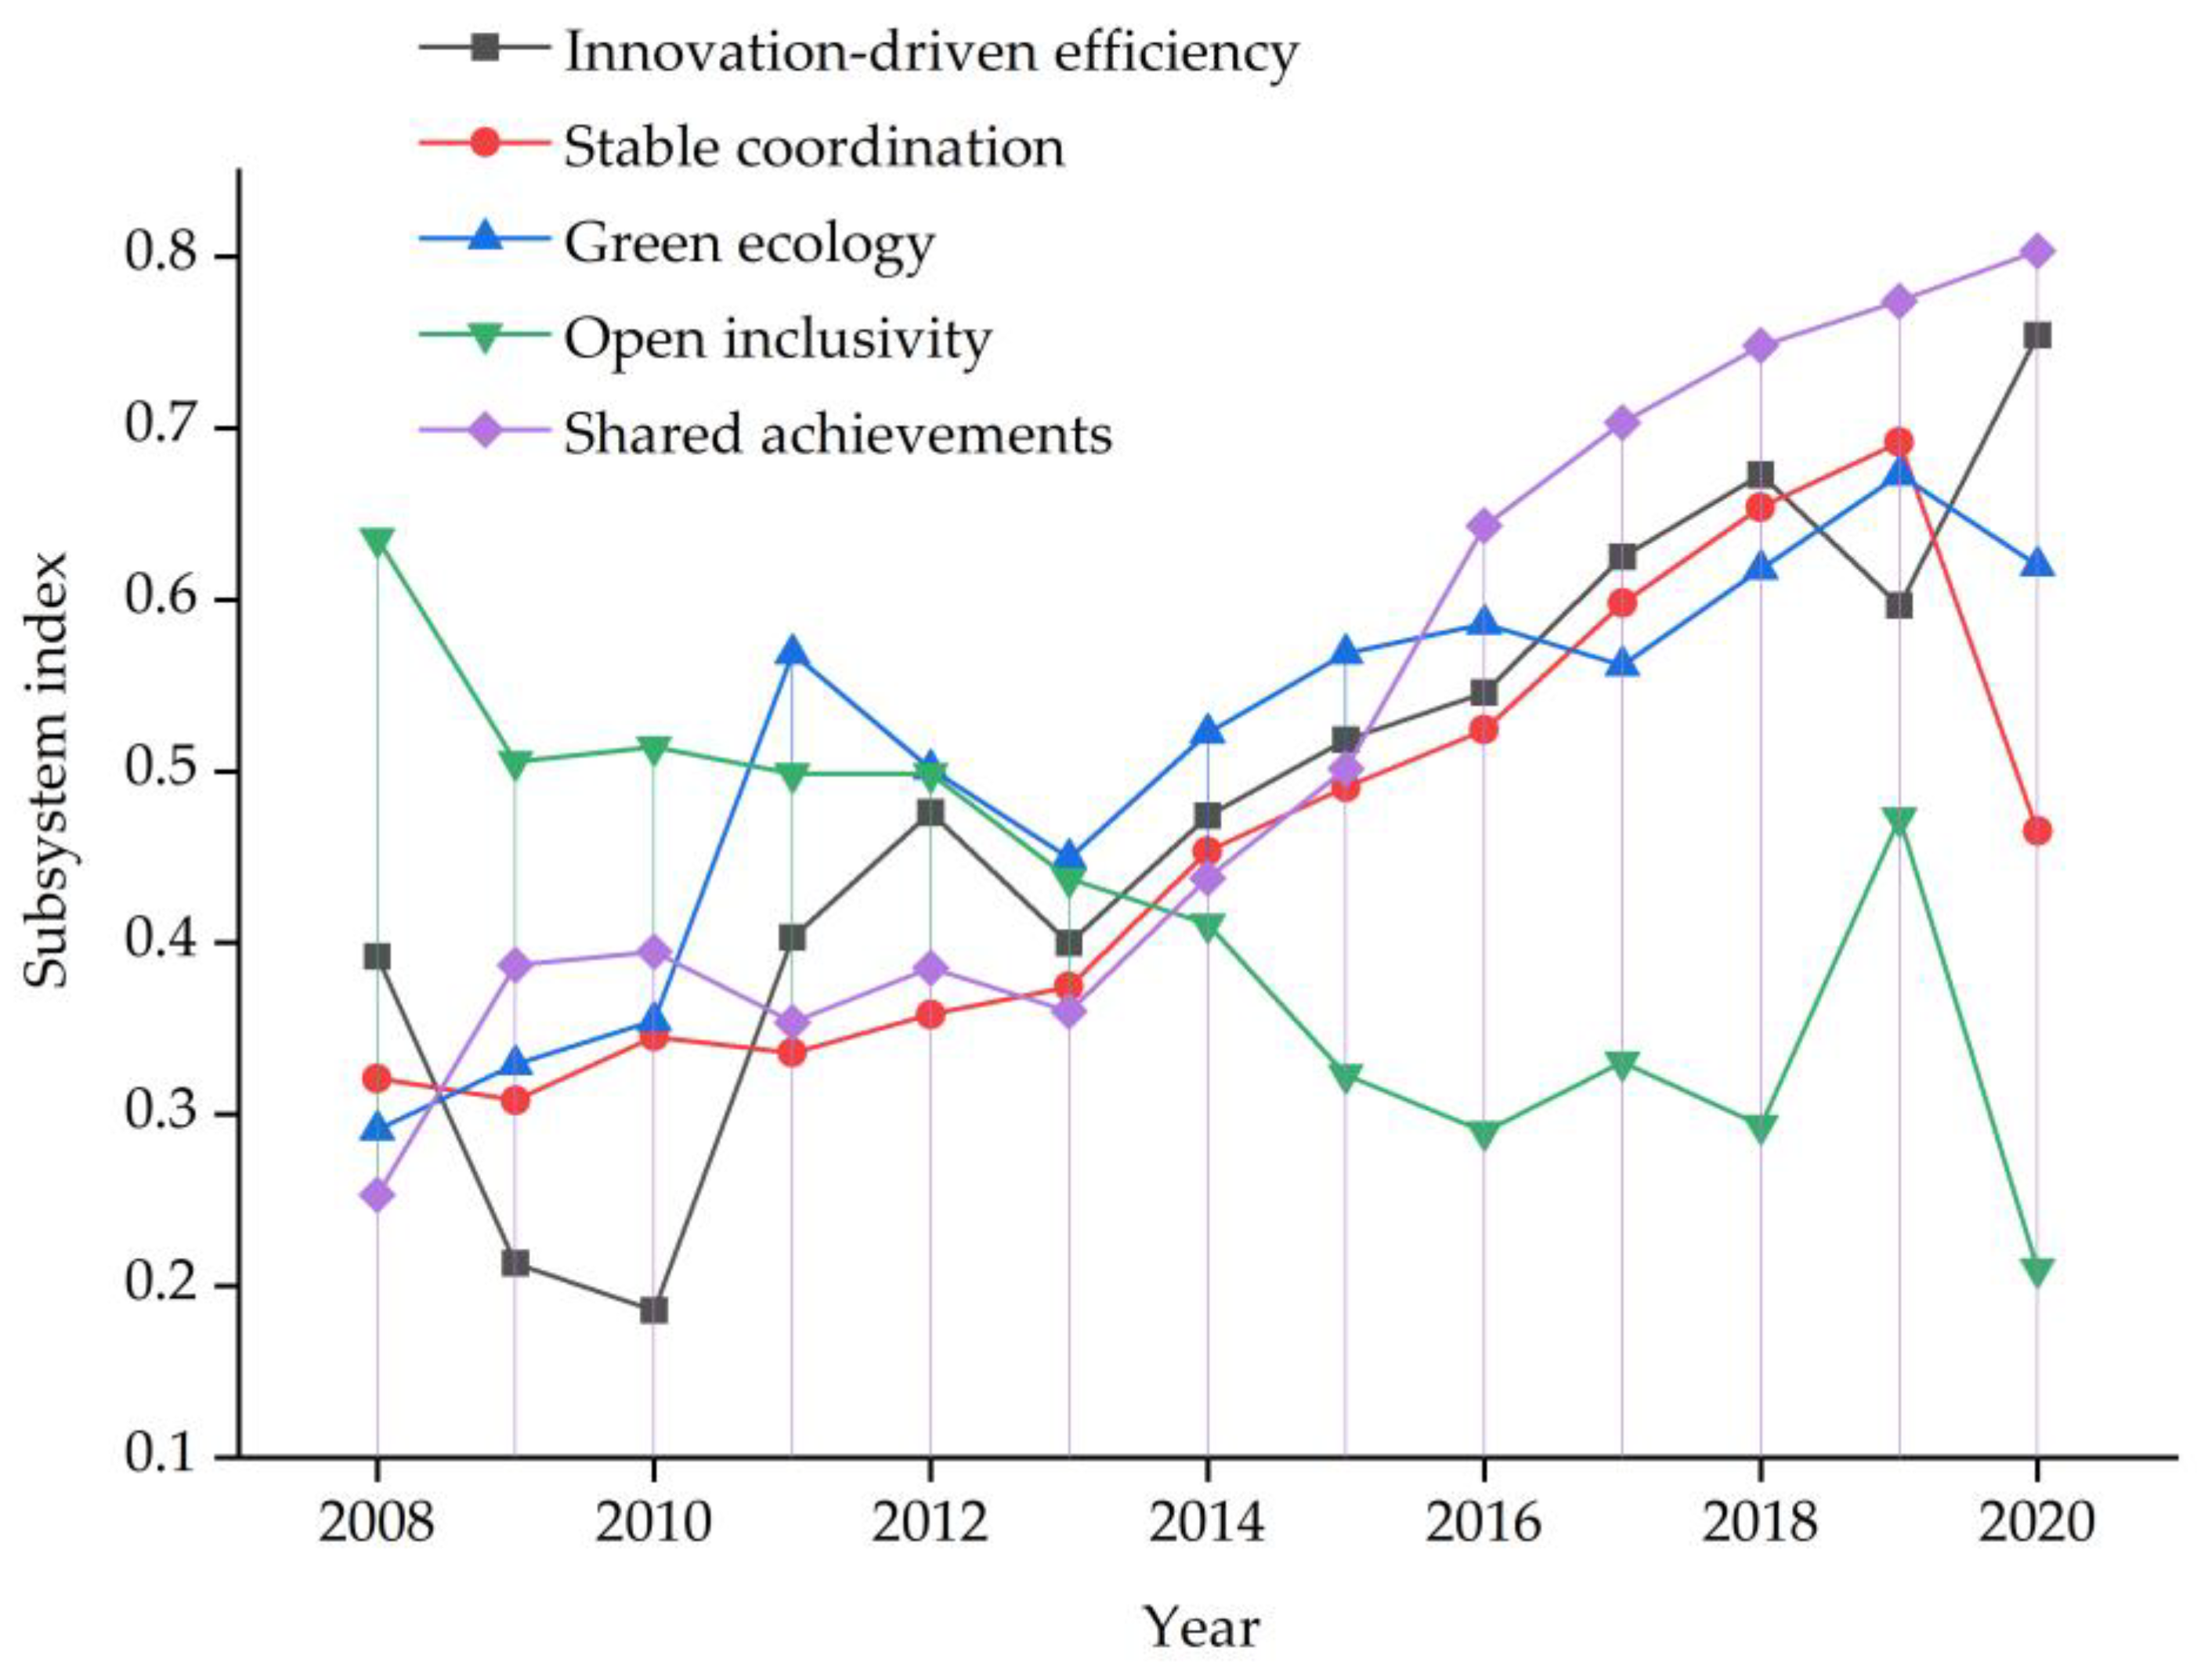
As shown in Figure 5, during the period from 2008 to 2020, except for the openness and inclusivity index, the other four subsystem indices have all experienced varying degrees of improvement, reflecting the implementation of the new development concepts in the process of China’s maritime economic development.
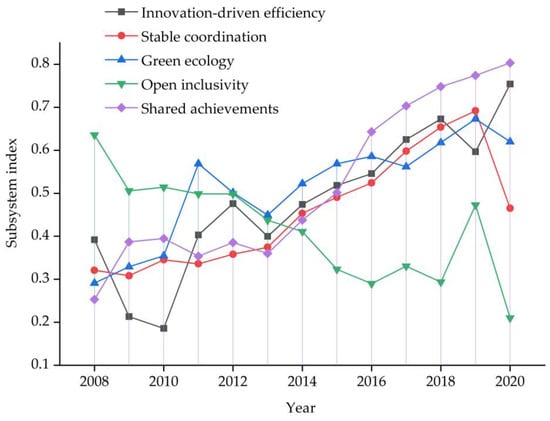
Figure 5.
Trend in the subsystem index of high-quality development of the national marine economy from 2008 to 2020.
In the dimension of innovation-driven efficiency, influenced by the continued impact of the “National Plan for Promoting Sea-based Scientific and Technological Development (2008–2015)” in 2008, the overall maritime economy innovation-driven efficiency index has increased. The slogan of mass entrepreneurship and innovation in 2013 further consolidated the upward trend in the innovation and efficiency enhancement index.
In the dimension of stable coordination, the subsystem index has steadily increased and reached 0.69 in 2019, doubling its value compared to 2008. This is closely related to the continuous optimization of China’s maritime economic industry structure and spatial layout over the past decade.
In the dimension of green ecology, the overall trend in the subsystem index is significantly upward, with peaks in 2011 and 2019, coinciding with the time of the national environmental protection special action.
In the dimension of open inclusivity, the subsystem index shows an overall declining trend, with a brief increase in 2019 followed by a severe impact due to the pandemic.
In the dimension of shared achievements, it is the subsystem index with the largest increase, with an average annual growth rate of 18.67%. It is a microcosm of China’s comprehensive construction of a well-off society in the maritime field.
- (2)
- Regional Level
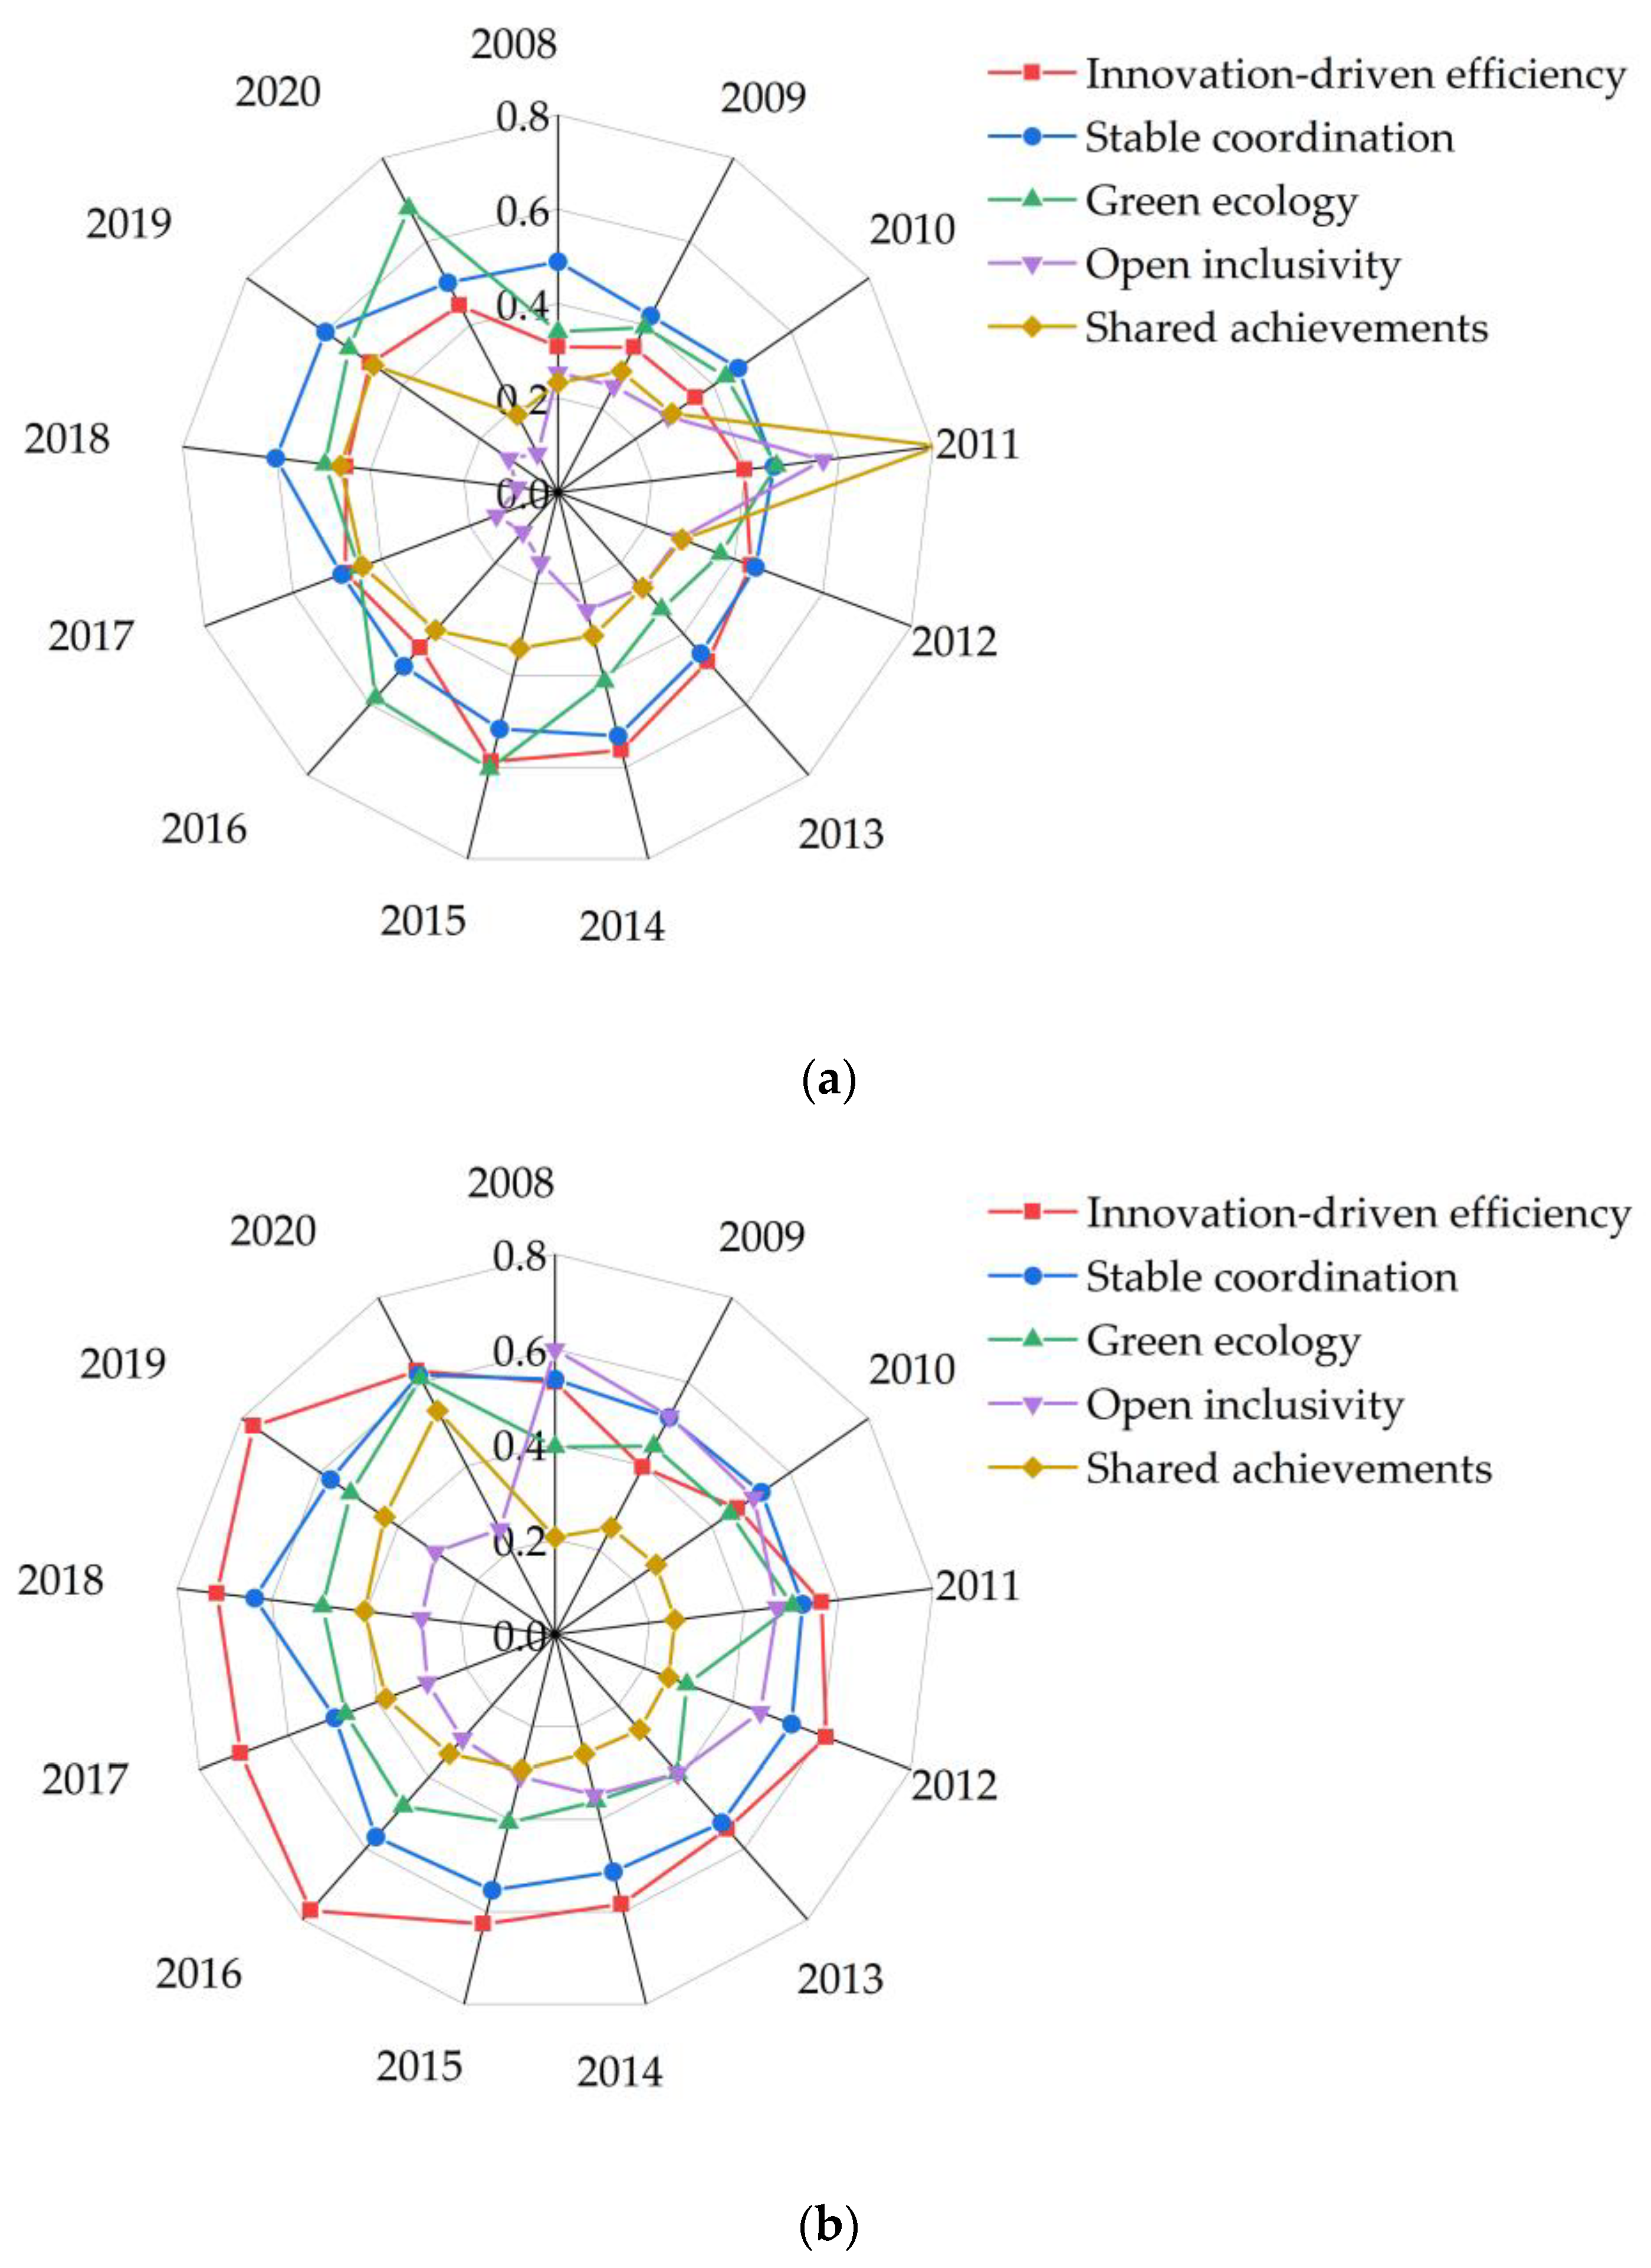
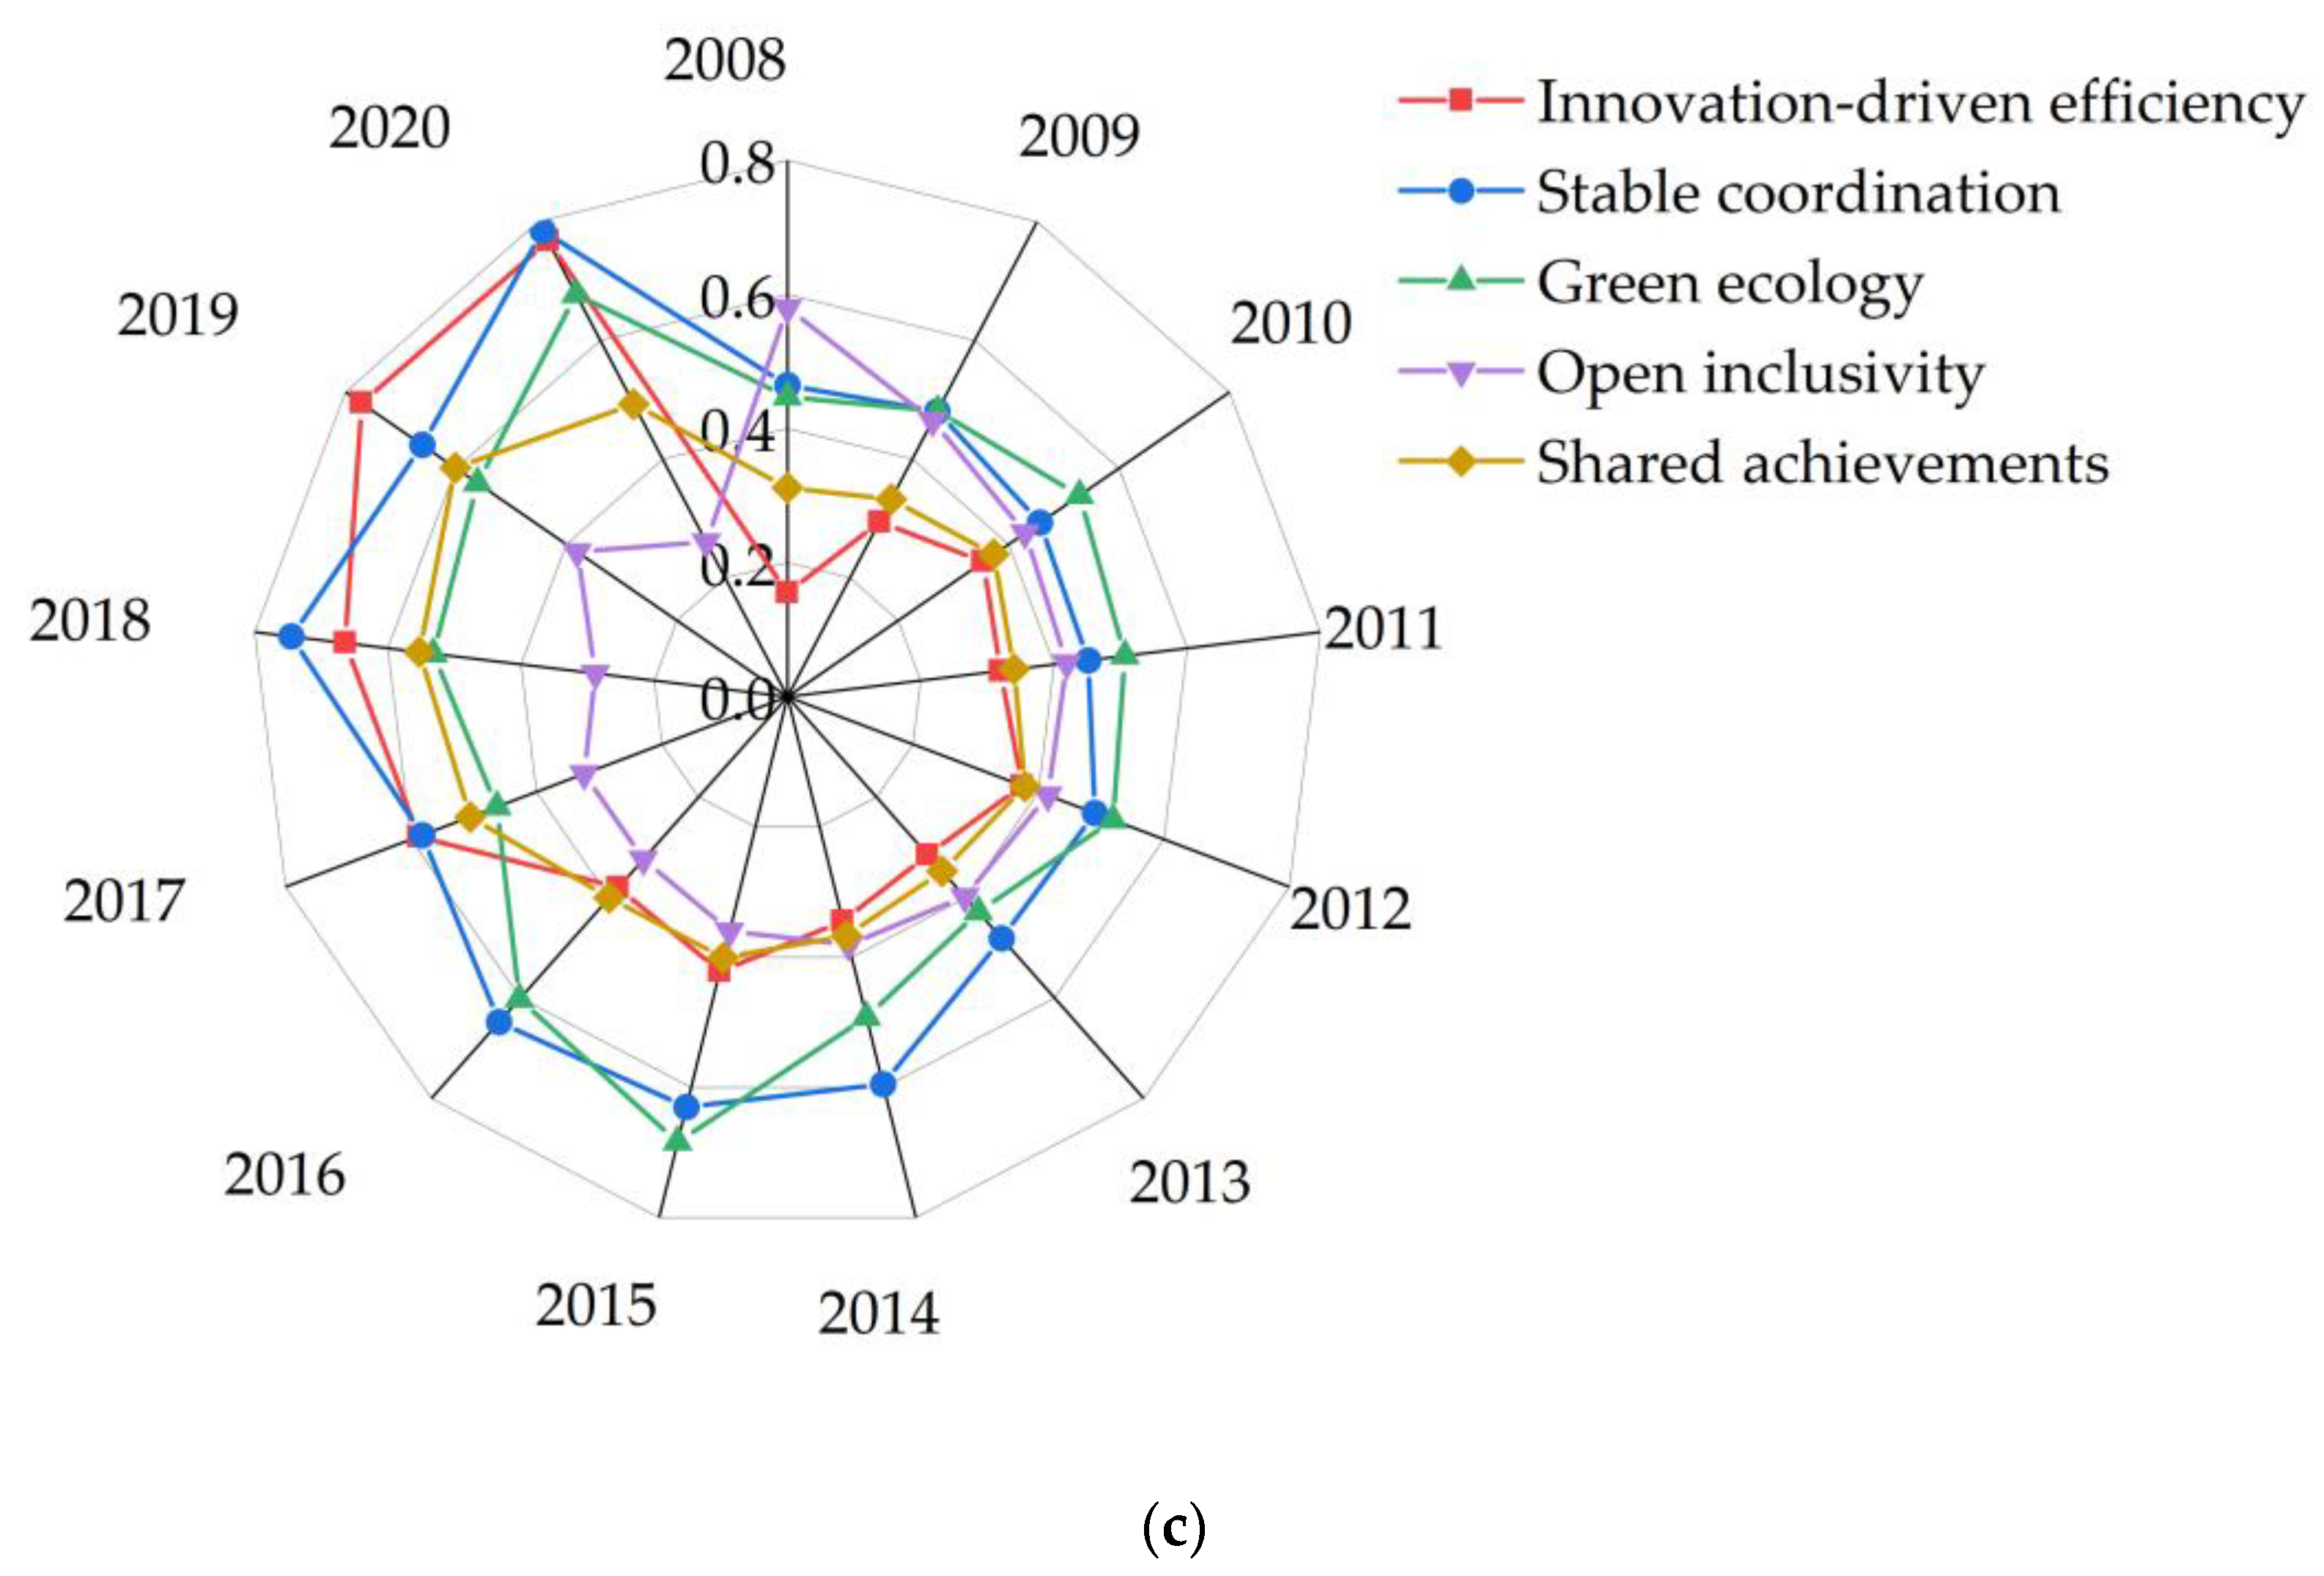
In Figure 6a–c, presented in the form of radar charts, the evolutionary characteristics of subsystem indices in the three major maritime economic zones are intuitively displayed, revealing both similarities and differences.
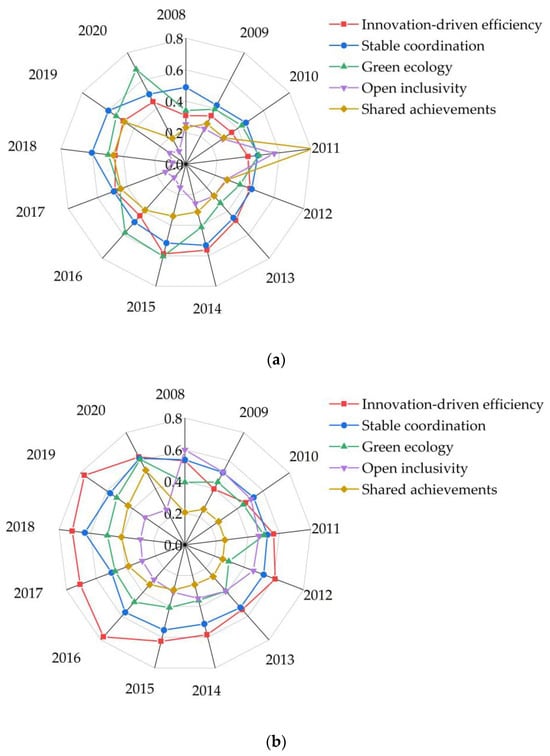
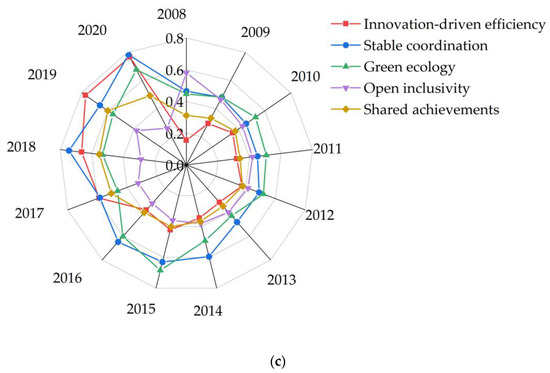
Figure 6.
Subsystem index of three major marine economic circle subsystems from 2008 to 2020: (a) Northern marine economic circle; (b) Eastern marine economic circle; (c) Southern marine economic circle.
In the Northern Maritime Economic Zone, the subsystem indices exhibit significant overlapping interactions during their evolution. The green ecology index shows a clear upward trend over time, nearly doubling in twelve years. The innovation-driven efficiency index stagnated after 2016. The open inclusivity index and shared achievements index, in comparison to the other two maritime economic zones, show a considerable gap and do not exhibit a clear outward expansion trend, indicating a relatively slow development.
In the Eastern Maritime Economic Zone, the distribution of subsystem indices is relatively balanced. The green ecology index and stable coordination index show a clear outward expansion trend, with index increases of 0.23 and 0.14, respectively. In contrast, due to factors such as the global financial crisis, the open inclusivity index in this region experienced a decline of more than half, displaying an inward trend.
In the Southern Maritime Economic Zone, the overall development of subsystem indices exhibits a more pronounced outward expansion. The improvement in innovation-driven efficiency index is particularly significant, almost quintupling over twelve years, ranking first in the development speed of subsystem indices among the three major maritime economic zones. Although the open inclusivity index also shows an inward trend, its overall level is higher than the other two maritime economic zones, which is related to the earlier and more extensive history of openness in the southern region of China.
- (3)
- Provincial Level
Table 4 reports the calculated results of the subsystem indices for high-quality development in the year 2020 for the 11 coastal provinces in China, revealing significant provincial differences in different subsystem indices.
Table 4.
Ranking of subsystem index of high-quality Marine economy development in China’s coastal provinces in 2020.
In the dimension of innovation-driven efficiency, Shanghai, ranking first in the corresponding subsystem index in 2020, is 0.3 higher than Liaoning, which is at the bottom. This aligns with the differences between these two provinces in research and innovation, as well as production efficiency.
In the dimension of stable coordination, only Shanghai, Tianjin, Fujian, and Hainan have their respective subsystem indices above the dimension mean.
In the dimension of green ecology, Fujian, ranking first in this subsystem index in 2020, reaches 0.76, whereas Guangxi and Hebei are the last two in this ranking.
In the dimension of open inclusivity, Shanghai and Guangdong have openness and inclusivity indices of 0.51 and 0.49, respectively, leading significantly ahead of Zhejiang, which is in the third position. The gap between provinces is notable.
In the dimension of shared achievements, Shandong tops the provincial ranking with a value of 0.63 in this subsystem index, closely followed by Guangdong. These rankings are attributed to the strong economic foundation and advanced development concepts in these two provinces.
5. Differential Evolution
5.1. Regional Disparities and Sources of High-Quality Development in China’s Maritime Economy
Table 5 presents the Gini coefficients for the high-quality development of China’s maritime economy from 2008 to 2020.
Table 5.
Regional Gini coefficient and its decomposition.
5.1.1. Overall Regional Disparities
From 2008 to 2020, the overall Gini coefficient for the high-quality development of China’s maritime economy exhibited a trend of “first rising and then falling”, indicating that regional disparities initially expanded before contracting. However, on the whole, the disparities have narrowed. Within the study period, the Gini coefficient reached its peak value of 0.125 in 2013. The corresponding values for 2008 and 2020 were 0.112 and 0.104, respectively, showing an overall decrease of 7.14% over the twelve years. Further analysis divides this process into three phases: 2008–2013, 2014–2017, and 2018–2020. In the first phase, the coefficient shows an ascending trend, whereas, in the latter two phases, it demonstrates a declining pattern. Notably, the coefficient decreases more significantly and rapidly in the last phase.
5.1.2. Intra-Regional Disparities
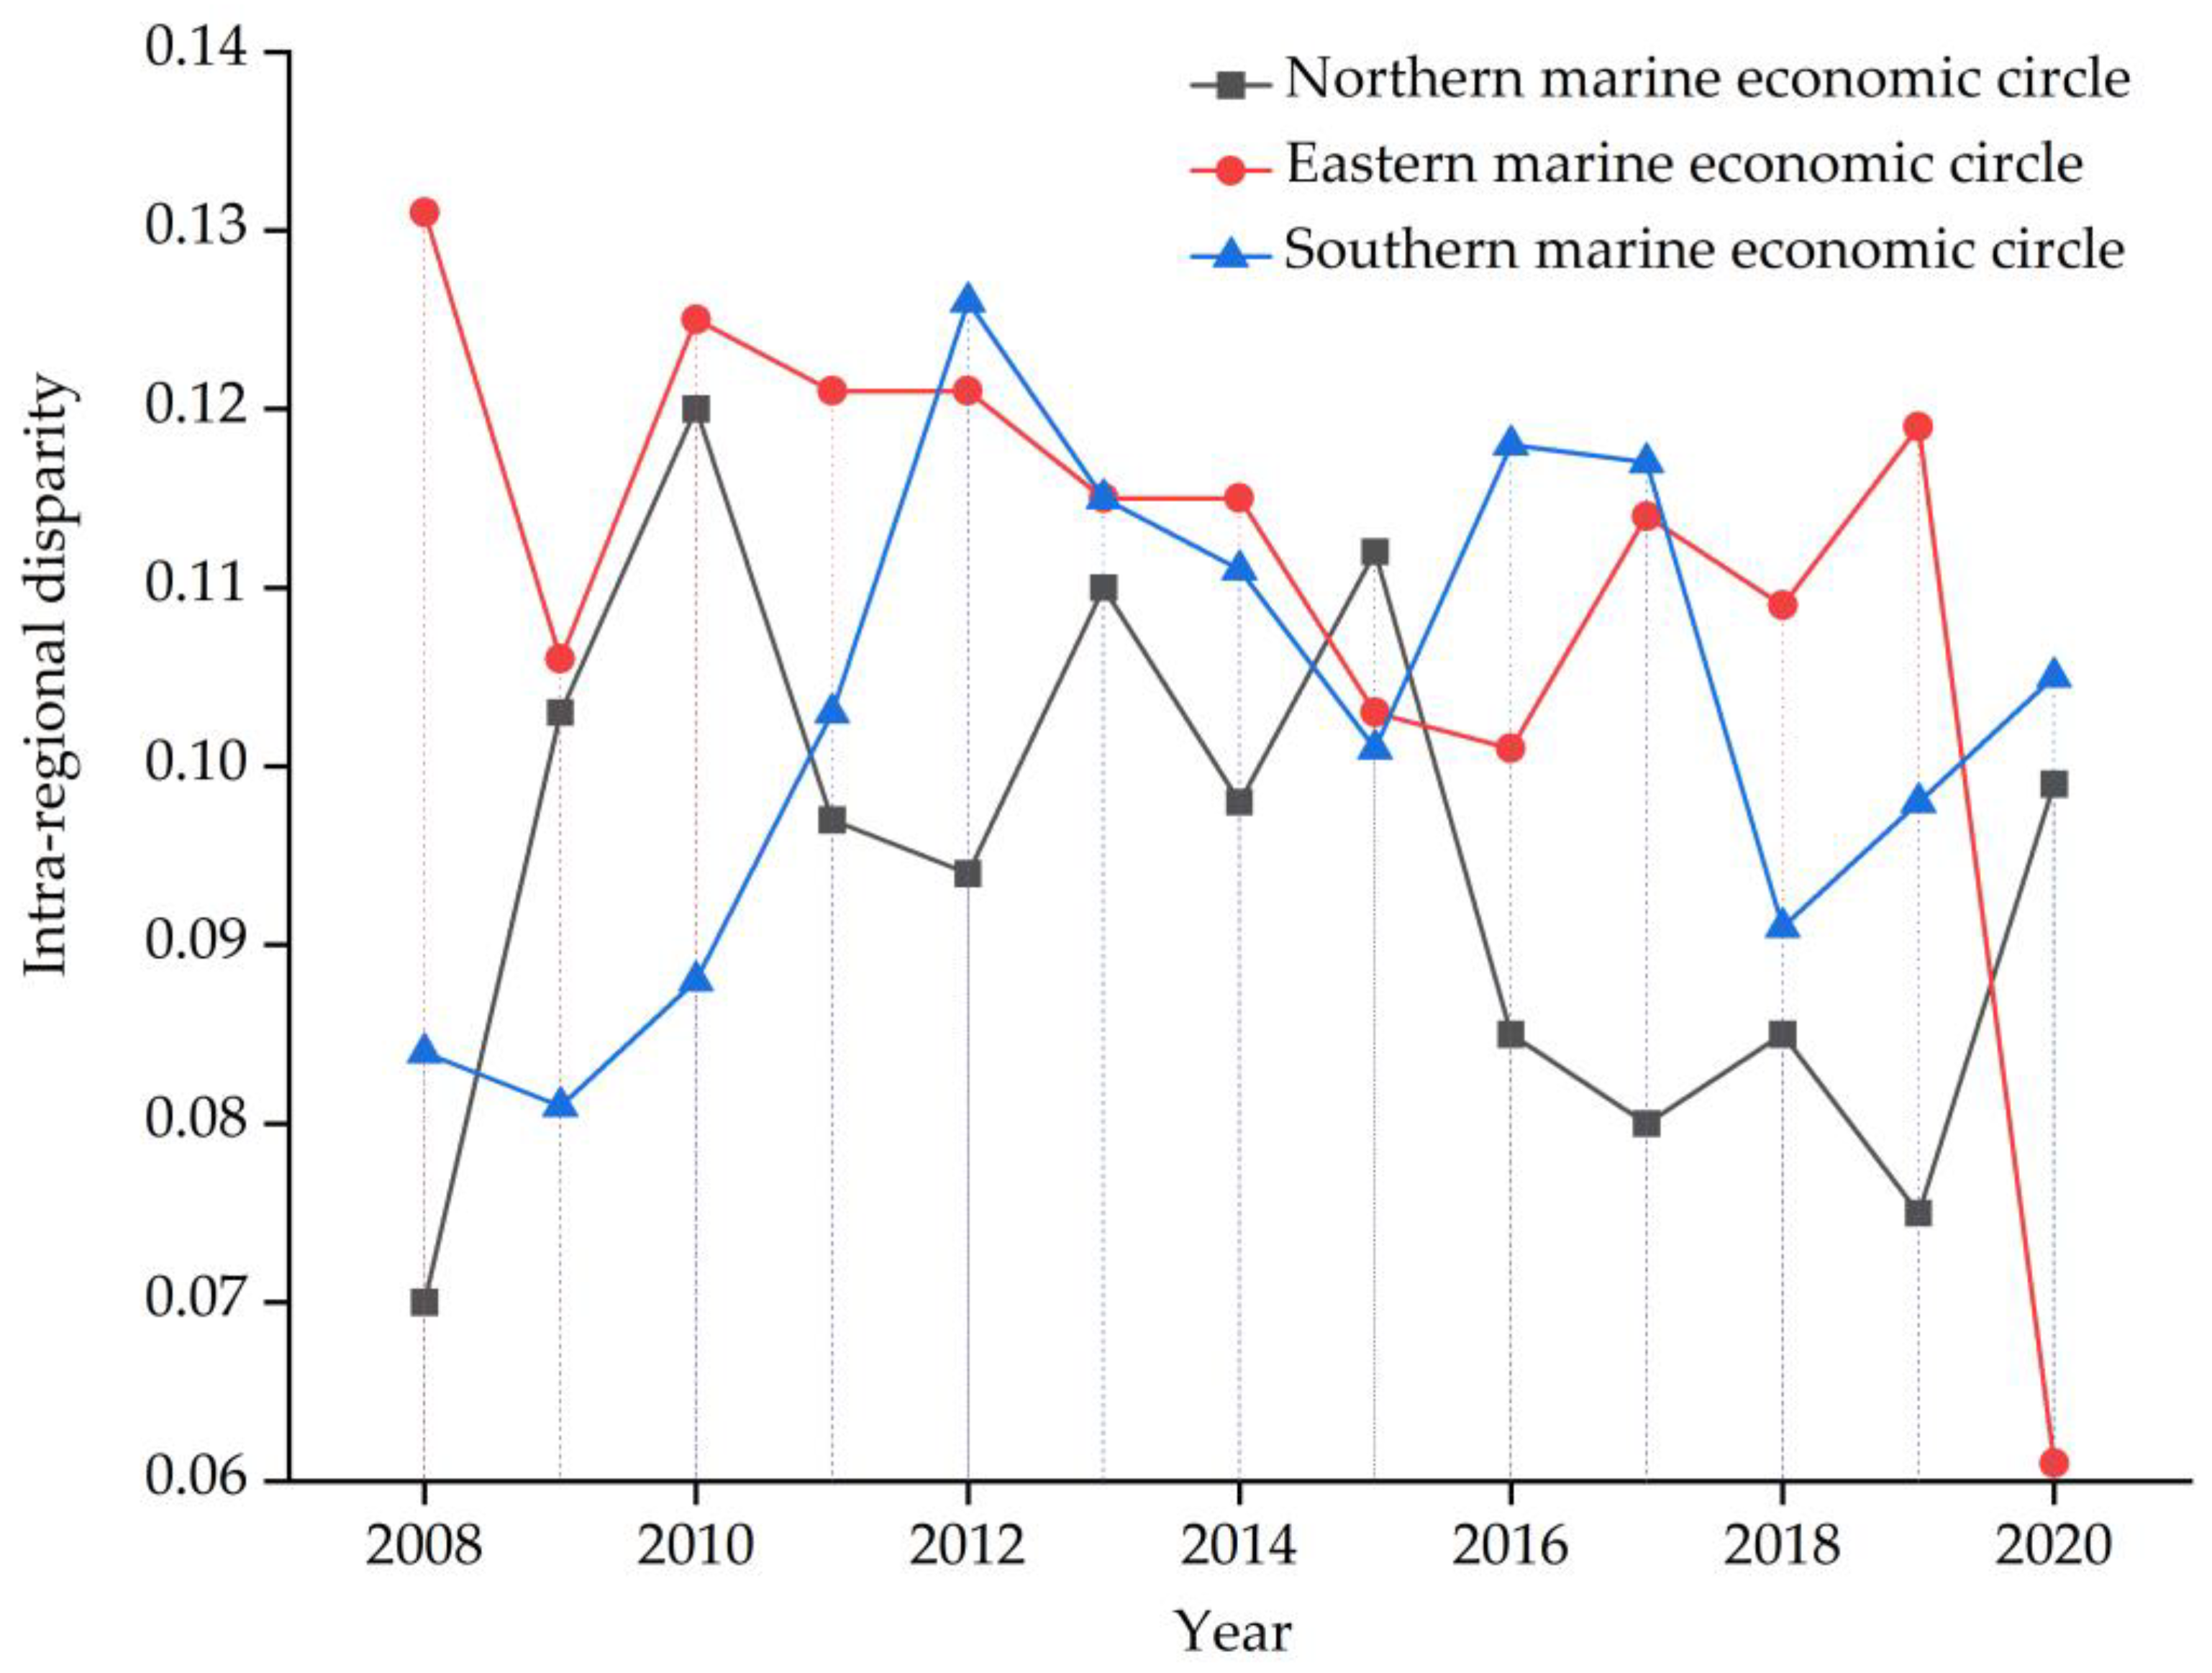
Figure 7 illustrates the intra-regional disparities and their evolving trends in the Northern, Eastern, and Southern maritime economic zones. Overall, the intra-regional disparities in the high-quality development of the maritime economy in these three zones are ranked in descending order as follows: Eastern Maritime Economic Zone, Southern Maritime Economic Zone, and Northern Maritime Economic Zone.
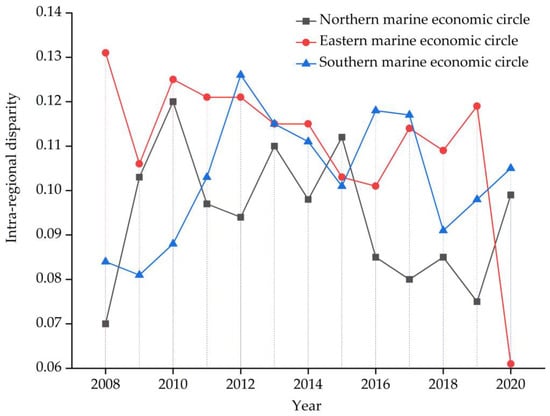
Figure 7.
Disparities within regions in the high-quality development of China’s Marine economy.
Except for the Eastern Maritime Economic Zone, both the Southern and Northern Maritime Economic Zones show an expanding trend in intra-regional disparities, with the trend being more pronounced in the Southern Maritime Economic Zone. Specifically, during the study period, more than half of the years saw the Eastern Maritime Economic Zone leading in intra-regional disparities, dropping sharply to the last position in 2020.
As for the Northern Maritime Economic Zone, the variation in intra-regional disparities during the study period is more complex. Before 2019, the Gini coefficient within the region showed a “W” shape, indicating a pattern of “two increases and two decreases” with a larger decrease following the initial increase. In the Southern Maritime Economic Zone, the trend in intra-regional disparities is similar to that of the Southern Maritime Economic Zone, with relatively smaller fluctuations.
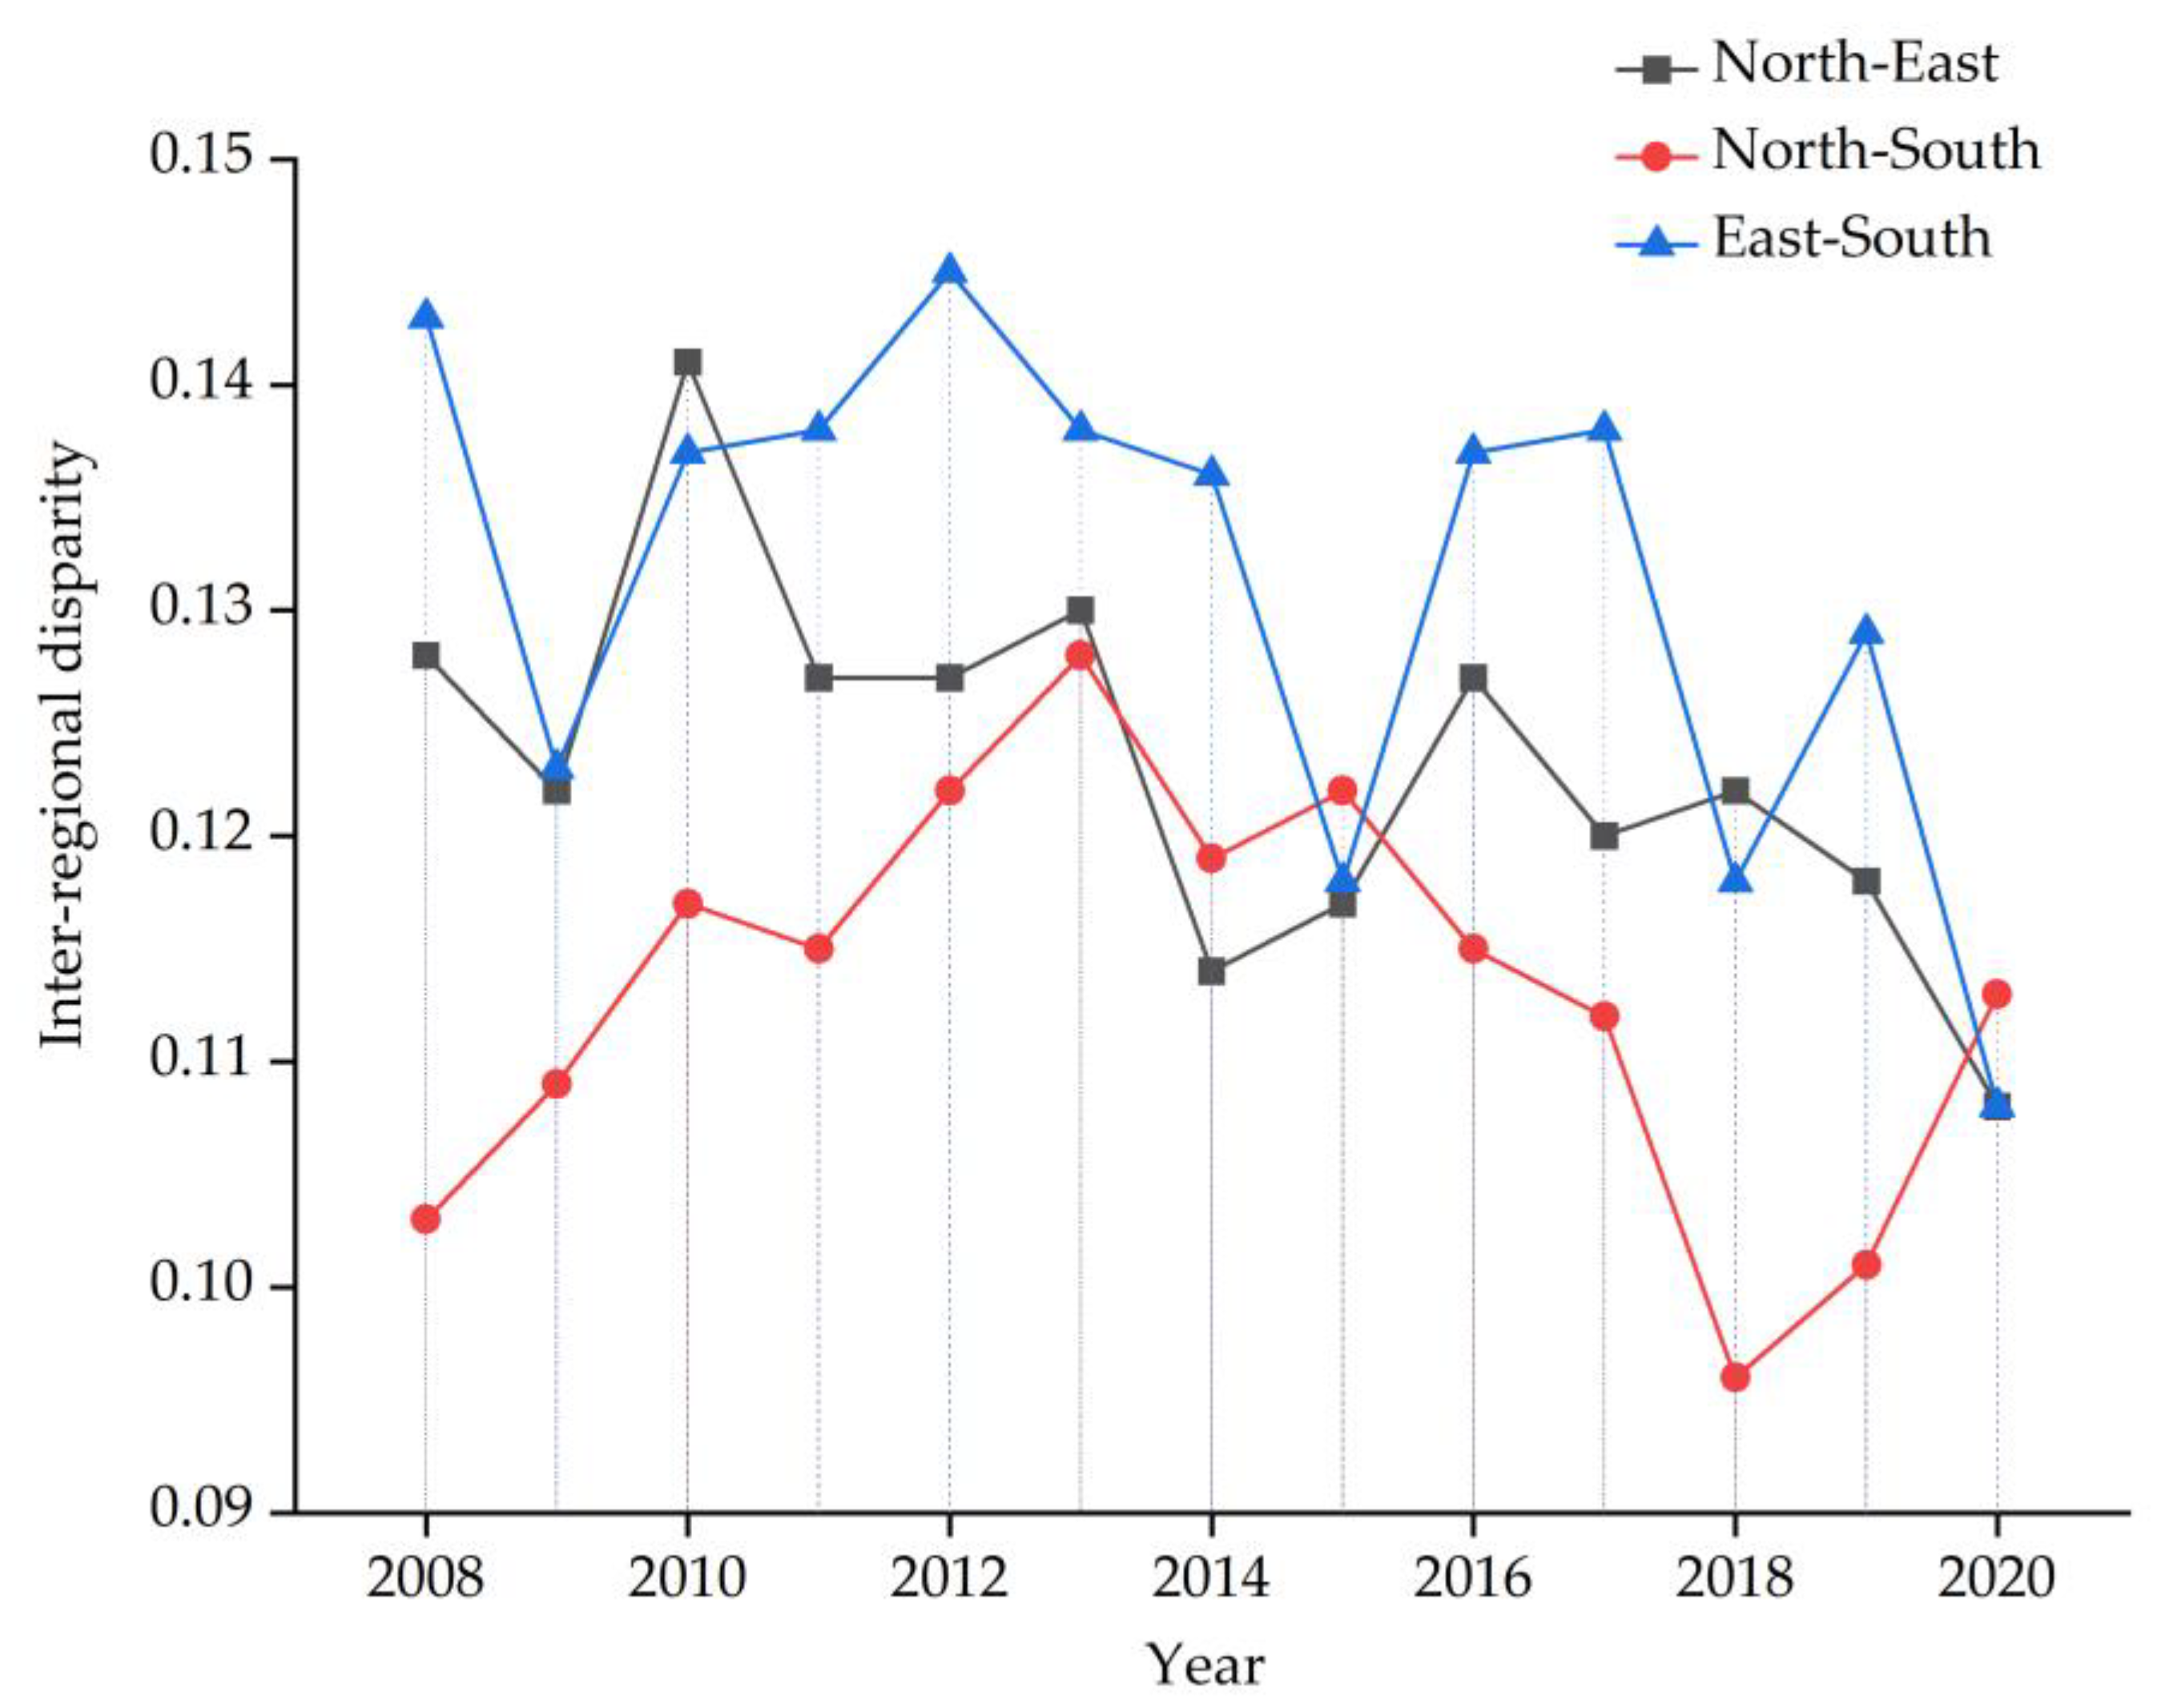
5.1.3. Inter-Regional Disparities
Figure 8 illustrates the inter-regional disparities in the high-quality development of China’s maritime economy, where the Northern Maritime Economic Zone, Eastern Maritime Economic Zone, and Southern Maritime Economic Zone are abbreviated as Northern, Eastern, and Southern for convenience.
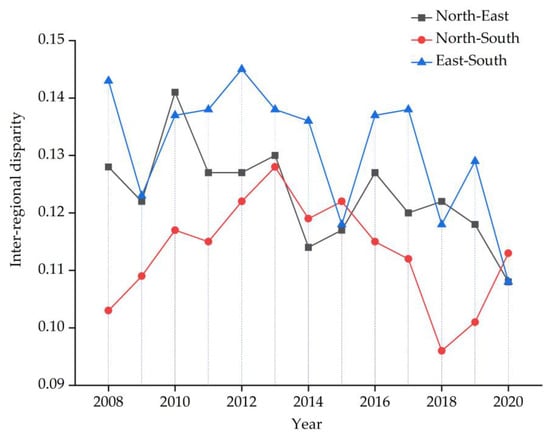
Figure 8.
Disparities between regions in the high-quality development of China’s Marine economy.
Overall, all three sets of curves show a decreasing trend after around 2012. Specifically, the evolution trajectories of disparities between the Northern and Eastern regions and between the Eastern and Southern regions are relatively similar, exhibiting a fluctuating and decreasing trend. The disparities between the Northern and Eastern regions are relatively larger and show a lagged trajectory. In contrast, the Gini coefficient for the high-quality development between the Northern and Southern regions shows an overall pattern of “first rising, then falling, then rising again.” It reached its peak value of 0.128 in 2013 but remained lower than the relative values of disparities between the other two pairs of regions. From 2018 to 2020, the Gini coefficient between the Northern and Southern regions rapidly increased and surpassed the values between the Northern and Eastern regions and between the Eastern and Southern regions in 2020, making it the pair with the largest disparities in high-quality development of the maritime economy that year.
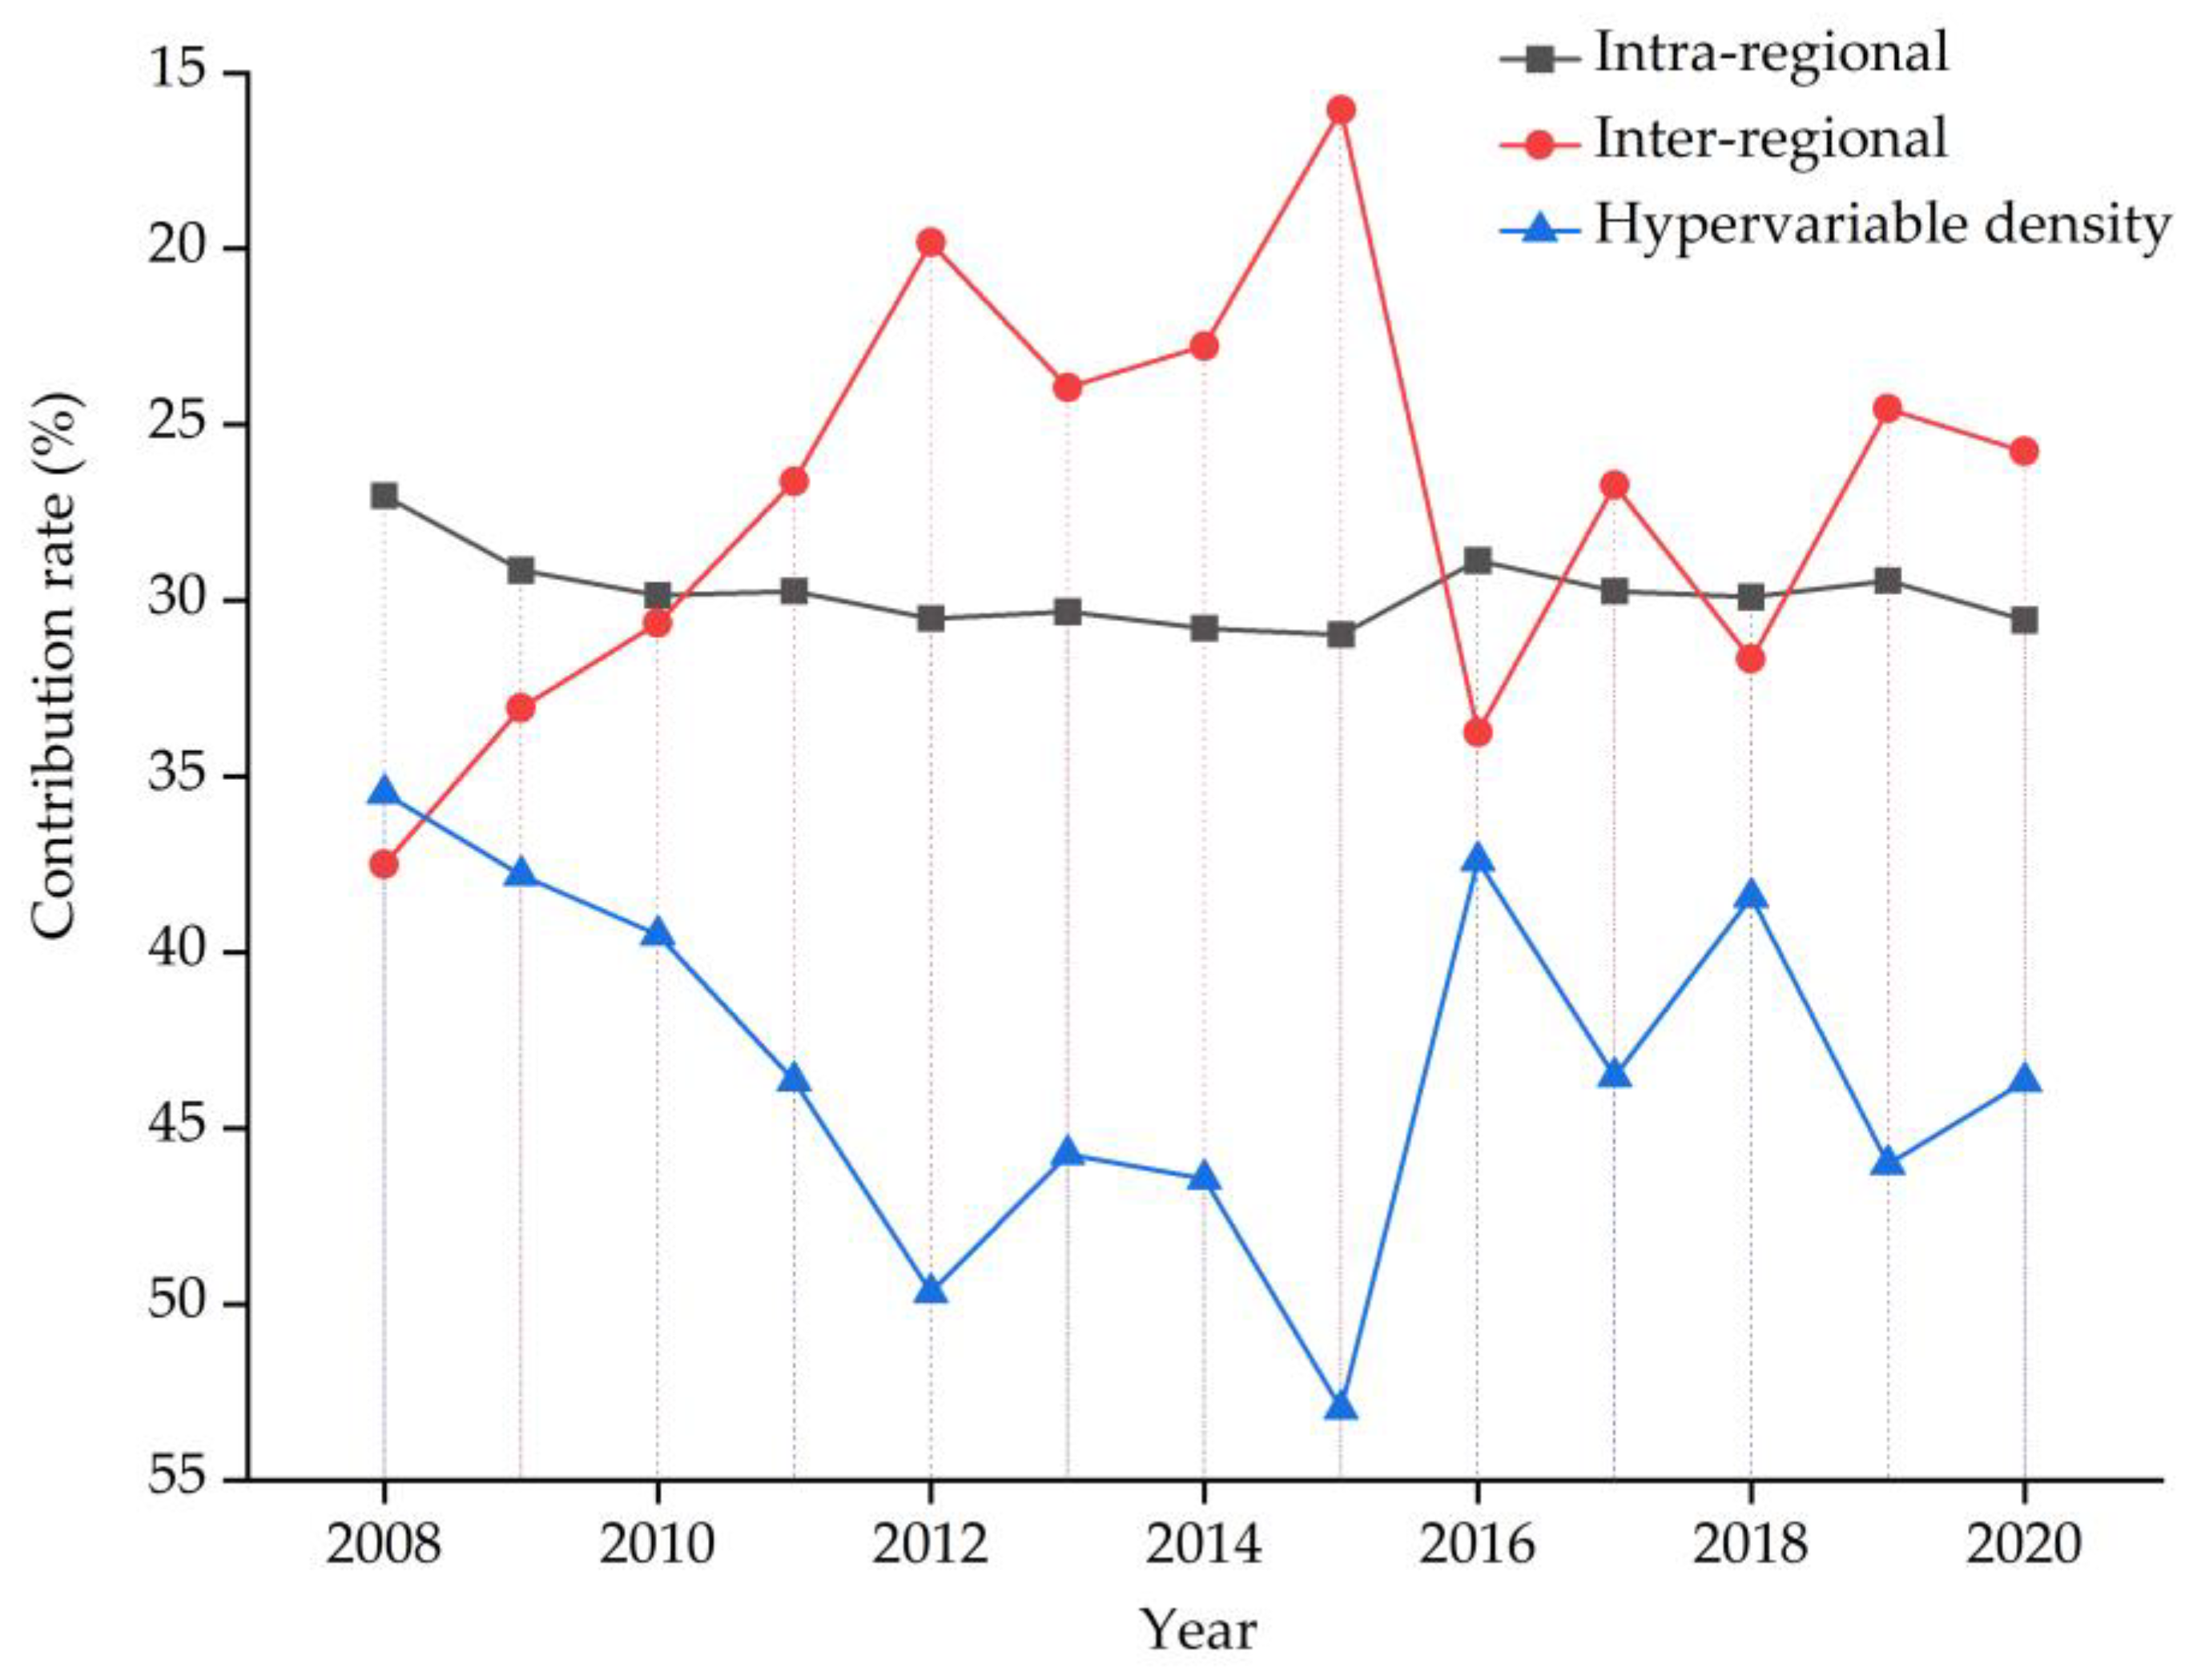
5.1.4. Sources and Contributions of Regional Disparities
Figure 9 displays the results of the Dagum Gini coefficient decomposition. The super-variation density is the main source of spatial differentiation in the high-quality development of China’s maritime economy, indicating a significant degree of overlapping. In comparison, the contributions of intra-regional disparities and inter-regional disparities to the overall regional disparities are relatively small.
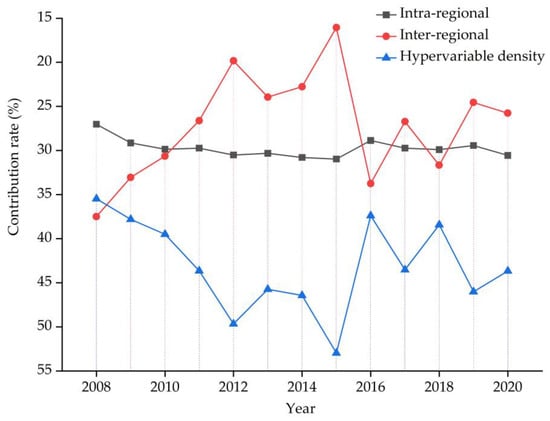
Figure 9.
Contributions of source of disparities of high-quality development of China’s marine economy.
Specifically, during the study period, the contribution rate of the super-variation density fluctuates at a high level, showing an overall trend of “first rising, then falling.” However, it consistently remains above 35% throughout the examination period. In contrast, the contribution rate of intra-regional disparities exhibits relatively small fluctuations, hovering around 30% during the study period, indicating overall stability.
5.2. Kernel Density Estimation of China’s High-Quality Development in Maritime Economy
The preceding text analyzed the regional disparities in the high-quality development of China’s marine economy by calculating the Gini coefficient. It is important to note that the Gini coefficient reflects relative differences rather than absolute differences. When the high-quality development levels of all coastal provinces increase proportionally, the Gini coefficient remains unchanged. However, in such a scenario, provinces with higher levels experience a larger absolute increase in the composite index, a distinction not effectively captured by the Gini coefficient. Therefore, this paper will employ the kernel density estimation method to explore the spatial distribution and dynamic evolution trends in China’s high-quality development in the marine economy from an absolute difference perspective.
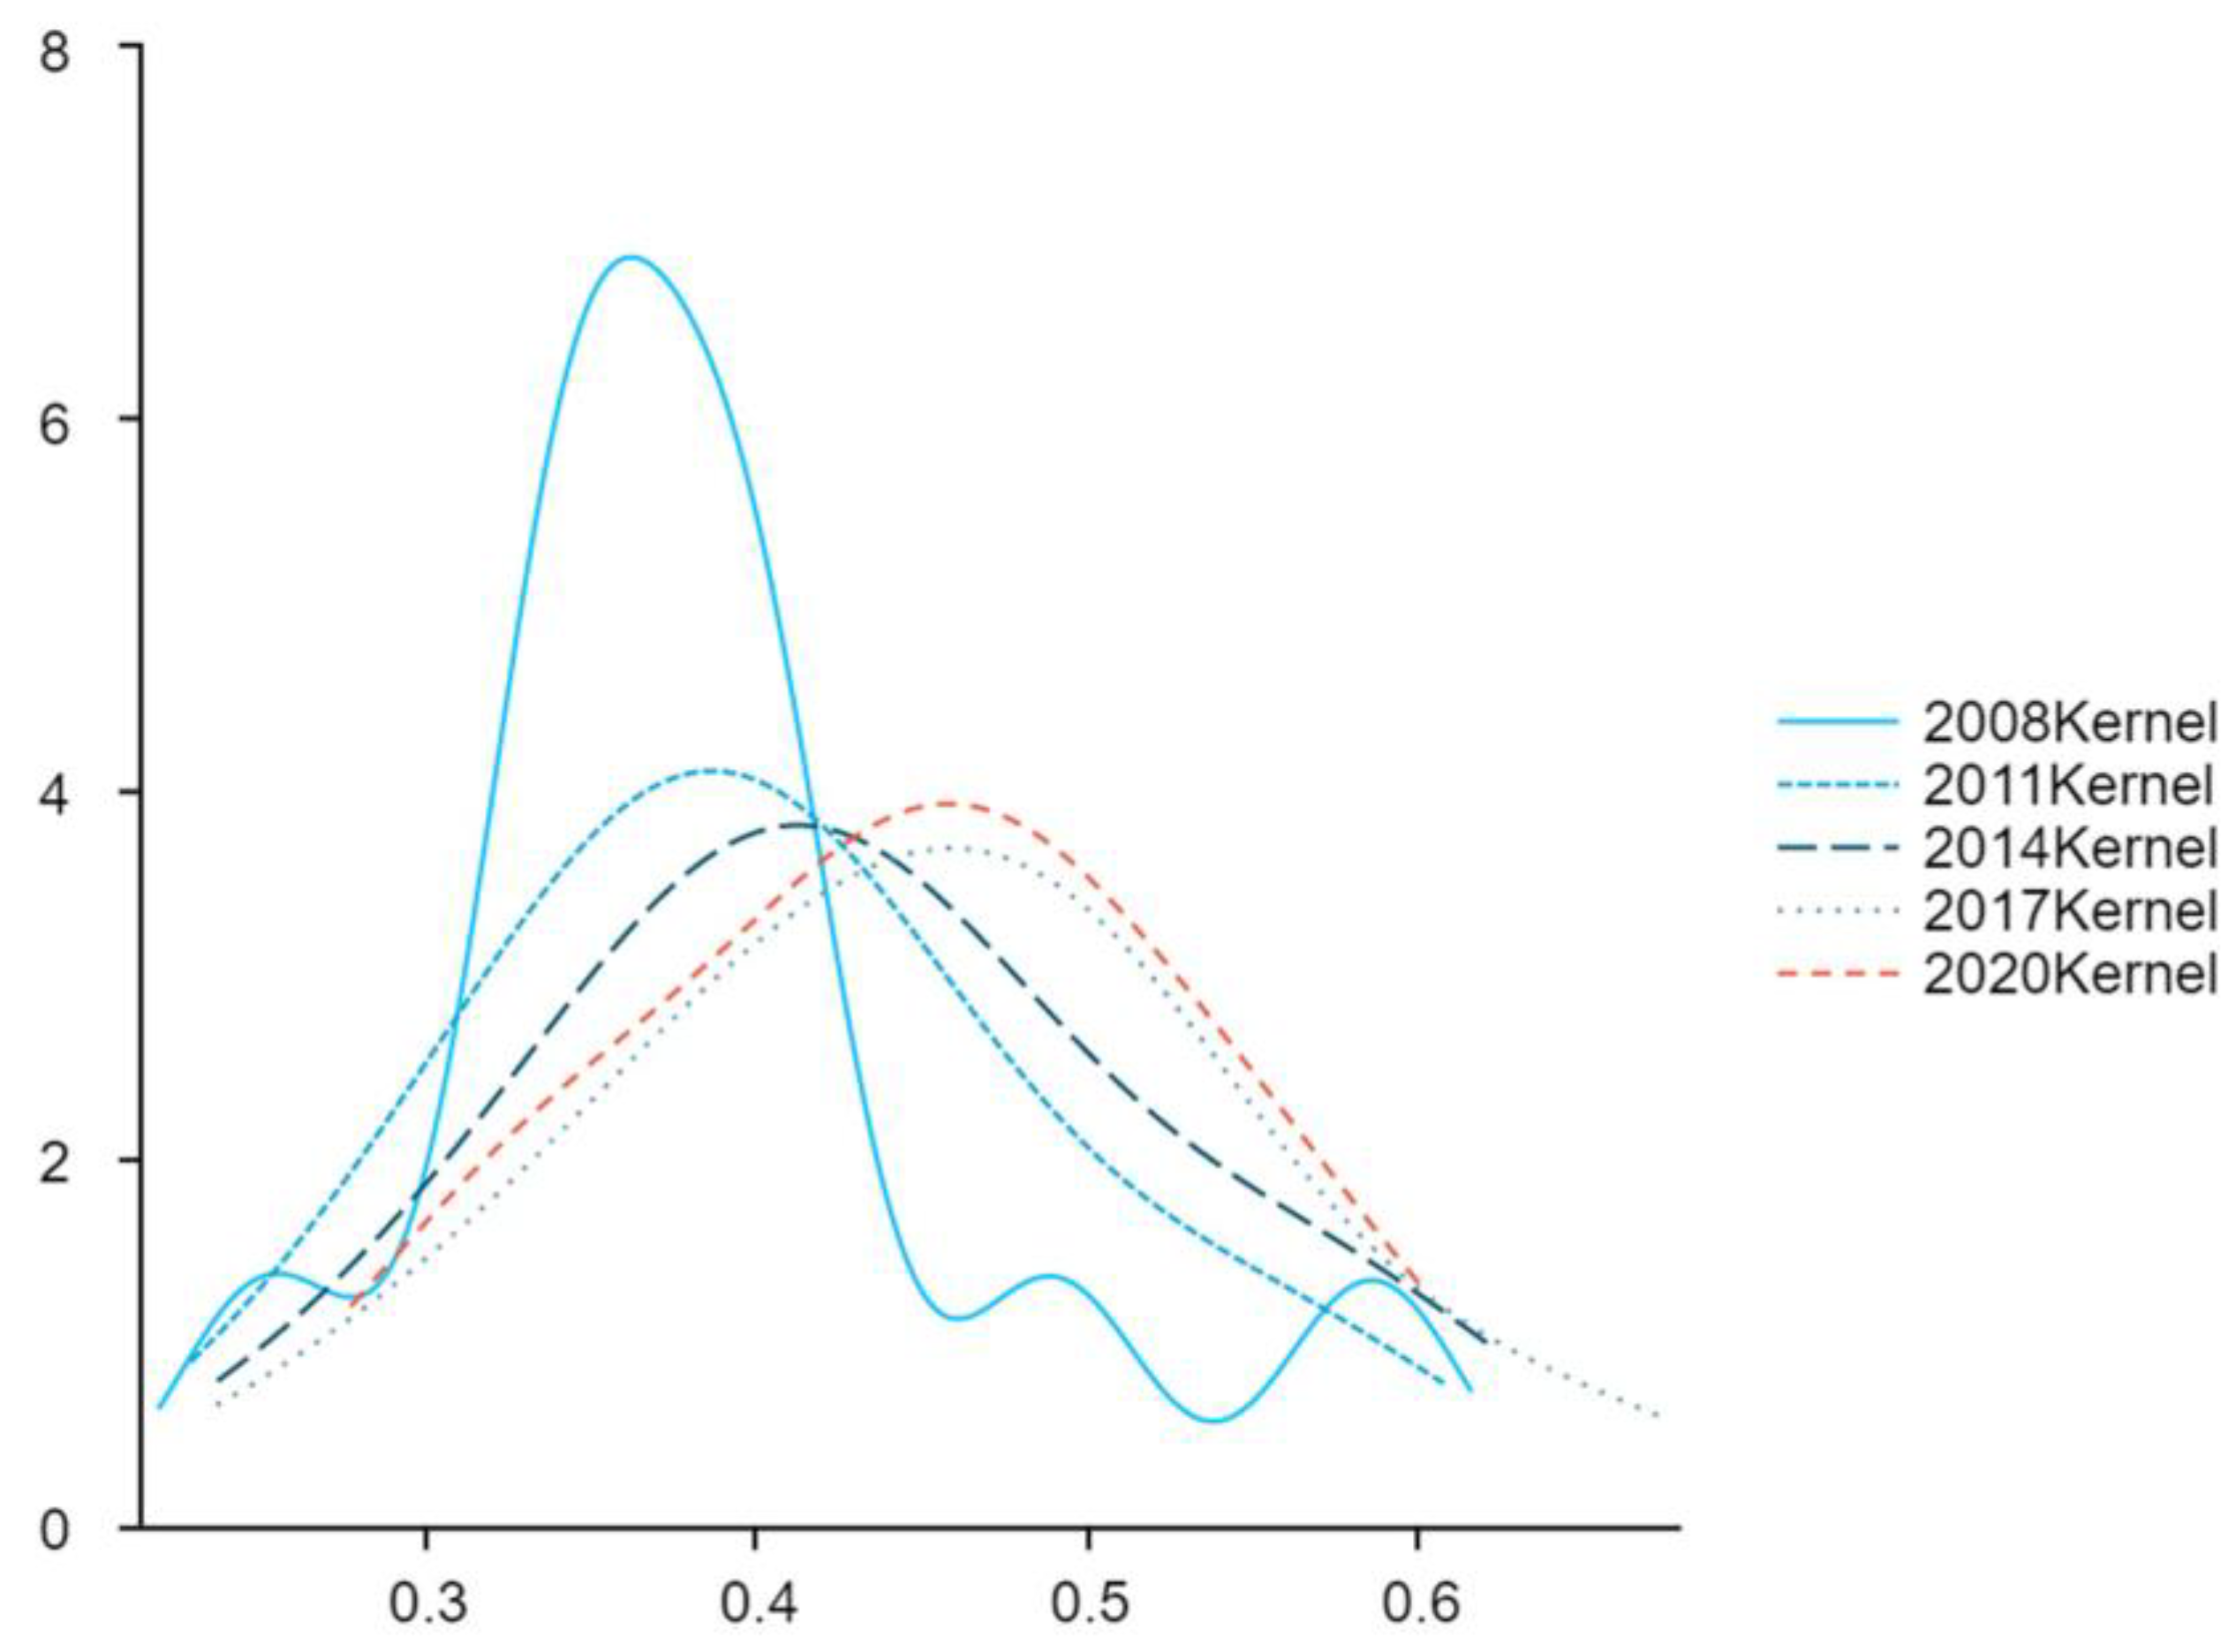
5.2.1. Across Regions
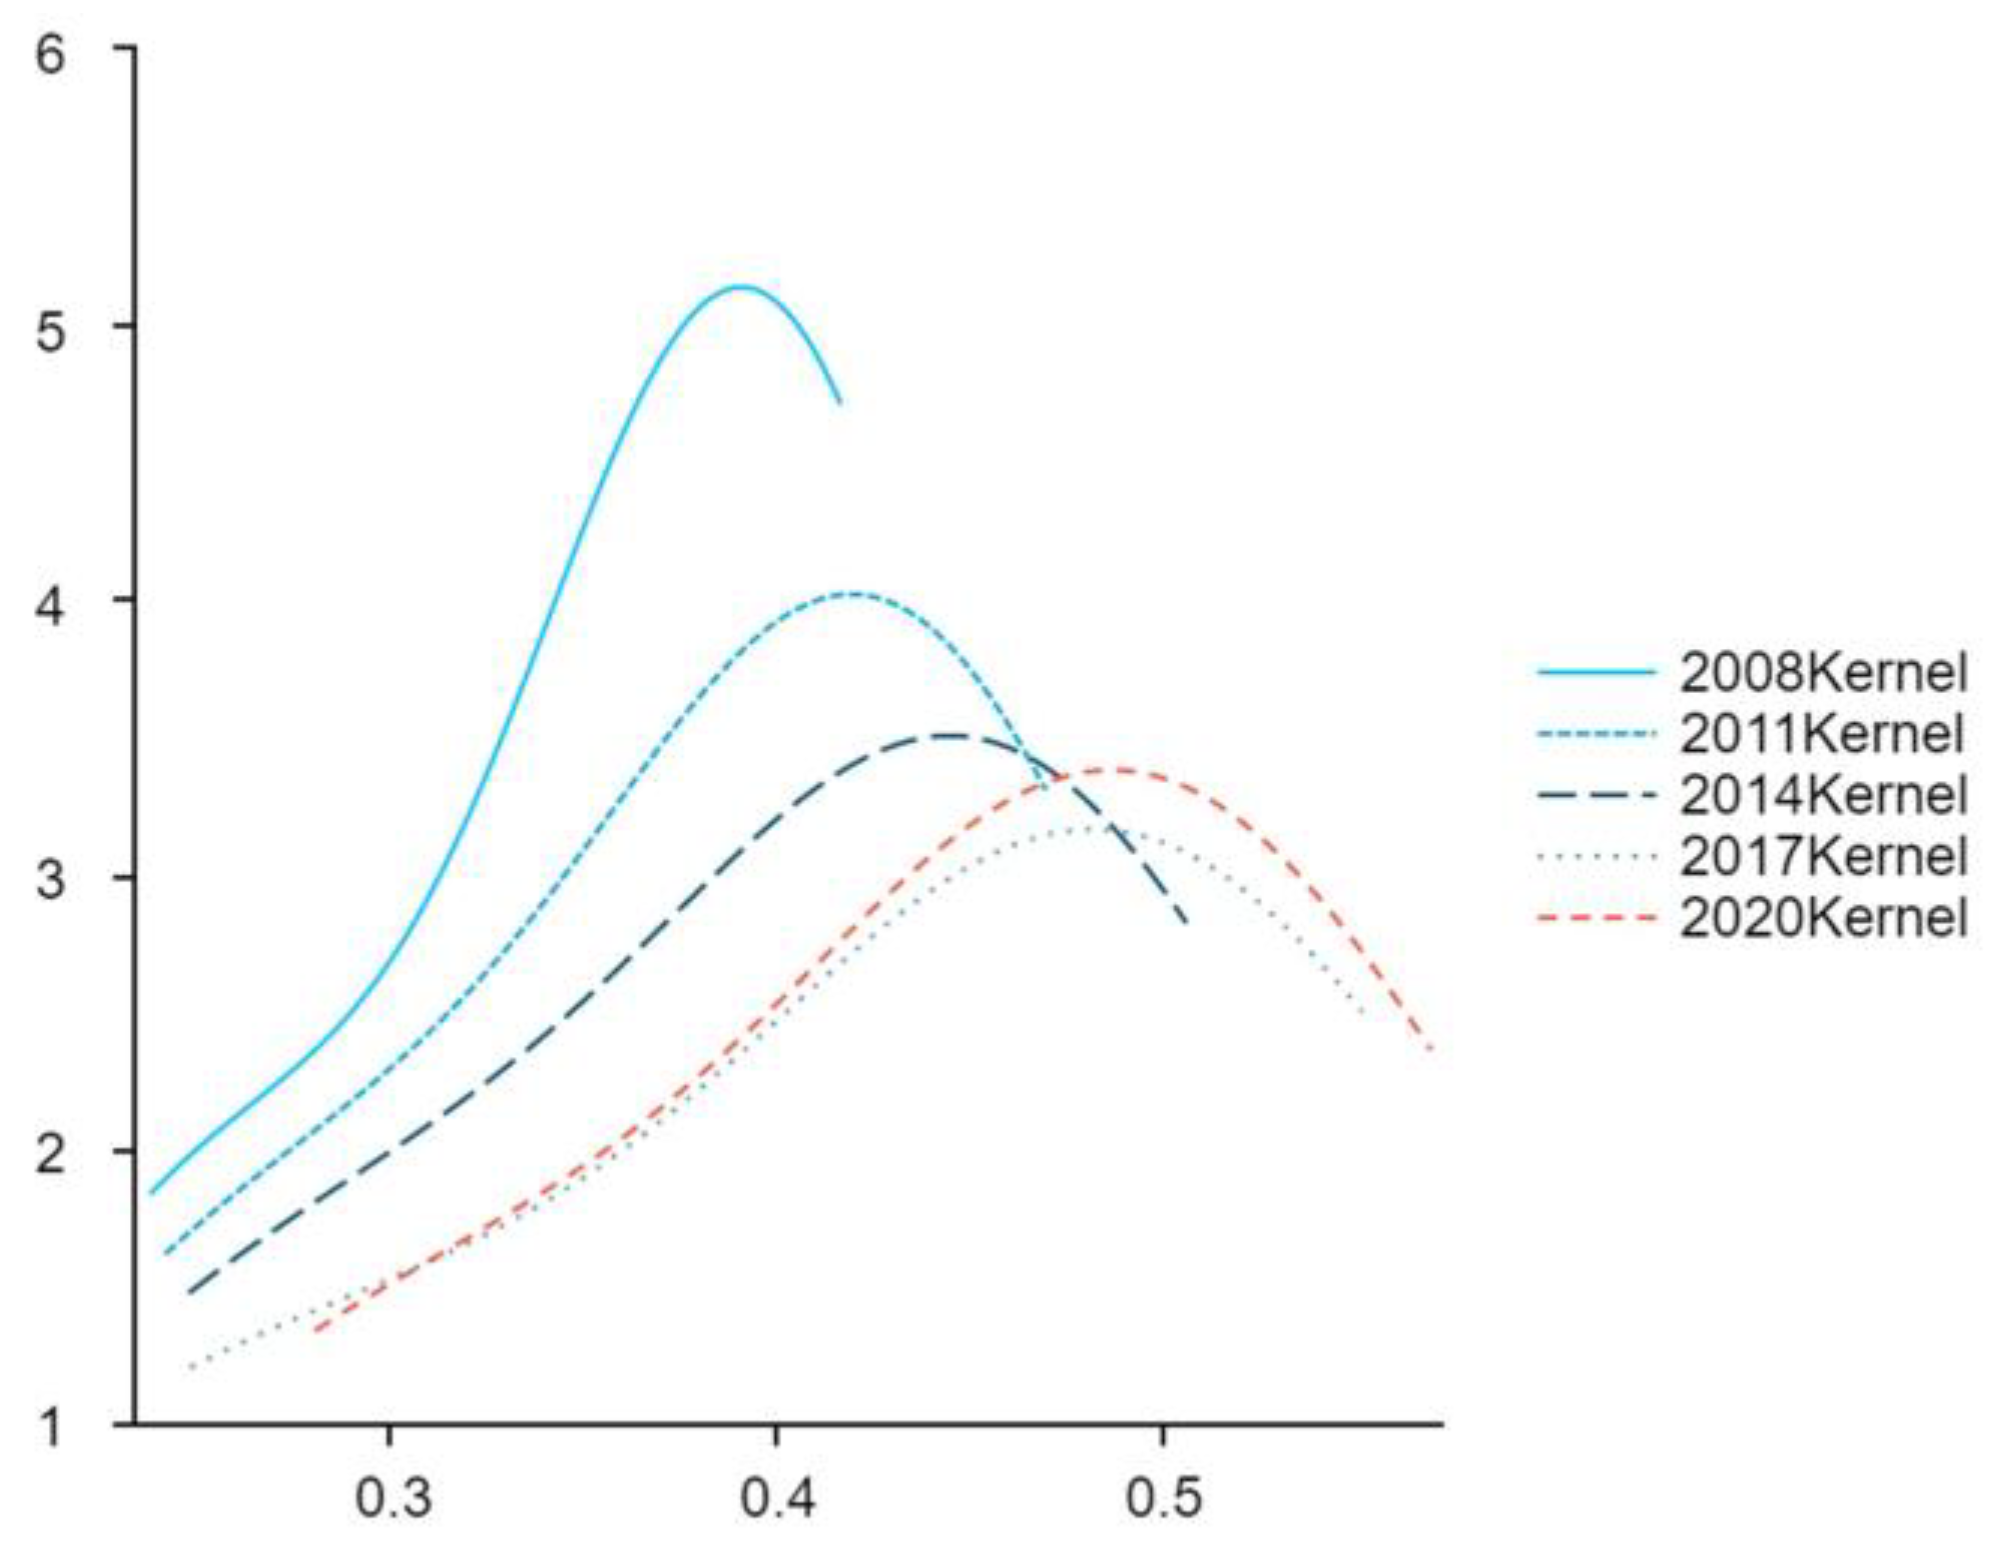
This study selects 2008, 2011, 2014, 2017, and 2020 as time nodes and plots the overall Kernel density estimates for these years. Specifically, Kernel density estimates are created for the Northern Maritime Economic Zone, Eastern Maritime Economic Zone, and Southern Maritime Economic Zone. This aims to illustrate the distribution dynamics of high-quality development in China’s maritime economy at different levels. The evolving characteristics of the distribution dynamics are summarized in Table 6.
Table 6.
Evolutionary characteristics of the distribution dynamics of high-quality development level of national and regional marine economy.
As shown in Figure 10, the center point of the Kernel density curve consistently shifts to the right, indicating a continuous improvement in the high-quality development level of coastal provinces (cities and districts) in China. The fluctuation of the curve peak suggests a trend of first decreasing and then increasing, with the width of the peak first increasing and then narrowing. This indicates fluctuations in the regional disparities in high-quality development, showing an initial expansion followed by contraction.
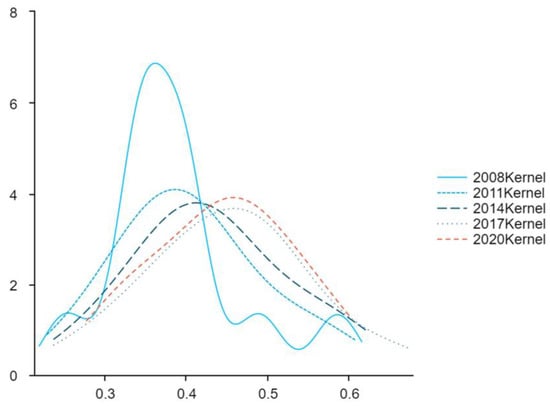
Figure 10.
The Kernel distribution of the high-quality development of the Marine economy in various regions.
The tail of the Kernel density curve shows a widening trend, suggesting the presence of initially prominent individuals whose prominence increases over time. Only in 2008 does the curve exhibit a multi-modal shape, but the height difference between the main peak and several side peaks is significant, indicating a weak polarization phenomenon. This suggests a noticeable gradient effect in the high-quality development level of China’s maritime economy at that time.
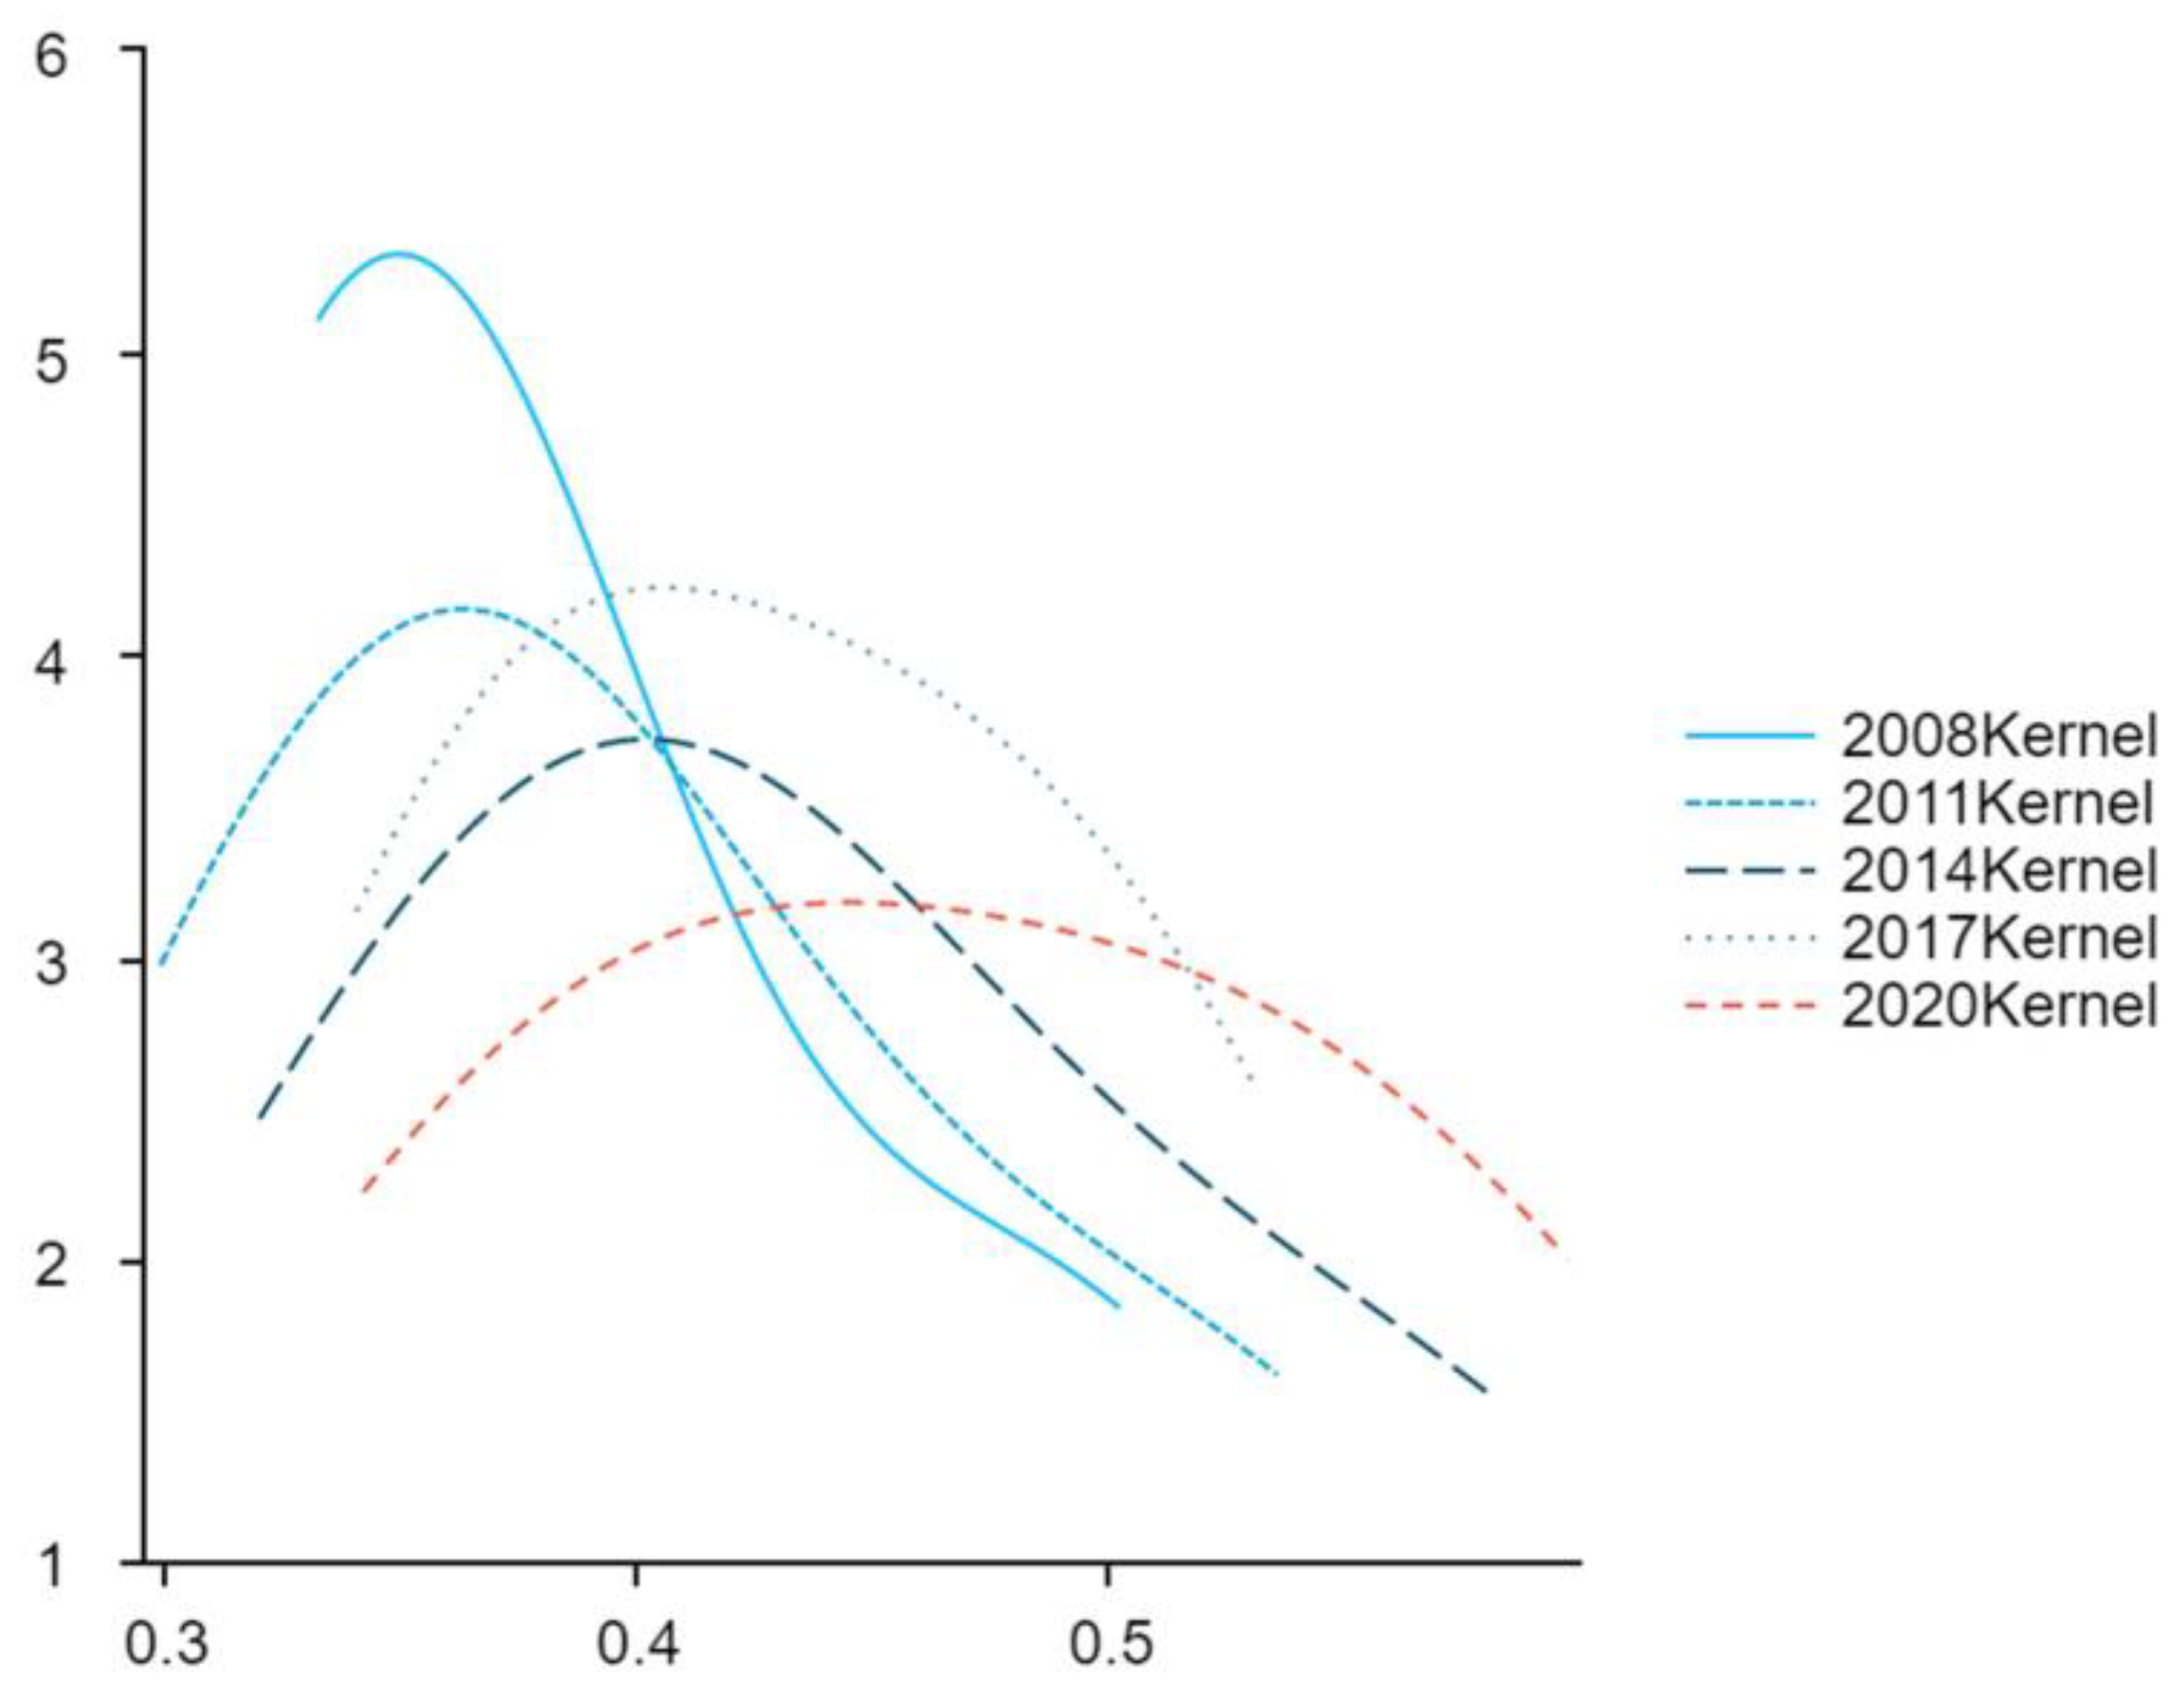
5.2.2. Three Major Maritime Economic Zones
As shown in Figure 11, from 2008 to 2020, the center point of the Kernel density curve for the Northern Maritime Economic Zone continuously shifts to the right, indicating ongoing progress in the high-quality development of the maritime economy. The overall trend in the curve peak height shows a decrease, with a width-changing process of “first widening, then narrowing, then widening.” The regional disparities in the high-quality development level of the maritime economy in this region exhibit a trajectory of “first expanding, then contracting, then expanding.”
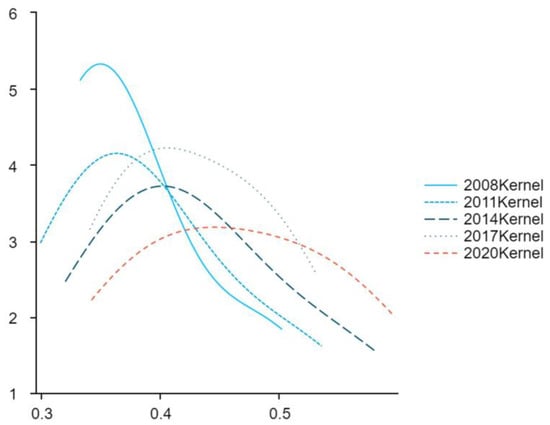
Figure 11.
The Kernel distribution of the high-quality development of marine economy in the northern marine economic circle.
Figure 12 reveals that the center of the Kernel density curve for the Eastern Maritime Economic Zone moves to the right and then shifts to the left in 2020. This suggests an initial rise followed by a decline in the high-quality development level of the maritime economy in this region. The overall trajectory of the curve peak height shows a pattern of “increase-decrease-increase”, with a significantly narrowed peak width. This indicates a trend in diminishing regional disparities in the high-quality development level of the maritime economy in this region. The curve transitions from a right tail to a left tail, indicating the presence of provinces with a higher level of high-quality development in the maritime economy in the region, with a shift towards provinces with a lower level over time.
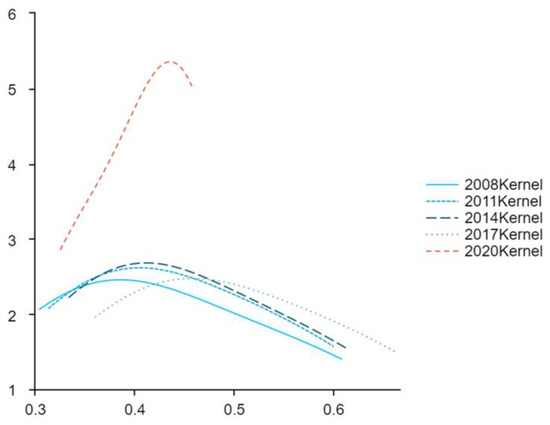
Figure 12.
The Kernel distribution of high-quality development of marine economy in eastern marine economic circle.
In Figure 13, the center point of the Kernel density curve for the Southern Maritime Economic Zone continues to move to the right, indicating an upward trend in the development level. The overall trajectory of the curve peak height first decreases and then increases, whereas the peak width first increases and then decreases. This suggests a development trend of initial widening followed by a narrowing of regional disparities in the high-quality development level. The curve exhibits a left tail and an extending trend, indicating the presence of provinces with a lower level of high-quality development in the maritime economy within the region and the disparity with the regional average becoming more pronounced over time.
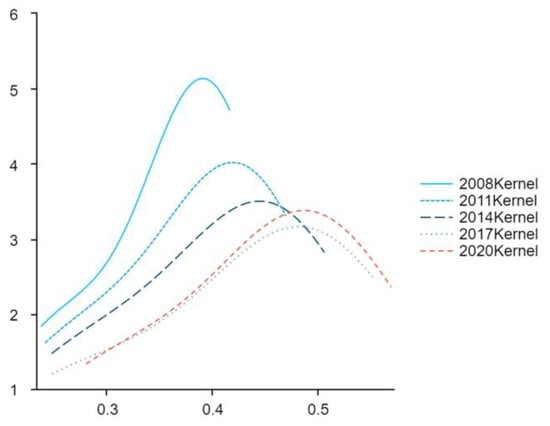
Figure 13.
The Kernel distribution of the high-quality development of marine economy in the southern marine economic circle.
5.3. Transition Probabilities of China’s High-Quality Development in Maritime Economy
Applying the classification method used earlier to categorize the coastal provinces’ high-quality development of the maritime economy in 2020, the examination period is extended from 2008 to 2020. China’s coastal provinces (cities and districts) are classified into three states: high level, middle level, and low level. Provinces with a comprehensive index greater than 0.473 are considered high level, those with an index less than 0.379 are considered low level, and those between these values are considered middle level.
Table 7 presents the state transition matrix, illustrating the probabilities of various scenarios for the next state under the current status of high-quality development in China’s marine economy. According to the physical interpretation of the Markov probability transition matrix, this probability is only related to the current state of high-quality development in the marine economy and is independent of the previous states of high-quality development. The transition probabilities on the main diagonal are relatively high, whereas the off-diagonal transition probabilities are low. This indicates a low mobility between different states of high-quality development in the maritime economy. High-level provinces tend to remain at a high level, whereas low-level provinces have a high probability of persistently maintaining a low level. This prediction result may be related to the existing differences in marine economic facilities among different coastal regions. Coastal provinces with better high-quality development in the marine economy often have comparative advantages in marine infrastructure, marine industries, and government support. Conversely, coastal provinces with lagging high-quality development in the marine economy tend to experience the opposite situation. This phenomenon contributes to the emergence of the “Matthew Effect” in the field of high-quality development in the marine economy, where the strong become stronger, and the weak become weaker. Additionally, during the examination period, most transitions in the high-quality development status of the maritime economy occurred within adjacent states, with a small probability of transitions across states.
Table 7.
The Markov transition probability matrix for the high-quality development of China’s Marine economy from 2008 to 2020.
Specifically, among all the probability distributions in the table, the probability of transitioning from “low-level to low-level” is the highest, reaching 0.892, followed by “high-level to high-level” and “low-level to low-level” with probabilities of 0.826 and 0.750, respectively. This indicates that, in the current state, provinces with a low level of high-quality development in the maritime economy exhibit a significant “low-end lock-in” phenomenon. For provinces in the middle-level state, the probability of transitioning to a low level (0.139) is higher than the probability of transitioning to a high level (0.111), emphasizing the need to pay special attention to the potential regression of the high-quality development level in the maritime economy.
6. Discussion
In the aforementioned research, this paper measured and analyzed China’s high-quality development of the marine economy from different perspectives, including the national, regional, and provincial levels. Overall, the level of China’s high-quality development of the marine economy shows a steady upward trend, which is consistent with the conclusions of some scholars [6,9,14]. The reasons for this can be attributed, on the one hand, to the increasing attention given to marine economic development by the country since 2008. A series of policy documents, such as the “National Outline for the Development of Maritime Affairs” and the “National Plan for the Development of the Marine Economy”, have been successively issued. The legal system related to maritime affairs continues to improve, optimizing the business environment for maritime activities and providing strong policy support for the high-quality development of the marine economy. On the other hand, with the rapid development of China’s marine technology, breakthroughs have been made in polar and deep-sea exploration, with achievements such as the independent development of deep-sea manned submersibles and marine satellites. This has injected a continuous stream of technological vitality into the marine economy, making technological advancement a key factor driving high-quality development and a leading field for the transformation of old and new economic drivers.
Compared with other related studies, this paper focuses on the results-oriented development of the marine economy, using the subjective–objective comprehensive weighting method to measure its index. This method has been proven in previous studies to simultaneously avoid the shortcomings of subjective–objective and objective–objective methods, making it more scientifically reliable in determining index weights [28,29,30]. On this basis, this paper decomposes the comprehensive index of high-quality development of the marine economy and analyzes the changes in the indices of five subsystems. The study found that, unlike dimensions such as innovation-driven efficiency, stable coordination, green ecology, and shared achievements, the index of open inclusivity subsystem shows a declining trend at the national level, in the three major marine economic circles, and most coastal provinces. This is consistent with the findings of An et al., who emphasized an overall retreat in the openness of the marine economy, with significant differences among coastal provinces [10]. The decline in the level of open inclusivity of the marine economy in China does not contradict the continuous promotion of the country’s openness to the outside world. While China is a maritime power with the fourth-longest coastline globally, there is still a certain gap from becoming a world-class maritime power. Therefore, the effectiveness and dividends generated by openness to the outside world in the field of the marine economy are relatively limited. This is also an important direction for the future high-quality development of the marine economy in China. Meanwhile, compared with advanced marine economy provinces such as Shandong, Guangdong, and Tianjin, some provinces such as Hebei, Jiangsu, and Guangxi lag in the high-quality development of the marine economy. Considering the connection between this and the local marine resources, economic foundation, and policy efforts, special attention should be paid to the “low-end lock-in” phenomenon in the high-quality development of the marine economy. Although there are slight differences in the rankings of provinces compared to other studies [1,14], the overall agreement is considerable. The study further revealed that the regional disparity in the high-quality development of the marine economy fluctuates significantly but generally shows a decreasing trend. This is closely related to the requirements for optimizing the regional spatial pattern in the “Twelfth Five-Year Plan”, and, since then, communication and cooperation in the marine economy between regions have become more in-depth. This finding is consistent with some related research [3,9]. In addition, this paper innovatively proposes that super-density is the main source of regional differences, indicating a significant overlap in the high-quality development of the marine economy in China.
This paper provides methodological and conceptual contributions to the definition, measurement, and regional differentiation of high-quality development of the marine economy in China. It also supplements empirical references for regional development. However, there are limitations. On the one hand, due to data acquisition limitations, the minimum scale of this study is coastal provinces, and it does not delve into coastal cities or conduct international comparisons. On the other hand, the focus of this paper is on the regional analysis of high-quality development of the marine economy, mainly discussing its spatial distribution and proposing relevant strategies. There is a lack of research on the promotion strategies for high-quality development of the marine economy itself. Therefore, based on the limitations of this study and in conjunction with the forefront issues of the marine economy, possible follow-up research in the future may include: First, conducting on-site investigations in major coastal cities in China to obtain first-hand data, measure the high-quality development levels of the marine economy in coastal cities, and systematically explore regional differences and distribution dynamics at the city level. Second, expanding the research on the high-quality development of the marine economy to the international level, comparing the high-quality development levels of the marine economy in different maritime countries based on the same measurement caliber, and deeply analyzing the dimensions of their advantages and weaknesses. Third, based on this study, analyzing the influencing factors of high-quality development of the marine economy, exploring the relationships and internal mechanisms between factors such as marine digital economy, construction of the entire marine industry chain, and marine carbon sequestration, and providing more comprehensive theoretical support for promoting high-quality development of the marine economy.
7. Conclusions and Recommendations
7.1. Conclusions
This paper utilized the subjective–objective comprehensive weighting method to calculate China’s high-quality development index of the marine economy from 2008 to 2020. Analyzing the regional disparities and dynamic evolution of China’s high-quality marine economic development using methods such as Dagum Gini coefficient decomposition, kernel density estimation, and Markov chain, the following conclusions were drawn:
- (1)
- Overall, the level of China’s high-quality development of the marine economy shows a fluctuating upward trend. Examining the comprehensive index of high-quality marine economic development across provinces reveals a fluctuating upward trend, indicating uneven development among various regions. On the subsystem level, apart from the open inclusivity index, the other four subsystem indices show varying degrees of improvement, with different coastal provinces excelling in different dimensions.
- (2)
- The overall regional disparity trajectory shows an initial expansion followed by contraction, with an overall trend in narrowing disparities. In terms of intra-regional disparities, rankings within the three major economic circles have constantly changed, with the southern marine economic circle currently exhibiting the largest internal differences. Inter-regional disparities between the eastern and southern marine economic circles are relatively apparent. Contribution analysis indicates that super-density is the main source of disparities, and intra-regional disparities contribute stably.
- (3)
- Fluctuations in the regional differences between China and the three major marine economic circles are apparent. The internal disparities in the northern and southern marine economic circles have expanded to varying degrees, whereas the eastern marine economic circle has shown some convergence. There is no polarization phenomenon in the three major marine economic circles.
- (4)
- The inter-group mobility of different high-quality development states of the marine economy is relatively low. Provinces with a high level of high-quality marine economic development tend to maintain that level, whereas provinces in a low state exhibit a clear “low-end lock-in” phenomenon. Additionally, during the study period, most state transitions occurred between adjacent states, with a low probability of transitions across states.
7.2. Recommendations
In response to the conclusions drawn in this paper, the following policy recommendations are proposed:
A. Strengthen Top-level Design for Overall Planning of China’s Marine Economy:
- (1)
- Enhance strategic planning and policy coordination: Optimize the marine industry layout of the three major marine economic circles based on factors such as geographical advantages and natural endowments. Tailor strategies to each region to optimize the spatial coordination mechanism for the high-quality development of the marine economy.
- (2)
- Implement the new development concept: Apply the new development concept more comprehensively in the marine economy domain. Increase research and development in cutting-edge marine technologies, coordinate the construction of a modern marine industry system, intensify efforts in restoring the marine ecological environment, actively participate in global marine industry chain restructuring, improve the marine intelligent management system, and comprehensively promote the high-quality development of the marine economy.
- (3)
- Focus on building a national marine innovation system: Stimulate the subjective initiative of research institutions, government, enterprises, and various sectors of society to participate in marine innovation. Establish a cross-regional, multi-subject collaborative mechanism for marine innovation, harnessing the compounding advantages of innovative elements.
B. Address Spatial Imbalances and Coordinate the High-quality Development of China’s Marine Economy:
- (1)
- Provinces along the coast should leverage their strengths and address weaknesses: Based on the characteristics of each subsystem’s performance, coastal provinces should play to their strengths, mitigate weaknesses, and simultaneously enhance the effectiveness of foreign openness in the marine economy. Seize opportunities such as the Maritime Silk Road, the signing of the RCEP, and negotiations on the EU-China investment agreement to actively expand blue partnerships.
- (2)
- Promote the formation of demonstration zones for marine economic development: Use marine economic development demonstration zones as a crucial foundation to develop stable, distinctive, and high-quality marine industry clusters. Leverage scale effects and agglomeration effects to radiate surrounding regions, exploring new models of marine economic cooperation.
- (3)
- Strengthen infrastructure construction such as coastal observation platforms and offshore 5G base stations: Improve the efficiency of the flow and allocation of marine elements. Overcome challenges and bottlenecks in building a unified national marine market, thereby facilitating the faster integration and service of the marine economy into the new development pattern.
These recommendations aim to comprehensively advance the high-quality development of China’s marine economy, address regional disparities, and create a coordinated and efficient marine economic system.
Author Contributions
Conceptualization, H.Z.; methodology, X.W.; validation, X.W.; funding acquisition, H.Z.; data processing, X.W.; supervision, H.Z.; writing—original draft preparation, X.W.; writing—review and editing, H.Z. All authors have read and agreed to the published version of the manuscript.
Funding
This work was supported by Key Project of National Social Science Foundation of China (No.19AJY014).
Institutional Review Board Statement
Not applicable.
Informed Consent Statement
Not applicable.
Data Availability Statement
Data are contained within the article.
Acknowledgments
Thanks to the Key Research Base of Social Science Theory, Shandong University of Finance and Economics for the support of this study.
Conflicts of Interest
The authors declare no conflicts of interest.
References
- Li, B.; Tian, C.; Shi, Z.; Han, Z. Evolution and differentiation of high-quality development of marine economy: A case study from China. Complexity 2020, 3, 5624961. [Google Scholar] [CrossRef]
- Haas, B.; Mackay, M.; Novaglio, C.; Fullbrook, L.; Murunga, M.; Sbrocchi, C.; McDonald, J.; McCormack, P.C.; Alexander, K.; Fudge, M. The future of ocean governance. Rev. Fish Biol. Fish. 2021, 32, 253–270. [Google Scholar] [CrossRef] [PubMed]
- Sun, Z.; Guan, H.; Zhao, A. Research on the Synergistic Effect of the Composite System for High-Quality Development of the Marine Economy in China. Systems 2023, 11, 282. [Google Scholar]
- Wang, Y.; Sun, C.; Zou, W. Study on the interactive relationship between marine economic growth and marine environmental pressure in China. Environ. Resour. Econ. 2021, 79, 117–133. [Google Scholar] [CrossRef]
- Heckwolf, M.J.; Peterson, A.; Jänes, H.; Horne, P.; Künne, J.; Liversage, K.; Sajeva, M.; Reusch, T.B.; Kotta, J. From ecosystems to socio-economic benefits: A systematic review of coastal ecosystem services in the Baltic Sea. Sci. Total Environ. 2021, 755, 142565. [Google Scholar] [CrossRef]
- Liu, S.; Wang, J. Coupling coordination between marine S&T innovation and the high-quality development of the marine economy: A case study of China’s coastal provinces. Sustainability 2022, 14, 7373. [Google Scholar]
- Gao, S.; Sun, H.; Wang, R. Audit evaluation and driving force analysis of marine economic development quality. Sustainability 2022, 14, 6822. [Google Scholar] [CrossRef]
- Xiao, J.; Hu, D. Construction and empirical study of the evaluation index system for high-quality development of marine economy in Guangdong Province based on five new development concepts. In Journal of Physics: Conference Series; IOP Publishing: Bristol, UK, 2020; p. 012030. [Google Scholar]
- Ji, J.; Liu, H.; Yin, X. Evaluation and regional differences analysis of the marine industry development level: The Case of China. Mar. Policy 2023, 148, 105445. [Google Scholar] [CrossRef]
- An, D.; Shen, C.; Yang, L. Evaluation and temporal-spatial deconstruction for high-quality development of regional marine economy: A case study of China. Front. Mar. Sci. 2022, 9, 916662. [Google Scholar]
- Yu, S.; Cui, B.; Xie, C.; Ma, X.; Man, Y.; Ning, Z. Ecological Offsetting in China’s Coastal Wetlands: Existing Challenges and Strategies for Future Improvement. Chin. Geogr. Sci. 2019, 29, 24–35. [Google Scholar] [CrossRef]
- Song, M.; Xie, Q.; Shahbaz, M.; Yao, X. Economic growth and security from the perspective of natural resource assets. Resour. Policy 2023, 80, 103153. [Google Scholar] [CrossRef]
- Luciana, T.A.; Gasparotti, C.; Rusu, E. Green fuels—A new challenge for marine industry. Energy Rep. 2021, 7, 127–132. [Google Scholar]
- Gao, S.; Sun, H.; Wang, J.; Liu, W. Evaluation and countermeasures of high-quality development of China’s marine economy based on pso-svm. Sustainability 2022, 14, 10749. [Google Scholar] [CrossRef]
- Li, J.; Luan, S.; Jiang, B.; Gong, Y. Industrialization process evaluation of marine economy in China. Ocean. Coast. Manag. 2023, 231, 106416. [Google Scholar]
- Liu, P.; Zhu, B.; Yang, M. Has marine technology innovation promoted the high-quality development of the marine economy?——Evidence from coastal regions in China. Ocean. Coast. Manag. 2021, 209, 105695. [Google Scholar] [CrossRef]
- Sumaila, U.R.; Walsh, M.; Hoareau, K.; Cox, A.; Teh, L.; Abdallah, P.; Akpalu, W.; Anna, Z.; Benzaken, D.; Crona, B. Financing a sustainable ocean economy. Nat. Commun. 2021, 12, 3259. [Google Scholar] [CrossRef]
- Bennett, N.J.; Blythe, J.; White, C.S.; Campero, C. Blue growth and blue justice: Ten risks and solutions for the ocean economy. Mar. Policy 2021, 125, 104387. [Google Scholar] [CrossRef]
- Wu, F.; Cui, F.; Liu, T. The influence of environmental regulation on high-quality development of marine economy from different subjects’ perspectives. Front. Mar. Sci. 2023, 10, 1107666. [Google Scholar]
- Tu, C.A.; Rasoulinezhad, E.; Sarker, T. Investigating solutions for the development of a green bond market: Evidence from analytic hierarchy process. Financ. Res. Lett. 2020, 34, 101457. [Google Scholar] [CrossRef]
- Zhao, D.; Li, C.; Wang, Q.; Yuan, J. Comprehensive evaluation of national electric power development based on cloud model and entropy method and TOPSIS: A case study in 11 countries. J. Clean. Prod. 2020, 277, 123190. [Google Scholar] [CrossRef]
- Gong, Y.; Ma, R.; Ren, F. Decomposition of industrial SO2 emission in China with firm entry and exit. J. Clean. Prod. 2023, 428, 139406. [Google Scholar]
- Liang, X.; Li, J.; Guo, G.; Li, S.; Gong, Q. Urban water resource utilization efficiency based on SBM—Undesirable—Gini coefficient—Kernel density in Gansu Province, China. Environ. Dev. Sustain. 2023, 25, 13015–13034. [Google Scholar] [CrossRef]
- Rahnama, M.R. Forecasting land-use changes in Mashhad Metropolitan area using Cellular Automata and Markov chain model for 2016–2030. Sustain. Cities Soc. 2021, 64, 102548. [Google Scholar] [CrossRef]
- You, J.; Zhang, W. How heterogeneous technological progress promotes industrial structure upgrading and industrial carbon efficiency? Evidence from China’s industries. Energy 2022, 247, 123386. [Google Scholar] [CrossRef]
- Wang, H.; Guo, W.; Zou, X. Herfindahl Index Methods and Special Analysis for Regional Competitiveness Inequality Evaluation. J. Financ. 2022, 10, 15–22. [Google Scholar] [CrossRef]
- Yin, G.; Lin, Z.; Jiang, X.; Qiu, M.; Sun, J. How do the industrial land use intensity and dominant industries guide the urban land use? Evidences from 19 industrial land categories in ten cities of China. Sustain. Cities Soc. 2020, 53, 101978. [Google Scholar] [CrossRef]
- Xia, K.; Guo, J.-K.; Han, Z.-L.; Dong, M.-R.; Xu, Y. Analysis of the scientific and technological innovation efficiency and regional differences of the land–sea coordination in China’s coastal areas. Ocean. Coast. Manag. 2019, 172, 157–165. [Google Scholar] [CrossRef]
- Qian, J.; Wu, J.; Yao, L.; Mahmut, S.; Zhang, Q. Comprehensive performance evaluation of Wind-Solar-CCHP system based on emergy analysis and multi-objective decision method. Energy 2021, 230, 120779. [Google Scholar] [CrossRef]
- Fu, X.; Zhao, G.; Wang, M.; Wang, J.; Xu, Y.; Gu, C. Comprehensive evaluation method for structural behavior of concrete dams in cold regions. Eng. Struct. 2023, 278, 115435. [Google Scholar]

Disclaimer/Publisher’s Note: The statements, opinions and data contained in all publications are solely those of the individual author(s) and contributor(s) and not of MDPI and/or the editor(s). MDPI and/or the editor(s) disclaim responsibility for any injury to people or property resulting from any ideas, methods, instructions or products referred to in the content. |
© 2024 by the authors. Licensee MDPI, Basel, Switzerland. This article is an open access article distributed under the terms and conditions of the Creative Commons Attribution (CC BY) license (https://creativecommons.org/licenses/by/4.0/).