Article

Economic Assessment of Hydrologic Ecosystem Services in Morocco’s Protected Areas: A Case Study of Ifrane National Park

by
Oumayma Sadgui
1,* and
Abdellatif Khattabi
2
1
Applied Economics and Social Sciences in Agriculture, IAV Hassan II, Rabat 10000, Morocco
2
National School of Forestry Engineering, Salé 11000, Morocco
*
Author to whom correspondence should be addressed.
Sustainability 2024, 16(20), 8800; https://doi.org/10.3390/su16208800
Submission received: 19 July 2024 / Revised: 8 August 2024 / Accepted: 12 August 2024 / Published: 11 October 2024

Abstract

:
This study delves into the complex interplay between land use dynamics, hydrological services, and intangible benefits within the context of Ifrane National Park (INP) in Morocco. Due to its extensive mountain forests and numerous wetlands, INP is a crucial contributor to the nation’s water supply and a vital source of hydrological ecosystem services (HES). However, climate change and evolving land use patterns have led to diminishing water resources and the desiccation of certain wetlands. This research used the Integrated Valuation of Ecosystem Services and Tradeoffs software (InVEST 3.10.2) for HES quantification and environmental economics approach for monetization to comprehend how HES values respond to challenges posed by urbanization, intensive agriculture, and other land use alterations. This work underscores INP’s role as a significant “water tower”, emphasizing the evolution of its services amidst challenges. Our findings reveal an annual decrease in HES economic value by USD 4000. This economic assessment serves as a compelling tool to enlighten decision-makers and park users about the imperative need to preserve natural ecosystems and use water resources judiciously. It advocates for investments in conservation and restoration within protected areas to sustain these vital services.

1. Introduction

Water is a vital element of our planet. It represents an invaluable and indispensable resource for sustaining life. In a dynamic global landscape, the importance of protected areas as crucial havens for natural resources, particularly water, becomes evident [1,2]. These undisturbed natural reserves are essential reservoirs of HES, gaining recognition and facing growing demand [3,4]. However, despite their paramount importance, the economic valuation of HES often remains notably absent from decision-making processes. This omission frequently leads to the undervaluation of ecosystems that provide these services [5,6,7], leading to ineffective decisions on natural resource use. The assessment and comprehension of HES within protected areas play pivotal roles in ensuring the sustainable management of water resources and the vitality of this ecosystem in a dynamically changing world [8,9].
This research focuses on Ifrane National Park in Morocco, which was established to protect its unique biodiversity and contribute significantly to the national water supply. The park’s mountainous forests and wetlands serve as vital sources of HES, including water supply, water purification, and erosion control [10,11]. However, the ever-growing impacts of climate change and shifting land use patterns have posed substantial threats to these services. These challenges are causing a gradual decline in water resources [12]. The aim of this paper is to assess and monetize the hydrological ecosystem services provided by this park, particularly in the context of land use dynamics. Scientific research on the economic valuation of HES in Africa, particularly in Morocco, has increased in recent years. However, there persist several challenges, such as a lack of empirical data, methodological variations, and perplexing results that are not verifiable and interpreted in an easy language. These challenges underscore the need for further research and standardized approaches to enhance valuation across the continent [13,14,15,16,17,18,19,20,21,22,23,24,25]. This study addresses these gaps by employing simple methods to explore the complex interactions between land use dynamics, hydrological services, and the intangible benefits offered by protected areas in terms of water management. By analyzing land use changes from 2008 to 2020, our research aims to understand how HES responds to the challenges posed by urbanization, intensive agriculture, and other land use alterations.
We first describe the area of study (Section 2.1), then the methodological approach adopted (Section 2.2). This includes the quantification of HES through InVEST 3.10.2 software, a tool that allows for accurate assessments of these crucial services (Section 2.2.1). Additionally, the environmental economics approach, including a cost of avoided damage monetization method, is used to ascertain the economic value of the quantified HES (Section 2.2.2). The results highlight the often-underestimated economic value of HES, which is at risk due to the deterioration of the ecosystems that provide it. This economic evaluation stands as a compelling instrument to advocate for the preservation of natural ecosystems and the judicious utilization of water resources. Through the integration of hydrological services into decision-making processes, this research aims to underscore the significance of preserving essential ecosystems, ultimately contributing to the sustainable management of INP and similar protected areas worldwide.

2. Materials and Methods

2.1. Study Area

The study area encompasses the watershed associated with Ifrane National Park (INP), situated in the western part of the central Middle Atlas region, covering identical territories within the Ifrane province (Figure 1).
This sub-watershed, delineated using GIS (ArcGIS 10.3 software) based on the hydrographic network, extends upstream of the Sebou and Oum Er-Rabia watersheds.
The INP was established with the goal of conserving and enhancing the cedar ecosystems and wetlands through participatory management of coherent spaces (forest, rangeland, and agricultural land) [26]. The geological formations within the park comprise shales, sandy dolomites, bedded dolomites, dolomitic limestones, alternating banks of marly and calcareous limestones, and volcanic formations. The park experiences two bioclimates: subhumid and humid with cool variations at midaltitudes, cold over most of the plateau, and very cold on the summits of the eastern reliefs. The precipitation regime is characterized by maximum rainfall concentration during December, January, and February, with the initial two summer months (July–August) being notably dry and hot [27]. The fauna of the area includes three endemic species: the magot monkey (Macaca sylvanus), the squirrel of Berberia (Atlantoxerus getulus), and the macroscelid of Rozet (Elephantulus rozeti). In terms of flora, the park boasts over 1015 species of vascular plants, representing more than 22% of the total Moroccan Flora, with a noteworthy rate of endemism [26]. Notably, major forest species such as the Atlas cedar (Cedrus atlantica) are prevalent [26].

2.2. Methods

The methodology employed in this study encompasses a systematic approach. Initially, we identify the primary HES of the park and select models for quantification. Following that, we quantify and estimate the monetary value of these services. The last step includes validating results and calibrating the models. To examine the evolution of HES, we compare two times: the park’s initial expansion in 2008 and the current study year in 2020.
The following table summarizes the different biophysical quantification and economic valuation methods used (Table 1).

2.2.1. Quantification Methods

The “Sediment Delivery Ratio” model operates at the pixel level, computing annual soil loss for each pixel and deriving the sediment delivery ratio, which represents the proportion of soil loss reaching the stream. Assuming sediment reaches the stream and then the watershed outlet, the model uses the Revised Universal Soil Loss Equation (RUSLE) to estimate annual soil loss for each pixel. The “Nutrient Delivery Ratio” model explains the spatial movement of nutrient masses using a simple mass balance methodology, considering land use and loading rates to determine nutrient loads. The “Annual Water Yield” model assesses water contributions across a landscape, calculating water flow from each pixel by subtracting evapotranspiration from precipitation. It does not distinguish between surface, subsurface, and baseflow and aggregates water yield at the sub-watershed level [28].
After applying the models, calibration is crucial for accuracy. It involves adjusting parameters to match terrain data and literature. Terrain data helps align model outputs. Literature reviews provide insights into parameters and processes. Calibration is iterative; we adjust until the model matches the observed data. Documenting the process is essential for transparency. As example: for “Sediment Delivery Ratio” model, we compare erosion results in the study area with field measurements. We adjust the kb factor based on literature. Initially, we use a kb value of 2. We increase it gradually until the results match previous studies.
The final step involves converting pixel outputs to hectares, employing the resolution of the input rasters utilized in this study, set at 30 m (MNT resolution). The input raster’s for the InVEST models are displayed in Table 2.

2.2.2. Economic Valuation Methods

In this study, we employ revealed preferences economic valuation methods as environmental economic approach. This category of methods relies on observed behaviors and utilizes techniques to deduce values indirectly from activities in proxy markets assumed to have a direct correlation with the studied ecosystem service [33].
A.
Market Price Method
The market price method is applicable when there exists an actual market for the goods or services under consideration. We utilize this method for market products at the local selling price, excluding operational, transportation, market, or processing costs [34,35].
B.
Damage Costs Avoided Method
The damage costs avoided method quantifies the expenses that would have been incurred if a specific environmental function were absent [35]. Onsite damages refer particularly to the potential degradation that could affect agricultural lands and rangelands.
For loss in agricultural yields, we convert soil losses into crop yield losses, using the relationship of Den Biggelaar et al. (2004) [36,37] (Equation (1)).
r = EwP1.224 * 0.0114
with:
-
r: Relative decrease in yield due to erosion (%).
-
EwP: Erosion rate (t/ha/year).
Subsequently, we calculate the decrease in yield as a percentage and multiply it by the average crop yield to determine the decline in yield in t/ha (2).
∆R = r * Average crop yield
with:
-
∆R: Relative decrease in yield due to erosion (t/ha);
-
r: Relative decrease in yield due to erosion (%).
For forage yield losses, we convert soil losses to forage yield losses using Table 3 [37].
Offsite damages refer to the impacts experienced by other components of the environment, particularly the loss of water resources due to siltation and a decline in water quality. For the calculation of the cost associated with the development of water resources lost to siltation, we rely on the national scale cost of developing water resources through dams, which ranges from USD 0.06 to 0.2/m3 [38]. This cost is then multiplied by the total quantity of sediment that would have been transported and resulted in the siltation of downstream dam reservoirs. To assess the cost linked to the loss of water quality, we adopt the cost of purifying drinking water sourced from the Hassan II dam in Midelt [39]. This cost is considered the expense for purifying water with a standard nutrient load (N and P). We estimate the avoided cost by calculating the reduction in this nutrient load. Assuming that the x% decrease in exported nutrients leads to an equivalent x% decrease in the cost of drinking water purification, we then multiply the revised water treatment cost by the surplus water volume in the INP watershed resulting from the sediment retention service.

3. Results

3.1. Land Use Dynamic in INP

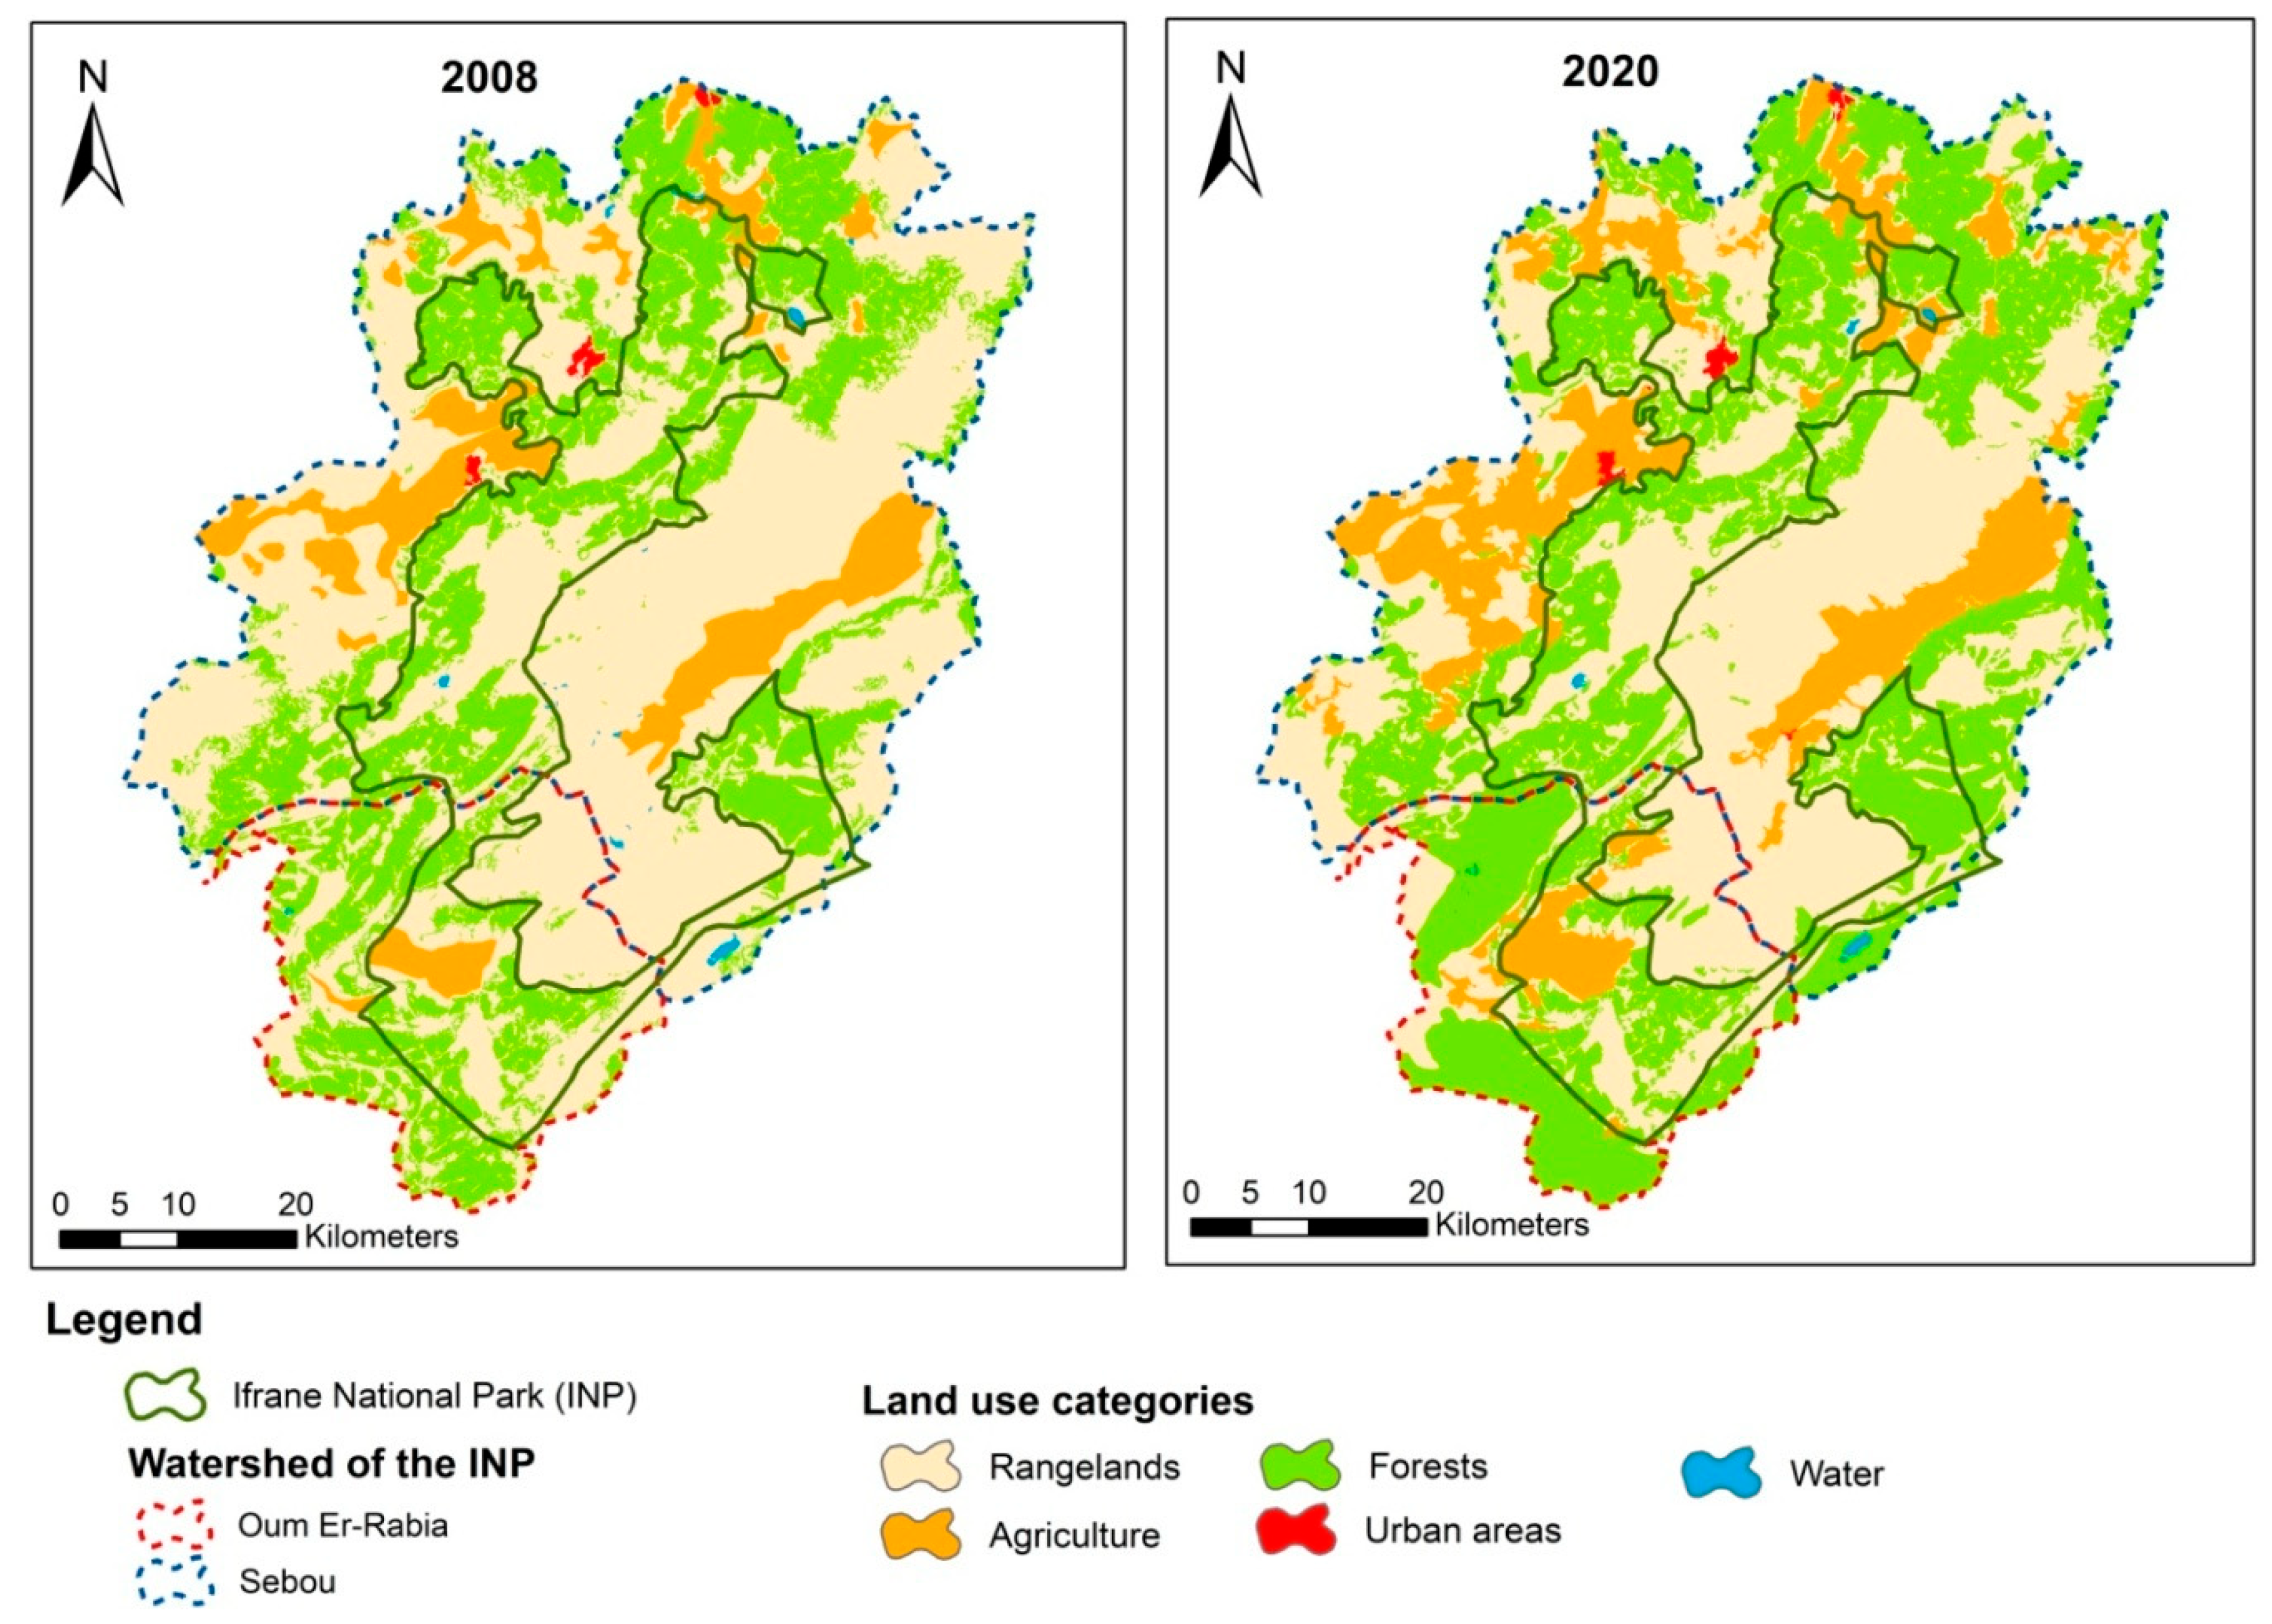
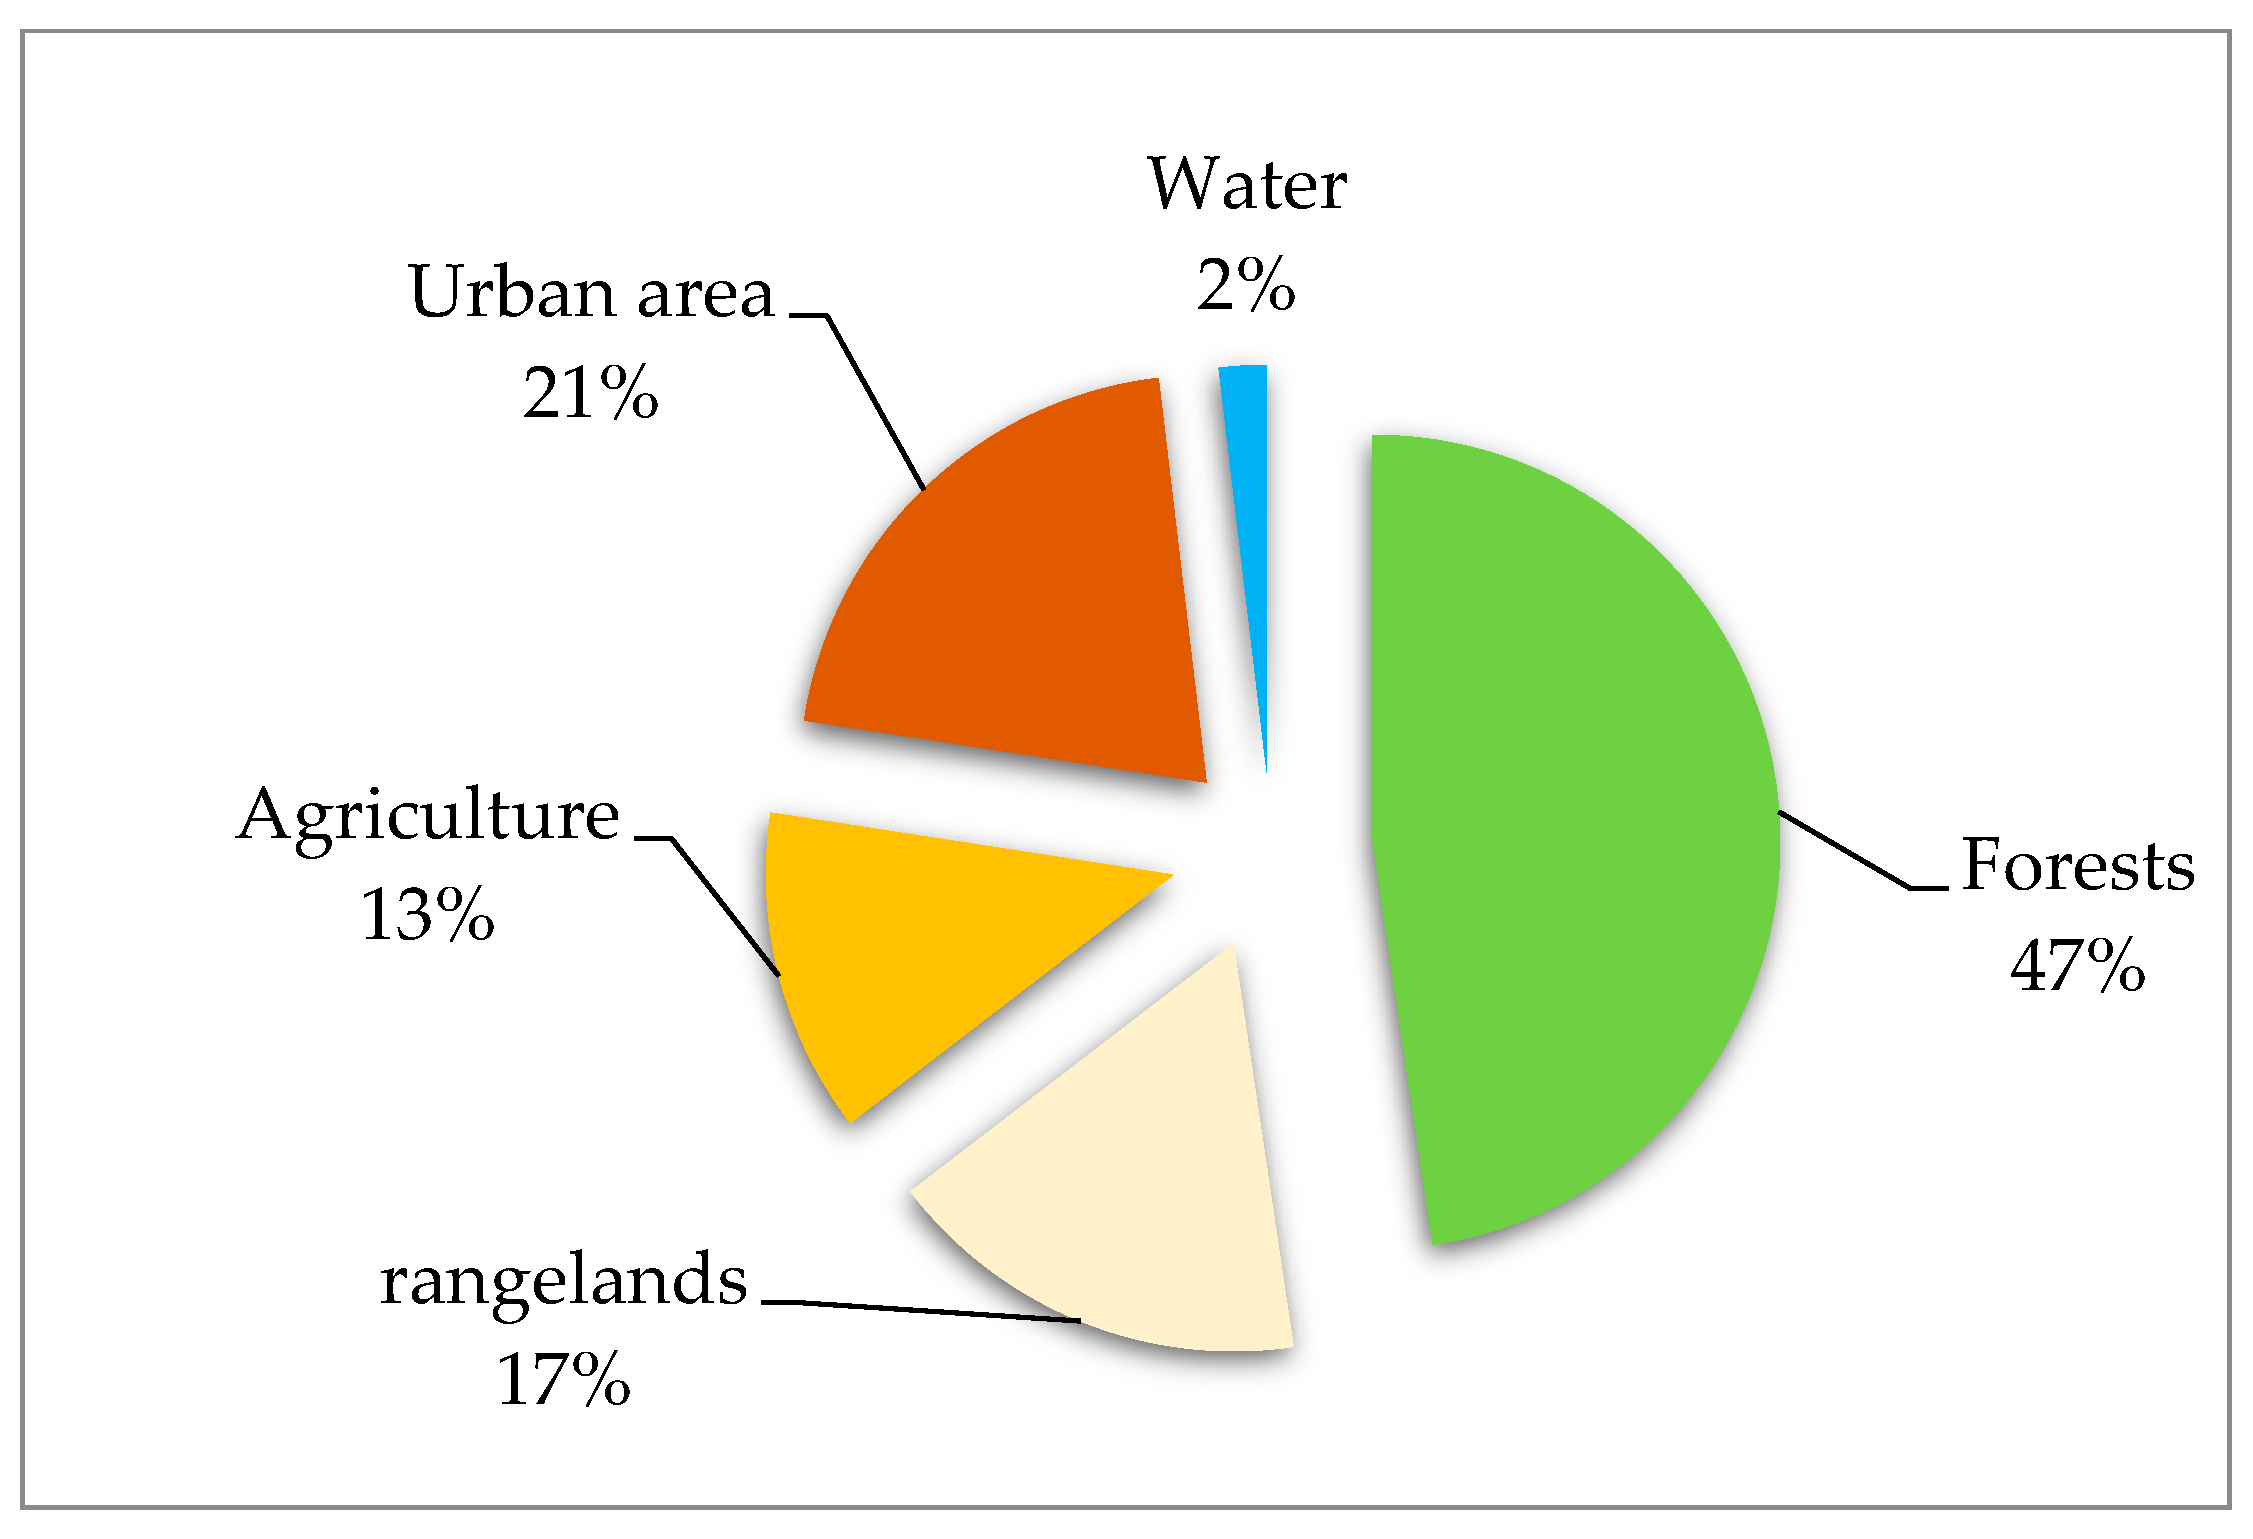
During the period 2008–2020, there was a 10% increase in forested areas and an 80% increase in agricultural land. On the other hand, there was an 18% decline in grazing land and a 2% decline in water bodies (Figure 2).

3.2. Economic Value of Sediment and Nutrient Retention

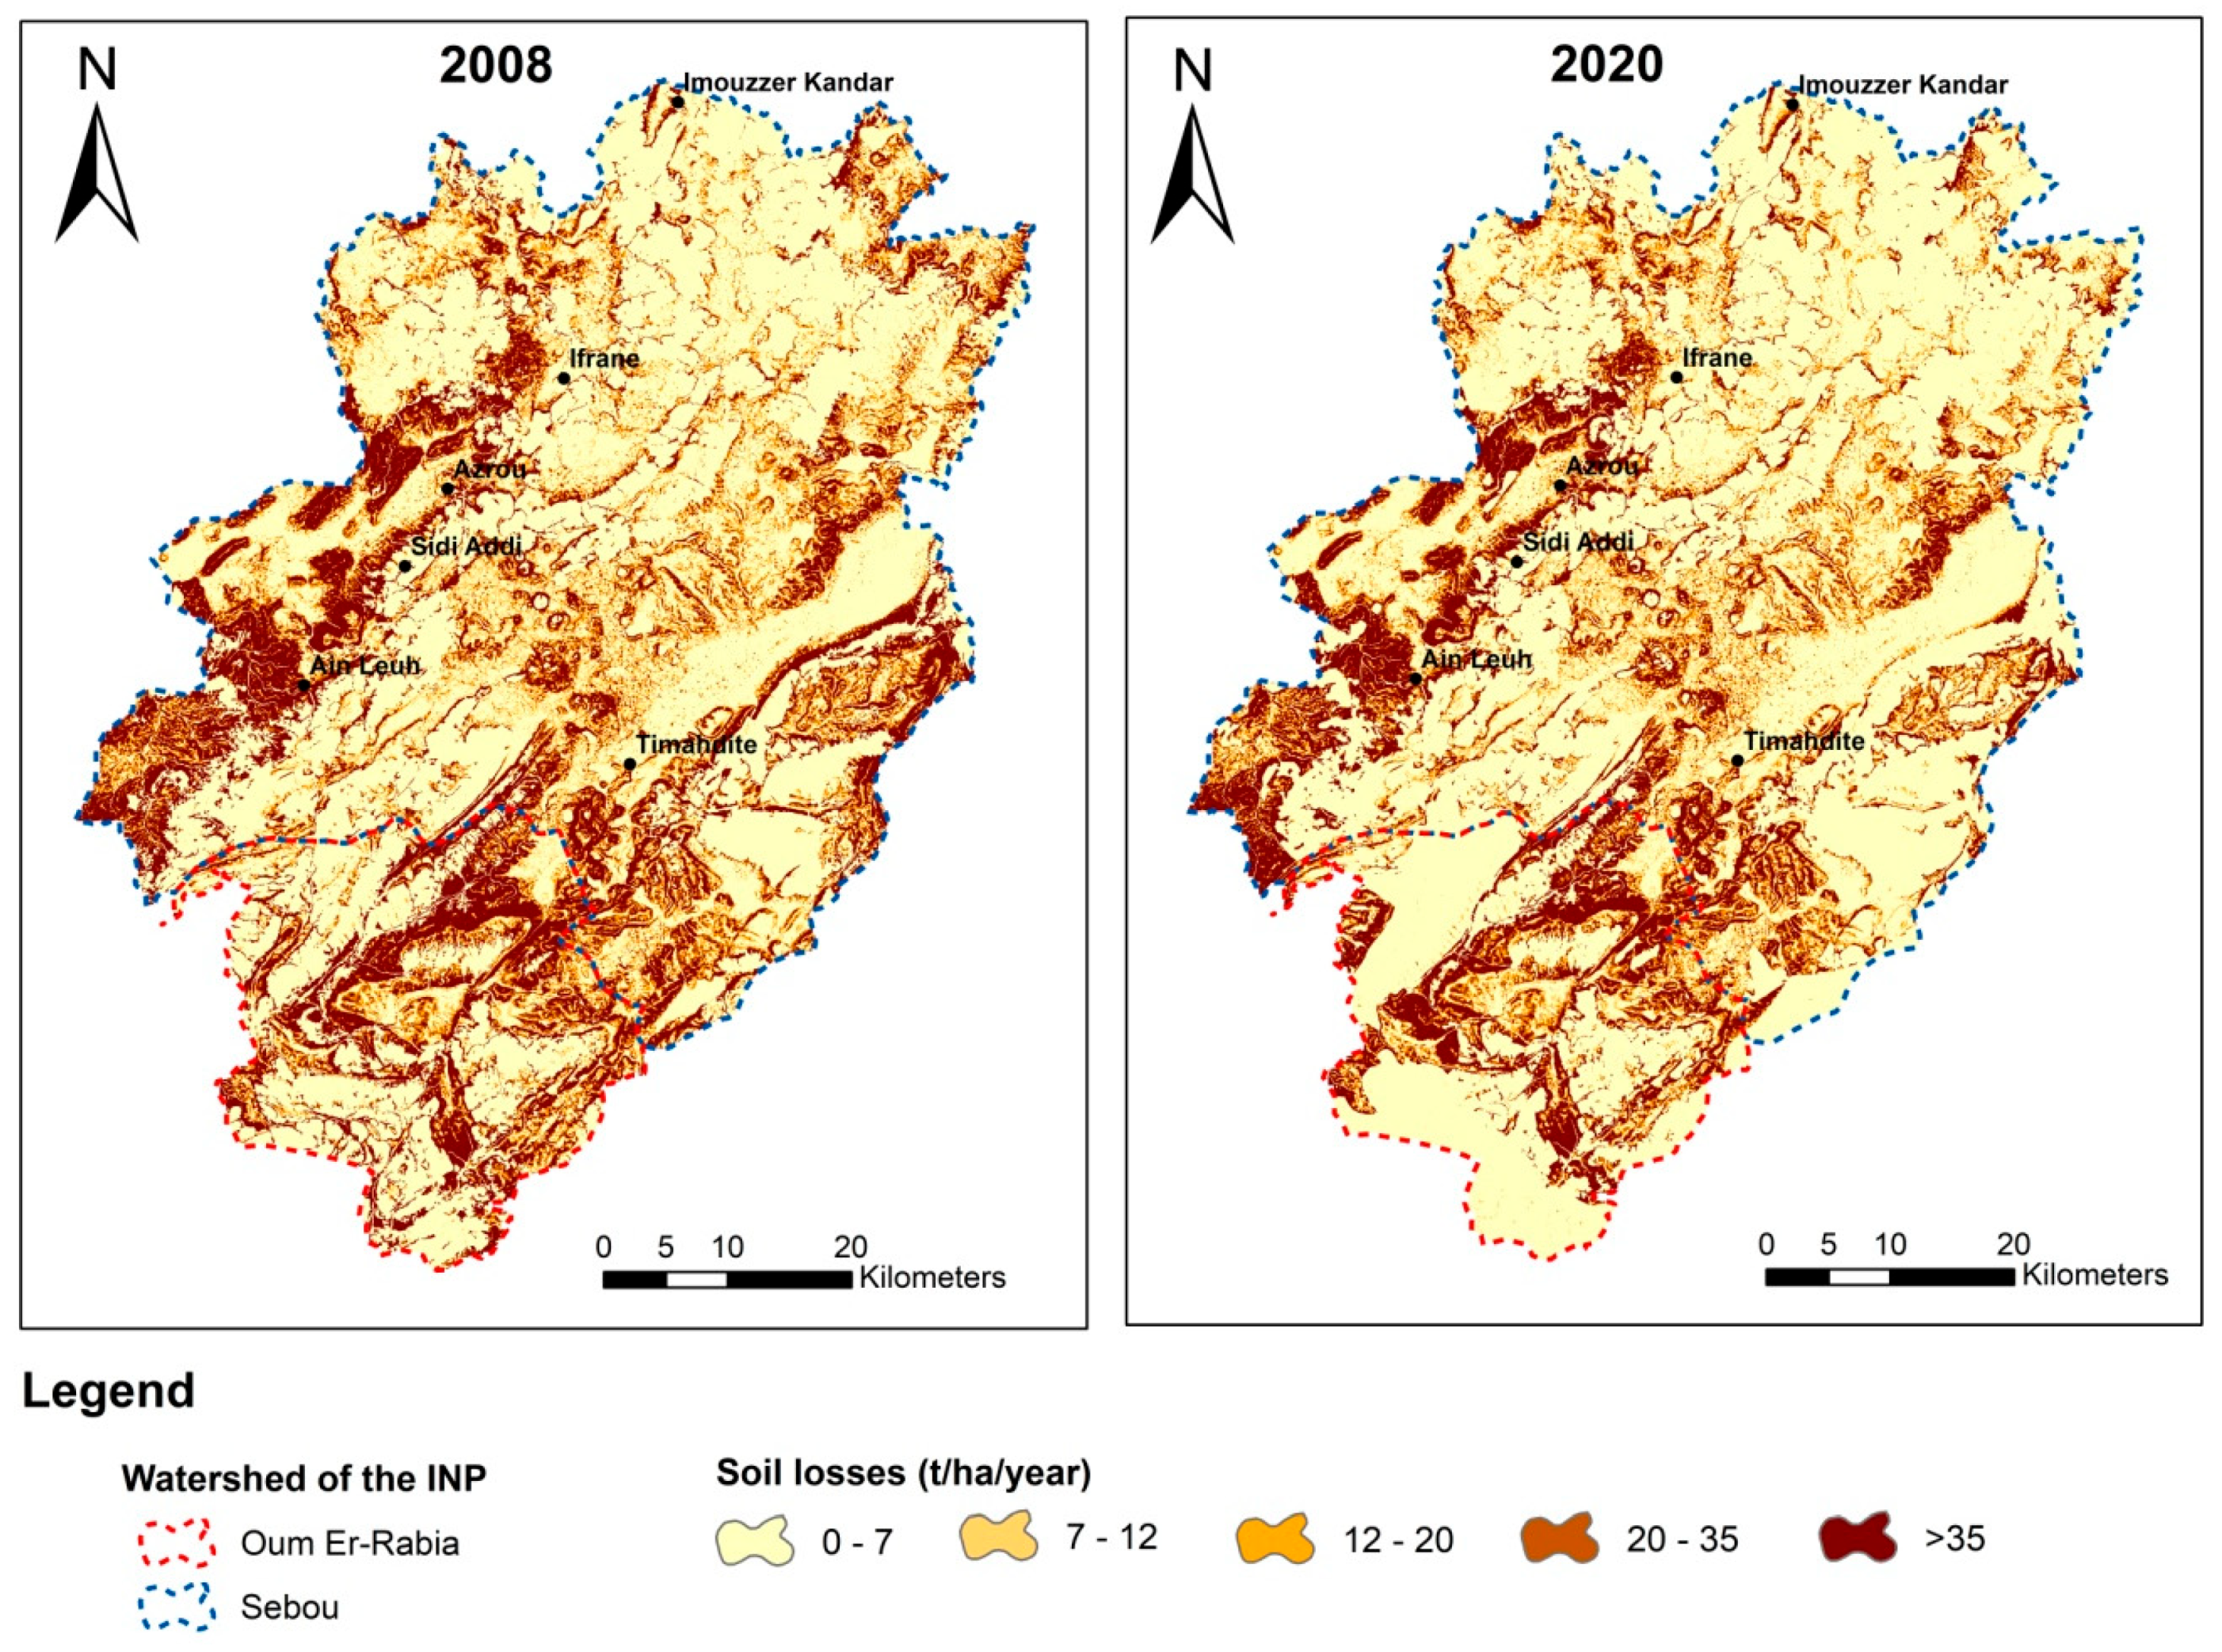
The SDR model gives the sediments lost as output (Figure 3) in tons per ha per year in the INP watershed in 2008 and 2020.
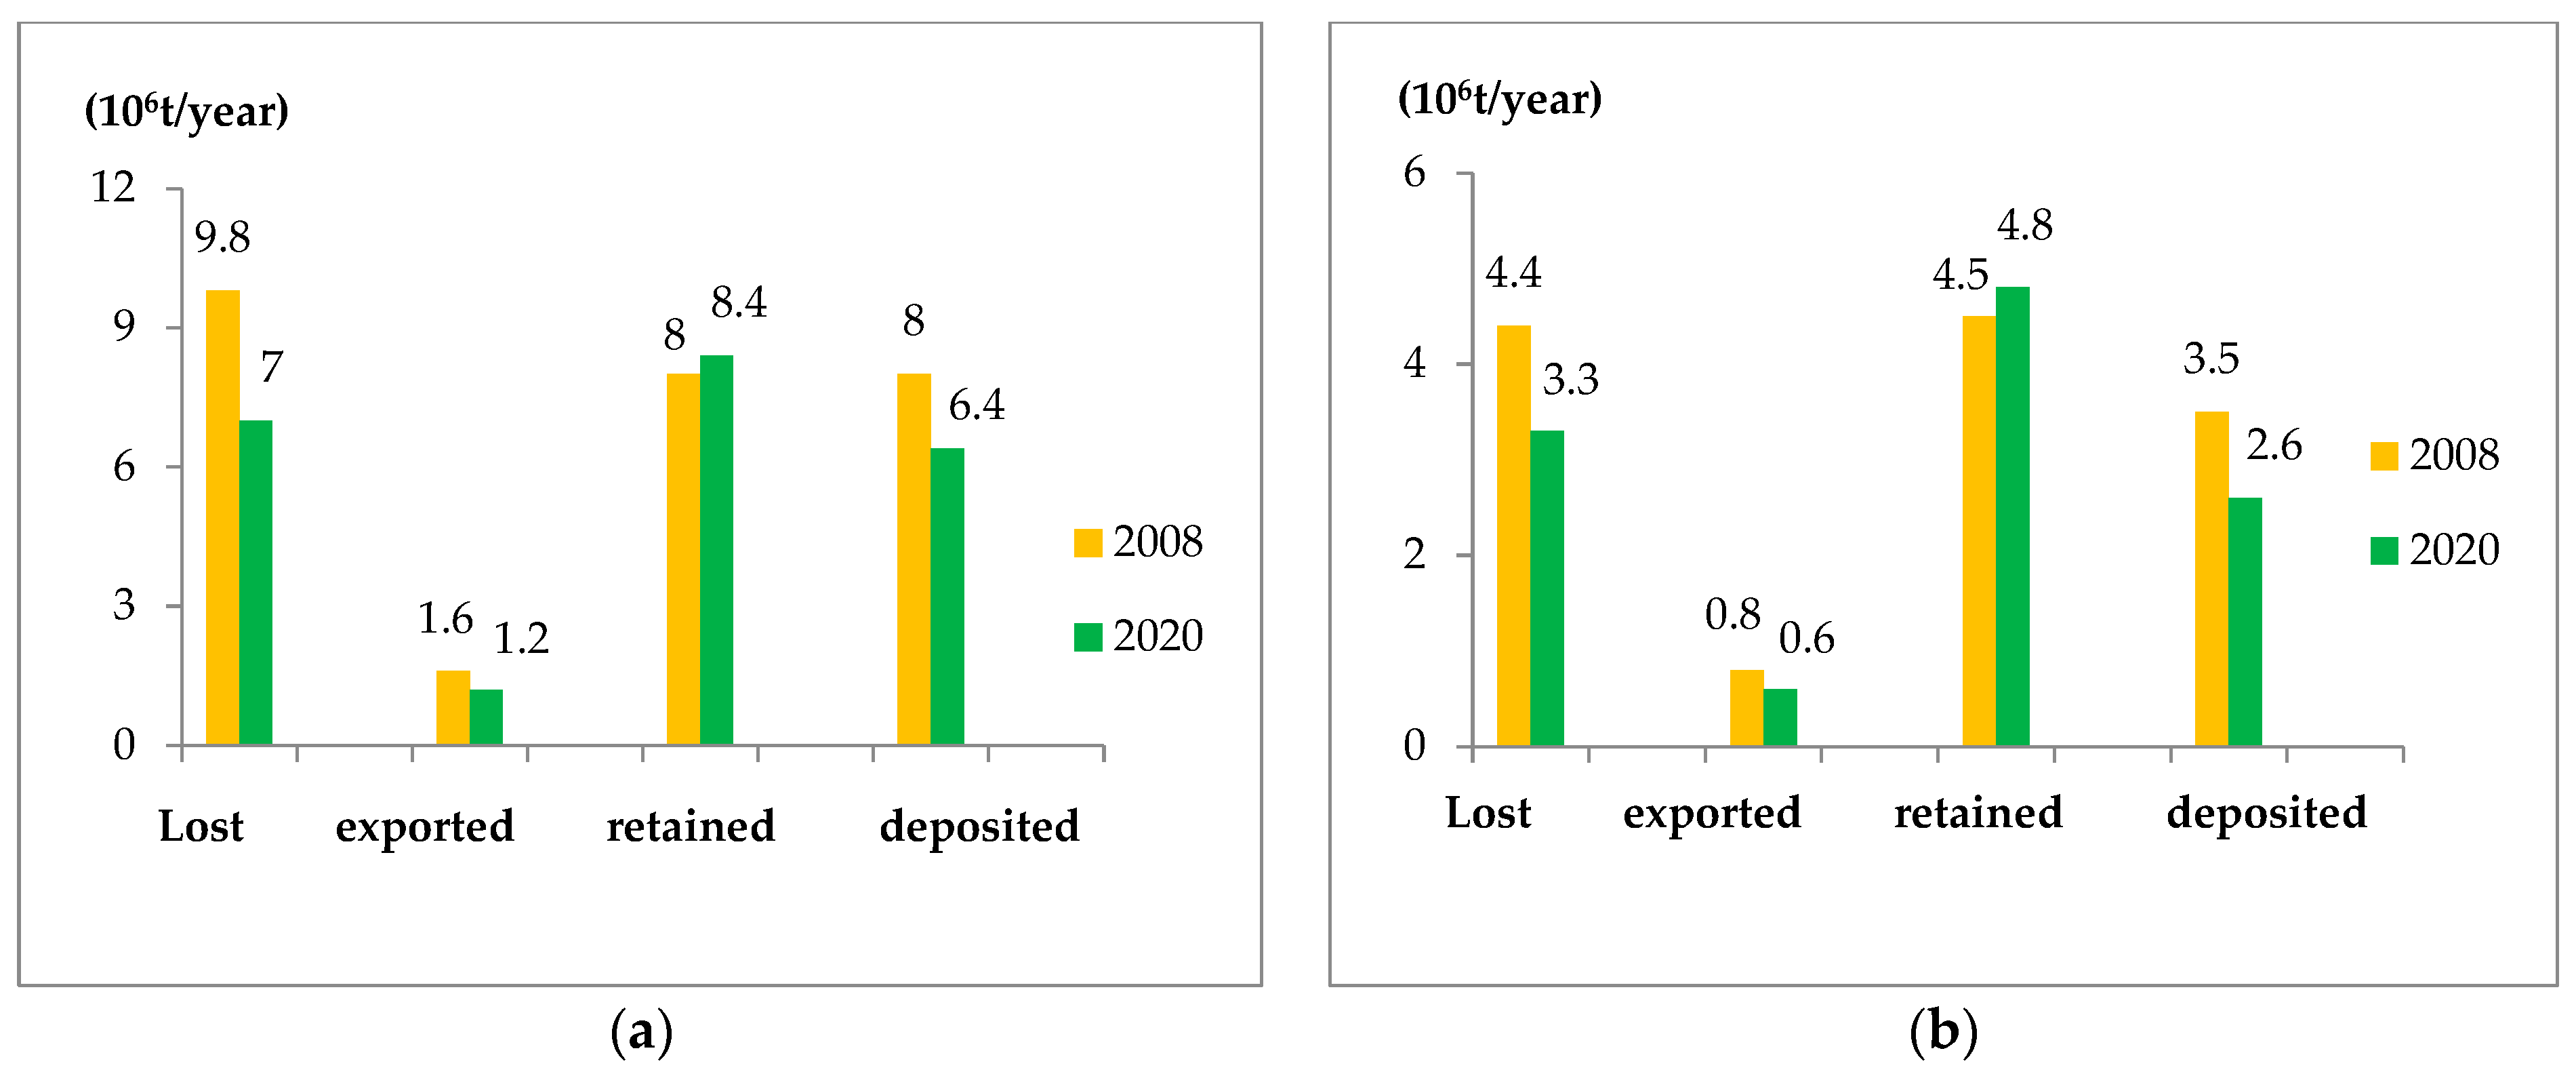
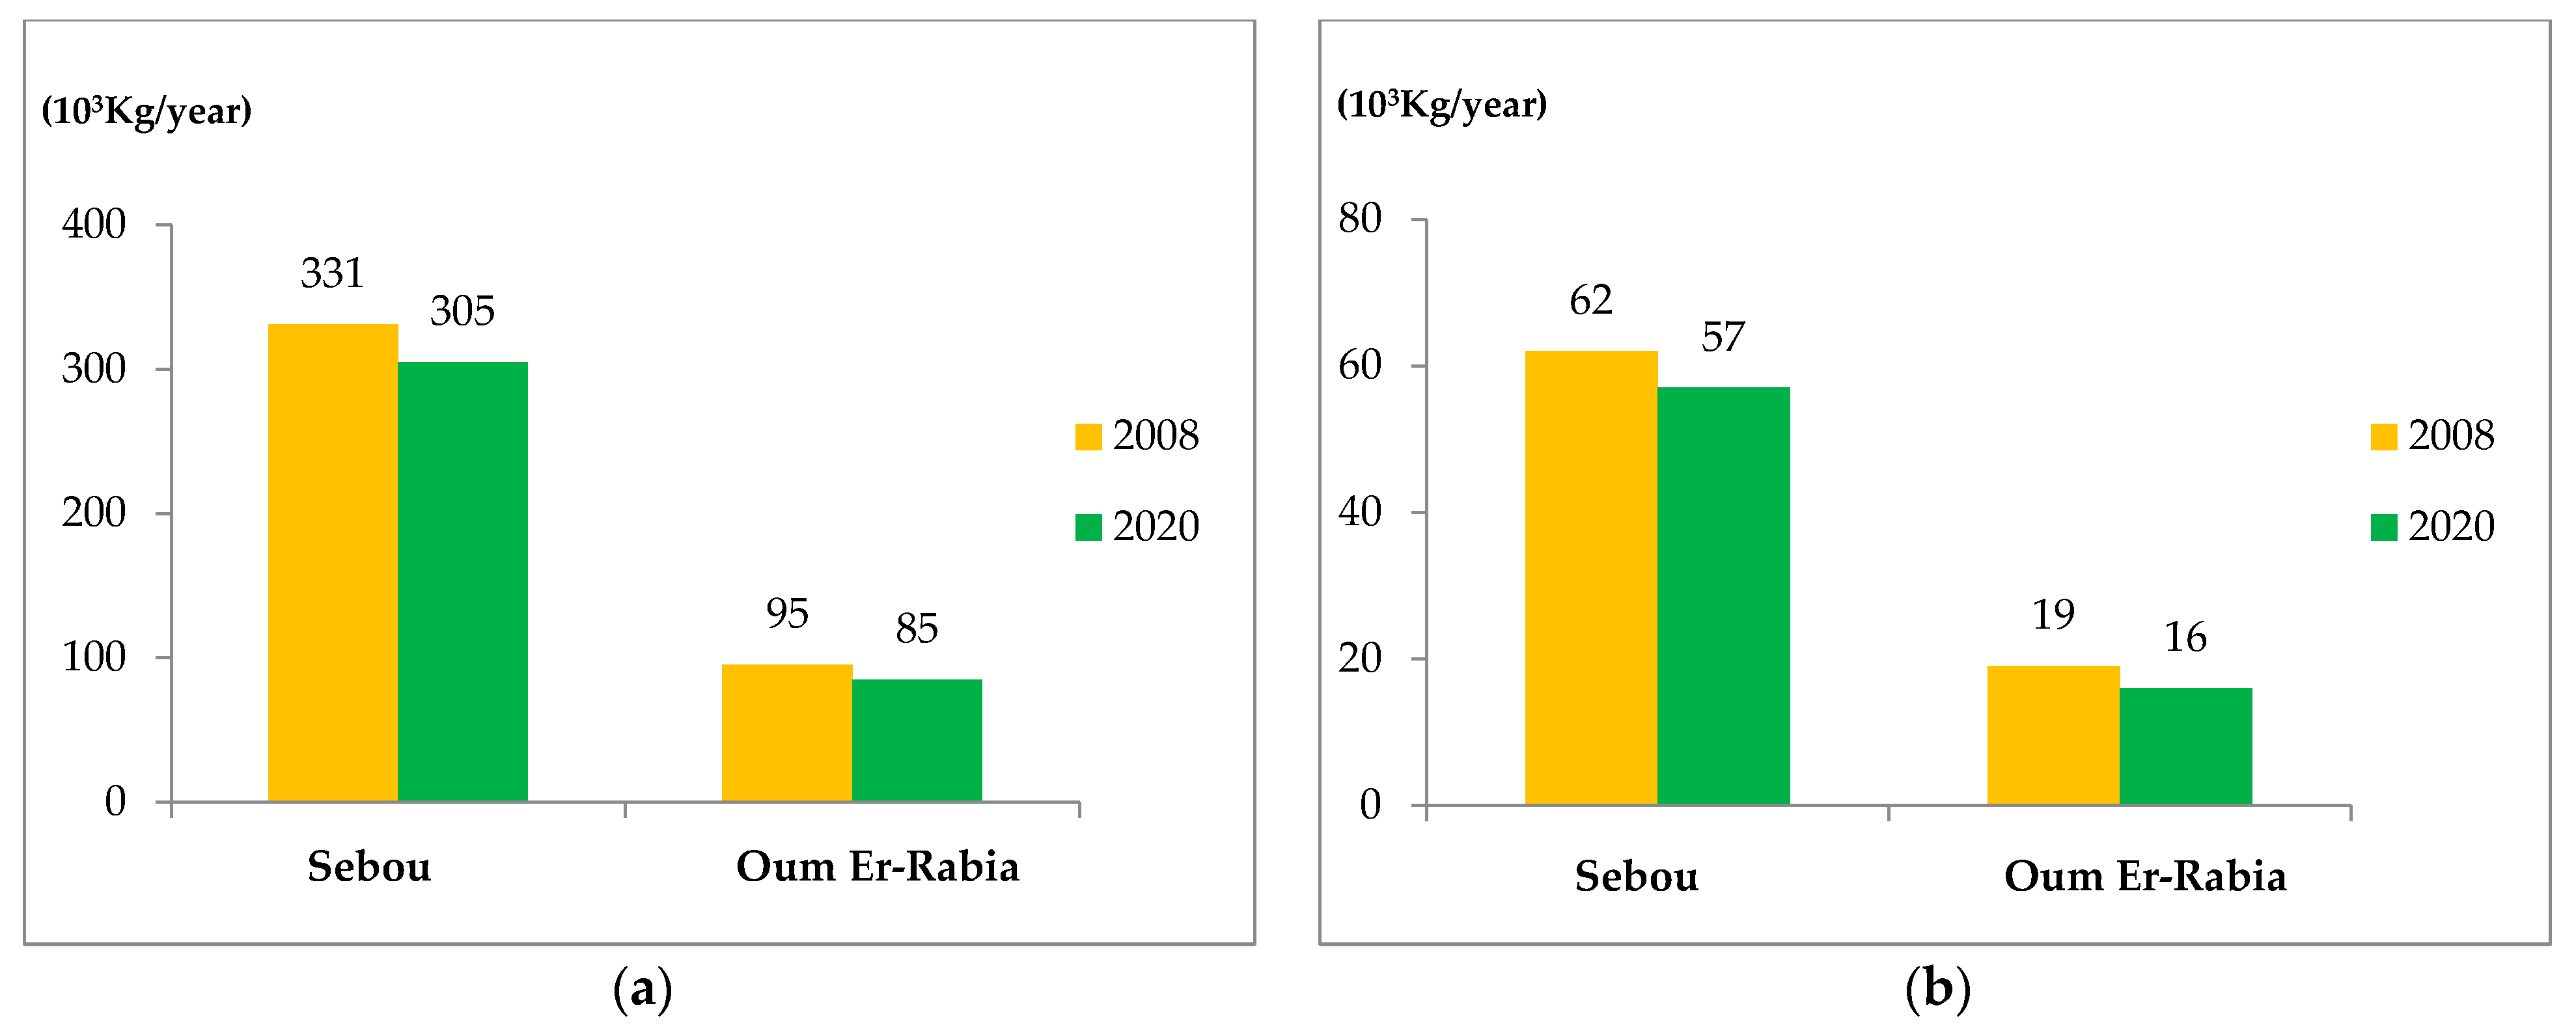
Quantification results from InVEST’s SDR model show that there is a decrease in sediment lost and exported between 2008 and 2020 (Figure 4).
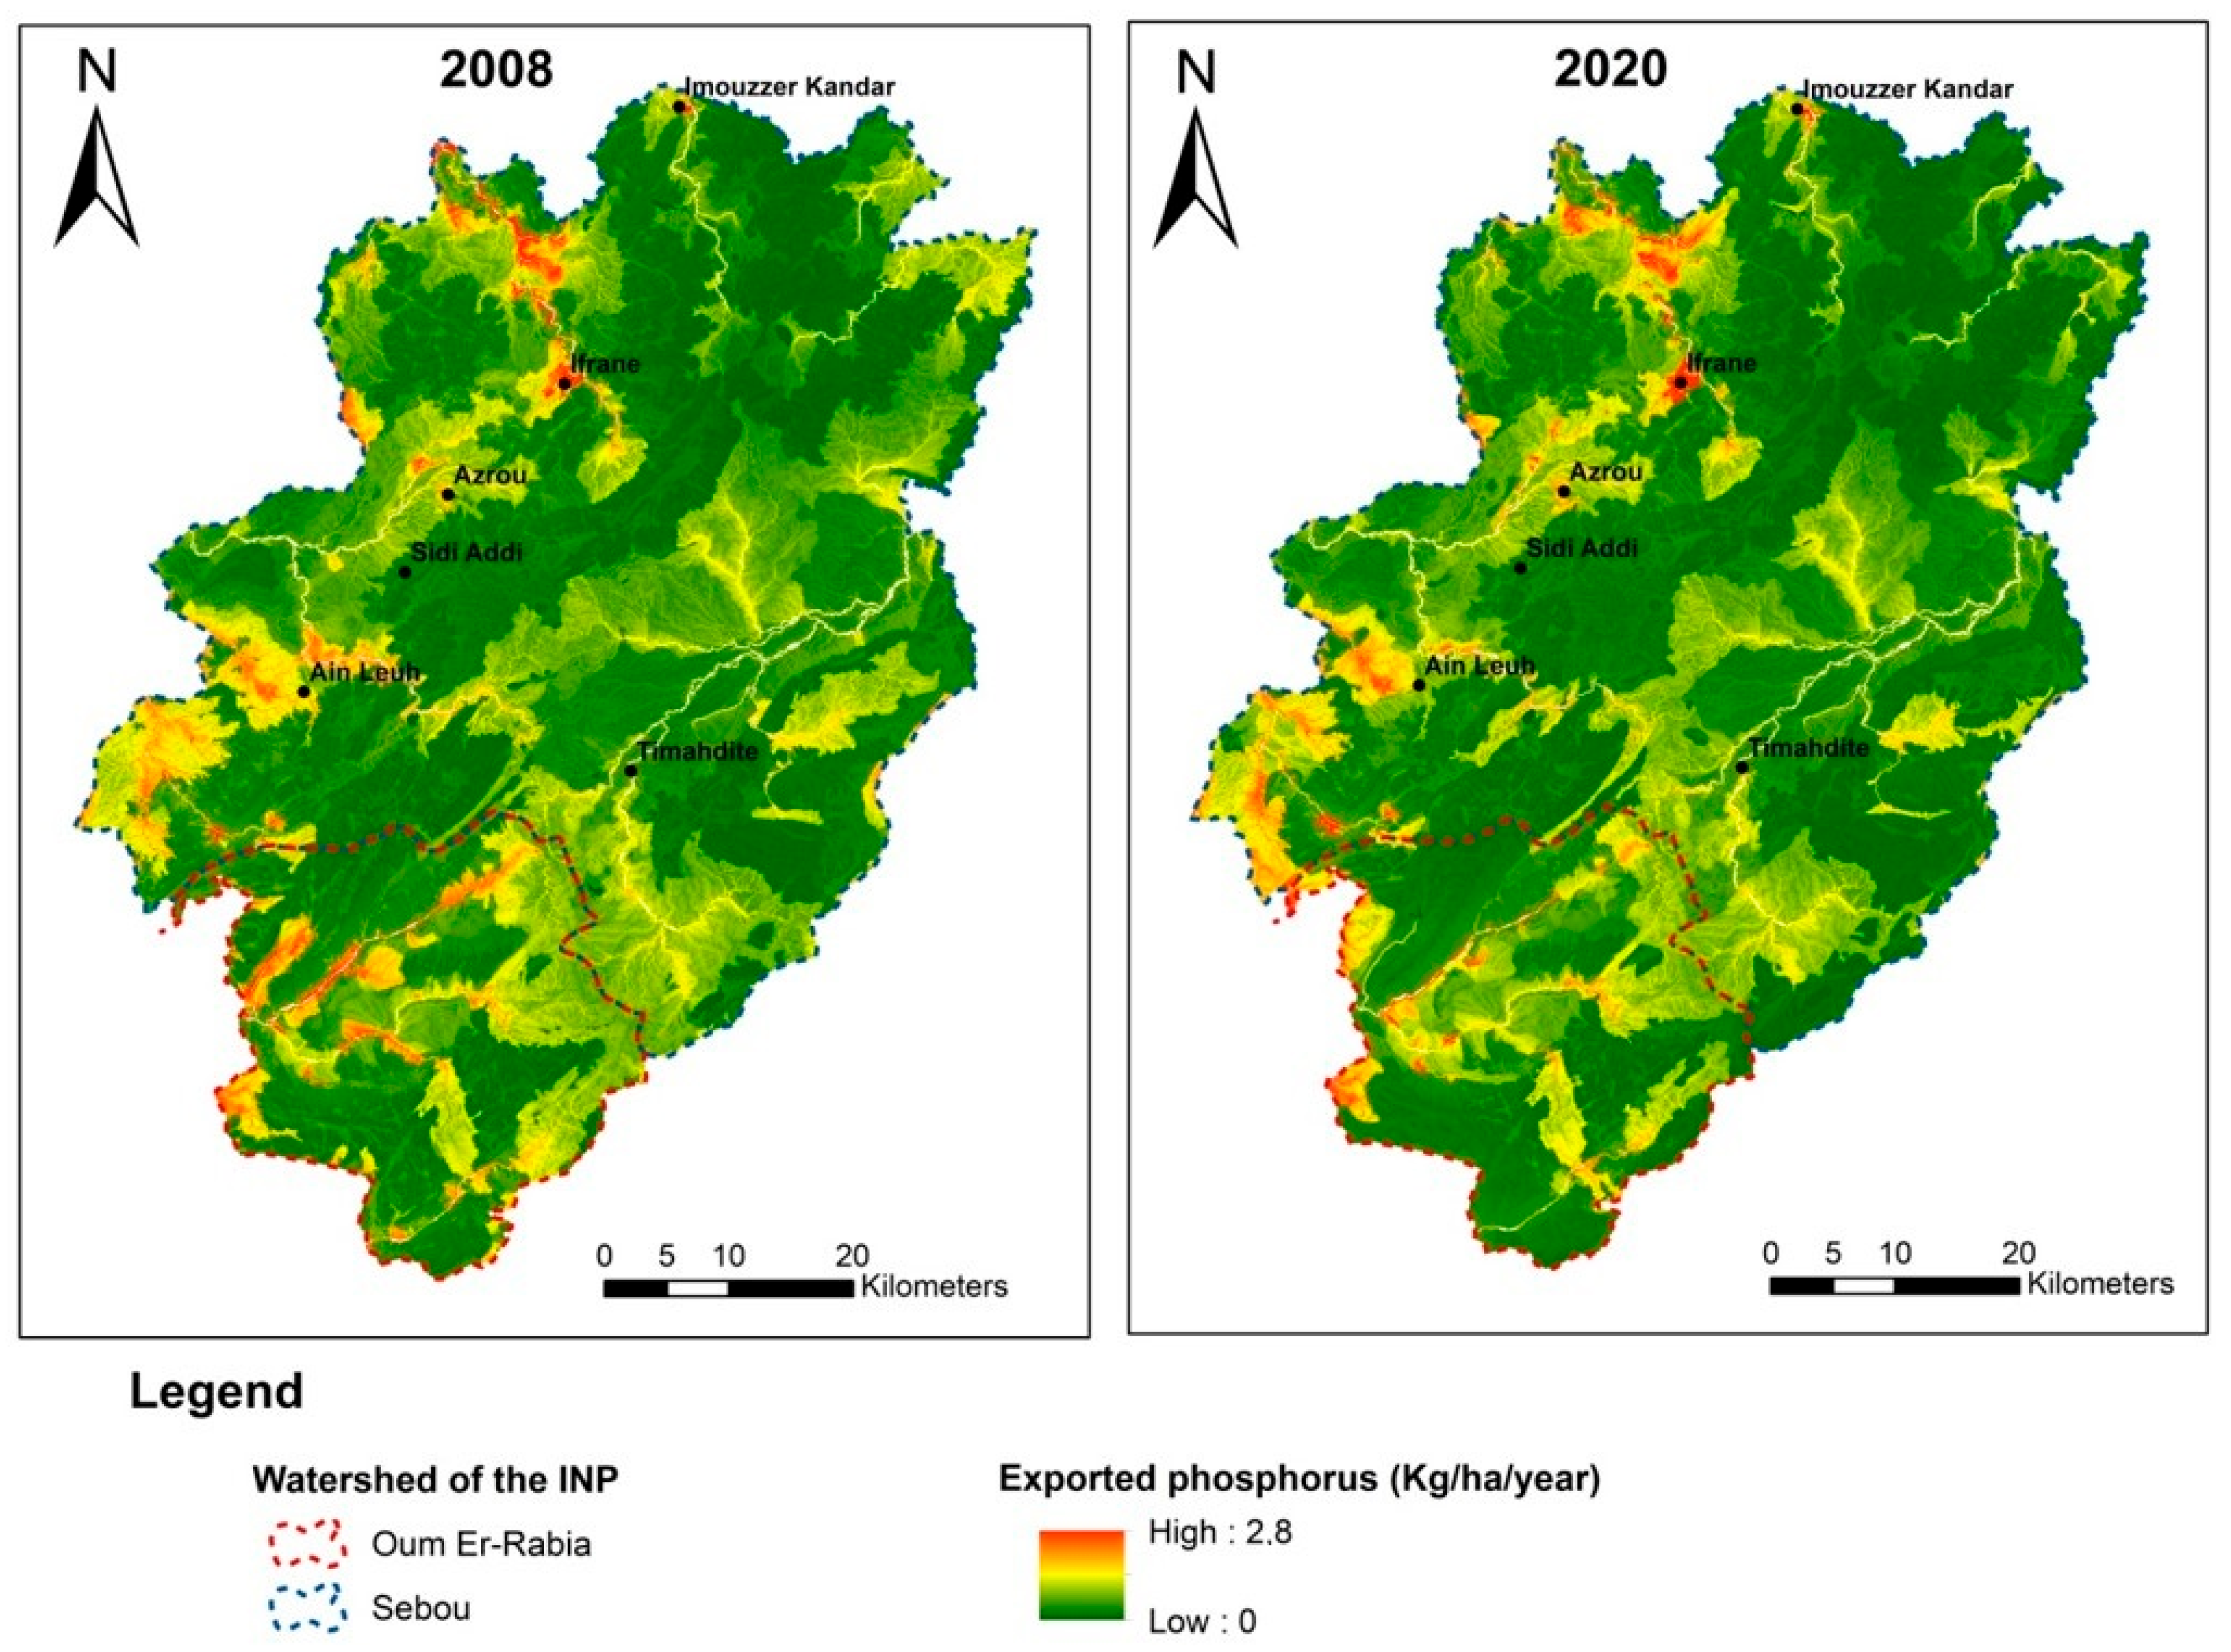
As for the NDR model, it gives the nutrients exported as output (nitrogen and phosphorus) in kilograms per ha per year in the INP watershed in 2008 and 2020 (Figure 5 and Figure 6).
Quantification results from InVEST’s NDR model show that there is a decrease in nutrient (N and P) exported between 2008 and 2020 (Figure 7).
The increase in vegetation cover—particularly forest cover, which retains a significant portion of the sediments (Figure 8), and therefore nutrients—results in the decrease in sediment and nutrient export.

Evaluation of On-Site Effects (Cost of Avoided Forage and Crop Yield Losses)

A.
Avoided loss of agricultural yields
The area of agricultural land in the INP watershed in 2008 was 40,137.3 ha; currently, it is 64,283.7 ha. Table 4 presents the agricultural areas by soil loss class.
Table 5 presents the losses in agricultural yields as a function of soil losses.
Erosion on agricultural lands in the INP watershed decreased between 2008 and 2020. However, it causes an annual loss of agricultural yields worth USD 3201/year. Indeed, even though soil losses have decreased between 2008 and 2020 due to the increase in vegetation cover, the damage due to erosion in 2020 is more significant. This is due to the increase in agricultural area (+80%), which has gone from 4826 ha in 2008 to 8675 ha in 2020, generating additional costs. The larger the agricultural area, the greater the agricultural yields lost to erosion and the lower the value of sediment retention on agricultural land. The value of the sediment retention service of agricultural lands is USD −3200.6/year.
B.
Avoided loss in forage yields
The forage supply in the non-forest rangelands in the area is 131.7 FU/ha/year. The price of a forage unit is USD 0.36 (price of the substitute product: 1 Kg of barley) [40].
The area of rangeland in the INP watershed in 2008 was 249,998 ha; currently, it is 193,665 ha, the distribution of this area by soil loss class is as follows (Table 6).
Table 7 presents forage yield losses as a function of soil losses.
The impact of erosion on rangelands has demonstrated a decrease from 2008 to 2020, resulting in a reduction of 30,525.7 USD per year. This decline can be attributed to the decrease in pastoral area from 54,680 ha in 2008 to 44,596 ha in 2020, coupled with a concurrent reduction in soil losses during the same period, thereby contributing to mitigating forage yield losses. The assessed value of the protection service provided by rangelands against erosion is USD +30,525.7 per year.
C.
Assessment of offsite effects
Offsite effects refer to losses associated with sediment exportation from upstream to dam reservoirs downstream. Assuming that all sediment from the INP watershed reaches these dams and equates to the volume of water lost, we utilize the amount of exported sediment between 2008 and 2020 to assign a monetary value to the sediment retention service offered by the park. This valuation accounts for the loss of dam reservoir storage capacity and the costs avoided in water treatment.
D.
Water Quality Loss
To estimate the cost of water quality loss, we adopted the purification cost of the Hassan 2 dam in Midelt, set at 0.17 USD/m3. This cost is considered representative of normal sediment concentrations. With nutrient exports decreasing by 9% between 2008 and 2020, we assume a proportional 9% decrease in purification costs, resulting in a new cost of USD 0.16/m3. The value of the nutrient retention service is therefore USD 0.01/m3. By multiplying this value by the surplus volume of drinking water in the INP watershed, representing 9% of the surplus volume (as per Water Basin Agency data), which is 46,576 m3/year, the nutrient retention service is assessed at USD +465.7 per year.
E.
Evaluation of Mobilizing Water Lost through Siltation Cost
The average price of water mobilization ranges from USD 0.06 to 0.2/m3. By multiplying this price by the volume of water (518,103 m3/year) that would have been lost due to siltation of the downstream dam reservoir, the cost of mobilizing this water is calculated at USD −67,340 per year.
Table 8 presents the annual cost of losses by erosion in the INP watershed.
The value of the sediment retention service provided by the INP is USD +94,665.1/year. As for the value of the nutrient retention service, it is equal to the cost of the loss in water quality avoided, it is USD +465.7/year.

3.3. Economic Value of Water Yield

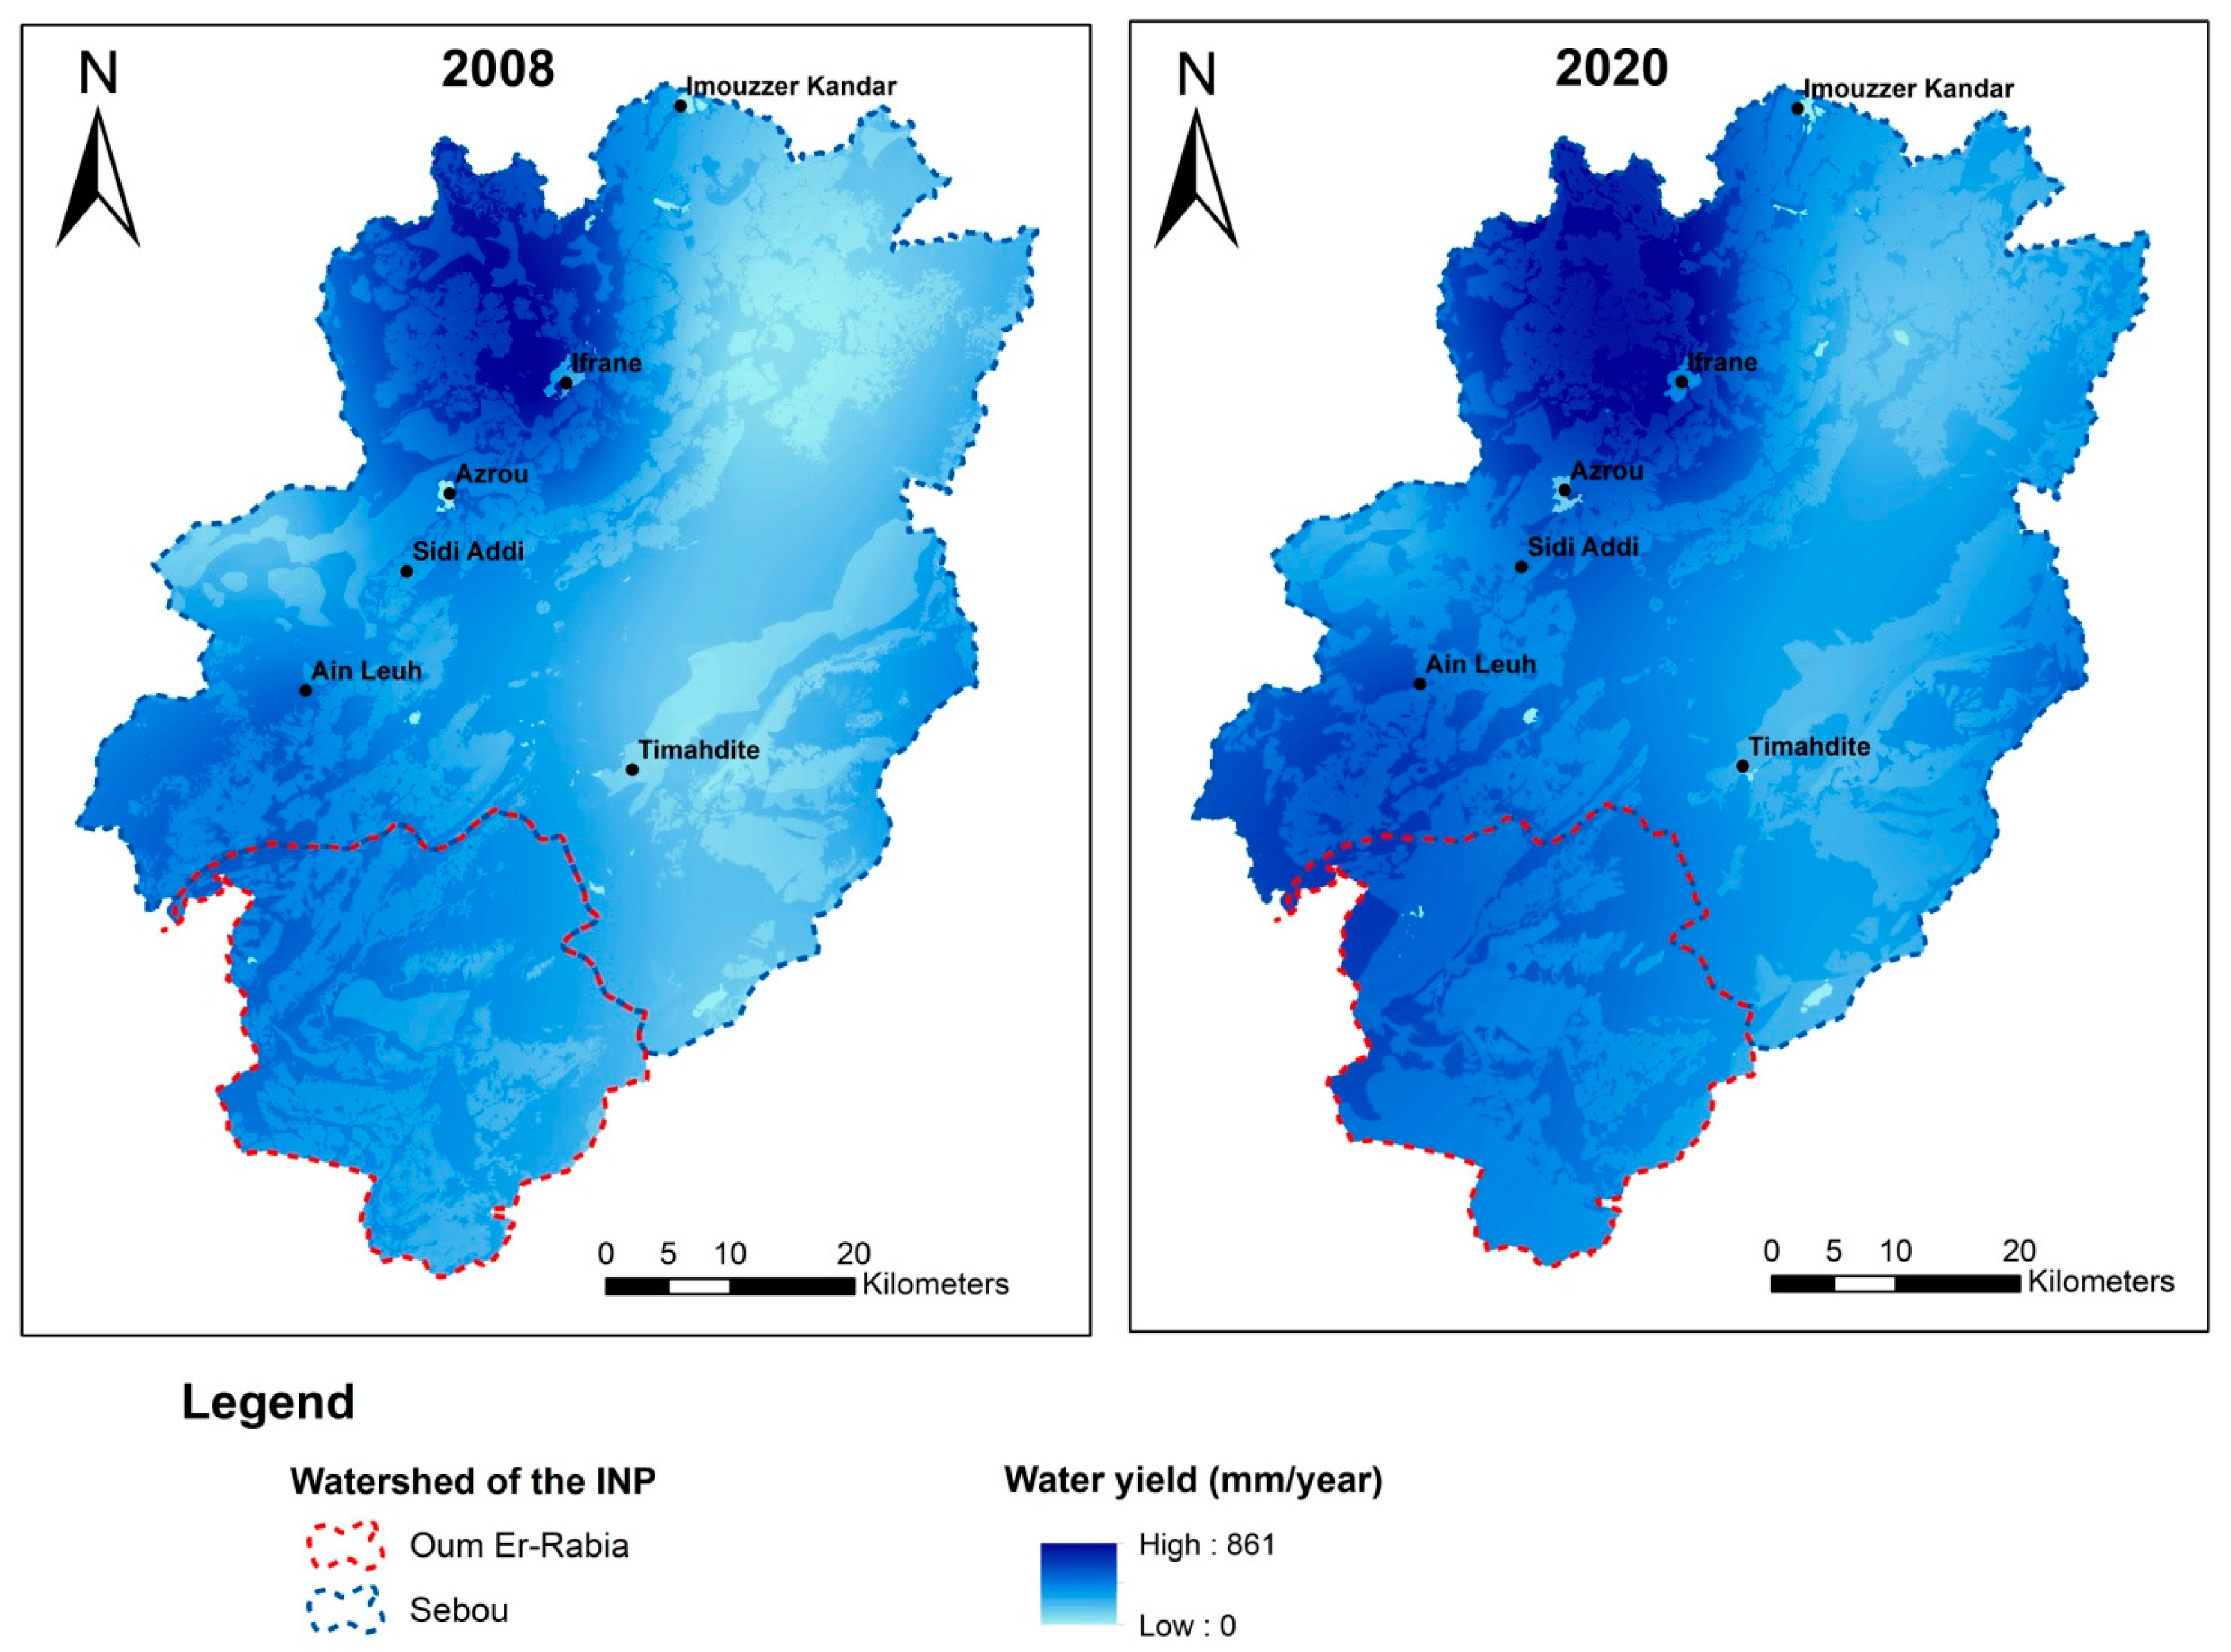
The WY model gives the water yield in millimeters per year as output in the INP watershed in 2008 and 2020 (Figure 9).
The water yield decreased between 2008 and 2020, with a volume of 49 Mm3/year (Figure 10).
The valuation of the water yield service relies on the cost of irrigation water, as it does not undergo treatment and represents the net price exclusive of intermediate costs. The water basin agency’s selling price for irrigation water stands at 0.002 USD/m3 [41]. Consequently, the reduction in the value of water yield, using this pricing, amounts to USD −98,000 per year. This decline is attributed to the expansion of agriculture.

4. Discussion

This study presents a comprehensive assessment of the changes in biophysical quantities and economic values of HES within the INP since its expansion. The findings reveal the significance of HES, which unfortunately experiences regression due to anthropogenic activities. Land use dynamics between 2008 and 2020 served as a foundational investigation prior to delving into the examination of HES evolution within the park. This analysis, fundamental to the various InVEST models, illuminated noteworthy trends in different land categories.
Between 2008 and 2020, forest fires have decreased [42] thanks to proactive alert processes, swift intervention measures, and reduced herbaceous cover due to controlled grazing. Additionally, forested areas increased from 9911 hectares in 2008 to 11,992 hectares in 2020 through reforestation activities [43]. Moreover, the rise in silvopastoral management associations and the introduction of a compensation mechanism have led to a 50% reduction in forest crimes within the park, decreasing from 1209 in 2008 to 549 in 2020 [44]. These trends have positively influenced both reforestation efforts and natural regeneration within fenced perimeters, contributing to an expansion in forested areas. However, agricultural land increased at the expense of rangelands, notably collective rangelands transformed into cultivated areas. This transformation resulted from the sharing, privatization, and individual development of collective spaces, often dedicated to high value crops [45]. Although agricultural expansion leads to superficial soil degradation in the medium and long term [46]. Additionally, the traditional water abstraction system competes with unregulated pumping, exacerbating groundwater depletion issues and contributing to the drying up of downstream lakes, which are vital groundwater sources [47].
The results of this research also confirm the negative impact of expansion of agriculture which is the primary catalyst for the reduction in water yield. This reduction initiates a notable surge in evapotranspiration, particularly transpiration due to elevated cultural coefficient. In contrast, forest cover characterized by its ability to improve infiltration, plays a pivotal role in regulating water dynamics. The leaves and branches of trees serve as natural barriers, attenuating rain intensity and moderating its impact, thereby facilitating enhanced water infiltration into the soil [48]. The presence of abundant forest correlates with reduced runoff, leading to a consequential increase in water storage within reservoirs including soil and groundwater. A noteworthy aspect is the cyclical process wherein part of the stored water is reintroduced to the atmosphere through evapotranspiration, primarily driven by growth activities—a phenomenon known as green water, derived from biomass. Simultaneously, another portion of the stored water follows a gradual course, reaching the watershed’s outlet one to two months after precipitation events [49]. This intricate interplay highlights the crucial role of land cover, particularly the contrast between agricultural expanses and forested areas, in influencing water yield, distribution, and storage dynamics within the ecosystem.
In order to enhance the provision of hydrologic ecosystem services, several strategic recommendations are proposed. Currently, numerous farmers and agropastoralists are forsaking several advantageous ancestral practices. It is imperative to underscore the need for optimizing and advocating the adoption of these traditional and sustainable practices. They not only optimize water and soil usage but also are well adapted to the specific conditions of the region. This necessitates a concerted collaboration with local communities to integrate these time-tested methods into their agricultural activities.
A second key recommendation involves mitigating the escalating strain on forest resources by diversifying income streams for local communities. This necessitates the design and implementation of revenue-generating ventures that not only offer sustainable economic alternatives but also contribute to alleviating the overall burden on forests. Exploring avenues to leverage payments for ecosystem services to compensate forest users who exert pressure on the forest should also be given due consideration. This approach holds the potential to incentivize sustainable practices while simultaneously providing financial support to those affected by conservation measures.
Moreover, it is crucial to consider the development of a park charter specifically focused on safeguarding natural resources, particularly water resources. Such a charter would empower park managers to prohibit any activities that pose a threat to these invaluable resources. Furthermore, it is essential to address the issues arising from the privatization of grazing lands and the intensification of agricultural activities.
This can be accomplished by reinforcing law enforcement measures within the park, guaranteeing the rigorous enforcement of environmental laws. Through the prevention of illegal exploitation, these measures play a vital role in safeguarding forest resources and maintaining the overall health of the ecosystem.
Finally, a priority should be placed on ecological restoration as a fundamental approach to improve hydrologic ecosystem services. The results of the study highlight the positive impact of restoring degraded forest ecosystems on hydrologic ecosystem services. Therefore, initiating and supporting restoration projects becomes crucial in alleviating pressure on existing resources and promoting the sustainable health of the ecosystem.

5. Conclusions

This paper presents an overview of the changes in biophysical quantities and economic values of HES in the INP since its expansion. The findings emphasize the often-underestimated significance of these non-market services. The analysis of land use dynamics from 2008 to 2020 revealed that the expansion of agricultural land at the expense of rangelands had a detrimental impact on HES. The research discloses an annual decrease in the economic value of HES by USD 4000. This economic assessment serves as a compelling tool to educate and convince policymakers and park users about the critical importance of preserving natural ecosystems and using water resources prudently. It also underscores the necessity of investing in conservation and restoration within protected areas to sustain these HES.

Author Contributions

Conceptualization, O.S. and A.K.; Data curation, O.S., Formal Analysis, O.S. and A.K.; Investigation, O.S.; Methodology, O.S. and A.K.; Resources, A.K.; Software, O.S.; Supervision, A.K.; Validation, A.K.; Writing—original draft, O.S.; Writing—review and editing, O.S. and A.K. All the authors discussed the results of the manuscript. All authors have read and agreed to the published version of the manuscript.

Funding

This research received no external funding.

Institutional Review Board Statement

Not applicable.

Informed Consent Statement

Not applicable.

Data Availability Statement

The data presented in this study are available in the article.

Conflicts of Interest

The authors declare no conflicts of interest or state.

Appendix A. InVEST Model Inputs

  • InVEST models input rasters.
Figure A1. Land use map of the INP watershed in 2008 and 2020.
Sustainability 16 08800 g0a1
Figure A2. InVEST models input rasters: precipitation (a), evapotranspiration (b), digital elevation model (c), erosivity (d), soil erodibility (e), roots depth (f), and plants’ available water content (g).
Sustainability 16 08800 g0a2
Table A1. Biophysical Table of the Sediment Delivery Ratio (SDR) model.
LULC_descLucodeUsle_cUsle_p
Rangelands111
Forests20.0031
Agriculture30.191
Urban areas40.11
Water50.041
With:
-
usle_c: Cover management factor for the USLE;
-
usle_p: Support practice factor for the USLE.
Table A2. Biophysical table of the Nutrient Delivery Ratio (NDR) model.
LULC_desclucodeLoad_nEff_nLoad_pEff_pcrit_len_pcrit_len_n
Rangelands14.840.3050.2920.25150150
Forests22.890.80.070.74150150
Agriculture37.40.691.3050.59150150
Urban areas411.860.432.550.02150150
water500.0600.61150150
With:
-
load_[NUTRIENT]: The nutrient loading for this land use class;
-
eff_[NUTRIENT]: The maximum proportion of the nutrient that is retained on this land use class;
-
crit_len_[NUTRIENT]: The distance after which it is assumed that this land use type retains the nutrient at its maximum capacity;
-
InVEST’s “Water yield” model.
Table A3. Biophysical table of the annual water yield (AWY) model.
LULC_desclucodeLULC_vegRoot_depth (mm)Kc
Rangelands118300.36
Forests2140001
Agriculture3114731.12
Urban areas4010000.4
Water5011
With:
-
Lulc_veg: Code indicating whether the land use class is vegetated for the purpose of AET;
-
root_depth: Maximum root depth for plants in this land use class;
-
Kc: Crop coefficient for this land use class. Used to calculate potential evapotranspiration to modify the reference evapotranspiration.

References

  1. John, C.M. Biodiversity Conservation Through Protected Areas Supports Healthy Ecosystems and Resilience to Climate Change and Other Disturbances. Imperiled Encycl. Conserv. 2022, 423–429. [Google Scholar]
  2. Chape, S.; Spalding, M.; Jenkins, M. (Eds.) The World’s Protected Areas: Status, Values and Prospects in the 21st Century; Universidad de Castilla La Mancha: Ciudad Real, Spain, 2008. [Google Scholar]
  3. Brauman, K.A.; Daily, G.C.; Duarte, T.K.E.; Mooney, H.A. The nature and value of ecosystem services: An overview highlighting hydrologic services. Annu. Rev. Environ. Resour 2007, 32, 67–98. [Google Scholar] [CrossRef]
  4. Abell, R.; Allan, J.D.; Lehner, B. Unlocking the potential of protected areas for freshwaters. Biol. Conserv. 2007, 134, 48–63. [Google Scholar] [CrossRef]
  5. Kumar, P. (Ed.) The Economics of Ecosystems and Biodiversity: Ecological and Economic Foundations; Routledge: New York, NY, USA, 2012. [Google Scholar]
  6. Tinch, R.; Beaumont, N.; Sunderland, T.; Ozdemiroglu, E.; Barton, D.; Bowe, C.; Börger, T.; Burgess, P.; Cooper, C.N.; Faccioli, M.; et al. Economic valuation of ecosystem goods and services: A review for decision makers. J. Environ. Econ. Policy 2019, 8, 359–378. [Google Scholar] [CrossRef]
  7. Sheergojri, I.A.; Rashid, I. Systematic review of wetland ecosystem services valuation in India: Assessing economic approaches, knowledge gaps, and management implications. J. Environ. Stud. Sci. 2023, 8, 359–378. [Google Scholar] [CrossRef]
  8. Costanza, R.; d’Arge, R.; De Groot, R.; Farber, S.; Grasso, M.; Hannon, B.; Limburg, K.; Naeem, S.; O’Neill, R.V.; Paruelo, J.; et al. The value of the world’s ecosystem services and natural capital. Nature 1997, 387, 253–260. [Google Scholar] [CrossRef]
  9. Turpie, J.K.; Marais, C.; Blignaut, J.N. The working for water programme: Evolution of a payments for ecosystem services mechanism that addresses both poverty and ecosystem service delivery in South Africa. Ecol. Econ. 2008, 65, 788–798. [Google Scholar] [CrossRef]
  10. Chillasse, L.; Dakki, M.; Abbassi, M.; Agdal, R. Valeurs et fonctions écologiques des Zones humides du Moyen Atlas (Maroc). Humed. Mediterráneos 2001, 1, 139–146. [Google Scholar]
  11. Touabay, M.; Aouad, N.; Mathieu, J. Etude hydrobiologique d’un cours d’eau du Moyen-Atlas: L’oued Tizguit (Maroc). Ann. Limnol. Int. J. Limnol. 2002, 38, 65–80. [Google Scholar] [CrossRef]
  12. Milian, J. Le dilemme entre développement et protection dans les montagnes du Maroc-le cas des parcs du Moyen Atlas. Géocarrefour 2007, 82, 177–186. [Google Scholar] [CrossRef]
  13. Abd Elbasit, M.A.M.; Knight, J.; Liu, G.; Abu-Zreig, M.M.; Hasaan, R. Valuation of Ecosystem Services in South Africa, 2001–2019. Sustainability 2021, 13, 11262. [Google Scholar] [CrossRef]
  14. Azadi, H.; Van Passel, S.; Cools, J. Rapid economic valuation of ecosystem services in man and biosphere reserves in Africa: A review. Glob. Ecol. Conserv. 2021, 28, e01697. [Google Scholar] [CrossRef]
  15. Jamouli, A.; Allali, K. Economic valuation of ecosystem services in Africa. In E3S Web of Conferences; EDP Sciences: Les Ulis, France, 2020; p. 01002. [Google Scholar]
  16. Pettinotti, L.; De Ayala, A.; Ojea, E. Benefits from water-related ecosystem services in Africa and climate change. Ecol. Econ. 2018, 149, 294–305. [Google Scholar] [CrossRef]
  17. Measho, S.; Chen, B.; Pellikka, P.; Trisurat, Y.; Guo, L.; Sun, S.; Zhang, H. Land use/land cover changes and associated impacts on water yield availability and variations in the Mereb-Gash River Basin in the Horn of Africa. J. Geophys. Res. Biogeosci. 2020, 125. [Google Scholar] [CrossRef]
  18. Arowolo, A.O.; Deng, X.; Olatunji, O.A.; Obayelu, A.E. Assessing changes in the value of ecosystem services in response to land-use/land-cover dynamics in Nigeria. Sci. Total Environ. 2018, 636, 597–609. [Google Scholar] [CrossRef]
  19. Du Toit, M.J.; Cilliers, S.S.; Dallimer, M.; Goddard, M.; Guenat, S.; Cornelius, S.F. Urban green infrastructure and ecosystem services in sub-Saharan Africa. Landsc. Urban Plan. 2018, 180, 249–261. [Google Scholar] [CrossRef]
  20. Leh, M.D.K.; Matlock, M.D.; Cummings, E.C.; Nalley, L.L. Quantifying and mapping multiple ecosystem services change in West Africa. Agric. Ecosyst. Environ. 2013, 165, 6–18. [Google Scholar] [CrossRef]
  21. Hamid, M.L.A. Economic Evaluation of Ecosystem Services Provided by Marine Protected Areas in West Africa: The Case of Banc d’Arguin National Park-Mauritania. PhD Thesis, University of Montpellier, Montpellier, France, 2018. [Google Scholar]
  22. Daly Hassen, H. Estimation of the Economic and Social Value of Goods and Services Provided by Mediterranean Forest Ecosystems: A Critical and Comparative Analysis of Studies in Algeria, Lebanon, Morocco, Tunisia, and Turkey. Plan Bleu 2016, Valbonne, 1–41. [Google Scholar]
  23. Kusi, K.K.; Khattabi, A.; Mhammdi, N.; Lahssini, S. Prospective evaluation of the impact of land use change on ecosystem services in the Ourika watershed, Morocco. Land Use Policy 2020, 97, 104796. [Google Scholar] [CrossRef]
  24. Kusi, K.K.; Khattabi, A.; et Mhammdi, N. Integrated assessment of ecosystem services in response to land use change and management activities in Morocco. Arab. J. Geosci. 2021, 14, 418. [Google Scholar] [CrossRef]
  25. Kusi, K.K.; Khattabi, A.; et Mhammdi, N. Analyzing the impact of land use change on ecosystem service value in the main watersheds of Morocco. Environ. Dev. Sustain. 2022, 25. [Google Scholar] [CrossRef]
  26. Department of Water and Forests/DREFLCD—Middle Atlas. Master Plan for the Development and Management of Ifrane National Park; Internal document; Department of Water and Forests/DREFLCD: Tetuan, Morroco, 2007; pp. 1–180. [Google Scholar]
  27. Achehboune, M.J. Etat Actuel du Dépérissement du Cèdre de l’Atlas au Moyen Atlas Central en Relation Avec la Station et la Sylviculture, Cas des Forêts: JbelAoua Sud et Ait Youssfi de l’Amekla (Canton de LallaMimouna). Ph.D. Thesis, 3rd Cycle National Forest Engineering School, Salé, Morocco, 2006; 137p. [Google Scholar]
  28. Naturel Capital Project. Invest User Guide_Invest documentation. Available online: http://releases.naturalcapitalproject.org/invest-userguide/latest/index.html (accessed on 10 November 2020).
  29. Achiban, H.; Taous, A.; El-Khantoury, I.; el Mderssa, M.; et Amechrouq, A. Quantification of soil loss in various lithological areas of the western Middle Atlas Central: Application to the Ras-Elma, Tamelalet and Sebab watershed (Tigrigra watershed, Morocco). In E3S Web of Conferences; EDP Sciences: Les Ulis, France, 2018; Volume 37, p. 04003. [Google Scholar]
  30. Benez-Secanho, F.J.; Dwivedi, P. Does quantification of ecosystem services depend upon scale (Resolution and Extent)? A case study using the invest nutrient delivery ratio model in Georgia, United States. Environments 2019, 6, 52. [Google Scholar] [CrossRef]
  31. Rango, A.; Arnoldus, H.M.J. Aménagement des bassins versants. Cah. Tech. FAO 1987, 36, 1–11. [Google Scholar]
  32. Aoubouazza, M. Estimation des besoins en eau du Cèdre à Ras El Ma et à Boutrouba (Moyen Atlas Central tabulaire). Rev. Marocaine Sci. Agron. Vétér. 2018, 6, 36–47. [Google Scholar]
  33. Carson, R.T.; Flores, N.E.; Martin, K.M.; Wright, J.L. Contingent valuation and revealed preference methodologies: Comparing the estimates for quasi-public goods. Land Econ. 1996, 72, 80–99. [Google Scholar] [CrossRef]
  34. Christie, M.; Fazey, I.; Cooper, R.; Hyde, T.; Kenter, J.O. An evaluation of monetary and non-monetary techniques for assessing the importance of biodiversity and ecosystem services to people in countries with developing economies. Ecol. Econ. 2012, 83, 67–78. [Google Scholar] [CrossRef]
  35. Pearce, D. Economics of natural resources and the environment/DW Pearce, RK Turner. Am. J. Agr. Econ. 1991, 73, 1242904. [Google Scholar]
  36. Den Biggelaar, C.; Lal, R.; Wiebe, K.; Breneman, V. The global impact of soil erosion on productivity. I. Absolute and relative erosion-induced yield losses. Adv. Agron. 2004, 81, 1–48. [Google Scholar]
  37. Jorio, A. Le Coût de la Dégradation de l’Environnement au Maroc. Chapitre 5 “Sols”. Environment and Natural Resources Global Practice Discussion Paper; World Bank Group Report 105633-MA; World Bank: New York, NY, USA, 2017; pp. 49–64. [Google Scholar]
  38. Khattabi, A.; Croitoru, L. Le Coût de la Dégradation de l’Environnement au Maroc. Chapitre 3 “Eau”. Environment and Natural Resources Global Practice Discussion Paper; World Bank Group Report 105633-MA; World Bank: New York, NY, USA, 2017; pp. 13–35. [Google Scholar]
  39. National Office of Electricity and Drinking Water—Midelt. Weekly Treatment Products Ratio; Internal document; National Office of Electricity and Drinking Water: Casablanca, Morocco, 2019. [Google Scholar]
  40. ABH Oum Er Rbia. Fees for the Use of Public Hydraulic Domain; Internal document; Agence du bassin hydraulique de l’Oum Er Rbia: Beni Mellal, Morroco, 2020. [Google Scholar]
  41. Department of Water and Forests/DREFLCD—Ifrane. Forest Fires in the Province of Ifrane; Internal document; Department of Water and Forests/DREFLCD: Tetuan, Morroco, 2020. [Google Scholar]
  42. Department of Water and Forests/DREFLCD—Ifrane. Final Report on Reforestation in the Province of Ifrane; Internal document; Department of Water and Forests/DREFLCD: Tetuan, Morroco, 2020. [Google Scholar]
  43. Department of Water and Forests/DREFLCD—Ifrane. Number of AGS and Compensated Defense Area; Internal document; Department of Water and Forests/DREFLCD: Tetuan, Morroco, 2020. [Google Scholar]
  44. Hamzaoui, I.; Gmira, N.; Qarro, M. Sedentarization of Pastoralists and Impacts on the Sustainability of Forest Ecosystems in the Central Middle Atlas (Case of the Province of Ifrane, Morocco). Nat. Technol. 2020, 12, 38–46. [Google Scholar]
  45. Laouina, A. Sustainable Land Management in Mountain Areas and Risk Reduction Downstream: The Moroccan Case. Bull. Séanc. Acad. R. Sci. Outre-Mer 2019, 2019, 203–223. [Google Scholar]
  46. Etebaai, I.; Damnati, B.; Raddad, H.; Benhardouz, H.; Benhardouz, O.; Miche, H.; Taieb, M. Climate and Anthropogenic Impacts on the Hydrogeochemical Functioning of Lake Ifrah (Moroccan Middle Atlas). Hydrol. Sci. J. 2012, 57, 547–561. [Google Scholar] [CrossRef]
  47. Qadem, A.; Akdim, B.; Laaouane, M.; Lebaut, S.; Gille, E. Use and Management of Water Resources in Upper Sebou (Middle Atlas, Morocco). Geomaghreb Rev. Appl. Stud. Earth Sci. Geogr. Plan. 2014, 10, 21–32. [Google Scholar]
  48. FAO. What Happens to Infiltration Water in the Soil? Available online: https://www.fao.org/fishery/en/ (accessed on 15 May 2021).
  49. Cosandey, C. Does the Forest Reduce Annual Runoff? In Annales de Géographie; Armand Colin: Paris, France, 1995; pp. 7–25. [Google Scholar]
Figure 1. Map of the geographical location of the INP watershed.
Sustainability 16 08800 g001
Figure 2. Changes in land use in INP between 2008 and 2020.
Sustainability 16 08800 g002
Figure 3. Soil loss maps of the INP watershed in 2008 and 2020.
Sustainability 16 08800 g003
Figure 4. Evolution of the quantities of sediments lost, exported, retained, and deposited in the INP watershed: upstream part of the Sebou watershed (a) and upstream part of the Oum Er-Rabia watershed (b).
Sustainability 16 08800 g004
Figure 5. Maps of nitrogen exported to the INP watershed in 2008 and 2020.
Sustainability 16 08800 g005
Figure 6. Maps of phosphorus exported to the INP watershed in 2008 and 2020.
Sustainability 16 08800 g006
Figure 7. Evolution of the quantities of nitrogen (a) and phosphorus (b) exported in the INP watershed between 2008 and 2020.
Sustainability 16 08800 g007
Figure 8. Sediment retention by land use in the INP watershed (%).
Sustainability 16 08800 g008
Figure 9. Water yield maps for the INP watershed in 2008 and 2020.
Sustainability 16 08800 g009
Figure 10. Water yield in the INP watershed between 2008 and 2020.
Sustainability 16 08800 g010
Table 1. Quantification and economic valuation methods used.
HES StudiedQuantification MethodEconomic Valuation Method
Erosion controlInVEST’s “Sediment Delivery Ratio” modelDamage costs avoided
Water purificationInVEST’s “Nutrient Delivery Ratio” model
Water yieldInVEST’s “Annual Water Yield” modelMarket price
Table 2. InVEST models data source.
Inputs (*)InVEST Models Source of Inputs
Land use raster All InVEST modelsObtained by digitizing, using Google Earth images
Biophysical tablesAll InVEST modelsFrom literature [25,29,30]
Rasters of climatic data (precipitation and evapotranspiration) “Sediment Delivery Ratio”
“Nutrient Delivery Ratio”
“Water Yield”
Obtained from the measurements of the weather stations covering the study area, and from: https://climate.northwestknowledge.net/ (accessed on 29 March 2021)
Digital Elevation Model “Sediment Delivery Ratio”
“Nutrient Delivery Ratio”
“Water Yield”
From the Earth Data website of the National Aeronautics and Space Administration of the United States of America (https://earthdata.nasa.gov (accessed on 20 April 2021))
Erosivity raster
(R Factor)
“Sediment Delivery Ratio”Calculated from annual and monthly precipitation averages over a 30-year period (1985–2015), using the formula of Rango and Arnoldus (1987) [31]
Soil erodibility raster
(K factor)
Obtained by assigning the corresponding K-factor values [29] to the lithologic facies of the study area
Roots depth raster“Water Yield”Obtained by granting each land use the corresponding root depth
Plants’ Available Water ContentObtained by assigning the corresponding plant’s available water content values [32] to the lithologic facies of the study area
Table 3. Correspondence between forage productivity loss and level of soil degradation.
Erosion Classes
(t/ha/year)
Erosion IntensityLoss of Forage Productivity (%)
0–5Very low2.5
5–25Low and medium25
>25Strong and very strong45
Table 4. Distribution of agricultural area by soil loss class.
Soil Loss Class (t/ha/year)Area in 2008
(ha)
Area in 2020
(ha)
The Difference
(ha)
The Difference (ha/year)
0–72198.23116.9+918.7+76.5
7–12658.1897.5+239.4+19.9
12–20612.6988.4+375.7+31.3
20–35618.51194.3+575.7+47.9
>35738.22477.8+1739.6+144.9
Total4825.78674.9+3849.3+320.7
Table 5. Losses in agricultural yields as a function of soil losses.
Soil Loss Class (t/ha/year)Erosion Rate Ewp
(t/ha/year)
Decrease in Yield: r
(%)
Decline in Yield (*)
∆R = rxAverage Yield (2.44 t/Ha)
(t/ha)
Price (USD/ha)Annual Cost of Erosion
(USD/year)
0–73.50.050.0010.46+35.2
7–129.50.180.0041.44+28.6
12–20160.340.0082.88+90.1
20–3527.50.660.0165.76+275.9
>3538.50.990.0248.64+2770.8
Total+3200.6
(*) All the agricultural land is considered cereal-growing land. Because cereal growing constitutes more than 58% of the useful agricultural area, the average yield of cereals is 2.44 t/ha, and their market price is USD 360/ton.
Table 6. Distribution of rangeland area by soil loss class.
Soil Loss Class (t/ha/year)Area in 2008
(ha)
Area in 2020
(ha)
The Difference
(ha)
The Difference (ha/year)
0–515,498.225,196.9+9698.8+808.2
5–2516,560.411,877.8−4682.6−390.2
+2522,621.97520.8−15,101.2−1258.4
Total54,680.544,595.6−10,084.9−840.4
Table 7. Forage yield losses as a function of soil losses.
Soil Losses
(t/ha)
Loss of Forage Productivity
(%)
Loss of Forage Productivity (UF/ha)Cost
(USD/ha)
Annual Cost
(USD/year)
0–52.53.31.2960.1
5–252532.911.8−4621.5
+254559.321.3−26,864.3
Total−30,525.7
Table 8. The annual losses by erosion of the INP watershed.
LossesCost (USD/year)
OnsiteLoss in agricultural yields+3200.6
Loss in forage yields−30,525.7
OffsiteLoss in water quality−465.7
Loss in storage capacity−67,340
Total−95,130.8
Disclaimer/Publisher’s Note: The statements, opinions and data contained in all publications are solely those of the individual author(s) and contributor(s) and not of MDPI and/or the editor(s). MDPI and/or the editor(s) disclaim responsibility for any injury to people or property resulting from any ideas, methods, instructions or products referred to in the content.