Article

Optimization of a Typical Gas Injection Pressurization Process in Underground Gas Storage

1
School of Petroleum Engineering, Northeast Petroleum University, Daqing 163000, China
2
Daqing Oilfield Design Institute Co., Ltd., China National Petroleum Corporation, Daqing 163000, China
3
Construction Project Management Sub-Company, China Oil & Gas Pipeline Network Corporation, Langfang 065000, China
*
Author to whom correspondence should be addressed.
Sustainability 2024, 16(20), 8902; https://doi.org/10.3390/su16208902
Submission received: 28 August 2024 / Revised: 5 October 2024 / Accepted: 8 October 2024 / Published: 14 October 2024
(This article belongs to the Section Energy Sustainability)

Abstract

:
In the early construction of an underground gas storage facility in an oil and gas field in southwest China, the increasing gas injection volume led to a continuous rise in energy consumption, which affects the economic sustainability of gas injection and extraction. In order to improve efficiency and reduce energy consumption, optimization of the pressurization process was carried out. An optimization model for the process of pressurization in underground gas storage has been established. Based on the model, a joint optimization approach is applied, where MATLAB is responsible for the iterative process of finding the optimal parameter combinations and HYSYS is responsible for the establishment of the process and calculation of the results of the process parameters. The key parameters include the outlet parameters of the compressor and the air cooler, which are critical in determining the overall energy consumption and operational performance of the system. Accordingly, the results related to the optimal parameter combinations for two-stage compression and three-stage compression were obtained in the case study. Compared with one-stage compression, two-stage and three-stage compression can diminish energy consumption by 1,464,789 kJ/h and 2,177,319 kJ/h, respectively. The reduced rate of energy consumption of three-stage compression was 16.10%, which was higher than that of two-stage compression by 10.83%. Although the construction costs of three-stage compression were higher than those of two-stage compression, from the perspective of long-term operation, three-stage compression had lower operating costs and superior economy and applicable value. The research results provided scientific references and new ideas for the optimization and adjustment of the pressurization process in underground gas storage.

1. Introduction

Worldwide, with the vigorous development of the economy and rapid technological progress, there is an increasing demand for improved quality of life and environmental conditions. Natural gas, as an efficient and clean form of energy, is gaining increasing attention. In recent years, the natural gas industry in China has entered a golden period of rapid growth, with consumption levels steadily rising. Its pivotal position within the national energy structure has become increasingly significant [1,2,3]. The reuse of large-volume salt caverns for the intermediate storage of liquid and gaseous energy carriers is an indispensable step on the way to a sustainable energy economy [4]. The rational use of underground space can effectively alleviate land-use pressures, enhance urban resilience, and contribute to sustainable development goals. Studying the potential social and environmental losses will help to optimize the development of underground resources, thereby supporting more sustainable urban planning [5,6]. By providing reservoir storage capacity, security, and long-term environmental isolation, gas storage can contribute to the sustainability of the energy supply, thereby supporting the transition to a low-carbon economy [7]. However, alongside this growth trend, the increasingly apparent issues of lagging infrastructure development and insufficient reservoir storage capacity have become critical bottlenecks affecting the stability of natural gas supply and the long-term development of the industry. To address this challenge, China’s National Development and Reform Commission (NDRC) introduced the “Implementation Opinions on Accelerating the Construction of Natural Gas Storage Capacity” (NDRC [2020] No. 567), aimed at accelerating the pace of storage facility construction and significantly enhancing China’s natural gas storage capacity [8].
In this context, the importance of underground gas storage as an advanced method of gas storage is self-evident. Advanced compressor technology is used in underground gas storage to safely inject natural gas into underground porous geological formations [3,9]. When the natural gas supply chain encounters sudden disruptions such as source interruptions or pipeline system failures, underground gas storage can swiftly respond by releasing stored natural gas, ensuring the continuity and stability of the gas supply [10]. These facilities not only effectively mitigate seasonal fluctuations in urban gas usage and smoothly adjust gas supply peaks but also offer several significant advantages. They boast large storage capacities, reducing reliance on above-ground tanks and lowering investment costs. Additionally, the stable underground environment is unaffected by weather conditions, facilitating convenient maintenance and management. Moreover, these facilities are environmentally safe, causing no pollution to the environment. Underground gas storage plays a key role in sustainable development. The release of stored natural gas at times of peak demand balances energy supply and demand, thereby reducing reliance on high-carbon energy sources and lowering carbon emissions [11]. In addition, underground gas storage can help regulate the volatility of renewable energy sources, such as wind and solar, improving the stability and economics of energy systems. Underground gas storage can also enhance energy security, provide emergency reserves, and support climate change adaptation strategies. There have also been findings that by enhancing the deliverability prediction capabilities of underground natural gas storage (UNGS), resource utilization can be optimized and supply chain efficiencies can be improved, thereby supporting cleaner production and sustainable development strategies [12]. Overall, underground gas storage contributes to the sustainable development of the global energy system by facilitating a green energy transition, reducing environmental impacts, and driving technological innovation [13].
Optimizing the process equipment in underground gas storage can save energy and reduce consumption. Optimizing the compression stages of compressors is a critical component in the construction of natural gas storage capacity Optimizing the compression stages enables a more efficient gas compression process, improves system stability, reduces vibration and noise, extends equipment lifespan, lowers failure rates, enhances safety, and thereby boosts overall efficiency and performance of the entire gas storage system [14]. The proper adjustment of compression stages can reduce energy consumption, decrease the operating costs of compressors, and contribute to the reduction of maintenance expenses for the system. In addition, optimizing the number of compression stages can enhance the responsiveness and flexibility of underground gas storage, enabling them to better accommodate fluctuations in natural gas demand [15]. In summary, optimizing the compression stages of compressors can improve the energy efficiency, economic viability, and reliability of gas storage systems, thus promoting the development of natural gas storage capabilities toward greater efficiency and sustainability [16].
HYSYS (V11), a well-established commercial software, is extensively applied in various processes, particularly in underground gas storage and natural gas processing [17]. Hasan et al. [18] used HYSYS for the development of a flowchart for a 150 MMSCFD natural gas processing plant. This study demonstrates the efficiency and reliability of HYSYS in steady-state simulation, reflects the powerful computational capabilities of HYSYS, and highlights the potential for its application in complex natural gas processing systems. In this way, HYSYS is proving to be a verified and effective tool for providing accurate technical support for industrial applications and driving technological advances and efficiency gains across the natural gas industry. Ansari et al. [19] constructed a model of an actual low-quality gas reservoir to analyze and optimize the injection/extraction strategy through dynamic simulation in HYSYS to ensure that the quality of the extracted gas is maintained over at least five consecutive production cycles while achieving maximum delivery rates. Szablowski et al. [20], in their study, developed a dynamic mathematical model using Aspen HYSYS software to analyze the performance of an adiabatic compressed air energy storage (A-CAES) system. They performed a detailed simulation of the system through HYSYS, covering the charging and discharging process of compressed air storage, and successfully identified the key aspects of energy loss and entropy consumption. Krawczyk et al. [21] used Aspen HYSYS software to thermodynamically analyze and simulate compressed air energy storage (CAES) and liquid air energy storage (LAES) systems. An in-depth thermodynamic analysis of compressed air energy storage (CAES) and liquid air energy storage (LAES) technologies is provided, revealing the key differences in energy storage efficiency and volume requirements, which provides important theoretical support and practical guidance for future energy storage technology development. Mikołajczak et al. [22] proposed an emerging energy storage technology, Liquefied Natural Gas Energy Storage (LNGES), and their study highlights the maturity of Aspen HYSYS in the LNGES process. By applying the proposed mathematical model in this numerical environment, their study demonstrates the capability of HYSYS in simulating and optimizing complex energy systems. Alnili et al. [23] performed a thermodynamic analysis of the CO2 sequestration process using HYSYS to evaluate the effect of rocks with different porosities on CO2 injection efficiency. By constructing a model of the subsurface reservoir, the CO2 storage capacity under different conditions was quantified, providing theoretical support for understanding the relationship between rock properties and CO2 sequestration efficiency.
However, due to the multitude of parameters involved in process-related issues, manually searching for optimal parameters often leads to lengthy time requirements. Moreover, the results obtained tend to be only approximate or locally optimal [24]. Therefore, to overcome this challenge, it is crucial to introduce advanced optimization methods to systematically explore and determine the optimal parameter combinations for processes. These methods not only significantly reduce the time required to find the optimal solution but also employ global search strategies to effectively avoid getting trapped in local optimum [25]. Chen et al. [26] developed a stochastic multi-objective optimization model for gas pipeline operation and underground gas storage peak shaving, utilizing rigorous non-linear programming, stochastic and robust optimization approaches, and Pareto optimal solutions to minimize costs and maximize line pack. Hao et al. [27] developed an optimization method for the compression and expansion ratios in a CO2-based compressed gas energy storage system, achieving up to 74.07% round-trip efficiency and 51.95% heat storage efficiency through a three-stage compression–expansion design and careful thermal parameter adjustments. Zhou et al. [28] developed a Multiple Condition Hybrid (MCH) model and a Hybrid Genetic Algorithm (HGA) to optimize pipeline network design for underground gas storage, achieving significant cost reductions and improved efficiency compared to conventional methods. Pan et al. [29] employed HYSYS to construct two dual-stage throttling refrigeration cycle natural gas liquefaction process systems. They simultaneously utilized single-objective optimization as well as two multi-objective optimization decision-making methods, LINMAP and TOPSIS. Their study’s findings demonstrate that by appropriately adjusting operational parameters and optimizing system structures, significant improvements in energy efficiency and economic viability of natural gas liquefaction processes can be achieved.
The use of intelligent algorithms has the characteristics of being able to solve in parallel, automatically adjusting the parameters and side rates according to the changes, finding the global optimum, etc. Scholars have already used intelligent algorithms on problems related to underground gas storage. Qiao et al. [30] proposed an innovative prediction model combining ICEEMDAN, GS, WT, and ISSA to significantly enhance the prediction performance of LSTM and improve the accuracy of seasonal peak load (SPL) for underground gas storage (UGS). Thanh et al. [31] explored the potential of underground natural gas storage as a means of reducing greenhouse gas emissions and achieving sustainable development goals, and their study proposed a hybrid model combining several intelligent algorithms (e.g., LSSVM, differential evolution, etc.) to accurately estimate the amount of gas available from storage fields in different geological formations. Ali et al. [32] presented a series of novel machine learning algorithm-based predictive models for the deliverability of underground natural gas storage (UNGS), particularly in salt caverns. Their study examined three machine learning algorithms: artificial neural networks (ANN), support vector machines (SVM), and random forests (RF), and evaluates them using monthly storage data from 36 active salt caverns in the U.S. for different years. Experimental results show that these models perform differently in deliverability prediction, with the Random Forest model outperforming the other two models. An optimal cost and design prediction methodology for UGS systems was developed by Jelušič et al. [33]. Their study created an adaptive network-based fuzzy inference system (ANFISUGS) aimed at predicting the minimum investment cost and optimal UGS design and verifying its validity and predictive power through case studies. In summary, the use of intelligent algorithms to solve problems related to underground gas storage is very effective. Wang et al. [34] developed a mathematical model for predicting and optimizing leaching parameters in gas storage salt caverns using nitrogen as a blanket, demonstrating high accuracy and reliability in field applications with an overall error of less than 3.7%. Curin et al. [35] applied reinforcement learning techniques to optimize operation plans for underground gas storage, providing a theoretical framework and numerical performance assessment compared to traditional least-squares Monte Carlo methods in the context of complex, high-dimensional risk management. Zhou et al. [36] presented an optimization model for injection–withdrawal scheduling in depleted gas reservoirs, demonstrating that the model significantly reduces pressure deviation between reservoir blocks and prevents excessive pressure conditions compared to empirical methods. Joseph et al. [37] investigated the development of closely spaced hydraulic fractures, concluding that near wellbore effects, rather than other mechanisms, primarily cause observed fracture swarming, challenging the notion of random fracture placement. Lin et al. [38] focused on optimizing gas injection in underground gas storage by comparing different equations of state for pressure calculations, using ASPEN HYSYS for system modeling, and determining the optimal injection patterns and well configurations to improve operational efficiency and support digital transformation. In recent years, although scholars have begun to explore the integration of MATLAB R2021a with process simulation technologies, the depth and breadth of joint optimization research in the field of pressurization processes for underground gas storage remains limited. Given this situation, there is a need to advance both process optimization and technological innovation in pressurization processes for underground gas storage. This initiative aims not only to explore new avenues for development in energy storage and utilization but also to facilitate the realization of more efficient and sustainable energy management strategies. This study utilized ASPEN HYSYS to develop models for both two-stage and three-stage compression based on existing injection requirements. By integrating MATLAB with the ASPEN HYSYS software platform, a joint optimization approach was employed to determine the optimal parameter combinations for each scheme with the objective function of minimizing energy consumption. The optimal parameters mainly include pressure and temperature. Finally, through comprehensive analysis that included energy consumption and construction costs, this study optimized and compared various injection gas pressurization process schemes to identify the most suitable solution for the current stage injection requirements. Energy is saved through efficient and cost-effective processes, which, in another way, means that the time for which energy can be extracted is extended, guaranteeing energy sustainability.

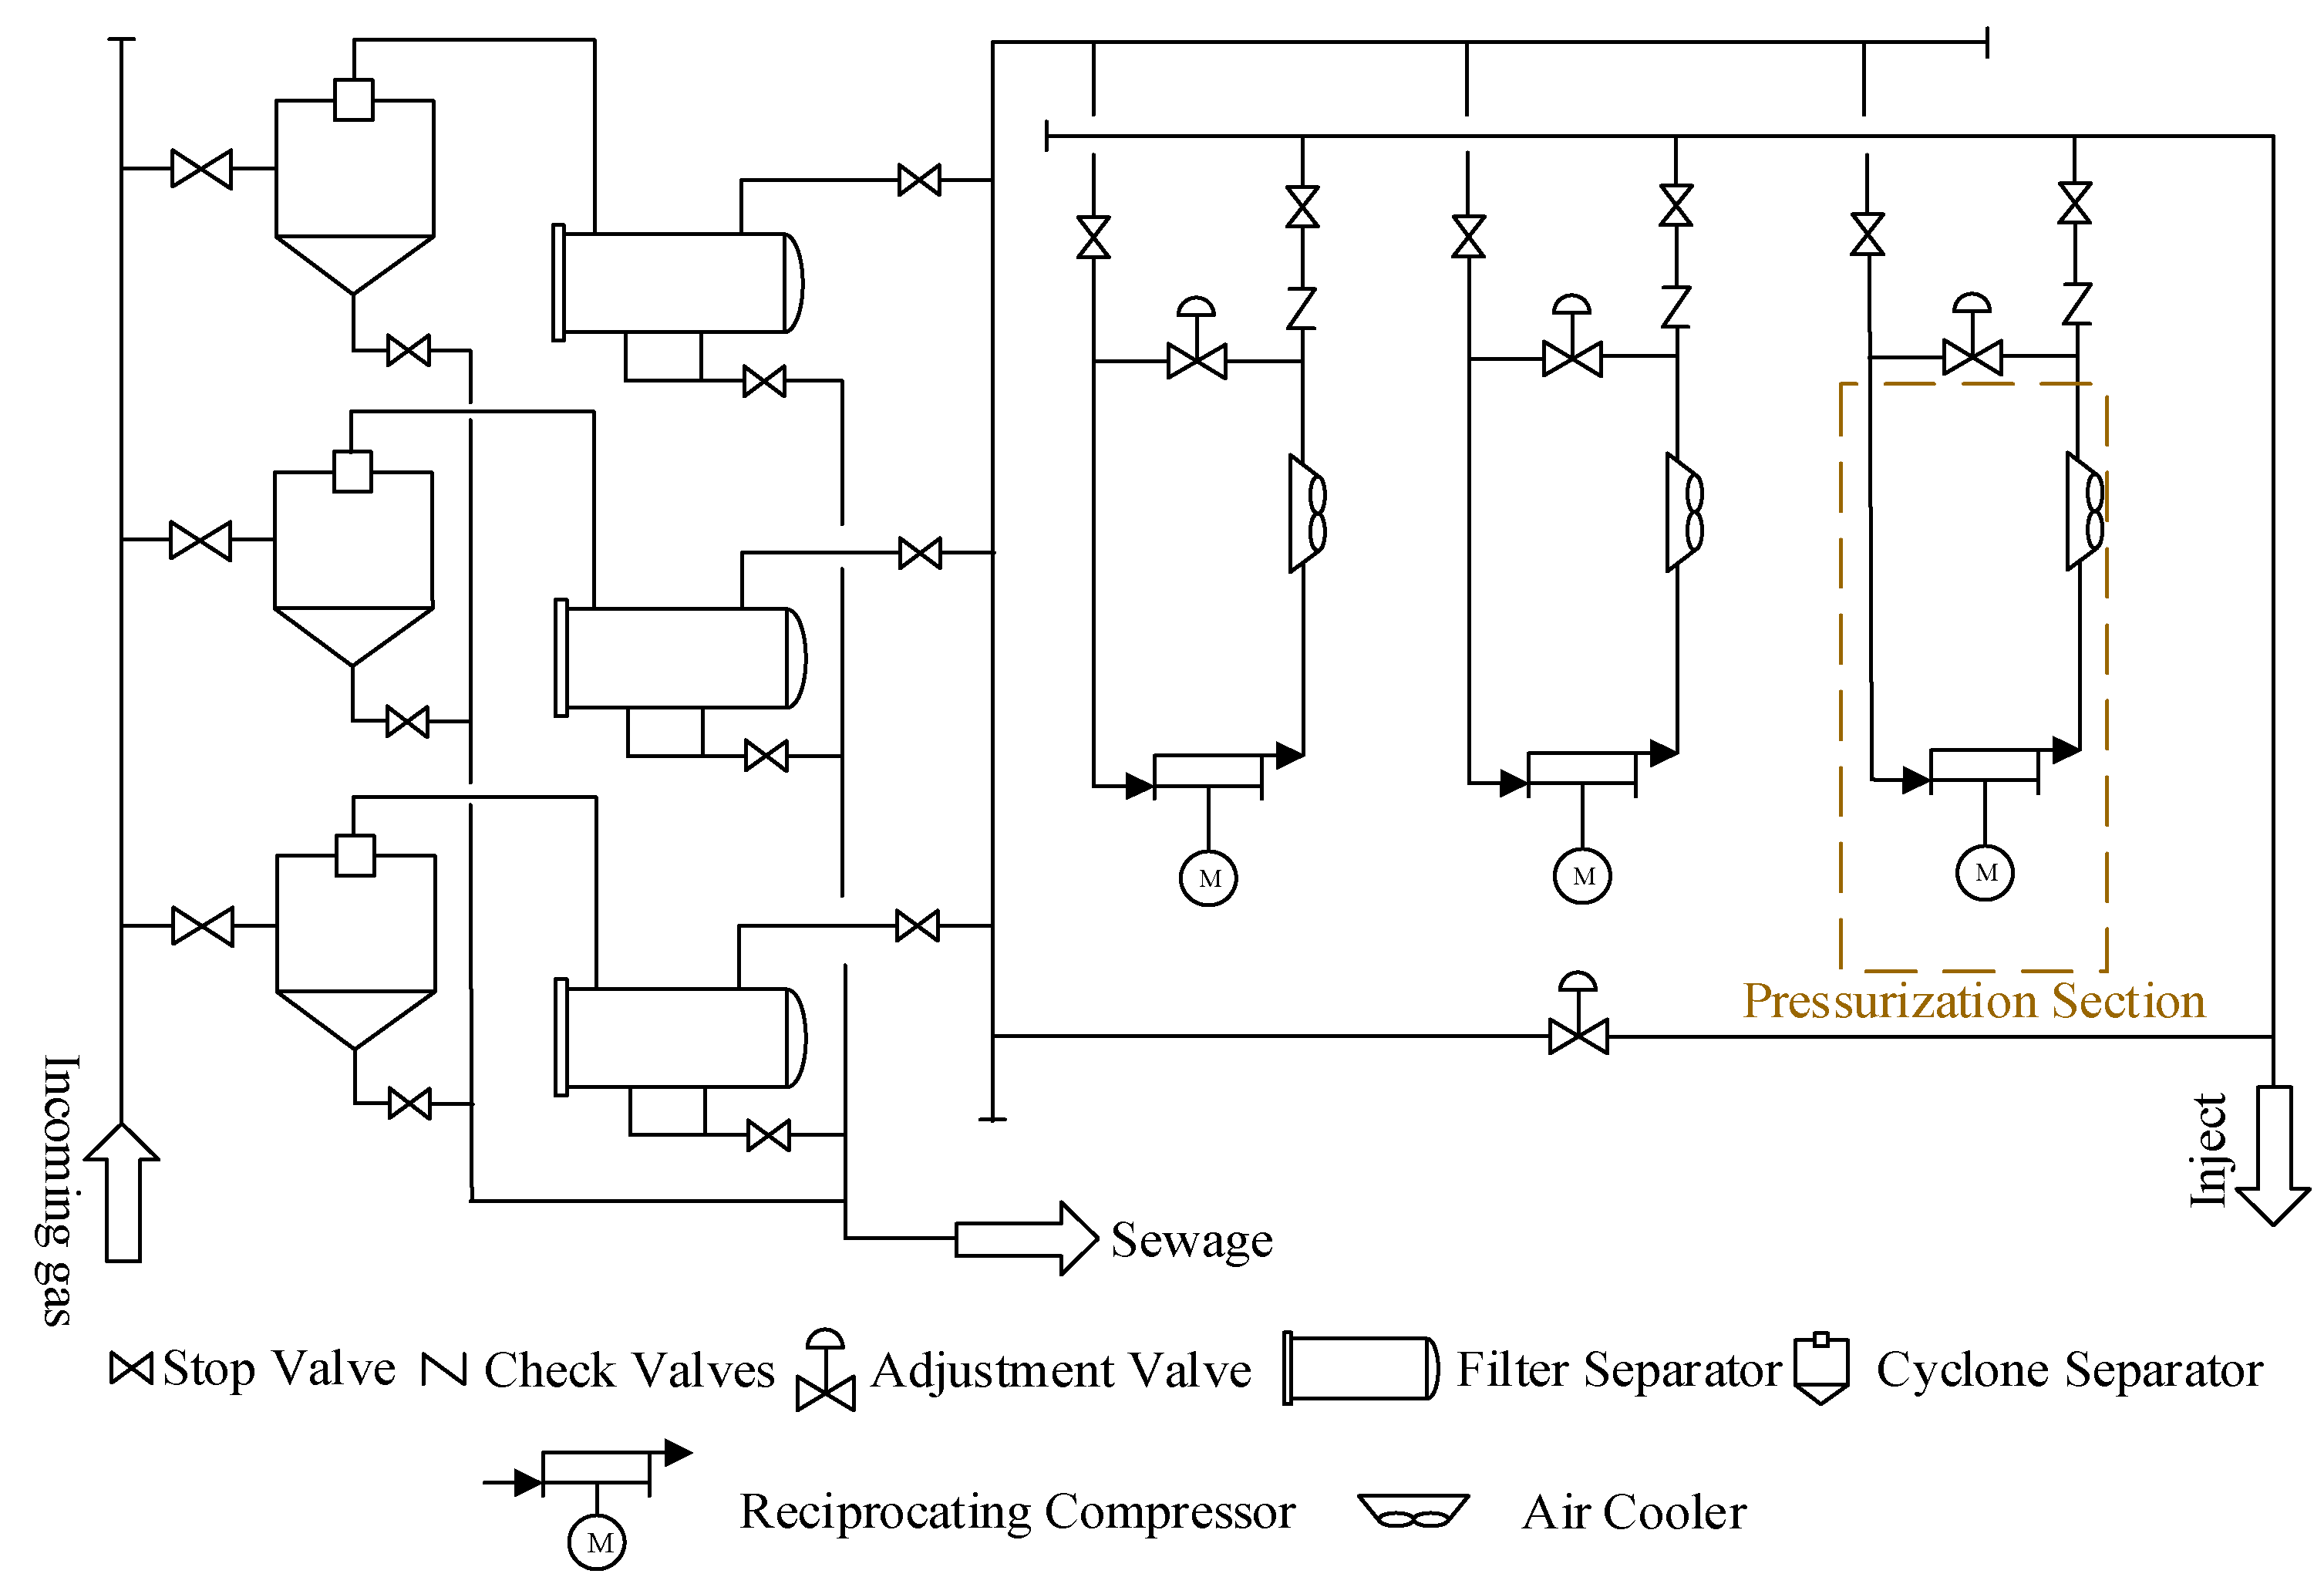
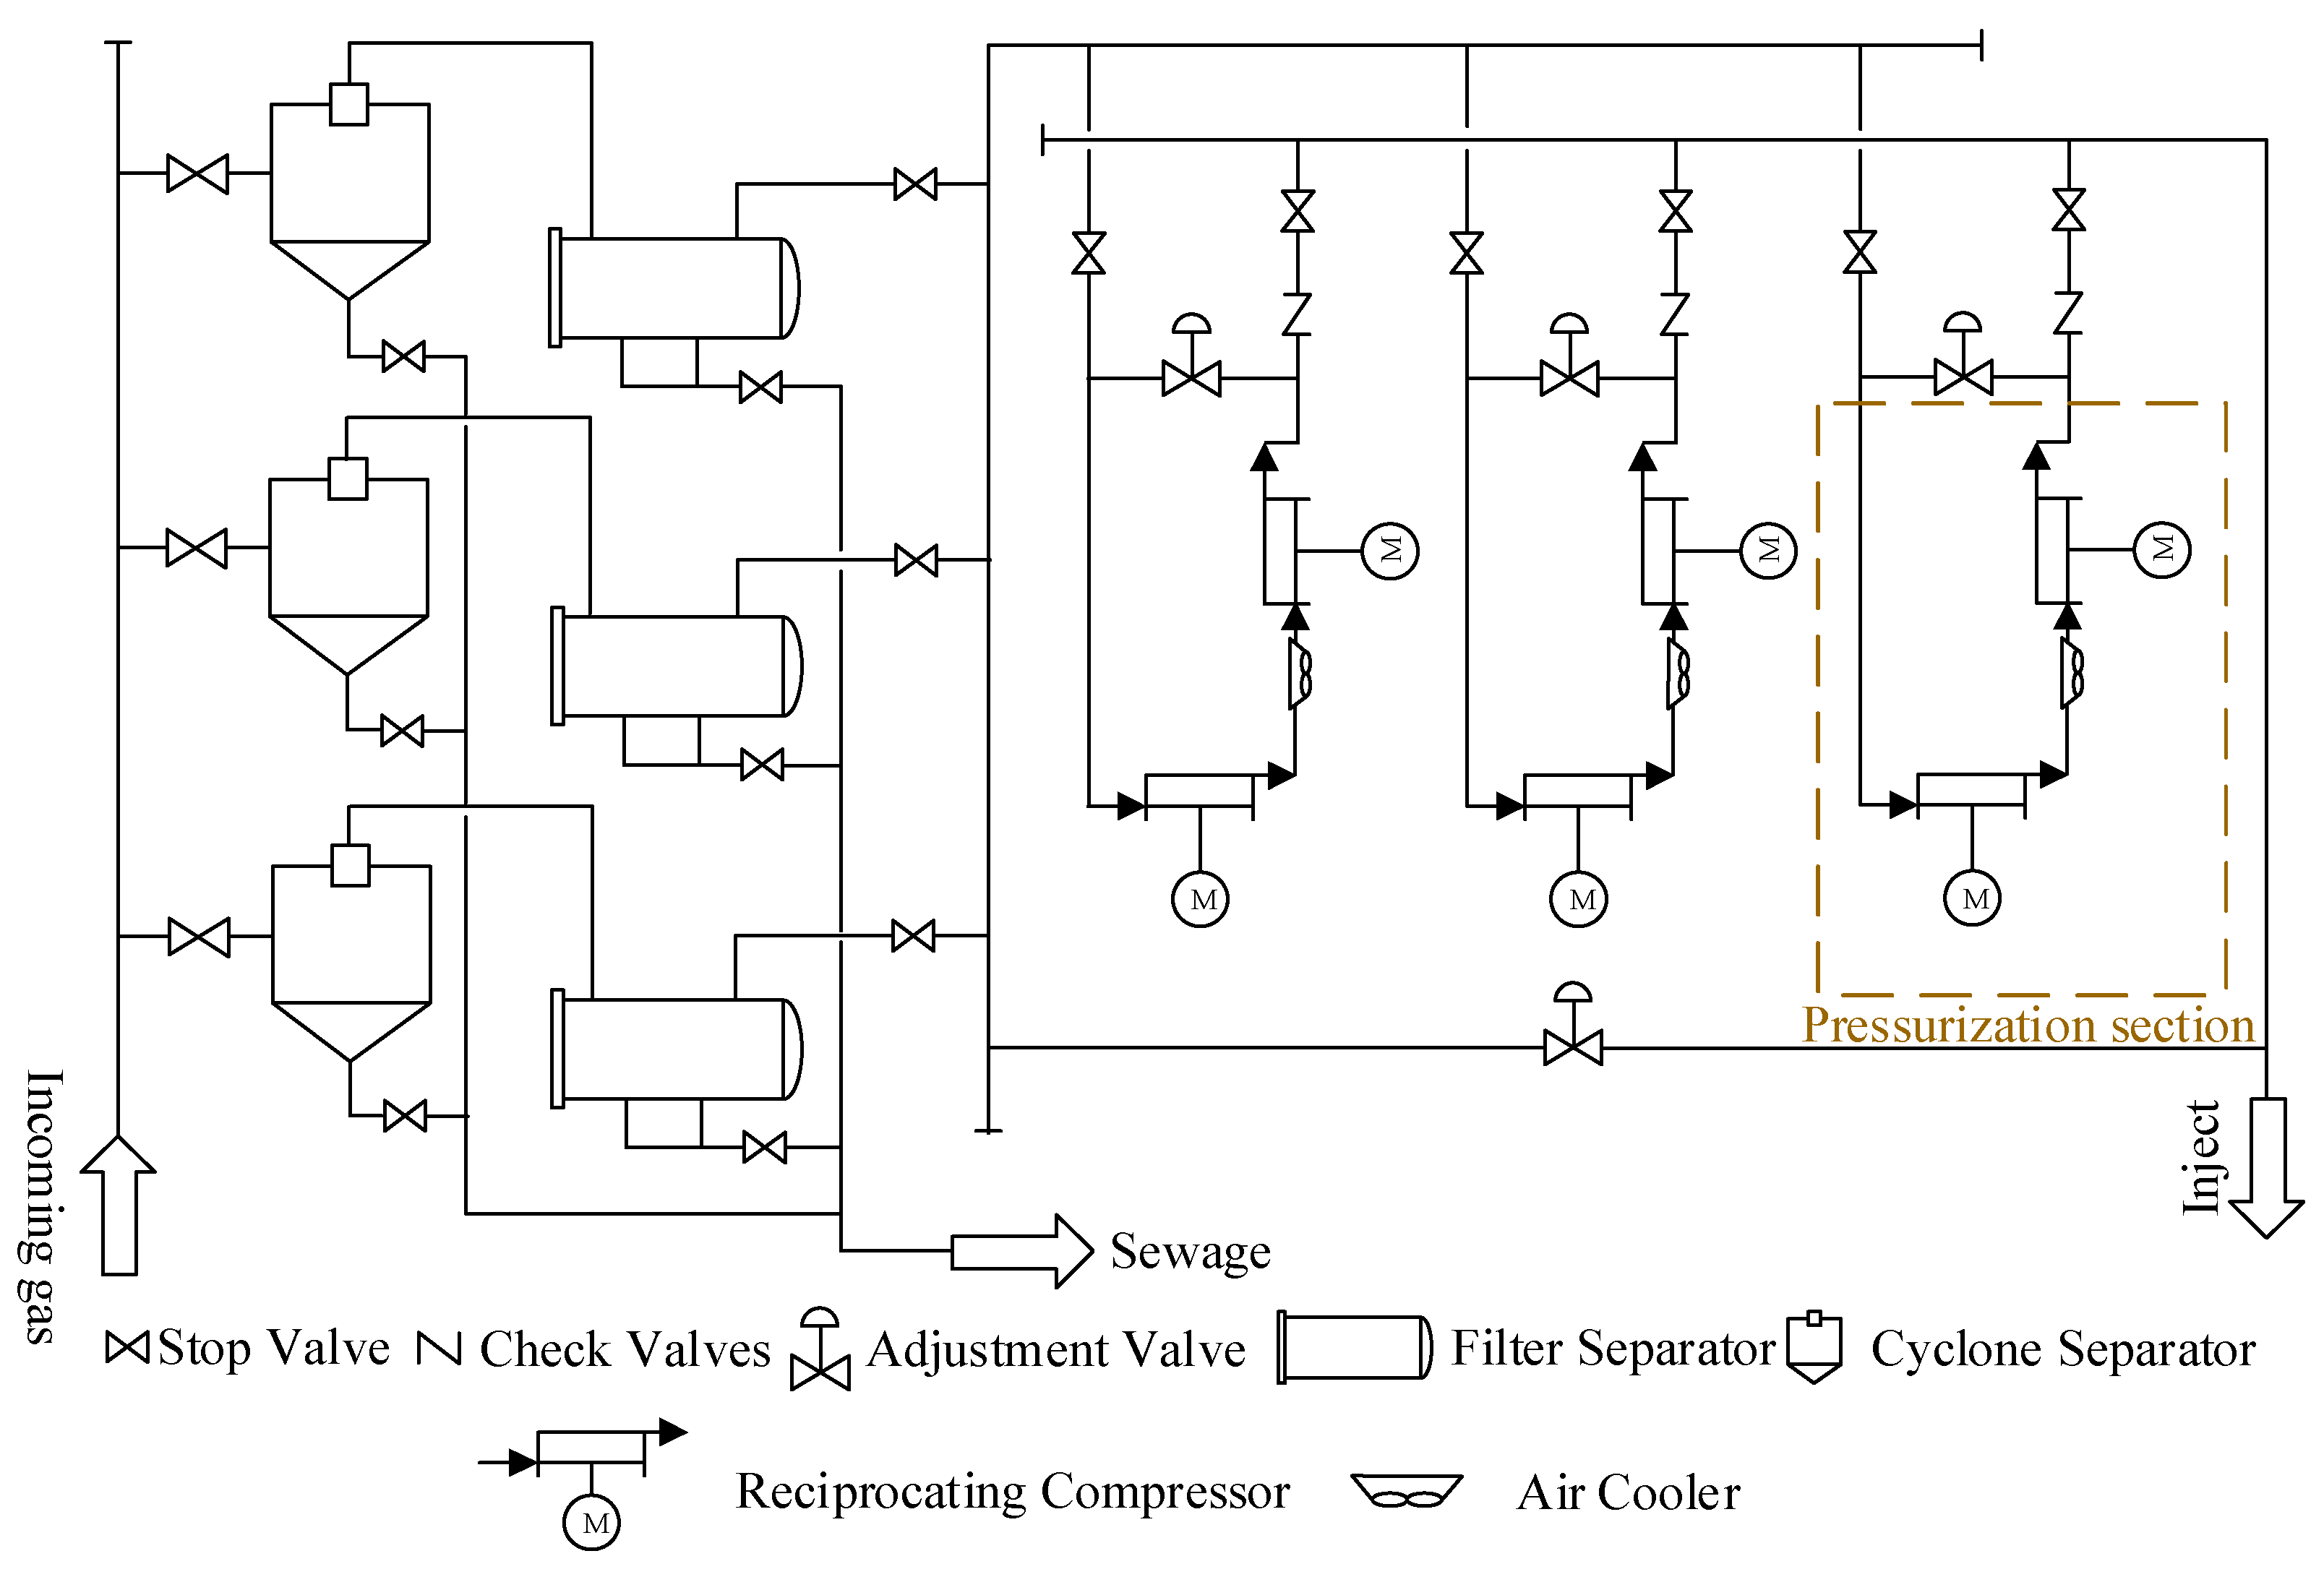
2. Overview of an Underground Gas Storage in Chinese Southwest Oil and Gas Field

This study focuses on the pressurization process of an underground gas storage facility designed for the Chinese Southwest Oil and Gas Field, with an injection system capacity of 200 × 104 Nm3/d. The injection period spanned from April to October. The composition of the injected gas is presented in Table 1.
Natural gas injection in the underground gas storage reservoir was performed with three reciprocating compressors operating in parallel. The compressors were driven by electric motors and were directly coupled in a single-stage compression configuration. The process of the pressurization system is illustrated in Figure 1. The incoming gas from the upstream passed through a cyclone separator for dust removal then went through a filter separator and proceeded to the reciprocating compressor for pressurization. The pressurized gas, after cooling through an air cooler, was injected underground. During the underground gas storage process, the injection pressure increases with the rising pressure of the underground gas storage. However, during certain time periods, the injection pressure can be considered constant. To facilitate production management, site managers conduct regular assessments of the facility [39]. This approach is not only more practical but also provides greater guidance. This paper focuses on a case where the injection pressure was 11 MPa. Specific parameters were as follows: the initial temperature of the incoming gas was 30 °C with an initial pressure of 2 MPa. The gas needed to be cooled to 80 °C and pressurized to 11 MPa before injection into the underground gas storage. As an example, for a single unit, the pressurization section of the current process was simulated by HYSYS. The property package used in this study was “Peng Robinson”. Others not mentioned in this document are the default settings. The model is illustrated in Figure 2. The main parameters are shown in Table 2.

3. Simulation of Multi-Stage Compression Schemes

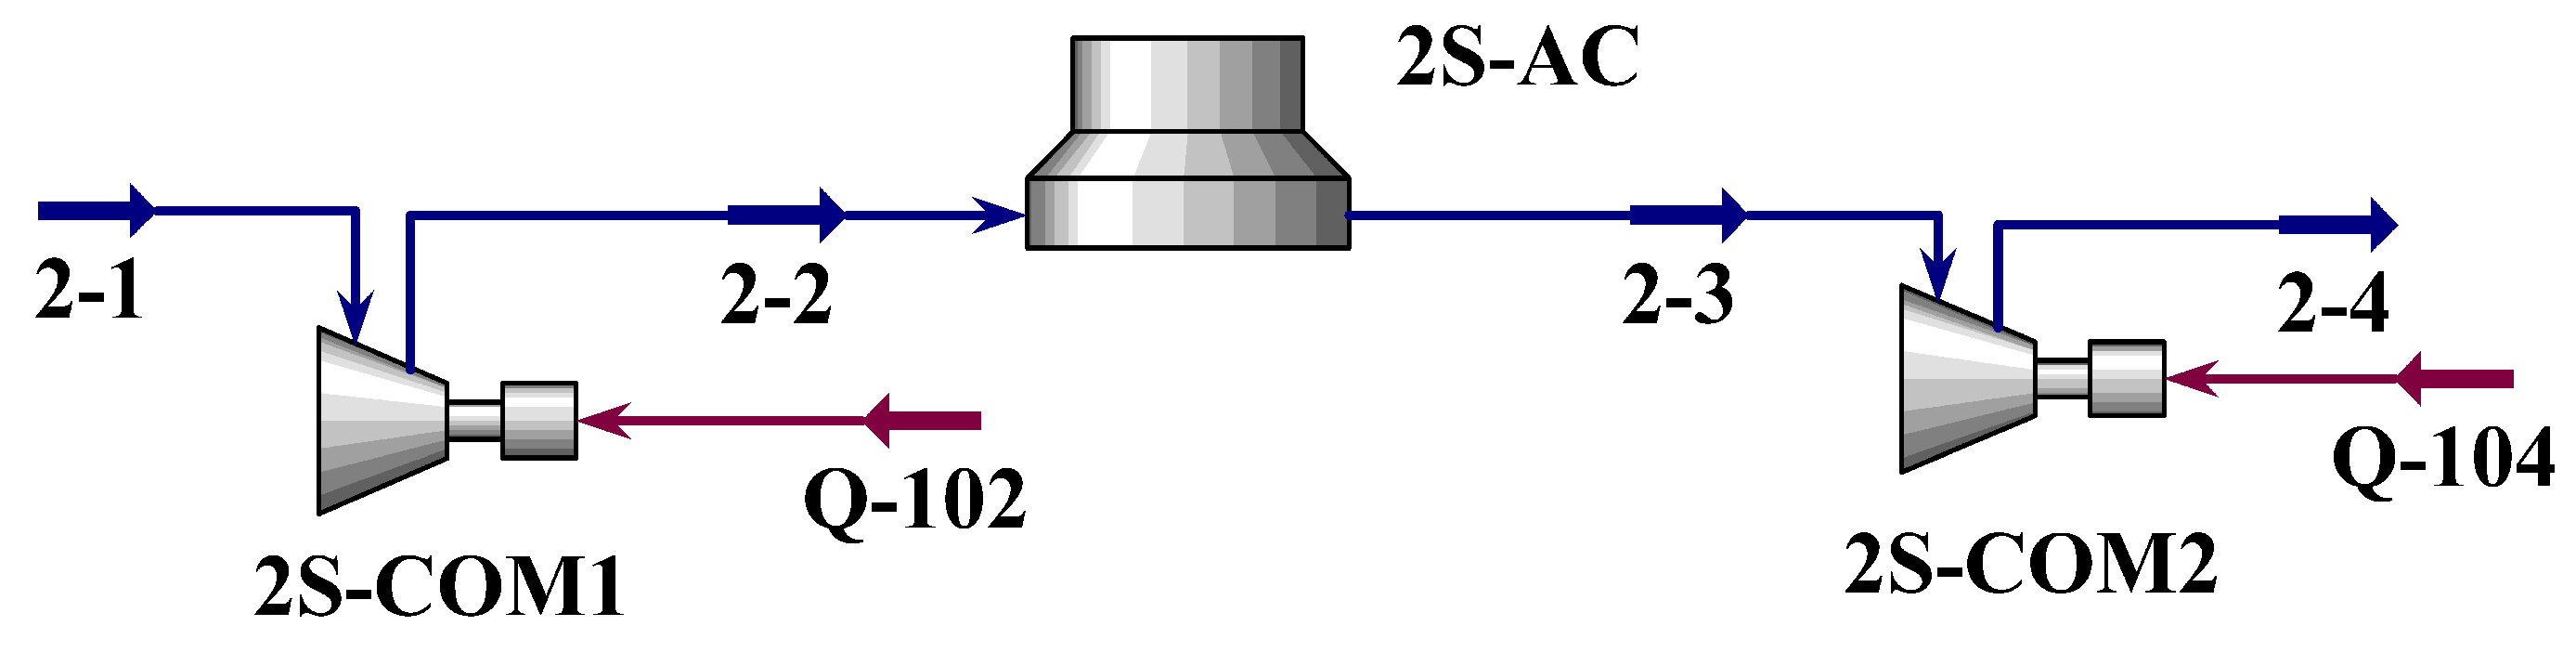
3.1. Two-Stage Compression Scheme Simulation

To maintain the existing configuration of three parallel units, improvements were made to the process of each compressor unit by adding a reciprocating compressor to create a two-stage compression system. The process flow for the two-stage compression and pressurization is illustrated in Figure 3, with the process modeling depicted in Figure 4. The process for the two-stage compression and pressurization section was as follows: incoming gas was pressurized by the first compressor (2S-COM1), and after pressurization, the natural gas passed through an air cooler (2S-AC) before undergoing further pressurization to 11 MPa by the second compressor (2S-COM2). At this stage, the temperature of the compressed gas was 80 °C.

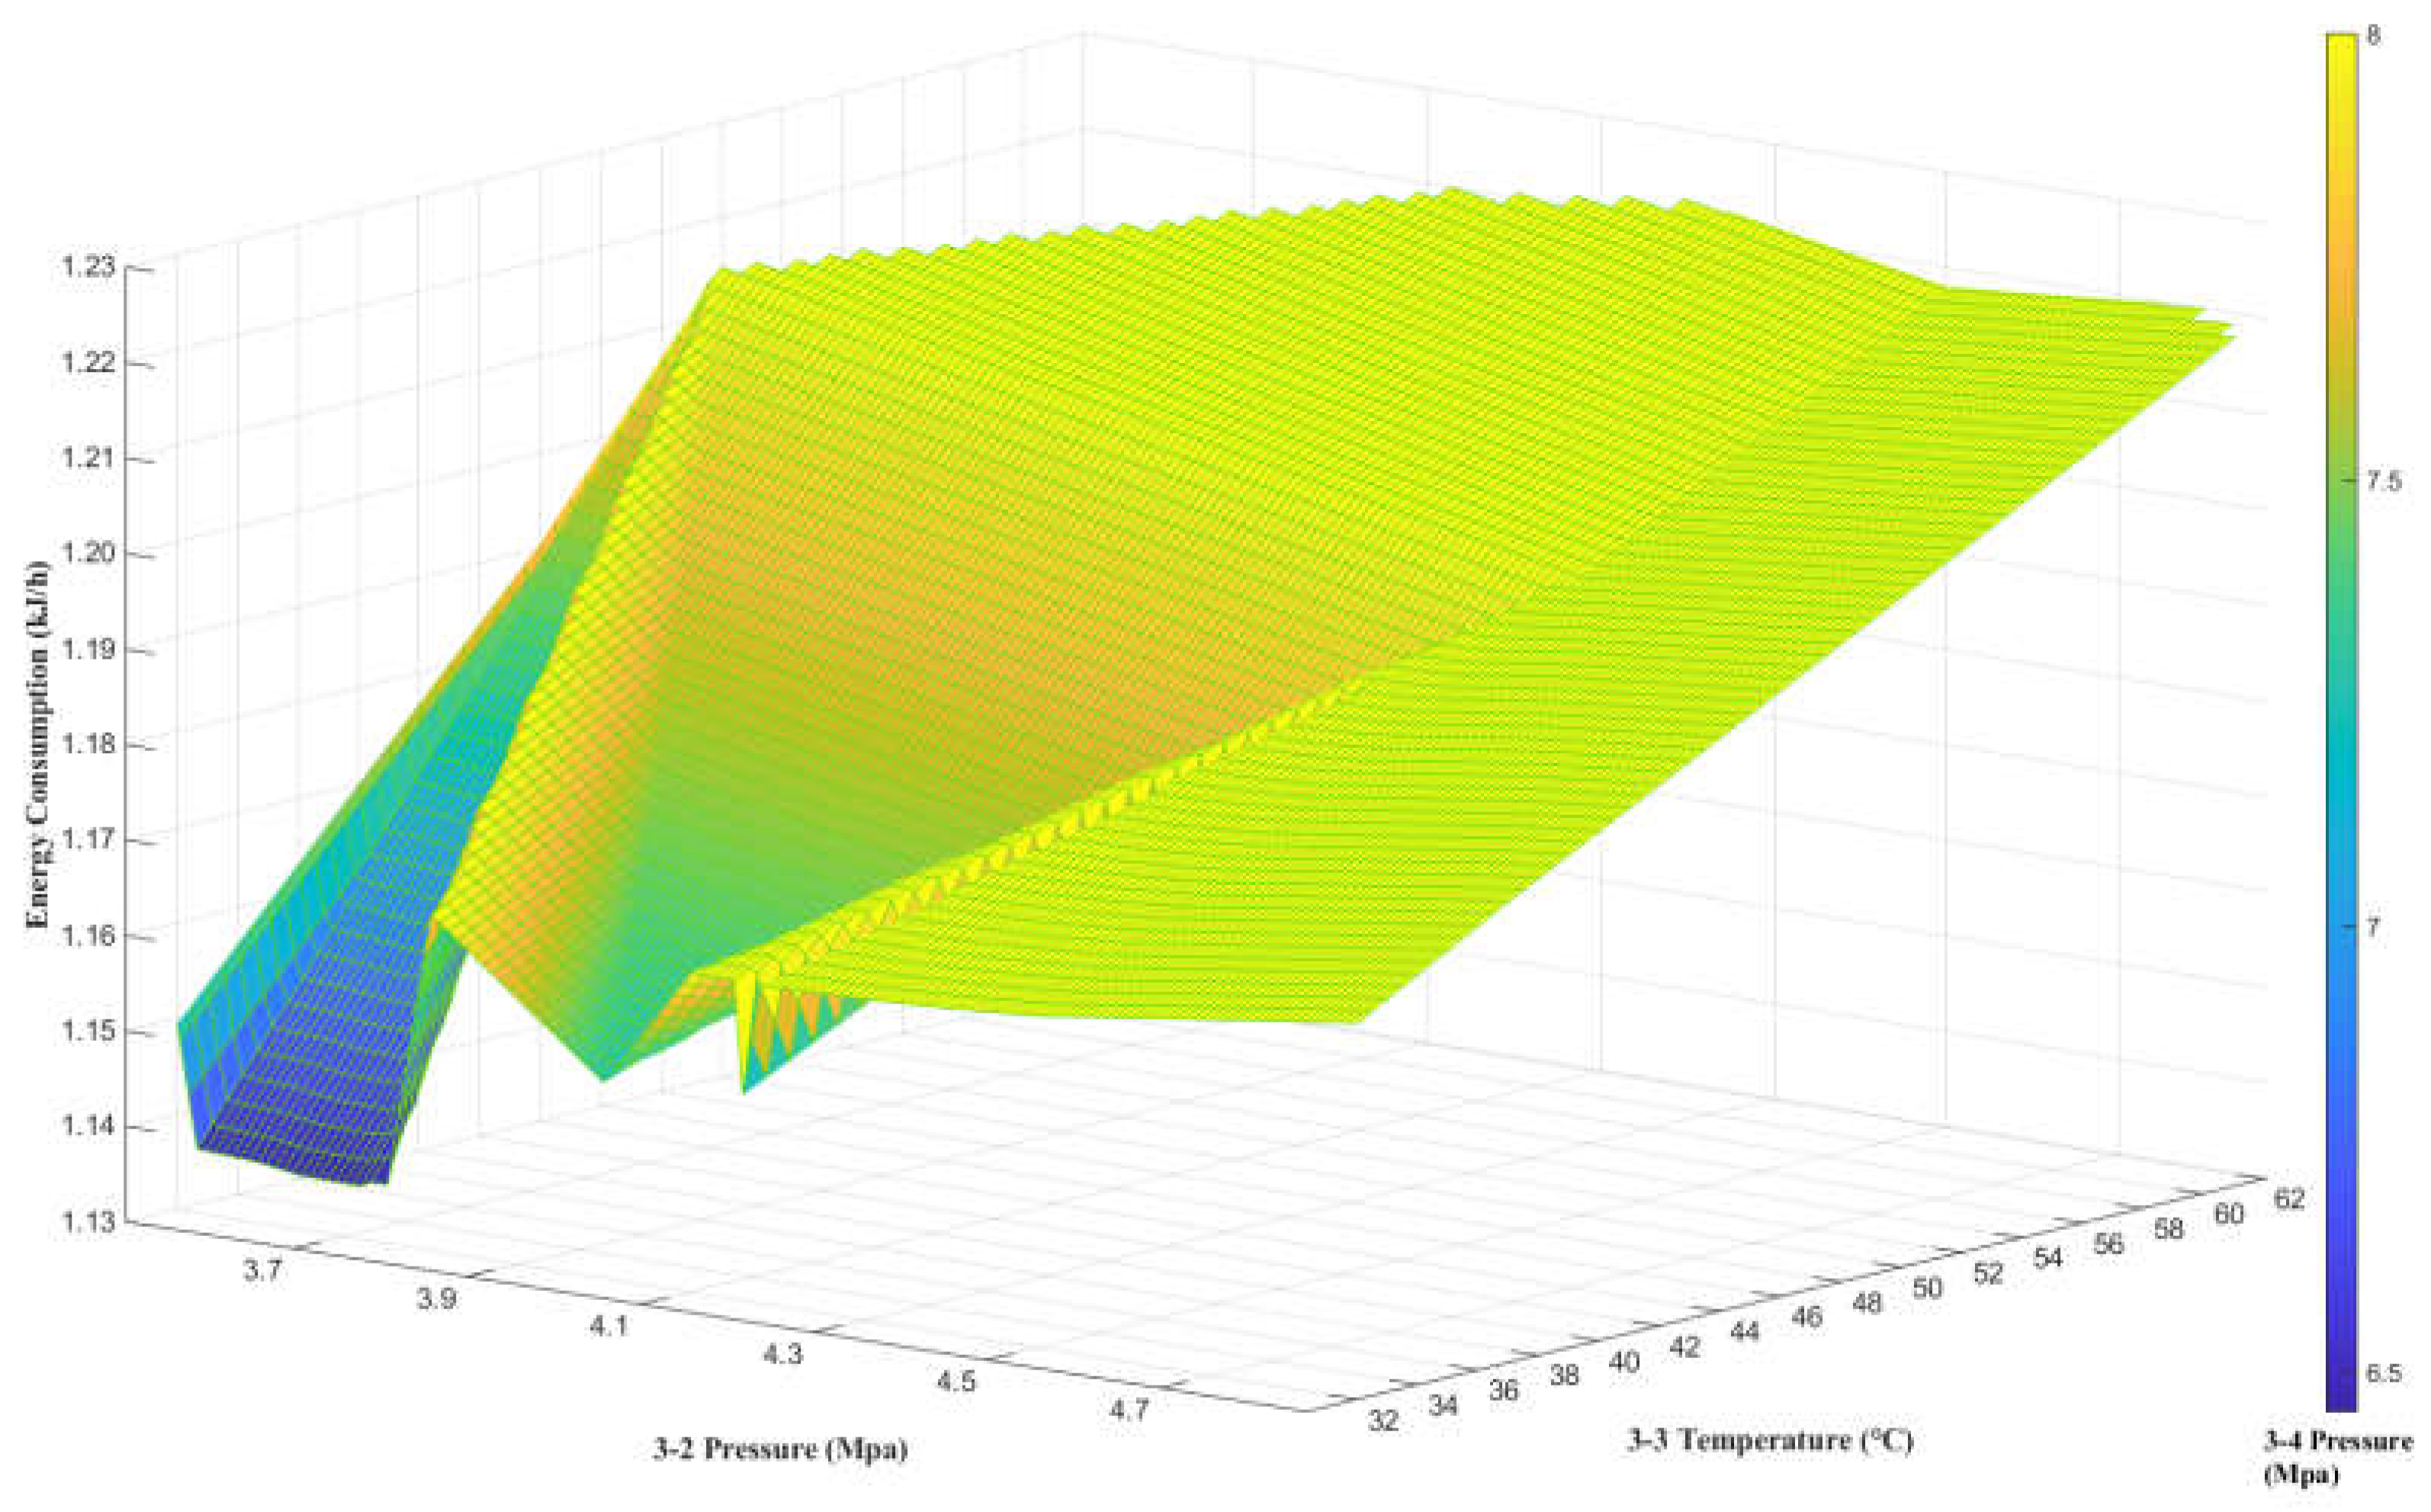
3.2. Three-Stage Compression Scheme Simulation

To maintain the existing configuration of three parallel units, improvements were made to the process of each compressor unit by adding two reciprocating compressors and an air cooler to create a three-stage compression system. The process flow for the three-stage compression and pressurization is illustrated in Figure 5, with the process modeling depicted in Figure 6. The process for the three-stage compression and pressurization section was as follows: incoming gas was pressurized by the first compressor (3S-COM1), and after pressurization, the natural gas passed through the first air cooler (3S-AC1) for cooling before further pressurization by the second compressor (3S-COM2). The gas, after secondary pressurization, passed through the second air cooler (3S-AC2) and was subsequently pressurized to 11 MPa by the third compressor (3S-COM3), resulting in a compressed gas temperature of 80 °C.

4. Process Optimization of Pressurization Based on Software Interaction

4.1. Optimization Model of Pressurization Process

The optimization of the pressurization process in the underground gas storage involved various factors such as compression stages, pressure, temperature, flow rate, and so on. In this study, the optimization objective is to minimize the total energy consumption, with a special focus on energy-consuming equipment such as compressors and air coolers. The values of the energy consumption were calculated by HYSYS and returned to MATLAB. The energy consumption calculations for the compressor were performed using the built-in calculation formulas in HYSYS and presented in the Energy Stream. The energy consumption calculations for the air cooler were carried out using the Energy Analysis module provided by HYSYS. A schematic diagram of the relevant software, using the one-stage compression as an example, is shown in Figure 7.
The optimization model for the pressurization process of underground gas storage proposed in the paper is shown in Equations (1) to (2).
Objective function:
min F ( n , P , T ) = i = 1 n E com , i + i = 1 n 1 E AC , i
Constraint conditions:
{ P f P m , n 1 1.5 n = 2 , 3 P m , 1 P 0 1.5 n = 2 , 3 P m , n 1 P m , 1 1.5 n = 3 T A C , j 32 1 j n 1
In the equations, n represents the number of compression stages. Based on industry experience, the pressurization process for gas injection typically does not exceed three-stage compression. Therefore, the value of n in this model ranged from 2 to 3. Ecom,i represents the energy consumption of the i-th compressor in the n-stage compression process, while EAC,i represents the energy consumption of the i-th air cooler in the n-stage compression process. Pf represents the export pressure of the final-stage compressor, which was required to be 11 MPa according to the current pressurization process. Pm,n−1 denotes the export pressure of the (n − 1)-th compressor in the n-stage compression process, Pm,1 represents the export pressure of the first compressor in each stage of compression, and P0 stands for the inlet pressure of the gas, which was 2 MPa. When the compression ratio is less than 1.5, the efficiency of the compressor significantly decreases, and its performance is also limited. Therefore, it was stipulated that the compression ratio must be greater than or equal to 1.5. TAC,j was the export temperature of the j-th air cooler in the n-stage compression process. Since air coolers were used as the cooling equipment in the pressurization process, it was specified that the minimum export temperature achievable for the air cooler was 32 °C, because the temperature of the air in this case is 32 °C.

4.2. Optimization Process Based on HYSYS and PSO

The traditional approach of manually iterating to find optimal process parameters often involves excessively long design times and may not necessarily yield the optimal solution. In this paper, if the manual iterative method is used, take three-stage compression as an example, where the variables include, 3-2 pressure, 3-3 temperature, 3-4 pressure, and 3-5 temperature. When these four parameters are randomly taken from between their own value ranges, a large number of combinations will occur with a workload that is undoubtedly huge for manual calculation. Therefore, this study explored an efficient method for process optimization by integrating the MATLAB and ASPEN HYSYS software platforms. Utilizing the ActiveX component in MATLAB, seamless connectivity with ASPEN HYSYS was achieved, leading to the development of an automated system for parameter tuning and simulation analysis.
In this system, MATLAB serves as the main control platform responsible for executing parameter optimization tasks based on the Particle Swarm Optimization (PSO) algorithm. PSO iteratively generated and optimized a set of parameters, which were then converted into a format recognized by ASPEN HYSYS through MATLAB interfaces. HYSYS, as the core tool for process simulation, received these parameters from MATLAB and performed a simulation of the pressurization process. During the simulation process, HYSYS accurately computed key indicators such as material balance parameters and energy consumption. These results were then outputted to MATLAB for further analysis and processing.
The following are more detailed steps:
(1)
Establish the model using HYSYS and import the relevant parameters into the spreadsheet within HYSYS. An example is shown in Figure 8.
(2)
Store the HYSYS simulation file and MATLAB code file in the same folder and link HYSYS and MATLAB through ActiveX components within the MATLAB file.
(3)
Utilize the particle swarm optimization algorithm to control the relevant parameters of the input material stream in HYSYS through MATLAB code and activate the HYSYS solver.
(4)
Read the values of each cell in the spreadsheet within HYSYS using MATLAB code and assign these values to the corresponding variables in MATLAB, which represent the various energy consumption components mentioned in the objective function.
(5)
After receiving the simulation results from HYSYS, MATLAB evaluated the objective function and adjusted the parameter update strategy of the PSO algorithm based on this evaluation. This process guided the direction of the next iteration. Through this iterative loop, the optimal pressurization process parameters were gradually approached.
An optimization process flowchart of the underground gas storage pressurization process based on HYSYS and PSO is shown in Figure 9.

5. Results

5.1. Joint Optimization Results

(1)
Analysis of optimization results for two-stage compression
The two-stage compression simulation was carried out through MATLAB combined with HYSYS, the parameter combinations generated by each iteration and the energy consumption results derived from the simulation were integrated, and finally, the curve fitting was carried out through the large amount of data obtained, and the fitting results are shown in Figure 10, and it can be found that the optimal parameter combinations through the simulation results were (6.45 MPa, 32 °C, 12,062,227.58 kJ/h), which meant that when the 2-2 pressure was 6.45 MPa and 2-3 temperature was 32 °C, the energy consumption of the two-stage compression scheme reached the lowest point 12,062,227.58 kJ/h, The parameters mentioned above correspond to the relevant parameters for each stream in Figure 4. More detailed parametric results are shown in Table 3.
(2)
Optimization results for three-stage compression
The three-stage compression simulation was carried out through MATLAB combined with HYSYS. Similarly, curve fitting was performed based on the extensive data obtained, and the fitting results are shown in Figure 11. It can be observed that the optimal parameter combination was (3.680 MPa, 32 °C, 6.455 MPa, 11,349,697.25 kJ/h), which means that when the pressure of stage 3-2 was 3.680 MPa, the temperature of stage 3-3 was 32 °C, and the pressure of stage 3-4 was 6.455 MPa, the energy consumption of the three-stage compression scheme reached its minimum value of 11,349,697.25 kJ/h, The parameters mentioned above correspond to the relevant parameters for each stream in Figure 6. More detailed parametric results are shown in Table 4.

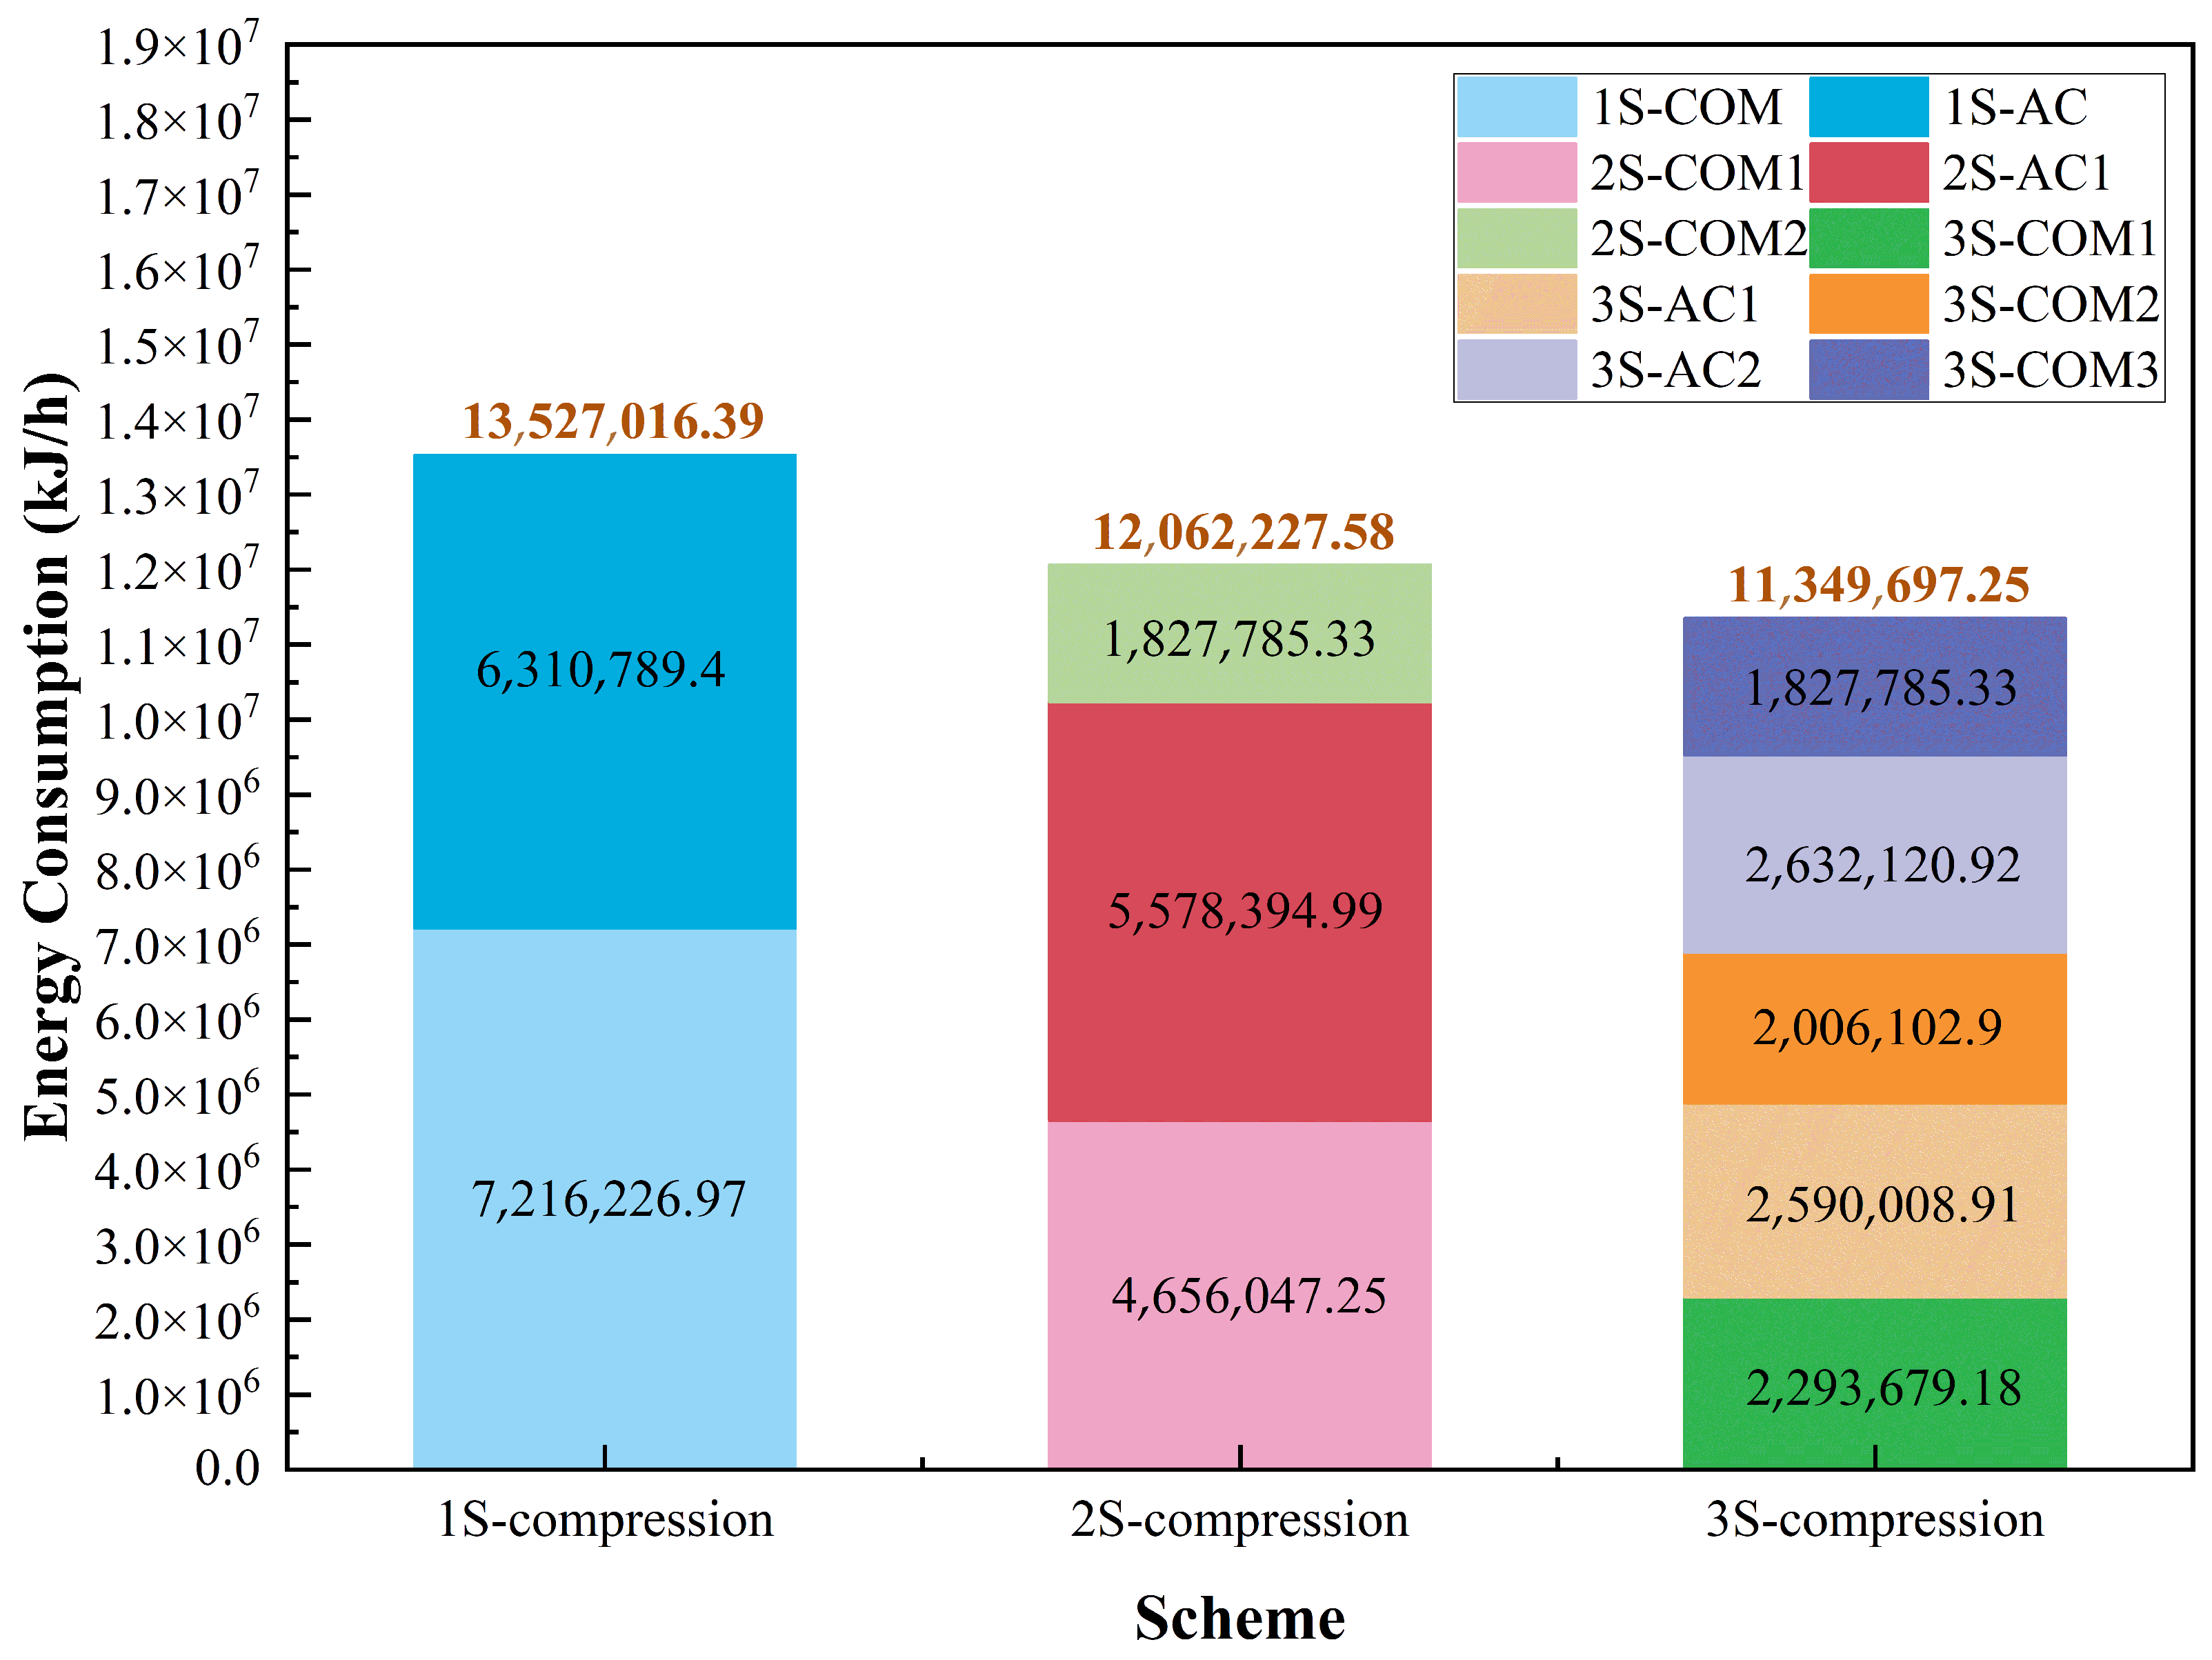
5.2. Results of Various Pressurization Schemes

(1)
Results of energy consumption
By simulating the original process, the two-stage compression and the three-stage compression process, respectively, the unit energy consumption can be obtained when the optimal parameters are adopted for each stage of the compression scheme. The one-stage compression and pressurization part included two parts: 1S-COM and 1S-AC. The total unit energy consumption was 13,527,016.39 kJ/h. The two-stage compression and pressurization part included 2S-COM1, 2S-AC, and 2S-COM2, and the total unit energy consumption was 12,062,227.58 kJ/h. The three-stage compression and pressurization part included 3S-COM1, 3S-AC1, 3S-COM2, 3S-AC2, and 3S-COM3, the total unit energy consumption was 11,349,697.25 kJ/h, which is shown in Figure 12.
According to the simulation results, the two-stage compression and three-stage compression saved 10.83% and 16.10% in energy consumption compared to one-stage compression, respectively. From the perspective of energy consumption, the three-stage compression was better than the two-stage compression in the improved pressurization scheme.
(3)
Construction costs
Compared with one-stage compression, only one additional compressor was needed in two-stage compression, while three-stage compression required two additional compressors and an air cooler. Through the market research on the equipment, the purchase and transportation installation cost of the compressor, air cooler, and its related accessories were obtained, and the statistical results are shown in Table 5. For the construction costs analysis of all pressurization schemes, the construction costs of the original pressurization scheme were USD 239,982.7. The construction costs of the two-stage compression were USD 411,034.26, which was an increase of USD 171,051.56 compared to the original scheme. The construction costs of the three-stage compression were USD 651,016.96, which was an increase of USD 411,034.26 compared to the original scheme. The results of the construction cost comparison are shown in Figure 13.
(3)
Comprehensive costs
The comprehensive costs of the pressurization scheme included the construction costs and the operating costs. The operating cost had to convert the energy consumption into an economic cost. By analyzing the comprehensive cost of the pressurization scheme, its corresponding comprehensive cost function can be obtained, which is shown in Equation (3).
y = a n + b n × 24 × f 3600 x
In the equation, y represents the comprehensive costs, measured in USD, and x represents the number of working days, measured in days. an represents the construction costs of n-stage compression, measured in USD. bn represents the energy consumption, measured in kJ/h. f represents the cost of electricity, which is based on the local electricity price, taken as USD 0.08/kWh in the paper.
The construction costs of one-stage compression were USD 239,982.7, and the energy consumption is 13,527,016.39 kJ/h. Considering that the equipment used in the one-stage compression process belongs to the already built equipment, the construction costs of one-stage compression are not considered in the comprehensive cost calculation, and the reconstruction costs are considered only in the two-stage compression and the three-stage compression. The two-stage compression reconstruction costs are USD 411,034.26, with an energy consumption of 12,062,227.58 kJ/h. The three-stage compression reconstruction costs were USD 651,016.96, with an energy consumption of 11,349,697.25 kJ/h.
The calculation function of the comprehensive costs of all pressurization schemes was plotted as a function image, and the results are shown in Figure 14.
When the number of working days was in (0, 525.53], the comprehensive costs were one-stage compression ≤ two-stage compression < three-stage compression. When the number of working days was in (525.53, 560.56], the comprehensive costs were two-stage compression < one-stage compression ≤ three-stage compression. When the number of working days was in (560.56, 630.631], the comprehensive costs were two-stage compression ≤ three-stage compression < one-stage compression. When the number of working days was greater than 630.631, the comprehensive costs were three-stage compression < two-stage compression < one-stage compression.

6. Conclusions

The energy consumption of a gas storage facility in southwest China is getting higher and higher with an increase in operation time, and the existing situation needs to be improved. In this study, we adopted the process optimization method of underground gas storage pressurization process based on software interaction and applied the optimization model and algorithm to successfully find the optimal parameter combinations of all schemes, in which the two-stage compression scheme and three-stage compression scheme can save energy under the optimal parameter combinations by 10.83% and 16.10%, respectively. Under the current conditions of gas injection demand, although the construction costs of the three-stage compression scheme are higher, considering the long-term operating objectives of the underground gas storage, the reconstruction to three-stage compression can effectively achieve the purpose of energy saving and consumption reduction. Compared with the original scheme, they can save 2,177,319 kJ/h, which is about 16.10%. Therefore, it is more economical and reasonable to reconstruct the current process into three-stage compression, and the specific process flow is as follows: the incoming gas is pressurized to 3.680 MPa through the first compressor (3S-COM1) and the temperature is 84.25 °C at this time. The pressurized gas is cooled to 32 °C by the first air cooler (3S-AC1) and then continues to be pressurized by the second compressor (3S-COM2), and the pressurized gas has a pressure of 6.455 MPa and a temperature of 82.63 °C. The second pressurized gas is cooled to 32 °C by the second air cooler (3S-AC2) and then pressurized to 11 MPa by the third compressor (3S-COM3). At this point, the temperature of the compressed gas is 80 °C, which meets the requirement of injection.
The joint optimization of MATLAB and HYSYS used in this study provided a new way for the optimization decision of the process scheme, and it also can explore parameter optimization problems under different working conditions by changing the number of compression stages, temperature, pressure, and other constraints, which can be expanded in the future for applications in scenarios such as deep-sea oil and gas extraction, hydrogen energy storage and transportation, industrial gas processing, as well as geothermal energy and ground-source heat pump systems. In our future work, we will optimize the whole life cycle and the whole process of underground gas storage, not limited to the current process of a specific period, and not limited to the compressor and air cooler, but extended to the use of motors, valves, tank equipment, and so on, in order to further optimize the gas storage process and to achieve effective energy savings and sustainable economic injection into the gas storage reservoirs.

Author Contributions

Conceptualization, S.C. and Z.Y.; methodology, S.C.; software, Z.Y. and M.S.; validation, S.C. and Z.Y.; formal analysis, Y.L.; investigation, Y.L.; resources, Z.W.; data curation, Z.Y.; writing—original draft preparation, Z.Y.; writing—review and editing, Z.W.; visualization, M.S.; supervision, Z.W.; project administration, Y.L.; funding acquisition, Z.W. All authors have read and agreed to the published version of the manuscript.

Funding

This research was funded by National Natural Science Foundation of China (No. 52104065, 52074090), China Postdoctoral Science Foundation (No. 2022T150089, 2020M681064), Heilongjiang Provincial Natural Science Foundation of China (No. LH2021E019), Heilongjiang Province Postdoctoral Foundation (No. LBH-Z20101), Scientific Research Personnel Training Foundation of Northeast Petroleum University (No. XNYXLY202103) and Northeast Petroleum University Scientific Research Foundation (No. 2019KQ54).

Institutional Review Board Statement

Not applicable.

Informed Consent Statement

Not applicable.

Data Availability Statement

The datasets used during the current study are available from the corresponding author upon reasonable request.

Conflicts of Interest

Authors Shuangqing Chen and Yuchun Li were employed by the company Daqing Oilfield Design Institute Co., Ltd., China National Petroleum Corporation. Author Minglin Si was employed by the company Construction Project Management Sub-Company, China Oil & Gas Pipeline Network Corporation. The remaining authors declare that the research was conducted in the absence of any commercial or financial relationships that could be construed as a potential conflict of interest.

References

  1. Fan, J.; Wang, J.; Liu, M.; Sun, W.; Lan, Z. Scenario Simulations of China’s Natural Gas Consumption under the Dual-Carbon Target. Energy 2022, 252, 124106. [Google Scholar] [CrossRef]
  2. Zhao, X.-G.; Zhu, J. Industrial Restructuring, Energy Consumption and Economic Growth: Evidence from China. J. Clean. Prod. 2022, 335, 130242. [Google Scholar] [CrossRef]
  3. Wang, Y.; Feng, G.; Li, Z.; Xu, W.; Zhu, J.; He, L.; Xiong, Z.; Qiao, X. Retrieving the Displacements of the Hutubi (China) Underground Gas Storage during 2003–2020 from Multi-Track InSAR. Remote Sens. Environ. 2022, 268, 112768. [Google Scholar] [CrossRef]
  4. Haske, B.; Rudolph, T.; Bernsdorf, B. Sustainability in Energy Storages-How Modern Geoscience Concepts Can Improve Underground Storage Monitoring. In Proceedings of the 2nd Geoscience & Engineering in Energy Transition Conference, Online, 23–25 November 2021; European Association of Geoscientists & Engineers: Utrecht, the Netherlands, 2021; Volume 2021, pp. 1–4. [Google Scholar]
  5. Qiao, Y.-K.; Peng, F.-L.; Sabri, S.; Rajabifard, A. Socio-Environmental Costs of Underground Space Use for Urban Sustainability. Sustain. Cities Soc. 2019, 51, 101757. [Google Scholar] [CrossRef]
  6. Menéndez, J.; Ordóñez, A.; Álvarez, R.; Loredo, J. Energy from Closed Mines: Underground Energy Storage and Geothermal Applications. Renew. Sustain. Energy Rev. 2019, 108, 498–512. [Google Scholar] [CrossRef]
  7. Schultz, R.A.; Heinemann, N.; Horváth, B.; Wickens, J.; Miocic, J.M.; Babarinde, O.O.; Cao, W.; Capuano, P.; Dewers, T.A.; Dusseault, M.; et al. An Overview of Underground Energy-Related Product Storage and Sequestration. In Enabling Secure Subsurface Storage in Future Energy Systems; Miocic, J.M., Heinemann, N., Edlmann, K., Alcalde, J., Schultz, R.A., Eds.; Geological Society of London: Bath, UK, 2023; pp. 15–35. ISBN 978-1-78620-576-6. [Google Scholar]
  8. Liu, Y.; Ba, X.; Wang, N.; Cheng, T.; Wen, Y. The Current Status and Optimization Recommendations of Surface Engineering Technologies for Gas Storage Facilities in China. Pet. New Energy 2021, 33, 19–26. [Google Scholar]
  9. Tarkowski, R. Underground Hydrogen Storage: Characteristics and Prospects. Renew. Sustain. Energy Rev. 2019, 105, 86–94. [Google Scholar] [CrossRef]
  10. Al-Shafi, M.; Massarweh, O.; Abushaikha, A.S.; Bicer, Y. A Review on Underground Gas Storage Systems: Natural Gas, Hydrogen and Carbon Sequestration. Energy Rep. 2023, 9, 6251–6266. [Google Scholar] [CrossRef]
  11. Iwaszczuk, N.; Zapukhliak, I.; Iwaszczuk, A.; Dzoba, O.; Romashko, O. Underground Gas Storage Facilities in Ukraine: Current State and Future Prospects. Energies 2022, 15, 6604. [Google Scholar] [CrossRef]
  12. Vo Thanh, H.; Safaei-Farouji, M.; Wei, N.; Band, S.S.; Mosavi, A. Knowledge-Based Rigorous Machine Learning Techniques to Predict the Deliverability of Underground Natural Gas Storage Sites for Contributing to Sustainable Development Goals. Energy Rep. 2022, 8, 7643–7656. [Google Scholar] [CrossRef]
  13. Liu, H.; Yang, C.; Liu, J.; Hou, Z.; Xie, Y.; Shi, X. An Overview of Underground Energy Storage in Porous Media and Development in China. Gas Sci. Eng. 2023, 117, 205079. [Google Scholar] [CrossRef]
  14. Tong, G.; Guiqiang, L.; Jinxiu, W.; Ping, W.; Dandan, S.; Shan, G.; Pai, L.; Qiang, W. Research on Energy Saving and Consumption Reduction Technology of Underground Gas Storage Compressor. J. Phys. Conf. Ser. 2019, 1187, 032059. [Google Scholar] [CrossRef]
  15. Chen, Q.; Zuo, L.; Wu, C.; Li, Y.; Hua, K.; Mehrtash, M.; Cao, Y. Optimization of Compressor Standby Schemes for Gas Transmission Pipeline Systems Based on Gas Delivery Reliability. Reliab. Eng. Syst. Saf. 2022, 221, 108351. [Google Scholar] [CrossRef]
  16. Li, Z.; Li, C.; Jia, W.; Chen, Y.; Zhang, C.; Xiao, H.; Pu, Z. Co-Optimization Method for Injection Strategy of Underground Natural Gas Storage Integrating Aboveground and Underground Parts. Gas Sci. Eng. 2024, 128, 205376. [Google Scholar] [CrossRef]
  17. Jokar, S.M.; Parvasi, P. Compressed, Liquefied, and Adsorbed Natural Gas Processes Simulation and Modeling. In Advances Natural Gas: Formation, Processing, and Applications. Volume 8: Natural Gas Process Modelling and Simulation; Elsevier: Amsterdam, The Netherlands, 2024; pp. 529–553. [Google Scholar]
  18. Hasan, M.H.; Hassan, Q.A.; Amit, S.K.; Amin, R. ASPEN-HYSYS Simulation of Natural Gas Processing Plant & Analysis of Different Operating Parameters. In Proceedings of the International Conference on Materials, Electronics & Information Engineering, ICMEIE-2015, Rajshahi, Bangladesh, 27–28 February 2015. [Google Scholar] [CrossRef]
  19. Ansari, N.; Ayatollahi, S.; Riazi, M. Underground Natural Gas Storage in a Low Quality Gas Reservoir-Produced Gas Quality Control by Rate Optimization. In Proceedings of the 79th EAGE Conference and Exhibition 2017, Paris, France, 12 June 2017. [Google Scholar]
  20. Szablowski, L.; Krawczyk, P.; Badyda, K.; Karellas, S.; Kakaras, E.; Bujalski, W. Energy and Exergy Analysis of Adiabatic Compressed Air Energy Storage System. Energy 2017, 138, 12–18. [Google Scholar] [CrossRef]
  21. Krawczyk, P.; Szabłowski, Ł.; Karellas, S.; Kakaras, E.; Badyda, K. Comparative Thermodynamic Analysis of Compressed Air and Liquid Air Energy Storage Systems. Energy 2018, 142, 46–54. [Google Scholar] [CrossRef]
  22. Mikołajczak, A.; Krawczyk, P.; Kurkus-Gruszecka, M.; Badyda, K. Analysis of the Liquid Natural Gas Energy Storage Basing on the Mathematical Model. Energy Procedia 2019, 159, 231–236. [Google Scholar] [CrossRef]
  23. Alnili, F.N.H. Natural Gas Processing for Removal of Sour Gases and Their Storage for Production of LNG and Its Gasification. Ph.D. Thesis, Curtin University, Bentley, Australia, 2020. [Google Scholar]
  24. Zhou, J.; Qin, C.; Peng, J.; Fang, S.; Hu, C.; Liang, G. Multiobjective Operation Optimization of Depleted Gas Storage Based on a Reference Vector–Guided Evolutionary Algorithm. J. Energy Eng. 2024, 150, 04023055. [Google Scholar] [CrossRef]
  25. Zhou, J.; Fu, T.; Wu, K.; Zhao, Y.; Feng, L. Optimization Design of Multi-Gathering Mode for the Surface System in Coalbed Methane Field. Petroleum 2023, 9, 237–247. [Google Scholar] [CrossRef]
  26. Chen, Q.; Wu, C.; Zuo, L.; Mehrtash, M.; Wang, Y.; Bu, Y.; Sadiq, R.; Cao, Y. Multi-Objective Transient Peak Shaving Optimization of a Gas Pipeline System under Demand Uncertainty. Comput. Chem. Eng. 2021, 147, 107260. [Google Scholar] [CrossRef]
  27. Hao, Y.; He, Q.; Fu, H.; Du, D.; Liu, W. Thermal Parameter Optimization Design of an Energy Storage System with CO2 as Working Fluid. Energy 2021, 230, 120688. [Google Scholar] [CrossRef]
  28. Zhou, J.; Zhao, Y.; Fu, T.; Zhou, X.; Liang, G. Dimension Optimization for Underground Natural Gas Storage Pipeline Network Coupling Injection and Production Conditions. Energy 2022, 256, 124651. [Google Scholar] [CrossRef]
  29. Pan, J.; Li, Y.; Cao, Q.; Han, B.; Wang, J.; Li, R. Simulation and optimization of natural gas liquefaction process based on two-stage throttling refrigeration cycle. Nat. Gas Ind. 2024, 44, 111–121. [Google Scholar]
  30. Qiao, W.; Fu, Z.; Du, M.; Nan, W.; Liu, E. Seasonal Peak Load Prediction of Underground Gas Storage Using a Novel Two-Stage Model Combining Improved Complete Ensemble Empirical Mode Decomposition and Long Short-Term Memory with a Sparrow Search Algorithm. Energy 2023, 274, 127376. [Google Scholar] [CrossRef]
  31. Vo Thanh, H.; Zamanyad, A.; Safaei-Farouji, M.; Ashraf, U.; Hemeng, Z. Application of Hybrid Artificial Intelligent Models to Predict Deliverability of Underground Natural Gas Storage Sites. Renew. Energy 2022, 200, 169–184. [Google Scholar] [CrossRef]
  32. Ali, A. Data-Driven Based Machine Learning Models for Predicting the Deliverability of Underground Natural Gas Storage in Salt Caverns. Energy 2021, 229, 120648. [Google Scholar] [CrossRef]
  33. Jelušič, P.; Kravanja, S.; Žlender, B. Optimal Cost and Design of an Underground Gas Storage by ANFIS. J. Nat. Gas Sci. Eng. 2019, 61, 142–157. [Google Scholar] [CrossRef]
  34. Wang, J.; An, G.; Shan, B.; Wang, W.; Jia, J.; Wang, T.; Zheng, X. Parameter Optimization of Solution Mining under Nitrogen for the Construction of a Gas Storage Salt Cavern. J. Nat. Gas Sci. Eng. 2021, 91, 103954. [Google Scholar] [CrossRef]
  35. Curin, N.; Kettler, M.; Kleisinger-Yu, X.; Komaric, V.; Krabichler, T.; Teichmann, J.; Wutte, H. A Deep Learning Model for Gas Storage Optimization. Decis. Econ. Financ. 2021, 44, 1021–1037. [Google Scholar] [CrossRef]
  36. Zhou, J.; Peng, J.; Liang, G.; Sun, J. Optimization of Injection-Withdrawal Schedules for Underground Gas Storage in a Multi-Block Depleted Gas Reservoir Considering Operation Stability. Energy Sources Part A Recovery Util. Environ. Eff. 2021, 1–16. [Google Scholar] [CrossRef]
  37. Joseph, M.; Fu, P.; Sherman, C.; Wu, H.; Huang, J.; Fu, W. An Investigation of Candidate Mechanisms for Hydraulic Fracture Swarming through High-Fidelity Numerical Modeling. In Proceedings of the SPE Hydraulic Fracturing Technology Conference and Exhibition, The Woodlands, TX, USA, 4–6 February 2022; p. D021S004R003. [Google Scholar]
  38. Lin, M.; Yan, G.; Liu, T.; Wu, X.; Yu, P. Simulation and Optimization of Surface Gas Injection Systems for Underground Gas Storage. ACS Omega 2023, 8, 32099–32107. [Google Scholar] [CrossRef]
  39. Qi, D. Feasibility and Parameter Optimization Study on the Reconstruction of Gas Storage. Master’s Thesis, China University of Petroleum, Beijing, China, 2023. [Google Scholar]
Figure 1. Existing pressurization system process.
Sustainability 16 08902 g001
Figure 2. Existing pressurization system process model.
Sustainability 16 08902 g002
Figure 3. The two-stage compression system process.
Sustainability 16 08902 g003
Figure 4. The two-stage compression system process model.
Sustainability 16 08902 g004
Figure 5. The three-stage compression system process.
Sustainability 16 08902 g005
Figure 6. The three-stage compression system process model.
Sustainability 16 08902 g006
Figure 7. Schematic diagram of the software solution results. (a) Energy consumption of compressor. (b) Energy consumption of air cooler.
Sustainability 16 08902 g007
Figure 8. An example of a spreadsheet for importing parameters in HYSYS.
Sustainability 16 08902 g008
Figure 9. Optimization process flowchart based on HYSYS and PSO.
Sustainability 16 08902 g009
Figure 10. Two-stage compression joint optimization results.
Sustainability 16 08902 g010
Figure 11. Three-stage compression joint optimization results.
Sustainability 16 08902 g011
Figure 12. Analysis of energy consumption of various pressurization schemes.
Sustainability 16 08902 g012
Figure 13. Analysis of construction costs of various pressurization schemes.
Sustainability 16 08902 g013
Figure 14. Analysis of comprehensive costs of various pressurization schemes.
Sustainability 16 08902 g014
Table 1. Injected natural gas components and concentrations.
ComponentConcentrations (mol%)
Methane93.7959236
Ethane3.2997936
Propane0.8784905
i-Butane0.1659304
n-Butane0.2431911
i-Pentane0.10178
n-Pentane0.0805633
n-Hexane0.0620488
n-Heptane0.0360283
Carbon dioxide0.8410611
Nitrogen0.4951892
Total100
Table 2. Main parameters in the existing pressurization system process model.
ParameterValue
1-1 pressure2MPa
1-1 temperature30 °C
1-1 mole flow rate1158 kmol/h
1-1 components and concentrationsSame as the injected natural gas in Table 1
1S-COM adiabatic efficiency75%
1-2 pressure11 MPa
1-2 temperature199.3 °C
1-3 temperature80 °C
Table 3. Main parameters in the two-stage compression system process model.
ParameterValue
2-1 pressure2 MPa
2-1 temperature30 °C
2-1 mole flow rate1158 kmol/h
2-1 components and concentrationsSame as the injected natural gas in Table 1
2S-COM1 adiabatic efficiency80%
2-2 pressure6.45 MPa
2-2 temperature143.3 °C
2-3 temperature32 °C
2S-COM2 adiabatic efficiency80%
2-4 pressure11 MPa
2-4 temperature80 °C
Table 4. Main parameters in the three-stage compression system process model.
ParameterValue
3-1 pressure2 MPa
3-1 temperature30 °C
3-1 mole flow rate1158 kmol/h
3-1 components and concentrationsSame as the injected natural gas in Table 1
3S-COM1 adiabatic efficiency80%
3-2 pressure3.68 MPa
3-2 temperature84.25 °C
3-3 temperature32 °C
3S-COM2 adiabatic efficiency80%
3-4 pressure6.455 MPa
3-4 temperature82.63 °C
3-5 temperature32 °C
3S-COM3 adiabatic efficiency75%
3-6 pressure11 MPa
3-6 temperature80 °C
Table 5. Construction costs of a single unit of equipment.
EquipmentEquipment CostsAccessory CostInstallation and Transportation CostsTotal Costs
CompressorUSD 136,841.22USD 13,684.14USD 20,526.20USD 171,051.56
Air CoolerUSD 50,889.87USD 6932.84USD 11,108.43USD 68,931.14
Disclaimer/Publisher’s Note: The statements, opinions and data contained in all publications are solely those of the individual author(s) and contributor(s) and not of MDPI and/or the editor(s). MDPI and/or the editor(s) disclaim responsibility for any injury to people or property resulting from any ideas, methods, instructions or products referred to in the content.

