Article

Evaluation of Thermal Comfort Conditions in the Working Environments of Seasonal Agricultural Workers in Csa Koppen Climate Type

by
Nihat Karakuş
1,
Serdar Selim
2,
Ceren Selim
3,
Rifat Olgun
1,*,
Ahmet Koç
4,
Zeynep R. Ardahanlıoğlu
5,
Sülem Şenyiğit Doğan
4 and
Nisa Ertoy
6
1
Vocational School of Serik G-S. Sural, Akdeniz University, 07500 Antalya, Türkiye
2
Faculty of Science, Akdeniz University, 07070 Antalya, Türkiye
3
Faculty of Architecture, Akdeniz University, 07070 Antalya, Türkiye
4
Diyarbakır Vocational School of Technical Sciences, Dicle University, 21200 Diyarbakır, Türkiye
5
Vocational School of Fethiye Ali Sıtkı Mefharet Kocman, Mugla Sitki Kocman University, 48000 Fethiye, Türkiye
6
Vocational School of Technical Sciences, Akdeniz University, 07070 Antalya, Türkiye
*
Author to whom correspondence should be addressed.
Sustainability 2024, 16(20), 8903; https://doi.org/10.3390/su16208903
Submission received: 11 September 2024 / Revised: 9 October 2024 / Accepted: 11 October 2024 / Published: 14 October 2024

Abstract

:
This study focuses on determining the thermal comfort conditions of seasonal agricultural workers during the hot periods of the year when agricultural production is intense in the Aksu/Türkiye region, which is characterized by the Csa climate type according to the Köppen–Geiger climate classification. In this study, the thermal comfort conditions of seasonal agricultural workers working on open farmlands were evaluated in ten-day, monthly, and seasonal periods for 6 months between 5:00 and 21:00 h using the modified Physiological Equivalent Temperature (mPET) index in the Rayman Pro software according to their activity energy during work. The results of the study reveal that increased activity energy leads to a decrease in thermal comfort conditions of agricultural workers, mPET values of agricultural workers engaged in soil cultivation (Group II) are 2.1 to 2.9 °C higher than the mPET values of workers engaged in plant care and harvesting (Group I), and the agricultural workers in Group II are exposed to more heat stress. The thermal comfort conditions of agricultural workers in Group I deteriorate between 09:00 and 16:00 h with mPET values between 34.1 and 35.3 °C and those of agricultural workers in Group II deteriorate between 08:00 and 17:00 h with mPET values between 34.3 and 37.7 °C. In this context, the daily comfortable working time in the morning and afternoon was found to be 9 h for Group I and 7 h for Group II. Overall, determining the comfortable working hours of agricultural workers in regions with different climate types in future studies will be an important resource for decision-makers in developing strategies to protect the health and increase the productivity of agricultural workers.

1. Introduction

Global warming refers to the long-term increase in the earth’s average surface temperature [1]. Although this warming trend has been ongoing for a long time, its rate has increased significantly in the last hundred years due to anthropogenic influences [2]. The consequences of global warming, in addition to temperature changes, have had broad and comprehensive effects on various aspects of the environment, society, and all economies, including agriculture [3]. The agricultural sector is one of the sectors most affected by global warming. Because climate is one of the important factors in agricultural production and productivity [4]. The agricultural sector has been affected by climate change globally and this has caused significant damage, especially to the economies of developing countries [5]. The effect of global warming on agricultural activities has been the subject of many studies, especially since the 1990s [6]. These studies mostly focus on the diversity of agricultural products [7], productivity [8], diseases and pests [9,10], physiological demands of agricultural products [11,12], changes in agricultural product patterns [13], changes in growing seasons of agricultural products [14], and ecological conditions in agricultural areas [15]. In addition, although studies have been conducted investigating the social, psychological and health effects of global warming on agricultural workers [16,17], the lack of studies on the thermal comfort conditions of these workers, working in open areas and under the sun, has attracted attention [18,19].
Compared to developed countries, it is known that workers in the agricultural sector in developing countries such as Türkiye mostly work with physical labor [20,21,22]. According to the 2023 data of the Turkish Statistical Institute (TUIK), the number of registered jobs in the agricultural sector in Türkiye is announced at 4,695,000 people, which constitutes 14.8% of total employment. However, unregistered employment, which can be defined as not reporting the time a person works and/or the wage to the official authorities, is reported to be 84.5% in the agricultural sector, according to the data announced by TUIK [23]. Therefore, the agricultural sector in Türkiye is one of the leading sectors. Agricultural workers in low- and middle-income countries are more vulnerable than workers using advanced agricultural mechanization because many of them engage in heavy physical labor in direct sunlight, outdoors, and for long periods of time [24]. Labor supply and productivity are sensitive to global warming and heat stress in the agricultural sector, which is highly dependent on outdoor work [25]. Long-term exposure to heat reduces physical activity capacity and reduces productivity in a wide variety of workplaces [26]. The level of environmental heat exposure determines how many hours workers can carry out their activities productively, and a limited workforce capacity will lead to decreased productivity and efficiency in economic activities, especially agriculture [22,27]. In addition, working under the sun and being exposed to heat for long periods of time can reduce work capacity and cause serious health problems, such as heat stroke, muscle cramps, heat exhaustion, dizziness, weakness, and other symptoms of heat stress, and even death [28]. Agricultural workers who physically work outdoors for long periods of time under direct sunlight and high temperatures are at high risk of health problems because they are exposed to dehydration and do not have adequate knowledge about preventing heat exposure. Agricultural workers face many more health risks than other workers working in open areas because they spend intense energy under the sun [22]. Therefore, investigating the thermal comfort conditions of agricultural workers is very important in terms of health, social, cultural, psychological, economic, productivity, and efficiency.
This study focused on determining the thermal comfort conditions of agricultural workers working physically in open areas and developing recommendations within the scope of relevant regulations. According to Labor Law No. 4857, agricultural work in Türkiye is defined as the cultivation, planting, production, breeding, pruning, irrigation, and fertilization of all kinds of plants, combating diseases and pests, soil reclamation, and protection of meadows, pastures, soil, and water. In Türkiye, an agricultural worker is defined as a person who engages in agricultural activities, such as soil preparation, plant cultivation, plant care, harvesting, seeding, fertilization, irrigation, and use of agricultural equipment, and participates in production processes, usually by working regularly or seasonally in farms, gardens, or fields [29]. In Türkiye, agricultural workers are mostly people with low levels of education and income. Agricultural workers work in agricultural fields for a certain wage, with or without a contract, and their social rights are protected within the scope of the Labor Law, Social Insurance and General Health Insurance Law, Occupational Health and Safety Law, and related regulations. There is no comprehensive definition of the working conditions of agricultural workers in the relevant legislation. However, the regulation of working conditions and hours is quite important in terms of worker health and productivity. Thermal comfort is a mood that is evaluated subjectively and reflects satisfaction with the thermal environment [30]. Thermal comfort can also be defined as a person’s own awareness of the thermal atmosphere and is defined as a person’s neutral feeling regarding a particular thermal environment [31,32].
In the study, the modified physiological equivalent temperature (mPET) index was used in the Rayman model to determine thermal comfort conditions. This index is a frequently preferred index in the literature, used to measure an individual’s thermal comfort in a certain situation by comparing physiological responses with responses in the reference environment by combining climate data and thermo-physiological parameters [32]. The most widely used index in recent years to determine thermal comfort conditions is the physiological equivalent temperature (PET) index, determined by Höppe [33], with his approach based on finding the balance between human skin and internal temperature in the external environment. PET is defined as the air temperature at which, in a typical indoor environment, the human body’s energy budget is balanced by the same skin temperature as the complex outdoor conditions to be evaluated [33,34]. The widely used RayMan model, which allows computer-based calculation of the PET index, is a micro-scale model developed at the Albert Ludwigs University of Freiburg to calculate radiation fluxes in simple and complex environments. The model predicts shortwave radiation fluxes together with the effects of clouds and solid obstacles. Taking complex structures into account, the model is suitable for use and planning purposes at different local and regional levels [35]. This model calculates the mean radiant temperature, which is used as input in calculating the energy balance index for humans. To calculate thermal indices based on human energy balance, meteorological (air temperature, wind speed, relative humidity, short- and long-wave radiation fluxes/cloudiness) and thermo-physiological (activity and clothing) data are required [35,36,37].
Since human thermal discomfort is a serious concern in open-field agricultural activities, especially under high temperatures, determining a person’s thermal comfort or discomfort with the mPET index is aimed at. This thermal discomfort directly affects a person’s health and productivity, and therefore agricultural productivity [38,39]. Türkiye’s Aksu/Antalya region, which was chosen as the study area, is very productive in terms of agricultural production. The region’s economy is mostly based on the agricultural sector, 45.64% of the land distribution in the region is agricultural land, and vegetable growing has a significant share in total production with a rate of 78.57% [40]. A large part of the region’s population is engaged in agriculture, and open-field vegetable cultivation is practiced in an area of approximately 100,000 decares [41]. Therefore, the number of workers in the open-field agricultural sector is also quite high. The following were important in choosing the study area to determine the thermal comfort conditions of agricultural workers: the region is under the influence of the Mediterranean climate, characterized by the Csa climate type in the Köppen–Geiger climate classification; the production, maintenance, and harvest periods of open-field vegetables in the region are mostly between April and September; agricultural workers work 5 days a week and 8 h a day, for a total of 40 h.
This study is important because, in the literature research so far, no study has been found that evaluates the thermal comfort conditions of agricultural workers working with physical labor in open areas and develops recommendations in this context. Therefore, it is envisaged that this study will contribute to the agricultural sector of regions with Csa climate type and Türkiye, guide the relevant regulations, be a reference for decision-makers, and support agricultural productivity internationally within the scope of agricultural workers.

2. Materials and Methods

2.1. Study Area

Aksu district, chosen as the study area, is one of the central districts of Antalya province, located in the south of Türkiye, on the Mediterranean coast, and is located at the coordinates of 36°56′44.43″ N and 30°51′11.77″ E (Figure 1). Aksu district, 18 km away from Antalya city center and located on the coast, has a population of 80,350 people according to 2023 data and still receives immigration [41,42].
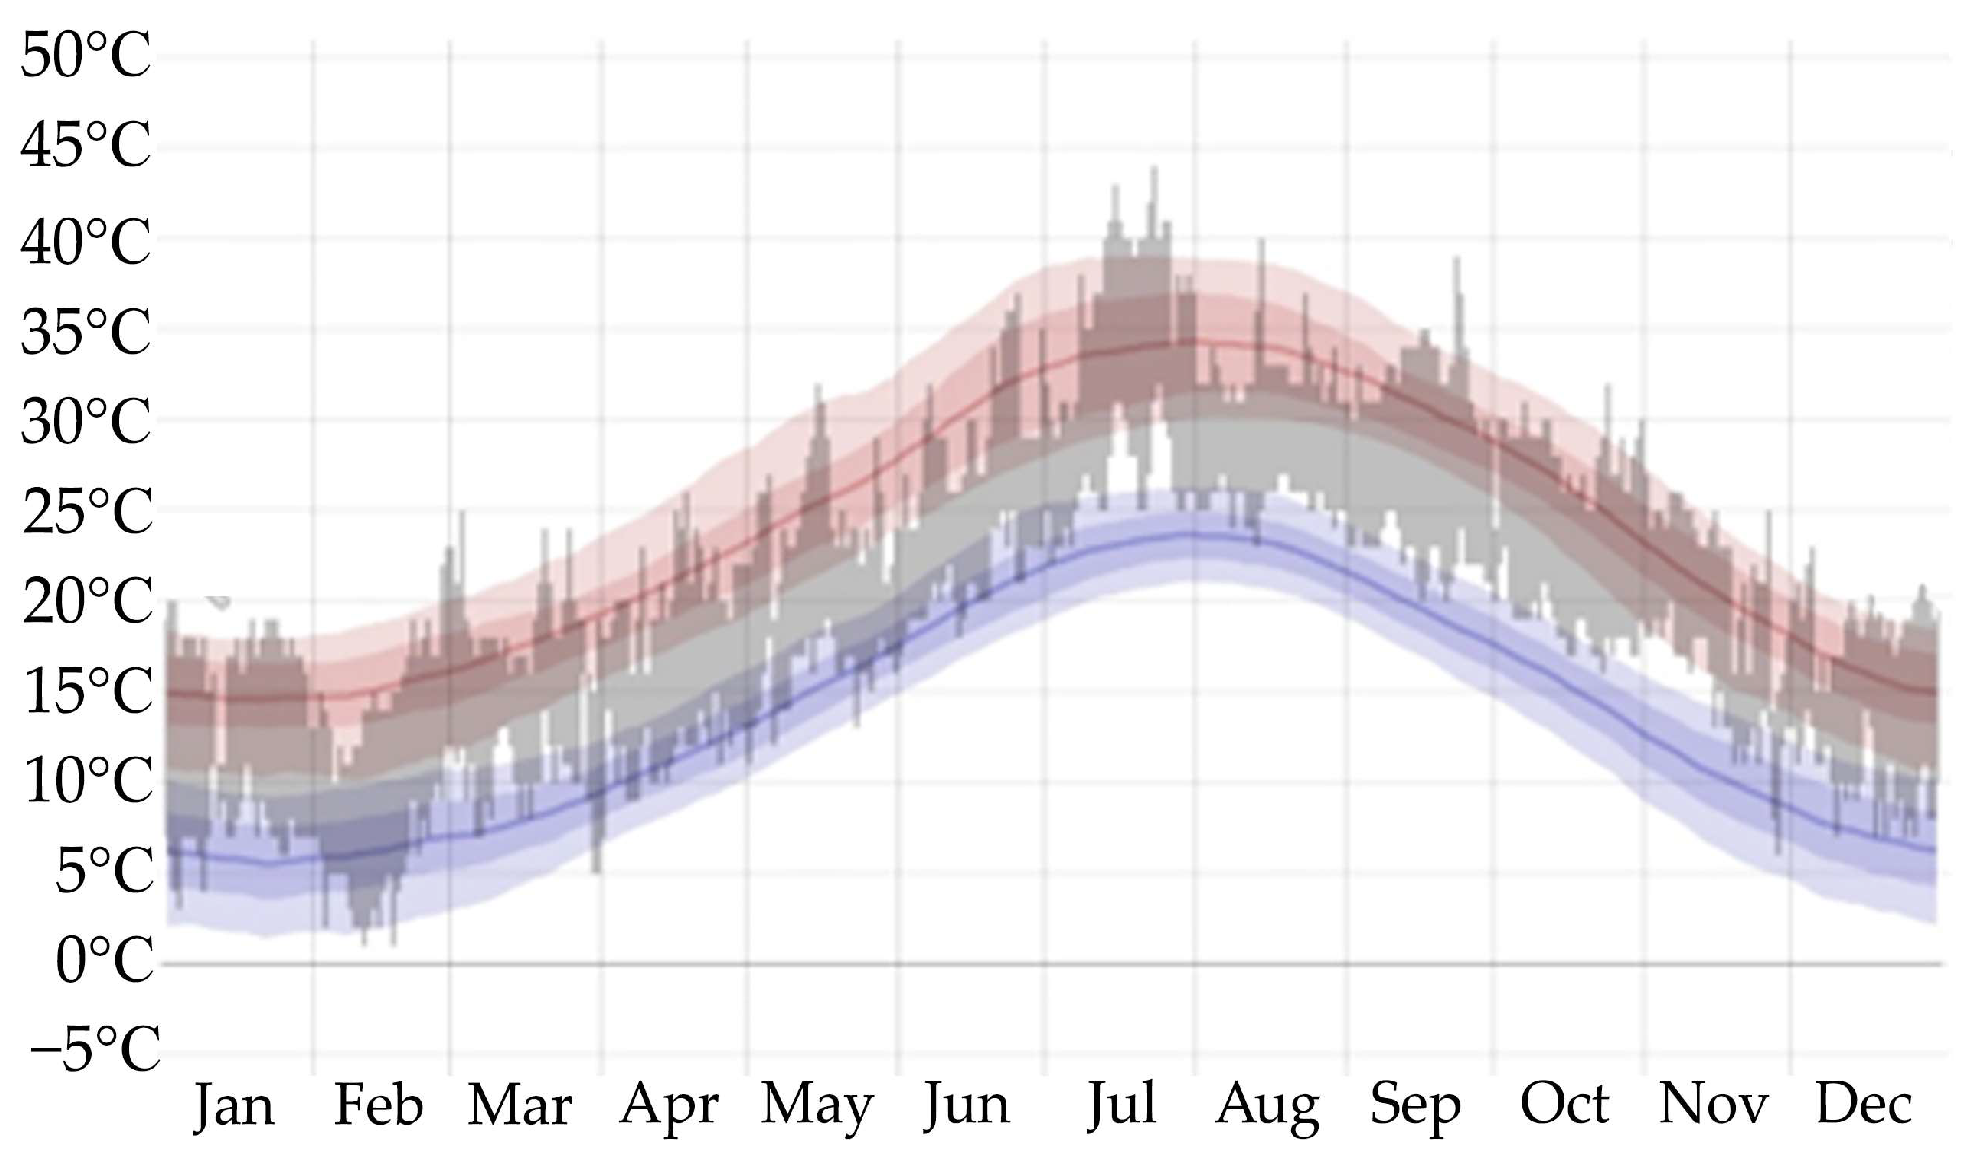
The study area is under the influence of the Mediterranean climate, which is characterized by the Csa climate type according to the Köppen–Geiger climate classification, with warm winter months and very hot and dry summer months. The meteorological data of the study area were obtained from the meteorological station located within its limits and representing the study area. The annual average temperature is 18.8 °C (Figure 2), and the annual average number of sunny days is 300 days [43]. The average annual relative humidity in the region is 62%. In July and August, when the average temperature is high, the relative humidity value does not fall below 50% due to the effect of the moist air mass coming from the sea, and 54.2% of the average annual precipitation, which is 1200 mm, falls in the winter season. In summer, precipitation values decrease due to the effect of tropical air mass [44].
The district’s economy predominantly relies on agriculture, with over 50% of the people employed in this sector. The Aksu district contains around 35,000 decares of greenhouses and 32,000 decares of orchards. Open-field vegetables are cultivated on roughly 100,000 decares, while ornamental plants are planted on an area of 700 decares. The district encompasses a total surface area of 44,592 hectares, comprising 20,350 hectares of agricultural land, 2700 hectares of meadow pasture, and 21,542 hectares of forest and non-agricultural resources. Agricultural regions comprise almost 50% of the overall land area. The proportion of agricultural output values attributed to open-field vegetable cultivation, fruit cultivation, and field crops constitutes 92.23% of total production [40].
The location of the region, its geographical structure, its climate, its large agricultural lands, the effective maintenance of open-field agriculture, the meteorology station’s measurement of agricultural land, and the fact that the regional economy is based on agriculture and seasonal agricultural workers mostly work in open fields were important in choosing the region as a study area.

2.2. Data Sets

The study utilized climate data sets and thermo-physiological data sets to ascertain the thermal comfort conditions of agricultural workers. The climatic data set was generated utilizing the hourly averages of temperature, relative humidity (Figure 3), wind speed, and cloud cover (Figure 4) [46]. The data were recorded at the Aksu/Boztepe Tigem meteorology station on agricultural land from 05:00 to 21:00 between 2015 and 2020. The meteorological station in the region is situated on the outskirts of Aksu city center, at an elevation of 10 m above sea level, with coordinates 36°56′21.5″ N and 30°53′52.8″ E, in open terrain east of the Aksu Stream. Agricultural endeavors in the region are centered around this station.
Agricultural workers benefit from daylight so that they can work physically in open areas. Therefore, sunrise and sunset times are effective in defining working hours between 08:00 and 17:00 in accordance with the legislation. Sunrise and sunset times are important during periods when agricultural activities are intensive. From the beginning of April to the end of September, the sun rises at 05:37 at the earliest and sets at 20:19 at the latest. During this period, the average sun benefit period is 13 h.
While the hourly average temperature data of the meteorological station generally shows an increasing trend from morning to noon in all months, it shows a decreasing trend from noon to evening. The temperature during the day shows an increasing trend until mid-June, after reaching its lowest level of 12.3 °C at 20:00 in early April. It shows a partial decrease in mid-June and an increasing trend again from the end of June to mid-August. It reaches its highest level at 35.5 °C at 11:00 in mid-August and then shows a gradual decreasing trend.
The hourly average relative humidity data of the meteorological station is inversely proportional to the temperature in all months and generally shows a decreasing trend from morning to noon, while it shows an increasing trend from noon to evening. Relative humidity during the day peaks at 96.6% at 20:00 in early April and then shows a decreasing trend until the beginning of July. After reaching its lowest level of 27% at 06:00 in early July, it shows an increasing trend until mid-September and then a decreasing trend.
The hourly average wind speed data from the meteorological station exhibits a correlation with the temperature across all months. Wind velocity typically climbs from morning to noon and diminishes from noon to evening. The windspeed rises from early April to mid-June, declines slightly in mid-June, and then ascends again from late June to mid-July. It reaches a maximum of 4.3 m/h at 12:00 in mid-July, then exhibiting a declining pattern until early August. Following its nadir of 0.6 m/h at 18:00 at the onset of August, it ascends until the month’s conclusion, subsequently exhibiting a slow decline.
The hourly cloudiness data of the meteorological station is similar to the temperature in all months, generally increasing from morning to late afternoon and decreasing from noon to evening. While cloudiness during the day shows an increasing trend from the beginning of April to mid-April, it peaks at 5.2 octas in mid-April and then shows a decreasing trend until the beginning of May. It rises again from the beginning of May to mid-May and reaches its highest level again with 5.2 octas in mid-May. It shows a decreasing trend from mid-May to the beginning of July and reaches its lowest level (0 octas) at the beginning of July when the sky becomes clear. Cloudiness gradually increases from the beginning of July to the end of August, reaches its lowest level again at the beginning of September, and then shows an increasing trend again.
The thermo-physiological data set refers to the data of a 35-year-old male individual sitting outdoors with a metabolic rate of 80 W and clothing heat transfer of 0.90 clo, which is considered the RayMan constant in many studies [32,35]. A measure of 80 W activity energy is defined for daily routine work and is used as a standard in determining outdoor thermal comfort conditions. However, for agricultural workers, since they have higher activity energy compared to the work they do while working on agricultural lands, they are evaluated in two groups as the 170 W (group I) and 235 W (group II) [47,48] according to their activity energy.

2.3. Methods

The RayMan model was used to determine the thermal comfort conditions of seasonal agricultural workers working in open agricultural areas in the Csa climate type according to their activity energy during their work. The RayMan model was created by Dr. Andreas Matzarakis and his associates at the Research Centre for Human Biometeorology of the German Meteorological Service (Deutscher Wetterdienst) [34,49]. RayMan is a micro-scale model designed to compute radiation fluxes in both simple and complicated situations. The model calculates shortwave radiation fluxes along with the impacts of clouds and solid obstructions. The model accounts for intricate structures and is appropriate for application and planning at various local and regional tiers [35,36,37]. This model computes the mean radiant temperature (Tmrt), utilized as input for determining the energy balance index for humans. Calculating thermal indices based on human energy balance necessitates meteorological data (air temperature, wind speed, relative humidity, short- and long-wave radiation fluxes/cloudiness) and thermo-physiological data (activity and clothing) [35]. Thermo-physiological characteristics are employed in numerous studies, utilizing data from a 35-year-old male seated outdoors, exhibiting an activity energy expenditure of 80 W and a clothing heat transfer value of 0.90 clo, which is recognized as the RayMan constant [32,35,49,50,51].
A measure of 80W activity energy has been defined for daily routine work in outdoor thermal comfort conditions, but it is not appropriate to use this standard for agricultural workers. Because agricultural workers have higher activity energy while working on agricultural lands, in this context 170 W activity energy is defined for light agricultural activities, such as plant care, pruning, and harvesting [47]. In Ansi/Ashrae Standard, the activity energy of human-powered soil cultivation for agricultural workers is defined as 235 to 280 W [48]. For this reason, the activity energy of agricultural workers in plant care-harvesting works, which are light agricultural activities, is defined as 170 W (Group I). Activity energy in soil cultivation work that require heavier labor is defined as 235 W (Group II). Therefore, in this study, agricultural workers were evaluated by dividing them into two groups. While determining the thermal comfort conditions of agricultural workers during their seasonal work, covering the period from the beginning of April to the end of September, all other thermo-physiological properties except activity energy were kept constant in the RayMan model. The thermal comfort conditions of seasonal agricultural workers were calculated using the mPET index in the RayMan Pro software according to 170W and 235W activity energies.
The RayMan model, thermal comfort with a predicted mean vote (PMV), physiological equivalent temperature (PET), standard effective temperature (SET*), universal thermal climate index (UTCI), perceived temperature (PT), and modified physiological equivalent temperature (mPET) indexes can be calculated. The predominant index for assessing outdoor thermal comfort in recent years is the Physiological Equivalent Temperature (PET), established by Höppe [33], which evaluates the equilibrium between human skin and internal temperature in the external environment. PET is the air temperature at which the human body’s energy budget equilibrates with the intricate outdoor conditions and maintains a consistent skin temperature in a standard indoor environment [33,34,52]. The thermal effect of the real environment is evaluated by the human energy balance equation (Equation (1)). The equation assumes that, at any given time, the sum of these variables equals zero.
M + W o + R + C + E s k + E r e s + E s w + S = 0
M: metabolic heat, Wo: mechanical work, R: the fluxes of radiation, C: sensible heat, Esk: latent heat through the skin, Eres: latent heat through respiration, Esw: latent heat through sweating, S: heat storage (S is assumed to equal 0 W at any time (assuming a steady state)) [33].
Although the PET index is more widely used in the literature to determine outdoor thermal comfort conditions according to the RayMan constant [53,54,55], when there are differences in thermo-physiological properties, the mPET index developed by Chen et al. [50] is preferred because it produces more sensitive results than the PET index. Moreover, mPET is preferred because it is sensitive to the effect of humidity in hot and humid regions, such as the study area, and can explain the subjective humidity perception of individuals [51,56,57]. mPET has been refined to address the limitations of PET by augmenting the evaluation of climatic and thermo-physiological parameters, notably relative humidity (RH), clothing coefficient (clo), and activity energy [50]. In the study, the mPET index considers the thermo-physiological characteristics of people as well as atmospheric parameters, reflects these characteristics into the results, and gives thermal comfort in degrees Celsius [49,51]. Thermal comfort conditions of seasonal agricultural workers were calculated using the mPET index in the RayMan Pro software according to 170 W and 235 W activity energies on a 10-day, monthly and seasonal basis. In addition, tolerance to heat and cold stress was evaluated necessary to sustain agricultural activities. The mPET values obtained as a result of the calculation were classified according to the thermal comfort criteria defined by Cohen et al. [58] for the Csa climate type (Table 1).

3. Results

According to the 10-day mPET results, it was determined that there were differences in the hours when the thermal comfort conditions were at a good level or bad level in the monthly calculations of both study groups (Figure 5).
According to the calculated ten-day mPET results of group I, uninterrupted comfort conditions occurred from 08:00 to 18:00 in the beginning and middle of April but did not occur at the end of April. Uninterrupted comfort conditions did not occur from the end of April to the end of September. Comfort conditions deteriorated in the early morning and evening hours due to cold stress and during the day due to heat stress. Comfort conditions are at a good level for 10 h at the beginning and middle of April and for 4 h at the end of April. It has been determined that thermal comfort conditions occur in the early mornings and evenings in May and June and, with the increase in heat stress during the day, thermal comfort conditions deteriorate more than in April. Thermal comfort conditions occur for 4 h at the beginning and middle of May and for 5 h at the end of May. Comfort conditions are good for 3 h at the beginning of June, 7 h in mid-June, and 4 h at the end of June. Comfort conditions occur for 2 h at the beginning of July. From mid-July to the end of August, the thermal comfort conditions of agricultural workers who work based on plant care and harvesting are not at a good level. Comfortable conditions occur for 1 h in the evening at the end of August and early September, for 2 h in mid-September, and for 4 h at the end of September.
According to the calculated ten-day mPET results for group II, it was determined that thermal comfort conditions deteriorated in April due to cold stress in the early morning and evening and heat stress in the middle of the day. Thermal comfort conditions occur during 5 h at the beginning of April, 7 h in mid-April, and 4 h at the end of April. It was determined that thermal comfort conditions occurred in the early mornings and evenings in May and June and deteriorated more during the day compared to April due to the increase in heat stress. Thermal comfort conditions occur for 4 h at the beginning and middle of May and for 3 h at the end of May. Comfort conditions are at a good level for 1 h in the evening at the beginning of June and for 4 h each in the morning and evening at the middle and end of June. The thermal comfort conditions of agricultural workers who work on soil cultivation from the beginning of July to the end of September are not at a good level. Only at the end of September do thermal comfort conditions occur for 3 h, early in the morning and late in the evening.
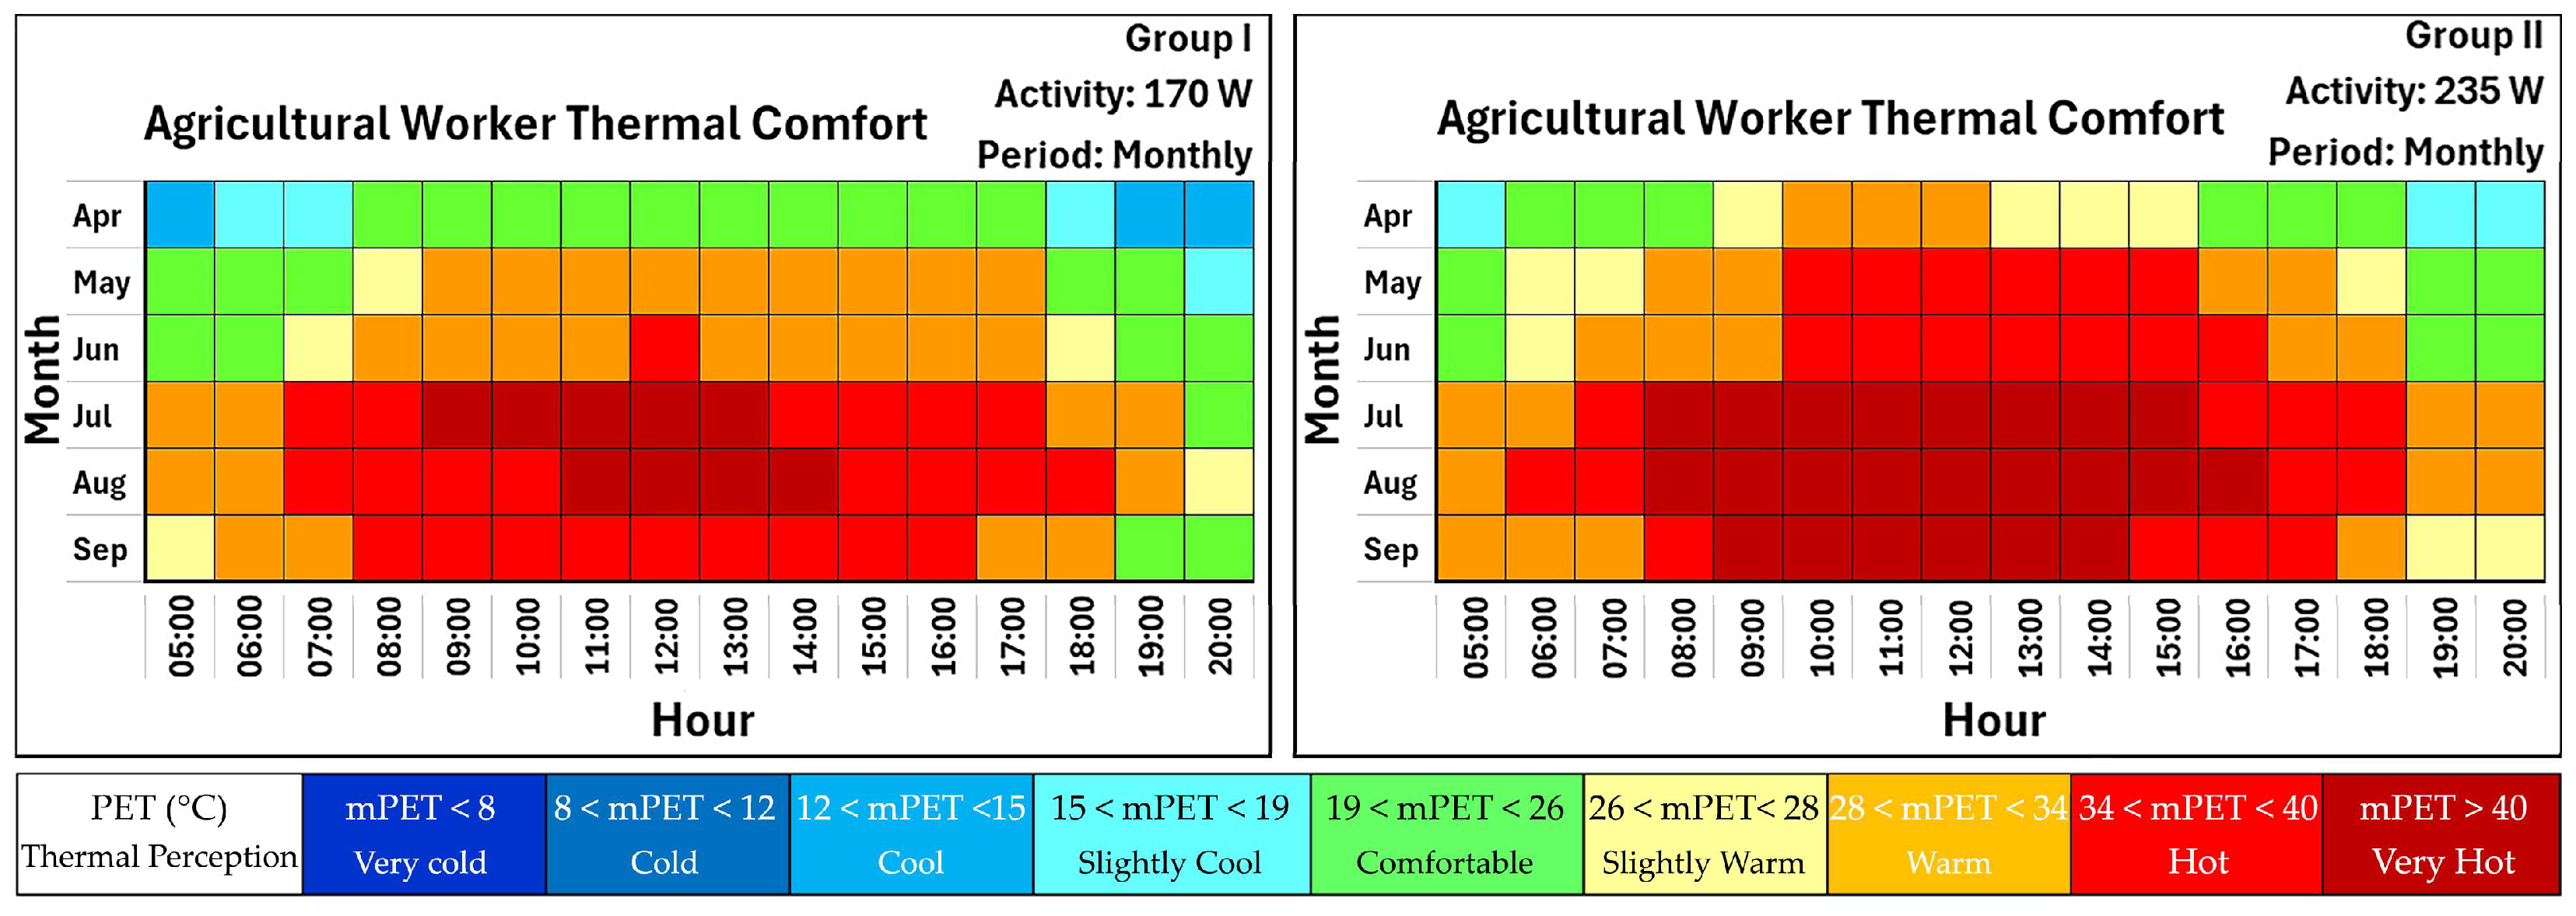
Monthly mPET results are given in Figure 6. Accordingly, it was observed that the thermal comfort conditions of both study groups differed according to month. Except for April, thermal comfort is at a good level in both study groups during limited hours in the early morning and evening. However, poor thermal comfort was detected throughout most of the day during the working season of seasonal agricultural workers. Especially in group II, thermal comfort conditions deteriorate in the middle of the day starting in April.
According to the monthly mPET results of group I, it was determined that comfort conditions due to cold stress deteriorated in April from 05:00 to 08:00 and after 18:00. In May, thermal comfort conditions are at a good level from 05:00 to 08:00 in the morning and from 18:00 to 20:00. Again, in May, comfort conditions deteriorated due to heat stress from 08:00 to 17:00 and cold stress after 20:00. In June, thermal comfort conditions are at a good level from 05:00 to 07:00 in the morning and after 19:00, but comfort conditions deteriorate due to heat stress from 07:00 to 19:00. In July, comfort conditions deteriorated due to heat stress between 05:00 and 20:00 in the morning, and comfort conditions improved after 20:00. It was determined that thermal comfort conditions deteriorated throughout the day due to heat stress in August, and that comfort conditions deteriorated due to heat stress between 05:00 and 19:00 in the morning in September, and occurred after 19:00.
In Group II, the hours between 06:00 and 09:00 and 16:00 and 19:00 in April are thermally comfortable. In the same month, cold stress is observed between 05:00 and 06:00, and after 18:00, and it has been determined that comfort conditions deteriorate due to heat stress in the middle of the day. It has been determined that in May and June, thermal comfort conditions occur between 05:00 and 06:00 in the morning and between 19:00 and 21:00 in the evening and, in the remaining hours, comfort conditions deteriorate due to heat stress. It has been determined that thermal comfort conditions deteriorate throughout the day due to heat stress in July, August, and September.
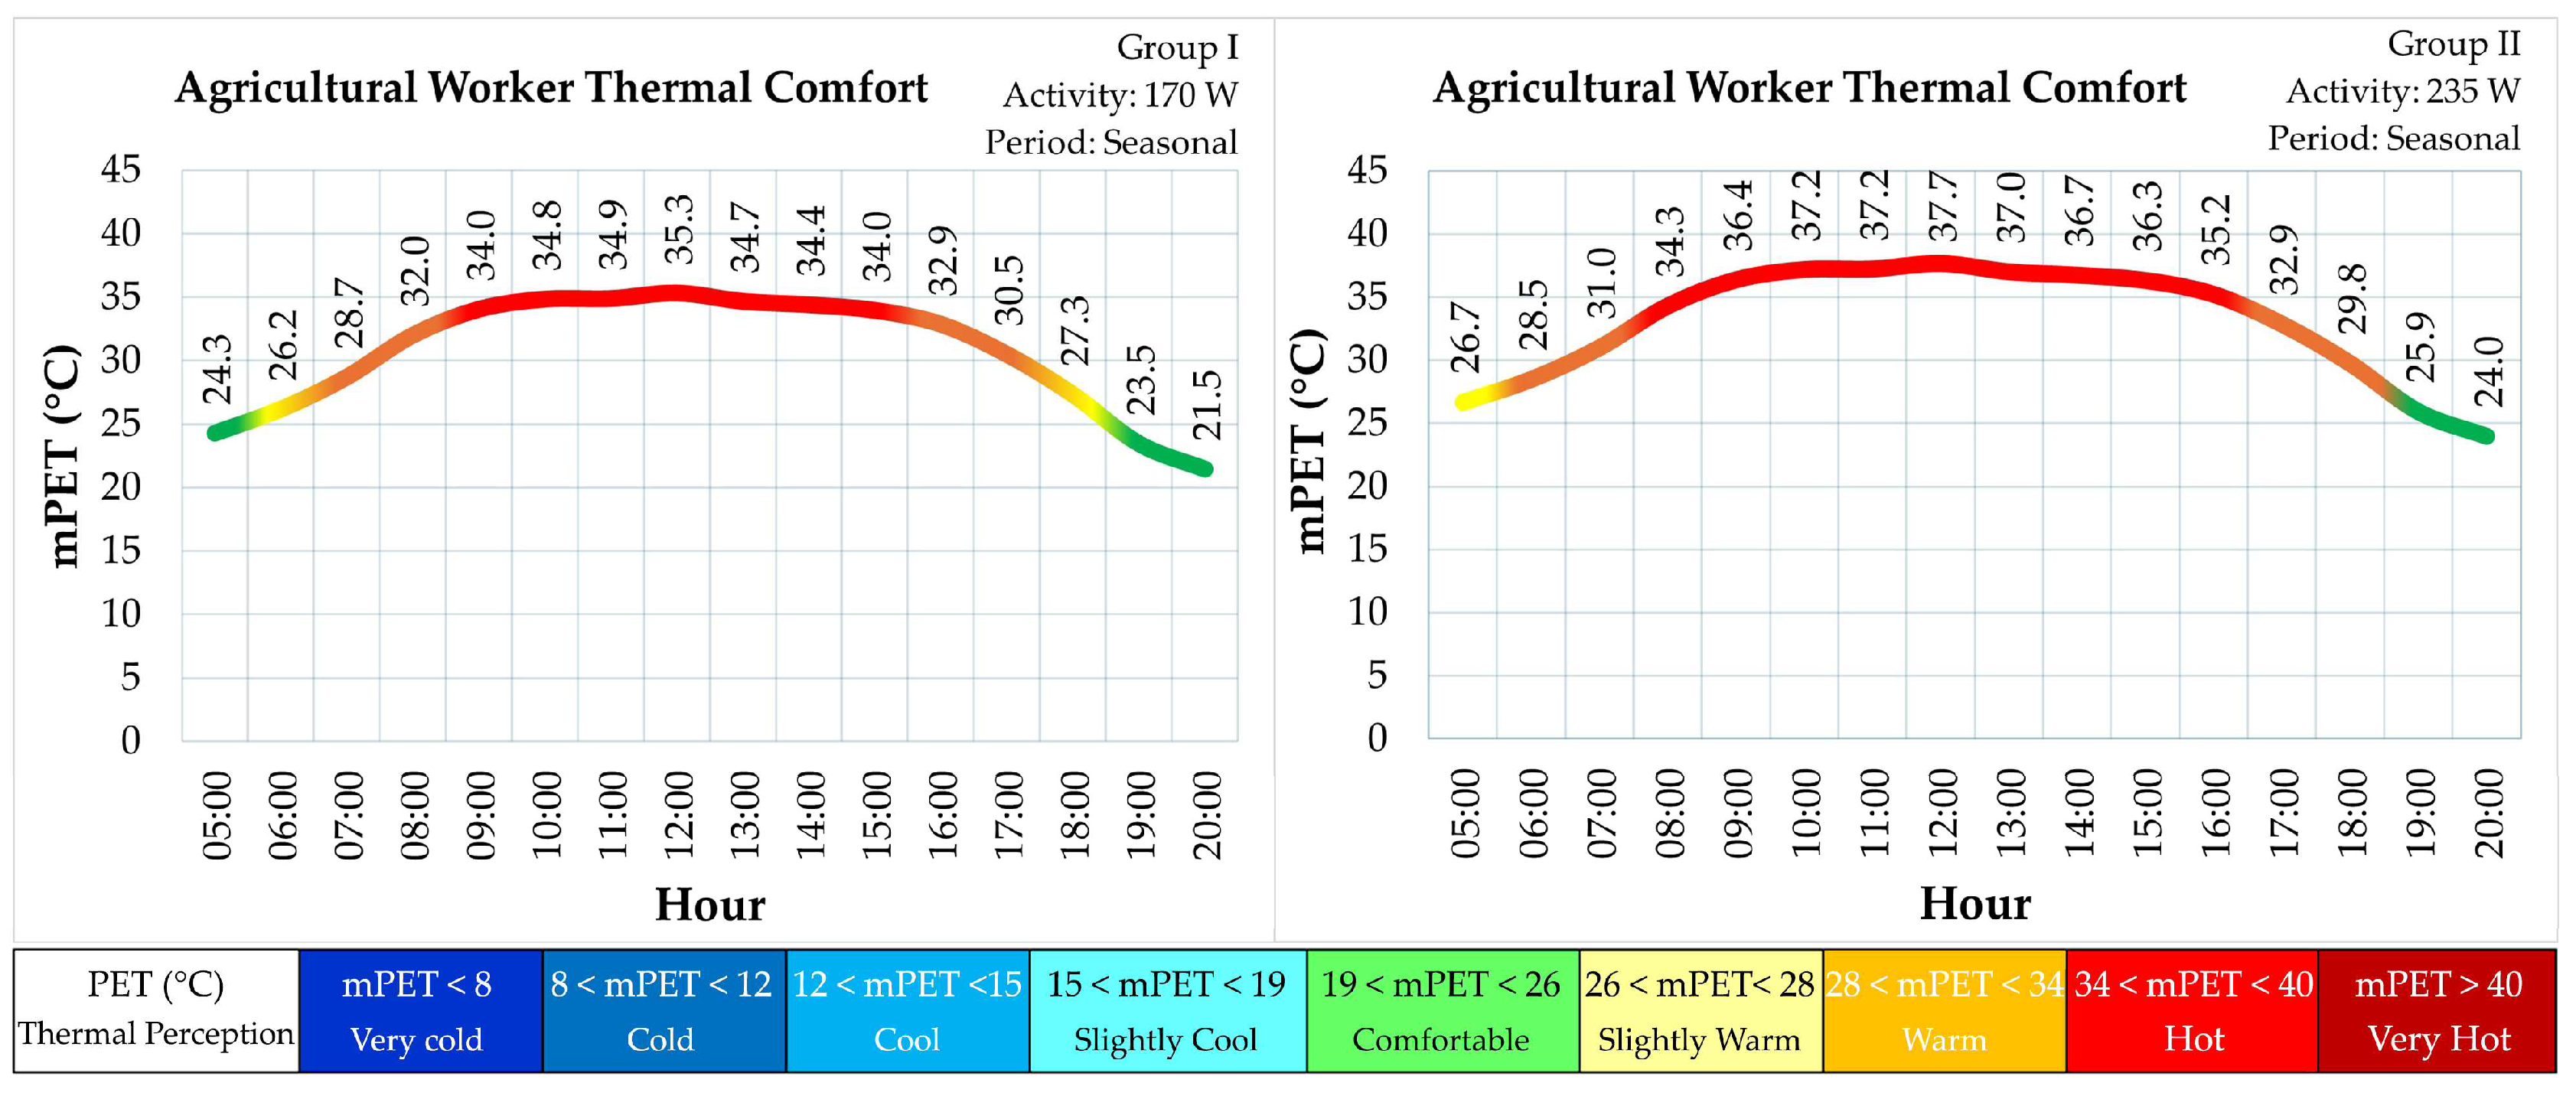
The mPET results for the seasonal work of agricultural workers, covering the agricultural activity period from the beginning of April to the end of September, are given in Figure 7. In the mPET results obtained by agricultural workers as an average of a 6-month period, thermal comfort conditions in the second group occur for 2 h in the evening between 19:00 and 21:00. In the first group, thermal comfort conditions occur for a total of 3 h, 1 h between 05:00 and 06:00 in the morning and 2 h in the evening between 19:00 and 21:00. In both working groups, thermal comfort conditions deteriorate at other hours of the day.
According to the seasonal mPET results for the first group, thermal comfort conditions occur in the early morning hours from 05:00 to 06:00. Heat stress begins to show its effect at 06:00 in the morning, and a slightly warm thermal perception occurs until 07:00. Warm thermal perception occurs between 07:00 and 09:00. As temperatures increase after 09:00, hot thermal perception occurs until 15:00, and thermal comfort deteriorates to the extent that it may prevent workers from working efficiently. After 15:00, as the effect of the temperature partially decreases, a warm thermal perception occurs until 18:00. Since the effect of heat stress continues to decrease until 19:00, a slightly warm thermal perception occurs between 18:00 and 19:00. After 19:00, thermal comfort conditions reach good levels again.
In the second group, heat stress shows its effect in the early morning hours, and a slightly warm thermal perception occurs between 05:00 and 06:00. Warm thermal perception occurs between 06:00 and 08:00. As the temperature increases during the day, heat stress becomes more effective, and hot thermal perception occurs between 08:00 and 17:00. Warm thermal perception occurs between 17:00 and 19:00. In the evening, the heat stress loses its effect and is replaced by comfortable conditions and, after 19:00, the thermal comfort conditions reach a good level.
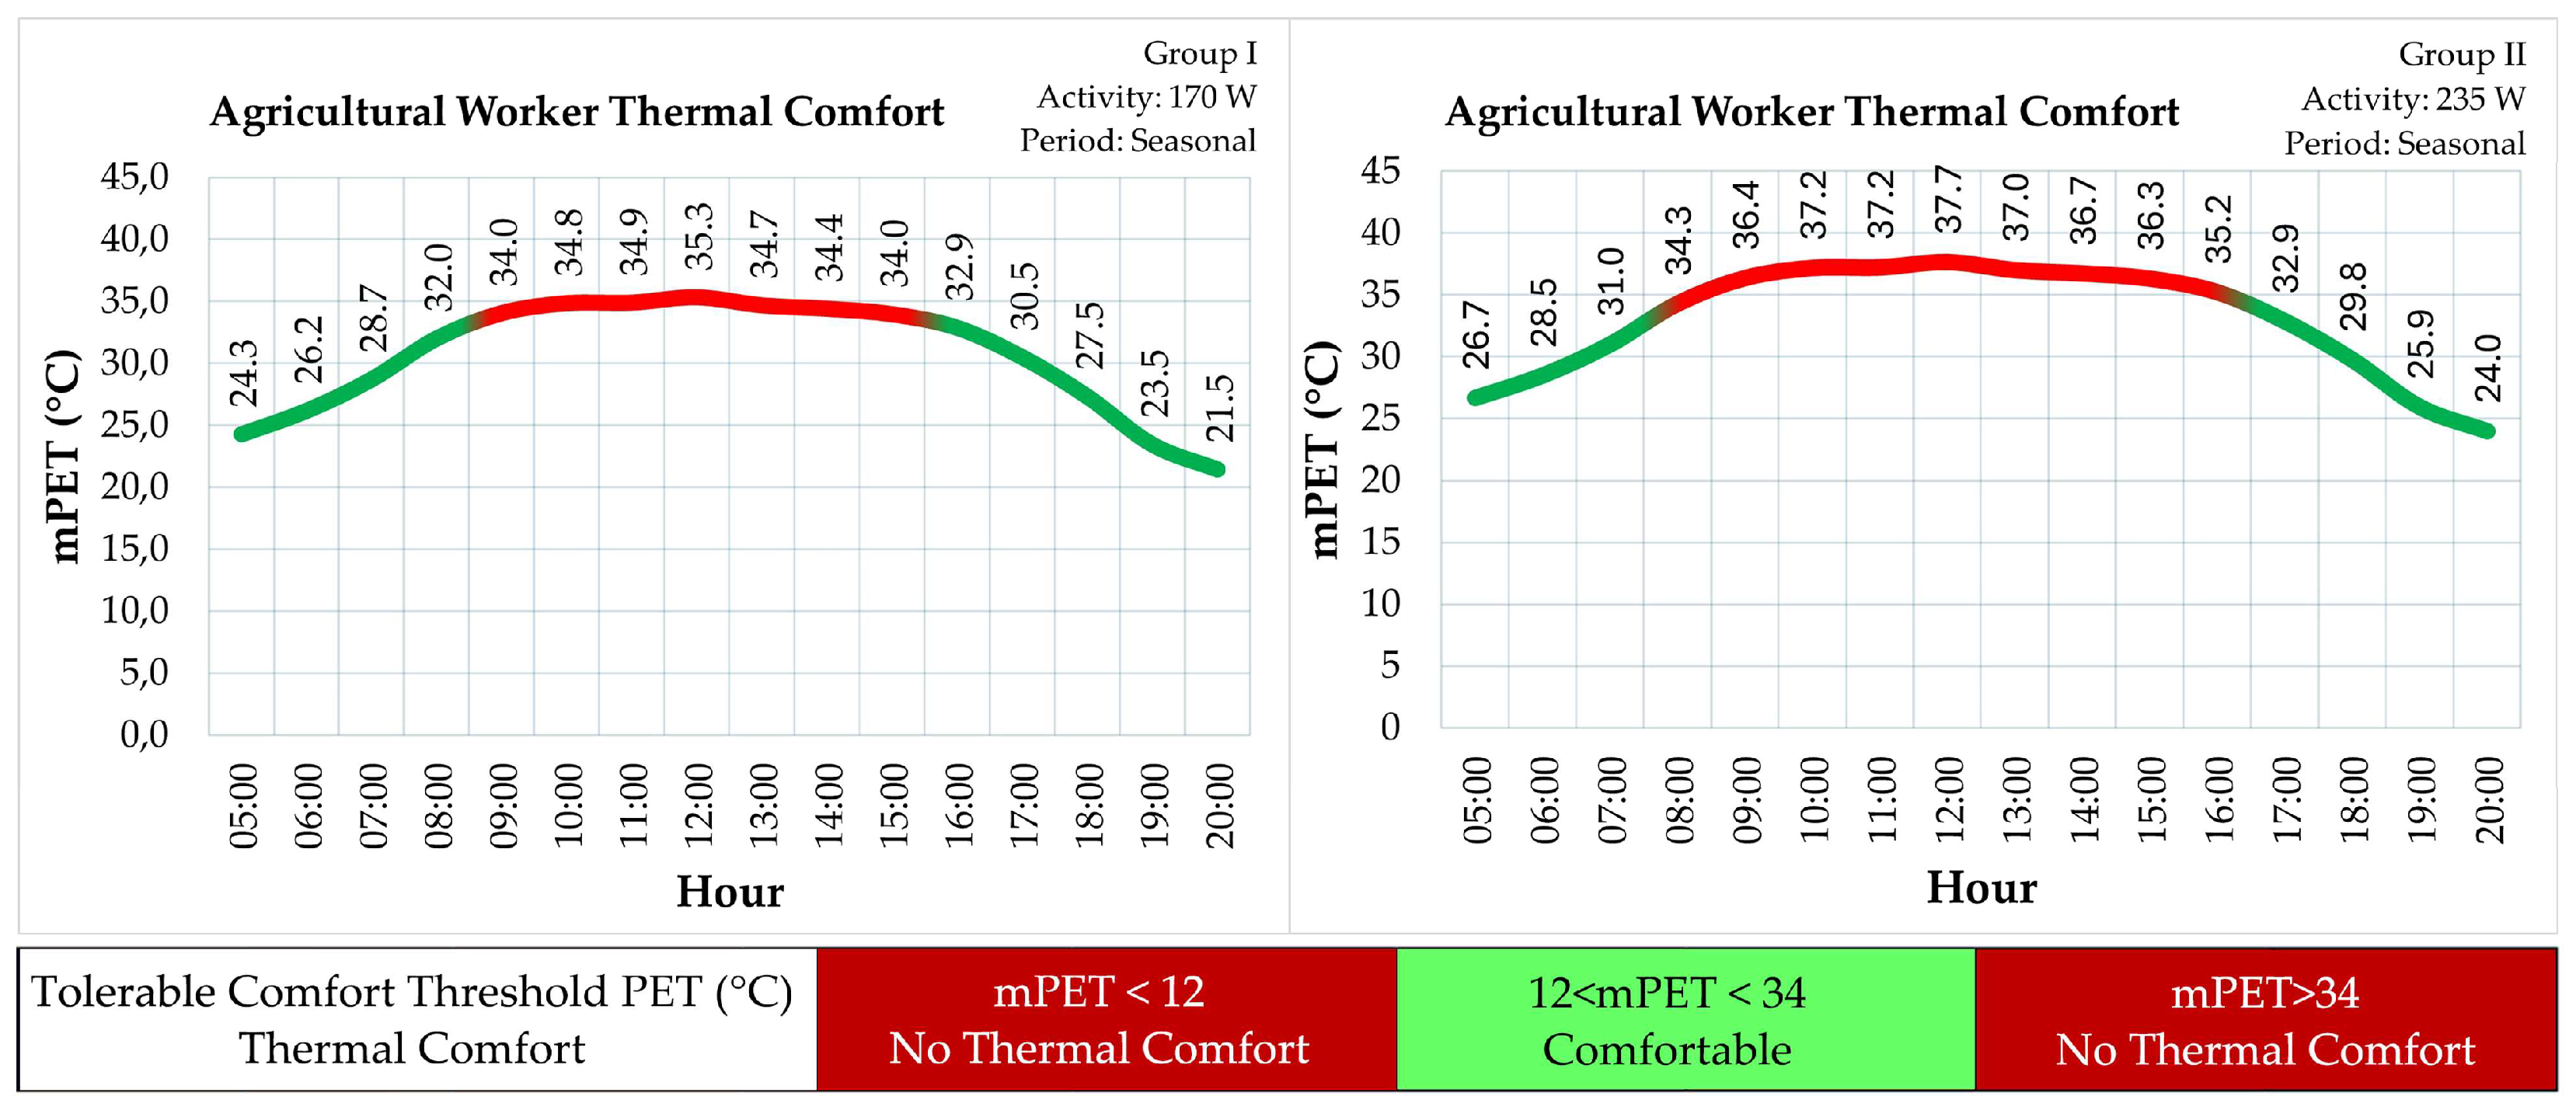
In the literature, it has been stated that thermal perception due to hot and cold stress can be tolerated in thermal comfort studies conducted using 80W activity energy in urban spaces [60,61,62]. This tolerability can also be used in the open field, because the land surface temperature is not higher in open agricultural land compared to urban areas. The heat reflected from the ground surface on agricultural lands affects human thermal comfort less. Wind circulation in agricultural areas is higher than in urban areas. Relative humidity is removed from the environment by wind, and therefore cool and warm thermal perceptions can be tolerated in open agricultural lands. In this context, comfortable and uncomfortable working hours obtained as a result of reclassifying the seasonal mPET results of both study groups are given in Figure 8. While tolerable comfort conditions in both groups occur in the morning and evening, they deteriorate in the middle of the day.
According to the comfortable–uncomfortable working hours of the first group, thermal comfort conditions are at a good level for 4 h from 05:00 to 09:00 in the early morning hours. Thermal comfort conditions are deteriorating due to heat stress for 7 h from 09:00 to 16:00. After 16:00, thermal comfort conditions are re-established. Thermal comfort conditions are good for a total of 9 h in the morning and evening. In the second group, thermal comfort conditions occur for 3 h, from 05:00 to 08:00. For 9 h, from 08:00 to 17:00, these conditions were disrupted due to heat stress. After 17:00, thermal comfort conditions are re-established. Thermal comfort conditions occur for a total of 7 h in the morning and evening.

4. Discussion

In the study, the thermal comfort conditions of agricultural workers classified into two different groups were evaluated by using the mPET index in the RayMan model with the climate data of the meteorological station and the activity energy value data of the agricultural workers during their work. Since Türkiye has different climatic conditions due to its geographical location, there are many meteorological stations in many regions in order to obtain accurate climate data [63,64]. Ünel et al. [65] state that a meteorological station in a region provides data not only on the climatic characteristics of the point where it is located but also on the climatic characteristics of the region in which it is located. Moreover, the Local Climate Zone (LCZ) classification system is used in metropolitan areas to assess the thermal variations and climate characteristics of urban areas. The LCZ classification system in these urban areas reveals temperature variations associated with urban density, topography and building inventory [66,67]. However, due to the limited building stock and intensive agricultural areas in the study area, climate data for the meteorological station located within the borders of the study area and representing the region were used.
The Rayman Pro software makes it possible to calculate thermal comfort conditions for months and hours with climate and thermo-physiological input data. It also allows for adjustments in physiological characteristics and activities. Moreover, although the PET index is widely used in outdoor thermal comfort studies, the mPET index in the RayMan model was preferred in this study because it is more sensitive to activity energy change, because the mPET index is based on a more complex model of human energy balance that is more sensitive to relative humidity, clothing and activity than PET [50]. It was also pointed out by Şensoy et al. [49] that the mPET index produced better and more sensitive results than the PET index in Antalya/Türkiye, which has the same climatic characteristics. The primary premise of RayMan is to necessitate only a minimal set of meteorological inputs, specifically common metrics [37]. In this context, the primary advantage of the Rayman model is its minimal computing effort and commendable usability. The principal deficiencies of the RayMan model are the lack of a wind model and the restriction to a single point of interest [36].
The study has revealed that there are differences in thermal comfort conditions of agricultural workers according to their working time and activity energies during their work. Temporal differences in the thermal conditions of workers were observed at seasonal levels and seasonal transitions. Therefore, climatic data are more effective than thermo-physiological data in temporal differences in thermal comfort [68]. The study area, where Csa climate type is observed according to Köppen–Geiger climate classification, is hot and dry in the summer season, as it has the characteristics of the Mediterranean climate zone. In this context, while thermal comfort conditions are comfortable in the spring season, comfort conditions reach uncomfortable levels in the middle of the day in the summer and autumn seasons. Olgyay’s [69] statement that outdoor thermal comfort conditions in the Mediterranean climate zone generally deteriorate between May and October due to heat stress supports the results of the study.
In the study, it was observed that the mPET value of the study area in the summer season exceeded 34 °C and agricultural workers in both groups were exposed to strong heat stress. The mPET value of Group I exceeded the threshold value of the critical level of extreme heat stress (mPET > 40 °C) between 9:00 and 16:00 h from early July to mid-August, causing the thermal comfort conditions to reach an extremely uncomfortable level. A similar deterioration in thermal comfort conditions in Group II continues from early July to mid-September. Due to the hot and dry summer in the study area and the increase in temperature and relative humidity, especially at 12:00 in mid-August, the mPET value reached the most uncomfortable level with 43.2 °C in Group I and 45.6 °C in Group II.
A study conducted in Antalya/Türkiye, which shares similar climatic conditions, indicated that the PET attained its peak discomfort level between 10:00 and 17:00 throughout July and August. Furthermore, it was established that thermal comfort attained elevated levels during nocturnal hours and diminished levels during diurnal hours due to solar exposure [49]. The findings of the research by Şensoy et al. [49] align with this study due to their placement inside the same climatic zone. Furthermore, outdoor thermal comfort studies conducted across various regions utilizing 80W activity energy in the PET index revealed that comfort conditions declined due to heat stress during June, July, August, and September, whereas thermal comfort was observed in certain locations in May and October [32,61,62,70]. The study by Soureh and Mohammadi [71] indicates that thermal comfort conditions, as measured by the PMV index, are present in April, May, and October, while the UTCI index shows comfort in April, May, and June; however, thermal comfort declines in July and August. The results of this study align with those of earlier research conducted in Csa, utilizing several indices related to thermal comfort throughout the summer season.
As stated by Lin et al. [56,57], activity energy affects human thermal comfort. While most people prefer low-intensity activities to provide thermal comfort conditions in hot environments, they turn to medium-intensity activities in temperate environments and high-intensity activities in cold environments [72]. However, agricultural workers cannot change their energy levels due to the work they do in agricultural fields. Agricultural workers who cannot exchange their activity energy are more vulnerable because they engage in heavy physical work for long periods of time under sunlight and outdoors [24]. While calculating mPET in the RayMan Pro software, it was determined that the increase in activity energy deteriorated thermal comfort conditions in April and caused further deterioration in thermal comfort conditions due to heat stress in the period from the beginning of May to the end of September. The study findings showed that increasing activity energy led to a deterioration in comfort conditions, and especially that the mPET values of agricultural workers in Group II working with high-intensity activity energy were 2.1 to 2.9 °C higher than those of agricultural workers in Group I working with medium intensity activity energy. Moreover, the earlier and longer deterioration of thermal comfort conditions due to increased activity energy caused agricultural workers in Group II to be exposed to more heat stress.
In thermal comfort studies conducted using 80W activity energy in urban spaces, it has been stated that thermal perception due to slightly hot and slightly cold stress can be tolerated [60,61,62]. Additionally, studies comparing the thermal comfort conditions of rural and urban areas have reported differences in PET values. Çınar and Karakuş [73] stated in their thermal comfort study in Csa that PET values vary between 13.2 and 24.6 °C depending on the months between urban and rural areas. In another study conducted in Csa, it was stated that PET values decreased from urban to rural areas in the summer [74]. It has been stated that even in a region with a cold climate (Dfb), the PET value in the city during the summer has 7.9% more heat stress than the PET value in rural areas [75]. Therefore, within the scope of this study, as a result of classifying the cool and warm thermal perceptions of agricultural workers in the region by tolerance, it was determined that the comfort conditions of agricultural workers in the first group were better than those of agricultural workers in the second group. While agricultural workers in Group I have comfortable working conditions from sunrise to sunset in April and May, agricultural workers in Group II have comfortable working conditions throughout the day only in April. According to tolerable thermal comfort conditions, the comfort conditions of Group I deteriorated due to heat stress between 09:00 and 16:00 and those of Group II between 08:00 and 17:00.
Agricultural workers are exposed to additional heat stress due to solar heat radiation during outdoor work [76]. In the study, carried out with the WBGT index during the hours when solar radiation is most effective, especially in places where there is no cloudiness, it was determined that heat stress increased by 2–3 °C due to solar radiation [77]. Therefore, the loss of work efficiency due to heat stress during working hours in the day is up to 10%, especially in hot regions of the world. It is estimated that the loss of work efficiency could be as high as 30–40% in 2085 due to climate change [78]. In studies of 300 W of activity energy expenditure, there was 1.65%, 0.28%, 0.14% and 0.20% loss of work efficiency per year in Cambodia, Philippines, Ethiopia and Costa Rica, respectively, due to heat exposure. In the USA, China and India, the annual loss of work efficiency is 0.17%, 0.31% and 2.05%, respectively. Moreover, it is estimated that a 2.7 °C temperature increase in Cambodia, Philippines, Ethiopia and Costa Rica, which are located in the tropical region, due to global climate change, will lead to a loss of 10.6%, 4.14%, 0.69% and 1.68% of work efficiency in 2100, respectively. It is similarly reported that a 2.7 °C temperature increase in the USA, China and India will lead to a loss of 1.37%, 2.04% and 8.08% of work efficiency in 2100, respectively [77]. According to the forecast maps of Kjellstrom et al. [77], there is less than 0.1% loss of work efficiency due to heat stress in Türkiye, but it is estimated that the 2.7 °C temperature increase in 2100 due to climate change will lead to around 1% loss of work efficiency.
In another study, it is estimated that there will be a 0.83% loss in Gross National Product due to loss of work efficiency as a result of a 3 °C increase in temperature due to climate change in Türkiye and that this loss will be the highest in the agricultural sector with a rate of 0.5% [79]. Şensoy et al. [49] indicated that climate change in Antalya has exacerbated comfort conditions, as assessed by PET and mPET indices, during the summer season. A study in Iran indicated that climate change will reduce regions of thermal comfort while expanding areas of discomfort due to rising air temperatures [80].
In outdoor agricultural endeavors, human thermal discomfort is a significant issue, particularly at elevated temperatures. Given that thermal discomfort directly impacts an individual’s health and productivity [39,52], agricultural workers should refrain from working during periods of thermal discomfort unless essential. Temporary labor may be permissible when required, and prolonged exposure to heat can be mitigated by assigning intermittent tasks during instances of thermal stress. Prolonged exposure to solar radiation and heat stress adversely affects thermal comfort, diminishing the physical capacity of agricultural workers and resulting in decreased productivity [22,26,27]. The study’s findings indicate that agricultural laborers may encounter significant health issues if they labor during thermally uncomfortable periods, particularly within the hours stipulated by legislation. Consequently, based on the findings from the study area, agricultural workers in group I should refrain from working between 09:00 and 16:00, while those in group II should avoid working between 08:00 and 17:00 to safeguard their health and promote effective labor. It is recommended that the working hours for agricultural workers in open fields be organized based on comfort conditions, with group I working during the optimal hours of 5:00–9:00 and 16:00–21:00, and group II during 5:00–8:00 and 17:00–21:00, because, during the noon hours, which are thermally uncomfortable and heat stress is high, agricultural workers may be exposed to the risk of heat stress and dehydration due to physical labor and low fluid consumption, and this reduces productivity and efficiency [19]. Recent studies in this field confirm that increasing heat exposure time leads to decreased productivity [81,82]. Uncomfortable working hours, break times, start and end times of work, threshold values of thermal comfort conditions and thermal exposure periods for agricultural workers should be ensured by relevant laws and regulations.

5. Conclusions

This study assessed the thermal comfort conditions of seasonal agricultural laborers in urban and rural locations characterized by a Csa climate type, from 5:00 to 21:00 h over a duration of 6 months, utilizing the mPET index within the RayMan model. This study disclosed that the thermal comfort conditions of agricultural workers in Group I (plant care-harvesting) and Group II (soil cultivation) vary based on the energy exerted during work, and optimal working hours were established for the workers’ health and productivity. The identification of suitable working time intervals for agricultural laborers, based on varying activity energy values using the mPET index, differentiates this research from analogous studies in the literature and represents its distinctive contribution.
The optimal working hours for agricultural workers in Group I were from 5:00 to 9:00, with mPET levels ranging from 24.3 to 32.0 °C, and from 16:00 to 21:00, with mPET values ranging from 21.5 to 32.9 °C. It was concluded that elevated mPET values (ranging from 34.1–35.3 °C) resulting from heat stress between 9:00 and 16:00 led to a decline in the comfort conditions of agricultural workers in Group I. The most significant decline in thermal comfort conditions was noted from early July to mid-August. In this connection, it was disclosed that Group I experienced a total of 9 h of comfortable working time daily.
The optimal working hours for agricultural workers in Group II were from 5:00 to 8:00 PM, with mPET levels ranging from 26.7 to 31.0 °C, and from 5:00 to 9:00 PM, with mPET values ranging from 24.0 to 32.9 °C. It was concluded that elevated mPET values (ranging from 34.3 to 37.7 °C) resulting from temperature stress between 9:00 and 16:00 adversely affected the comfort conditions of agricultural workers in Group II. The most significant decline in thermal comfort conditions was noted from early July to mid-September. In this regard, it was shown that Group II experienced a total of 7 h comfortable working time daily.
The study revealed that elevated activity energy correlates with diminished comfort conditions, particularly as the mPET values for agricultural workers engaged in high intensity activity energy in Group II were 2.1 to 2.9 °C higher than those of agricultural workers involved in medium-intensity activity energy in Group I. Agricultural workers in Group II experience greater heat stress than those in Group I due to the earlier and prolonged decline in thermal comfort conditions caused by heightened activity energy.
During periods of inadequate thermal comfort, it is imperative to emphasize that agricultural workers should refrain from prolonged labor unless absolutely necessary to safeguard their health and enhance output. Nonetheless, it has been established that short-term employment can be accommodated in such instances. The results of this study provide a reference for workers to regulate their working hours. It is also a guide for employers and other workers working in inappropriate thermal conditions to use in collective labor agreements. Nevertheless, further comprehensive research is required to ascertain the duration of this tolerance and its impact on labor productivity. Moreover, there is a necessity for rules that limit the working hours of employees based on thermal comfort conditions, implemented by governments and authorized entities, to safeguard worker health and enhance productivity in response to evolving climatic conditions. In this context, future studies should establish threshold values for the duration of heat stress exposure among agricultural workers in open fields across various climatic regions, assess the rate of work efficiency decline due to heat stress, evaluate the economic impact of this decline, and identify optimal working hours regionally to enhance work efficiency and safeguard worker health. This research will serve as a crucial resource for decision-makers in formulating initiatives to safeguard the health and enhance the productivity of agricultural workers.

Author Contributions

The lead author of this study is N.K. Conceptualization, N.K., S.S. and C.S.; methodology, N.K., S.S. and C.S.; software, N.K.; validation, S.S., C.S. and R.O.; formal analysis, R.O. and A.K.; investigation, S.S., Z.R.A. and N.E.; resources, C.S., R.O, N.E. and S.Ş.D.; data curation, N.K. and S.S.; writing—original draft preparation, N.K., S.S. and C.S.; writing—review and editing, R.O., A.K, Z.R.A., S.Ş.D. and N.E.; visualization, N.K and R.O.; supervision, S.S. and C.S. All authors have read and agreed to the published version of the manuscript.

Funding

This research received no external funding.

Institutional Review Board Statement

Not applicable.

Informed Consent Statement

Not applicable.

Data Availability Statement

The raw data supporting the conclusions of this article will be made available by the authors on request.

Conflicts of Interest

The authors declare no conflicts of interest.

References

  1. Yoro, K.O.; Daramola, M.O. CO2 emission sources, greenhouse gases, and the global warming effect. In Advances in Carbon Capture, 1st ed.; Rahimpour, M.R., Farsi, M., Makarem, M.A., Eds.; Woodhead Publishing: Cambridge, UK, 2020; pp. 3–28. [Google Scholar]
  2. Wang, J.; Guan, Y.; Wu, L.; Guan, X.; Cai, W.; Huang, J.; Dong, W.; Zhang, B. Changing lengths of the four seasons by global warming. Geophys. Res. Lett. 2021, 48, e2020GL091753. [Google Scholar] [CrossRef]
  3. Baraka, J. Effect of global warming on agricultural productivity. Int. J. Agric. 2023, 8, 21–30. [Google Scholar] [CrossRef]
  4. Anwar, M.R.; Liu, D.L.; Macadam, I.; Kelly, G. Adapting agriculture to climate change: A review. Theor. Appl. Climatol. 2013, 113, 225–245. [Google Scholar] [CrossRef]
  5. Chen, S.; Gong, B. Response and adaptation of agriculture to climate change: Evidence from China. J. Dev. Econ. 2021, 148, 102557. [Google Scholar] [CrossRef]
  6. Adams, R.M.; Hurd, B.H.; Lenhart, S.; Leary, N. Effects of global climate change on agriculture: An interpretative review. Clim. Res. 1998, 11, 19–30. [Google Scholar] [CrossRef]
  7. Zimmerer, K.S. Biological diversity in agriculture and global change. Annu. Rev. Env. Resour. 2010, 35, 137–166. [Google Scholar] [CrossRef]
  8. Zhu, P.; Burney, J.; Chang, J.; Jin, Z.; Mueller, N.D.; Xin, Q.; Xu, J.; Yu, L.; Makowski, D.; Ciais, P. Warming reduces global agricultural production by decreasing cropping frequency and yields. Nat. Clim. Change 2022, 12, 1016–1023. [Google Scholar] [CrossRef]
  9. Lehmann, P.; Ammunét, T.; Barton, M.; Battisti, A.; Eigenbrode, S.D.; Jepsen, J.U.; Kalinkat, G.; Neuvonen, S.; Niemelä, P.; Terblanche, J.S.; et al. Complex responses of global insect pests to climate warming. Front. Ecol. Environ. 2020, 18, 141–150. [Google Scholar] [CrossRef]
  10. Skendžić, S.; Zovko, M.; Živković, I.P.; Lešić, V.; Lemić, D. The impact of climate change on agricultural insect pests. Insects 2021, 12, 440. [Google Scholar] [CrossRef]
  11. Fatima, Z.; Ahmed, M.; Hussain, M.; Abbas, G.; Ahmad, S.; Ahmed, N.; Ali, M.A.; Sarwar, G.; Haque, E.U.; Iqbal, P.; et al. The fingerprints of climate warming on cereal crops phenology and adaptation options. Sci. Rep. 2020, 10, 18013. [Google Scholar] [CrossRef]
  12. dos Santos, T.B.; Ribas, A.F.; de Souza, S.G.H.; Budzinski, I.G.F.; Domingues, D.S. Physiological Responses to Drought, Salinity, and Heat Stress in Plants: A Review. Stresses 2022, 2, 113–135. [Google Scholar] [CrossRef]
  13. Jakhar, R.; Singh, G.; Sachar, P. Impact of global warming on agricultural pattern: A case study of select agricultural spaces in Rajasthan. Int. J. Mech. Eng. 2022, 7, 5453–5463. [Google Scholar]
  14. Hatfield, J.L.; Antle, J.; Garrett, K.A.; Izaurralde, R.C.; Mader, T.; Marshall, E.; Nearing, M.; Robertson, G.P.; Ziska, L. Indicators of climate change in agricultural systems. Clim. Change 2020, 163, 1719–1732. [Google Scholar] [CrossRef]
  15. Stoate, C.; Báldi, A.; Beja, P.; Boatman, N.; Herzon, I.; Van Doorn, A.; De Snoo, G.; Rakosy, L.; Ramwell, C. Ecological impacts of early 21st century agricultural change in Europe—A review. J. Environ. Manag. 2009, 91, 22–46. [Google Scholar] [CrossRef]
  16. Arjona, R.H.; Piñeiros, J.; Ayabaca, M.; Freire, F.H. Climate change and agricultural workers’ health in Ecuador: Occupational exposure to UV radiation and hot environments. Ann. Ist. Super. Sanità 2016, 52, 368–373. [Google Scholar]
  17. De Lima, C.Z.; Buzan, J.R.; Moore, F.C.; Baldos, U.L.C.; Huber, M.; Hertel, T.W. Heat stress on agricultural workers exacerbates crop impacts of climate change. Environ. Res. Lett. 2021, 16, 044020. [Google Scholar] [CrossRef]
  18. Amaro, A.L.; Yanagi Junior, T.; Yanagi, S.D.N.; Ferraz, G.A.S.; Campos, A.T. Climate change and rural workers thermal comfort: Historical and future impacts. Eng. Agríc. 2018, 38, 173–179. [Google Scholar] [CrossRef]
  19. Wagoner, R.S.; López-Gálvez, N.I.; de Zapien, J.G.; Griffin, S.C.; Canales, R.A.; Beamer, P.I. An occupational heat stress and hydration assessment of agricultural workers in North Mexico. Int. J. Environ. Res. Public Health 2020, 17, 2102. [Google Scholar] [CrossRef]
  20. Çakmur, H. Health risks faced by Turkish agricultural workers. Sci. World J. 2014, 2014, 185342. [Google Scholar] [CrossRef]
  21. Simsek, Z.; Ersin, F.; Kirmizitoprak, E. Development of the seasonal migrant agricultural worker stress scale in Sanliurfa, Southeast Türkiye. J. Agromed. 2016, 21, 56–60. [Google Scholar] [CrossRef]
  22. Sadiq, L.S.; Hashim, Z.; Osman, M. The impact of heat on health and productivity among maize farmers in a tropical climate area. J. Environ. Public Health 2019, 2019, 989641. [Google Scholar] [CrossRef]
  23. Kemal, U.S.; Akbiyik, N. Employment in the agricultural sector and social security of employees. Econharran 2023, 7, 25–36. [Google Scholar]
  24. Kjellstrom, T.; Gabrysch, S.; Lemke, B.; Dear, K. The ‘Hothaps’ programme for assessing climate change impacts on occupational health and productivity: An invitation to carry out field studies. Glob. Health. Action 2009, 2, 2082. [Google Scholar] [CrossRef]
  25. Hertel, T.W.; de Lima, C.Z. Climate impacts on agriculture: Searching for keys under the streetlight. Food Policy 2020, 95, 101954. [Google Scholar] [CrossRef]
  26. Venugopal, V.; Chinnadurai, J.S.; Lucas, R.A.; Kjellstrom, T. Occupational heat stress profiles in selected workplaces in India. Int. J. Environ. Res. Public Health 2016, 13, 89. [Google Scholar] [CrossRef]
  27. Matsumoto, K.I.; Tachiiri, K.; Su, X. Heat stress, labour productivity, and economic impacts: Analysis of climate change impacts using two-way coupled modeling. Environ. Res. Commun. 2021, 3, 125001. [Google Scholar] [CrossRef]
  28. Ioannou, L.G.; Tsoutsoubi, L.; Mantzios, K.; Gkikas, G.; Piil, J.F.; Dinas, P.C.; Notley, S.R.; Kenny, G.P.; Nybo, L.; Flouris, A.D. The impacts of sun exposure on worker physiology and cognition: Multi-country evidence and interventions. Int. J Environ. Res. Public Health 2021, 18, 7698. [Google Scholar] [CrossRef]
  29. Er, S.; Gürbüz, İ.B. Problems of seasonal agricultural workers in Bursa/Mudanya. Balk. Near East. J. Soc. Sci. 2022, 8, 2014–2223. [Google Scholar]
  30. Shooshtarian, S. Theoretical dimension of outdoor thermal comfort research. Sustain. Cities Soc. 2019, 47, 101495. [Google Scholar] [CrossRef]
  31. Shooshtarian, S.; Lam, C.K.C.; Kenawy, I. Outdoor thermal comfort assessment: A review on thermal comfort research in Australia. Build. Environ. 2020, 177, 106917. [Google Scholar] [CrossRef]
  32. Karakuş, N.; Selim, S. Temporal and spatial distribution of outdoor thermal comfort conditions: The case of Konyaaltı-Antalya, Turkey. J. Grad. Sch. Nat. Appl. Sci. Mehmet Akif Ersoy Univ. 2022, 13, 259–269. [Google Scholar]
  33. Höppe, P.R. The physiological equivalent temperature-a universal index for the biometeorological assessment of the thermal environment. Int. J. Biometeorol. 1999, 43, 71–75. [Google Scholar] [CrossRef]
  34. Matzarakis, A.; Mayer, H.; Iziomon, M.G. Applications of a universal thermal index: Physiological equivalent temperature. Int. J. Biometeorol. 1999, 43, 76–84. [Google Scholar] [CrossRef]
  35. Matzarakis, A.; Rutz, F.; Chen, Y.; Fröhlich, D. RayMan Pro, A Tool for Applied Climatology, Rayman Manual Version 0.1. Available online: https://www.urbanclimate.net/rayman/RayManManual.pdf (accessed on 26 April 2024).
  36. Matzarakis, A.; Rutz, F.; Mayer, H. Modelling radiation fluxes in simple and complex environments-application of the RayMan model. Int. J. Biometeorol. 2007, 51, 323–334. [Google Scholar] [CrossRef]
  37. Matzarakis, A.; Rutz, F.; Mayer, H. Modelling radiation fluxes in simple and complex environments: Basics of the RayMan model. Int. J. Biometeorol. 2010, 54, 131–139. [Google Scholar] [CrossRef]
  38. Lan, L.; Wargocki, P.; Lian, Z. Quantitative measurement of productivity loss due to thermal discomfort. Energy Build. 2011, 43, 1057–1062. [Google Scholar] [CrossRef]
  39. Li, G.; Liu, C.; He, Y. The effect of thermal discomfort on human well-being, psychological response and performance. Sci. Technol. Built Environ. 2021, 27, 960–970. [Google Scholar] [CrossRef]
  40. Aksu District Governorate. Republic of Türkiye Aksu District Governorship Official Website. Available online: http://www.antalyaaksu.gov.tr/tarim (accessed on 21 April 2024).
  41. Aksu Municipality. Aksu Municipality Official Website. Available online: https://www.aksu.bel.tr/Aksu-Ilcesinde-Ekonomi_page_20 (accessed on 3 May 2024).
  42. Turkstat. Turkish Statistical Institute. Available online: https://www.tuik.gov.tr/ (accessed on 6 May 2024).
  43. Kırcalı, Ş.; Selim, S. Site suitability analysis for solar farms using the geographic information system and multi-criteria decision analysis: The case of Antalya, Turkey. Clean Technol. Environ. Policy 2021, 23, 1233–1250. [Google Scholar] [CrossRef]
  44. Yilmaz, F.K. Antalya’nın günlük yağış özellikleri ve şiddetli yağışların doğal afetler üzerine etkisi. Sos. Bilim. Derg. 2008, 10, 19–65. [Google Scholar]
  45. Weather Spark. Weather History for 2023. Available online: https://weatherspark.com/h/y/148633/2023/Historical-Weather-during-2023-at-Antalya-Airport-Türkiye (accessed on 21 March 2024).
  46. Turkish State Meteorological Service. Available online: https://www.mgm.gov.tr/ (accessed on 25 March 2024).
  47. Auliciems, A.; Szokolay, S.V. Thermal Comfort, 2nd ed.; PLEA: Brisbane, Australia, 2007; pp. 1–66. [Google Scholar]
  48. Ansi/Ashrae. Thermal Environmental Conditions for Human Occupancy (Standard 55-2023). Available online: https://www.ashrae.org/technical-resources/bookstore/standard-55-thermal-environmental-conditions-for-human-occupancy (accessed on 15 March 2024).
  49. Şensoy, S.; Türkoğlu, N.; Çiçek, İ.; Matzarakis, A. Thermal comfort features of Antalya, future projections using climate model data and its effects on tourism. Turk. J. Geogr. Sci. 2020, 18, 124–160. [Google Scholar]
  50. Chen, Y.C.; Lin, T.P.; Matzarakis, A. Comparison of mean radiant temperature from field experiment and modelling: A case study in Freiburg, Germany. Theor. Appl. Climatol. 2014, 118, 535–551. [Google Scholar] [CrossRef]
  51. Chen, Y.C.; Matzarakis, A. Modified physiologically equivalent temperature-basics and applications for Western European Climate. Theor. Appl. Climatol. 2018, 132, 1275–1289. [Google Scholar] [CrossRef]
  52. Mayer, H.; Höppe, P. Thermal comfort of man in different urban environments. Theor. Appl. Climatol. 1987, 38, 43–49. [Google Scholar] [CrossRef]
  53. Deevi, B.; Chundeli, F.A. Quantitative outdoor thermal comfort assessment of street: A case in a warm and humid climate of India. Urban Clim. 2020, 34, 100718. [Google Scholar] [CrossRef]
  54. Matallah, M.E.; Alkama, D.; Ahriz, A.; Attia, S. Assessment of the outdoor thermal comfort in oases settlements. Atmosphere 2020, 11, 185. [Google Scholar] [CrossRef]
  55. Karimimoshaver, M.; Shahrak, M.S. The effect of height and orientation of buildings on thermal comfort. Sustain. Cities Soc. 2022, 79, 103720. [Google Scholar] [CrossRef]
  56. Lin, T.P.; Yang, S.R.; Matzarakis, A. Customized rating assessment of climate suitability (CRACS): Climate satisfaction evaluation based on subjective perception. Int. J. Biometeorol. 2015, 59, 1825–1837. [Google Scholar] [CrossRef]
  57. Lin, T.P.; Yang, S.R.; Chen, Y.C.; Matzarakis, A. The potential of a modified physiologically equivalent temperature (mPET) based on local thermal comfort perception in hot and humid regions. Theor. Appl. Climatol. 2019, 135, 873–876. [Google Scholar] [CrossRef]
  58. Cohen, P.; Potchter, O.; Matzarakis, A. Human thermal perception of coastal Mediterranean outdoor urban environments. Appl. Geogr. 2013, 37, 1–10. [Google Scholar] [CrossRef]
  59. Arrar, F.H.; Kaoula, D.; Matallah, M.E.; Abdessemed-Foufa, A.; Taleghani, M.; Attia, S. Quantification of Outdoor Thermal Comfort Levels under Sea Breeze in the Historical City Fabric: The Case of Algiers Casbah. Atmosphere 2022, 13, 575. [Google Scholar] [CrossRef]
  60. Matzarakis, A. Relevance of thermal bioclimate for tourism in Japan. Glob. Environ. Res. 2008, 12, 129–136. [Google Scholar]
  61. Mirza, E. Determining the Bioclimatic Comfort Structure of the Provinces of The Göller Yöresi. Master’s Thesis, Süleyman Demirel University, Isparta, Turkey, 2023. [Google Scholar]
  62. Karakuş, N. Bioclimatic Comfort-Focused Settlement Determination Model. Ph.D. Thesis, Akdeniz University, Antalya, Turkey, 2024. [Google Scholar]
  63. Yılmaz, E.; Çiçek, İ. Detailed Köppen-Geiger Climate Regions of Turkey. Int. J. Hum. Sci. 2018, 15, 225–242. [Google Scholar]
  64. Yılmaz, E.; Darende, V. Comparison of manual-automatic meteorological station precipitation data in Turkey. Türk Coğrafya Dergisi 2021, 77, 53–66. [Google Scholar] [CrossRef]
  65. Ünel, F.B.; Kuşak, L.; Yakar, M.; Doğan, H. Automatic meteorology observation station location selection in Mersin using geographic information systems and analytical hierarchy process. Geomatic 2023, 8, 107–123. [Google Scholar]
  66. Fan, P.Y.; Chun, K.P.; Mijic, A.; Mah, D.N.Y.; He, Q.; Choi, B.; Lam, C.K.C.; Yetemen, O. Spatially-heterogeneous impacts of surface characteristics on urban thermal environment, a case of the Guangdong-Hong Kong-Macau Greater Bay Area. Urban Clim. 2022, 41, 101034. [Google Scholar] [CrossRef]
  67. Fan, C.; Zou, B.; Li, J.; Wang, M.; Liao, Y.; Zhou, X. Exploring the relationship between air temperature and urban morphology factors using machine learning under local climate zones. Case Stud. Therm. Eng. 2024, 55, 104151. [Google Scholar] [CrossRef]
  68. Hobbs, J.E. Applied Climatology A Study of Atmospheric Resources; Butterworths: London, UK, 1995; 218p. [Google Scholar]
  69. Olgyay, V. Design with Climate, Bioclimatic Approach to Architectural Regionalism; Princeton University Press: Princeton, NJ, USA, 1973; pp. 1–190. [Google Scholar]
  70. Cinar, İ.; Karakus, N.; Toy, S. Analysing daytime summer thermal comfort conditions for Turkey’s third largest tourism destination. Environ. Sci. Pollut. Res. 2023, 30, 50046–50056. [Google Scholar] [CrossRef]
  71. Soureh, E.; Mohammadi, B. Analyzing the Climatic Conditions of Tourism in West Azerbaijan Province Using Bioclimatic Indicators. J. Geogr. Reg. Plann. 2024, 35, 1–4. [Google Scholar]
  72. Huang, J.; Zhou, C.; Zhuo, Y.; Xu, L.; Jiang, Y. Outdoor thermal environments and activities in open space: An experiment study in humid subtropical climates. Build. Environ. 2016, 103, 238–249. [Google Scholar] [CrossRef]
  73. Çınar, İ.; Karakuş, N. Comparison of bioclimatic comfort conditions of urban, suburban and rural settlements. In Planning, Design and Management in Landscape Architecture, 1st ed.; Altuntaş, A., Ed.; Iksad International Publishers: Ankara, Turkey, 2021; Volume 1, pp. 221–239. [Google Scholar]
  74. Güngor, S.; Cetin, M.; Adiguzel, F. Calculation of comfortable thermal conditions for Mersin urban city planning in Türkiye. Air Qual. Atmos. Health 2021, 14, 515–522. [Google Scholar] [CrossRef]
  75. Çağlak, S.; Toy, S.; Esringü, A. An approach to evaluate the effects of cities on bioclimatic conditions; the sample of Erzurum city. J. Kesit Acad. 2022, 8, 220–239. [Google Scholar] [CrossRef]
  76. Kjellstrom, T.; Lemke, B.; Otto, M. Mapping occupational heat exposure and effects in South-East Asia: Ongoing time trends 1980-2011 and future estimates to 2050. Ind. Health 2013, 51, 56–67. [Google Scholar] [CrossRef] [PubMed]
  77. Kjellstrom, T.; Freyberg, C.; Lemke, B.; Otto, M.; Briggs, D. Estimating population heat exposure and impacts on working people in conjunction with climate change. Int. J. Biometeorol. 2018, 62, 291–306. [Google Scholar] [CrossRef] [PubMed]
  78. Kjellstrom, T.; Briggs, D.; Freyberg, C.; Lemke, B.; Otto, M.; Hyatt, O. Heat, human performance, and occupational health: A key issue for the assessment of global climate change impacts. Annu. Rev. Public Health 2016, 37, 97–112. [Google Scholar] [CrossRef] [PubMed]
  79. Roson, R.; Sartori, M. Estimation of climate change damage functions for 140 regions in the GTAP 9 database. J. Glob. Econ. Anal. 2016, 1, 78–115. [Google Scholar] [CrossRef]
  80. Ahmadi, H.; Baaghideh, M. Investigating the potential effects of climate change on deviation of thermal and human bioclimatic conditions in Iran. Model. Earth Syst. Environ. 2020, 6, 439–453. [Google Scholar] [CrossRef]
  81. Zhao, J.; Zhu, N.; Lu, S. Productivity model in hot and humid environment based on heat tolerance time analysis. Build. Environ. 2009, 44, 2202–2207. [Google Scholar] [CrossRef]
  82. Quiller, G.; Krenz, J.; Ebi, K.; Hess, J.J.; Fenske, R.A.; Sampson, P.D.; Pan, M.; Spector, J.T. Heat exposure and productivity in orchards: Implications for climate change research. Arch. Environ. Occup. Health 2017, 72, 313–316. [Google Scholar] [CrossRef]
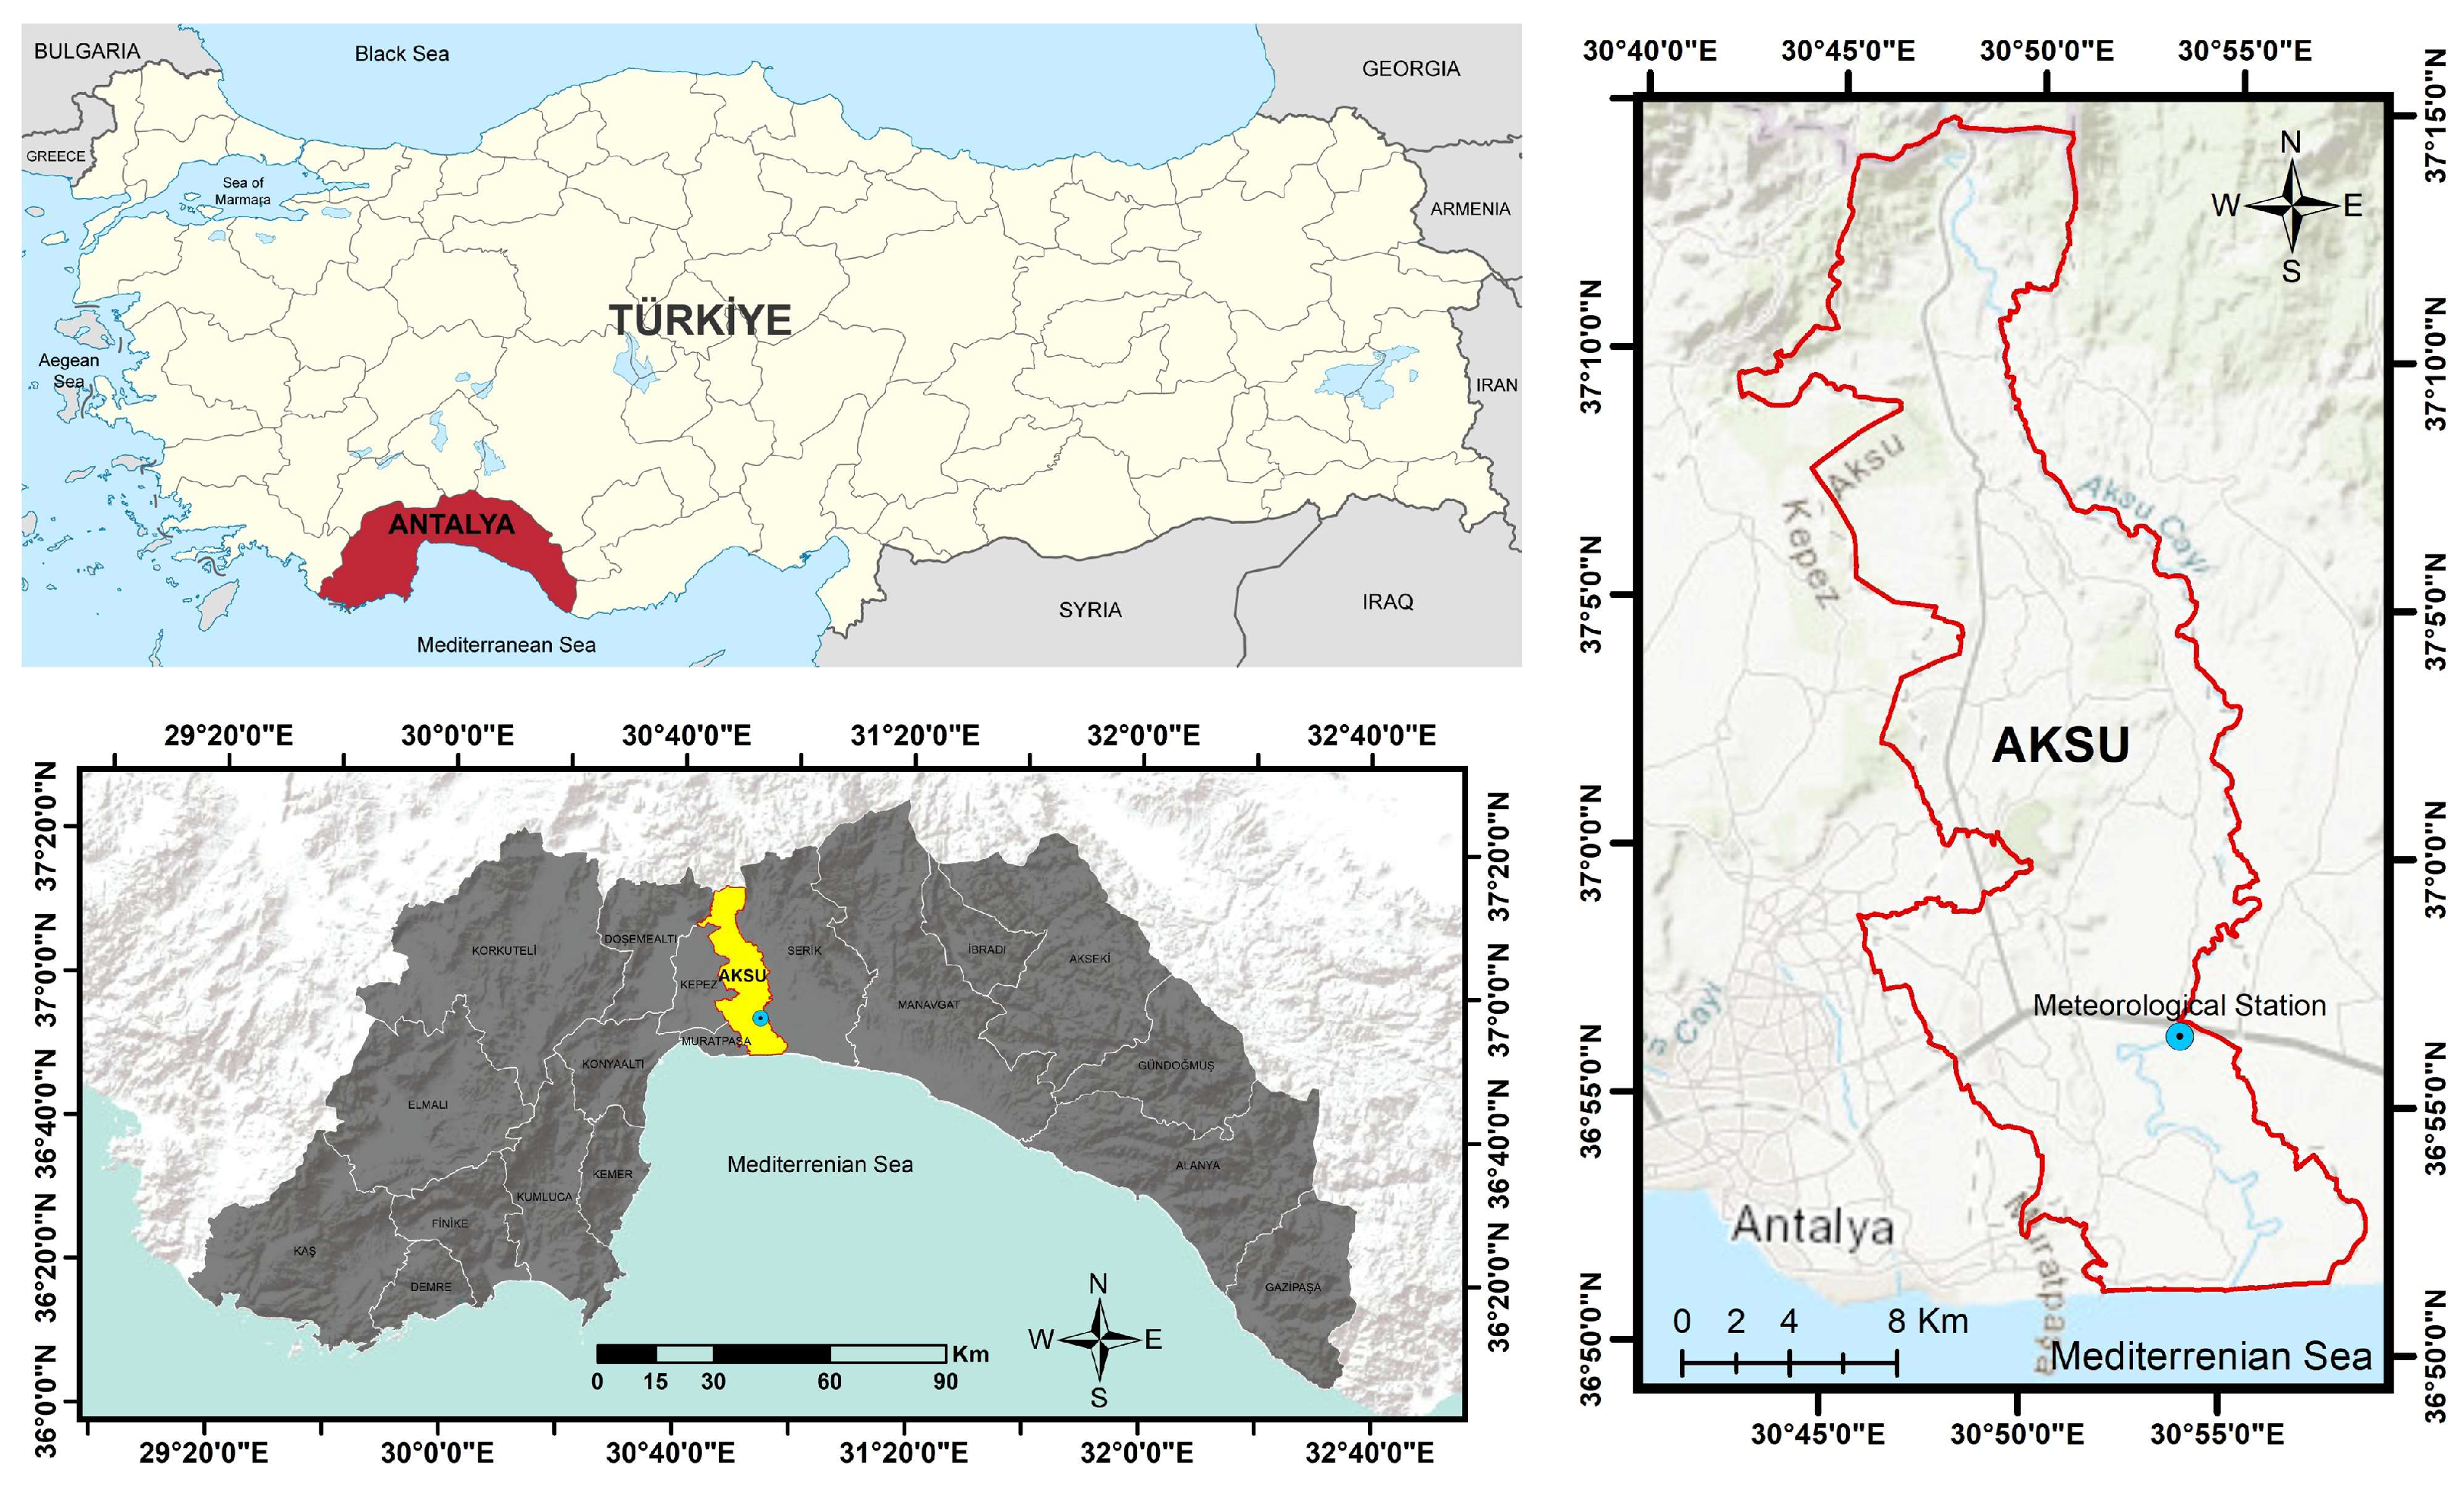
Figure 1. Geographic location of the study area.
Sustainability 16 08903 g001
Figure 2. Air temperature graph of the study area in 2023. The daily range of reported temperatures (gray bars) and 24-h highs (red ticks) and lows (blue ticks) are placed over the daily average high (faint red line) and low (faint blue line) temperature [45].
Sustainability 16 08903 g002
Figure 3. Hourly average climate data for temperature and relative humidity.
Sustainability 16 08903 g003
Figure 4. Hourly average climate data for wind speed/velocity and cloud cover.
Sustainability 16 08903 g004
Figure 5. Ten-day mPET results for seasonal agricultural workers.
Sustainability 16 08903 g005
Figure 6. Monthly mPET results of seasonal agricultural workers.
Sustainability 16 08903 g006
Figure 7. mPET results for seasonal agricultural workers between April and September.
Sustainability 16 08903 g007
Figure 8. Comfortable and uncomfortable working hours of seasonal agricultural workers.
Sustainability 16 08903 g008
Table 1. PET and thermal perception criteria for Csa climate type [59].
PET (°C)Thermal PerceptionGrade of Physiological Stress
<8Very coldExtreme cold stress
8–12ColdStrong cold stress
12–15CoolModerate cold stress
15–19Slightly coolSlight cold stress
19–26Comfortable No thermal stress
26–28Slightly warmSlight heat stress
28–34WarmModerate heat stress
34–40HotStrong heat stress
>40Very hot Extreme heat stress
Disclaimer/Publisher’s Note: The statements, opinions and data contained in all publications are solely those of the individual author(s) and contributor(s) and not of MDPI and/or the editor(s). MDPI and/or the editor(s) disclaim responsibility for any injury to people or property resulting from any ideas, methods, instructions or products referred to in the content.