Article

Measuring Hotel Service Productivity Using Two-Stage Network DEA

1
College of Hotel & Tourism Management, Kyunghee University, Seoul 02447, Republic of Korea
2
Smart Tourism Education Platform, Kyunghee University, Seoul 02447, Republic of Korea
*
Author to whom correspondence should be addressed.
Sustainability 2024, 16(20), 8995; https://doi.org/10.3390/su16208995
Submission received: 11 September 2024 / Revised: 9 October 2024 / Accepted: 9 October 2024 / Published: 17 October 2024

Abstract

:
For the sustainable development of the service industry, the industry’s resources must be allocated efficiently so that productivity can be steadily improved. Accurate measurement of productivity is very important for the sustainable growth of the industry because it can be used as basic information for optimizing resource allocation, but in the service industry, it is difficult to accurately reflect consumer feedback due to simultaneity of service. This study aims to overcome these limitations and present a new service productivity measurement model. To this end, we set service quality as an intermediate and used two-stage network DEA, which can better reveal the impact of service quality in productivity than existing DEA models. The subjects of the study were 57 hotels, and they were analyzed according to service level. The analysis revealed that 2- and 3-star hotels with relatively low service levels were efficiently using the given resources to create service quality but were unable to effectively generate sales due to low unit prices. However, 4- and 5-star hotels with relatively high service levels received low service quality evaluations compared to the given resources and effectively generated sales through high per-guest prices. This study has academic significance in that it empirically demonstrated that including service quality as an intermediate is a more effective method for measuring productivity in the hotel industry. In addition, this study suggests practical implications in that high-star hotels need to allocate appropriate resources to improve service quality, and low-star hotels need an appropriate price strategy that is in line with service quality.

1. Introduction

Since the Industrial Revolution of the 19th century, product manufacturing methods have become increasingly innovative [1]. Although innovations have created utility for both firms and consumers through product revitalization, problems such as the consumer choice paradox [2] and intensified corporate competition [3] owing to product overabundance have also occurred. Under these circumstances, it is important for firms with limited resources to measure and improve productivity to reduce costs and achieve maximum sales. In particular, from a manufacturing-centered perspective, it is important to achieve the maximum performance relative to various inputs. Numerous studies related to productivity have been conducted in the manufacturing industry, where input and output factors are clear, and various methodologies to measure productivity have been developed. Among them, the representative methodology is the data envelopment analysis DEA method [4,5,6,7], which has been widely used because of the advantages that input and output factors are variously set and unit-irrelevant.
The service industry has developed along with informatization since the Industrial Revolution, and the concept of productivity has been treated as important in the industry. Since the Industrial Revolution, the productivity of the service industry has increased significantly as IT technology and the Fourth Industrial Revolution technologies (AI, 5G, IoT, Cloud, and Big Data) have developed. These technologies have replaced simple human labor and reduced the amount of human intervention in the service process. However, some services, such as full-service restaurants, are provided by humans, and interaction between humans is still important in the service industry. Therefore, products provided in the service industry have intangible characteristics, and production and consumption occur simultaneously. This is a different characteristic from manufacturing, which simply produces tangible products, and because of this, productivity measurements in the service industry should be different from those of the manufacturing industry. Nevertheless, because of the simultaneity in production and consumption [8], it is difficult to accurately measure the quality of services perceived by consumers. In the service industry, the quality of service provided to consumers should be considered a major factor [9]; however, owing to difficulties such as simultaneity, productivity has been measured by considering input and output factors similar to those in the manufacturing industry [10,11,12,13]. Because the model omits the quality of service evaluated from the consumer’s perspective, it may be difficult to see it as an accurate model of service productivity, because consumer feedback is an important factor in the service industry. In other words, a model that considers service quality based on consumer feedback as an intermediate factor could be an accurate service productivity measurement model reflecting consumer feedback behavior. Therefore, the research question of this study can be defined as follows: “Is it reasonable to simply look at the relationship between input resources and financial performance when measuring productivity in the service industry?” In addition, the sub-question to empirically clarify the problem is “Is there a difference in productivity mediated by service quality depending on the level of hotel service?”
Recent advances in research methodologies and technologies have increased the possibility of establishing productivity models based on consumer feedback. First, in the research methodology, there is a two-stage network DEA method derived from the existing traditional DEA model. This model, developed by Kao and Hwang [14], measures the input and output stages of DEA by dividing them into two stages. In the first stage, the efficiency of the intermediate output created by the first input factor is measured. In the second stage, the output factor of the first stage is converted into an input factor, and the efficiency of the final output generated by these converted input factors is measured. Finally, the efficiency of the entire system is measured by multiplying the efficiencies of the two stages. This method has been used in many studies because of its usefulness [15,16,17,18]. Kao and Hwang [19] highlighted the limitations of the existing DEA model by referring to it as a black box model. The model defines productivity using only input and output factors and cannot sufficiently explain complex intermediate production processes. There are alternative models such as slack-based DEA and stochastic frontier analysis, which are also used in the hotel industry and other service industries [20,21,22,23,24,25]. These models can reveal not only the relative efficiency of each DMU, but also how much input or output factors should be adjusted to improve efficiency. However, these methods only deal with input or output factors and have difficulty in revealing where efficiency or inefficiency occurs in the process between input and output factors. In this respect, the two-stage network DEA is a model that can further refine the measurement of productivity in the service industry, where the production of goods is difficult to explain simply through inputs and outputs. Second, regarding technology, various service platforms based on user feedback have been developed, along with tools to manage the data they generate, making more sophisticated customer feedback data available. With the development of these technologies and topic modeling techniques handling unstructured data [26] based on reviews, which are forks of consumer feedback, it is now possible to study consumer feedback behaviors more easily than before.
Given these environmental changes, this study aimed to achieve the following objectives: First, while solving the problem of service simultaneity, which has been a limitation in defining service quality in previous studies, we aimed to redefine consumer review-based feedback behavior as service quality by applying more advanced techniques. The redefined service quality suggestion is expected to overcome the limitations of service quality research, which has predominantly relied on survey methods, and to offer a new perspective. Second, we aimed to contribute to the development of existing service productivity measurement models by proposing a new productivity model for the service industry that includes service quality as an intermediate. In the hospitality field, DEA analysis has been conducted in many studies and has developed from studies that simply considered factors such as human resources, tangible assets, and financial performance [27,28,29] to the current stage of applying two-stage network DEA [30]. The two-stage network DEA of previous studies did not include service quality as an intermediate, but this study included it to clarify the importance of service quality for productivity. To achieve the research objective, we executed two-stage network DEA methodology and compared it with the existing model. To further compare clear differences in productivity according to service quality, we conducted an empirical analysis by dividing the research object by service level. The hotel industry is subject to empirical analysis, considering the size of the industry and data availability. We planned to examine hotel companies in Korea. This study offers academic and practical contributions by empirically investigating the effect of service quality, previously only conceptually explored in the service industry, on productivity and verifying the importance of the service quality value determined by consumers, as discussed in previous research.

2. Literature Review

2.1. Service Quality and Service Productivity

Quality improvement can increase a firm’s productivity and maximize profits. From this perspective, these three aspects work as triplets, which means that they form a network of interactions [31]. The framework illustrated in Figure 1 illustrates the relationships between these three elements.
In traditional industries (like manufacturing), productivity can be increased by improving a series of quality-related activities that reduce costs and increase sales. For example, investing in new machines can reduce production costs and improve the manufacturing processes. However, there are some limitations to applying the same framework to the service industry. In the service context, service quality is not simply defined by providers’ activities. An essential characteristic of a service is that production and consumption occur simultaneously [8]. This means that the producer-oriented viewpoint is not applicable to the service sector, and customer-oriented service quality is required to measure productivity [9]. However, much research on measuring the service industry’s productivity has been conducted from a traditional perspective, which does not consider customer-oriented service quality [10,11,12,13].
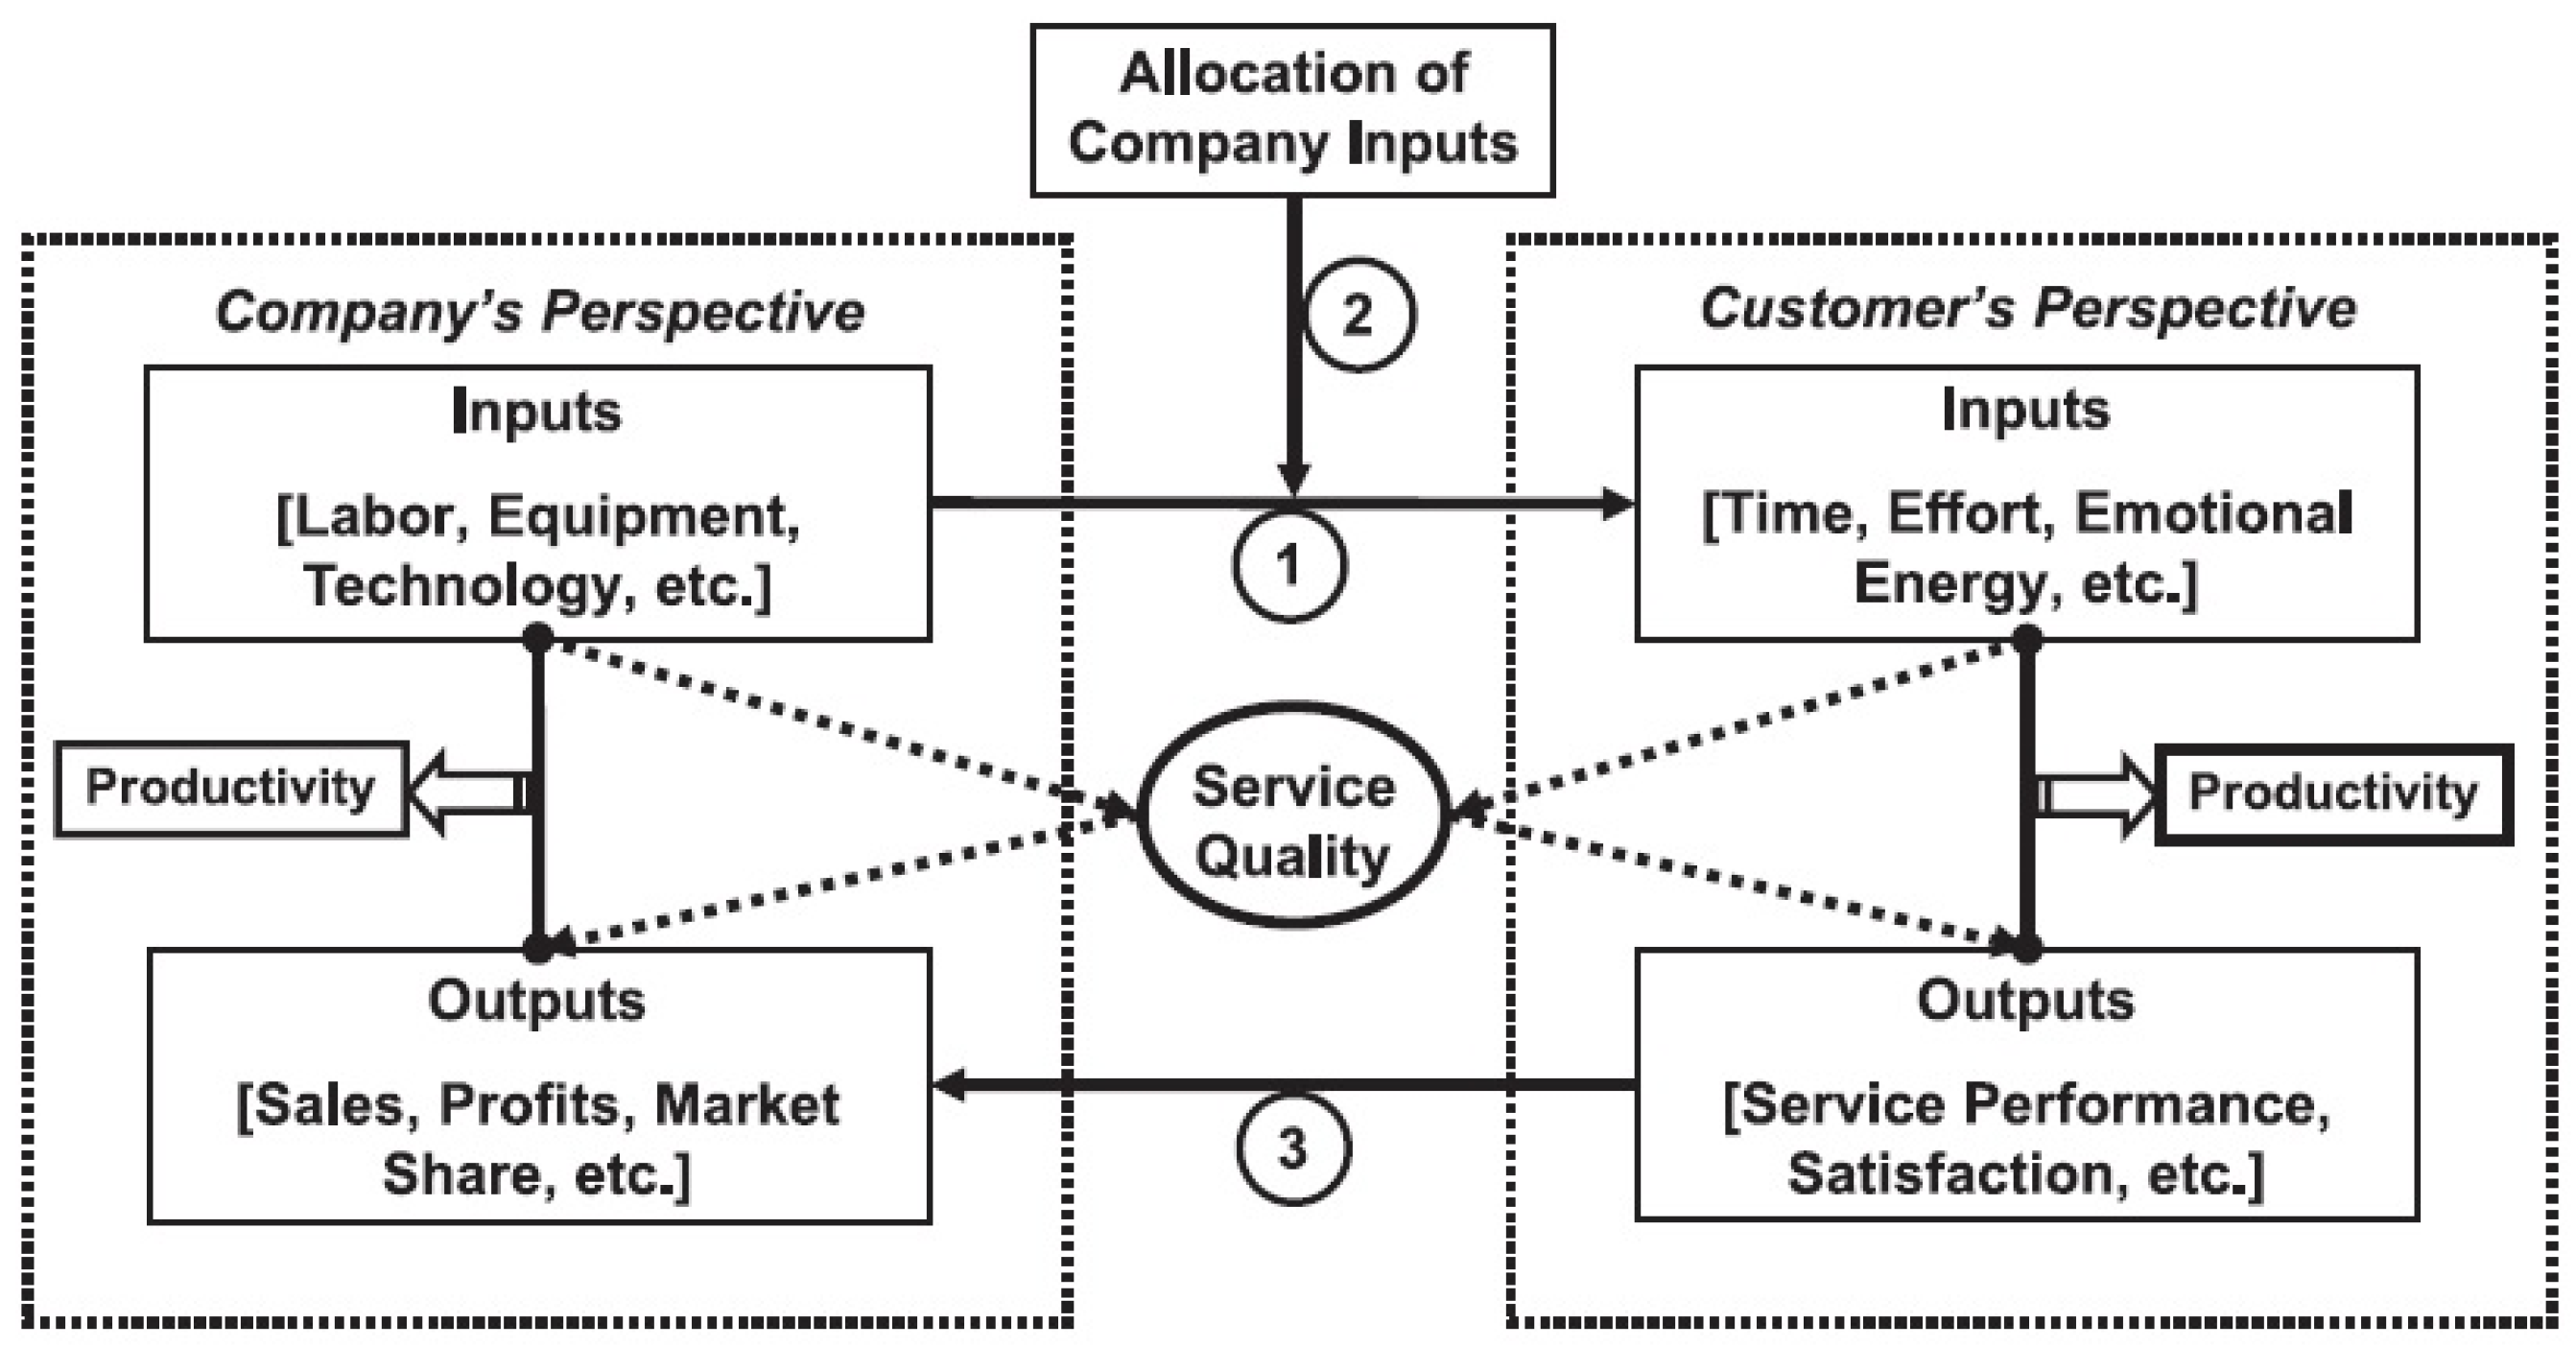
Service quality is normally defined as a customer’s recognition or perception of services provided during each service process [32,33,34]. The measurement and definition of service quality have been actively discussed [35,36,37,38,39,40]. These definitions are defined in various ways, depending on the purpose of the researchers and practitioners in diverse industries. The most widely used quality measurement method is SERVQUAL [41]. Although SERVQUAL has been criticized for its validity, its applicability in different cultures, and its applicability in online environments [42], it is still a powerful method that is used even nowadays. SERVQUAL consists of five dimensions: tangibility, reliability, responsiveness, assurance and empathy. The main purpose of SERVQUAL is to measure how service quality responds to customer-oriented outcomes such as customer satisfaction, retention, and intention. By measuring this response, SERVQUAL determines whether it can contribute to a company’s profit creation by increasing customer loyalty. Some researchers have stated that service quality based on customer evaluations should be considered, particularly when measuring productivity in the service industry. Parasuraman [9] suggested a conceptual framework for measuring productivity, as shown in Figure 2:
In this framework, during the processing of a service product, the customer’s perspective of the input–output relationship must be considered. For example, consider a full-service restaurant. From a traditional perspective, the productivity of this restaurant can be expressed as the number of customers handled per employee. To maximize this productivity, it would be necessary to hire more employees or expand the kitchen equipment to produce food more rapidly. However, this type of productivity calculation does not include customer-centered factors such as the customer’s time or economic effort and satisfaction. However, factors such as customer satisfaction can increase the customer revisit intention and contribute to increased sales [43]. Therefore, productivity including the customer perspective should be considered primarily. This framework also mentions that service quality perceived by customers plays a role in adjusting productivity in the service production process and that a synergetic effect exists between productivity and service quality. For instance, the sales generated by a hotel relative to its resources such as manpower and tangible assets vary depending on the quality of service perceived by customers. Since the perceived service quality of customers increases, the revisit intention increases as their satisfaction increases [44], so it is possible to maintain steady sales without additional resource investment for promotion. In addition, the service quality provided by a hotel can increase or decrease the customer satisfaction relative to the effort invested. Therefore, this service quality plays an intermediate role in terms of service productivity. Another study noted that when measuring service productivity, the relationship between quality, profitability, and profit is not unidirectional; however, the interaction between productivity, quality, and customer demand should be considered [45,46]. These studies suggest that customers’ perceived service quality can act as an intermediate variable in measuring service productivity. The measured service quality does not directly affect a company’s financial performance; however, as revealed in previous studies, this service quality is closely related to productivity, and an increase in productivity is directly linked to company performance.
Despite the importance of perceived service quality in the service industry, numerous studies have only presented a conceptual framework rather than empirical research that measures productivity by applying service quality, due to limitations such as measurement costs and technology [9,47,48]. Although there are some empirical studies on measuring service productivity, they have been studied only in terms of traditional aspects such as input of tangible resources and production of sales rather than considering service quality as a major factor due to limitations in data accessibility and methodology [27,28,29]. In the service sector, alternative efficiency measurement methods were used in various studies. Several studies conducted slack-based DEA [20,21,22], which can estimate the factors need to be adjusted to improve efficiency, and stochastic frontier analysis, which probabilistically estimates efficiency from the maximum production frontier [23,24,25]. However, these analyses only consider the output compared to the input, so they cannot know what kind of efficiency improvement is needed in the intermediate stage. This means that the existing model cannot accurately see the impact of service quality on productivity. As mentioned in previous studies, it is difficult for service quality in the service industry to be a sole input or output factor. Service quality is strongly characterized as an intermediate that is necessary to transform tangible resources into financial performance. Since these traditional DEA methods only use resources that can be quantified in terms of tangible aspects, subjective indicators such as service quality have not been widely used. In this study, in order to overcome these limitations, we intend to measure productivity using service quality as an intermediate using a two-stage network DEA. One recent study examined the flow of existing research related to service productivity using a meta-analysis approach, stating that more than half of the research related to service productivity was a survey (53.7%), followed by other literature studies (29.9%), interviews, and case studies (16.4%) [49]. The survey method can precisely measure the perceived quality of customers but cannot measure a firm’s actual performance, such as financial growth. Furthermore, in survey-based service-quality measurements, there is a time gap between when the service is provided and when it is measured. To overcome these issues, recent studies have measured service quality based on consumer feedback generated by consumers’ voluntary behavior.

2.2. Measuring Service Quality from Consumer’s Feedback

One of the major actions consumers can take is to leave an evaluation on review sites. These consumer actions can be defined as voluntary engagements in which the consumer delivers feedback directly in the final stage of the service process [50]. Recent studies have attempted to measure and analyze the service quality resulting from these voluntary feedback behaviors. Calvin and Johan Setiwan [51] measured the service quality of mobile phone providers by using Twitter text mining. Their results showed that popularity based on customer satisfaction derived from voluntary feedback can be used to define supplier service quality. Miranda and Sassi [52] conducted similar research on online job search companies incorporating sentiment analysis using customer comments collected from service cancellation forms. Their findings revealed that customer comments, which are unstructured data and voluntary feedback data, are sufficiently usable tools to evaluate customer satisfaction with suppliers. Another study was conducted in the hotel industry [53]. In this research, authors analyzed 100 hotel consumer reviews in New York City collected from TripAdvisor using Herzberg’s two-factor theory. The results showed that satisfiers and dissatisfiers are distinct in full-service hotels and hotel firms should monitor these factors to enhance their service experiences for customers. In addition, various studies have examined consumers’ voluntary feedback processes, such as review writing and rating behavior, and these studies have suggested that these consumer behaviors can be sufficiently used as a measurement of service quality [54,55].
In the service industry, not only the provider’s process but also consumer participation is a factor that defines service quality. Therefore, the act of writing reviews, in which a consumer voluntarily participates in the service process, can be described as a process of valuing consumers’ perceived services. In other words, it is expected that by using reviews expressed by consumers’ voluntary feedback behavior, it will be possible to suggest an alternative direction to overcome the limitations of survey-based research in measuring service quality.

3. Methodology

3.1. Framework of Research

By applying the service productivity measurement framework proposed by previous researchers such as Parasuraman [9], this study attempted to measure service productivity, which includes customers’ voluntary feedback behavior, as shown in Figure 3. Unlike the traditional productivity measurement method, which simply measures the output factor compared to the service provider’s input factor, this study attempted to measure productivity through the network DEA presented by Kao and Hwang [14]. Examining the two-stage network DEA step by step, the input factors in the first stage are elements such as the company’s tangible assets and labor force. Additionally, the output factors in stage 1 are the customer’s perceived service quality, that is, the review score, which is a voluntary feedback behavior. The service quality derived from the first stage is converted back into the input factor of the second stage, and the output factor of the second stage is the company’s financial performance. Service quality can be defined as an intermediate factor because it is both an output in stage 1 and an input in stage 2. In addition, this study simultaneously analyzed the traditional DEA model based on variable returns to scale (VRS) to compare how the two-stage network DEA is advantageous over the traditional DEA model, which is referred to as the black box model.
The two-stage network DEA has also been used in several studies in the hotel field. One study analyzed the productivity of hotels in the UK, decomposed it into two stages, and analyzed which stage of productivity improvement was more necessary [30]. The first stage analyzed the assets created by input factors such as the cost of goods sold, fixed assets, and labor, and the second stage analyzed the revenue and capital created by these assets. The analysis results showed that UK hotels were not using resources efficiently, and that productivity improvement was particularly necessary in the second stage rather than the first stage. In other words, it revealed that it was important to use assets efficiently to create profits. In this way, the two-stage network DEA is useful for identifying which parts require efficiency improvement through stage-by-stage productivity comparisons that are difficult to see with traditional DEA models.

3.2. Probability-Frequency Weighted Measurement

To measure service quality as an intermediate product, review data, which reflect consumers’ voluntary feedback behaviors, must be analyzed. There are many analysis methods for reviewing data; however, this study used the probability–frequency weighted scale that was applied in a previous study [56]. The probability–frequency weighted scale can be expressed as the sum of user i ’s positive or negative evaluation scores in service quality dimension k . First, to deduce the service quality dimensions, the words used in each user’s review and the topics that these words express are probabilistically estimated. Next, the quantitative size of the positive or negative emotions of the words by building their own sentiment dictionaries is measured. To build a sentiment dictionary, a penalized logistic method is applied to solve the dimensionality problem, in which the ridge model with the highest classification accuracy is set as the final dictionary construction model.
To construct the sentiment dictionary, a document-term matrix (DTM) obtained through text preprocessing was first set as the independent variable. A DTM is a matrix that lists all the words mentioned by each user in a review and displays their frequency. For example, if a certain user mentioned a review that said, “Today’s meal was good,” the words ‘today’, ‘meal’, ‘was’, and ‘good’, which are the smallest semantic units, are counted once each. Since these reviews are written by multiple people, it is organized as a matrix. The dependent variable was set as the rating given by each user and as a dichotomous dependent variable, with 5 points being 1 and 1–3 points being 0. The classification model was defined as a logistic model, and the size of the coefficient of each word was defined as the size of the sentiment. The reason for using a logistic model by dividing consumer evaluations into dichotomous variables is that it is more efficient to view the magnitude of emotion itself as positive or negative rather than expressing it in a continuous form. The sentiment of a specific word mentioned by an individual user is determined by whether the score each person evaluated is positive or negative. In other words, the more a word is mentioned in a negatively evaluated rating, the more likely it is that the word has a negative sentiment, and the opposite is true for a positive evaluation. The penalized logistic method is used to solve the “curse of dimensionality” in which the dimensions of the dependent variable become numerous when using a simple logistic model. The penalized logistic model was compared with the commonly used Lasso model and Ridge model, as well as the ElasticNet model. Among these, the Ridge model, which had the highest classification accuracy (accuracy: 92.58), was set as the final model. Coefficients of the sentiment dictionary generated by the Ridge model will be the sentiment scores of specific words in the potential service dimension derived through latent Dirichlet allocation (LDA).
The LDA method was used to determine the dimensions of the post-designed service quality [20]. When the collected text data are not classified into a specific topic, discovering latent topics that are not revealed in the document through unsupervised learning is called topic modeling. This method is also called LDA and is named after the distribution of documents and words used in the model. Using the LDA method, latent topics can be extracted and the probability of word distribution within the topic can be calculated. For example, the word ‘hotel’ in this study has a probability of appearing in a total of 16 latent topics. Among them, the probability of appearing in latent topics number 8 and number 16 was the highest at 25.5% and 21.4%, respectively. This probability can be expressed as a matrix that is called the term-topic matrix (TTM), and in this analysis, the service dimension was classified using the derived TTM. A total of 20 potential topics were initially deduced, and to determine the dimensions, words were sorted in order of the highest probability among these topics. For instance, words with a high probability of appearing in latent topic number 1 can be sorted in the order of ‘room’, ‘bathroom’, ‘shower’, and ‘water’. Based on the sorted words, the service dimensions appropriate for each of the 20 topics were named. In this process, some of each topic may cover the same service dimension. For example, words mainly related to ‘room condition’ may be abundant in latent topic number 1 or number 11. In our study, the words with high probability in latent topic number 1 were ‘room’, ‘bathroom’, and ‘shower’ and ‘night’, ‘sleep’, and ‘bed’ in topic number 11. Therefore, we went through the process of grouping potential topics that cover the same dimension. After organizing service dimensions with related latent topics, the dimensions that did not reflect the providers’ service quality were deleted (emotional, cost-effectiveness, and customers’ family topics were deleted). Finally, the four service dimensions were determined. Examples of word combinations with high distribution probabilities for each determined service dimension are listed in Table 1.
Using the LDA method, four service dimensions were derived, and the probability of a specific word appearing in each dimension was calculated. With these probabilities, it is possible to calculate a probability–frequency weighted scale by also determining each word’s frequency. The frequency of the appearance of each word was calculated using the DTM derived from the text preprocessing step. The service quality evaluation score of a specific user was calculated by multiplying the weighted scale by the magnitude of positive or negative emotions established in the sentiment dictionary. For example, if a particular consumer mentioned ‘airport’, ‘bus’, and ‘station’, the consumer’s ‘Convenience’ evaluation score would be the sum of the number of times each word was mentioned in the review by the product of the probabilities of each word appearing in the ‘Convenience’ topic. The final probability–frequency weighted measurement can be expressed as Equations (1) and (2):
S Q p o s ,   k = s S k i I k [ P r ( w i | T s ) × F r e q ( w i ) × β i p o s ] ,             k K
S Q n e g ,   k = s S k i I k [ P r ( w i | T s ) × F r e q ( w i ) × β i n e g ] ,             k K
where:
K represents the total number of service quality dimensions,
w i | T s represents an i th word in a certain topic S ,
F r e q ( w i ) represents the frequency of i th word that appeared in each review,
β i p o s ,   β i n e g represents the coefficient of sentiment dictionary when the i th word is positive (pos) or negative (neg).
As the final service quality score includes both positive and negative evaluations, there are cases where negative scores are calculated if negative evaluations prevail for a specific analysis unit. However, in a typical DEA model, input factors cannot have negative values. To overcome these limitations, various methodologies that include negative values as input factors have recently been proposed. Transforming negative data is an initial approach for solving these problems [57,58]. Negative data can be handled by adding the same constant to all elements of the input or output vector, such that these negative values become positive [59]. The same calculation is usually applied to include a negative service score in the two-stage network DEA. However, this study applied the method differently by adding a constant that reflected the distribution of the data rather than adding an arbitrary constant. In other words, by subtracting the minimum value of each variable from the corresponding variable vector and adding the standard deviation, data conversion was attempted to consider dispersion as much as possible. Because there is no standard model for dealing with negative data [60], this application is also considered as a way to convert negative values to positive values while minimizing data distortion. According to Zhu and Cook [61], data conversion is the only invariant in the variable return to scale (VRS) DEA model, and no form of negative data can be used in the constant return to scale (CRS) DEA model. Because this analysis assumes a VRS model, the transformation of negative data appears to be sufficiently usable.

3.3. Network Data Envelopment Analysis (DEA) and Malmquist Productivity Index (MPI)

This study employed a two-stage network DEA to measure service productivity each year and a common-weight global Malmquist productivity index (MPI) to measure the changes in productivity over the period [56,62,63]. DEA is a non-parametric method that measures relative productivity by measuring the weighted sum of inputs to the weighted sum of outputs, deriving efficient frontiers, and comparing them with individual decision-making units (DMU). Although the MPI suggested by Färe et al. [64] has been widely used in productivity studies, their model does not meet the circularity requirements when comparing more than two periods. In contrast, Pastor and Lovell [65] proposed a global MPI by constructing a global efficiency frontier with DMUs for all periods. Kao and Hwang [63] proposed the common-weight global MPI, which maintains a common frontier facet over a period to make efficiencies comparable across periods, leading to circularity. We developed a service productivity model based on the framework suggested by Kao and Hwang [63]. To maintain the same frontier facet, this study first calculated the overall efficiency of k entirety E k · S using Equation (3).
E k S = m a x r = 1 s u r Y ~ r k . , s . t   i = 1 m v i X ~ i k . = 1 , g = 1 h w g Z ~ g j . i = 1 m v i X ~ i j .   0 ,     j = 1 , , n , g = 1 h w g Z g j p i = 1 m v i X i j p 0 ,     p = 1 , , q     j = 1 , , n , r = 1 s u r Y ~ r j . g = 1 h w g Z ~ g j .   0 ,     j = 1 , , n , r = 1 s u r Y r j p g = 1 h w g Z g j p 0 ,     p = 1 , , q ,     j = 1 , , n , u r ,   v i ,   w g     0 ,     r = 1 , , s ,     i = 1 , , m ,     g = 1 , , h
where:
k denotes entirety which is set of n DMUs (j = 1, …, n),
u r ,   v i ,     w g denotes virtual multipliers applied to meet the assumptions of convexity,
X ~ i k .   ,     Z ~ g k .   ,     Y ~ r k . denotes the total of i th input factor, g th intermediate factor, and r th output factor for k th entirety across all periods,
X i k p ,     Z g k p ,     Y r k p denote the i th input factor, g th intermediate factor, and r th output factor for k th entirety at period p .
Although the system efficiencies calculated by network models can be decomposed into separate efficiencies, different frontiers may cause multiple solutions, which implies that the decomposition might not be unique [63]. Therefore, as mentioned above, the overall efficiency E k · S calculated in Equation (3) must be fixed to make a common basis for comparison. With the overall efficiency E k · S fixed, system efficiencies in each period ( t ) E k t S can be calculated as demonstrated in Equation (4).
E k t S = m a x r = 1 s u r Y r k t ,   s . t   i = 1 m v i X i k t = 1 ,   r = 1 s u r Y ~ r k . = E k . s i = 1 m v i X ~ i k .   ,   g = 1 h w g Z g j p i = 1 m v i X i j p 0 ,     p = 1 , , q     j = 1 , , n ,   r = 1 s u r Y r j p g = 1 h w g Z g j p 0 ,     p = 1 , , q ,     j = 1 , , n ,   u r ,   v i ,   w g     0 ,     r = 1 , , s ,     i = 1 , , m ,     g = 1 , , h
The decomposed efficiencies must maintain the common basis by fixing overall system efficiency E k · S and multi-period system efficiency E k t S as calculated by Equations (3) and (4), respectively. By fixing the two system efficiencies, the decomposed efficiencies for first-stage E k t I were measured using Equation (5).
E k t I = m a x g = 1 h w g Z g k t ,   s . t   i = 1 m v i X i k t = 1 , r = 1 s u r Y ~ r k . = E k . s i = 1 m v i X ~ i k .   , r = 1 s u r Y r k t = E k t s i = 1 m v i X i k t   , g = 1 h w g Z g j p i = 1 m v i X i j p 0 ,     p = 1 , , q ,     j = 1 , , n , r = 1 s u r Y r j p g = 1 h w g Z g j p 0 ,     p = 1 , , q ,     j = 1 , , n , u r ,   v i ,   w g     0 ,     r = 1 , , s ,     i = 1 , , m ,     g = 1 , , h
Once the first-stage efficiency E k t I is calculated, the decomposed second-stage efficiency E k t I I can be calculated from E k t S , which is the product of E k t I and E k t I I . In the conventional DEA framework, constant returns to scale (CRS) productivity can be expressed as the product of scale efficiency (SEC) and (pure) technical efficiency (TEC), which assumes variable returns to scale (VRS) [4]. Thus, this study further sought to decompose each period’s productivity, as calculated by Equation (5), which divides the CRS into TEC and SEC. In the multistage production process, increased outputs in the first stage may cause inefficiencies in the second stage because the output of the first stage is the input of the second stage [19]. Therefore, this study uses an input-oriented model for TEC in the first stage and an output-oriented model for TEC in the second stage. By fixing the multi-period first-stage efficiencies, E k t I , the technical efficiencies of the first stage of each period can be calculated using Equation (6).
T E C k t I = max ( g = 1 h w ~ g Z g k t w ~ k + w ~ k ) ,   s . t   i = 1 m v ~ i X i k t = 1 , g = 1 h w g Z g k t . = E k t I i = 1 m v i X i k t   , g = 1 h w g Z g j p i = 1 m v i X i j p 0 ,     p = 1 , , q ,     j = 1 , , n , r = 1 s u r Y r j p g = 1 h w g Z g j p 0 ,     p = 1 , , q ,     j = 1 , , n , ( g = 1 h w ~ g Z g j p w ~ k + w ~ k ) i = 1 m v ~ i X i j p 0 ,   p = 1 , q ,   j = 1 , , n u r ,   v i ,   w g ,   v ~ i ,   w ~ g ,   w ~ k ,   w ~ k     0 ,     r = 1 , . . . , s ,     i = 1 , , m ,     g = 1 , , h
Similarly, the TEC of the second stage can be calculated by fixing the second-stage efficiency of each period E k t I I . One difference from the first-stage technical efficiency is that the values calculated by Equation (7) are the reciprocal of the efficiencies because the second-stage technical efficiencies are based on the output-oriented model.
1 T E C k t I I = m a x ( g = 1 h w ~ g Z g k t w ~ k + w ~ k )   s . t   i = 1 m u ~ i Y i k t = 1 , r = 1 s u r Y r k t . = E k t I I g = 1 h Z g k t   , g = 1 h w g Z g j p i = 1 m v i X i j p 0 ,     p = 1 , , q ,     j = 1 , , n , r = 1 s u r Y r j p g = 1 h w g Z g j p 0 ,     p = 1 , , q ,     j = 1 , , n , i = 1 m u ~ r Y r j p ( g = 1 h w ~ g Z g j p w ~ k + w ~ k ) 0 ,   p = 1 , , q ,   j = 1 , , n u r ,   v i ,   w g ,   v ~ i ,   w ~ g ,   w ~ k ,   w ~ k     0 ,     r = 1 , , s ,     i = 1 , , m     g = 1 , , h
While this study did not directly develop models to calculate second- and first-stage efficiencies, they can be calculated using Equation (8), which consists of decompositions derived from Equations (4)–(7).
E k t S = E k t I × E k t I I = T E C k t I × T E C k t I I
Finally, because the efficiencies calculated by previous models possess the property of circularity and are thus comparable across periods, the common-weight global MPIs between periods t and t + 1 can be calculated using the ratio of the efficiencies of period t to those of period t + 1 . From the decompositions calculated by the previous models, the relationship can be derived using Equation (9).
M P I k ( t ,   t + 1 ) S = E k (   t + 1 ) S E k t S = T E C k (   t + 1 ) I × T E C k (   t + 1 ) I I T E C k t I × T E C k t I I = M P I k ( t ,   t + 1 ) I × M P I k ( t ,   t + 1 ) I I

3.4. Data and Variables

The data were collected from two sources: TripAdvisor and Korean corporate disclosure data. Consumer review data were collected from TripAdvisor, and service quality scores were derived from the data. Korean corporate disclosure data were collected from the electronic disclosure system (data analysis, retrieval, and transfer system; DART) provided by the Korean government’s Financial Supervisory Service, through which the company’s input and output factors were collected. Among the various service industries, the hotel industry is our subject. The prerequisites for using the two-stage network DEA model in this study are service quality data evaluated by consumers and actual input and output information for each DMU. In the hotel industry, reviews by hotel users exist on various online hotel reservation sites, and public information on hotel companies is disclosed and provided by credible government agencies. In this respect, the hotel industry can be considered as an appropriate subject for analysis.
To construct the data, basic and financial information on 397 hotels, which are external audit target corporations in Korea, was first collected. Basic information includes operating hotel brands and the number of rooms per hotel. Financial information includes balance sheets and cash flow statements. Information on companies subject to external audits was collected through the DART. To prevent the analysis results from being distorted due to the impact of the coronavirus pandemic, only data up to 2019, before the pandemic began in earnest, were used. During the coronavirus pandemic period, the number of hotel visitors was rapidly decreasing [66], and in particular, fear of infectious diseases and policies for distancing from infected people caused an abnormal market shock. Therefore, evaluation of service quality during this period was excluded from the analysis because there was a high probability of bias due to exogenous factors. In addition, five years of data from 2015 to 2019 were acquired to calculate the global MPI and compare the efficiency at various points in time. Considering that review data were collected at the hotel level and corporate information was collected at the company level, hotel companies operating multiple brands were excluded, and companies operating only a single hotel were targeted.
The data that formed the basis of service quality evaluation were collected using TripAdvisor. TripAdvisor is relatively advantageous in the crawling collection environment and has the advantage of being able to be translated into English regardless of the written language. In addition, TripAdvisor provides relatively clearer and richer review and rating data than other platforms [67] and also includes ratings for each element of the service, making it easy to conduct a comprehensive analysis [68]. Other data sources such as Hotels.com and domestic review sites (e.g., Yanolja, Naver smartstore) may also exist. However, since a service quality evaluation of homogeneous consumers is required and previous studies have shown that TripAdvisor’s review quality is relatively better, these sites were excluded. For this reason, TripAdvisor is one of the hotel reservation platforms most commonly used by consumers and has been used in many studies [69,70,71]. Among the businesses registered on TripAdvisor, approximately 110,000 reviews were collected for 1153 lodging establishments in Seoul, of which only hotels belonging to external audit corporations collected through the DART were selected for analysis. Hotel reviews are converted into service quality scores using the probability–frequency weighted measurement method described above. Finally, 57 companies that matched the service quality evaluation data and corporate information, including a five-year time series, were analyzed. Considering previous research [5,72,73,74,75,76,77,78] and data availability, this study defined the input, intermediate, and output factors, as shown in Table 2. The sales variable was analyzed using natural logarithms in consideration of previous research [79,80,81] and the possibility of data distortion caused by data dispersion.

4. Results

4.1. Descriptive Results

Examining the descriptive statistics which is given in Table 3, first, there is a tendency for the dispersion of each variable to increase. Taking tangible asset (TA) items as an example, the standard deviation in 2015 was 88,251.2 million KRW; however, in 2019, this deviation increased to 91,497.9 million KRW. One of the reasons for this deviation is that the value of Central Mark Hotel Seoul, which had the lowest value from 2015 to 2019, continued to decline, whereas the maximum value of tangible assets did not increase significantly. For other expenses (EXP), the standard deviation continued to increase along with the difference between the maximum and minimum values. For the sales (SALES) variable, since log transformation was used, the variance of the data was relatively more stable than other variables.
Another characteristic of the descriptive statistics is that the number of rooms (NROOMS) remained constant for five years. For a hotel to expand or increase its rooms, it needs strategic judgment with a lot of investment, so this seems to reflect the difficulty in increasing it. Regarding average values, tangible assets and sales tended to increase over the five years, but other costs and labor costs also increased; thus, profits did not improve significantly. Despite the increase in financial indicators, service scores (SQ) did not show the same trend, and the average evaluation scores tended to decrease for all service dimensions. From this perspective, the service evaluation score is expected to play a role as an intermediate in the next two-stage network DEA analysis.

4.2. Productivity Score Comparison by Class of Hotels

This study presents a new productivity evaluation model for service companies that reflects the service evaluation score, which is the voluntary feedback behavior of consumers. To achieve this purpose, it is necessary to compare the existing traditional DEA model with the newly proposed model. The comparison method involves comparing the average efficiency score considering previous research [82,83,84,85]. When comparing the average efficiency scores, the overall average scores of the VRS DEA model and the two-stage network DEA were compared, and the average efficiency scores of the first and second stages within the network stage were compared. Examining the descriptive statistics results, the standard deviation increased by year, and because the average score between hotels may differ depending on the level of service, a simple comparison of averages may distort the results. Therefore, this study conducted average comparisons according to service level. When dividing the groups by service level, the star rating provided by the Korean government according to domestic standards was used. The star rating increases as the service level increases, and ranges from 1 to 5 stars. Based on this standard, 2- and 3-star hotels are classified as class 1, and 4- to 5-star hotels are classified as class 2.
Figure 4 shows a year-by-year comparison of the average scores for each class of the VRS and network DEA models. First, examining the overall scores of the VRS DEA and network DEA, it can be seen that the overall score of the network DEA model is lower than that of the VRS model. This tendency occurs because the efficiency of the entire system in the Network DEA is expressed as a product of the first- and second-stage scores. However, differences still appeared between the models. Examining the scores of VRS DEA, class 1 was 0.781 and class 2 was 0.792 in 2015, 0.712 and 0.739 in 2016, 0.717 and 0.728 in 2017, 0.688 and 0.700 in 2018, and 0.668 and 0.699 in 2019. The class 1 score of the VRS DEA model was lower than class 2 in all years. However, because the VRS model simply represents the degree of sales output compared to inputs such as cost factors, it is difficult to know where these differences appear depending on the service level. Examining the network DEA scores, class 1 recorded 0.472, and class 2 recorded 0.378 in 2015. In 2016, it was 0.439 and 0.343, in 2017 it was 0.470 and 0.363, in 2018 it was 0.480 and 0.354, and in 2019 it was 0.525 and 0.377. The network DEA overall system efficiency score was lower in class 2 than in class 1 for all years. The two-stage network DEA can be observed in more detail, where the score difference according to this service level appeared compared to the VRS DEA. In this study, the 1st stage was viewed as the calculation of service quality compared to the general input factors, and the 2nd stage was viewed as the calculation of sales compared to the input of perceived service quality. In other words, the 2nd stage is to observe how efficiently the consumers perceived service quality, which as an intermediate output is managed to generate sales.
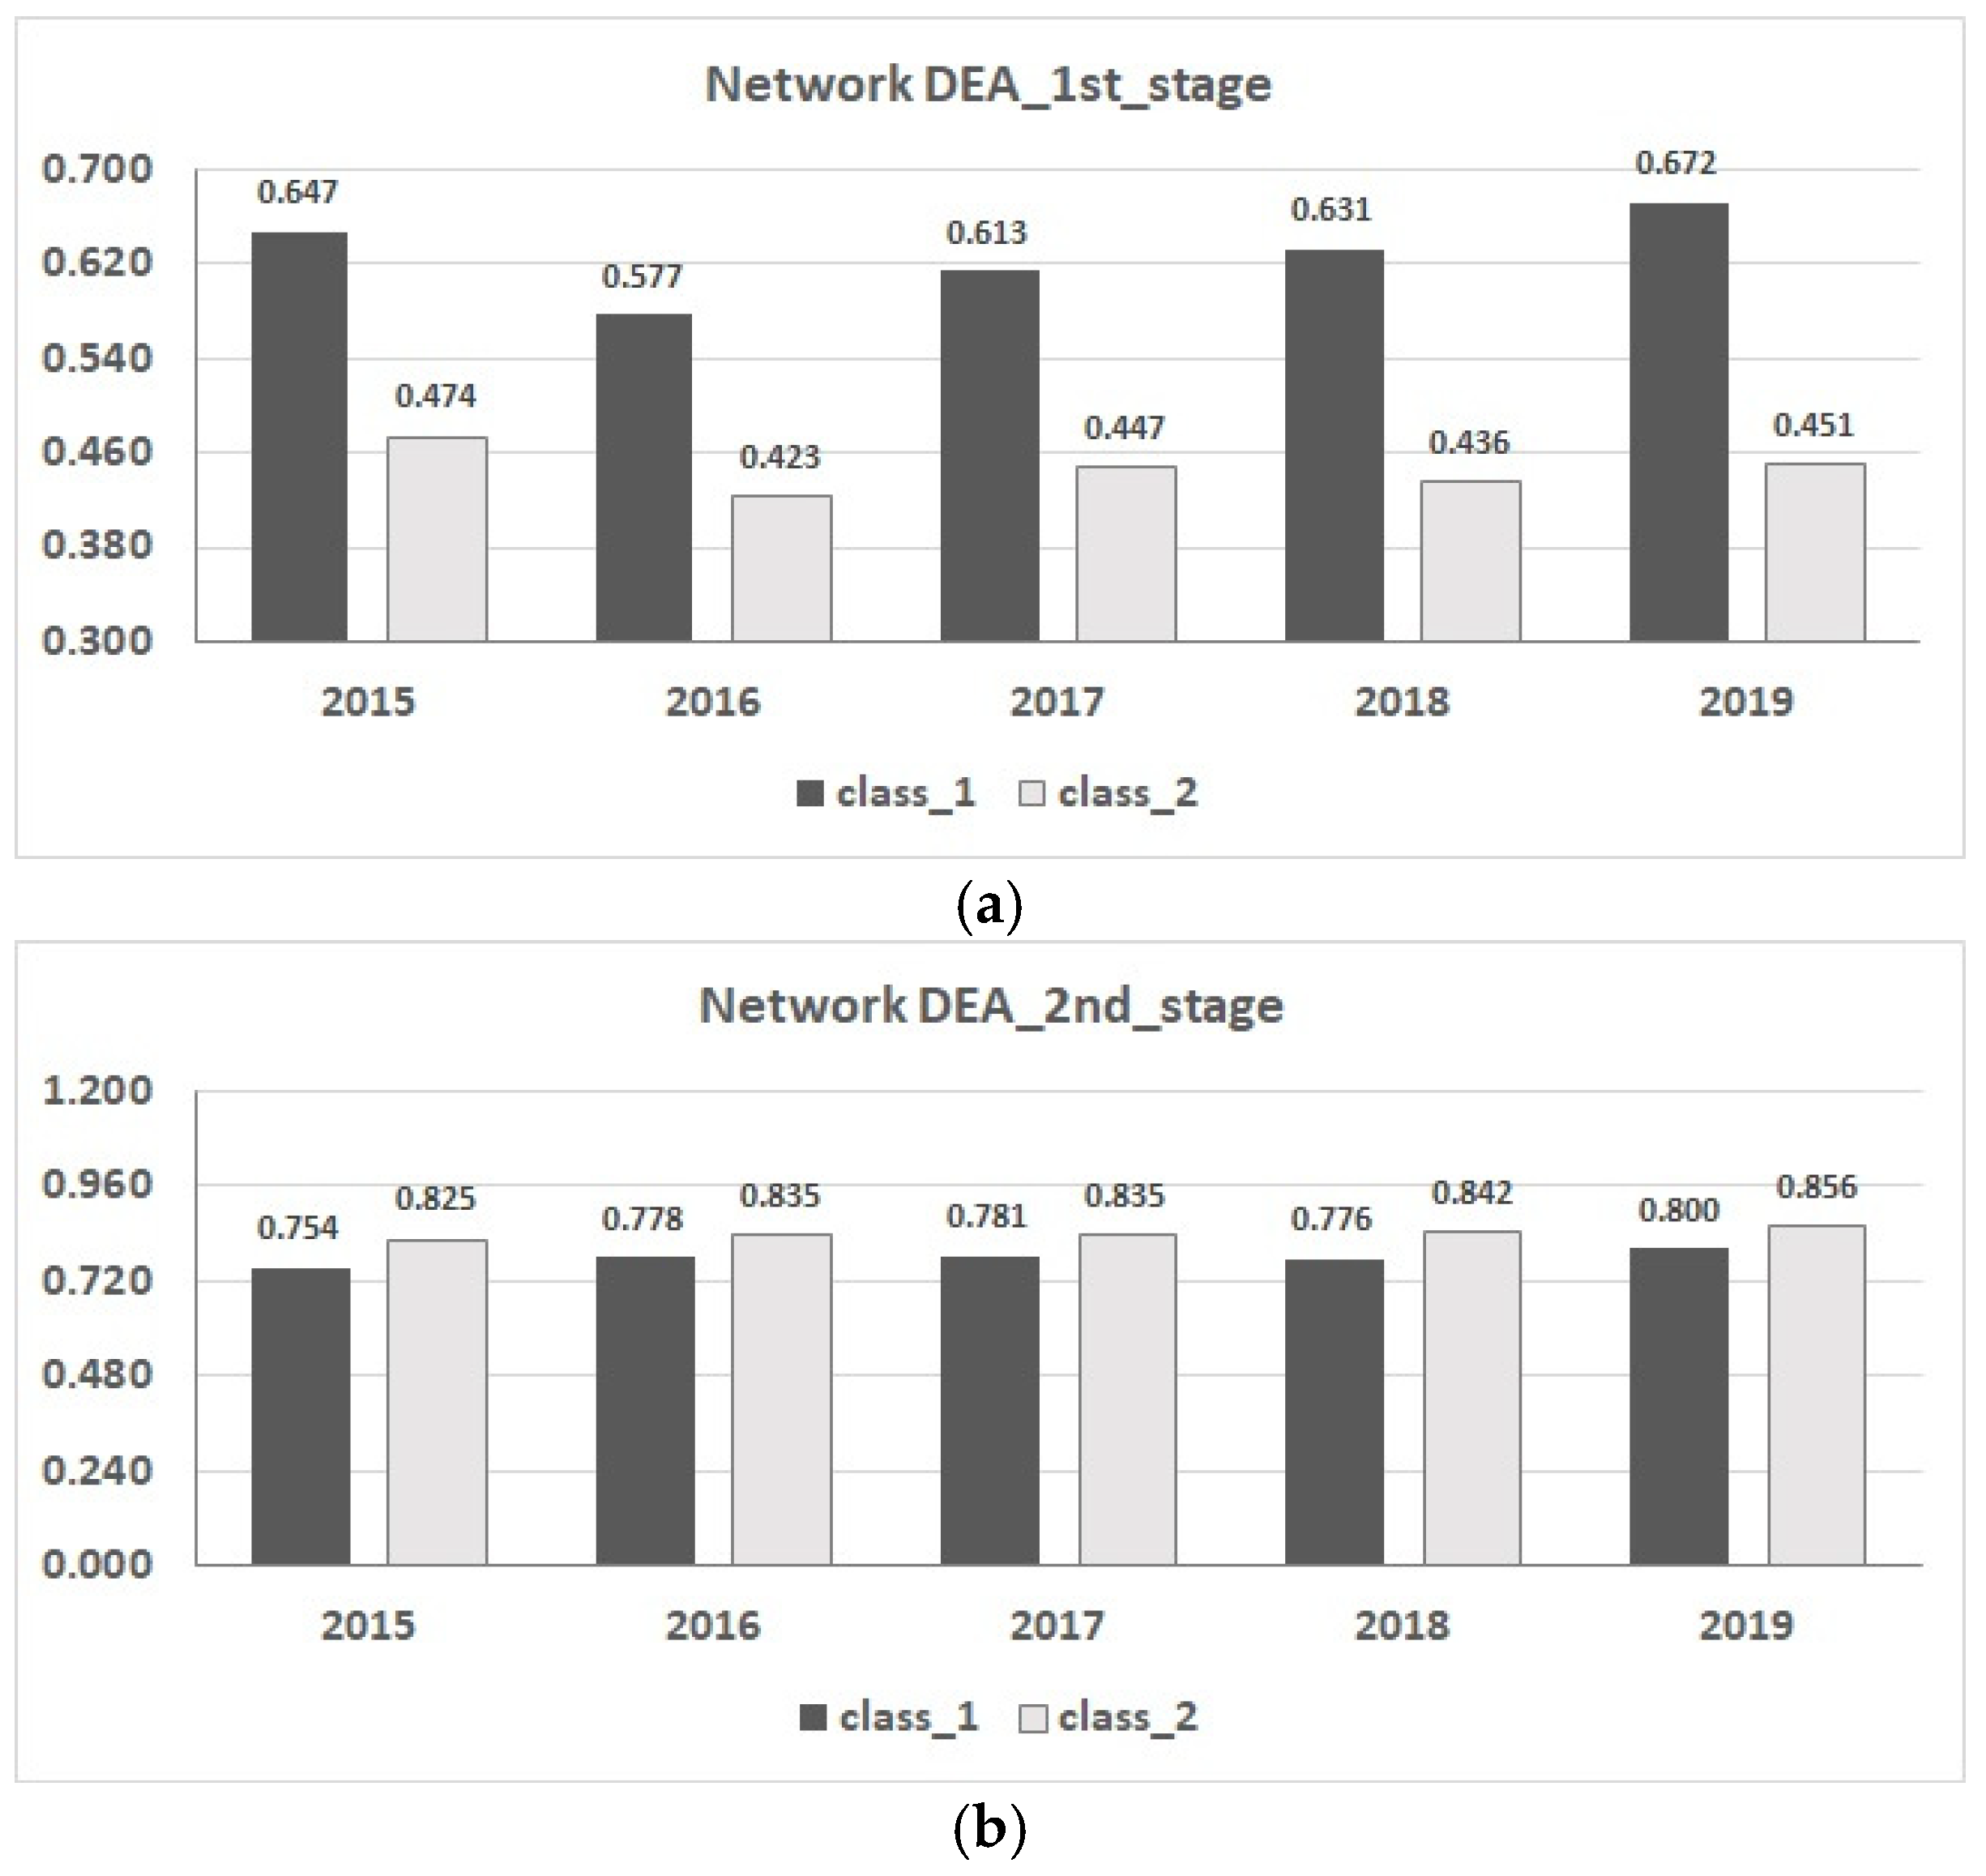
By examining the results of each step of the two-stage network DEA by class, it is clear how hotels are managed efficiently according to the service level. The results are shown in Figure 5. First, the efficiency score of the 1st stage shows that class 1 has an overall higher efficiency score than class 2. Considering that class 1 is a 2~3-star rated hotel with a relatively low service level, it appears that they have created higher service quality relative to the investment of assets, manpower, and costs than hotels with a relatively high star rating. These results are contradictory to the results of the VRS DEA, which showed that hotels with high service levels showed high efficiency, indicating that hotels with low service levels operated more efficiently in creating service quality.
The 2nd stage shows opposite results to the 1st stage. The second step shows how much sales were generated compared with the service quality perceived by customers. In this result, class 2 hotels, that is, 4~5-star hotels with higher service levels, show higher efficiency scores. In other words, hotels with high service levels generate relatively higher sales than low service hotels despite of having lower customers’ perceived service quality scores. To summarize the first and second stages, hotels with relatively low service levels receive higher service evaluations compared to input factors but generate low sales compared to these service evaluations. Conversely, hotels with relatively high service levels receive low service evaluations compared with input factors, but they generate relatively more sales than hotels with low service levels. These results also show more clearly that there are differences in productivity outcomes depending on the service level when service quality is set as an intermediate factor. In other words, they show an intermediate effect of service quality that cannot be seen in the simple input and output relationship.
Wilcoxon’s rank sum test was conducted to examine whether these conflicting results were statistically significant. Wilcoxon’s rank sum test, also called the Mann–Whitney U test, is a representative non-parametric method that tests randomly selected values from two groups [86,87]. It is widely used to compare means, and the null hypothesis assumes that the means of the two groups are the same; if this is not rejected, the means of the two groups are significantly different. Wilcoxon’s rank sum test has also been used in several DEA studies [88,89].
Looking at Table 4, under the VRS DEA, the p-value of Wilcoxon’s rank sum test comparing class 1 and class 2 was not significant in all years. Therefore, the null hypothesis cannot be rejected, and the average for each class cannot be considered statistically different. Comparing the total system efficiency score of network DEA by class, the p-value was significant in all years, except 2015. In 2015, the p-value of the average difference between the two groups was higher than 5%. As a result of comparing the average of each step in network DEA, the p-value of Wilcoxon’s rank sum test was significant in all years. Therefore, there was a significant difference in the means of the groups in the 1st and 2nd stages. In summary, in the VRS DEA model, there was no significant difference in the efficiency score depending on the service level. However, in the two-stage network DEA, there was still a significant difference in the efficiency score for each service level at each stage. Looking at these results, the productivity measurement with service quality as intermediate shows more significant differences in efficiency between hotels due to differences in service levels. In other words, by including service quality as an intermediate, it shows more statistically significant differences in efficiency that were difficult to confirm in the existing model.

4.3. MPI by Class of Hotels

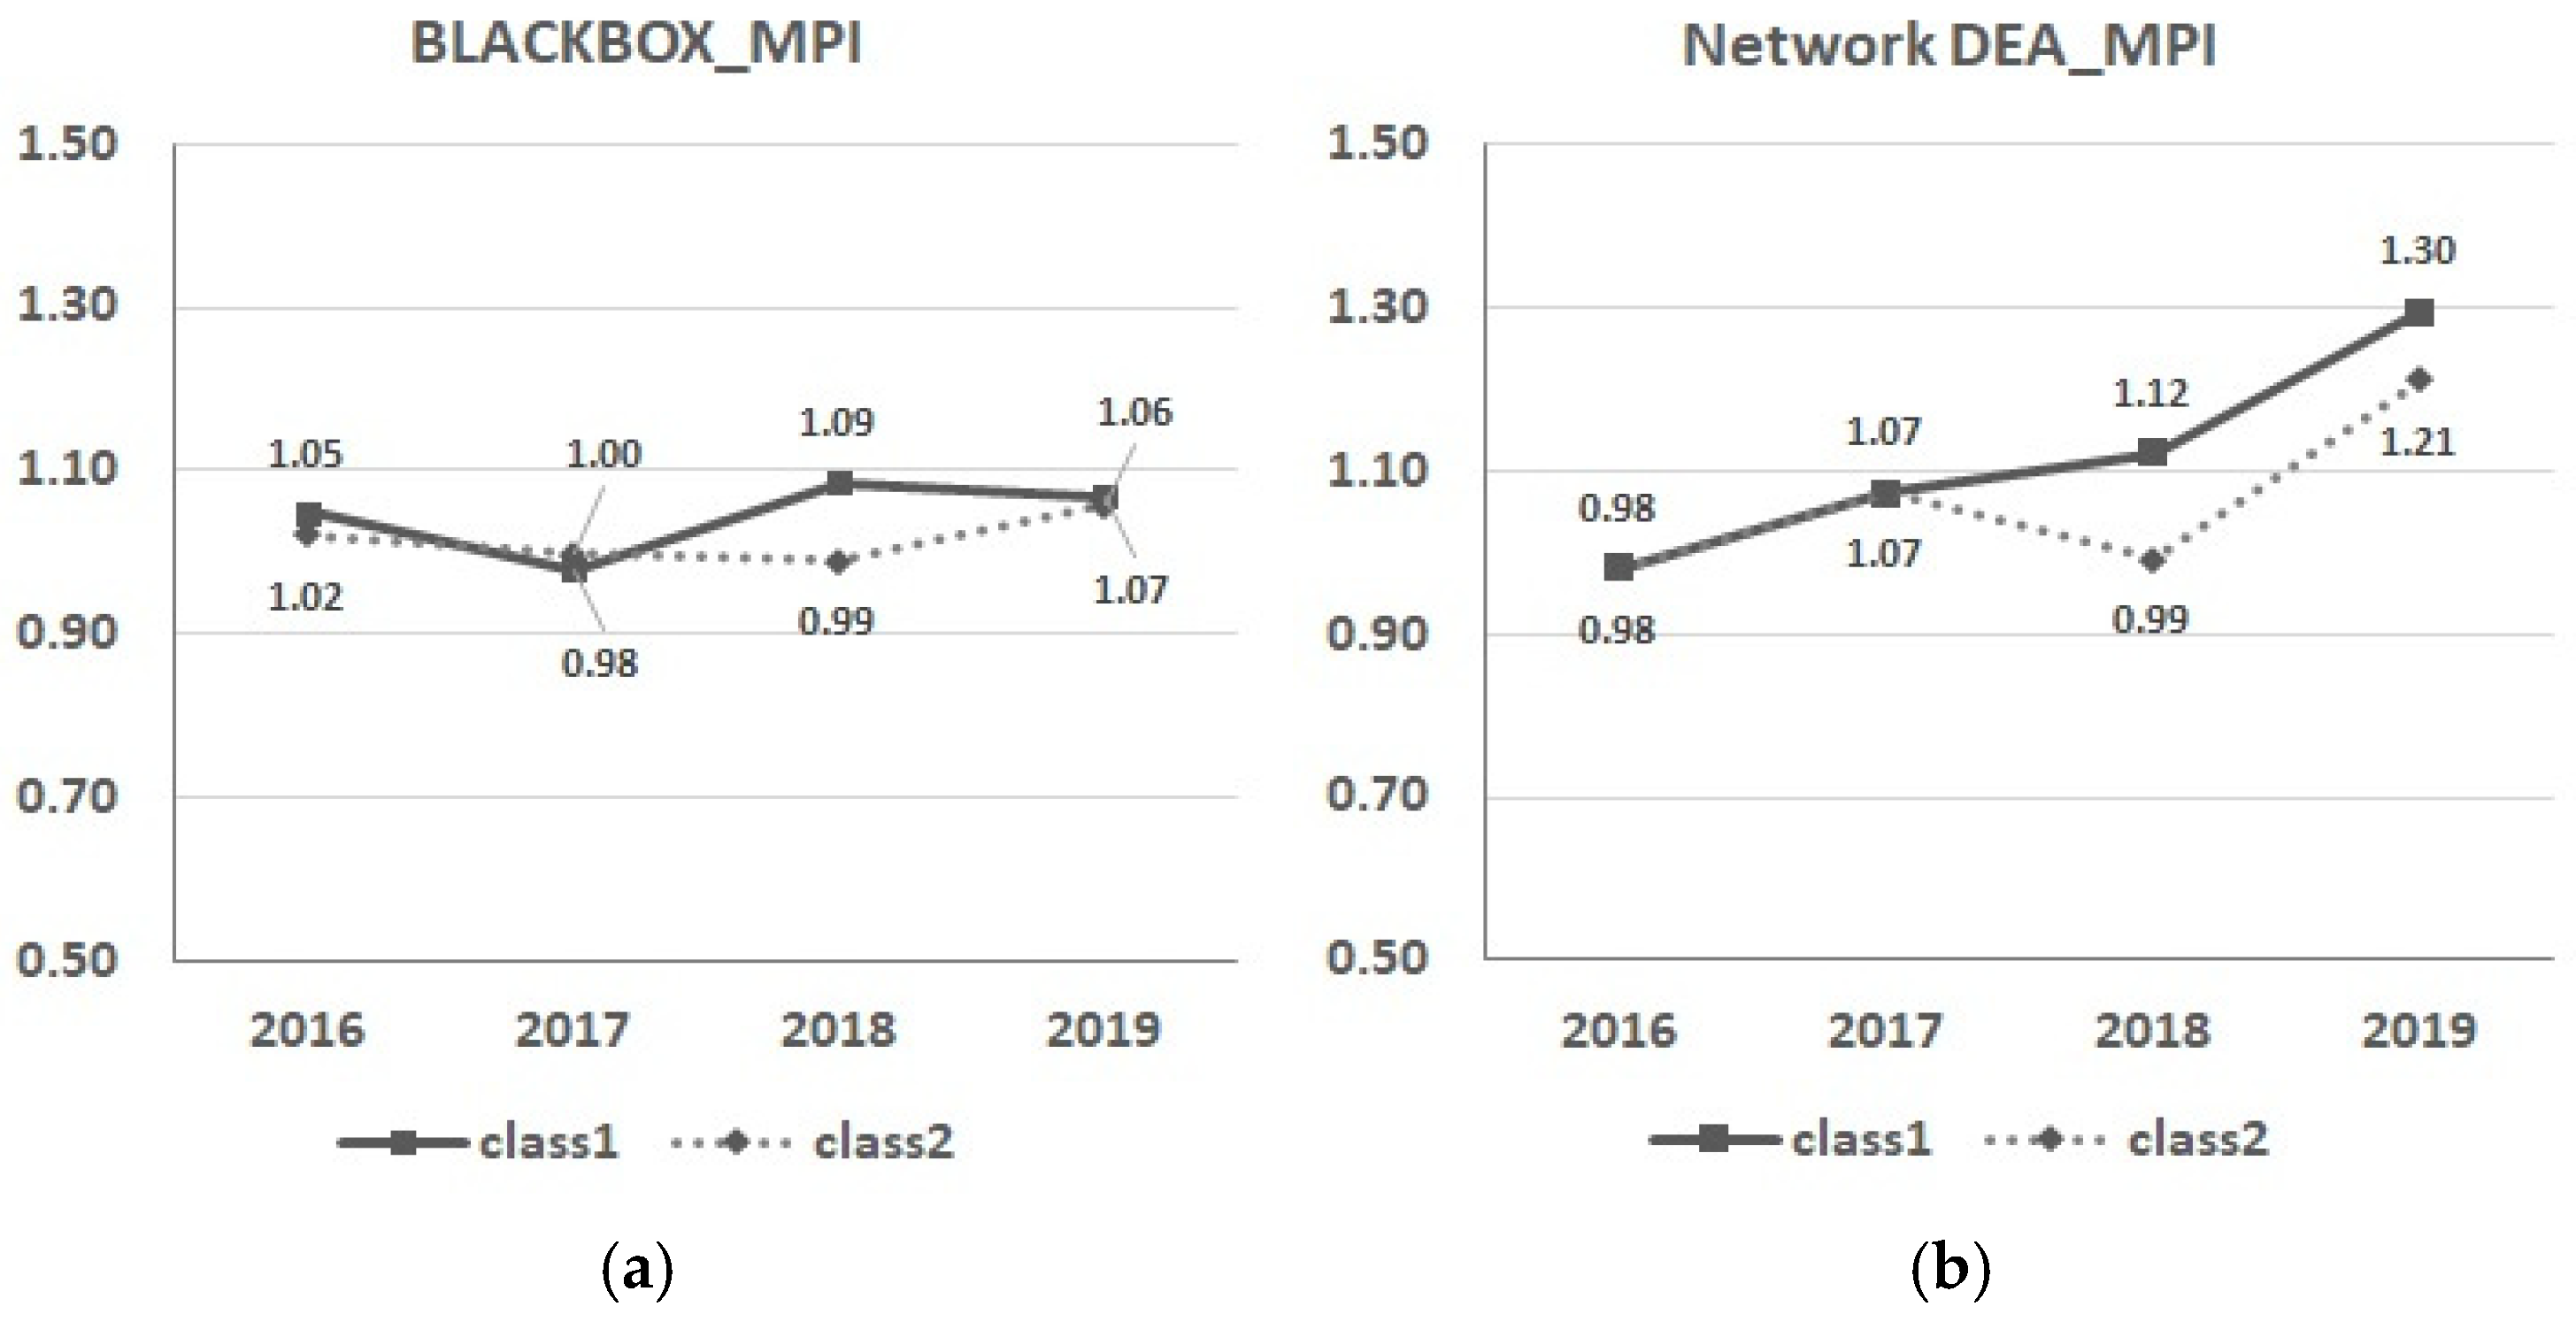
In addition to calculating the efficiency for each year, the global MPI was also calculated to measure how much efficiency had grown over the years. To compare the results, the MPI index was calculated under the VRS assumption. The MPI for each decomposed stage and the overall system was calculated using a two-stage network DEA, and the average of all DMUs was compared. First, the results in Figure 6 show that the growth in efficiency by service level under VRS DEA has no significant difference through all years except in 2018. Compared with 2015, the efficiency growth in 2016 was 1.05 for class 1 and 1.02 for class 2. In 2017, class 1 was 1.00 and class 2 was 0.98. In 2018, class 1 (1.09) was slightly higher than class 2 (0.99) in an average MPI. In 2019, class 1 was 1.07 and class 2 was 1.06. The growth in the overall system efficiency of the two-stage network DEA shows a different trend from that of the VRS DEA model. In 2016 and 2017, the scores of class 1 and class 2 were the same at 0.98 and 1.07. In 2018, class 1 was 1.12 and class 2 was 0.99, and in 2019, class 1 was 1.30 and class 2 was 1.21. The results of the two-stage network DEA showed that the average growth of hotels with relatively low service levels was higher than that of hotels with relatively high service levels in 2018 and 2019.
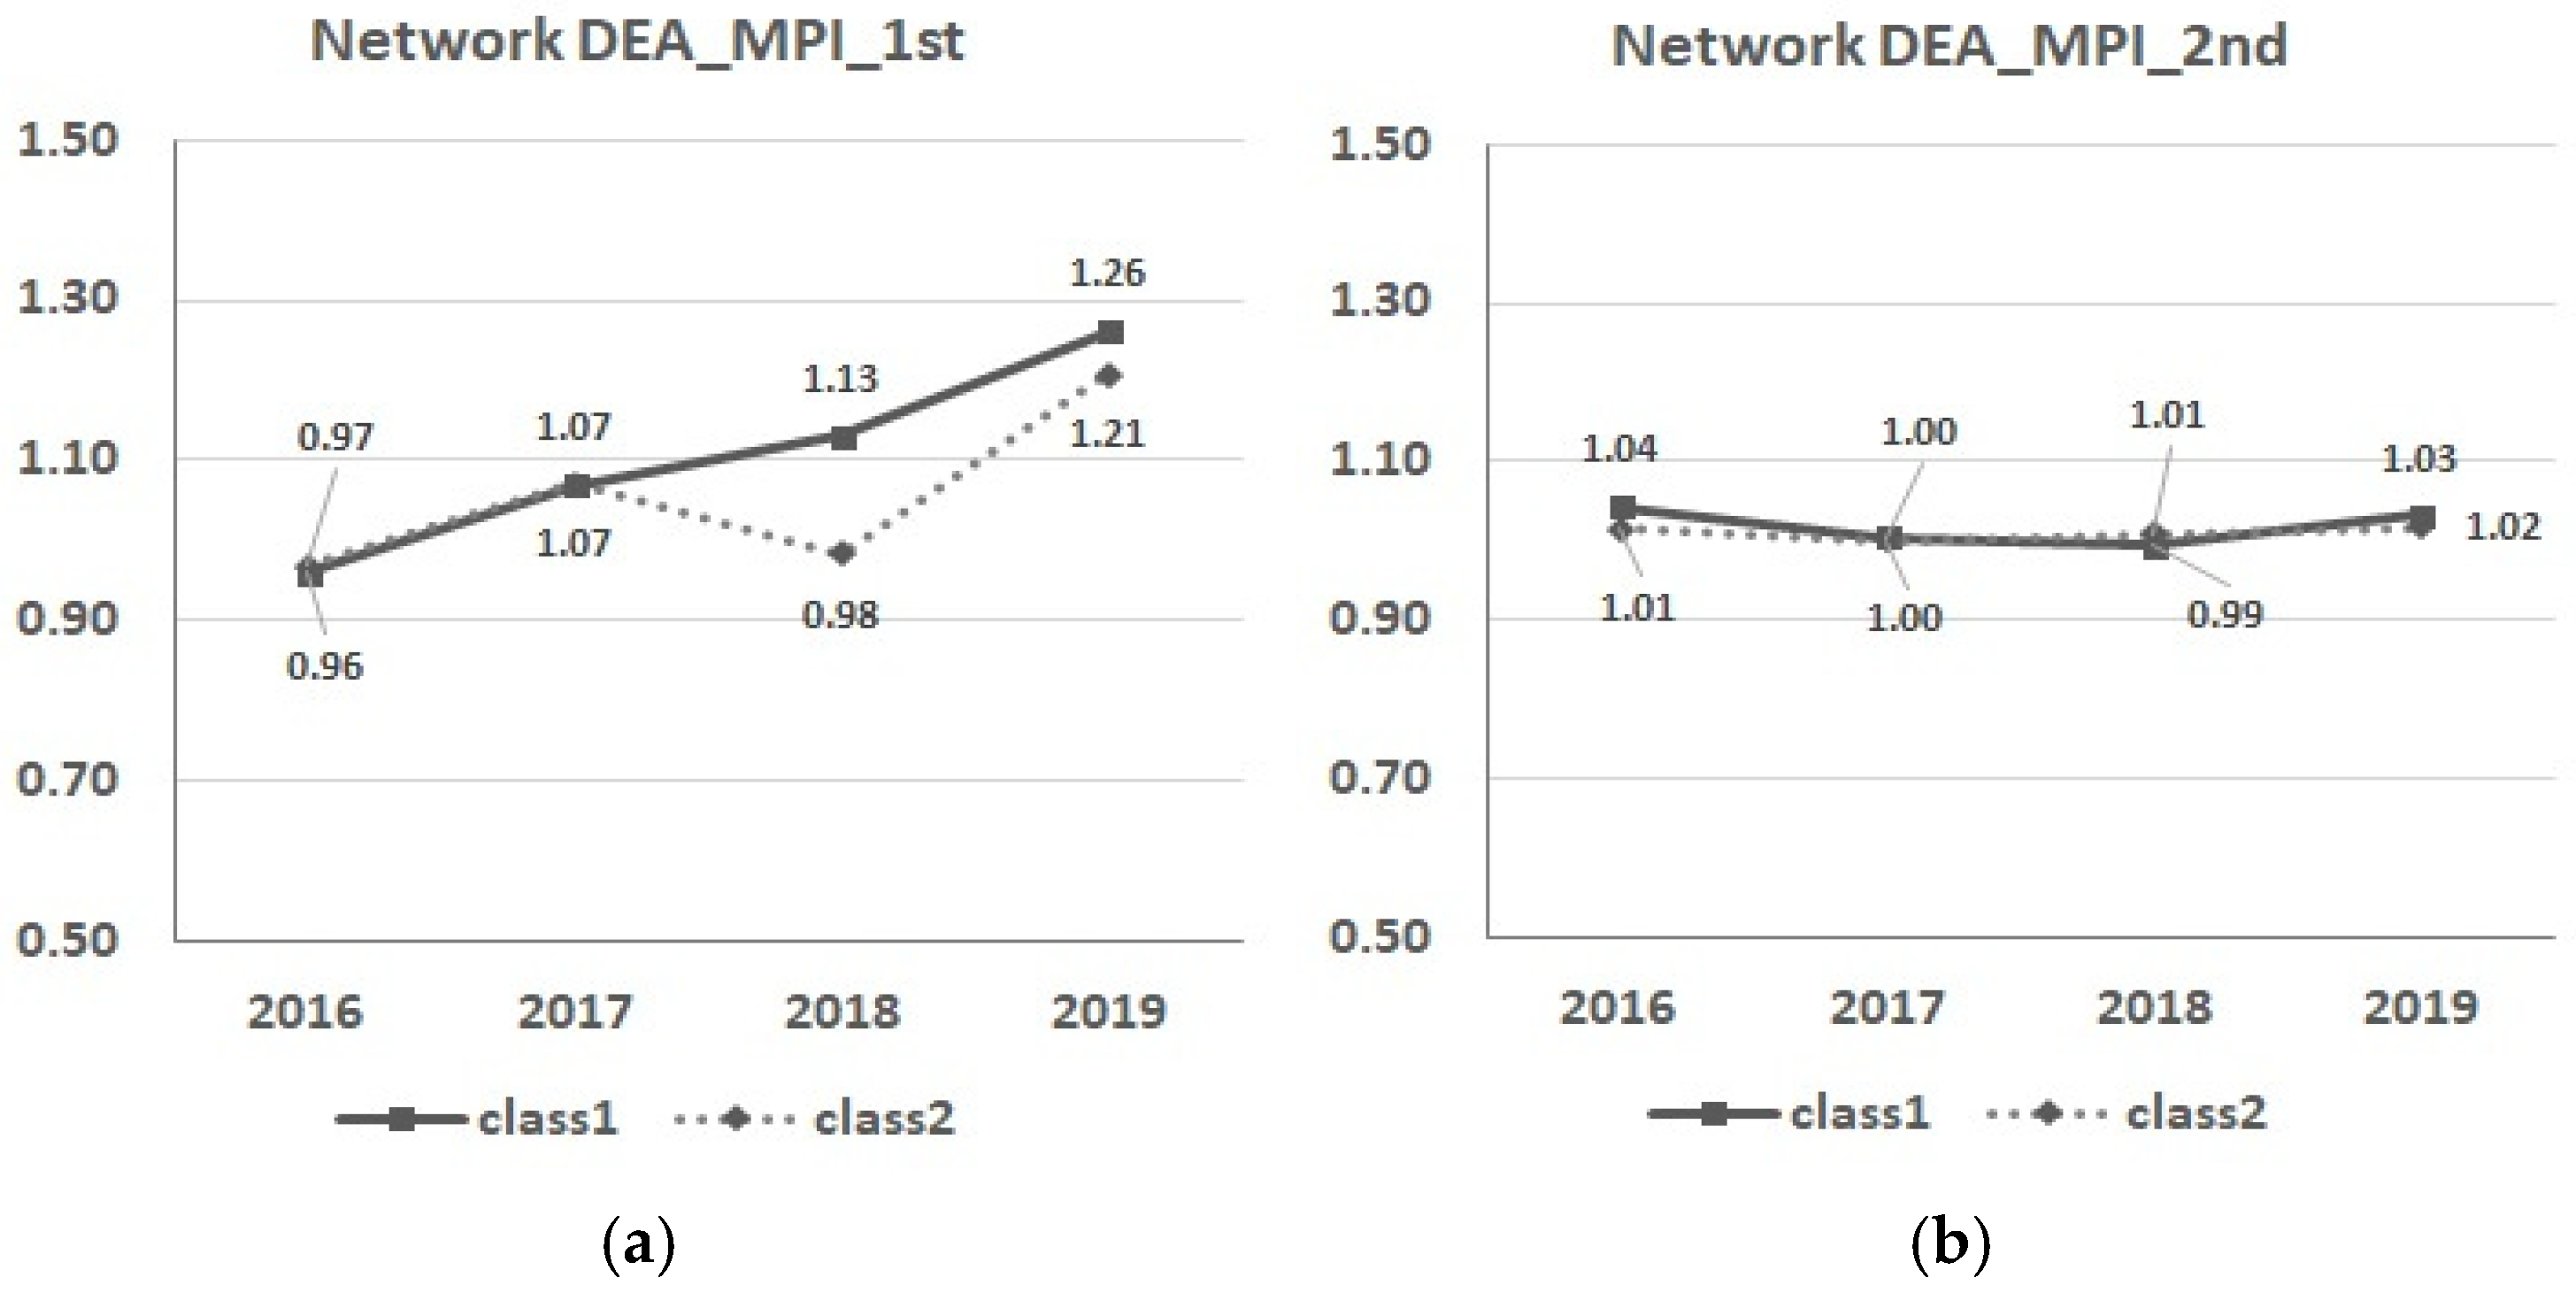
In other words, considering service quality as an intermediate, hotels with relatively low service levels had higher average efficiency growth. The cause of this trend was identified by comparing the average scores for each stage, as shown in Figure 7. Examining the results of the 1st stage, class 1 showed continuous growth in efficiency, whereas class 2 showed a decline in efficiency scores once in 2018. The scores in 2018 and 2019 were consistently higher in class 1 than in class 2. In the 2nd stage, the score difference between class 1 and class 2 was not significant. In 2016, class 1 recorded 1.04 and class 2 recorded 1.01. In 2017, class 1 and class 2 recorded the same score of 1.00. In 2018 and 2019, the average MPI score was almost the same between class 1 and class 2. The difference in the average MPI efficiency scores was more evident in the 1st stage. Considering that the overall system efficiency is expressed as the product of each stage, the difference in growth in the 1st stage appears to have had a greater impact on the overall system efficiency than in the 2nd stage. This implies that the 1st stage, which measures the consumer’s perceived service quality generated compared to the input factors, has more influence on the efficiency growth of each hotel’s service level.

5. Discussion

5.1. Main Results

This study measured service productivity using service quality as an intermediate, which is difficult to measure in the service industry. Among service industries, the hotel industry was selected for analysis based on its data accessibility, usability, and previous studies. For service quality in this study, review data, which is the voluntary feedback behavior of consumers, were used, and reviews written on TripAdvisor were analyzed by applying the probability–frequency weighted measurement used in previous studies. Data for the DEA analysis should include both review information, which is intermediate, and financial indicators, which are the input and output variables. Therefore, among corporations subject to external audits, hotels registered simultaneously with TripAdvisor and Korea’s electronic disclosure system became the subject of analysis; among these, 57 DMUs operating independent hotels were utilized. The two-stage network DEA framework of this study evaluates service quality scores compared to input factors (number of rooms, tangible assets, labor costs, and other expenses) in the first stage and evaluates sales compared to service quality perceived by consumers in the second stage. The average efficiency scores of the two-stage network DEA and VRS DEA were compared, because the main purpose of this study was to explain how well the two-stage evaluation methods can measure service productivity compared to the existing VRS DEA model. In addition, to analyze how evident the differences in productivity were, each model was compared based on the service level of the hotel. Service levels were classified according to star rating, and class 1 is defined as a 2- to 3-star hotel, and class 2 is defined as a 4- to 5-star hotel.
Examining the main analysis results, first, when comparing models for each year, there was no significant difference in efficiency scores by service level in the existing VRS DEA model; however, there was a difference in scores for each service level in the two-stage network DEA. Comparing the scores for each stage to determine the cause of the differences in scores, the average efficiency score of hotels with low service levels was higher than that of hotels with high service levels in stage 1. This means that hotels with low service levels have higher service quality evaluations compared to the inputs of tangible assets and labor costs. In the second stage, the results were reversed for hotels with high service levels and relatively higher average efficiency scores. This implies that hotels with high service levels have higher sales than those evaluated by consumers. After conducting the Wilcoxon’s rank sum test, the difference between the scores of the first and second stages of the two-stage network DEA was found to be significant. By measuring the MPI index to compare growth in productivity by year, a difference was found between the existing and the two-stage network models. In particular, the efficiency growth of hotels with low service levels was noticeable in 2018 and 2019. The cause of this difference is revealed in the first stage, that is, how much the evaluated service quality has grown compared to the input factors. In the second stage, there was no significant difference in the MPI efficiency scores between class 1 and class 2 hotels.
Considering these results, the measurement of service productivity using the two-stage network DEA model better explains the differences in productivity by service level. Class 1 hotels had relatively less manpower, tangible assets, and number of rooms, but were utilizing these to receive better service quality evaluations, while class 2 hotels had lower service quality evaluations compared to the input factors. Class 2 hotels showed higher efficiency scores in the second stage despite their lower service quality evaluations, which means that the unit price per room was higher compared to the service quality of class 2 hotels. In other words, class 2 hotels did not efficiently use the given manpower and resources to improve service quality, but sales were relatively higher due to high unit prices per room. Comparing the average room prices by star rating for hotels used in this study, the price of a 5-star hotel was 184,811 KRW, a 4-star was 129,005 KRW, a 3-star was 92,374 KRW, and a 2-star was 80,357 KRW. Since there is a difference in the average room price itself, if the same number of rooms are sold, the higher the star rating, the more sales a hotel can generate. Additionally, the higher the star rating, the more power it has in determining the price [90], and since more human resources and facilities are invested in creating the service, the price per room is bound to be higher. Additionally, hotels with higher star ratings must have additional facilities such as banquet halls and fitness centers. Therefore, it is expected that additional income from auxiliary facilities in addition to simple room income will be higher than that of low-star hotels. As a result, even though the service evaluation of a hotel with a higher star rating is relatively low, the overall sales of the company are likely to increase. Therefore, in the second step of comparing sales performance to service quality, there would have been a high possibility of recording high sales at a high price per unit even though service quality was lower. Despite this price advantage, hotels with higher stars received lower service quality evaluations compared to the human and tangible resources invested, so measures to improve service quality are needed.
The results of this study have practical implications in clarifying at what stage productivity improvement is needed. The empirical analysis results showed that the quality value perceived by customers differs depending on the level of service provided by the hotel. In addition, the two-stage network DEA revealed the stages at which productivity differs depending on the difference in service level. Through this, we propose the following to business owners: First, managers of high-star hotels should recognize that the average creation of service quality is low compared to the resources invested, and they should devise a resource distribution plan to increase service quality. For example, in order to increase the service quality perceived by customers from the total resources owned by the hotel, it may be better to invest more resources in employee training that can further increase the quality of customer contact points. These strategies can prevent hotels from using excessive resources unnecessarily and contribute to sustainable growth of the hotel industry. On the other hand, managers of low-star hotels still receive good service quality evaluations from customers, but they should recognize the loss of productivity caused by low per-room prices and adopt appropriate pricing strategies to efficiently achieve service quality and financial performance compared to the resources invested. To this end, it is necessary to adopt not only a simple price imitation strategy, but also a variety of pricing strategies, such as cross-selling pricing that bundles and sells tickets to use various facilities and package pricing that provides price discounts in connection with specific local festivals and events.

5.2. Contributions, Limitations, and Future Research Suggestions

This study makes the following academic and practical contributions: First, this study is significant because it empirically reveals the effect of service quality on productivity, which has been emphasized in previous studies. In particular, this study revealed that service quality is an important intermediate between resource input and financial performance in the service industry. As previous research has shown, it is difficult for service quality to act as an input or output factor on its own. There are some studies that conceptually state that service quality is important as an intermediate. By including service quality as an intermediate using a two-stage DEA model, this study revealed that service quality, which is addressed only conceptually in previous studies, acts as an important factor in efficiency. In other words, through the analysis of empirical data from hotels, this study revealed that using the two-stage network DEA method is more effective in examining the relationship between service quality and corporate productivity. Owing to cost and time limitations, service quality has mainly been assessed through survey research. However, survey research is likely to have a large gap between consumers’ service experience and measurement and is also likely to measure factors that are not actually perceived. To overcome these limitations, this study measures service quality based on consumer feedback, expresses it as a quantified value, and reveals the impact of service quality on productivity using data from the hotel industry. Second, this study confirms the usefulness of the two-stage network DEA analysis established in previous studies. To date, the traditional DEA methodology has been called a black box model in that it can reveal the results of output relative to input but does not know which factors actually increase or decrease productivity. In this study, a two-stage network analysis was used to overcome these limitations, and an academic contribution was made by using service quality as an intermediate to reveal how it affects productivity. Third, this study derives practical implications by explaining the differences in productivity by hotel service level. Hotels with relatively high service levels of four to five stars were inefficient in creating service quality compared with the given resources, and sales were high because of the high unit price per room. These results show that high-star hotels do not create service quality more effectively than low-star hotels do, even though they invest relatively more resources. Consumer service quality expectations are bound to be high in hotels with high service levels. According to the results of this study, hotels with relatively high service levels did not effectively meet these expectations. In the future, it will be important for these high-service hotels to effectively deliver service products or manage service quality that meets consumer expectations.
Despite these contributions, this study had several limitations. First, this study used only some variables because of data limitations regarding intermediate, input, and output variables; therefore, it is possible that the related variables were not sufficiently reflected. Future research can be more sophisticated if the available data are examined more extensively and additional input and output variables are considered. For example, in the case of restaurants, food cost, which was not covered in this study, can be added as an input factor. Furthermore, characteristic indicators such as seat turnover rate can be added as output factors. In addition, the productivity measurement model in this study has the potential to be applied extensively in industries where service quality plays a very important role. For example, it is difficult to apply this model to the financial industry and online retail industry, which have relatively few customer contact points, but the model of this study can be applied to industries such as the tourism industry, the restaurant industry, and education services, where service quality is still an important factor. Second, because this study only empirically analyzed hotels in Korea, global generalization may be difficult. Therefore, in future studies, if more countries or industries are targeted, a service productivity evaluation model based on consumer feedback can be more generalizable. In particular, if groups operating in the homogeneous service industry within the country (e.g., restaurants or travel agencies) are selected as research subjects, extensive research will be possible more easily. Third, this study used only data up to 2019 to exclude the effects of the COVID-19 pandemic. However, at this point, there is a possibility that they did not reflect the latest phenomena because they were outdated. Therefore, in future studies, analyzing more up-to-date data will better reflect the empirical phenomena. Alternatively, if sufficient data are collected after 2023, when the pandemic is almost over, it would be interesting to measure changes in productivity by comparing pre-pandemic and post-pandemic data.
Finally, this study has potential limitations related to the data collection method. Since this study collected data from an unspecified number of hotel users, it was not possible to distinguish whether they only used certain star rating hotels. As a result, it was not possible to sufficiently reflect differences in consumer expectations, which are expected to differ depending on the level of service provided. In future research, it will be necessary to separate and analyze consumers by the star ratings. In addition, although TripAdvisor, a representative review collection channel, was used, there is a potential bias in the sample because only a single collection channel was used. In particular, this bias may occur because it fails to include the IT-vulnerable groups with relatively low IT accessibility. Therefore, future studies should combine it with an offline survey or further diversify the collection channel.

Author Contributions

All authors contributed equally to this research. All authors have read and agreed to the published version of the manuscript.

Funding

This research was funded by the KYUNG HEE UNIVERSITY (grant number KHU-20201226).

Institutional Review Board Statement

Not applicable.

Informed Consent Statement

Not applicable.

Data Availability Statement

The data supporting the results of this study are available on request from the corresponding author (the data are not publicly available due to privacy or ethical restrictions).

Conflicts of Interest

The authors declare no conflicts of interest.

References

  1. Schwab, K. The Fourth Industrial Revolution, 1st ed.; Crown Business: New York, NY, USA, 2017; pp. 6–13. [Google Scholar]
  2. Schwartz, B. The paradox of choice. In Positive Psychology in Practive: Promoting Human Flourishing in Work, Health, Education, and Every Life; Joseph, S., Ed.; John Wiley & Sons, Inc.: Hoboken, NJ, USA, 2015; pp. 121–138. [Google Scholar]
  3. Desmet, K.; Greif, A.; Parente, S.L. Spatial competition, innovation and institutions: The Industrial Revolution and the Great Divergence. J. Econ. Growth 2020, 25, 1–35. [Google Scholar] [CrossRef]
  4. Banker, R.D.; Charnes, A.; Cooper, W.W. Some models for estimating technical and scale inefficiencies in data envelopment analysis. Manag. Sci. 1984, 30, 1078–1092. [Google Scholar] [CrossRef]
  5. Charnes, A.; Cooper, W.W.; Rhodes, E. Measuring the efficiency of decision making units. Eur. J. Oper. Res. 1978, 2, 429–444. [Google Scholar] [CrossRef]
  6. Farrell, M.J. The measurement of productive efficiency. J. R. Stat. Soc. Ser. A Gen. 1957, 120, 253–281. [Google Scholar] [CrossRef]
  7. Shepard, R.W. Theory of Cost and Production Functions; Princeton University Press: Princeton, NJ, USA, 1970; pp. 13–17. [Google Scholar]
  8. Kotler, P.; Keller, K.L. A Framework for Marketing Image Management, 6th ed.; Pearson Education Limited: Essex, UK, 2016; pp. 184–185. [Google Scholar]
  9. Parasuraman, A. Service quality and productivity: A synergistic perspective. Manag. Serv. Qual. Int. J. 2002, 12, 6–9. [Google Scholar] [CrossRef]
  10. Al-Shammari, M. A multi-criteria data envelopment analysis model for measuring the productive efficiency of hospitals. Int. J. Oper. Prod. Manag. 1999, 19, 879–891. [Google Scholar] [CrossRef]
  11. Goodwin, C. “I can do it myself.” training the service consumer to contribute to service productivity. J. Serv. Mark. 1988, 2, 71–78. [Google Scholar] [CrossRef]
  12. McLaughlin, C.P.; Coffey, C. Measuring productivity in services. Int. J. Serv. Ind. Manag. 1990, 1, 46–64. [Google Scholar] [CrossRef]
  13. Dean, E.R.; Kunze, K. Bureau of labor statistics productivity measures for service industries. In The Service Productivity and Quality Challenge; Harket, P.T., Ed.; Springer: Dordrecht, The Netherlands, 1995; Volume 5, pp. 11–42. [Google Scholar]
  14. Kao, C.; Hwang, S.-N. Efficiency decomposition in two-stage data envelopment analysis: An application to non-life insurance companies in Taiwan. Eur. J. Oper. Res. 2008, 185, 418–429. [Google Scholar] [CrossRef]
  15. Fathi, A.; Karimi, B.; Saen, R.F. Sustainability assessment of supply chains by a novel robust two-stage network DEA model: A case study in the transport industry. Soft Comput. 2022, 26, 6101–6118. [Google Scholar] [CrossRef]
  16. Wang, Y.; Pan, J.F.; Pei, R.M.; Yi, B.W.; Yang, G.L. Assessing the technological innovation efficiency of China’s high-tech industries with a two-stage network DEA approach. Socio Econ. Plan. Sci. 2020, 71, 100810. [Google Scholar] [CrossRef]
  17. Yang, G.L.; Fukuyama, H.; Song, Y.Y. Measuring the inefficiency of Chinese research universities based on a two-stage network DEA model. J. Informetr. 2018, 12, 10–30. [Google Scholar] [CrossRef]
  18. Zhu, J. Airlines performance via two-stage network DEA approach. J. Cent. Cathedra Bus. Econ. Res. J. 2011, 4, 260–269. [Google Scholar] [CrossRef]
  19. Kao, C. Network Data Envelopment Analysis: Foundations and Extensions; Springer International Publishing: Cham, Switzerland, 2017; p. 214. [Google Scholar]
  20. El Kadiri Boutchich, D. Tourism performance evaluation and analysis from composite index and slack based method. Opsearch 2024, 61, 501–523. [Google Scholar] [CrossRef]
  21. Shi, X.; Wang, L.; Emrouznejad, A. Performance evaluation of Chinese commercial banks by an improved slacks-based DEA model. Socio Econ. Plan. Sci. 2023, 90, 101702. [Google Scholar] [CrossRef]
  22. Tayebi, A.; Lila, A.; Cheikh, S.; Lutfi, B. Technical efficiency measurement in insurance companies by using the slack-based measure (SBM-DEA) with undesirable outputs: Analysis case study. Compet. Rev. An. Int. Bus. J. 2023, 34, 229–243. [Google Scholar] [CrossRef]
  23. Bala, M.M.; Singh, S.; Gautam, D.K. Stochastic frontier approach to efficiency analysis of health facilities in providing services for non-communicable diseases in eight LMICs. Int. Health 2023, 15, 512–525. [Google Scholar] [CrossRef]
  24. Bourjade, S.; Muller-vibes, C. Optimal leasing and airline’s cost efficiencies: A stochastic frontier analysis. Transp. Res. Part A 2023, 176, 103804. [Google Scholar]
  25. Shen, B.; Perfilev, A.A.; Bufetova, L.P.; Li, X. Bank profitability analysis in China: Stochastic frontier approach. J. Risk Financ. Manag. 2023, 16, 243. [Google Scholar] [CrossRef]
  26. Blei, D.M.; Ng, A.Y.; Jordan, M.I. Latent dirichlet allocation. J. Mach. Learn. Res. 2003, 3, 993–1022. [Google Scholar]
  27. Dobrovič, J.; Čabinová, V.; Gallo, P.; Partlová, P.; Váchal, J.; Balogová, B.; Orgonáš, J. Application of the DEA model in tourism SMEs: An empirical study from Slovakia in the context of business sustainability. Sustainability 2021, 13, 7422. [Google Scholar] [CrossRef]
  28. Higuerey, A.; Viñan-Merecí, C.; Malo-Montoya, Z.; Martínez-Fernández, V.A. Data envelopment analysis (DEA) for measuring the efficiency of the hotel industry in Ecuador. Sustainability 2020, 12, 1590. [Google Scholar] [CrossRef]
  29. Karakitsiou, A.; Kourgiantakis, M.; Mavrommati, A.; Migdalas, A. Regional efficiency evaluation by input-oriented data envelopment analysis of hotel and restaurant sector. Oper. Res. 2020, 20, 2041–2058. [Google Scholar] [CrossRef]
  30. Tan, Y.; Despotis, D. Investigation of efficiency in the UK hotel industry: A network data envelopment analysis approach. Int. J. Contemp. Hosp. Manag. 2021, 33, 1080–1104. [Google Scholar] [CrossRef]
  31. Gummesson, E. Quality, service-dominant logic and many-to-many marketing. TQM J. 2008, 20, 143–153. [Google Scholar] [CrossRef]
  32. Parasuraman, A.; Zeithaml, V.A.; Berry, L.L. A conceptual model of service quality and its implications for future research. J. Mark. 1985, 49, 41–50. [Google Scholar] [CrossRef]
  33. Zeithaml, V.A. Consumer perceptions of price, quality, and value: A means-end model and synthesis of evidence. J. Mark. 1988, 52, 2–22. [Google Scholar] [CrossRef]
  34. Parasuraman, A. Customer-oriented corporate cultures are crucial to services marketing success. J. Serv. Mark. 1987, 1, 39–46. [Google Scholar] [CrossRef]
  35. Grönroos, C. An applied service marketing theory. Eur. J. Mark. 1982, 16, 30–41. [Google Scholar] [CrossRef]
  36. Parasuraman, A.; Zeithaml, V.A.; Berry, L.L. Reassessment of expectations as a comparison standard in measuring service quality: Implications for further research. J. Mark. 1994, 58, 111–124. [Google Scholar] [CrossRef]
  37. Cronin, J.J., Jr.; Taylor, S.A. Measuring service quality: A reexamination and extension. J. Mark. 1992, 56, 55–68. [Google Scholar] [CrossRef]
  38. Rust, R.T.; Oliver, R.L. Service Quality: New Directions in Theory and Practice; Sage Publications, Inc.: Thousand Oaks, CA, USA, 1994; pp. 6–8. [Google Scholar]
  39. Dabholkar, P.A.; Thorpe, D.I.; Rentz, J.O. A measure of service quality for retail stores: Scale development and validation. J. Acad. Mark. Sci. 1996, 24, 3–16. [Google Scholar] [CrossRef]
  40. Brady, M.K.; Cronin, J.J., Jr. Some new thoughts on conceptualizing perceived service quality: A hierarchical approach. J. Mark. 2001, 65, 34–49. [Google Scholar] [CrossRef]
  41. Parasuraman, A.; Zeithaml, V.A.; Berry, L.L. SERVQUAL: A multiple-item scale for measuring consumer perceptions of service quality. J. Retail. 1988, 64, 12–40. [Google Scholar]
  42. Ladhari, R. A review of twenty years of SERVQUAL research. Int. J. Qual. Serv. Sci. 2009, 1, 172–198. [Google Scholar] [CrossRef]
  43. Pun, L.B. Customer satisfaction, revisit intention and word-of-mouth in the restaurant business. Butwal Campus J. 2022, 5, 26–42. [Google Scholar] [CrossRef]
  44. Raza, M.A.; Siddiquei, A.N.; Awan, H.M.; Bukhari, K. Relationship between service quality, perceived value, satisfaction and revisit intention in hotel industry. Interdiscip. J. Contemp. Res. Bus. 2012, 4, 788–805. [Google Scholar]
  45. Ojasalo, J. Managing customer expectations in professional services. Manag. Serv. Qual. An. Int. J. 2001, 11, 200–212. [Google Scholar] [CrossRef]
  46. Grönroos, C.; Ojasalo, K. Service productivity: Towards a conceptualization of the transformation of inputs into economic results in services. J. Bus. Res. 2004, 57, 414–423. [Google Scholar] [CrossRef]
  47. Maroto-Sánchez, A. Productivity in the services sector: Conventional and current explanations. Serv. Ind. J. 2012, 32, 719–746. [Google Scholar] [CrossRef]
  48. Calabrese, A. Service productivity and service quality: A necessary trade-off? Int. J. Prod. Econ. 2012, 135, 800–812. [Google Scholar] [CrossRef]
  49. Balci, B.; Hollmann, A.; Rosenkranz, C. Service productivity: A literature review and research agenda. In Proceedings of the XXI International RESER (European Association for REsearch on SERvices) Conference, Hamburg, Germany, 8–10 September 2011. [Google Scholar]
  50. Van Doorn, J.; Lemon, K.N.; Mittal, V.; Nass, S.; Pick, D.; Pirner, P.; Vernhoef, P.C. Customer engagement behavior: Theoretical foundations and research directions. J. Serv. Res. 2010, 13, 253–266. [Google Scholar] [CrossRef]
  51. Setiawan, J. Using text mining to analyze mobile phone provider service quality (Case study: Social media Twitter). Int. J. Mach. Learn. Comput. 2014, 4, 106–109. [Google Scholar]
  52. Miranda, M.D.; Sassi, R.J. Using sentiment analysis to assess customer satisfaction in an online job search company. In Business Information Systems Workshops; Abramowicz, W., Kokkinaki, A., Eds.; Springer International Publishing: Cham, Switzerland, 2014; pp. 17–27. [Google Scholar]
  53. Kim, B.; Kim, S.; Heo, C.Y. Analysis of satisfiers and dissatisfiers in online hotel reviews on social media. Int. J. Contemp. Hosp. Manag. 2016, 28, 1915–1936. [Google Scholar] [CrossRef]
  54. Song, B.; Lee, C.; Yoon, B.; Park, Y. Diagnosing service quality using customer reviews: An index approach based on sentiment and gap analyses. Serv. Bus. 2016, 10, 775–798. [Google Scholar] [CrossRef]
  55. Palese, B.; Piccoli, G. Online reviews as a measure of service quality. In Proceedings of the 2016 Pre-ICIS SIGDSA/IFIP WG8.3 Symposium: Innovations in Data Analytics, Dublin, Ireland, 11 December 2016. [Google Scholar]
  56. Bang, D.; Choi, K.; Kim, A.J. Does Michelin effect exist? An empirical study on the effects of Michelin stars. Int. J. Contemp. Hosp. Manag. 2022, 34, 2298–2319. [Google Scholar] [CrossRef]
  57. Lovell, C.K. Measuring the macroeconomic performance of the Taiwanese economy. Int. J. Prod. Econ. 1995, 39, 165–178. [Google Scholar] [CrossRef]
  58. Portela, M.S.; Thanassoulis, E.; Simpson, G. Negative data in DEA: A directional distance approach applied to bank branches. J. Oper. Res. Soc. 2004, 55, 1111–1121. [Google Scholar] [CrossRef]
  59. López, F.J.; Ho, J.C.; Ruiz-Torres, A.J. A computational analysis of the impact of correlation and data translation on DEA efficiency scores. J. Ind. Prod. Eng. 2016, 33, 192–204. [Google Scholar] [CrossRef]
  60. Emrouznejad, A.; Anouze, A.L.; Thanassoulis, E. A semi-oriented radial measure for measuring the efficiency of decision making units with negative data, using DEA. Eur. J. Oper. Res. 2010, 200, 297–304. [Google Scholar] [CrossRef]
  61. Zhu, J.; Cook, W.D. Modeling Data Irregularities and Structural Complexities in Data Envelopment Analysis; Springer Science + Business Media, LLC: New York, NY, USA, 2007; pp. 66–70. [Google Scholar]
  62. Kao, C.; Hwang, S.-N. Decomposition of technical and scale efficiencies in two-stage production systems. Eur. J. Oper. Res. 2011, 211, 515–519. [Google Scholar] [CrossRef]
  63. Kao, C.; Hwang, S.-N. Multi-period efficiency and Malmquist productivity index in two-stage production systems. Eur. J. Oper. Res. 2014, 232, 512–521. [Google Scholar] [CrossRef]
  64. Färe, R.; Grosskopf, S.; Norris, M. Productivity growth, technical progress, and efficiency change in industrialized countries. Am. Econ. Rev. 1994, 84, 66–83. [Google Scholar]
  65. Pastor, J.T.; Lovell, C.K. Circularity of the Malmquist productivity index. Econ. Theory 2007, 33, 591–599. [Google Scholar] [CrossRef]
  66. Haryanto, T. Editorial: COVID-19 pandemic international tourism demand. J. Dev. Econ. 2020, 5, 1–5. [Google Scholar] [CrossRef]
  67. Kalnaovakul, K.; Promsivapallop, P. Hotel service quality dimensions and attributes: An analysis of online hotel customer reviews. Tour. Hosp. Res. 2023, 23, 420–440. [Google Scholar] [CrossRef]
  68. Chang, Y.-C.; Ku, C.-H.; Chen, C.-H. Social media analytics: Extracting and visualizing Hilton hotel ratings and reviews from TripAdvisor. Int. J. Inf. Manag. 2019, 48, 263–279. [Google Scholar] [CrossRef]
  69. Calheiros, A.C.; Moro, S.; Rita, P. Sentiment classification of consumer-generated online reviews using topic modeling. J. Hosp. Mark. Manag. 2017, 26, 675–693. [Google Scholar] [CrossRef]
  70. Mehraliyev, F.; Chan, I.C.C.; Kirilenko, A.P. Sentiment analysis in hospitality and tourism: A thematic and methodological review. Int. J. Contemp. Hosp. Manag. 2022, 34, 46–77. [Google Scholar] [CrossRef]
  71. Taecharungroj, V.; Mathayomchan, B. Analysing TripAdvisor reviews of tourist attractions in Phuket, Thailand. Tour. Manag. 2019, 75, 550–568. [Google Scholar] [CrossRef]
  72. Anderson, R.I.; Fok, R.; Scott, J. Hotel industry efficiency: An advanced linear programming examination. Am. Bus. Rev. 2000, 18, 40–48. [Google Scholar]
  73. Barros, C.P. Measuring efficiency in the hotel sector. Ann. Tour. Res. 2005, 32, 456–477. [Google Scholar]
  74. Hwang, S.-N.; Chang, T.-Y. Using data envelopment analysis to measure hotel managerial efficiency change in Taiwan. Tour. Manag. 2003, 24, 357–369. [Google Scholar]
  75. Johns, N.; Howcroft, B.; Drake, L. The use of data envelopment analysis to monitor hotel productivity. Progress. Tour. Hosp. Res. 1997, 3, 119–127. [Google Scholar]
  76. Pulina, M.; Santoni, V. A two-stage DEA approach to analyse the efficiency of the hospitality sector. Tour. Econ. 2018, 24, 352–365. [Google Scholar]
  77. Sigala, M. Using data envelopment analysis for measuring and benchmarking productivity in the hotel sector. J. Travel Tour. Mark. 2004, 16, 39–60. [Google Scholar] [CrossRef]
  78. Tarim, Ş.; Dener, H.I.; Tarim, Ş.A. Efficiency measurement in the hotel industry: Output factor constrained DEA application. Anatolia 2000, 11, 111–123. [Google Scholar] [CrossRef]
  79. Sengupta, J.K. A dynamic efficiency model using data envelopment analysis. Int. J. Prod. Econ. 1999, 62, 209–218. [Google Scholar] [CrossRef]
  80. Smriti, T.N.; Khan, H.R. Efficiency analysis of manufacturing firms using data envelopment analysis technique. J. Data Sci. 2018, 18, 69–78. [Google Scholar] [CrossRef]
  81. Souza, A.A.; Moreira, D.R.; Avelar, E.A.; de Faria Marques, A.M.; Lara, A.L. Data envelopment analysis of efficiency in hospital organisations. Int. J. Bus. Innov. Res. 2014, 8, 316–332. [Google Scholar] [CrossRef]
  82. Abd Aziz, N.A.; Janor, R.M.; Mahadi, R. Comparative departmental efficiency analysis within a university: A DEA approach. Procedia Soc. Behav. Sci. 2013, 90, 540–548. [Google Scholar] [CrossRef]
  83. Liu, X.; Wu, X.; Zhang, W. A new DEA model and its application in performance evaluation of scientific research activities in the universities of China’s double first-class initiative. Socio Econ. Plan. Sci. 2024, 92, 101839. [Google Scholar] [CrossRef]
  84. Merkert, R.; Hensher, D.A. The impact of strategic management and fleet planning on airline efficiency—A random effects Tobit model based on DEA efficiency scores. Transp. Res. Part A Policy Pract. 2011, 45, 686–695. [Google Scholar] [CrossRef]
  85. Standfuss, T.; Hirte, G.; Schultz, M. How to Benchmark Air Navigation Service Providers? In Proceedings of the International Transportation Economics Association (ITEA) Conference, Toulouse, France, 15–17 June 2022. [Google Scholar]
  86. Mann, H.B.; Whitney, D.R. On a test of whether one of two random variables is stochastically larger than the other. Ann. Math. Stat. 1947, 18, 50–60. [Google Scholar] [CrossRef]
  87. Wilcoxon, F. Individual comparisons by ranking methods. Biom. Bull. 1945, 1, 80–83. [Google Scholar] [CrossRef]
  88. Atris, A.M. Assessment of oil refinery performance: Application of data envelopment analysis-discriminant analysis. Resour. Policy 2020, 65, 101543. [Google Scholar] [CrossRef]
  89. Mohamed Shahwan, T.; Mohammed Hassan, Y. Efficiency analysis of UAE banks using data envelopment analysis. J. Econ. Adm. Sci. 2013, 29, 4–20. [Google Scholar] [CrossRef]
  90. Agušaj, B.; Bazdan, V.; Lujak, Đ. The relationship between online rating, hotel star category and room pricing power. Ekon. Misao Praksa 2017, 26, 189–204. [Google Scholar]
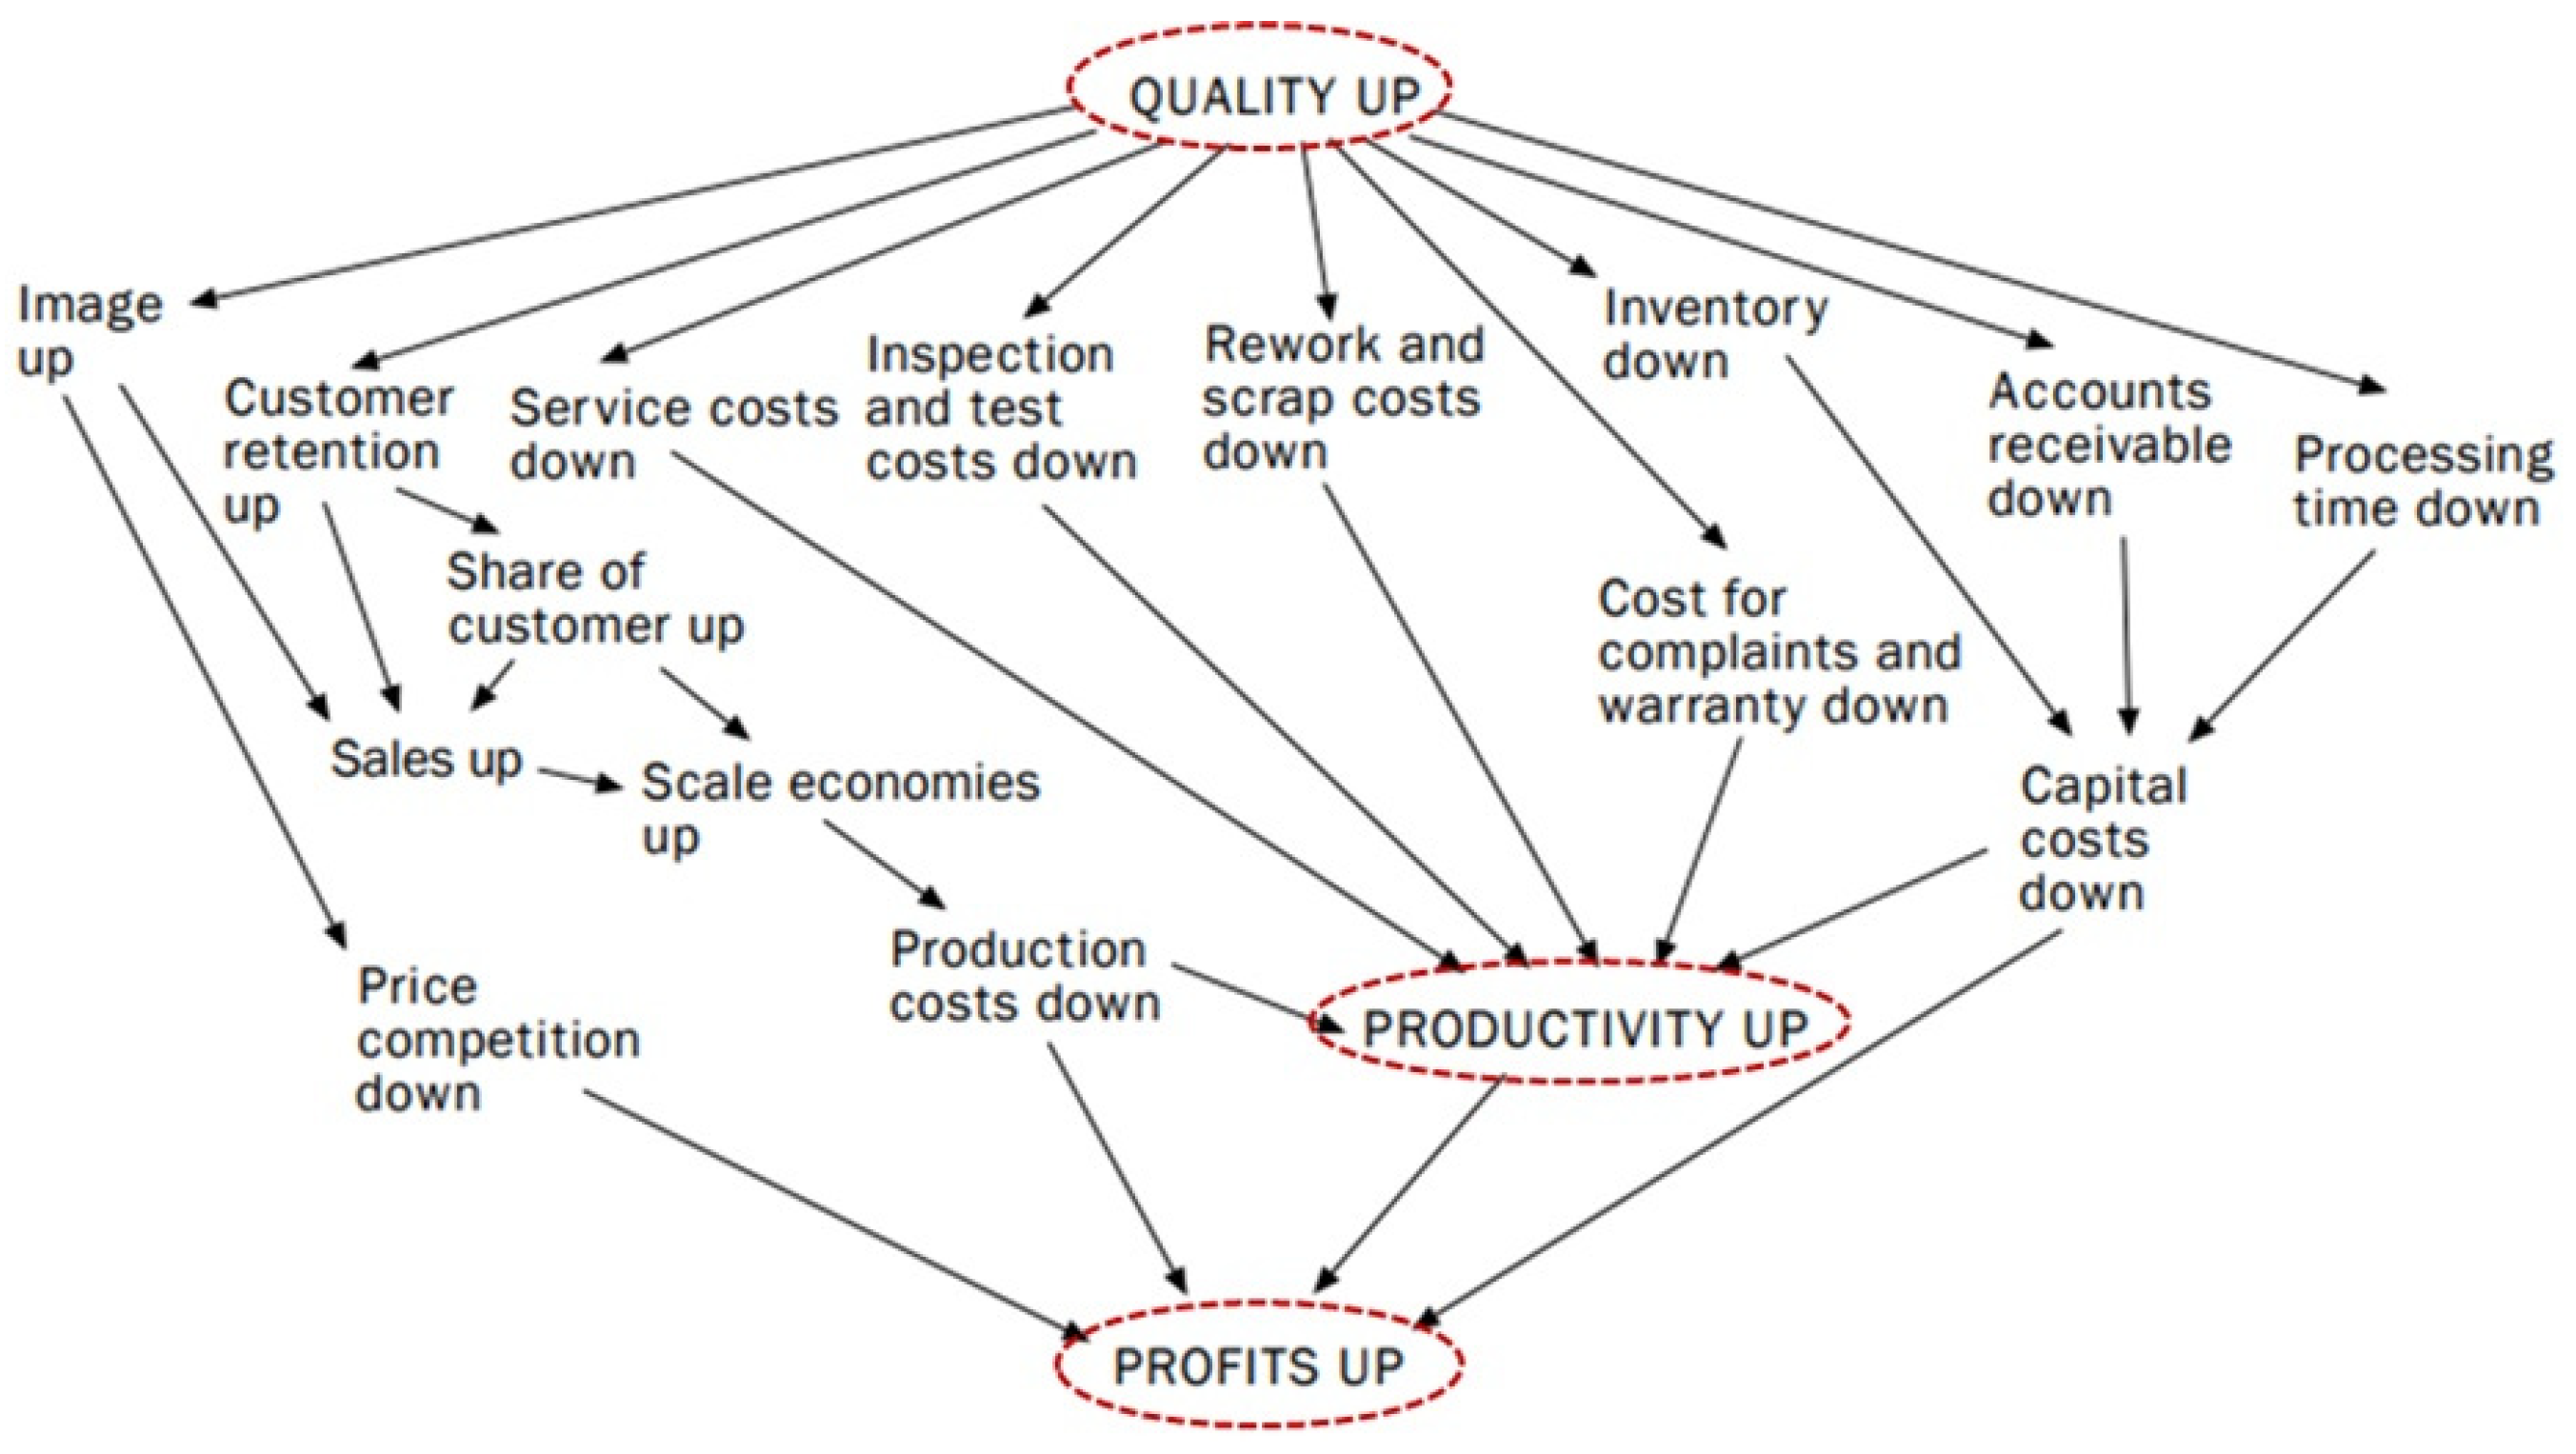
Figure 1. Relationship between quality, productivity, and profits [31].
Sustainability 16 08995 g001
Figure 2. Conceptual framework of comprehensive service productivity with service quality [9].
Sustainability 16 08995 g002
Figure 3. Framework for customer-involved service productivity.
Sustainability 16 08995 g003
Figure 4. Average productivity score by class of hotels: (a) results of VRS (black box model); (b) results of two-stage network DEA’s total system score.
Sustainability 16 08995 g004
Figure 5. Average productivity score in two-stage network DEA by class of hotels: (a) results of 1st stage; (b) results of 2nd stage.
Sustainability 16 08995 g005
Figure 6. Average MPI score by class of hotels: (a) results of VRS (black box model); (b) results of two-stage network DEA’s total system score.
Sustainability 16 08995 g006
Figure 7. Average MPI score in two-stage network DEA by class of hotels: (a) results of 1st stage; (b) results of 2nd stage.
Sustainability 16 08995 g007
Table 1. Examples of service dimensions and words with high probability in each dimension.
Service DimensionsExamples of Words with High Distribution Prob.
Convenienceairport, bus, station, stop, shuttle, subway, easy, train, convenient, floor, small, luggage, street, side, road, room, location, shopping, food, mall, city, center, restaurants, walking, distance, area, shops, close, walk, minutes
Facilitiesaccess, amazing, apartment, beautiful, buffet, clean, club, common, executive, facilities, guesthouse, gym, hostel, included, internet, kitchen, laundry, lounge, park, place, pool, property, selection, spa, tea, variety, view, washing machine, western, wifi
Room Conditionsroom(s), bathroom, shower, water, toilet, provided, bed, towels, hot, bath, night, sleep, open, window, cold, problem, door, noise, work(ing), comfortable, large, nice, spacious, floor, amenities, big, size, clean, beds, space
Human Servicescheck, day, arrived, early, asked, booked, checked, time, morning, told, staff(s), service, front, desk, excellent, concierge, helpful, special, professional, English, find, speak, Korean, taxi, clean, nice, friendly, comfortable, recommend, super
Table 2. Input, intermediate, output factors of the two-stage network DEA model in the study.
CategoriesVariable NameDefinition
Input
Variables
Number of Rooms
(NROOMS)
Number of rooms held by the DMU hotels (unit: number)
Tangible Assets
(TA)
Tangible assets on the statement of financial position
(unit: KRW million)
Labor Expense
(LABOR)
Labor costs on the income statement (unit: KRW million)
Other Expenses
(EXP)
Selling and administrative expenses excluding labor costs in the income statement (unit: KRW million)
Intermediate VariableService Quality
(SQ)
Each DMU’s service score which is calculated via probability–frequency weighted measurement (unit: score)
Output
Variable
Sales
(SALES)
Natural logarithmic value of sales (KRW million) on the income statement
Table 3. Descriptive results of input, intermediate, and output variables.
CategoryVariableStatistic20152016201720182019
Input
Variables
NROOMS 1Mean205.8
SD104.0
Min.29.0
Max.430.0
TAMean62,708.5 60,940.0 60,848.7 62,093.7 63,017.9
SD88,251.2 87,121.8 86,757.2 90,463.5 91,479.9
Min.1116.0 745.0 378.0 34.0 43.0
Max.423,669.0 417,758.0 416,964.0 411,106.0 403,101.0
LABORMean2031.5 2044.2 2088.4 2157.0 2230.9
SD1961.4 2015.2 2087.9 2102.5 2205.1
Min.33.8 29.5 31.1 34.5 44.6
Max.10,241.8 11,858.8 13,023.6 13,087.9 13,470.0
EXPMean3419.6 3795.1 4069.1 4360.9 5151.4
SD3750.8 4818.3 6823.8 7572.4 11,307.3
Min.71.8 35.4 60.8 37.1 22.2
Max.25,328.7 34,347.2 49,412.1 55,166.6 84,559.9
Inter-
mediate
Variables 2
SQ_CONVMean11.611.211.210.810.9
SD2.52.43.12.73.3
Min.5.97.14.34.42.8
Max.18.119.219.317.520.3
SQ_FACMean27.927.027.326.926.2
SD3.32.73.23.55.2
Min.19.219.419.418.03.7
Max.39.932.636.736.236.0
SQ_ROOMMean33.032.332.631.631.5
SD6.75.35.66.97.4
Min.14.717.113.79.06.4
Max.57.243.648.845.350.7
SQ_SERVMean35.135.235.234.734.2
SD3.33.23.84.06.4
Min.24.226.015.822.44.3
Max.42.341.341.443.045.5
Output
Variable
SALESMean9.19.39.29.39.3
SD1.00.80.90.90.9
Min.5.67.87.57.77.8
Max.11.211.211.311.311.4
1 Number of Rooms remained the same during the period. 2 CONV: convenience; FAC: facilities; ROOM: room conditions; SERV: human services.
Table 4. Wilcoxon’s rank sum test results for each model.
CategoryStatistic20152016201720182019
DEA_VRSAverage_Class10.75490.67130.68580.65760.6429
Average_Class20.79210.73880.72820.69980.6991
Wilcoxon’s W594582592594.5588.5
p-value0.7990.6500.7740.8080.730
Network DEA_total
system
Average_Class10.47240.43930.47000.48050.5251
Average_Class20.37830.34280.36280.35390.3772
Wilcoxon’s W926917918901886
p-value0.0510.036 **0.037 **0.018 **0.009 ***
Network DEA_1st
stage
Average_Class10.64660.57670.61320.63130.6719
Average_Class20.47360.42330.44750.43600.4512
Wilcoxon’s W909902896897873.5
p-value0.025 **0.019 **0.014 **0.015 **0.005 ***
Network DEA_2nd stageAverage_Class10.75390.77800.78150.77570.8002
Average_Class20.82490.83530.83550.84250.8563
Wilcoxon’s W427426451420460
p-value0.003 ***0.002 ***0.009 ***0.002 ***0.014 **
The significance level: ** p < 0.05; *** p < 0.01.
Disclaimer/Publisher’s Note: The statements, opinions and data contained in all publications are solely those of the individual author(s) and contributor(s) and not of MDPI and/or the editor(s). MDPI and/or the editor(s) disclaim responsibility for any injury to people or property resulting from any ideas, methods, instructions or products referred to in the content.