
Sewage Treatment Equipment Supply Chain Collaboration and Resilience Improvement Path Analysis: Collaborative Decision-Making, Information Sharing, Risk Management


Abstract
1. Introduction
2. Literature Review
2.1. Supply Chain Resilience
2.2. Supply Chain Collaboration
2.3. Collaborative Decision-Making
2.4. Information Sharing
2.5. Risk Management
3. Materials and Methods
3.1. Structural Equation Model
3.2. Research Hypotheses
3.3. Data Collection
3.4. Descriptive Analysis of Samples
3.4.1. Gender and Equality
3.4.2. Product Categories and Company Distribution
3.4.3. Management Level of Respondents
3.4.4. Experience and Expertise
3.5. Related Data Processing and Testing
4. Results
4.1. Hypothesis Testing
4.2. Mediation Model Analysis
5. Conclusions
Author Contributions
Funding
Institutional Review Board Statement
Informed Consent Statement
Data Availability Statement
Conflicts of Interest
References
- Dulude, E.; Coutu, M.-F.; Durand, M.-J. Promoting resilience in work rehabilitation: Development of a transdiagnostic intervention. Disabil. Rehabil. 2020, 43, 3652–3662. [Google Scholar] [CrossRef] [PubMed]
- Christopher, M.; Peck, H. Building the Resilient Supply Chain. Int. J. Logist. Manag. 2004, 15, 1–14. [Google Scholar] [CrossRef]
- Marin, V. How to construct an effective mechanism of supply chain resilience? Contemp. Econ. Manag. 2022, 44, 27–38. [Google Scholar] [CrossRef]
- Wieland, A.; Wallenburg, C.M. The influence of relational competence on supply chain resilience: A relational view. Int. J. Phys. Distrib. Logist. Manag. 2013, 43, 300–320. [Google Scholar] [CrossRef]
- Brandon-Jones, E.; Squire, B.; Autry, C.W.; Petersen, K.J. A contingent resource-based perspective of supply chain resilience and robustness. J. Supply Chain. Manag. 2014, 50, 55–73. [Google Scholar] [CrossRef]
- Mandal, S. An empirical competence-capacity model of supply chain resilience. Int. J. Disaster Resil. Built Environ. 2017, 8, 190–208. [Google Scholar] [CrossRef]
- Hohenstein, N.O.; Feisel, E.; Hartmann, E. Research on the phenomenon of supply chain resilience: A systematic review and paths for further investigation. Int. J. Phys. Distrib. Logist. Manag. 2015, 45, 90–117. [Google Scholar] [CrossRef]
- Sahu, A.K.; Datta, S.; Mahapatra, S.S. Evaluation of performance index in resilient supply chain: A fuzzy-based approach. Benchmarking Int. J. 2017, 24, 118–142. [Google Scholar] [CrossRef]
- Rajesh, R. A novel advanced grey incidence analysis for investigating the level of resilience in supply chains. Ann. Oper. Res. 2022, 308, 27–39. [Google Scholar] [CrossRef]
- Teece, D.J. Explicating dynamic capabilities: The nature and microfoundations of sustainable enterprise performance. Strateg. Manag. J. 2007, 28, 1319–1350. [Google Scholar] [CrossRef]
- Wu, J. Evaluation study on the Resilience of Maritime Silk Road Shipping Network. Master’s Thesis, Wuhan University of Technology, Wuhan, China, 2020. [Google Scholar] [CrossRef]
- Hu, Q. Dynamic Perspective under Supply Chain Environment Strategy Practice Mechanism Research. Ph.D. Thesis, Beijing University of Posts and Telecommunications, Beijing, China, 2023. [Google Scholar] [CrossRef]
- Du, X.R. Research on the Impact of Enterprise Emerging IT Integration on Supply Chain Resilience and Sustainability Performance. Master’s Thesis, Xi’an University of Electronic Science and Technology, Xi’an, China, 2023. [Google Scholar] [CrossRef]
- Min, S.; Mentzer, J.T.; Ladd, R.T. A market orientation in supply chain management. J. Acad. Mark. Sci. 2007, 35, 507–522. [Google Scholar] [CrossRef]
- Zhang, H.J. Based on inventory control of supply chain management environment study. Chin. Mark. 2023, 2, 176–178. [Google Scholar] [CrossRef]
- Alzoubi, H.M.; Ahmed, G.; Al-Gasaymeh, A.; Al Kurdi, B. Empirical study on sustainable supply chain strategies and its impact on competitive priorities: The mediating role of supply chain collaboration. Manag. Sci. Lett. 2020, 10, 345–354. [Google Scholar] [CrossRef]
- Yang, Z.; Lin, Y. The effects of supply chain collaboration on green innovation performance: An interpretive structural modeling analysis. Sustain. Prod. Consum. 2020, 23, 128–137. [Google Scholar] [CrossRef]
- Hofman, P.; Blome, C.; Schleper, M.; Subramanian, N. Supply chain collaboration and eco-innovations: An institutional perspective from China. Bus. Strategy Environ. 2020, 29, 1587–1601. [Google Scholar] [CrossRef]
- Sudusinghe, J.I.; Seuring, S. Supply chain collaboration and sustainability performance in circular economy: A systematic literature review. Int. J. Prod. Econ. 2021, 233, 107942. [Google Scholar] [CrossRef]
- Ali, N.; Ghazal, T.M.; Ahmed, A.; Abbas, S.; Khan, M.A.; Alzoubi, H.M.; Farooq, U.; Ahmad, M.; Khan, M.A. Fusion-based supply chain collaboration using machine learning techniques. Intell. Autom. Soft Comput. 2022, 32, 421–432. [Google Scholar] [CrossRef]
- Zhiwen, Z.; Yujun, X.; Junxing, L.; Limin, G.; Long, W. Supply chain logistics information collaboration strategy based on evolutionary game research. J. Logist. Technol. 2023, 46, 1–6. [Google Scholar] [CrossRef]
- Zhang, J.J.; Zhao, Q.L. Mongolia farming and animal husbandry in the cross-border supply chain collaboration theory framework and realization path. Circ. Econ. China 2024, 38, 55–67. [Google Scholar] [CrossRef]
- Zhang, P. An Empirical Study on the Influence of Supply Chain Collaboration on Supply Chain Flexibility in Machinery Manufacturing Enterprises. Master’s Thesis, Hebei University of Geosciences, Wuhan, China, 2022. [Google Scholar] [CrossRef]
- Allaoui, H.; Guo, Y.; Sarkis, J. Joseph Sarkis Decision Support for Collaboration Planning in Sustainable Supply Chains. J. Clean. Prod. 2019, 229, 761–774. [Google Scholar] [CrossRef]
- Brock, T.; Reed, M.G.; Stewart, K.J. A practical framework to guide collaborative environmental decision making among Indigenous Peoples, corporate, and public sectors. Extr. Ind. Soc. 2023, 14, 101246. [Google Scholar] [CrossRef]
- Gemma, J. Collaborative leadership in team science: Dynamics of sense making, decision making, and action taking. Front. Res. Metr. Anal. 2023, 8, 1211407. [Google Scholar]
- Guan, Z.; Zhang, X.; Zhou, M.; Dan, Y. Demand Information Sharing in Competing Supply Chains with Manufacturer-provided Service. Int. J. Prod. Econ. 2020, 220, 107450. [Google Scholar] [CrossRef]
- Tang, L.; Yang, T.; Tu, Y.; Ma, Y. Supply Chain Information Sharing Under Consideration of Bullwhip Effect and System Robustness. Flex. Serv. Manuf. J. 2020, 33, 337–380. [Google Scholar] [CrossRef]
- Yu, Y.; Zhou, S.; Shi, Y. Information sharing or not across the supply chain: The role of carbon emission reduction. Transp. Res. Part E Logist. Transp. Rev. 2020. [Google Scholar] [CrossRef]
- Xue, X.; Dou, J.; Shang, Y. Blockchain-driven supply chain decentralized operations: Information sharing perspective. Bus. Process Manag. J. 2021, 27, 184–203. [Google Scholar] [CrossRef]
- Wei, J.; Wang, C. A differential game analysis on green technology innovation in a supply chain with information sharing of dynamic demand. Kybernetes 2021, 52, 362–400. [Google Scholar] [CrossRef]
- Kasparis, E.; Huang, Y.; Lin, W.M.; Vasilakis, C. Improving timeliness in the neglected tropical diseases preventive chemotherapy donation supply chain through information sharing: A retrospective empirical analysis. Soc. Sci. Res. Netw. 2021, 15, e0009523. [Google Scholar] [CrossRef]
- Zhang, X.; Zha, X.; Dan, B.; Liu, Y.; Sui, R. Logistics mode selection and information sharing in a cross-border e-commerce supply chain with competition. Eur. J. Oper. Res. 2024, 314, 136–151. [Google Scholar] [CrossRef]
- Ngxesha, N.C.; Langton, I.; Mafini, C. Municipal supply chain performance through information sharing and stakeholder collaboration. S. Afr. J. Econ. Manag. Sci. 2024, 27, e1–e14. [Google Scholar] [CrossRef]
- Munir, M.; Jajja, M.S.S.; Chatha, K.A.; Farooq, S. Supply chain risk management and operational performance: The enabling role of supply chain integration. Int. J. Prod. Econ. 2020, 227, 107667. [Google Scholar] [CrossRef]
- Jüttner, U.; Peck, H.; Christopher, M. Supply Chain Risk Management: Outlining An Agenda for Future Research. Int. J. Logist. Res. Appl. 2003, 6, 197–210. [Google Scholar] [CrossRef]
- Hatami-Marbini, A.; Asu, J.O.; Hafeez, K.; Khoshnevis, P. DEA-driven risk management framework for oil supply chains. Socio-Econ. Plan. Sci. 2024, 95, 101996. [Google Scholar] [CrossRef]
- Abdel-Basset, M.; Mohamed, R. A novel plithogenic TOPSIS-CRITIC model for sustainable supply chain risk management. J. Clean. Prod. 2020, 247, 119586. [Google Scholar] [CrossRef]
- Saglam, Y.C.; Çankaya, S.Y.; Sezen, B. Proactive risk mitigation strategies and supply chain risk management performance: An empirical analysis for manufacturing firms in Turkey. J. Manuf. Technol. Manag. 2020, 32, 1224. [Google Scholar] [CrossRef]
- Pournader, M.; Kach, A.; Talluri, S.S. A review of the existing and emerging topics in the supply chain risk management literature.Decision Sciences. J. Innov. Educ. 2020, 51, 867–919. [Google Scholar]
- Manhart, P.; Summers, J.; Blackhurst, J. A meta-analytic review of supply chain risk management: Assessing buffering and bridging strategies and firm performance. J. Supply Chain. Manag. 2020, 56, 66–87. [Google Scholar] [CrossRef]
- El Baz, J.; Ruel, S. Can supply chain risk management practices mitigate the disruption impacts on supply chains’ resilience and robustness? Evidence from an empirical survey in a COVID-19 outbreak era. Int. J. Prod. Econ. 2020, 233, 107972. [Google Scholar] [CrossRef]
- Nel, D.J. The role of supply chain risk mitigation strategies to manage supply chain disruptions. J. Transp. Supply Chain. Manag. 2024, 18, e1–e12. [Google Scholar] [CrossRef]
- Rice, J.B.; Sheff, C.A. Supply chain resilience: Development of a conceptual framework. J. Bus. Logist. 2005, 26, 39–55. [Google Scholar]
- Li, S.; Li, Y.; Wang, C.; Qiao, Q. The role of digitalization in enhancing supply chain resilience: A dynamic capability perspective. Int. J. Prod. Res. 2023, 61, 1933–1948. [Google Scholar]
- Zhou, Y.; Bowersox, D.J.; Pohlman, L.A. The role of IT capabilities and supply chain collaboration in enhancing supply chain resilience. J. Bus. Logist. 2022, 43, 45–62. [Google Scholar]
- Mandal, S. The influence of organizational culture on healthcare supply chain resilience: Moderating role of technology orientation. J. Bus. Ind. Mark. 2017, 32, 1021–1037. [Google Scholar] [CrossRef]
- Wang, Y.P. On the quality improvement of fresh e-commerce service from the perspective of blockchain. Bus. Econ. Res. 2020, 14, 92–95. [Google Scholar]
- Tan, H.-C.; Soh, K.L.; Wong, W.P.; Tseng, M.-L. Enhancing supply chain resilience by counteracting the Achilles heel of information sharing. J. Enterp. Inf. Manag. 2022, 35, 817–846. [Google Scholar] [CrossRef]
- Coşkun, A.E.; Erturgut, R. How Do Uncertainties Affect Supply-Chain Resilience? The Moderating Role of Information Sharing for Sustainable Supply-Chain Management. Sustainability 2024, 16, 131. [Google Scholar] [CrossRef]
- Cai, S.L. Study on Supply Chain Risk Management. Master’s Thesis, Central South University, Changsha, China, 2012. [Google Scholar]
- Fan, Y.; Stevenson, M. A review of supply chain risk management: Definition, theory, and research agenda. Int. J. Phys. Distrib. Logist. 2018, 48, 205–230. [Google Scholar] [CrossRef]
- Chi, C.C. Research on Supply Chain Risk Management of BorgWarner Company. Master’s Thesis, Dalian University of Technology, Dalian, China, 2022. [Google Scholar] [CrossRef]
- Yang, Y. Research on Supply Chain Risk Management from the Perspective of Risk Transmission. Master’s Thesis, Qingdao Technological University, Qingdao, China, 2022. [Google Scholar] [CrossRef]
- Hua, L.J. Study on Risk Sharing in Collaborative Decision-Making of Household Appliance Supply Chain. Master’s Thesis, Zhengzhou University, Zhengzhou, China, 2015. [Google Scholar]
- Williams, T.A.; Gruber, D.A.; Sutcliffe, K.M.; Shepherd, D.A.; Zhao, E.Y. Organizational response to adversity: Fusing crisis management and resilience research streams. Acad. Manag. Ann. 2017, 11, 733–769. [Google Scholar] [CrossRef]
- Hanelt, A.; Bohnsack, R.; Marz, D.; Marante, C.A. A systematic review of the literature on digital transformation: Insights and implications for strategy and organizational change. J. Manag. Stud. 2021, 58, 1159–1197. [Google Scholar] [CrossRef]


| Project | Description | Percentage |
|---|---|---|
| Gender | Female | 46% |
| Male | 54% | |
| Products | Resin | 7% |
| Fiberglass | 12% | |
| Fiberglass pipes | 37% | |
| Sewage Treatment Plant | 26% | |
| Others (valves, pumps, etc.) | 18% | |
| Persons under investigation | General Staff | 6% |
| Managers at the grass-roots level | 8% | |
| Middle Management | 52% | |
| Senior Management | 34% | |
| Years of service | 1 year and below | 5% |
| One to three years | 17% | |
| Three to six years | 47% | |
| 6 years and above | 31% |
| Fit Index | Collaboration X | Information Sharing X1 | Risk Management X2 | Collaborative Decision Making X3 | Flexibility Y1 | Adaptability Y2 | Recovery Y3 | Compressive Ability Y4 | Partnership M |
|---|---|---|---|---|---|---|---|---|---|
| Reliability value | 0.876 | 0.799 | 0.809 | 0.787 | 0.939 | 0.916 | 0.930 | 0.922 | 0.900 |
| KMO Sampling Appropriateness Quantity | 0.935 | |
| Bartlett sphericity test | Approximately chi-squared | 9886.289 |
| df | 703 | |
| p-value | 0.000 | |
| Explanation of Total Variance | ||||||
|---|---|---|---|---|---|---|
| Ingredients | Extract the Sum of Squares of Loads | Sum of Squares of Rotational Loads | ||||
| Total | Variance % | Cumulative % | Total | Variance % | Cumulative % | |
| X | 12.632 | 33.243 | 33.243 | 5.073 | 13.351 | 13.351 |
| X1 | 3.338 | 8.783 | 42.026 | 3.483 | 9.166 | 22.517 |
| X2 | 2.698 | 7.099 | 49.125 | 3.224 | 8.483 | 31.000 |
| X3 | 2.390 | 6.291 | 55.415 | 3.175 | 8.354 | 39.354 |
| Y1 | 2.014 | 5.300 | 60.716 | 3.032 | 7.980 | 47.334 |
| Y2 | 1.493 | 3.929 | 64.644 | 2.781 | 7.317 | 54.651 |
| Y3 | 1.375 | 3.619 | 68.263 | 2.659 | 6.997 | 61.649 |
| Y4 | 1.224 | 3.222 | 71.485 | 2.657 | 6.993 | 68.642 |
| M | 1.105 | 2.909 | 74.393 | 2.186 | 5.752 | 74.393 |
| The Component Matrix after Rotation a | |||||||||
|---|---|---|---|---|---|---|---|---|---|
| Ingredients | |||||||||
| 1 | 2 | 3 | 4 | 5 | 6 | 7 | 8 | 9 | |
| Qcol-6 | 0.754 | ||||||||
| Qcol-7 | 0.801 | ||||||||
| Qcol-8 | 0.794 | ||||||||
| Qcol-9 | 0.797 | ||||||||
| Qcol-10 | 0.794 | ||||||||
| Qimf-11 | 0.768 | ||||||||
| Qimf-12 | 0.782 | ||||||||
| Qimf-13 | 0.764 | ||||||||
| Qimf-14 | 0.752 | ||||||||
| Qris-15 | 0.781 | ||||||||
| Qris-16 | 0.75 | ||||||||
| Qris-17 | 0.782 | ||||||||
| Qris-18 | 0.802 | ||||||||
| Qdec-20 | 0.794 | ||||||||
| Qdec-21 | 0.834 | ||||||||
| Qdec-22 | 0.796 | ||||||||
| Qpar-39 | 0.782 | ||||||||
| Qpar-40 | 0.78 | ||||||||
| Qpar-41 | 0.803 | ||||||||
| Qpar-42 | 0.775 | ||||||||
| Qpar-43 | 0.769 | ||||||||
| Qpar-44 | 0.796 | ||||||||
| Qfex-23 | 0.748 | ||||||||
| Qfex-24 | 0.767 | ||||||||
| Qfex-25 | 0.75 | ||||||||
| Qfex-26 | 0.762 | ||||||||
| Qada-27 | 0.725 | ||||||||
| Qada-28 | 0.706 | ||||||||
| Qada-29 | 0.738 | ||||||||
| Qada-30 | 0.757 | ||||||||
| Qrec-31 | 0.787 | ||||||||
| Qrec-32 | 0.76 | ||||||||
| Qrec-33 | 0.802 | ||||||||
| Qrec-34 | 0.791 | ||||||||
| Qcom-35 | 0.814 | ||||||||
| Qcom-36 | 0.834 | ||||||||
| Qcom-37 | 0.833 | ||||||||
| Qcom-38 | 0.815 | ||||||||
| Variable | M | SD | ||||||||
|---|---|---|---|---|---|---|---|---|---|---|
| X | 0.136 | 0.683 | — | |||||||
| X1 | 0.129 | 0.733 | 0.180 | — | ||||||
| X2 | 0.962 | 0.731 | 0.242 | −0.064 | — | |||||
| X3 | 0.063 | 0.772 | 0.139 | −0.031 | −0.014 | — | ||||
| Y1 | 0.982 | 0.759 | 0.300 | 0.270 | 0.222 | 0.314 | — | |||
| Y2 | 0.833 | 0.812 | 0.303 | 0.297 | 0.244 | 0.246 | 0.628 | — | ||
| Y3 | 0.176 | 0.869 | 0.310 | 0.287 | 0.264 | 0.273 | 0.667 | 0.654 | — | |
| Y4 | 0.919 | 0.795 | 0.273 | 0.256 | 0.198 | 0.203 | 0.626 | 0.612 | 0.607 | — |
| M | 0.879 | 0.832 | 0.386 | 0.250 | 0.214 | 0.274 | 0.344 | 0.329 | 0.418 | 0.288 |
| Path | Hypothesis | Estimate | S.E. | C.R. | p | Hypothesis Testing | ||
|---|---|---|---|---|---|---|---|---|
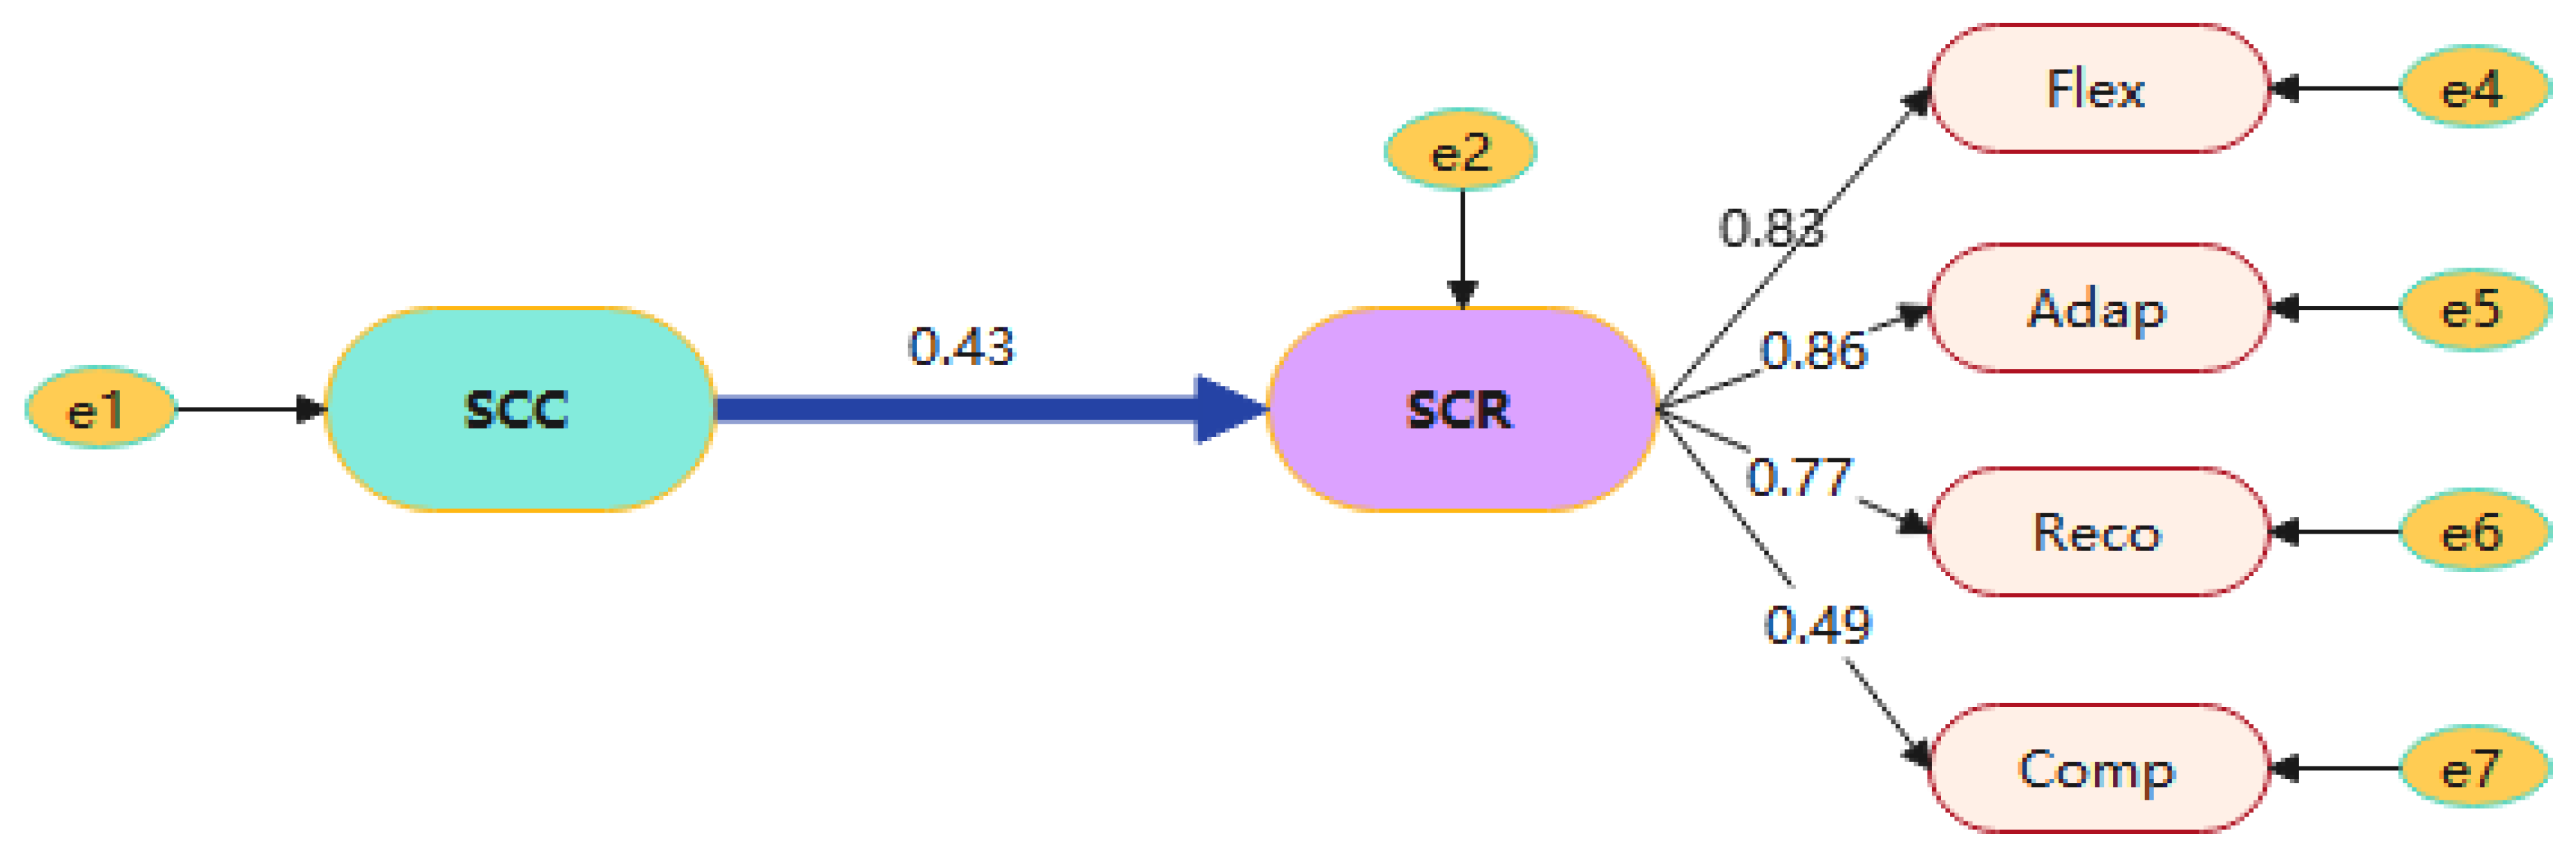
| Resilience | <--- | Collaboration | H1 | 0.427 | 0.05 | 5.644 | *** | Set up |
| Path | Hypothesis | Estimate | S.E. | C.R. | p | Hypothesis Testing | ||
|---|---|---|---|---|---|---|---|---|
| Resilience | <--- | Information Sharing; Risk Management; Collaborative decision-making | H2 | 0.350 | 0.02 | 5.687 | *** | Set up |
| Path | Hypothesis | Estimate | S.E. | C.R. | p | Hypothesis Testing | ||
|---|---|---|---|---|---|---|---|---|
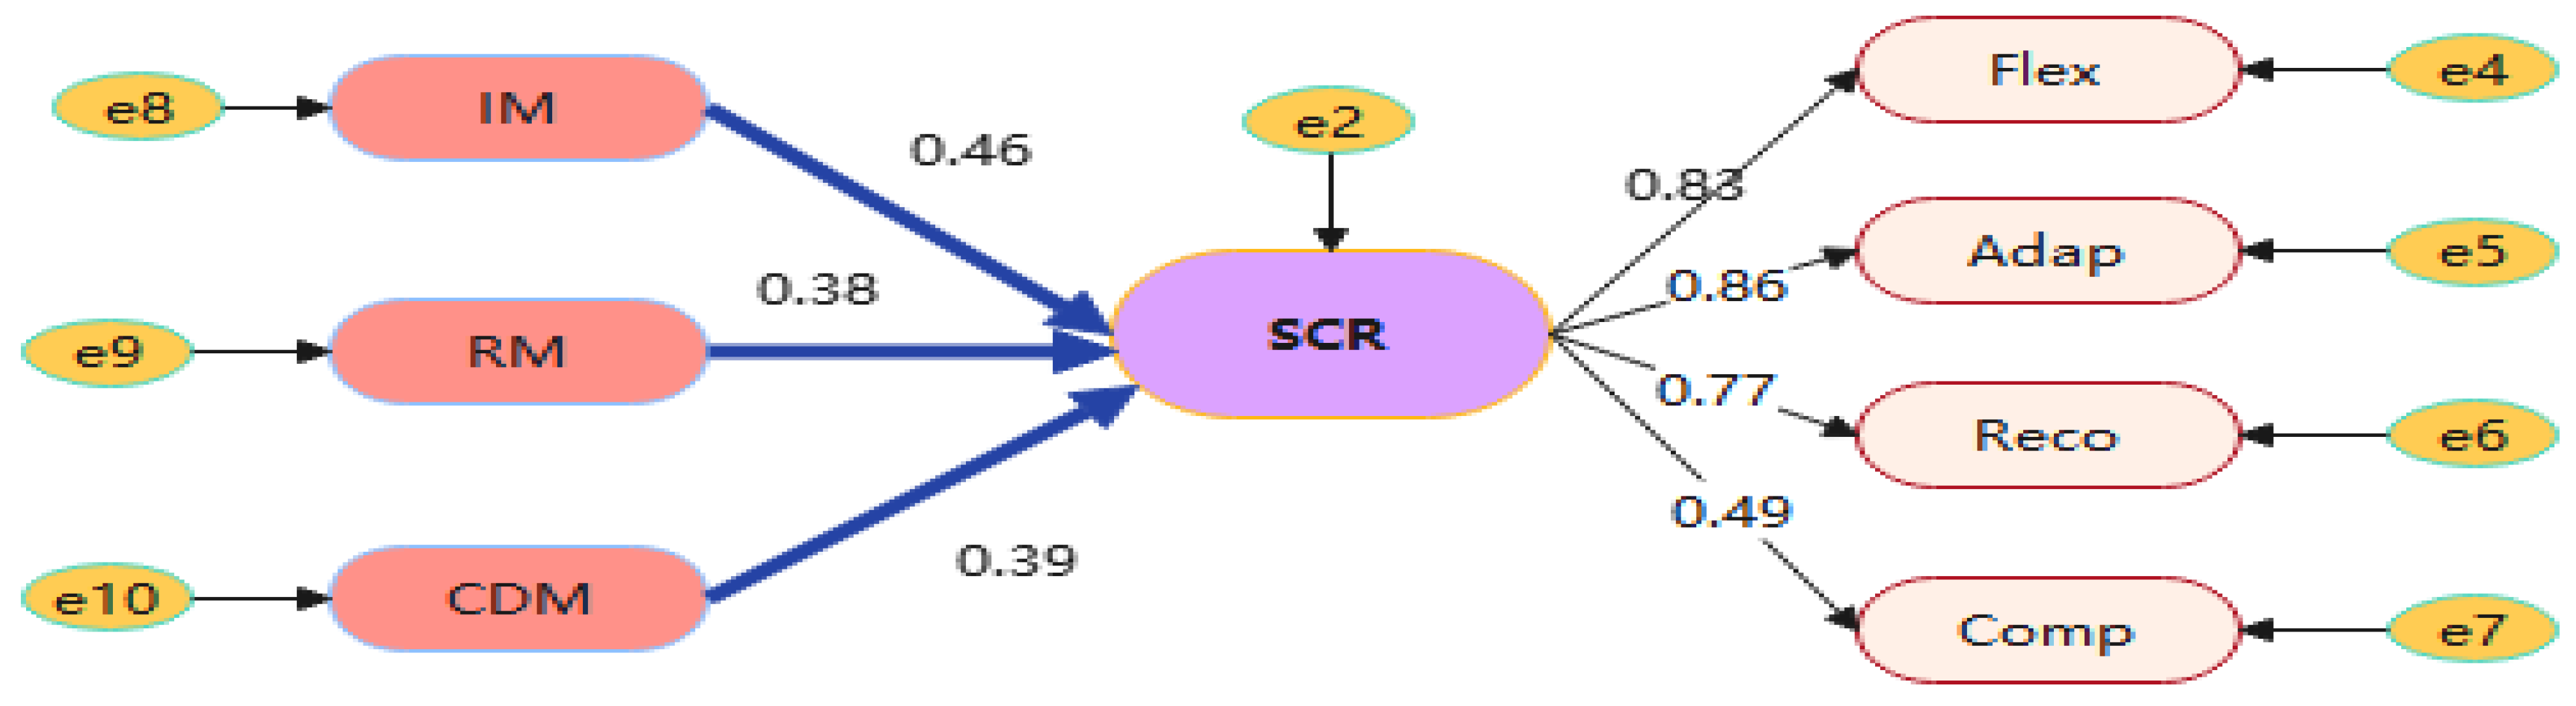
| Resilience | <--- | Information Sharing | H2a | 0.458 | 0.062 | 7.310 | *** | Set up |
| Resilience | <--- | Risk management | H2b | 0.385 | 0.054 | 6.577 | *** | Set up |
| Resilience | <--- | Collaborative Decision-making | H2c | 0.394 | 0.056 | 6.584 | *** | Set up |
| Path | Hypothesis | Estimate | S.E. | C.R. | p | Hypothesis Testing | ||
|---|---|---|---|---|---|---|---|---|
| Partnership | <--- | Collaboration | H3 | 0.360 | 0.080 | 6.278 | *** | Set up |
| Resilience | <--- | Partnership | 0.767 | 0.049 | 13.182 | *** | ||
| Parameter | Estimate | Low Level | High Level | p |
|---|---|---|---|---|
| Mesomeric Effect | 0.325 | 0.234 | 0.431 | 0.006 |
| Direct Effect | 0.219 | 0.139 | 0.313 | 0.007 |
| Total Effect | 0.544 | 0.427 | 0.667 | 0.006 |
Disclaimer/Publisher’s Note: The statements, opinions and data contained in all publications are solely those of the individual author(s) and contributor(s) and not of MDPI and/or the editor(s). MDPI and/or the editor(s) disclaim responsibility for any injury to people or property resulting from any ideas, methods, instructions or products referred to in the content. |
© 2024 by the authors. Licensee MDPI, Basel, Switzerland. This article is an open access article distributed under the terms and conditions of the Creative Commons Attribution (CC BY) license (https://creativecommons.org/licenses/by/4.0/).
Share and Cite
Xu, X.; Wang, J.; He, C.; Jiang, X.; An, Q. Sewage Treatment Equipment Supply Chain Collaboration and Resilience Improvement Path Analysis: Collaborative Decision-Making, Information Sharing, Risk Management. Sustainability 2024, 16, 9031. https://doi.org/10.3390/su16209031
Xu X, Wang J, He C, Jiang X, An Q. Sewage Treatment Equipment Supply Chain Collaboration and Resilience Improvement Path Analysis: Collaborative Decision-Making, Information Sharing, Risk Management. Sustainability. 2024; 16(20):9031. https://doi.org/10.3390/su16209031
Chicago/Turabian StyleXu, Xu, Jie Wang, Chan He, Xuting Jiang, and Qianru An. 2024. "Sewage Treatment Equipment Supply Chain Collaboration and Resilience Improvement Path Analysis: Collaborative Decision-Making, Information Sharing, Risk Management" Sustainability 16, no. 20: 9031. https://doi.org/10.3390/su16209031
APA StyleXu, X., Wang, J., He, C., Jiang, X., & An, Q. (2024). Sewage Treatment Equipment Supply Chain Collaboration and Resilience Improvement Path Analysis: Collaborative Decision-Making, Information Sharing, Risk Management. Sustainability, 16(20), 9031. https://doi.org/10.3390/su16209031