Article

Study on the Sand Reduction Effect of Slope Vegetation Combination in Loess Areas

School of Civil Engineering, Lanzhou Jiaotong University, Anning District, Lanzhou 730070, China
*
Author to whom correspondence should be addressed.
Sustainability 2024, 16(20), 9132; https://doi.org/10.3390/su16209132
Submission received: 24 September 2024 / Revised: 16 October 2024 / Accepted: 18 October 2024 / Published: 21 October 2024

Abstract

:
Slope erosion in the Loess Plateau region has long been a concern, and vegetation plays an important role in slowing down erosion and controlling sedimentation. However, a single vegetation model shows some limitations when facing complex natural conditions and variable rainfall events. Therefore, this study investigated the influence mechanism of vegetation configuration on slope sand production at different slopes through theoretical analyses and indoor experiments. The results of the study showed that certain factors, such as vegetation configuration mode, flow rate, runoff power, runoff velocity, and runoff shear, are closely related to slope runoff sand production. The specific findings are as follows: (1) Under the condition of slope gradient of 2°, the sand reduction effect of the rigid–flexible single-row staggered configuration is the most significant, and the sediment production is reduced by 29.89%. (2) With the increase in the slope gradient and flow rate, the sand production on the slope surface rises significantly, and when the slope gradient is increased from 2° to 6°, the average sand production is increased from 1.43 kg to 2.51 kg.(3) The erosion reduction effects of different vegetation configurations were in the order of rigid–flexible single-row staggered combination > flexible vegetation single combination > rigid–flexible double-row staggered combination > rigid vegetation single combination > upstream rigid downstream flexible combination > bare slope. This study provides a theoretical basis for optimizing the vegetation configuration for effective sand reduction and provides an important reference for the sustainable development of the Yellow River Basin.

1. Introduction

The Loess Plateau is one of the most serious areas of soil erosion in the world, and the soil erosion problem has posed a great threat to the ecological environment and socio-economic development of the region [1]. Slope runoff, as the main driver of soil erosion [2], is particularly important to the slope erosion and deposition process, which directly determines the intensity and spatial distribution of soil erosion [3]. In this context, vegetation becomes the key to controlling soil erosion and maintaining soil and water resources [4], and its role in soil and water conservation on the Loess Plateau cannot be ignored [5]. Vegetation can not only reduce the direct strike of raindrops on soil and reduce the disintegration and splash erosion of soil particles through root fixation and branch and leaf interception but can also increase the content of soil organic matter and improve the soil structure, thus improving the erosion resistance of soil [6]. Slope vegetation has a significant role in the sediment retention process, especially in watersheds with serious soil erosion, and vegetation is regarded as a major sediment regulator [7,8]. In recent years, although a large number of studies have explored the effects of vegetation on slope runoff and sediment yield, the complex interaction mechanism between the spatial configuration mode of vegetation and the soil erosion process for the special ecosystem of the Loess Plateau has still not been fully revealed.
It has been pointed out that the effect of vegetation on reducing soil erosion is usually better than its ability to reduce runoff [9], and the retention efficiency of vegetation on sediment is affected by slope, flow velocity, sand content, sediment particle composition, vegetation type and plant density [10]. For example, Zhao et al. used PVC pipes to simulate vegetation and found that although the total amount of sediment siltation increased with the sand content, the retention efficiency did not significantly increase [11,12]. In addition, there is a power function relationship between runoff velocity and sand transport capacity, and an increase in sand transport is often accompanied by an increase in the proportion of coarse particles [13]. There are also significant differences in the effectiveness of different vegetation types in soil and water conservation. Compared to trees and shrubs, herbaceous vegetation can achieve significant erosion control benefits in a shorter period of time due to its shorter growth cycle [14], as the above-ground portion of grasses protects the soil surface from spattering by reducing the kinetic energy of raindrops [15], whereas the stems and roots of grasses reduce the sediment transporting capacity and increase soil erosion resistance by increasing the roughness of the ground surface and increasing the soil infiltration rate [16,17,18,19,20,21].
Grass stems play a key role in mitigating water erosion, although the role of grass stems is often overlooked compared to roots, leaves, and apoplasts [22,23]. Studies have shown that shrub-grass vegetation cover is effective in reducing slope runoff and sediment production, especially as the rate of increase in cumulative runoff is greater than the rate of increase in cumulative sediment production with increasing vegetation cover [24,25]. It was also found that grass stems play an important role in mitigating water erosion and are the main roughness element in slope runoff [26], increasing surface roughness and resistance more than apoplastic material, thus effectively reducing runoff volume and erosion [27,28]. Runoff volume is reduced by up to 90% on land with 30% plant stem cover compared to bare slopes [29]. Greater stem density and diameter help reduce runoff and erosion. Stolons were well developed in 41.51 and 61.04 per cent of serpentine berry species, much higher than leaves and roots, respectively [30,31].
Vegetation type and configuration mode have a significant effect on the effect of soil erosion control have a certain effect [32,33]. With the increase in slope grass cover and the adjustment of the configuration mode, the amount of flow and sand production on the slope was significantly reduced [34,35]. Both the increase in grass cover and the modification of grass layer configuration on the slope significantly reduced the amount of flow-producing sand production on the slope [36], and the distribution of vegetation at the bottom of the slope was the most effective in reducing the runoff shear, while the distribution of vegetation in the middle of the slope was more effective in reducing the runoff dynamics of the slope gully system [37]. However, traditional vegetation measures have mostly focused on single rigid or flexible vegetation, ignoring the potential for synergistic effects of both. The performance of rigid vegetation (hard stalks, not easy to bend) and flexible vegetation (soft stalks, easy to bend) under different flow conditions has its own advantages and disadvantages, and how to scientifically configure these two types of vegetation in order to maximize their soil and water conservation effects is still an urgent research challenge [38].
Therefore, this study will systematically investigate the influence of different rigid–flexible vegetation combination modes on the sand reduction effect on the slopes of the Loess Plateau by using an indoor discharge flushing test. By designing multiple vegetation combination modes, including single rigid vegetation, single flexible vegetation, and mixed rigid–flexible vegetation combinations, combined with different slope and flow conditions, runoff and sediment yield were observed and recorded. Through quantitative analysis and numerical simulation, the interaction mechanism between the vegetation combination and the sand reduction effect was revealed. The research results will provide a scientific basis for soil and water conservation and ecological restoration in the Loess Plateau, and at the same time provide theoretical support for optimizing the spatial layout of vegetation and improving the effectiveness of soil and water conservation.

2. Materials and Methods

2.1. Research Area Overview

The study area is located in Hei Fangtai, Yongjing County, Gansu Province, on the western edge of the Loess Plateau in Longxi (102°53′–103°39′ E, 35°47′–36°12′ N), with an elevation ranging from 1539 m to 2841 m. The region has a semi-arid climate in the mesothermal zone, with an average annual rainfall of 287.6 mm, evaporation of up to 1593.4 mm, and an average annual air temperature of 9.9 °C. Hei Fangtai is located on the fourth terrace on the north bank of the Yellow River. The stratigraphy from bottom to top is purple–red sandy mudstone of the Cretaceous Hekou Group, a pebble layer of the Middle Pleistocene of the Quaternary, and orange–red powdery clay, loess of the Upper Pleistocene, and a top layer of Malan loess; the physical properties are shown in Table 1 [39]. The vegetation in this area is sparse, and the top layer of loess is severely degraded by hydraulic and gravitational erosion.
In the study area, the vegetation type is mainly semi-arid grassland, with common herbaceous plants, such as wood grass and ice grass. The plantation forest consists mainly of sea buckthorn, poplar, and willow, and the artificially planted grasses are mainly alfalfa and awnless bird’s-eye. However, soil erosion remains a serious problem due to poor engineering, poor selection of tree species, and poor reforestation techniques (Figure 1). To combat slope erosion, the region has implemented measures to restore vegetation on loess slopes. This was achieved by planting a combination of rigid trees and flexible herbaceous plants at the top of the slopes while relying mainly on flexible herbaceous plants at the foot of the slopes. However, erosion remained severe in the areas covered only by flexible herbaceous plants, while soil erosion was significantly reduced in the areas planted with a combination of rigid and flexible plants.

2.2. Design and Methodology

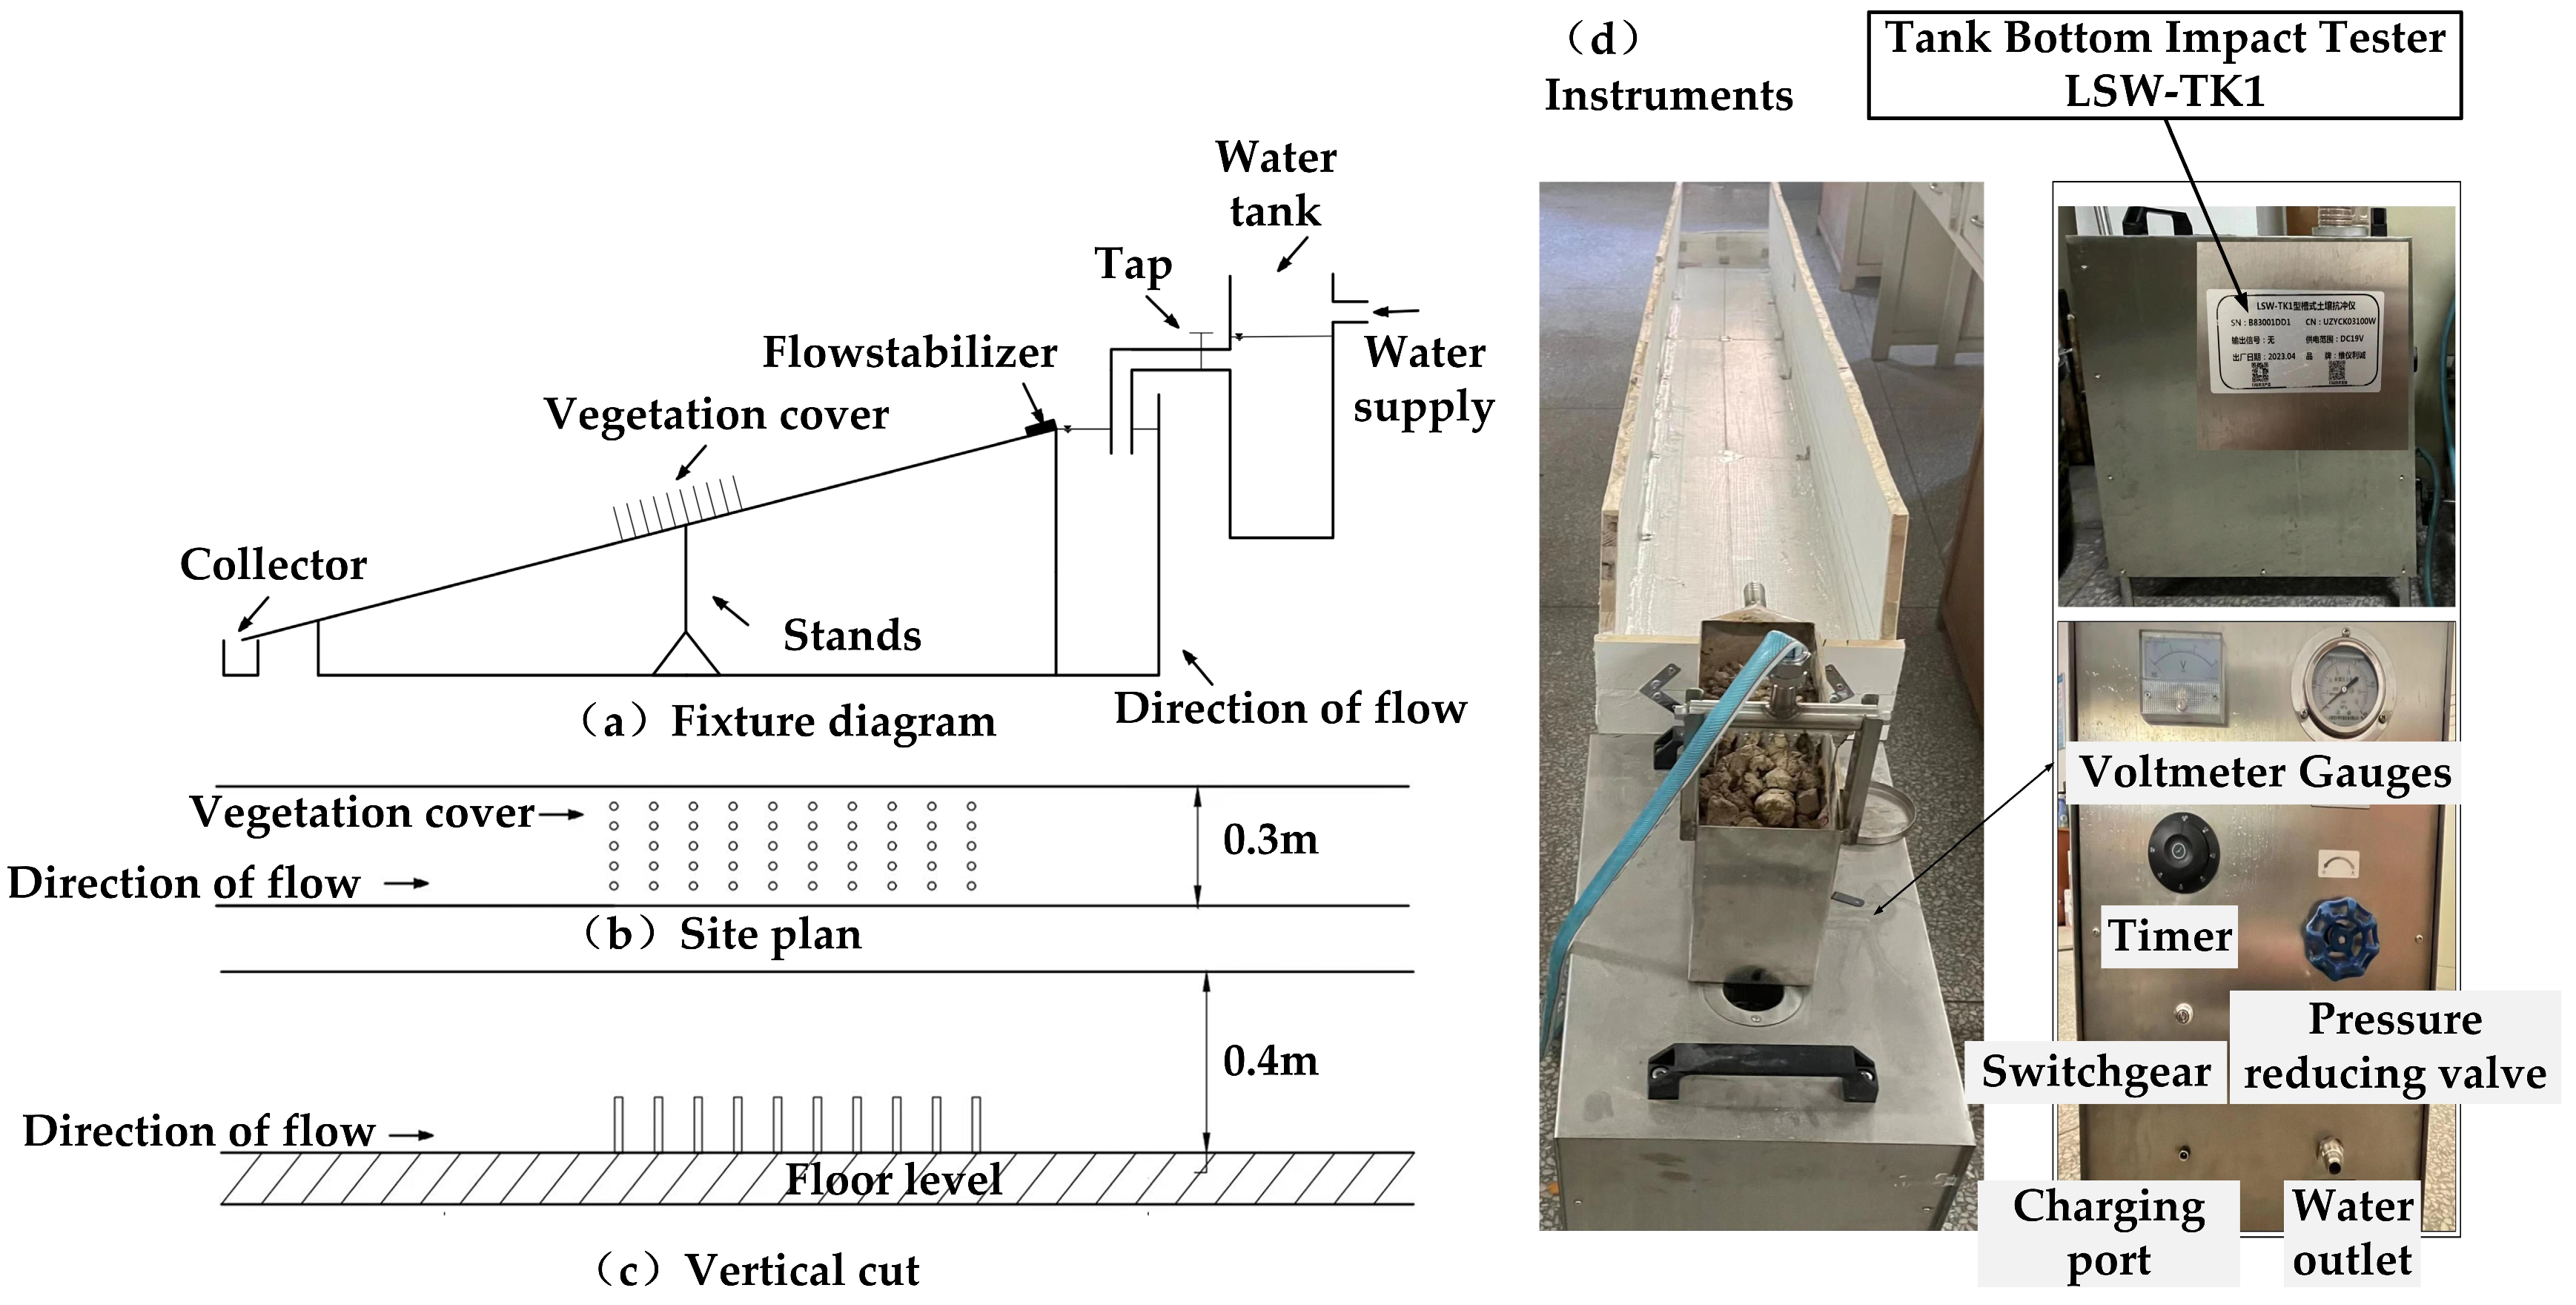
In this study, a slope discharge scour test was used and, based on the test design, a test setup was developed in-house that included a custom erosion system, a water tank, and a water collection device. This test uses a water supply erosion system consisting of a water tank, a constant head scouring device, a water pipe, and a water pump (Figure 2). The water reservoir was filled with water and the constant head device was set at the top of the flume to ensure a uniform flow of water into the flume. The catchment system consisted mainly of plastic containers placed at the bottom of the flume to collect run-off and sediment.
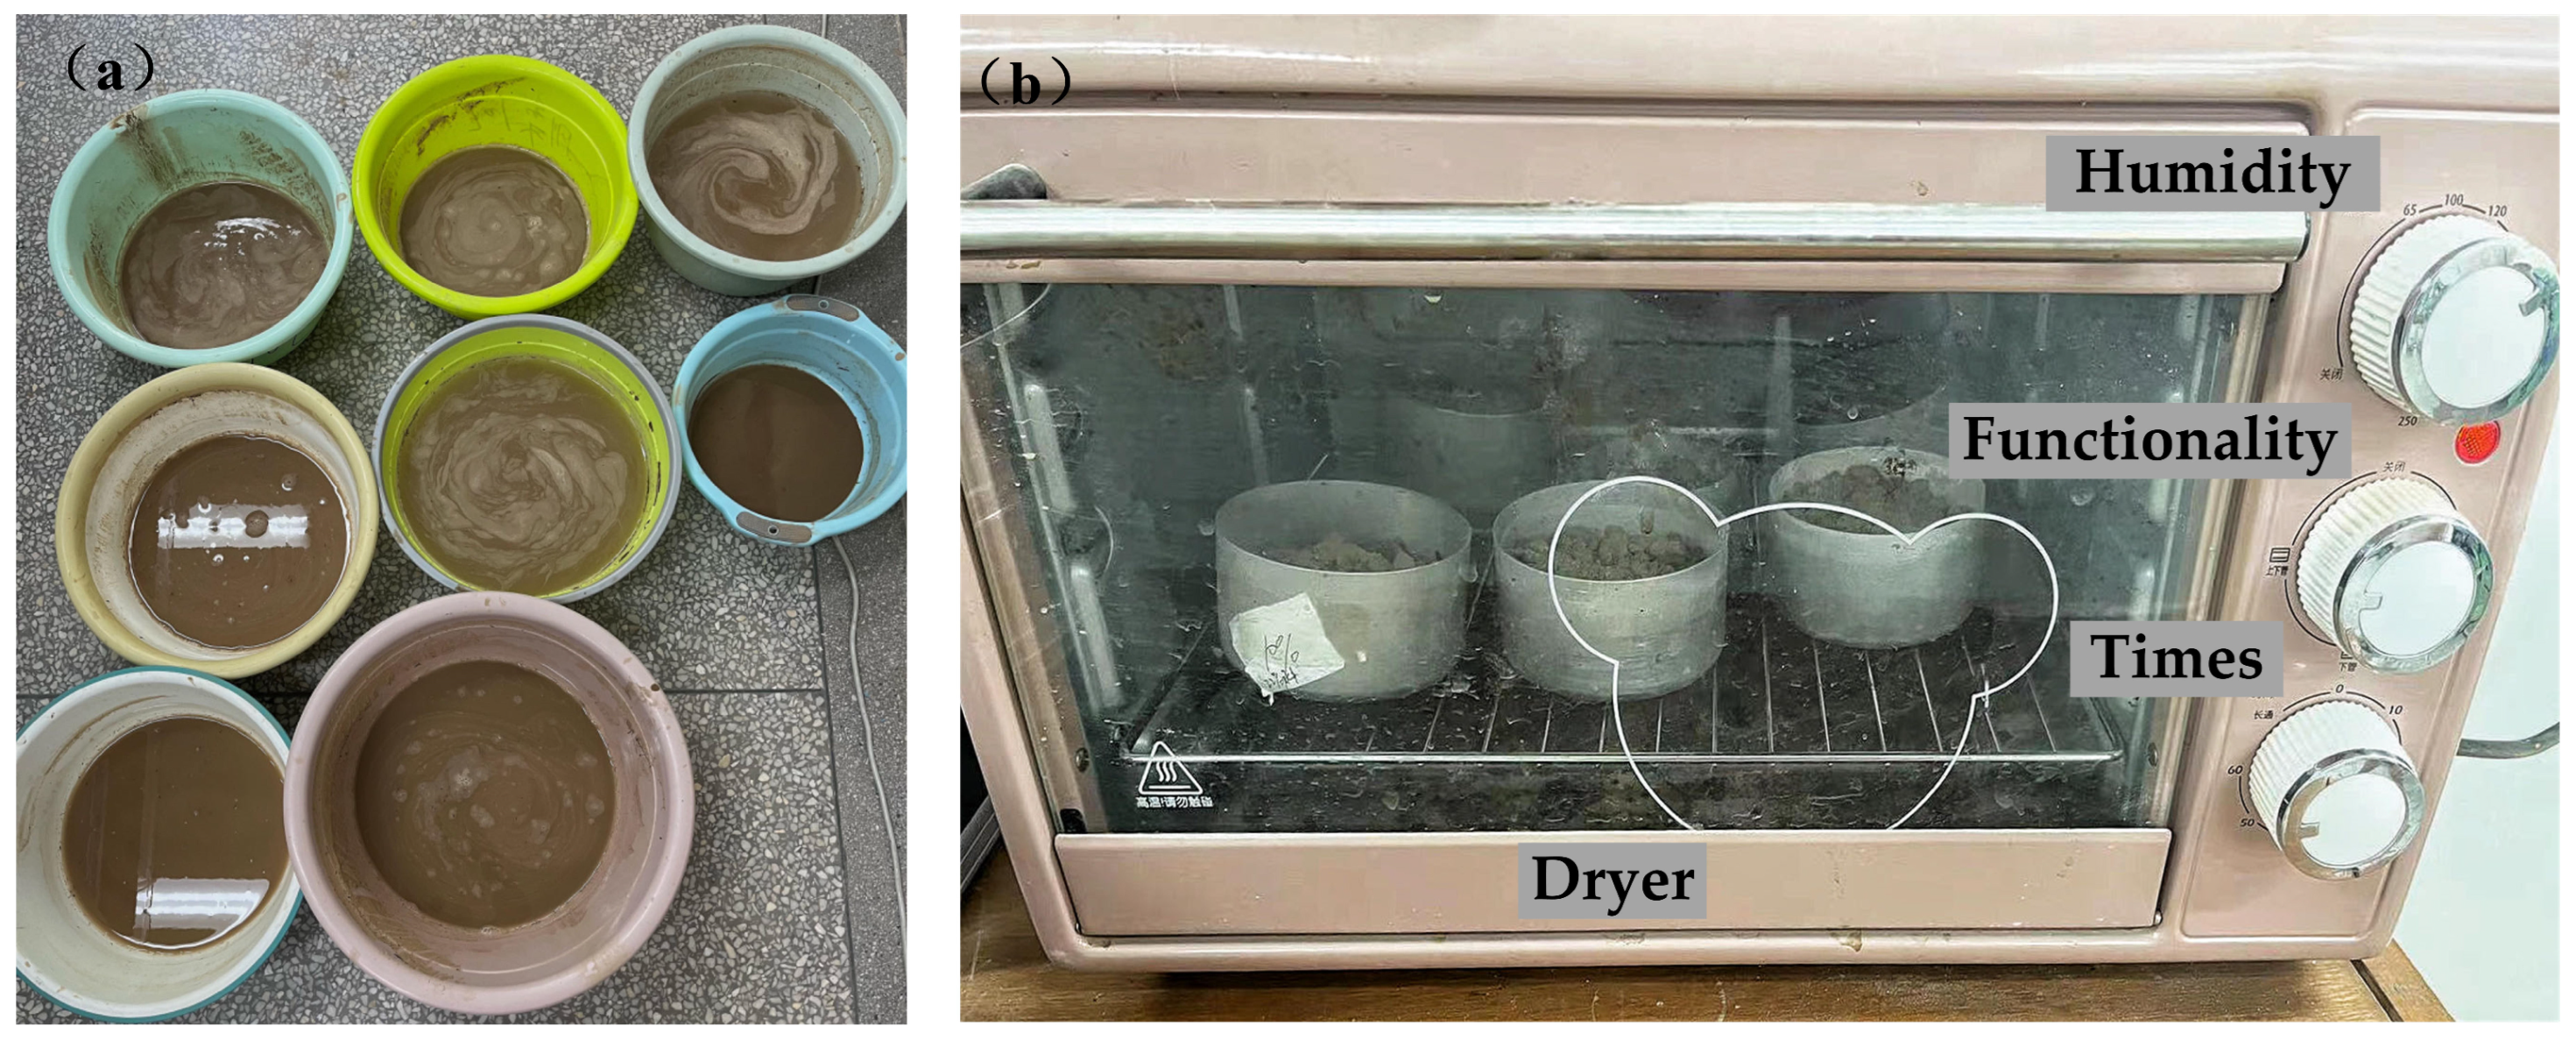
The test flume was 0.3 m wide and 3 m long, and the slope was divided into three sections from top to bottom, of which 0–1 m was the transition zone for water discharge the middle 1 m was the vegetation zone, and the test was set up with three different gentle slopes of 2°, 4°, and 6°, respectively. Before the test, 3 cm of 0–5 mm diameter gravel was placed at the bottom of the flume and 10 cm of Q3 Malan topsoil from the study area was placed on top to ensure that the permeability of the test soil layer was close to that of the natural slope by compacting and burrowing the soil layer at each fill. The flow rate was controlled by a series of valves and the water flow entered from the top of the channel. Five test flow rates were set, taking into account the actual situation and test conditions, which were 6 L/min, 12 L/min, 18 L/min, 24 L/min, and 30 L/min, respectively. Gradient and flow rates were adjusted to design values before each test, and full sediment samples were collected at the outlet of the flume after the slope surface had given way to the flow. At the end of the test, each sediment sample was weighed and recorded. The sediment samples were then stirred thoroughly, the supernatant was poured off after 24 h of standing, and the sediment content was determined by the drying method (shown in Figure 3) in order to calculate the amount of erosion and runoff from the slopes under different vegetation arrangements.
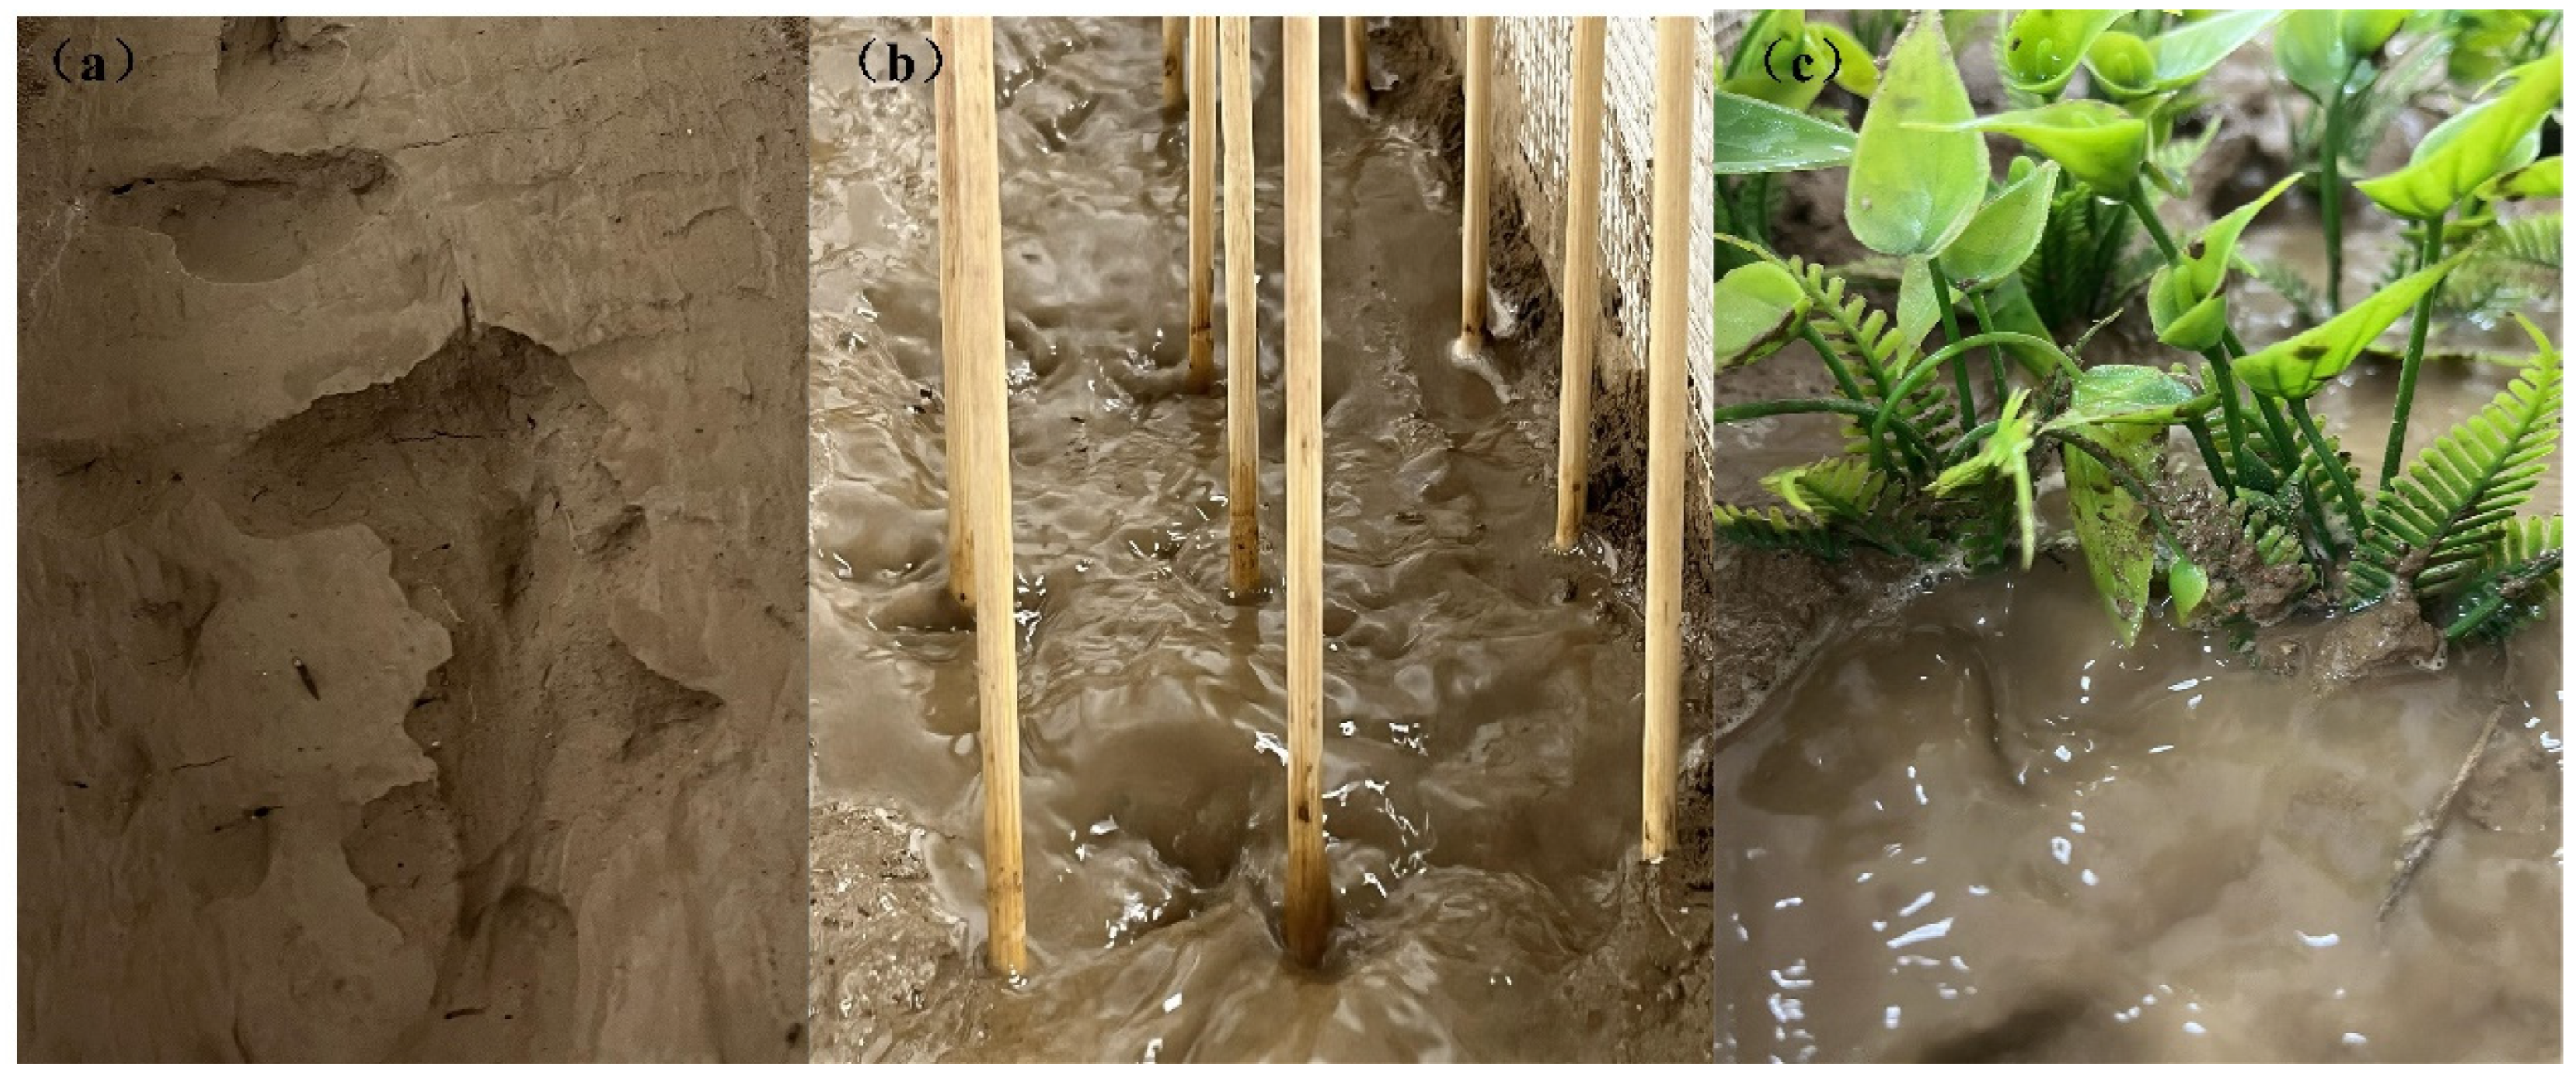
According to the test requirements, different types of vegetation combinations were constructed, and two types of vegetation, rigid and flexible, were selected for the test. In the test, the rigid vegetation (e.g., sea buckthorn, willow, etc.) in the study area was simulated by using a round wooden stick with a diameter of 6 mm, which had a vegetation height of 13.8 cm under the inundated state; meanwhile, plastic simulated grasses were used to simulate the natural flexible herbaceous vegetation (e.g., iceweed, timothy grass, alfalfa, etc.), which had an average height of 5 cm under the inundated state. The vegetation density in this experiment was set at 50 plants per square metre, and six vegetation combinations were set up: rigid vegetation single combination (GX), flexible vegetation single combination (RX), upstream rigid downstream flexible combination (UG), rigid–flexible single-row staggered combination (DJ), rigid–flexible double-row staggered combination (SJ), and a bare slope control group (BS) (Figure 4).

3. Theoretical Analyses

3.1. Slope Runoff Sand Production Analysis

Slope runoff belongs to the category of thin-layer water flow. Runoff transport sediment’s main mode of movement is in the form of nudging mass movement, under the action of runoff water flow and the sediment surface, as viscous or relative motion produces friction, because water flow turbulence will also give sediment particles shape resistance. In general, shape resistance and friction together are called the drag force (FD), which is calculated by the following formula:
F D = 1 2 K 1 C D ρ d 2 u s 2
where CD is the drag coefficient; K1 is the shape coefficient when the sediment particles are spherical, K 1 = π 4 ; us is the flow rate; ρ is the density of water; d is the mean particle size of the particles. Therefore, Equation (2) is as follows:
F D = π 8 C D ρ d 2 u s 2
The uplift force is a force generated by the difference in flow velocities at the top and bottom of sediment particles in water. As the water flows around the sediment, the flow velocity at the top of the particles is greater than the flow velocity at the bottom, and the sediment particles are subjected to the water flow to give the uplift force (FL), which is calculated by the following formula:
F L = π 8 C L ρ d 2 u s 2
where CL is the coefficient of buoyancy.
Sediment particles exist between the physical and chemical properties of the granular material related to the force, known as the binding force (FC). The binding force of particles is much smaller than gravity, and the role of binding force is significant among fine particles. Yao Wenyi et al. [40] concluded that the cohesive force can be expressed by the following equation:
F C = A c f c
where Ac is the area of the sediment particle on which the binding force acts; fc is the binding force per unit area.
Sediment particles are subject to gravity (FG) and buoyancy (FW) in the flow, which are expressed as follows:
F G = π 6 ρ s g d 3
F W = π 6 ρ g d 3 cos θ
where ρ s is the density of the sediment particles; θ is the slope.
The interaction force between sediment particles is called additional mass force. The additional mass force (FM) generated by relative exposure must be taken into account for river sediment, and it gives an expression for (FM) for uniform sediment particles, as follows:
F M = π 6 ξ ( ρ s ρ ) g d 3
where ξ is a coefficient related to relative exposure and is the distance between the lowest point of a surface sediment particle and the highest point of a downstream subsurface sediment particle in a uniform sediment particle, as follows:
ξ = 2 Δ = 1 cos θ
At the same time, in slopes under vegetation cover, sediment particles are affected by the resistance FZ of the vegetation stems and leaves to them. During runoff sand production, soil water is generally considered to be saturated. At this time, the infiltration effect of water flow is very small, so it is ignored in the calculation of infiltration pressure and the influence of sediment movement, Figure 5 shows the runoff sand production force force analysis. Therefore, the analysis of runoff sand production force can be obtained as follows:
F D + F G sin θ = ( F G cos θ F W F L F M ) tan φ + F C + F Z
Equations (1)–(9) are obtained, resulting in the following Equation (10):
ρ u s 2 g d ( ρ s ρ ) = λ tan φ 1 cos θ ρ s ρ s ρ sin θ + λ F C + F Z k 3 g d 3 ( ρ s ρ )
In the style, Equation (11) is as follows:
λ = 2 k 3 k 1 C D + k 2 C L tan φ
where φ is the friction angle between particles.
The above equation shows that the slope runoff shear force under vegetation cover τ = F φ , θ , ρ s , ρ , F C , F Z . It can be seen that the erosion process experienced by the soil particles on the slope surface is the result of the combined effect of gravity downward traction, the adhesive force between soil particles to maintain the stability, the uplift force of the water flow to try to peel it off, as well as the resistance generated by vegetation through the canopy and the root system. This complex interaction mechanism profoundly affects the stability of the slope and the dynamics of soil erosion. Eroding soil particles on slopes are affected by gravity, cohesion, uplift forces, and vegetation resistance.

3.2. Data Calculation

(1) Runoff shear: Runoff shear is the tangential force exerted on the ground surface or streambed by the viscous and inertial action of water flowing along the surface. In slopes, the equation for runoff shear is usually expressed as follows:
τ = ρ g h J
where ρ is the density of water flow, kg/m3; h is the depth of runoff, m; J is the hydraulic gradient.
(2) Runoff power: Runoff power reflects the ability of water to erode the surface of the ground and transport sediments, and is expressed as follows:
Φ = τ V
where V is the runoff flow rate, m/s.
(3) Unit runoff power: Unit runoff power is the rate of change in the reduction in potential energy per unit weight of water with time. Its expression is as follows:
P = V J
(4) Sediment attenuation rate by vegetation: The sediment attenuation rate by different combinations of vegetation can be calculated using the following formula:
E = Y B Y Z Y B × 100 %
where E is the erosion reduction rate, and YB and YZ denote the cumulative amount of sediment on bare slopes and vegetated slopes with different arrangements, kg, respectively.

4. Analysis of Results

4.1. Characteristics of Changes in Slope Erosion Sand Production

In the study of slope erosion, the changing characteristics of sand production is an important aspect of understanding soil erosion mechanisms. The dynamics of sand production on slopes is influenced by a variety of factors, including slope gradient, vegetation arrangement, and soil physical properties. The interaction of these factors determines the erosive capacity of water flow and the sediment transport path. Figure 6 and Table 2 summarize the erosion of slope runoff, the average sand yield and the average erosion reduction rate for different slope gradients and different vegetation configurations.
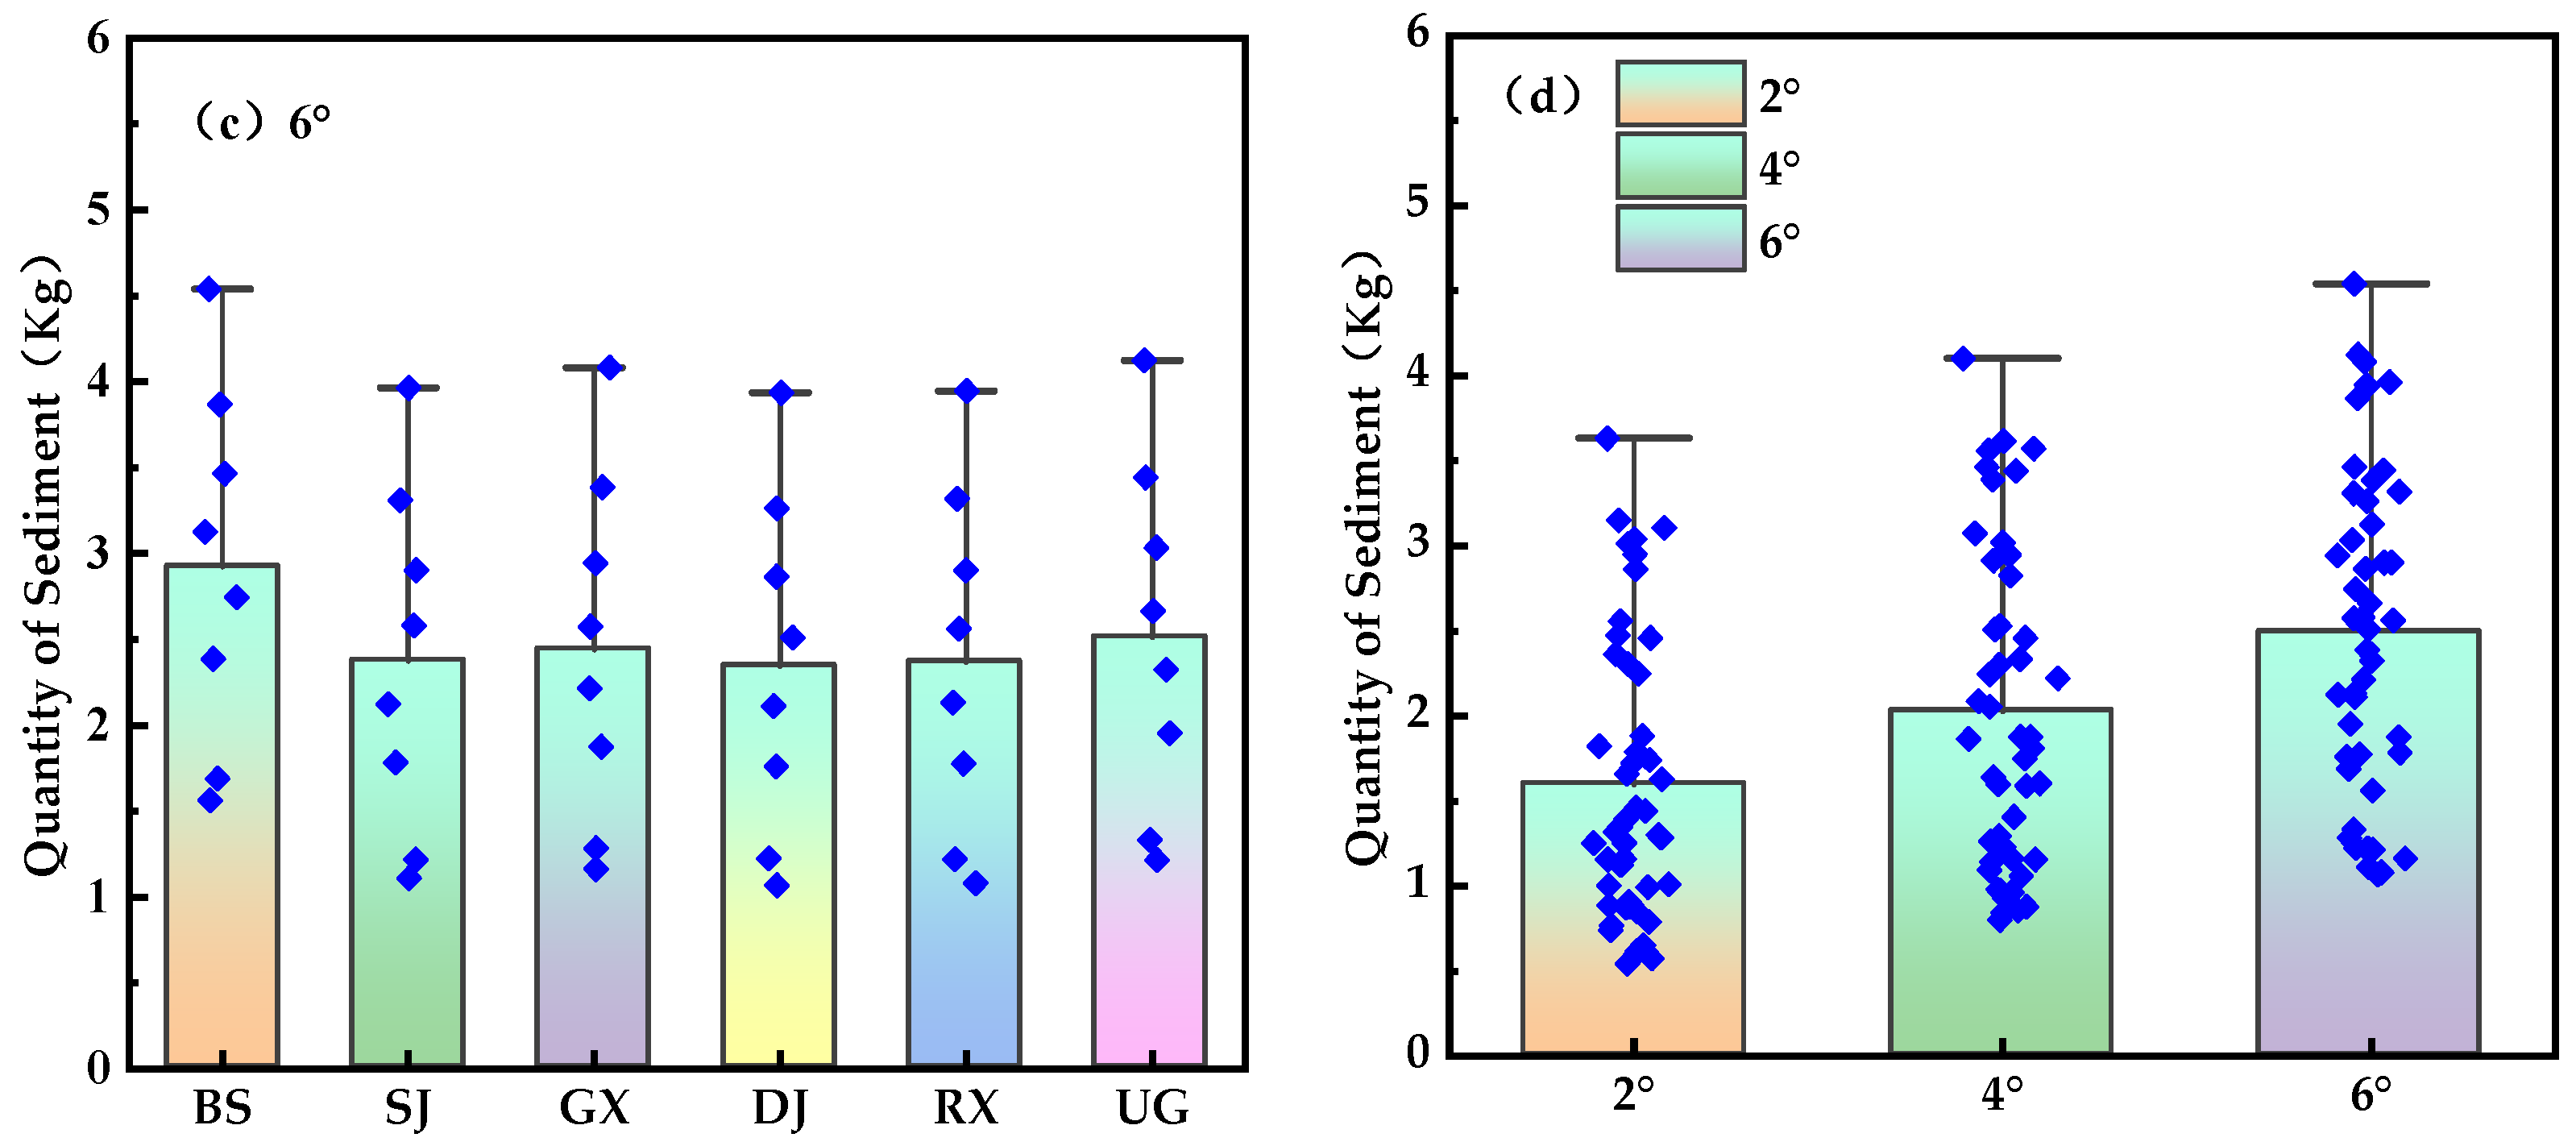
With the increase of slope and flow, the sand production on the slope showed an obvious upward trend, indicating that the slope and flow had a significant effect on the sand production of the slope vegetation configuration pattern, and Figure 7 shows the variation of sand production of different vegetation configuration patterns under different slopes. Specifically, when the slope is 2°, the average sand production under different vegetation configurations is 1.43~1.61 kg; when the slope increases to 4°, the average sand production rises to 1.85~2.06 kg; and when the slope further increases to 6°, the average sand production reaches 2.06~2.51 kg. It can be seen that the increase in the slope and flow rate will significantly increase the sand production of slopes, which will exacerbate soil erosion. The results of the study further confirmed that vegetation configuration is a key factor in controlling soil erosion, and significant differences can be observed by comparing the sand production on slopes with different vegetation configurations. Specifically, the configuration with rigid vegetation upstream and flexible vegetation downstream resulted in the greatest sand production, indicating that this configuration is relatively ineffective in slowing down water flow and controlling sediment loss. On the contrary, the single-row staggered configuration and the flexible vegetation configuration had the lowest sand production, and these configurations were able to effectively slow down the water flow rate and increase sediment deposition, thus showing a superior effect in controlling soil erosion on slopes. Increasing the slope gradient changes the slope flow characteristics and vegetation resistance effect. Rigid vegetation, with its higher structural stiffness, may find it more difficult to adapt to changes in water flow when the slope increases, leading to an increase in water flow bypass and weakening the vegetation’s ability to stop sand. Flexible vegetation, on the other hand, is better able to adapt to fluid deformation and reduce the velocity of water flow, which in turn enhances the sediment deposition effect. The related literature also points out that certain factors, such as the structural characteristics of vegetation, root distribution, and the degree of oscillation in the water flow, have an important influence on the soil and water conservation effect [41,42,43]. These mechanisms explain the advantages of a single-row staggered configuration of rigid and flexible vegetation in terms of erosion reduction at higher slopes.
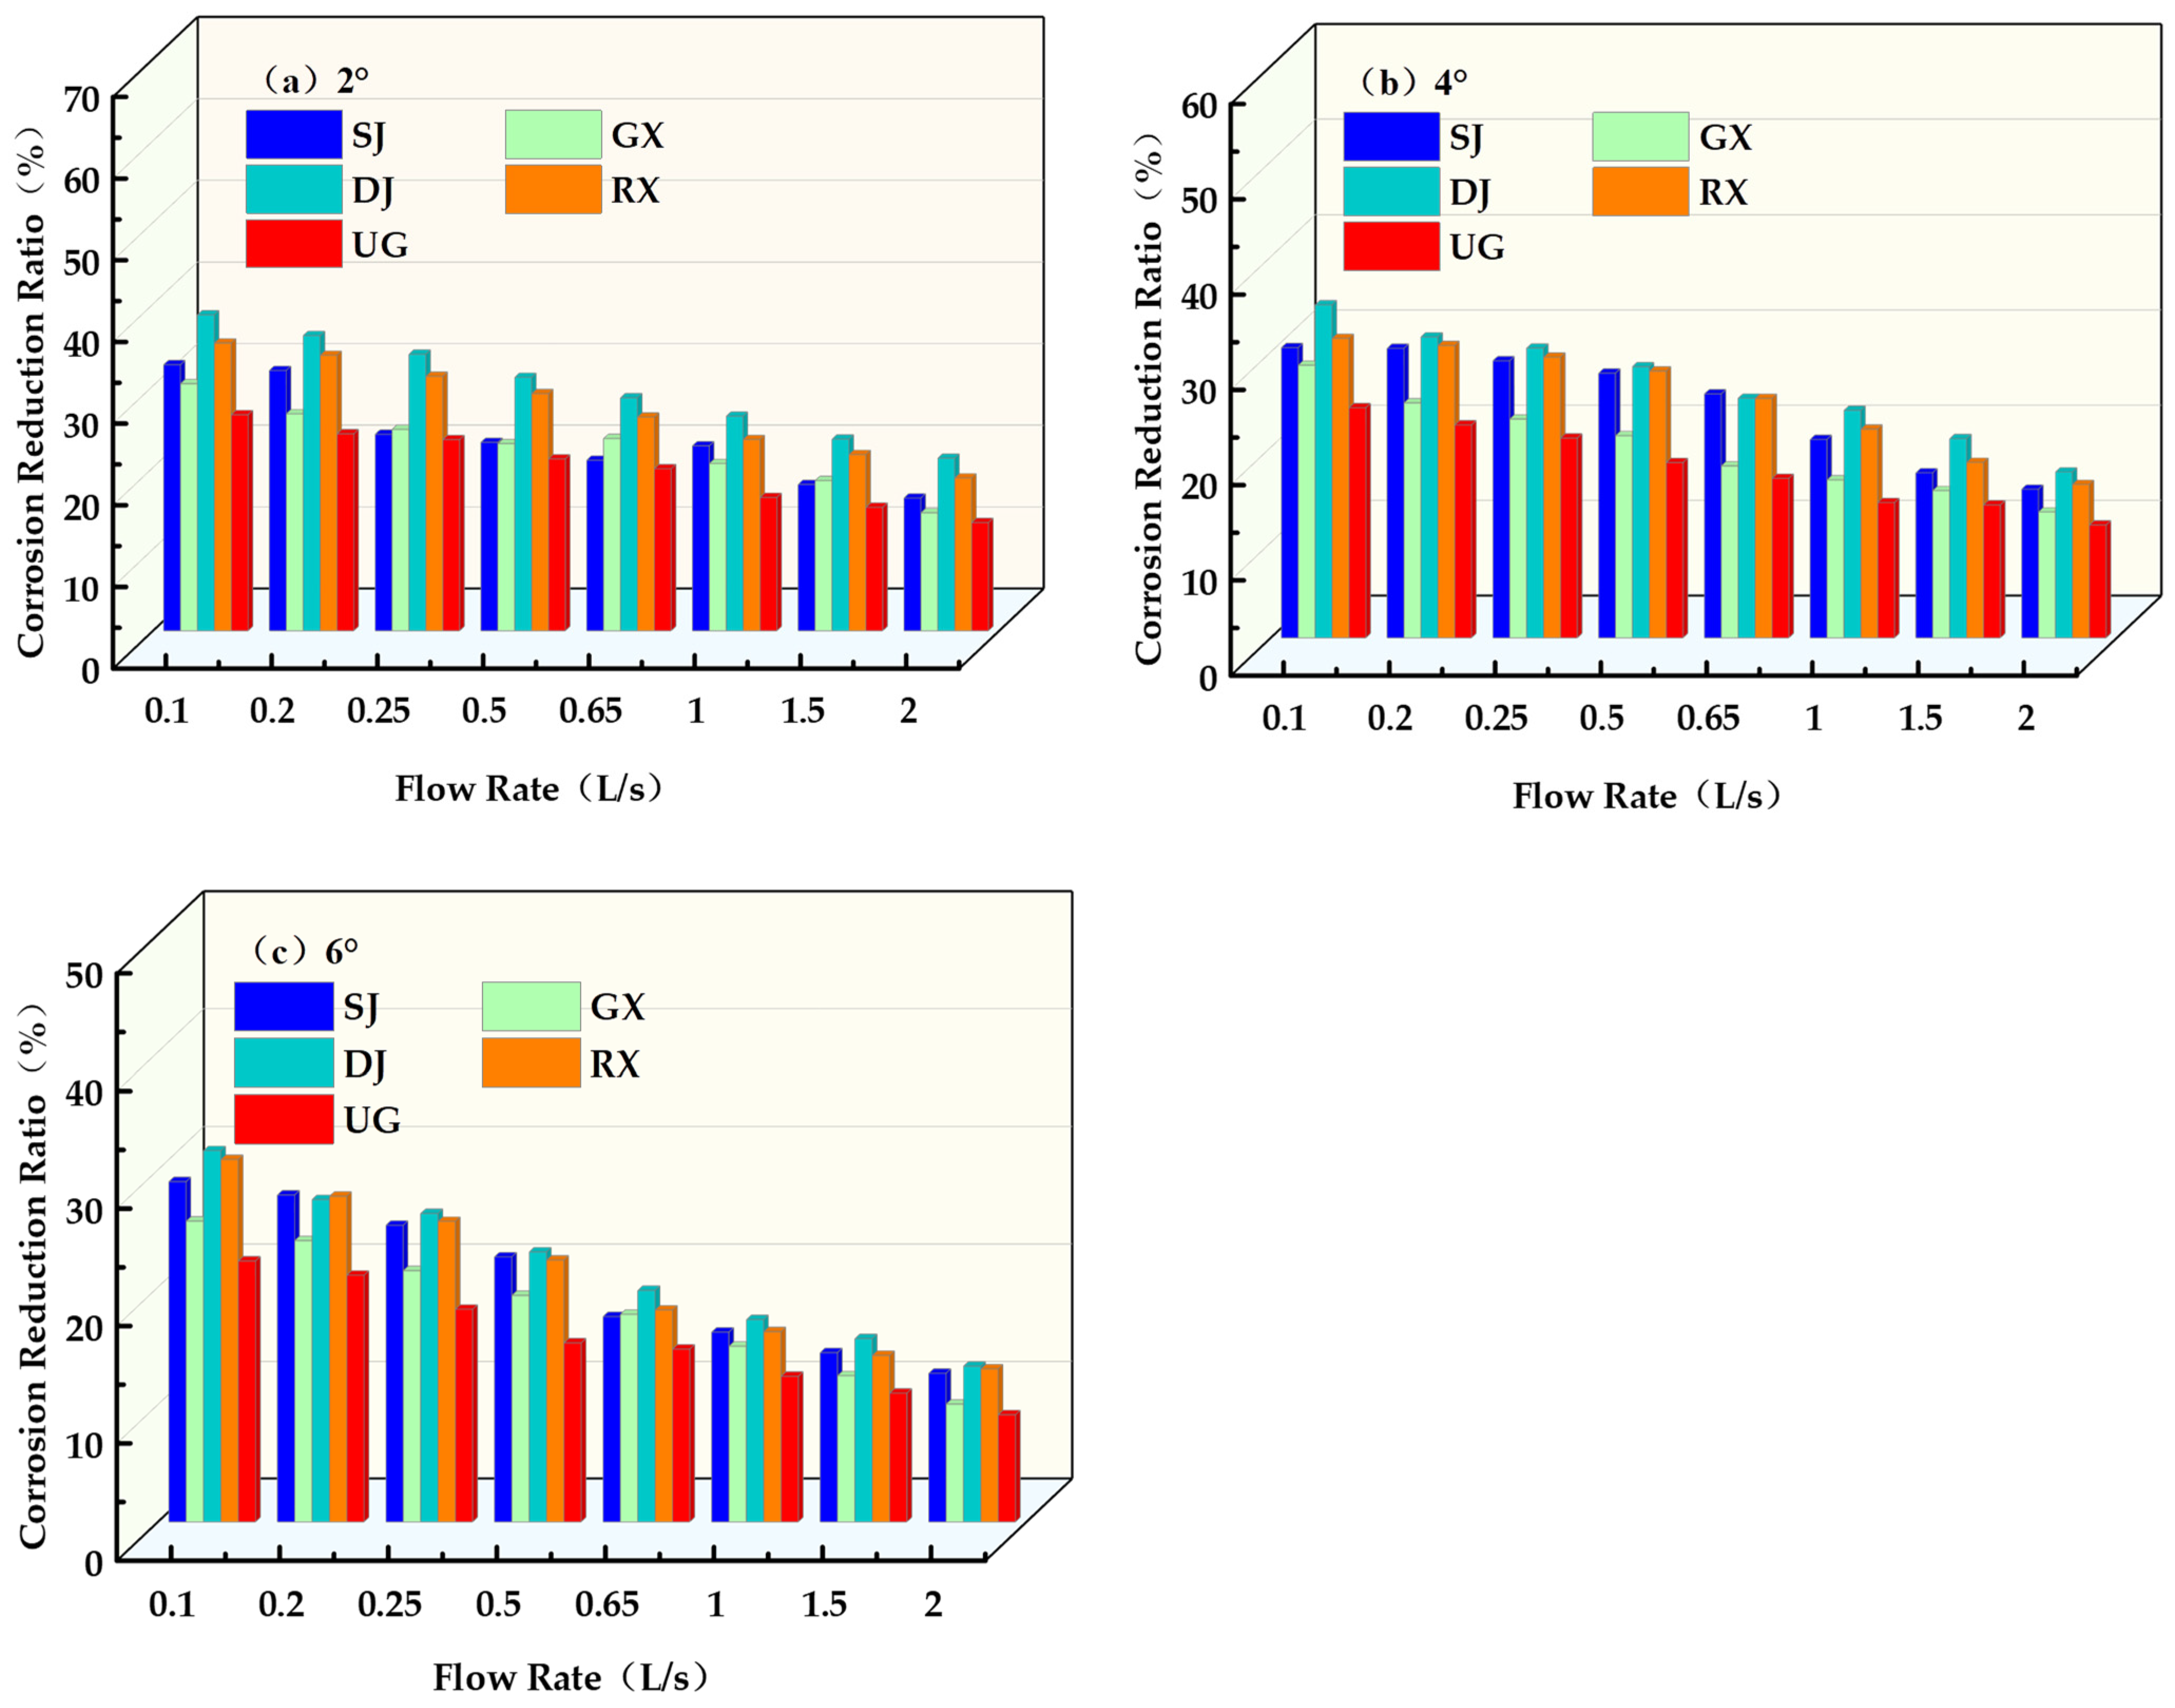
Figure 8 shows the erosion reduction effect under different vegetation configurations at different slopes, from which it can be concluded that the erosive effect of different vegetation configurations on slope sediments are all weakened with the increase of flow rate and slope, which is mainly due to the fact that with the increase of slope, the energy and flow rate of the water flow increase significantly, which exacerbates the scouring effect of the water flow on the soil. This enhanced hydrodynamic action not only weakened the sediment interception capacity of the vegetation, but also resulted in soil particles being more easily stripped and transported, thus intensifying the erosion process of the slope soil. The experimental data showed that changes in slope had a significant effect on the erosion reduction rates of different vegetation configurations: when the slope was 2°, the erosion reduction rates of the vegetation configurations ranged from 19.96% to 29.89%; when the slope was 4°, the erosion reduction rates decreased, ranging from 17.84% to 26.6%; and when the slope was increased to 6°, the erosion reduction rates further decreased, ranging from 15.49% to 21.76%. This indicates that under lower slope conditions, the velocity and kinetic energy of water flow are relatively low, and the vegetation can perform its sediment interception and deposition function more effectively, thus significantly reducing the soil loss on the slope. Further analyses showed that there were significant differences in the erosion reduction effects of different vegetation configurations. Specifically, the DJ configuration was the most significant in reducing sediment loss from the slope. In contrast, the UG and GX configurations, with their relatively weak sand retention effect, had a weak soil erosion control effect.

4.2. Hydrodynamic Parameters

Compared with bare slopes, vegetation-covered slopes can significantly increase runoff water depth, and this effect shows obvious differences under different vegetation combination methods. Through ANOVA (analysis of variance) and regression analysis, the effect of flow on the change of water depth of side slopes can be deeply revealed, and Table 3 demonstrates the relationship between water depth and flow under different slopes. The results showed that regardless of the presence or absence of vegetation cover, there was a power function increasing relationship between slope flow water depth and flow rate (R2 > 0.98), i.e., with the increase in flow rate, the slope water depth increased significantly. This pattern was verified under various vegetation configurations, indicating the broad applicability of vegetation in water depth regulation. Specifically, the presence of vegetation was able to significantly increase the slope water depth by a factor equivalent to 0.086 to 0.22 of the bare slope [44]. This increase may be attributed to the fact that vegetation slows down the surface runoff rate, thus prolonging the residence time of water on the slope and increasing infiltration, leading to an increase in water accumulation. In addition, the effect of different vegetation arrangements on water depth varied. Under the same flow conditions, the DJ combination approach was more effective in increasing the water depth on the slope than other arrangements. This may be due to the fact that staggered vegetation can disperse the water flow more evenly and lengthen its path, increasing the residence time of water on the slope. In addition, the change in slope had a significant effect on water depth. It was found that the water depth tended to decrease as the slope increased, which was related to the increase in water velocity at larger slopes. However, even on steeper slopes, vegetation cover was still able to maintain higher water depths to some extent, highlighting the key role of vegetation in runoff regulation. In order to further verify the above conclusion, the study used regression analysis to validate the results of the water depth test. The regression analyses showed high consistency (R2 > 0.9) between the measured values and the regression fitted values, which indicates that the test data have high reliability and validity, and that the conclusions of the study have a solid scientific basis.
The flow velocity is one of the key hydrodynamic elements affecting the erosion capacity and sand carrying capacity of slope runoff. According to the data in Table 4, there is a significant regression relationship between flow rate and flow velocity under different slope conditions, and the experimental results show that the flow rate of slope runoff tends to increase with the increase in flow rate (R2 > 0.94). Figure 9 further demonstrates the moderating effect of vegetation cover on slope flow rate. Specifically, the increase in flow rate was relatively slow on slopes covered with vegetation. As the flow rate increased, the differences in the effects of different vegetation combinations on the flow rate gradually decreased, and overall, the average flow rate on the vegetated slopes slowed down by between 8.6% and 21.9% compared to the bare slopes. This phenomenon may be related to the alteration of microtopography on the slope surface by vegetation, which causes the slope surface to be uneven due to vegetation cover, altering the kinetic characteristics of water flow and, thus, affecting the flow velocity. In addition, the average flow rate showed an increasing trend with increasing flow rate, both for the vegetation-covered slopes and the bare slopes. This suggests that flow is one of the main factors affecting flow velocity on slopes, while vegetation cover mitigates the rapid increase in flow velocity to some extent, thus having a moderating effect on the erosive effects of water flow.

4.3. Characteristics of Runoff Shear Change

Runoff shear is a commonly used hydrodynamic parameter in erosion modelling to describe the extent of soil erosion [45], and it is one of the comprehensive indicators for determining the intensity of sand production by erosion on slopes [46]. Within the slope range of this test, the runoff shear increased with increasing flow rate (Figure 10), and under the same slope conditions, it was found that the water flow shear tended to increase exponentially with increasing flow rate (R2 > 0.98) (Table 5). When the flow rate increases, the kinetic energy of the water flow increases, resulting in enhanced water flow shear. This enhanced shear accelerates the erosion of slope soils, which in turn affects the stability of the slope. In addition, this trend can be attributed to the dispersing and blocking effect of vegetation on runoff. Vegetation significantly increases the roughness coefficient of the surface by creating resistance to surface runoff through its root system and foliage.
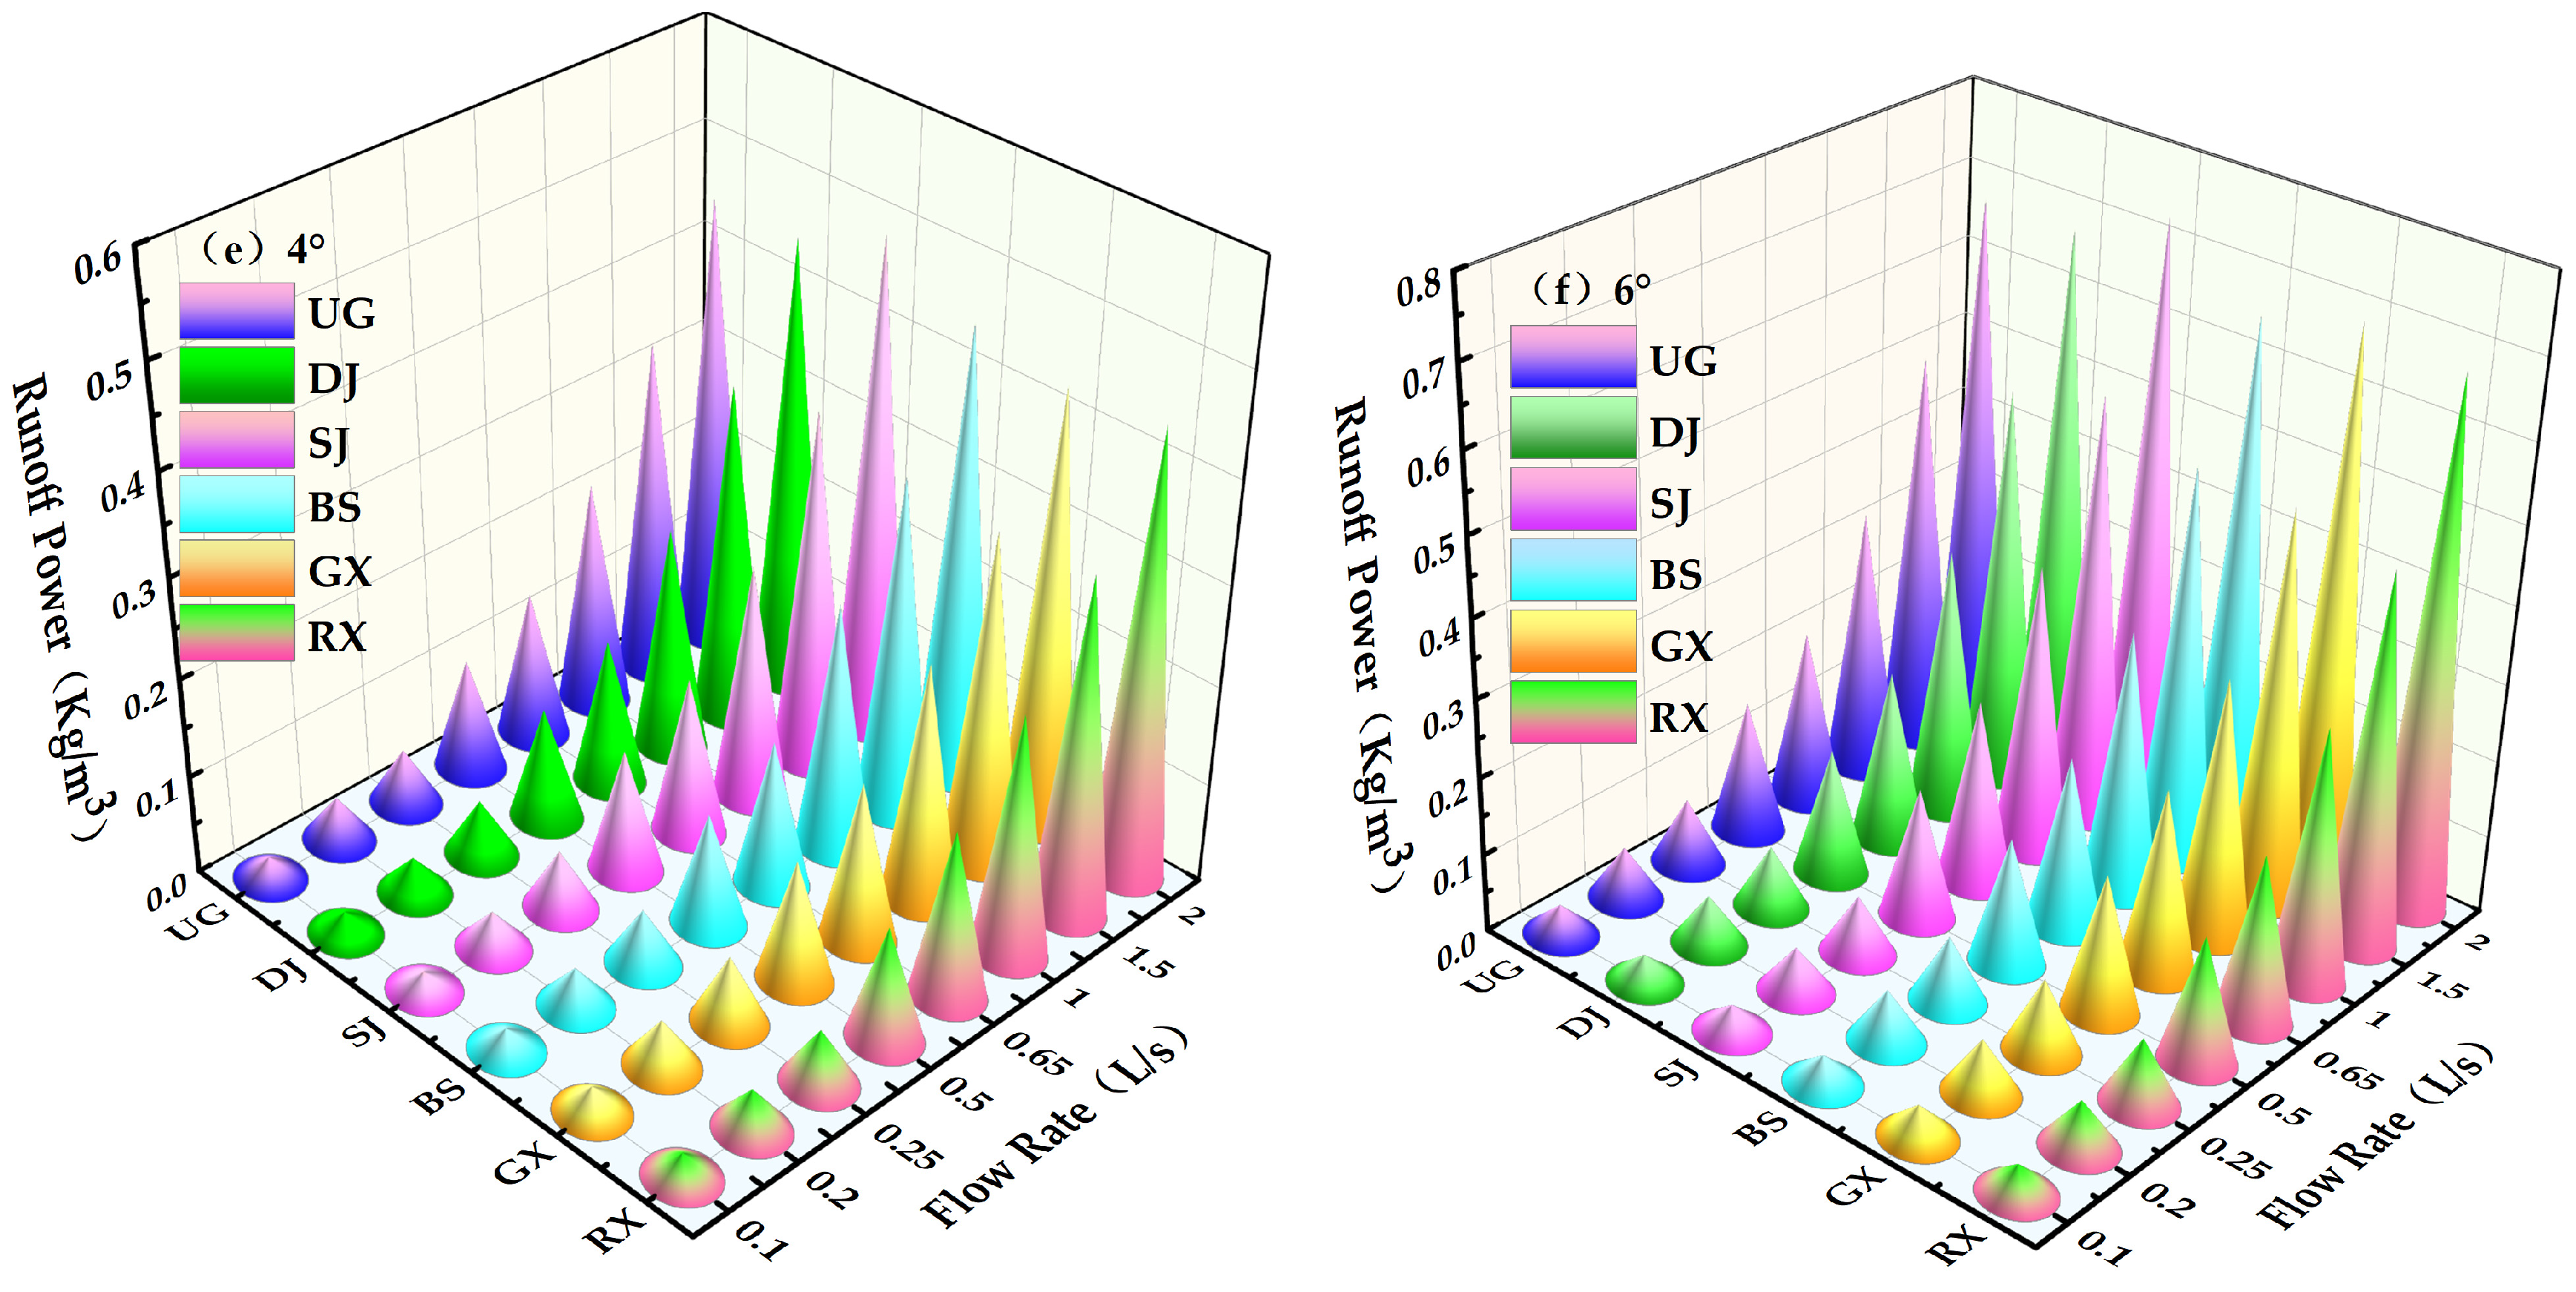
The effect of different vegetation configurations on runoff power and unit runoff power should not be ignored. Both runoff power and unit runoff power showed a significant increase with the increase in water discharge flow. Figure 11 demonstrates the trends of unit runoff power and runoff power with flow rate at different slopes. This phenomenon is mainly due to the fact that the increase in water release flow rate directly leads to the increase in runoff single width flow rate, which enhances the flow rate of water. Specifically, with the increase in water release flow rate, the kinetic energy of the water flow also increases, and the velocity of the water flow is accelerated accordingly, resulting in the increase in energy transfer per unit time, which leads to the significant increases in runoff power and unit runoff power. In this paper, the relationship between flow rate and runoff power for different vegetation configurations was fitted, and it can be concluded from Table 6 that a linear functional relationship was found to exist between the two (R2 > 0.95), which indicates that there is a significant relationship between runoff shear force and runoff power and flow rate under different vegetation configurations, and that under different slope vegetation modes, the pavement of slopes with vegetation can effectively reduce the amount of runoff volume and the energy generated in the process of runoff migration. Ultimately, it reduces the sediment content in the runoff. Different vegetation arrangement modes, such as RX and UG, show different sand reduction effects. Generally speaking, the DJ vegetation pattern can effectively control runoff and sediment transport by combining deep root consolidation and surface cover, and achieve better soil and water conservation.

5. Discussion

Vegetation construction plays a crucial role in soil and water conservation and sediment control in loess areas [47]. Vegetation cover not only affects the onset time, flow rate, and volume of runoff on slopes, but also directly relates to the change in soil erosion rate [24], and vegetation is an effective way to fight against erosion [48]. Vegetation significantly reduces soil erosion and sediment loss by intercepting precipitation and slowing down the rate of surface runoff [49]. There are significant differences between the effects of rigid and flexible vegetation on the hydrodynamic characteristics of slopes. Firstly, rigid vegetation can provide stronger resistance under higher flow values, Reynolds number, and water depth conditions due to its solid structure, resulting in a fluctuating decrease in the total energy of slope flow compared to the bare slope [31], showing a good buffering effect, which in turn effectively reduces slope erosion and improves soil and water conservation capacity. In contrast, flexible vegetation is prone to bending, inverting, and deflecting under the action of water flow, which makes its influence on the hydrodynamic characteristics of the slope surface more complicated. The average flow rate under flexible vegetation cover is more susceptible to changes in flow rate, and the influence of the distribution of flexible vegetation in different locations at the top, middle, and bottom of the slope on the flow rate gradually diminishes with the increase in rainfall intensity [50]. In terms of flow rate, the flow rate in the grass-covered area was significantly lower than that in the bare area, and the flow rate at the bottom of the slope was significantly higher than that at the top of the slope [51]. Therefore, the way of vegetation combination plays an important role in controlling slope erosion.
There are also some differences in the sand reduction benefits of rigid and flexible vegetation. When the vegetation is located in the middle and lower part of the slope, the longer runoff path slows down the flow of water through the vegetation, which results in more effective sediment deposition and reduced erosion intensity. This arrangement has shown more significant effects in slowing down the flow to intercept sand and stagnant flow to dissipate energy than when the vegetation is located in the upper part of the slope [52]. The sand reduction effect of grasses is particularly pronounced at larger slopes (e.g., 30°), indicating that vegetation has a more powerful effect on the dissipation of flow energy at higher slopes [53]. In addition, vegetation cover has a significant effect on sand production. With the increase in vegetation cover, the flow rate and sand production rate of the slope decreased significantly, indicating a significant negative correlation between vegetation cover and sand production. When the vegetation cover was high, the vegetation resistance on the slope increased and the water flow rate slowed down, thus reducing the sand-carrying capacity of the water flow [54]. These findings suggest that vegetation enhances soil and water conservation by effectively trapping sediments, a finding that is consistent with previous studies [33,55]. In addition, it was shown that the spatial pattern, density and canopy structure of vegetation patches had significant effects on water flow dynamics. Vegetation patches with higher densities and complex canopy patterns were able to provide greater canopy resistance, which not only changed the flow structure but also enhanced sediment interception. The effect of canopy resistance on water flow and sediment interception was more significant than the change in sediment grain size [56]. Therefore, enhancing canopy resistance by optimising vegetation configuration is an effective strategy for achieving soil and water conservation. When the ratio of rigid and flexible vegetation is 1:2, the soil loss on the slope reaches its minimum and shows the best soil and water conservation effect [57]. Different vegetation configurations can lead to significant differences in sand production on slopes [58]. In this study, bare slopes had the highest sand production, while slopes with single-row interlocking vegetation configurations had the lowest sand production. In particular, the combination of rigid and flexible vegetation, especially in the two-row staggered configuration, significantly improved the sand reduction on the slopes. In contrast, a rigid vegetation arrangement only upstream of the slope and a flexible vegetation arrangement downstream were relatively less effective in sand reduction. This may be due to the limited variation in hydrodynamic parameters of the vegetation at higher flow velocities, leading to a decrease in the sand reduction benefit. Under the conditions of gentle slopes with gradients of 2°, 4°, and 6°, the sand production under different vegetation arrangements showed an increasing trend with the increase in flow rate. This suggests that although vegetation has a significant effect on soil and water conservation under certain conditions, its effectiveness decreases under high flow conditions. Therefore, for high-flow environments, vegetation alone may not be sufficient for effective erosion control, and other soil and water conservation measures need to be combined to enhance the overall erosion resistance.
Future research should strengthen the quantitative analysis of the differences in slope erosion patterns caused by different vegetation configurations and should not only explore the effects of the above-ground and below-ground parts of the vegetation and the soil structure on slope erosion but should also study, in depth, the relationship between the erosion resistance of the vegetation and the improvement of soil erosion resistance, and establish a corresponding evaluation model. These studies will contribute to a more comprehensive understanding of the role of vegetation in regulating slope runoff and sedimentation processes.

6. Conclusions

Through theoretical analyses and indoor discharge scour tests, this study examined the changes in slope runoff and sand production under three slopes (2°, 4°, and 6°) and six vegetation configurations (rigid vegetation single combination, flexible vegetation single combination, upstream rigid downstream flexible combination, rigid–flexible single-row staggered combination, rigid–flexible double-row staggered combination, and a bare slope control group). The results showed that slope erosion and sand production were closely related to vegetation resistance, runoff shear, and gravity. Under different vegetation configurations, sand production increased significantly with increasing slope and runoff volume, indicating that slope and flow intensity are the main factors affecting erosion and sediment yield. Under the conditions of low slope and low flow, the vegetation can effectively slow down the runoff rate and intercept the sediment, showing obvious protective effects. Test results showed that vegetation configurations could reduce total sediment yield by between 19.96 and 29.89 per cent. However, when the slope increased, the sediment output increased significantly regardless of the vegetation configuration. This study suggests that the rigid–flexible single-row staggered vegetation configuration should be prioritized for the management of slope erosion in loess areas, as it has the best performance in terms of sand reduction, can effectively reduce slope erosion and sediment loss, and provides a scientific basis and technical support for ecological restoration and soil and water conservation in the Loess Plateau.

Author Contributions

H.T. developed the research idea, F.W. wrote the manuscript, Z.B. and D.Z. performed the experimental manipulations, and S.B. and X.S. handled the data processing. All authors have read and agreed to the published version of the manuscript.

Funding

This study was supported by the research project on the destabilisation mechanism of impact-damaged loess landslides based on differences in spatial structure (52360031), the Lanzhou Jiaotong University–Tianjin University Joint Innovation Fund (LH2023008), the Gansu Higher Education Institutions’ Science and Technology Support Programme Project (2022CYZC-32), the Gansu Provincial Water Conservancy Science and Technology Extension Programme Project ’Biological Afforestation Efficient Utilisation Technology Research’ support, Technology Innovation Guidance Programme-Science and Technology Specialist Special Project (23CXGA0074), and the Gansu Provincial Water Conservancy Science and Technology Promotion Programme Project “Research on Bio-forestation Technology for Efficient Utilisation of Rainfall-Runoff in Lanzhou New Area” (Gan Water Science and Technology Outreach [2018] No. 70).

Institutional Review Board Statement

Not applicable.

Informed Consent Statement

Not applicable.

Data Availability Statement

The data in this study were the basis for the analysis that we performed.

Conflicts of Interest

The authors declare no conflicts of interest.

References

  1. Liu, G.; Shangguan, Z.; Yao, W.; Yang, Q.; Zhao, M.; Dang, X.; Guo, M.; Wang, G.; Wang, B. Ecological Effects of Soil Conservation in Loess Plateau. Bull. Chin. Acad. Sci. 2017, 32, 11–19. [Google Scholar]
  2. Zhu, H.; Zhao, Y.; Liu, H. Scale characters analysis for gully structure in the watersheds of loess landforms based on digital elevation models. Front. Earth Sci. 2018, 12, 431–443. [Google Scholar] [CrossRef]
  3. Qin, W.; Cao, W.; Guo, Q.; Yu, Y.; Yin, Z. Review of the effects of vegetation patterns on soil erosion and sediment yield. Acta Ecol. Sin. 2017, 37, 4905–4912. [Google Scholar]
  4. Luo, J.; Zhou, X.; Rubinato, M.; Li, G.; Tian, Y.; Zhou, J. Impact of Multiple Vegetation Covers on Surface Runoff and Sediment Yield in the Small Basin of Nverzhai, Hunan Province, China. Forests 2020, 11, 329. [Google Scholar] [CrossRef]
  5. Xu, Q.; Lin, Q.; Wu, F. Comparative Study of the Impacts of Maize and Soybean on Soil and Water Conservation Benefits during Different Growth Stages in the Loess Plateau Region. Land 2024, 13, 1264. [Google Scholar] [CrossRef]
  6. Zhang, S.; Zhang, J.; Liu, Y.; Liu, Y. Effects of farmland vegetation row direction on overland flow hydraulic characteristics. Hydrol. Res. 2018, 49, 1991–2001. [Google Scholar] [CrossRef]
  7. Zhao, C.; Gao, J.; Huang, Y.; Wang, G.; Zhang, M. Effects of Vegetation Stems on Hydraulics of Overland Flow Under Varying Water Discharges. Land Degrad. Dev. 2016, 27, 748–757. [Google Scholar] [CrossRef]
  8. Wu, Y.; Li, N.; Wang, X.; Cui, J.; Chen, Y.; Wu, Y.; Yamamoto, H. Experimental investigation on mechanical behavior and particle crushing of calcareous sand retrieved from South China Sea. Eng. Geol. 2021, 280, 105932. [Google Scholar] [CrossRef]
  9. Mekonnen, M.; Keesstra, S.D.; Stroosnijder, L.; Baartman, J.E.M.; Maroulis, J. Soil conservation through sediment trapping: A review. Land Degrad. Dev. 2015, 26, 544–556. [Google Scholar] [CrossRef]
  10. Guo, W.; Luo, L.; Li, H.; Wang, W.; Bai, Y. Runoff- and erosion-reducing effects of vegetation on the loess hillslopes of China under concentrated flow. Int. Soil Water Conserv. Res. 2022, 10, 662–676. [Google Scholar] [CrossRef]
  11. Saleh, I.; Kavian, A.; Roushan, M.H.; Jafarian, Z. The efficiency of vegetative buffer strips in runoff quality and quantity control. Int. J. Environ. Sci. Technol. 2018, 15, 811–820. [Google Scholar] [CrossRef]
  12. Wu, Y.; Yamamoto, H.; Cui, J.; Cheng, H. Influence of Load Mode on Particle Crushing Characteristics of Silica Sand at High Stresses. Int. J. Geomech. 2020, 20, 04019194. [Google Scholar] [CrossRef]
  13. Zhao, C.; Gao, J.; Zhang, M.; Wang, F.; Zhang, T. Sediment deposition and overland flow hydraulics in simulated vegetative filter strips under varying vegetation covers. Hydrol Process. 2016, 30, 163–175. [Google Scholar] [CrossRef]
  14. Wang, S.; Flanagan, D.C.; Engel, B.A. Estimating sediment transport capacity for overland flow. J. Hydrol. 2019, 578, 123985. [Google Scholar] [CrossRef]
  15. Luo, M.; Pan, C.; Peng, J.; Wang, L. Characteristics of the Sediment Transport Process in Vegetation Hillslopes under Different Flow Rates. Water 2023, 15, 2922. [Google Scholar] [CrossRef]
  16. Zhu, P.; Zhang, G.; Wang, H.; Yang, H.; Zhang, B.; Wang, L. Effectiveness of typical plant communities in controlling runoff and soil erosion on steep gully slopes on the Loess Plateau of China. J. Hydrol. 2021, 602, 126714. [Google Scholar] [CrossRef]
  17. Hou, G.; Bi, H.; Huo, Y.; Wei, X.; Zhu, Y.; Wang, X.; Liao, W. Determining the optimal vegetation coverage for controlling soil erosion in Cynodon dactylon grassland in North China. J. Clean. Prod. 2020, 244, 118771. [Google Scholar] [CrossRef]
  18. Wu, Y.; Cui, J.; Huang, J.; Zhang, W.; Yoshimoto, N.; Wen, L. Correlation of Critical State Strength Properties with Particle Shape and Surface Fractal Dimension of Clinker Ash. Int. J. Geomech. 2021, 21, 04021071. [Google Scholar] [CrossRef]
  19. Kervroëdan, L.; Armand, R.; Saunier, M.; Faucon, M. Effects of plant traits and their divergence on runoff and sediment retention in herbaceous vegetation. Plant Soil. 2019, 441, 511–524. [Google Scholar] [CrossRef]
  20. Wang, B.; Zhang, G. Quantifying the Binding and Bonding Effects of Plant Roots on Soil Detachment by Overland Flow in 10 Typical Grasslands on the Loess Plateau. Soil Sci. Soc. Am. J. 2017, 81, 1567–1576. [Google Scholar] [CrossRef]
  21. Zhao, C.; Gao, J.; Huang, Y.; Wang, G.; Xu, Z. The Contribution of Astragalus adsurgens Roots and Canopy to Water Erosion Control in the Water–Wind Crisscrossed Erosion Region of the Loess Plateau, China. Land Degrad. Dev. 2017, 28, 265–273. [Google Scholar] [CrossRef]
  22. Zhao, J.; Zhu, Z.; Li, W.X. Assessment of fabric characteristics with the development of sand liquefaction in cyclic triaxial tests: A DEM study. Soil Dyn. Earthq. Eng. 2024, 176, 108343. [Google Scholar] [CrossRef]
  23. Fu, S.; Mu, H.; Liu, B.; Yu, X.; Zhang, G.; Liu, Y. Effects on the plant stem arrangement onsediment transport capacity of croplands. Land Degrad. Dev. 2020, 31, 1325–1334. [Google Scholar] [CrossRef]
  24. Han, D.; Deng, J.; Gu, C.; Mu, X.; Gao, P.; Gao, J. Effect of shrub-grass vegetation coverage and slope gradient on runoff and sediment yield under simulated rainfall. Int. J. Sediment Res. 2021, 36, 29–37. [Google Scholar] [CrossRef]
  25. Li, Q.; Zhu, Z. Calibration of an elastoplastic model of sand liquefaction using the swarm intelligence with a multi-objective function. J. Rock Mech. Geotech. Eng. 2022, 15, 789–802. [Google Scholar] [CrossRef]
  26. Zhang, Y.; Zhao, Q.; Cao, Z.; Ding, S. Inhibiting Effects of Vegetation on the Characteristics of Runoff and Sediment Yield on Riparian Slope along the Lower Yellow River. Sustainability 2019, 11, 3685. [Google Scholar] [CrossRef]
  27. Pan, C.; Lan, M.; Wainwright, J.; Shangguan, Z. Overland flow resistances on varying slope gradients and partitioning on grassed slopes under simulated rainfall. Water Resour. Res. 2016, 52, 2490–2512. [Google Scholar] [CrossRef]
  28. Ding, L.; Fu, S.; Liu, B.; Yu, B.; Zhang, G.; Zhao, H. Effects of Pinus tabulaeformis litter cover on the sediment transport capacity of overland flow. Soil Tillage Res. 2020, 204, 104685. [Google Scholar] [CrossRef]
  29. Mu, H.; Yu, X.; Fu, S.; Yu, B.; Liu, Y.; Zhang, G. Effect of stem cover on hydraulic parameters of overland flow. J. Hydrol. 2019, 577, 123964. [Google Scholar] [CrossRef]
  30. Wen, L.; Huang, Z.; Fu, Q.; Xie, W.; Huang, Z.; Wu, Y. Effect of complex-grain-size curves on shear modulus degradation of calcareous sand. Mar. Georesources Geotechnol. 2024, 1–11. [Google Scholar] [CrossRef]
  31. Duan, J.; Liu, Y.; Wang, L.; Yang, J.; Tang, C.; Zheng, H. Importance of grass stolons in mitigating runoff and sediment yield under simulated rainstorms. Catena 2022, 213, 106132. [Google Scholar] [CrossRef]
  32. Li, C.; Pan, C. The relative importance of different grass components in controlling runoff and erosion on a hillslope under simulated rainfall. J. Hydrol. 2018, 558, 90–103. [Google Scholar] [CrossRef]
  33. Zhang, X.; Li, P.; Li, Z.B.; Yu, G.Q.; Li, C. Effects of precipitation and different distributions of grass strips on runoff and sediment in the loess convex hillslope. Catena 2018, 162, 130–140. [Google Scholar] [CrossRef]
  34. Zhang, X.; Yu, G.Q.; Li, Z.B.; Li, P. Experimental study on slope runoff, erosion and sediment under different vegetation types. Water Resour. Manag. 2014, 28, 2415–2433. [Google Scholar] [CrossRef]
  35. Yao, C.; Zhong, H.; Zhu, Z. Development of a Large Shaking Table Test for Sand Liquefaction Analysis. Lithosphere 2024, 2, 137. [Google Scholar] [CrossRef]
  36. Ding, W.; Wang, X.; Zhang, G.; Meng, X.; Ye, Z. Impacts of Grass Coverage and Arrangement Patterns on Runoff and Sediment Yield in Slope-Gully System of the Loess Plateau, China. Water 2023, 15, 133. [Google Scholar] [CrossRef]
  37. Chen, B.; Zhang, X. Effects of slope vegetation patterns on erosion sediment yield and hydraulic parameters in slope-gully system. Ecol. Indic. 2022, 145, 109723. [Google Scholar] [CrossRef]
  38. Zhang, K.; Jing, H.; Song, Y.; Li, C. Experimental study on flow characteristics in a flume with flexible vegetation. Yangtze River 2018, 49, 97–102. [Google Scholar] [CrossRef]
  39. Tao, H.; Lei, S.; Gong, L.; Shi, X.; Zhang, M.; Yang, G. Study on erosion and stability of the ecological slope. Front. Earth Sci. 2023, 10, 1071231. [Google Scholar] [CrossRef]
  40. Xiao, P.; Yao, W.; Wang, G. Effects of soil shear strength and runoff erosivity on slopes with different vegetation cover. Adv. Water Sci. 2016, 27, 224–230. [Google Scholar]
  41. Cen, Y.; Liang, D.; Cheng, Q.; Liu, X.; Zou, S. Hydrodynamic performance of shallow-water waveguides subject to nonlinear waves. Phys. Fluids 2024, 36, 047108. [Google Scholar] [CrossRef]
  42. Nepf, H.M. Flow and Transport in Regions with Aquatic Vegetation. Annu. Rev. Fluid Mech. 2011, 44, 123–142. [Google Scholar] [CrossRef]
  43. Assessment of the impact of different vegetation patterns on soil erosion processes on semiarid loess slopes. Earth Surf. Process. Landf. 2018, 43, 1860–1870. [CrossRef]
  44. Tao, H.; Wang, F.; Shi, X.; Bu, S.; Bao, Z.; Zhang, D.; Xiong, L. Research on the Impact of Using a Combination of Rigid and Flexible Vegetation on Slope Hydrological Properties in Loess Regions. Water 2024, 16, 1140. [Google Scholar] [CrossRef]
  45. Wu, B.; Wang, Z.; Zhang, Q.; Shen, N.; Liu, J. Response of soil detachment rate by raindrop-affected sediment-laden sheet flow to sediment load and hydraulic parameters within a detachment-limited sheet erosion system on steep slopes on Loess Plateau, China. Soil Tillage Res. 2019, 185, 9–16. [Google Scholar] [CrossRef]
  46. Zhang, R.; Zhang, L.; Fu, X. Research on relationships between sediment yield and hydraulics parameters on slope. J. Soil Water Conserv. 2017, 31, 81–86. [Google Scholar]
  47. Peng, X.; Shi, D.; Dong, J.; Wang, S.; Li, Y. Runoff erosion process on different underlying surfaces from disturbed soils in the Three Gorges Reservoir Area, China. Catena 2014, 123, 215–224. [Google Scholar] [CrossRef]
  48. Zhou, J.; Fu, B.; Gao, G.; Lü, Y.; Liu, Y.; Lü, N.; Wang, S. Effects of precipitation and restoration vegetation on soil erosion in a semi-arid environment in the Loess Plateau. Catena 2015, 137, 1–11. [Google Scholar] [CrossRef]
  49. Madi, H.; Mouzai, L.; Bouhadef, M. Plants Cover Effects on Overland Flow and on Soil Erosion under Simulated Rainfall Intensity. Int. J. Environ. Ecol. Eng. 2013, 7, 561–565. [Google Scholar]
  50. Wang, Y.; Zhang, H.; Yang, P.; Wang, Y. Experimental Study of Overland Flow through Rigid Emergent Vegetation with Different Densities and Location Arrangements. Water 2018, 10, 1638. [Google Scholar] [CrossRef]
  51. Xiao, P.Q.; Yao, W.Y.; Shen, Z.Z.; Yang, C.X. Experimental study on erosion process and hydrodynamics mechanism of alfalfa grassland. Shuili Xuebao 2011, 42, 232–237. [Google Scholar]
  52. Zhang, G.; Hu, J. Effects of patchy distributed Artemisia capillaris on overland flow hydrodynamic characteristics. Int. Soil Water Conserv. Res. 2019, 7, 81–88. [Google Scholar] [CrossRef]
  53. Huo, Y.; Zhu, B. Experimental Study on Impact of Vegetation Patterns on Sediment Yield of Slope. Res. Soil Water Conserv. 2022, 29, 14–20. [Google Scholar]
  54. Sun, R.; Shen, M. Effects of Grass Belt Distribution on runoff and sediment yield under simulated rainfall. J. Soil Water Conserv. 2022, 36, 22–29. [Google Scholar]
  55. Zhang, M.; Hu, G. Effects of long-term vegetation coverage on runoff and sediment reducing ability of purple soil slope. Res. Soil Water Conserv. 2024, 31, 164–172. [Google Scholar]
  56. Lu, R.; Liu, Y.; Jia, C.; Huang, Z.; Liu, Y.; He, H.; Liu, B.; Wang, Z.; Zheng, J.; Wu, G. Effects of mosaic-pattern shrub patches on runoff and sediment yield in a wind-water erosion crisscross region. Catena 2019, 174, 199–205. [Google Scholar] [CrossRef]
  57. Li, J.; Song, Y. Experiment of the sediment transport pattern and resistance mechanism for sand beaing flow in vegetation patches. Transactions of the Chinese Society of Agricultural. Engineering 2023, 39, 95–103. [Google Scholar]
  58. Zhao, J.C.; Wei, W.; Duan, X.W. Response of the runoff and sediment process on loess slope to the vertical structure changes of three shrub and grass vegetations under simulated rainfall. Acta Ecol. Sin. 2021, 41, 8602–8611. [Google Scholar]
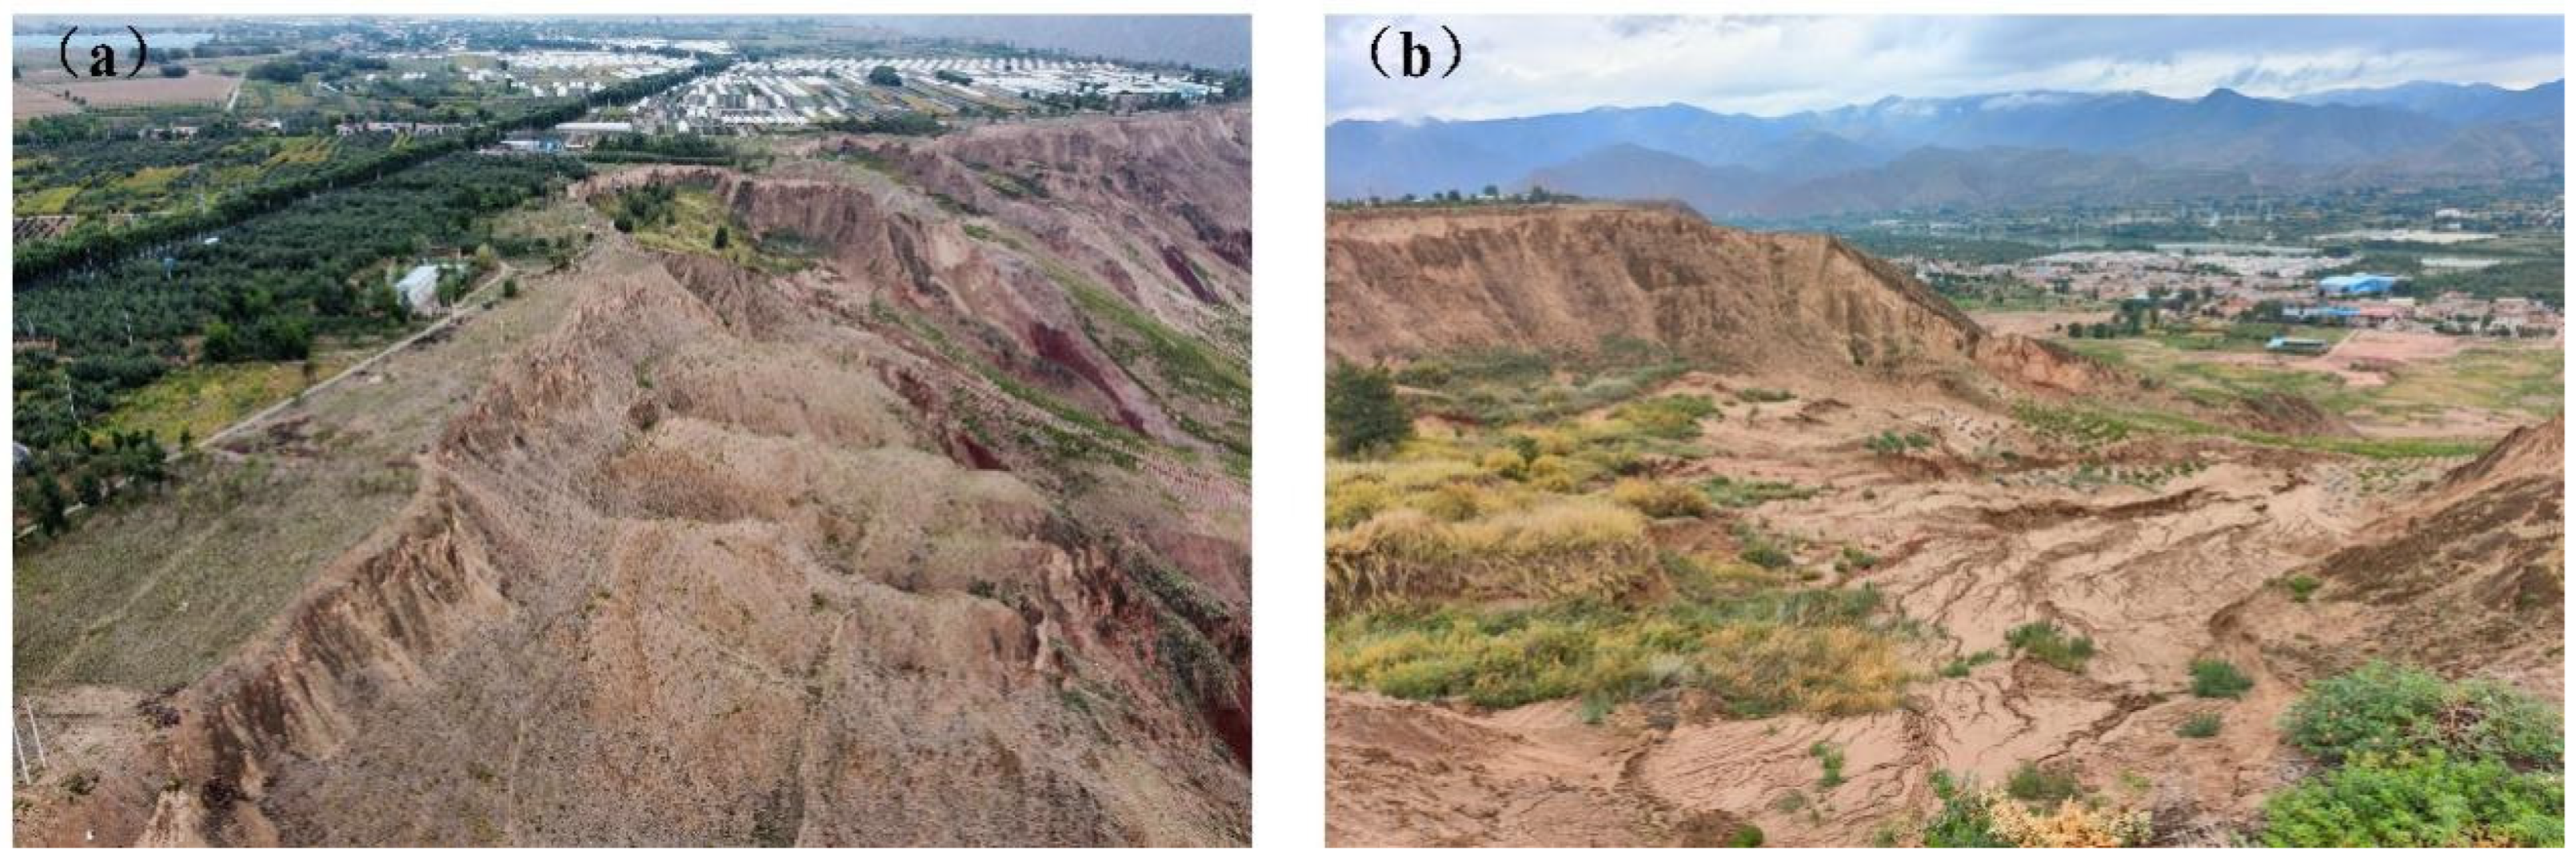
Figure 1. (a) is the location of the study area; (b) is the current status of soil erosion in the study area.
Sustainability 16 09132 g001
Figure 2. Test equipment and layout.
Sustainability 16 09132 g002
Figure 3. (a) Sediment collection pictures (b) Sediment drying pictures.
Sustainability 16 09132 g003
Figure 4. Different combinations of rigid–flexible vegetation for BS (a), GX (b), RX (c), DJ (d), UG (e), and SJ (f).
Sustainability 16 09132 g004
Figure 5. Slope soil erosion force analysis.
Sustainability 16 09132 g005
Figure 6. (a) Bare slope erosion map; (b) rigid vegetation erosion reduction map; (c) flexible vegetation erosion reduction map.
Sustainability 16 09132 g006
Figure 7. (a) is the sand production of six different vegetation configurations at a slope of 2°; (b) is the sand production of six different vegetation configurations at a slope of 4°; (c) is the sand production of six different vegetation configurations at a slope of 6°; and (d) is the sand production at different slopes.
Sustainability 16 09132 g007aSustainability 16 09132 g007b
Figure 8. (a) Plot of flow velocity versus erosion reduction rate for a slope of 2°; (b) Plot of flow velocity versus erosion reduction rate for a slope of 4°; (c) Plot of flow velocity versus erosion reduction rate for a slope of 6°.
Sustainability 16 09132 g008
Figure 9. Plots of flow versus water depth for different slopes with slopes of 2° (a), 4° (b), and 6° (c), and flow versus current velocity for slopes of 2° (d), 4° (e), and 6° (f).
Sustainability 16 09132 g009aSustainability 16 09132 g009b
Figure 10. (a) Plot of flow velocity versus runoff shear for a slope of 2°; (b) Plot of flow velocity versus runoff shear for a slope of 4°; (c) Plot of flow velocity versus runoff shear for a slope of 6°.
Sustainability 16 09132 g010
Figure 11. (ac) are plots of flow velocity versus unit runoff power for slopes of 2°, 4°, and 6°, respectively; (df) are plots of flow velocity versus runoff power for slopes of 2°, 4°, and 6°, respectively.
Sustainability 16 09132 g011aSustainability 16 09132 g011b
Table 1. Basic physical properties of project area loess.
Natural
Moisture Content
(%)
Dry Density (g/cm3)Relative Particle DensityPlastic Limit
(%)
Liquid Limit
(%)
Soil Particle Size
<0.005 mm
(%)
Soil Particle Size
0.005~0.05 mm (%)
Soil Particle Size
>0.05 mm
(%)
3.21.292.6317.823.7166024
Table 2. Average sand production and erosion reduction rate on slopes.
Slope (°)Layout AverageSand Production (kg)Average Erosion Reduction (%)
SJ1.5423.67
GX1.5622.66
DJ1.4329.89
RX1.4727.39
UG1.6119.96
SJ1.9024.64
GX2.0120.09
DJ1.8526.60
RX1.8925.15
UG2.0617.84
SJ2.3720.69
GX2.4418.18
DJ2.3421.78
RX2.3621.00
UG2.5115.49
Table 3. Relationship between flow and water depth at different slopes.
SlopeRegression EquationR2
h = 1.466Q0.6420.993
h = 1.500Q0.6720.986
h = 1.465Q0.6340.993
Table 4. Relationship between flow rate and flow velocity at different slopes.
SlopeRegression EquationR2
v = 0.076ln(Q + 0.364) + 0.2130.976
v = 0.345ln(Q + 3.9) − 0.3270.994
v = 0.093ln(Q + 0.334) + 0.2550.993
Table 5. Relationship between flow rate and runoff shear at different slopes.
SlopeRegression EquationR2
τ = 0.746 Q 0.597 0.992
τ = 1.117 Q 0.602 0.987
τ = 1.502 Q 0.642 0.993
Table 6. Relationship between flow rate and runoff power, per unit of runoff power at different slopes.
SlopeRegression EquationR2
Φ = 2.24 + 0.11V0.99
Φ = −4.85 + 0.23V0.99
Φ = 0.002 + 0.34V0.99
Disclaimer/Publisher’s Note: The statements, opinions and data contained in all publications are solely those of the individual author(s) and contributor(s) and not of MDPI and/or the editor(s). MDPI and/or the editor(s) disclaim responsibility for any injury to people or property resulting from any ideas, methods, instructions or products referred to in the content.