Abstract
Machine learning (ML) models trained with remote sensing data have the potential to improve cereal yield estimation across various geographic scales. However, the complexity and heterogeneity of agricultural landscapes present significant challenges to the robustness of ML-based field-level yield estimation over large areas. In our study, we propose decomposing the landscape complexity into homogeneous zones using existing landform, agroecological, and climate classification datasets, and subsequently applying stratum-based ML to estimate cereal yield. This approach was tested in a heterogeneous region in northern Morocco, where wheat is the dominant crop. We compared the results of the stratum-based ML with those applied to the entire study area. Sentinel-1 and Sentinel-2 satellite imagery were used as input variables to train three ML models: Random Forest, Extreme Gradient Boosting (XGBoost), and Multiple Linear Regression. The results showed that the XGBoost model outperformed the other assessed models. Furthermore, the stratum-based ML approach significantly improved the yield estimation accuracy, particularly when using landform classifications as homogeneous strata. For example, the accuracy of XGBoost model improved from R2 = 0.58 and RMSE = 840 kg ha−1 when the ML models were trained on data from the entire study area to R2 = 0.72 and RMSE = 809 kg ha−1 when trained in the plain area. These findings highlight that developing stratum-based ML models using landform classification as strata leads to more accurate predictions by allowing the models to better capture local environmental conditions and agricultural practices that affect crop growth.
1. Introduction
Recent advancements in cereal yield estimation have increasingly focused on integrating Machine Learning (ML) models with remote sensing images to enhance accuracy and scalability [1,2,3,4,5,6] At the county level, Mwaura and Kenduiywo [7] have successfully used an Artificial Neural Network trained with the Normalized Difference Vegetation Index (NDVI), calculated using Landsat 7, for maize yield estimation. Cao et al. [8] and Joshi et al. [5] employed a Random Forest (RF) model using Solar-Induced Chlorophyll Fluorescence for rice and wheat yield estimation, respectively. More recently, Lyu et al. [9] used Light Gradient Boosting Machine for estimating maize yield with MODIS data. At the field level, deep learning models were successfully applied for soybean yield estimation [10,11]. Fernandez-Beltran et al. [12] trained a 3D Convolutional Neural Network for rice yield estimation using Sentinel-2 images, and Marshall et al. [13] estimated cereal yields using multispectral and hyperspectral imaging from Sentinel-2, and the Hyperspectral Precursor of the Application Mission (PRISMA). Guo et al. [14] implemented an RF model to estimate maize yields in the Ethiopian highlands using samples from major maize-producing areas.
Accurate yield estimation and monitoring are essential for supporting farmers and policymakers to make informed decisions. These practices optimize agricultural methods, enhance food security, and support sustainable farming [15,16,17]. For example, the Scalable Crop Yield Mapper developed by Lobell et al. [16] integrates satellite data with crop model simulations to forecast yields, which has been successfully applied to predict yields for crops such as sorghum [18] and maize [19].
When applying ML models to predict field-level yield across extensive geographic regions, we identified several challenges that are often inadequately addressed by the remote sensing community. Environmental conditions, including precipitation, temperature, solar radiation, soil types, and their interplay with land use and management practices, contribute to the observed spatial and temporal variability in agricultural systems. This variability, particularly localized, is not adequately captured by ML models when predictions are made across large geographic extents [20]. Additionally, the samples used to train these models are often inconsistently distributed, with some areas being underrepresented while others are densely sampled. This inconsistency restricts the model’s capacity to generalize effectively to regions with distinct geographic and feature space characteristics [21].
A promising strategy is regionalization, which divides large study areas into homogeneous zones based on environmental conditions [4,22,23,24,25]. For example, Mohammed et al. [26] stratified the landscape into homogeneous zones based on Crop Production Systems (CPS) and then applied a Generalized Additive Model to estimate cropland fractions within these zones. The stratification revealed significant variability in the NDVI temporal responses across the CPS zones, which helped in distinguishing areas with different agricultural activities. The use of CPS zones in this study provided a more refined and accurate representation of the spatial distribution of cropland compared to previous cropland mapping efforts without stratification. Huang et al. [27] mapped global impervious surface areas by dividing the terrestrial surface into grids based on data consistency. Regions where the datasets were consistent in their classifications were categorized as A-Grids, while inconsistent regions, where existing global impervious surface area (ISA) datasets showed significant differences due to variations in mapping methods and training samples, were classified as M-Grids. RF classifiers were used, with samples collected either automatically (for consistent A-Grids), or manually (for inconsistent M-Grids). The study showed significant accuracy improvements, particularly in the inconsistent regions. Trivedi et al. [28] found that the use of seasonally stratified Sentinel-2 and Sentinel-1 data with RF can significantly improve the accuracy of cropland mapping in fragmented agricultural landscapes. Qiao et al. [29] predicted yield at the county level by dividing the study areas into three zones for wheat, and two for corn. As a result, the model was better able to capture localized factors and seasonal variations, leading to improved prediction accuracy.
While regionalization has proven to be an effective strategy in decomposing spatial and temporal variability in agricultural systems, its application to field-level yield estimation across large geographic extents remains underexplored. This study applies regionalization to an extensive study area, encompassing diverse environmental conditions and management practices. The objective of our work is to analyze stratum-based ML yield predictions by addressing the challenges associated with spatial heterogeneity and sample clustering. First, we design stratum-based ML models fitted to homogeneous zones defined by landform, climate, and agroecological characteristics. Second, we examine the within-area spatial heterogeneity of wheat yield across various geographic scales, and analyze its impact on the effectiveness of the implemented ML models.
2. Materials and Methods
2.1. Study Area and Field Data
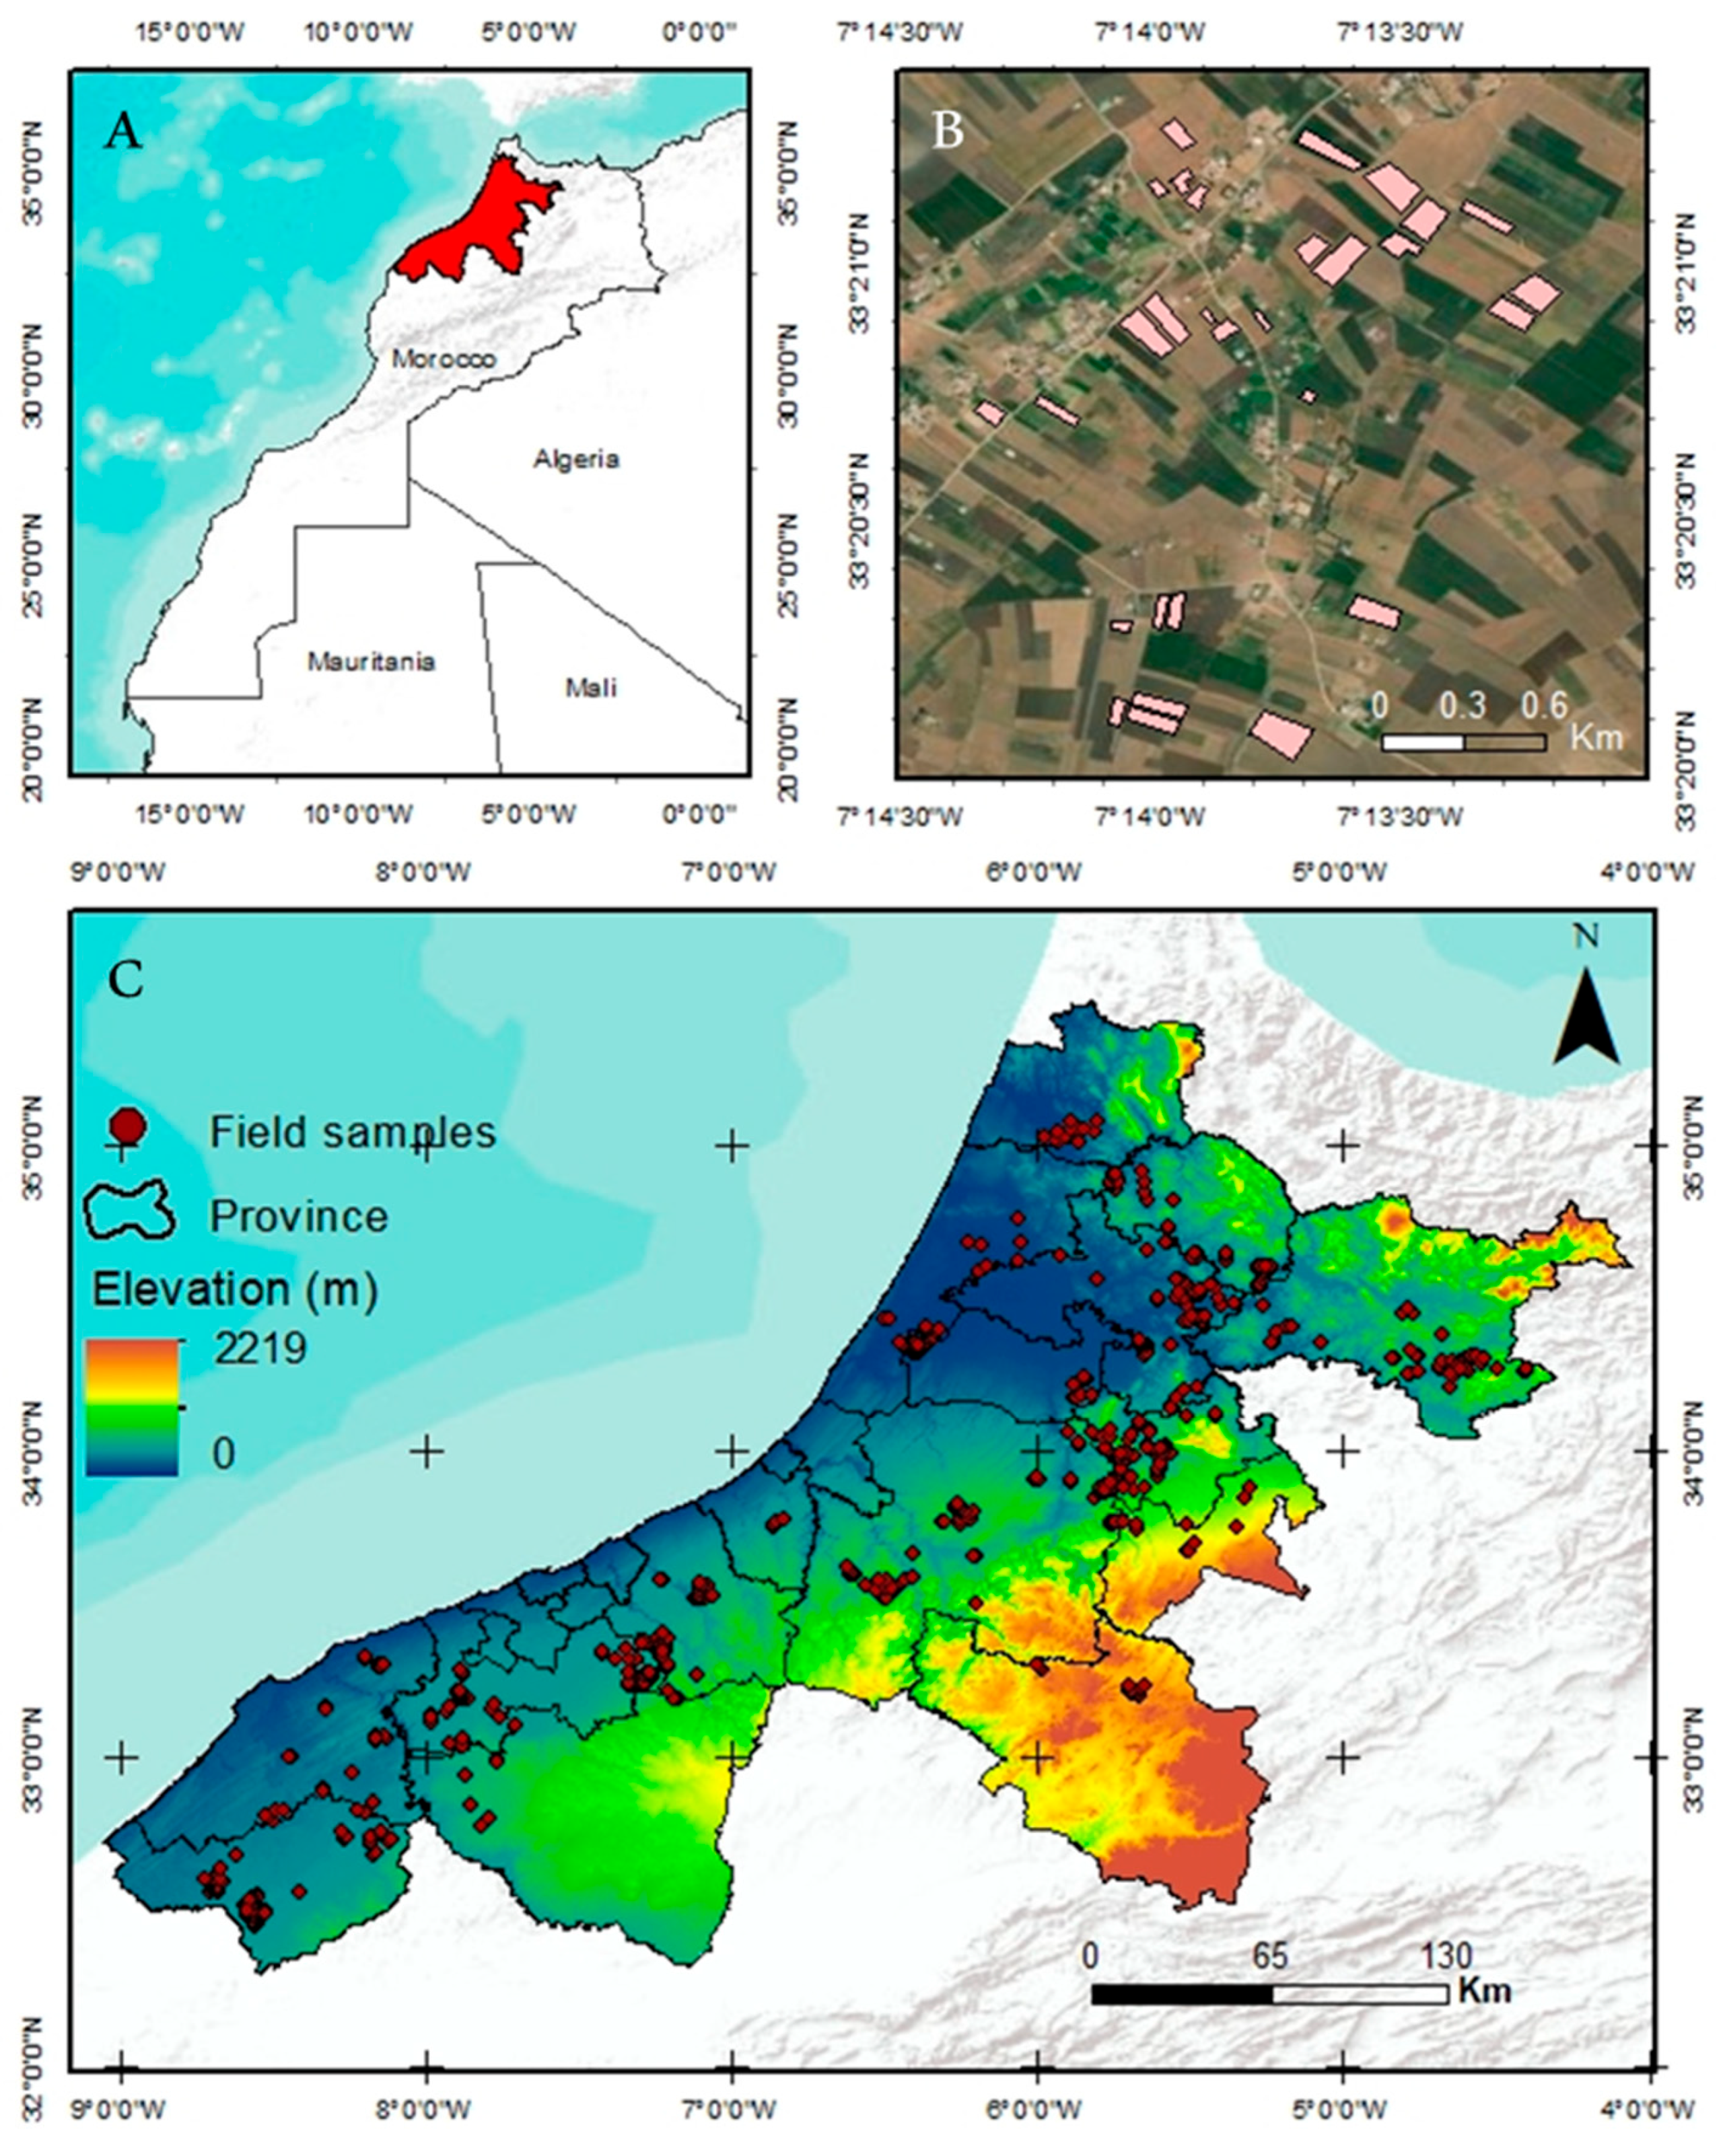
The research was conducted in Morocco’s northwestern Atlantic quadrant, covering 22 provinces (Figure 1) [30,31] where wheat is the predominant crop. The study area is characterized by high precipitation levels, with a maximum of 1100 mm and a minimum of 139 mm, and average temperatures ranging from 13 °C to 24 °C, both recorded during the 2020–2021 agricultural season (November to June). These values were extracted from the ERA5 reanalysis dataset [32] A yield survey conducted during the same season resulted in 1329 dry yield data samples, primarily from soft wheat, with Faiza and Bandera being the dominant varieties. To ensure accurate boundary delineation, each field was manually outlined using ArcGIS software version 10.6.
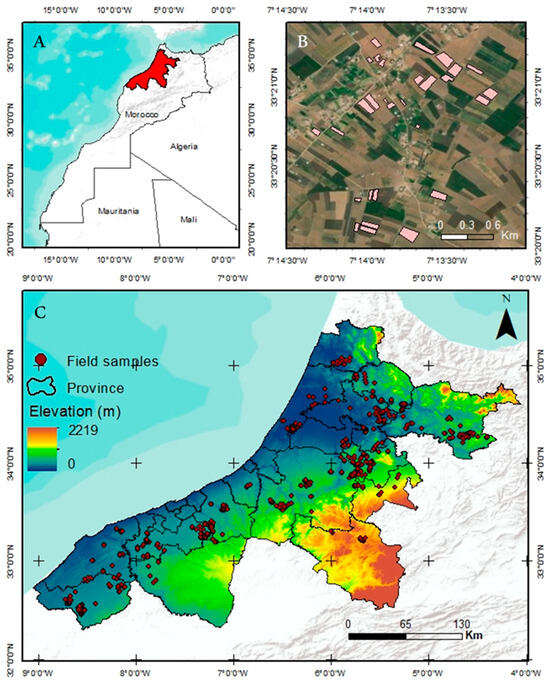
Figure 1.
Location of the study area (A), and the topographic map depicting provincial boundaries and the elementary sampling units (B), a zoomed-in view of field sample locations (C).
2.2. Land Stratification
We divided the study area into homegeneous strata (referred to as zones in our paper) based on three classificationproducts, referred to as Land Classification Systems (LCS): the Landform Classification Map, the Köppen-Geiger classification, and the Agroecological Zones Map.
2.2.1. Landform Classifications
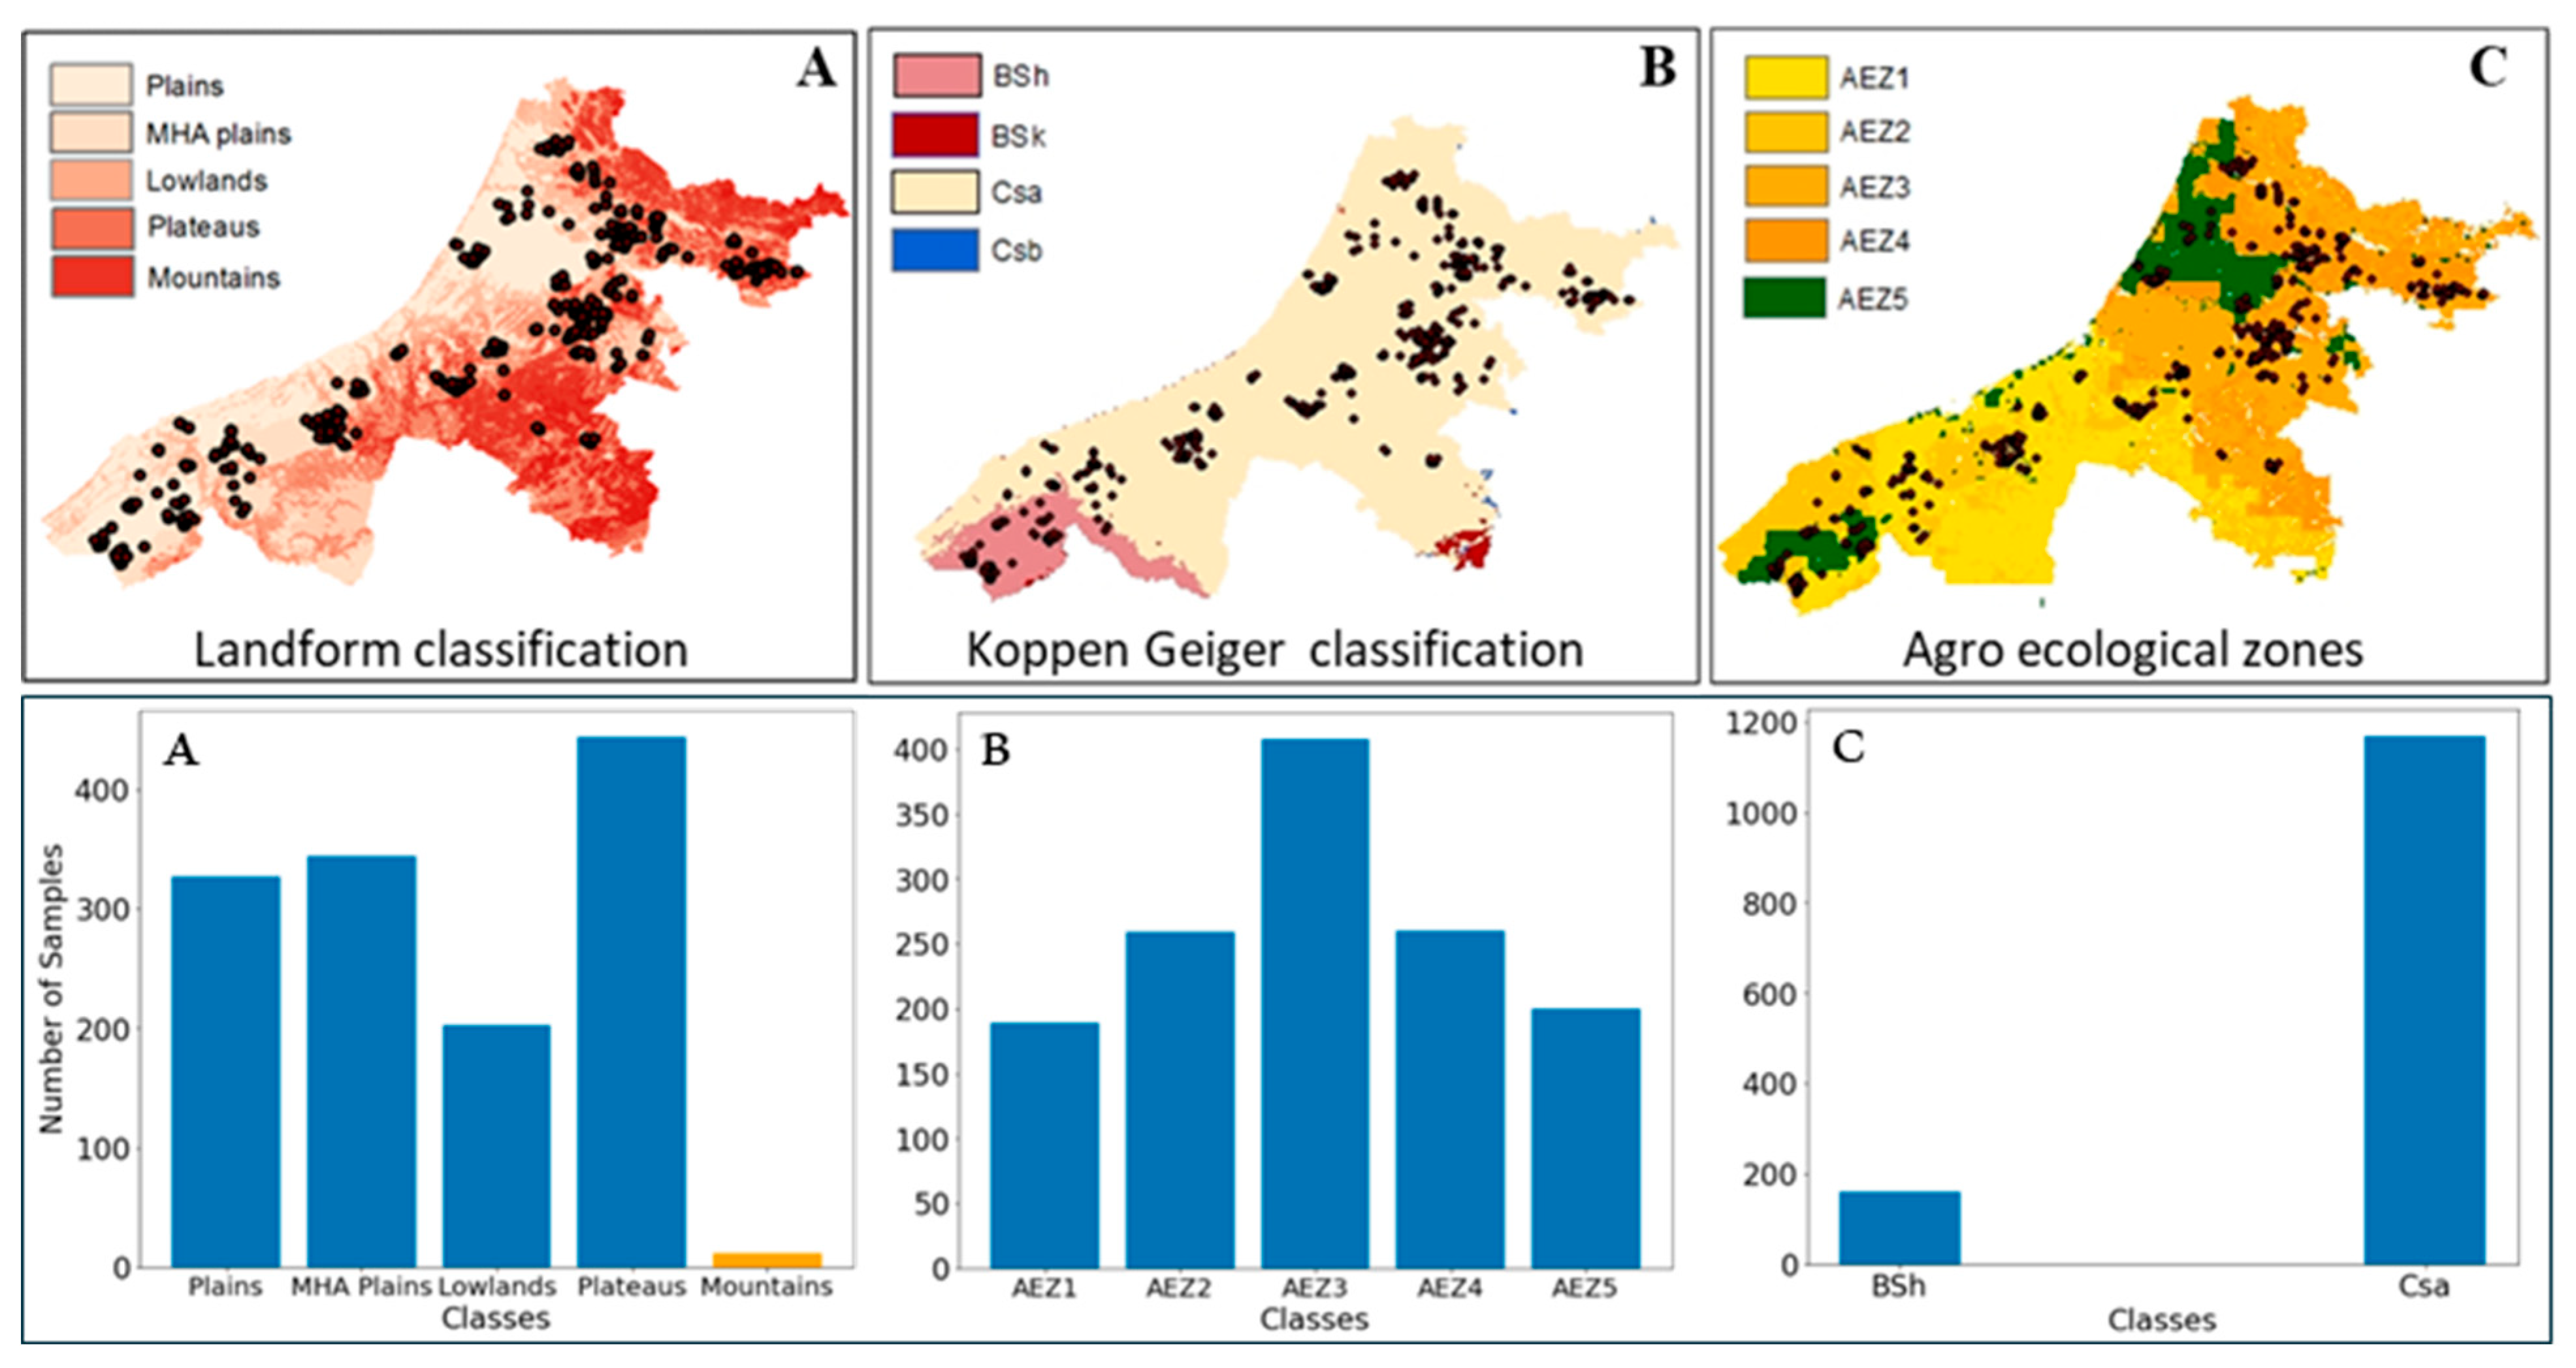
We utilized the landform classification map (LC) developed by Meybeck et al. [33] which categorizes the Earth’s surface into 15 distinct relief zones based on a combination of relief roughness indicators and mean altitude, at a resolution of 30′ × 30′. Our study area included 13 of these landform zones, with yield samples collected from 11 of them. To effectively train the selected ML algorithms, zones with insufficient sample sizes were either merged or excluded. Specifically, the Low, Mid, and High-altitude Mountain zones, totaling 12 samples, were excluded from the ML model analysis. The remaining similar zones were merged, resulting in four primary zones: Plains, Mid and High-altitude (MHA) Plains, Lowlands, and Plateaus (Figure 2A).
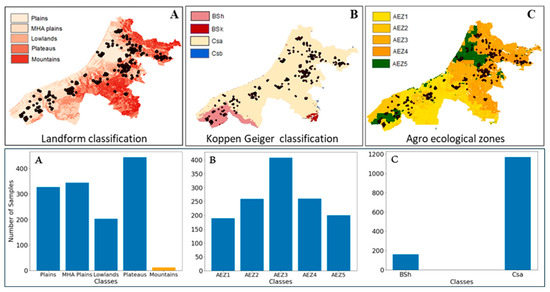
Figure 2.
Number and spatial distribution of the field samples across selected Landform (A), Köppen-Geiger climate classification (B), and Agroecological Zones (C). Blue indicates samples used in the analysis, while orange represents samples excluded from the analysis.
2.2.2. The Köppen-Geiger Classification System
The Köppen-Geiger climate classification system (KGC) is a globally recognized system for categorizing world climates [34]. With a resolution of 1 km, it delineates the global climate into 30 subcategories, primarily based on specific threshold values like monthly air temperature and precipitation patterns. Our study area consists of four zones (Figure 2B): Csb: a temperate climate with a dry summer and warm summer months; Csa: a temperate climate that experiences dry summers and high summer temperatures; BSk: an arid, steppe-like landscape with low temperatures; and BSh: an arid, steppe-like environment with high temperatures. Field samples from the study predominantly fall into the zones BSh (160) and Csa (1169).
2.2.3. Global Agroecological Zones
The Agricultural Ecological Zone (AEZ) map [35] offers a comprehensive summary of land suitable for agriculture, integrating factors such as climatic conditions and soil properties. This map plays an important role in guiding sustainable crop cultivation and resource management. Our study area contains 18 distinct zones from the AEZ classification system, while field data cover only six of them. Among those, the Dominantly hydromorphic soils zone with a bare 13 samples, was excluded from further analysis (Figure 2C).
2.3. Remote Sensing Data
In this study, Sentinel-1 and Sentinel-2 satellite images, covering the agricultural season of winter wheat from 1 November 2020 to 30 June 2021, were accessed and processed using the Google Earth Engine platform [36]. For Sentinel-2, Level 2A images with less than 60% cloud coverage were selected, and clouds were masked using the QA60 band method. We used five spectral indices: Normalized Difference Vegetation Index (NDVI) [37], Green-Red Vegetation Index (GRVI) [38], Moisture Stress Index (MSI) [39], Terrestrial Chlorophyll Index (MTCI) [40], and CI Red Edge (CIR) [41] (Table 1). Sentinel-1 images focused on the VH and VV polarizations. For both Sentinel-1 and Sentinel-2, 13-day maximum value composites were created, with missing data interpolated to address gaps and cloud cover issues. Additionally, the Sentinel-2 time-series images were smoothed using the Savitzky-Golay filter [42] with a window size of five and a polynomial order of two, while Sentinel-1 images were despeckled using the Lee filter (Lee Filters: Hampshire, UK) [43]. The processed Sentinel-1 and Sentinel-2 images were then extracted for each field by averaging the pixel values within a buffer centered on the field. Each buffer maintained a minimum 10 m gap from the field boundary to exclude non-field areas like roads and buildings, ensuring that only relevant field pixels were analyzed. These mean pixel values were subsequently used for yield estimation.

Table 1.
Spectral indices used in this study. S2-Sentinel 2.
2.4. Methodology
2.4.1. Stratum-Based Machine Learning Models for Yield Estimation
Initially, as part of a baseline assessment, the models were trained and validated using the entire set of 1329 samples distributed across the whole study area. Subsequently, the models were applied to each zone defined by the specific LCS map. The three ML-based prediction models used in our study are presented below.
Multiple Linear Regression (MLR): MLR is a statistical method that predicts a dependent variable using multiple independent variables [44]. It establishes a linear relationship between the response (dependent) variable and the explanatory (independent) variables. In the context of MLR, the relationship is represented as:
where y is the predicted yield, the represent the input variables, which in our case, include Sentinel-1 and Sentinel-2 remote sensing data, a0 is the intercept, and the are the regression coefficients.
RF regressor [45,46], is an ensemble of multiple decision tree regressors. Each tree in this ensemble makes its own prediction on a continuous target variable. The final prediction of the RF regressor is obtained by averaging the outputs of all individual decision tree regressors. In configuring the RF regressor, two key parameters need to be optimized [47]: the number of regression trees, which has a default value of 500 trees, and the number of input variables used to split the internal nodes of each decision tree, usually defined as representing one-third of the total number of variables in the dataset.
XGBoost, a development of Gradient Boosting Machines in machine learning [48], operates similarly to RF in that it uses decision trees as its foundational models. Unlike RF, which uses bagging, XGBoost relies on boosting to sequentially train multiple trees. XGBoost improves upon each iteration by focusing on the errors made by previous trees, thereby enhancing overall prediction accuracy. The underlying concept is that combining several weak learners can produce a robust model with reduced error. Boosting methods work by leveraging the negative gradient of a chosen loss function to guide the training process, systematically increasing accuracy with each step. Through this iterative refinement, XGBoost progressively builds a more accurate model by correcting the mistakes of earlier learners.
The following hyperparameters of XGBoost have been fine-tuned using the grid search method: (1) max_depth, i.e., the maximum depth of an individual tree; (2) n_estimators, i.e., the number of trees to be built during boosting; (3) the parameter η that reduces the feature weights to ensure that boosting becomes more conservative; (4) colsample_bytree, i.e., the subsampling ratio of the columns during tree construction.
2.4.2. Assessing the Prediction Accuracy
We used two statistical metrics to evaluate the prediction accuracy: the coefficient of determination (R2) and the root mean squared error (RMSE) (Equations (2) and (3)). The R2 values were calculated using r2_score from sklearn.metrics in Python version 3.8.8, which allows for negative values, indicating that the model’s predictions are worse than simply predicting the mean of the target variable. Negative R2 values were subsequently replaced with “NA” to indicate non-applicable results. We applied 3-fold random cross-validation in our analysis.
N being the sample size, the measured value, the predicted values, and the mean of the values.
is the sum of squares of the residual errors and is the total sum of the errors.
2.4.3. Integrating Land Classification Systems Maps with Satellite Imagery as Input for Training Machine Learning Models
This section includes the LCS datasets (landform classification, globalagroecological zones, and Köppen-Geiger classification system data) as independent variables along with the input variables from Sentinel-1 and Sentinel-2 (referred to as VR). The goal is to determine whether integrating LCS data significantly improves model performance in predicting wheat yield compared to relying solely on developing stratum-based ML models. We evaluated the performance of XGBoost (version 1.7.1) with different input variable combinations (Table 2) across the entire study area.

Table 2.
Input variable configurations for model runs in the entire study area.
3. Results
3.1. Yield Data Distribution across Landform, Climatic and Agroecological Zones
In the LC map, the Plains zone obtains the highest standard deviation (SD), equal to 1528 kg ha−1, whereas the Lowland zone has the lowest at 1061 kg ha−1. Both the MHA Plains and Lowlands zones contain outliers. Yield distributions in all zones are positively skewed, except for the Plateaus zone. The interquartile range (IQR) of yield remains relatively consistent across zones, with the Plains showing a slightly larger IQR. For the KGC map, the BSh zone has an SD of 784 kg ha−1 with an average yield of 2812 kg ha−1. The Csa zone has an SD of 1253 kg ha−1 with an average yield of 4335 kg ha−1. Outliers are found in the BSh zone. The Csa zone is characterized by positive skewness and high kurtosis. On the AEZ map, AEZ2 has the lowest SD, with 573 kg ha−1. The highest SD equals 1596 kg ha−1 in AEZ5. Outliers are present only in AEZ1. The AEZ zones show varying skewness; for instance, AEZ3 exhibits positive skewness, while AEZ5 has negative skewness. AEZ1 and AEZ2 have shorter IQRs compared to the other zones (Figure 3). The presence of outliers may be attributed to differences in agricultural practices within the same zone. For example, most samples in a zone might represent the same wheat variety, but a few representing a different variety can cause outliers due to the impact of the variety difference on yield. Factors such as variations in sowing dates and fertilizer application may also contribute to these variations.

Figure 3.
Violin plot of yield distribution across selected Landform, Köppen-Geiger climate classification, and Agroecological zones.
3.2. Comparative Model Performance across Zones
When applying the model across the whole study area (SA), XGBoost and RF achieved a slight difference in performance, with RMSE values equal to 840 and 885 kg ha−1, and R2 values of 0.58 and 0.54, respectively. These methods outperformed MLR, which achieved an RMSE of 1017 kg ha−1 and R2 of 0.39.
A clear variation in model performance is observed when applying stratum-based ML models fitted to LCS maps. When analyzing the results based on the LC map, XGBoost, RF, and MLR all demonstrate enhanced accuracy for the plain zone compared to the SA (for XGBoost: R2 = 0.72, and RMSE = 809 kg ha−1; for RF: R2 = 0.68, and RMSE = 861 kg ha−1; for MLR: R2 = 0.43, RMSE = 1153 kg ha−1). The performance of XGBoost and RF also improves for the MHA Plains and Lowlands zones. The performance of MLR decreases, with R2 and RMSE values of 0.11 and 1176 kg ha−1, respectively, for the MHA Plains zone, and it drastically decreases to even negative R2 values for the Lowlands zone (Table 3).

Table 3.
Statistical performance metrics of the three models under different scenarios. NA: Not applicable.
When comparing KGC zones with SA, XGBoost shows consistent model performance between SA and the Csa zone, while both RF and MLR exhibit a slight decrease in performance. In contrast, the BSh zone shows lower performance when compared to the other zones in all three models, with the MLR model displaying a drastic decline in performance, with R2 values dropping to negative values. This variation is attributed to the presence of outliers in the BSh zone, which significantly impact the effectiveness of the MLR model.
For the AEZ scenarios, AEZ2 and AEZ5 show improvements in performance for non-linear models. Specifically, the XGBoost model achieved R2 values of 0.60 in AEZ2 and 0.67 in AEZ5, respectively; the RF model recorded R2 values of 0.61 in both. In contrast, the MLR model experiences a drastic drop in accuracy for all the zones except AEZ3, which shows a marginal R2 value of 0.2. Such model accuracy is still inferior when compared to the results achieved with SA.
After assessing the accuracy of three ML models across different scenarios under LCS maps, XGBoost consistently outperforms the other models in most scenarios. RF, although typically robust, shows slightly lower performance compared to XGBoost across various landscapes and climatic conditions. The MLR model, on the other hand, demonstrates significant variability in its performance, often underperforming in comparison to the non-linear algorithms. These findings suggest that XGBoost is the most reliable for this analysis. Therefore, subsequent findings will exclusively focus on the XGBoost model, presenting a comparative analysis of model performance with various input variable combinations (Table 2). This includes using LCS maps as independent variables, along with the variables derived from Sentinel-1 and Sentinel-2 satellite imagery.
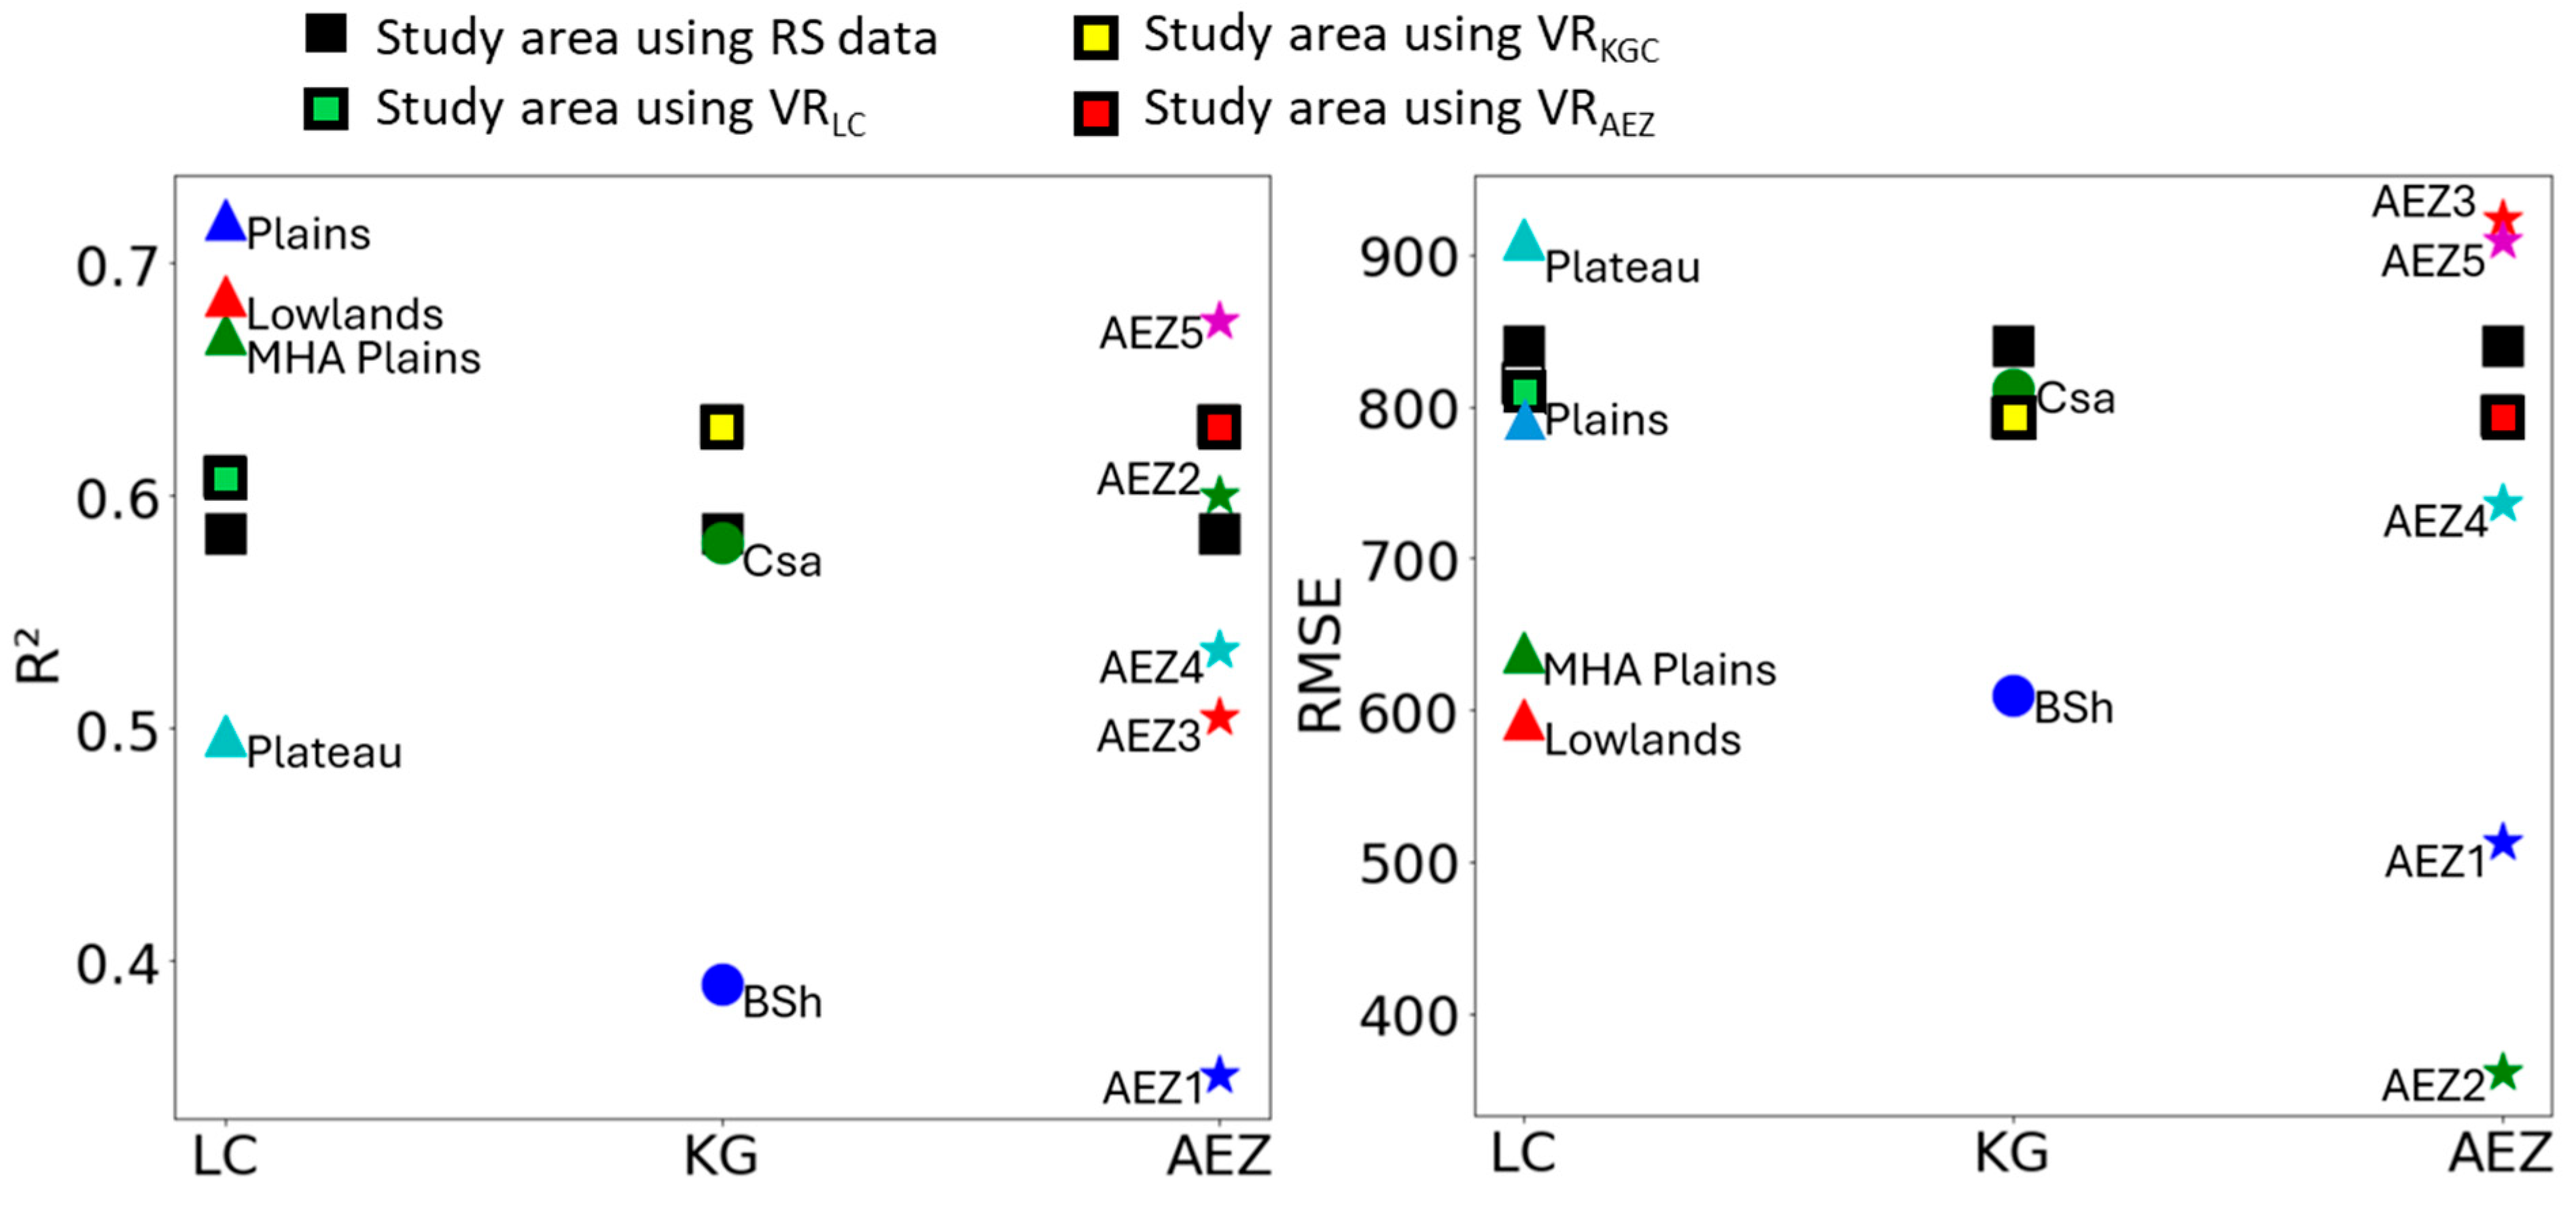
After adding the LCS as additional input variables to the existing Sentinel-1 and Sentinel-2 images, we obtained higher accuracy across all new model configurations compared to the VR-only model (e.g., R2 = 0.61, RMSE = 815 kg ha−1 for VRLC, and R2 = 0.58, RMSE = 840 kg ha−1 for the VR-only model). This improvement is expected, as the added variables—LC, KGC, AEZ—represent key factors impacting wheat yield variations. When comparing these model configurations applied to SA with those utilizing strata, the zones derived from the LC map, particularly Plains, MHA plains, and Lowlands, generally outperform the combined VRLC model. In contrast, in the Plateaus zone, the performance decreased (R2 = 0.49, RMSE = 909 kg ha−1). Additionally, the remaining zones within the KGC and AEZ maps demonstrate lower accuracy than their VRKGC and VRAEZ counterparts, respectively (Figure 4).
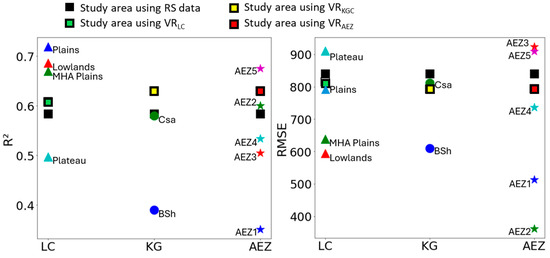
Figure 4.
The performance of the XGBoost model across different scenarios using CV, represented by three sets of bars: R2 (blue), MAE (green), and RMSE (yellow).
4. Discussion
The objective of our study was to evaluate how effectively stratum-based ML models can predict wheat yields at the field level in northern Morocco, using Sentinel-1 and Sentinel-2 imagery. Stratum-based XGBoost, RF, and MLR models were trained to predict wheat yield in homogeneous zones defined based on landform, climate, and agroecological characteristics. The results indicate that XGBoost and RF consistently outperform MLR, with XGBoost showing a slight improvement over RF. This can be attributed to the ability of non-linear models such as XGBoost and RF to capture complex non-linear relationships and interactions among variables, which are prevalent in agricultural yield prediction [49,50].
The study demonstrates that stratum-based ML models trained and validated with samples from homogeneous regions such as plains, Csa, or AEZ5 zone achieve better performance compared to ML models trained with data from the entire study area. Dividing the study area into homogeneous zones allows for a more targeted analysis that inherently accounts for local variations, supporting the hypothesis that stratum-based ML models are key to enhancing geospatial data analysis accuracy [20].
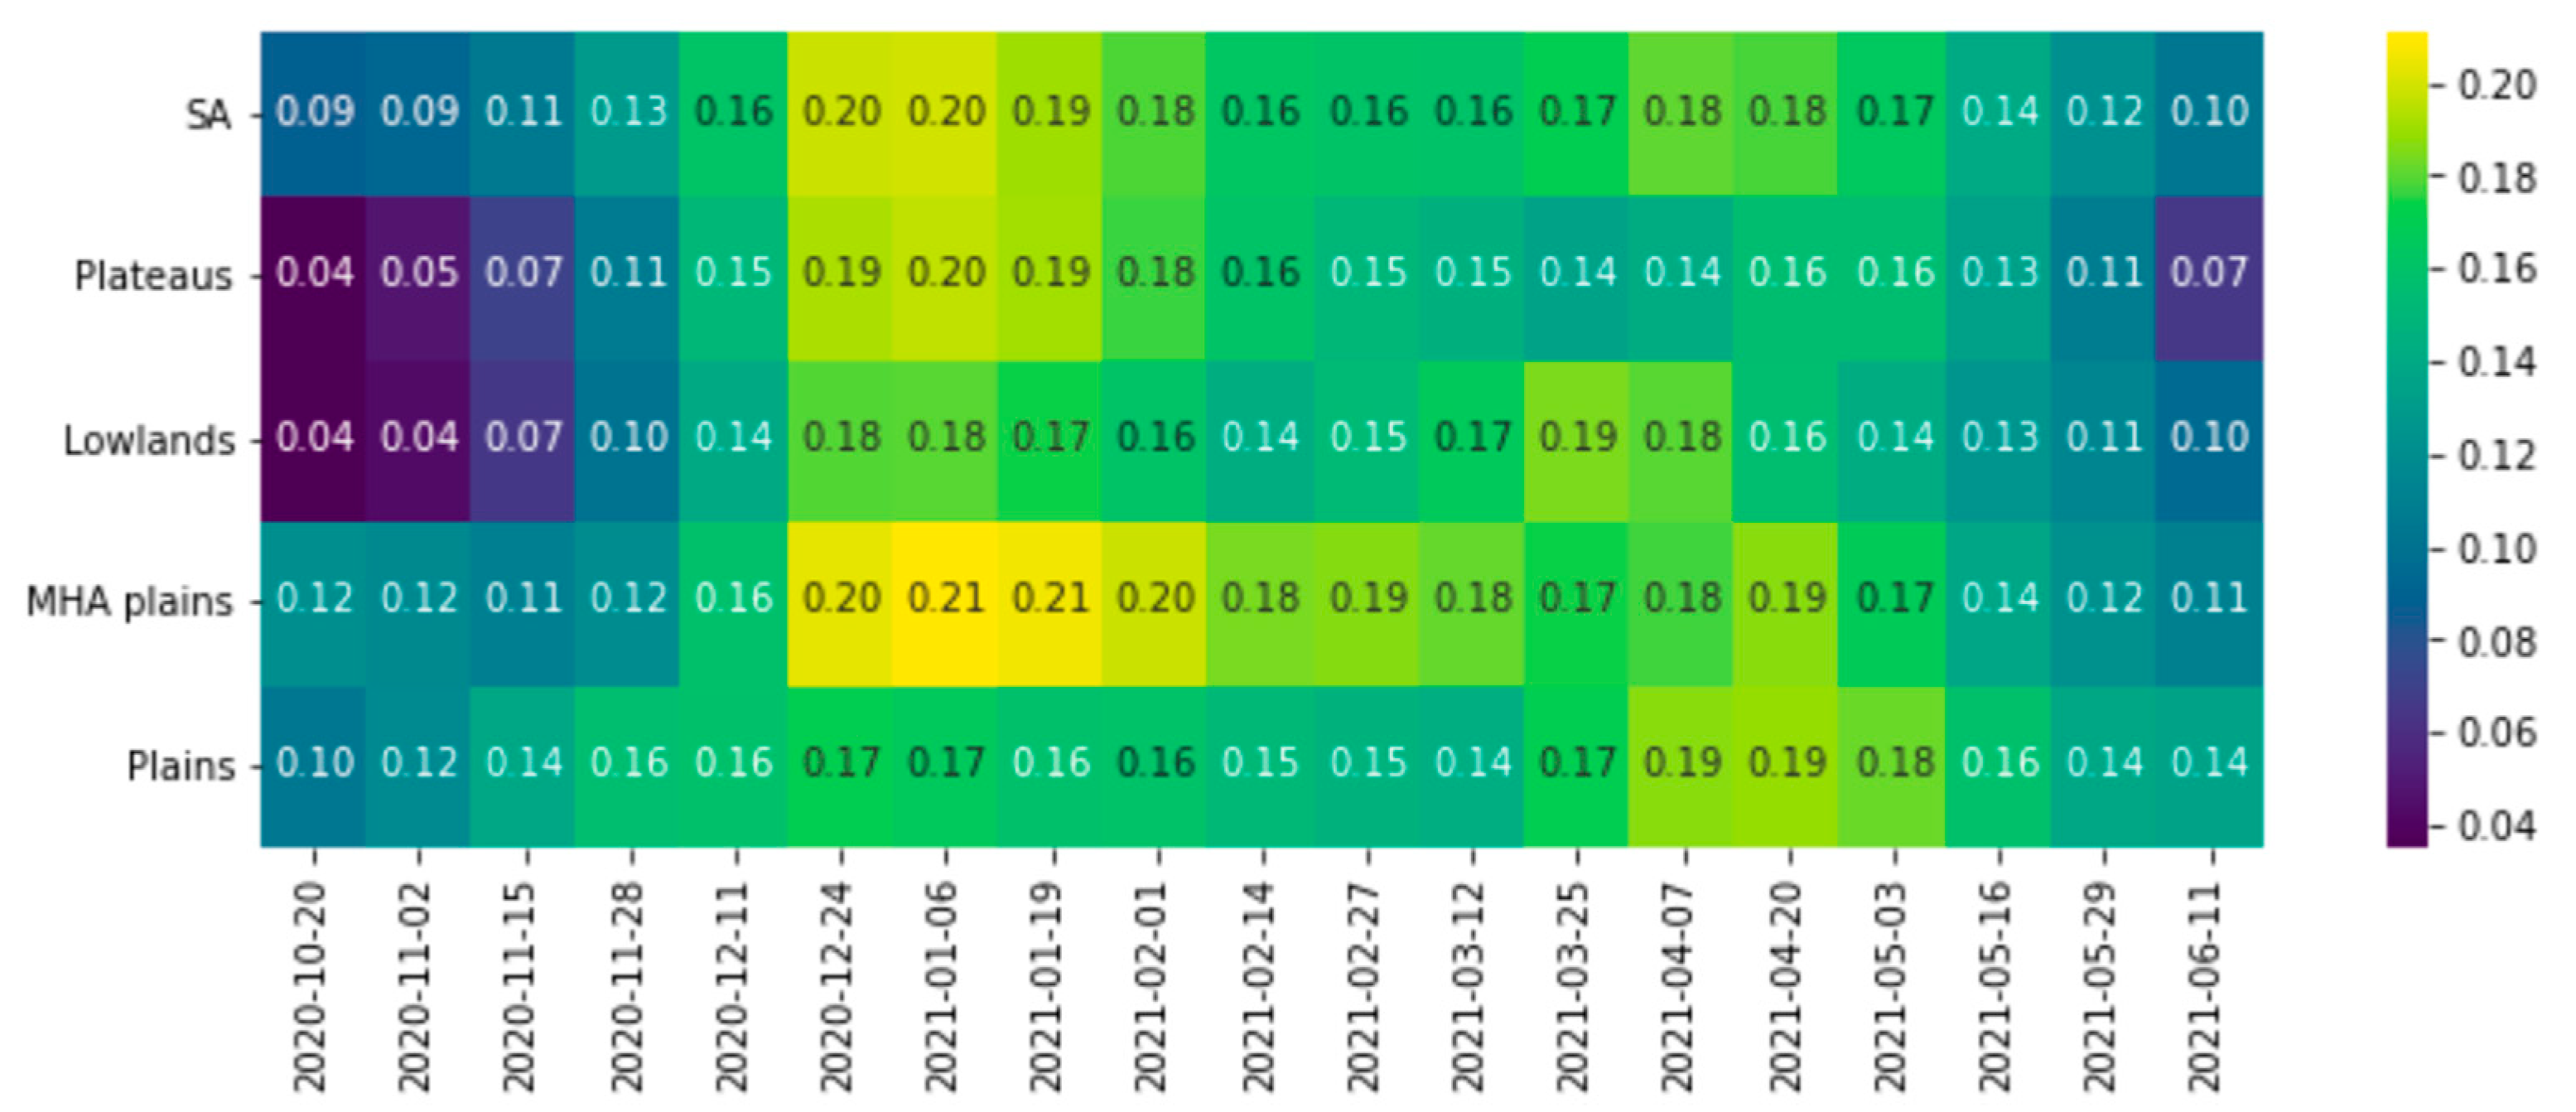
Despite the advantages of stratum-based ML, in several instances, the ML models trained and validated with samples from the Plateaus, BSH, or AEZ4 zones obtained lower accuracy than the SA model. This can be explained by the small number of field samples available for these zones, which makes it difficult for the non-linear ML models to learn local patterns, leading to lower accuracy [51]. There are, however, cases when a large number of field samples does not necessarily lead to higher prediction accuracy. For instance, the stratum-based ML model fitted to 327 field samples available in the plain zone obtained higher accuracy than the model fitted to the plateau zone, where 444 samples are available. This can be attributed to the lower kurtosis in the plain zone compared to the plateau zone, indicating fewer extreme values and a more uniform distribution of data points around the mean. It could also be due to a greater temporal consistency of the NDVI SD over time in the plain zone (Figure 5), referred to as temporal stability by Padilla et al. [52]. These consistent NDVI values suggest more stable vegetation growth conditions, which allows the model to learn from more uniform patterns and, thus, yield better prediction accuracy. As a result, the samples used to train the ML models should be able to capture the underlying environmental and agricultural practices conditions. Thus, a large number of samples does not necessarily translate into higher accuracy unless they adequately reflect the spatial heterogeneity [53].
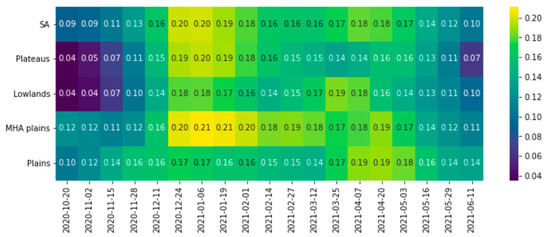
Figure 5.
Standard deviation of the Normalized Difference Vegetation Index (NDVI) across various LC map categories over selected time periods.
Integrating categorical variables derived from LCS maps with Sentinel-1 and Sentinel-2-based variables into the XGBoost model enhanced its accuracy. This improvement occurs because these maps capture essential factors influencing agricultural conditions and plant growth. Specifically, the LC map captures the underlying terrain characteristics that inform the model about soil drainage and sun exposure, as well as altitude, which further influences weather conditions and consequently impacts wheat productivity.
Climate factors are captured by the Köppen-Geiger map, providing direct information on precipitation and temperature that impact yield. Agroecological factors, including soil, terrain, and climate data, are represented in agroecological zone maps. These help the model adjust to regional agricultural potentials and constraints, thereby refining yield predictions. Despite these improvements, the stratum-based ML models still achieved higher accuracy when fitted to LC zones compared to using categorical variables derived from LCS maps with Sentinel data. This might be explained by the fact that zoning data based on the LC map can reduce the impact of remote sensing data noise, such as the presence of shadows, cloud cover, and terrain slopes across some landform zones [54,55]. More specifically, shadows and slope effects might be more pronounced in mountainous regions [56] compared to plains. These geographic-specific discrepancies can significantly impact data quality and, consequently, model performance. By focusing on landform zones, the model is better adapted to account for and mitigate these issues, ensuring more reliable accuracy across diverse terrains.
Our study provides valuable insights into the impact of spatial heterogeneity on wheat yield estimation by using stratum-based ML models. Stratifying data is crucial for capturing localized variations within large and diverse regions, particularly at the sub-national level, as demonstrated in our research. Among the stratification methods tested, landform-based stratification is particularly recommended because it effectively accounts for critical geographic factors that directly influence agricultural productivity. This approach enables future studies to better target local conditions and optimize yield estimation accuracy in heterogeneous landscapes. Overlaying multiple classification methods, such as landform, climate, and agroecological zones, can also offer a more nuanced understanding of yield variability by capturing the interactions of multiple factors influencing agricultural productivity. However, this approach may result in a large number of smaller, more specific zones with fewer data samples in each, which can compromise the statistical robustness and reliability of ML-based yield predictions. Therefore, future studies should balance the benefits of increased granularity with the need for sufficient data representation within each stratum. This study also has some limitations that could be addressed in future research. The ML models were trained using data from only one agricultural year (2020–2021) and therefore do not account for temporal variability, such as annual climatic fluctuations. Future research could benefit from incorporating data from multiple agricultural seasons. Additionally, the samples are unevenly distributed, with a higher density in certain areas (see Figure 2). This uneven distribution results in inadequate sample coverage across all zones present in the used LCS datasets, leading to the exclusion or merging of some zones, particularly in the landform classification. While the stratum-based ML approach improves model performance by addressing spatial heterogeneity using the LCS map, future studies could further enhance model robustness by incorporating additional samples in underrepresented areas. Furthermore, the study focuses on a single country and is also limited to wheat. Therefore, the generalizability capability of the stratum-based ML across should be further investigated across different crops, agricultural practices, and conditions from different countries.
5. Conclusions
This study aimed to estimate wheat yield at the field level in Morocco by employing Sentinel-1 and Sentinel-2 satellite data across an extensive study area. The results demonstrate that the XGBoost model consistently outperformed other ML models in yield prediction. Furthermore, the study reveals that training models on homogeneous zones, delineated by landform, climate, and agroecological classifications, significantly improves predictive accuracy compared to models trained on the entire study area. Notably, the use of landform-based zoning proved particularly effective in capturing local variations resulting from different management practices and environmental conditions.
These findings highlight the importance of developing stratum-based ML models that account for spatial heterogeneity in yield estimation models, offering a solution for improving the precision of agricultural predictions at different spatial scales. Future research should explore the applicability of stratum-based ML across multiple agricultural seasons to account for temporal variability and further investigate the integration of additional variables, such as socio-economic factors and farm management data, to refine yield predictions. Finally, the generalization capability of stratum-based ML should be tested across various countries with different environmental conditions and agricultural management practices.
Author Contributions
Conceptualization, K.K. and M.B.; Data curation, K.K.; Formal analysis, K.K.; Funding acquisition, A.L. and A.C.; Investigation, K.K., A.L., M.B. and A.S.; Methodology, K.K. and M.B.; Project administration, A.L. and A.C.; Resources, A.L. and A.C.; Software, K.K. and Q.D.; Supervision, M.B., A.L., A.S. and A.C.; Validation, K.K., A.L., M.B. and A.S.; Visualization, K.K., A.L., M.B. and A.S.; Writing—original draft, K.K.; Writing—review and editing, K.K., M.B., A.S. and A.L. All authors have read and agreed to the published version of the manuscript.
Funding
This project has been financially supported by the OCP group foundation throughout The Yield Gap project (reference: YP-OCP2024), and the Mohammed VI Polytechnic University (UM6P). The lead author received financial support from the UM6P and Yield Gap Project.
Data Availability Statement
The data presented in this study are available on request from the corresponding author.
Acknowledgments
The authors acknowledge all the technical support of those who helped in conducting the study. We also thank the academic editor and anonymous reviewers for accepting to review the manuscript.
Conflicts of Interest
The authors declare no conflicts of interest.
References
- Pantazi, X.E.; Moshou, D.; Alexandridis, T.; Whetton, R.; Mouazen, A. Wheat Yield Prediction Using Machine Learning and Advanced Sensing Techniques. Comput. Electron. Agric. 2016, 121, 57–65. [Google Scholar] [CrossRef]
- Ma, Y.; Zhang, Z.; Kang, Y.; Özdoğan, M. Corn Yield Prediction and Uncertainty Analysis Based on Remotely Sensed Variables Using a Bayesian Neural Network Approach. Remote Sens. Environ. 2021, 259, 112408. [Google Scholar] [CrossRef]
- Feng, L.; Wang, Y.; Zhang, Z.; Du, Q. Geographically and Temporally Weighted Neural Network for Winter Wheat Yield Prediction. Remote Sens. Environ. 2021, 262, 112514. [Google Scholar] [CrossRef]
- Li, C.; Ma, Z.; Wang, L.; Yu, W.; Tan, D.; Gao, B.; Feng, Q.; Guo, H.; Zhao, Y. Improving the Accuracy of Land Cover Mapping by Distributing Training Samples. Remote Sens. 2021, 13, 4594. [Google Scholar] [CrossRef]
- Joshi, A.; Pradhan, B.; Chakraborty, S.; Behera, M.D. Winter Wheat Yield Prediction in the Conterminous United States Using Solar-Induced Chlorophyll Fluorescence Data and XGBoost and Random Forest Algorithm. Ecol. Inform. 2023, 77, 102194. [Google Scholar] [CrossRef]
- Joshi, A.; Pradhan, B.; Gite, S.; Chakraborty, S. Remote-Sensing Data and Deep-Learning Techniques in Crop Mapping and Yield Prediction: A Systematic Review. Remote Sens. 2023, 15, 2014. [Google Scholar] [CrossRef]
- Mwaura, J.; Kenduiywo, B. County Level Maize Yield Estimation Using Artificial Neural Network. Model. Earth Syst. Environ. 2021, 7, 1417–1424. [Google Scholar] [CrossRef]
- Cao, J.; Zhang, Z.; Tao, F.; Zhang, L.; Luo, Y.; Zhang, J.; Han, J.; Xie, J. Integrating Multi-Source Data for Rice Yield Prediction across China Using Machine Learning and Deep Learning Approaches. Agric. For. Meteorol. 2021, 297, 108275. [Google Scholar] [CrossRef]
- Lyu, Y.; Wang, P.; Bai, X.; Li, X.; Ye, X.; Hu, Y.; Zhang, J. Machine Learning Techniques and Interpretability for Maize Yield Estimation Using Time-Series Images of MODIS and Multi-Source Data. Comput. Electron. Agric. 2024, 222, 109063. [Google Scholar] [CrossRef]
- Maimaitijiang, M.; Sagan, V.; Sidike, P.; Hartling, S.; Esposito, F.; Fritschi, F.B. Soybean Yield Prediction from UAV Using Multimodal Data Fusion and Deep Learning. Remote Sens. Environ. 2020, 237, 111599. [Google Scholar] [CrossRef]
- Sagan, V.; Maimaitijiang, M.; Bhadra, S.; Maimaitiyiming, M.; Brown, D.R.; Sidike, P.; Fritschi, F.B. Field-Scale Crop Yield Prediction Using Multi-Temporal WorldView-3 and PlanetScope Satellite Data and Deep Learning. ISPRS J. Photogramm. Remote Sens. 2021, 174, 265–281. [Google Scholar] [CrossRef]
- Fernandez-Beltran, R.; Baidar, T.; Kang, J.; Pla, F. Rice-Yield Prediction with Multi-Temporal Sentinel-2 Data and 3D CNN: A Case Study in Nepal. Remote Sens. 2021, 13, 1391. [Google Scholar] [CrossRef]
- Marshall, M.; Belgiu, M.; Boschetti, M.; Pepe, M.; Stein, A.; Nelson, A. Field-Level Crop Yield Estimation with PRISMA and Sentinel-2. ISPRS J. Photogramm. Remote Sens. 2022, 187, 191–210. [Google Scholar] [CrossRef]
- Guo, Z.; Chamberlin, J.; You, L. Smallholder Maize Yield Estimation Using Satellite Data and Machine Learning in Ethiopia. Crop Environ. 2023, 2, 165–174. [Google Scholar] [CrossRef]
- Lobell, D.B. The Use of Satellite Data for Crop Yield Gap Analysis. Field Crops Res. 2013, 143, 56–64. [Google Scholar] [CrossRef]
- Lobell, D.B.; Thau, D.; Seifert, C.; Engle, E.; Little, B. A Scalable Satellite-Based Crop Yield Mapper. Remote Sens. Environ. 2015, 164, 324–333. [Google Scholar] [CrossRef]
- Paudel, D.; Boogaard, H.; de Wit, A.; Janssen, S.; Osinga, S.; Pylianidis, C.; Athanasiadis, I.N. Machine Learning for Large-Scale Crop Yield Forecasting. Agric. Syst. 2021, 187, 103016. [Google Scholar] [CrossRef]
- Lobell, D.; Di Tommaso, S.; You, C.; Yacoubou Djima, I.; Burke, M.; Kilic, T. Sight for Sorghums: Comparisons of Satellite- and Ground-Based Sorghum Yield Estimates in Mali. Remote Sens. 2019, 12, 100. [Google Scholar] [CrossRef]
- Jin, Z.; Azzari, G.; You, C.; Di Tommaso, S.; Aston, S.; Burke, M.; Lobell, D.B. Smallholder Maize Area and Yield Mapping at National Scales with Google Earth Engine. Remote Sens. Environ. 2019, 228, 115–128. [Google Scholar] [CrossRef]
- Goodchild, M.F.; Li, W. Replication across Space and Time Must Be Weak in the Social and Environmental Sciences. Proc. Natl. Acad. Sci. USA 2021, 118, e2015759118. [Google Scholar] [CrossRef]
- Meyer, H.; Pebesma, E. Predicting into Unknown Space? Estimating the Area of Applicability of Spatial Prediction Models. Methods Ecol. Evol. 2021, 12, 1620–1633. [Google Scholar] [CrossRef]
- Zhou, W.; Liu, Y.; Ata-Ul-Karim, S.T.; Ge, Q.; Li, X.; Xiao, J. Integrating Climate and Satellite Remote Sensing Data for Predicting County-Level Wheat Yield in China Using Machine Learning Methods. Int. J. Appl. Earth Obs. Geoinf. 2022, 111, 102861. [Google Scholar] [CrossRef]
- Li, M.; Zhao, J.; Yang, X. Building a New Machine Learning-Based Model to Estimate County-Level Climatic Yield Variation for Maize in Northeast China. Comput. Electron. Agric. 2021, 191, 106557. [Google Scholar] [CrossRef]
- Deines, J.M.; Patel, R.; Liang, S.-Z.; Dado, W.; Lobell, D.B. A Million Kernels of Truth: Insights into Scalable Satellite Maize Yield Mapping and Yield Gap Analysis from an Extensive Ground Dataset in the US Corn Belt. Remote Sens. Environ. 2021, 253, 112174. [Google Scholar] [CrossRef]
- Paudel, D.; Marcos, D.; Wit, A.d.; Boogaard, H.; Athanasiadis, I.N. A Weakly Supervised Framework for High-Resolution Crop Yield Forecasts. Environ. Res. Lett. 2023, 18, 094062. [Google Scholar] [CrossRef]
- Mohammed, I.; Marshall, M.; de Bie, K.; Estes, L.; Nelson, A. A Blended Census and Multiscale Remote Sensing Approach to Probabilistic Cropland Mapping in Complex Landscapes. ISPRS J. Photogramm. Remote Sens. 2020, 161, 233–245. [Google Scholar] [CrossRef]
- Huang, X.; Song, Y.; Yang, J.; Wang, W.; Ren, H.; Dong, M.; Feng, Y.; Yin, H.; Li, J. Toward Accurate Mapping of 30-m Time-Series Global Impervious Surface Area (GISA). Int. J. Appl. Earth Obs. Geoinf. 2022, 109, 102787. [Google Scholar] [CrossRef]
- Trivedi, M.B.; Marshall, M.; Estes, L.; de Bie, C.A.J.M.; Chang, L.; Nelson, A. Cropland Mapping in Tropical Smallholder Systems with Seasonally Stratified Sentinel-1 and Sentinel-2 Spectral and Textural Features. Remote Sens. 2023, 15, 3014. [Google Scholar] [CrossRef]
- Qiao, M.; He, X.; Cheng, X.; Li, P.; Luo, H.; Zhang, L.; Tian, Z. Crop Yield Prediction from Multi-Spectral, Multi-Temporal Remotely Sensed Imagery Using Recurrent 3D Convolutional Neural Networks. Int. J. Appl. Earth Obs. Geoinf. 2021, 102, 102436. [Google Scholar] [CrossRef]
- Knippertz, P.; Christoph, M.; Speth, P. Long-Term Precipitation Variability in Morocco and the Link to the Large-Scale Circulation in Recent and Future Climates. Meteorol. Atmos. Phys. 2003, 83, 67–88. [Google Scholar] [CrossRef]
- Born, K.; Christoph, M.; Fink, A.H.; Knippertz, P.; Paeth, H.; Speth, P. Moroccan Climate in the Present and Future: Combined View from Observational Data and Regional Climate Scenarios. In Climatic Changes and Water Resources in the Middle East and North Africa; Zereini, F., Hötzl, H., Eds.; Environmental Science and Engineering; Springer: Berlin/Heidelberg, Germany, 2008; pp. 29–45. ISBN 978-3-540-85047-2. [Google Scholar]
- Muñoz Sabater, J.; Dutra, E.; Agusti-Panareda, A.; Albergel, C.; Arduini, G.; Balsamo, G.; Boussetta, S.; Choulga, M.; Harrigan, S.; Hersbach, H.; et al. ERA5-Land: A State-of-the-Art Global Reanalysis Dataset for Land Applications. Earth Syst. Sci. Data 2021, 13, 4349–4383. [Google Scholar] [CrossRef]
- Meybeck, M.; Green, P.; Vörösmarty, C. A New Typology for Mountains and Other Relief Classes: An Application to Global Continental Water Resources and Population Distribution. Mt. Res. Dev. 2001, 21, 34–45. [Google Scholar] [CrossRef]
- Beck, H.; Zimmermann, N.; McVicar, T.; Vergopolan, N.; Berg, A.; Wood, E. Present and Future Köppen-Geiger Climate Classification Maps at 1-Km Resolution. Sci. Data 2018, 5, 180214. [Google Scholar] [CrossRef]
- Sebastian, K. Agro-Ecological Zones of Africa. 2009. Available online: https://w.cradall.org/sites/default/files/atlasafricanag_all_2.pdf (accessed on 15 September 2024).
- Gorelick, N.; Hancher, M.; Dixon, M.; Ilyushchenko, S.; Thau, D.; Moore, R. Google Earth Engine: Planetary-Scale Geospatial Analysis for Everyone. Remote Sens. Environ. 2017, 202, 18–27. [Google Scholar] [CrossRef]
- Rouse, J.W.; Haas, R.H.; Schell, J.A.; Deering, D.W. Monitoring Vegetation Systems in the Great Plains with ERTS; NASA: Washington, DC, USA, 1974. [Google Scholar]
- Yang, Z.; Willis, P.; Mueller, R. Impact of Band-Ratio Enhanced AWIFS Image on Crop Classification Accuracy. 2008. Available online: https://www.asprs.org/a/publications/proceedings/pecora17/0041.pdf (accessed on 15 September 2024).
- Hunt, E.R.; Rock, B.N. Detection of Changes in Leaf Water Content Using Near- and Middle-Infrared Reflectances. Remote Sens. Environ. 1989, 30, 43–54. [Google Scholar] [CrossRef]
- Dash, J.; Curran, P.J. The MERIS Terrestrial Chlorophyll Index. Available online: https://www.tandfonline.com/doi/abs/10.1080/0143116042000274015 (accessed on 14 September 2024).
- Gitelson, A.; Viña, A.; Rundquist, D.; Arkebauer, T.; Keydan, G.; Leavitt, B.; Ciganda, V.; Burba, G.; Suyker, A.; Gitelson, C. Relationship between Gross Primary Production and Chlorophyll Content in Crops: Implications for the Synoptic Monitoring of Vegetation Productivity. J. Geophys. Res. 2006, 111, 13. [Google Scholar] [CrossRef]
- Press, W.H.; Teukolsky, S.A. Savitzky-Golay Smoothing Filters. Comput. Phys. 1990, 4, 669–672. [Google Scholar] [CrossRef]
- Lee, J.-S. Digital Image Enhancement and Noise Filtering by Use of Local Statistics. IEEE Trans. Pattern Anal. Mach. Intell. 1980, PAMI-2, 165–168. [Google Scholar] [CrossRef]
- Eberly, L.E. Multiple Linear Regression. Methods Mol. Biol. 2007, 404, 165–187. [Google Scholar] [CrossRef]
- Ho, T.K. Random Decision Forests. In Proceedings of the 3rd International Conference on Document Analysis and Recognition, Montreal, QC, Canada, 14–16 August 1995; Volume 1, pp. 278–282. [Google Scholar]
- Breiman, L. Random Forests. Mach. Learn. 2001, 45, 5–32. [Google Scholar] [CrossRef]
- Belgiu, M.; Drăguţ, L. Random Forest in Remote Sensing: A Review of Applications and Future Directions. ISPRS J. Photogramm. Remote Sens. 2016, 114, 24–31. [Google Scholar] [CrossRef]
- Chen, T.; Guestrin, C. XGBoost: A Scalable Tree Boosting System. In Proceedings of the 22nd ACM SIGKDD International Conference on Knowledge Discovery and Data Mining, San Francisco, CA, USA, 13 August 2016; pp. 785–794. [Google Scholar]
- Jeffries, G.R.; Griffin, T.S.; Fleisher, D.H.; Naumova, E.N.; Koch, M.; Wardlow, B.D. Mapping Sub-Field Maize Yields in Nebraska, USA by Combining Remote Sensing Imagery, Crop Simulation Models, and Machine Learning. Precis. Agric. 2020, 21, 678–694. [Google Scholar] [CrossRef]
- van Klompenburg, T.; Kassahun, A.; Catal, C. Crop Yield Prediction Using Machine Learning: A Systematic Literature Review. Comput. Electron. Agric. 2020, 177, 105709. [Google Scholar] [CrossRef]
- Meroni, M.; Waldner, F.; Seguini, L.; Kerdiles, H.; Rembold, F. Yield Forecasting with Machine Learning and Small Data: What Gains for Grains? Agric. For. Meteorol. 2021, 308–309, 108555. [Google Scholar] [CrossRef]
- Padilla, M.; Stehman, S.V.; Litago, J.; Chuvieco, E. Assessing the Temporal Stability of the Accuracy of a Time Series of Burned Area Products. Remote Sens. 2014, 6, 2050–2068. [Google Scholar] [CrossRef]
- Kaijage, B.; Belgiu, M.; Bijker, W. Spatially Explicit Active Learning for Crop-Type Mapping from Satellite Image Time Series. Sensors 2024, 24, 2108. [Google Scholar] [CrossRef]
- Ju, J.; Roy, D.P. The Availability of Cloud-Free Landsat ETM+ Data over the Conterminous United States and Globally. Remote Sens. Environ. 2008, 112, 1196–1211. [Google Scholar] [CrossRef]
- Li, J.; Roy, D.P. A Global Analysis of Sentinel-2A, Sentinel-2B and Landsat-8 Data Revisit Intervals and Implications for Terrestrial Monitoring. Remote Sens. 2017, 9, 902. [Google Scholar] [CrossRef]
- Giles, P.T. Remote Sensing and Cast Shadows in Mountainous Terrain. Photogramm. Eng. Remote Sens. 2001, 67, 833–839. [Google Scholar]
Disclaimer/Publisher’s Note: The statements, opinions and data contained in all publications are solely those of the individual author(s) and contributor(s) and not of MDPI and/or the editor(s). MDPI and/or the editor(s) disclaim responsibility for any injury to people or property resulting from any ideas, methods, instructions or products referred to in the content. |
© 2024 by the authors. Licensee MDPI, Basel, Switzerland. This article is an open access article distributed under the terms and conditions of the Creative Commons Attribution (CC BY) license (https://creativecommons.org/licenses/by/4.0/).

