Article

Spatiotemporal Variability in Snow and Land Cover in Sefid-Rud Basin, Iran

1
Department of Geography, Faculty of Literature and Humanities, Razi University, Tagh Bostan, Kermanshah 6714414971, Iran
2
Division of Geochronology and Environmental Isotopes, Institute of Physics, Silesian University of Technology, Konarskiego 22B, 44-100 Gliwice, Poland
3
Department of Geomorphology, Faculty of Natural Resources, University of Kurdistan, Pasdaran Boulevard, Sanandaj 6617715175, Iran
4
Department of Earth Sciences & CERI Research Centre, Sapienza University of Rome, Piazzale Aldo Moro, 5, 00185 Rome, Italy
*
Authors to whom correspondence should be addressed.
Sustainability 2024, 16(21), 9381; https://doi.org/10.3390/su16219381
Submission received: 22 September 2024 / Revised: 15 October 2024 / Accepted: 23 October 2024 / Published: 29 October 2024
(This article belongs to the Section Environmental Sustainability and Applications)

Abstract

:
Snow cover has a key role in balancing the Earth’s surface temperature and can help in filling rivers and reservoirs. In this study, 8-day MOD10A2 images are employed to monitor the spatiotemporal changes in snow cover in the Sefid-Rud basin and its eleven sub-basins during 2000–2019. The non-parametric Mann–Kendall (MK) test and its associated Sen’s slope estimator are utilized to estimate the trends in annual, seasonal, and monthly snow cover changes. The Sen’s slope results show a decrease in the snow cover for the basin, statistically significant toward the central and southern parts of the basin. In the winter season, a decreasing trend is observed, where its decreasing rate is higher than the annual rate. The trends in the calendar months are like the seasons, i.e., December, January, and February exhibit a decreasing trend, like the winter season. The Goltapeh-Zarinabad and Ghorveh-Dehgolan sub-basins show decreasing snow cover rates of 0.51 and 0.68 (%/year) during 2000–2019, respectively, the only two sub-basins whose gradients are statistically significant at the 95% confidence level. The Pearson correlation analysis between elevation and snow cover for each year shows that the highest and lowest correlations are 0.81 for 2007 and 0.59 for 2017. Finally, analysis of the MCD12Q1 land cover data shows that a significant portion of non-vegetated lands have turned into grasslands, mainly in the central part of the basin, where the significant gradual snow cover decline is observed. The results can guide stakeholders and policymakers in the development of a sustainable environment in the face of climate change.

1. Introduction

Snow is a crucial reflector of incoming short-wave solar radiation, playing a key role in the Earth’s energy balance and atmospheric budget [1,2]. The temporal and spatial distribution of snow cover through its accumulation stage and melting cycle affect many vital and non-vital processes of the Earth [3,4,5]. Snow melt eventually replenishes groundwater reserves, provides water supply for agriculture, and it is an important source of soil moisture during the spring [6,7,8]. According to the statistics, about 17% of the world’s population is dependent on seasonal snow melting and ice melting of glaciers for their water supply [9,10]. Snow cover has an economic impact on communities that need road access in winter and also on their agricultural activities [11]. Furthermore, understanding snow mechanisms in time and space and their impact on wildlife and ecosystems is important [12,13]. Therefore, monitoring snow cover is a crucial task for decision making and planning to maintain sustainable environment and agriculture, etc.
Several studies have reported downward and sometimes upward trends in snow cover around the world [14,15,16,17]. In the spring season of the Northern Hemisphere, the area of snowfall and glaciers has decreased at a rate of 1.6% per decade since the middle of the 19th century. In June, during the years 1967 to 2012, a decrease of 11.7% has been seen in every decade due to the increase in the summer temperature. Due to the premature melting of the snow cover and the transfer of snow-melt runoff from spring to winter, there is a possibility of increasing winter floods and summer drought [18].
Mountains are the water sources of the world. They have a key role in providing water to their downslope regions. At least one-sixth of the world’s population depends on water sources from mountains. At the same time, mountains have created a lot of climatic diversity on a spatial scale due to their extreme height changes in small horizontal distances [19,20]. In this situation, remote sensing data are a useful tool for investigating various phenomena and have a high potential for providing suitable spatial data to describe snow’s spatial and temporal patterns. It has been proven that remote sensing is an effective technique for studying snow characteristics at the local and global levels, especially due to the wide snow areas and the difficulties in obtaining ground estimates in cold regions [21,22,23].
Satellite remote sensing methods for mapping snow cover, developed in the 1960s, have improved over time with the availability of data with favorable spatial and temporal resolutions [24]. Moderate Resolution Imaging Spectroradiometer (MODIS) is a sensor designed for environmental monitoring that is onboard Terra and Aqua satellites launched in 1999 and 2002, respectively, by National Aeronautics and Space Administration (NASA), Washington, DC, USA. Recently, the use and application of MODIS retrievals have increased due to their high efficiency in analyzing snow’s spatiotemporal changes. The display of snow cover at a daily interval in MODIS images provides an overview of the timing and amount of snow cover remotely [25,26,27].
The Mann–Kendall (MK) method is a non-parametric trend test, meaning that it does not have any assumption on the distribution of the data [28]. The Sen’s slope algorithm uses a median technique, which make it insensitive to outliers as compared to average-based trend estimation models like linear regression [29]. The MK method and Sen’s slope have been utilized in many fields, including remote sensing, climate, and hydrological research [30,31,32].
Azizi et al. [33] studied spatiotemporal dynamics of snow cover on the southern slopes of Alborz. They employed MODIS images for their research. According to their results, obtained from an MK trend analysis, the snow cover has increased in early autumn and winter and decreased in the spring season, which indicates a decline in the period of snow continuity and an increase in the period of snow melting. Ahmad et al. [18] investigated the trend in annual and seasonal changes in snow over 17 years using 8-day MODIS images and an MK trend analysis in the Chitral River Basin of Pakistan. Based on their results, there is an increasing trend in the amount of snow cover in high-altitude areas. Anjum et al. [34] utilized MODIS images and an MK trend analysis to study snow cover change in the Hindu Kush Mountains, Pakistan. Their results showed a declining trend in winter and a rising trend in other seasons.
Many other studies have been conducted on snow cover changes. Gao et al. [35] investigated the spatial and temporal changes in snow cover in the years 1979 to 2005 in eastern Tibet, showing a reduction in the snowfall at lower altitudes. Nemat [36] analyzed the surface and height changes in the glaciers in the Takht Suleiman region in the last half century (from 1955 to 2010) using different satellite images with appropriate spatial resolutions. Their findings indicated that the thickness of the glaciers in their study region has decreased from 1.5 to 0.35 m/year. Shafiq et al. [37] calculated the seasonal and inter-annual components of snow cover changes in the Himalayan Mountains located in Indian Kashmir using 8-day MODIS images between 2000 and 2016. Their results showed a general increase in the amount of snow. Malmros et al. [38] investigated changes in snow surface and snow albedo with MODIS in the central Andes of Chile and Argentina. According to their results, there was a downward trend in all cases. Rathore et al. [39] conducted a study in the Chenab basin of India using remote sensing images to investigate the variability in snow cover between 2004 and 2013. In their study, the trend in snow accumulation and reduction in the sub-basins was estimated, showing an increasing trend. Different results have been obtained from research conducted in different regions.
In the current research, the Sefid-Rud basin, one of the most important watersheds of Iran, has been studied using MODIS products, where its water resources are particularly important in terms of drinking and agricultural water. The present work complements the results of an earlier study by the authors on the basin [10], in that new snow cover images are utilized and the potential interconnections between snow cover, elevation, and land cover are investigated. The trend in snow cover and its spatial and temporal changes have been investigated with different methods, and according to the area of the basin and diversity in terms of topography, geography, and climate, the results have been compared in its different sub-basins to unravel the role of different factors in the possible changes in snow cover.
The main contributions of the present work are listed below.
  • Visualizing and analyzing temporal changes in snow cover for the Sefid-Rud basin.
  • Illustrating the spatiotemporal dynamic of average snow cover for each month of the winter, i.e., December, January, and February.
  • Estimating the snow cover trend for the Sefid-Rud basin and its sub-basins for the period 2000–2019 by an MK trend analysis.
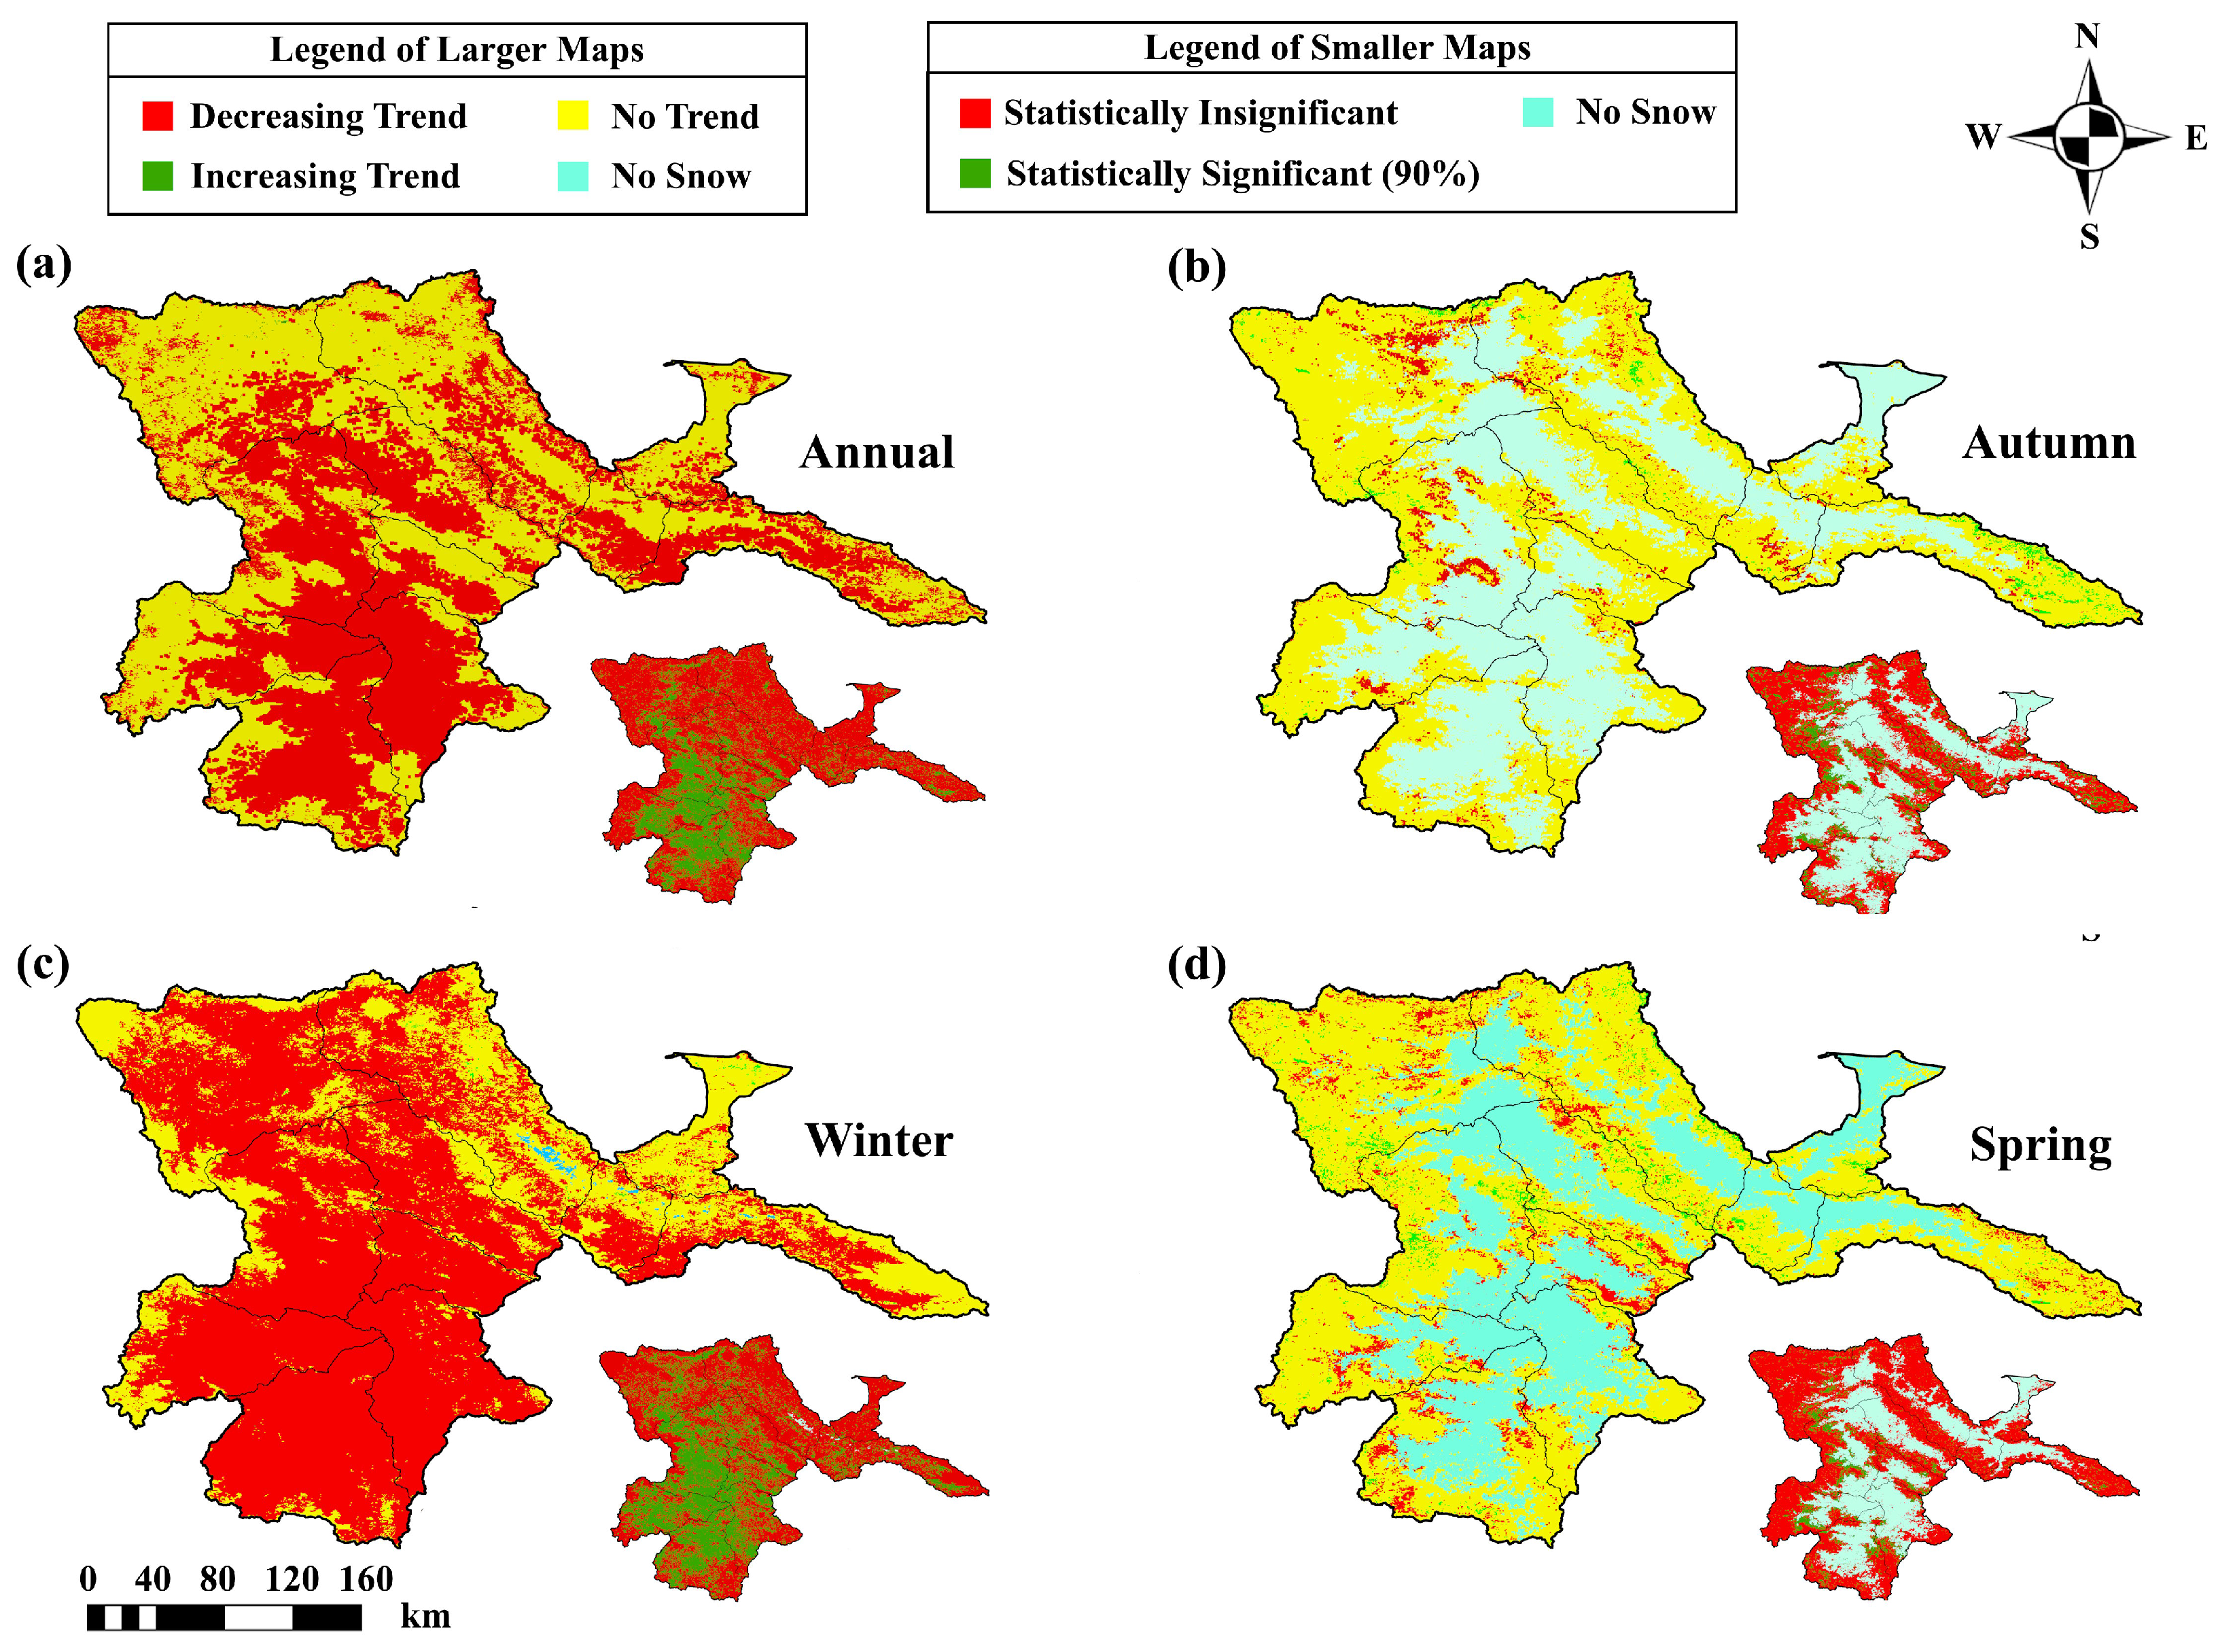
  • Estimating and illustrating the snow cover trends with their statistical significance for the period 2000–2019 at annual, seasonal, and monthly scales by an MK trend analysis.
  • Calculating the Pearson correlation between elevation and snow cover during the winter of each year for the Sefid-Rud basin.
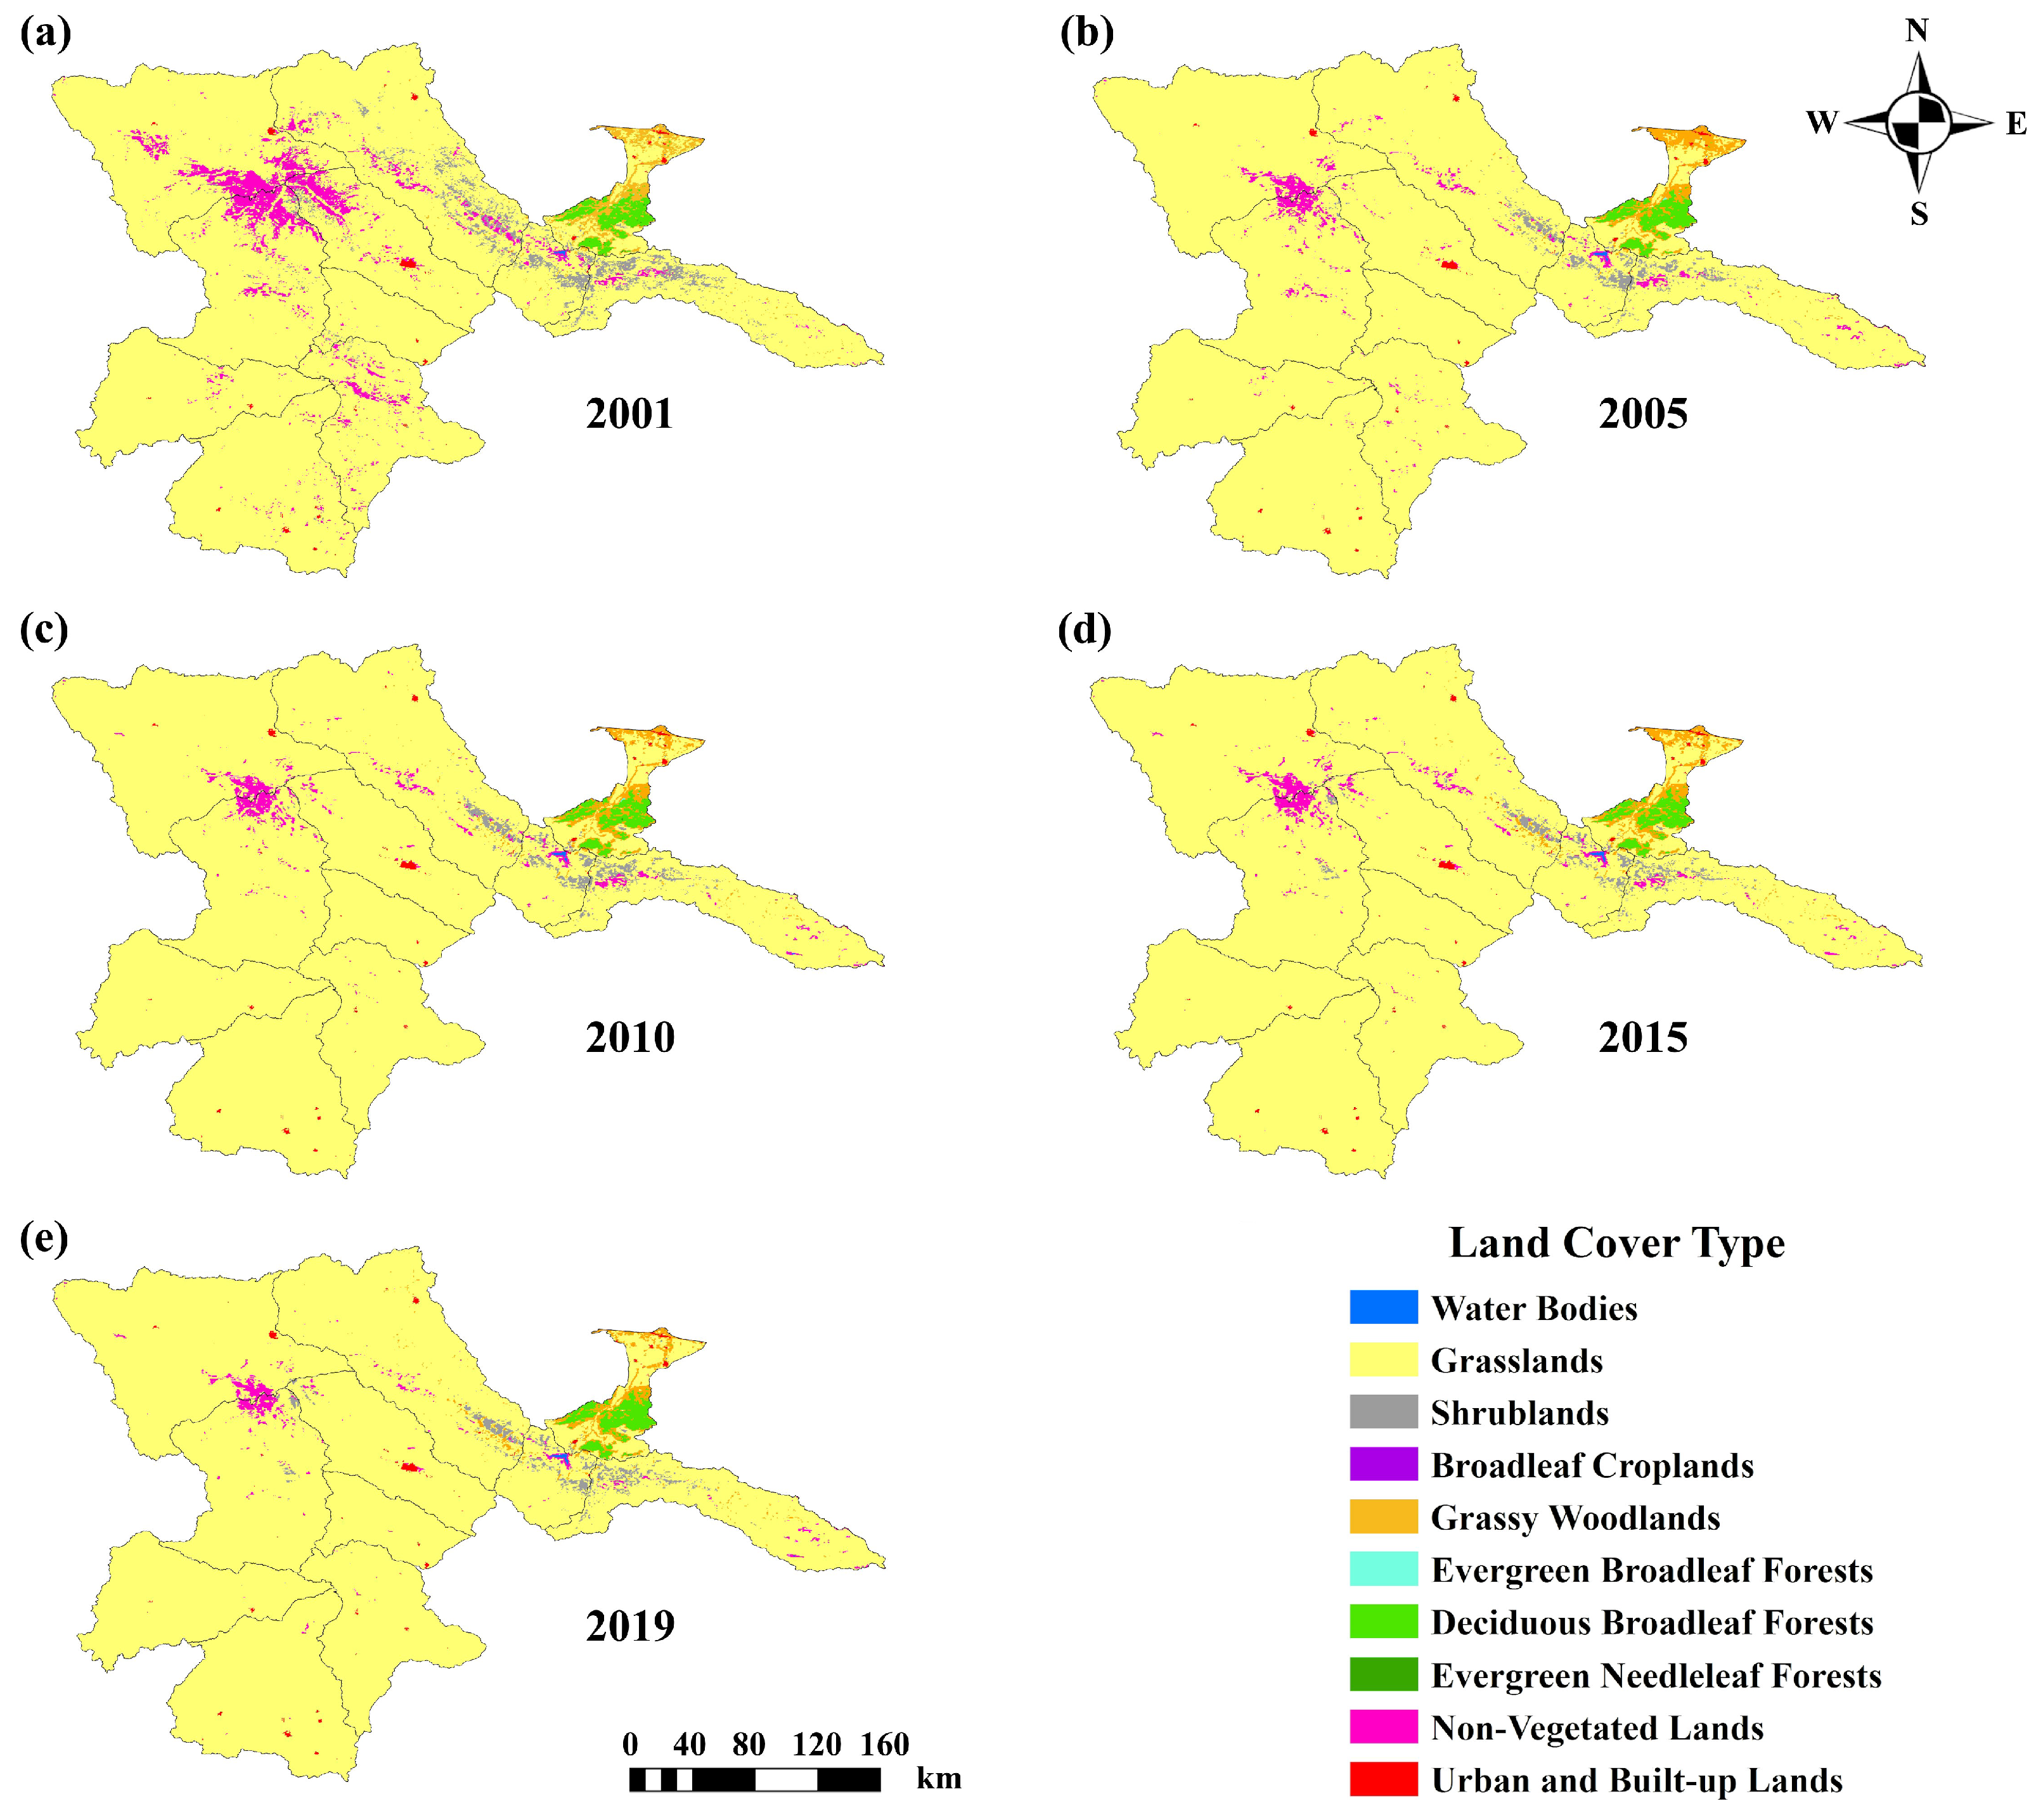
  • Illustrating land cover changes and investigating their relationships with snow cover dynamics.
The remainder of the current work is structured as follows. Section 2 presents the study region, datasets, and methods utilized. The results are presented in Section 3. Finally, the discussion and conclusions are presented in Section 4 and Section 5, respectively.

2. Materials and Methods
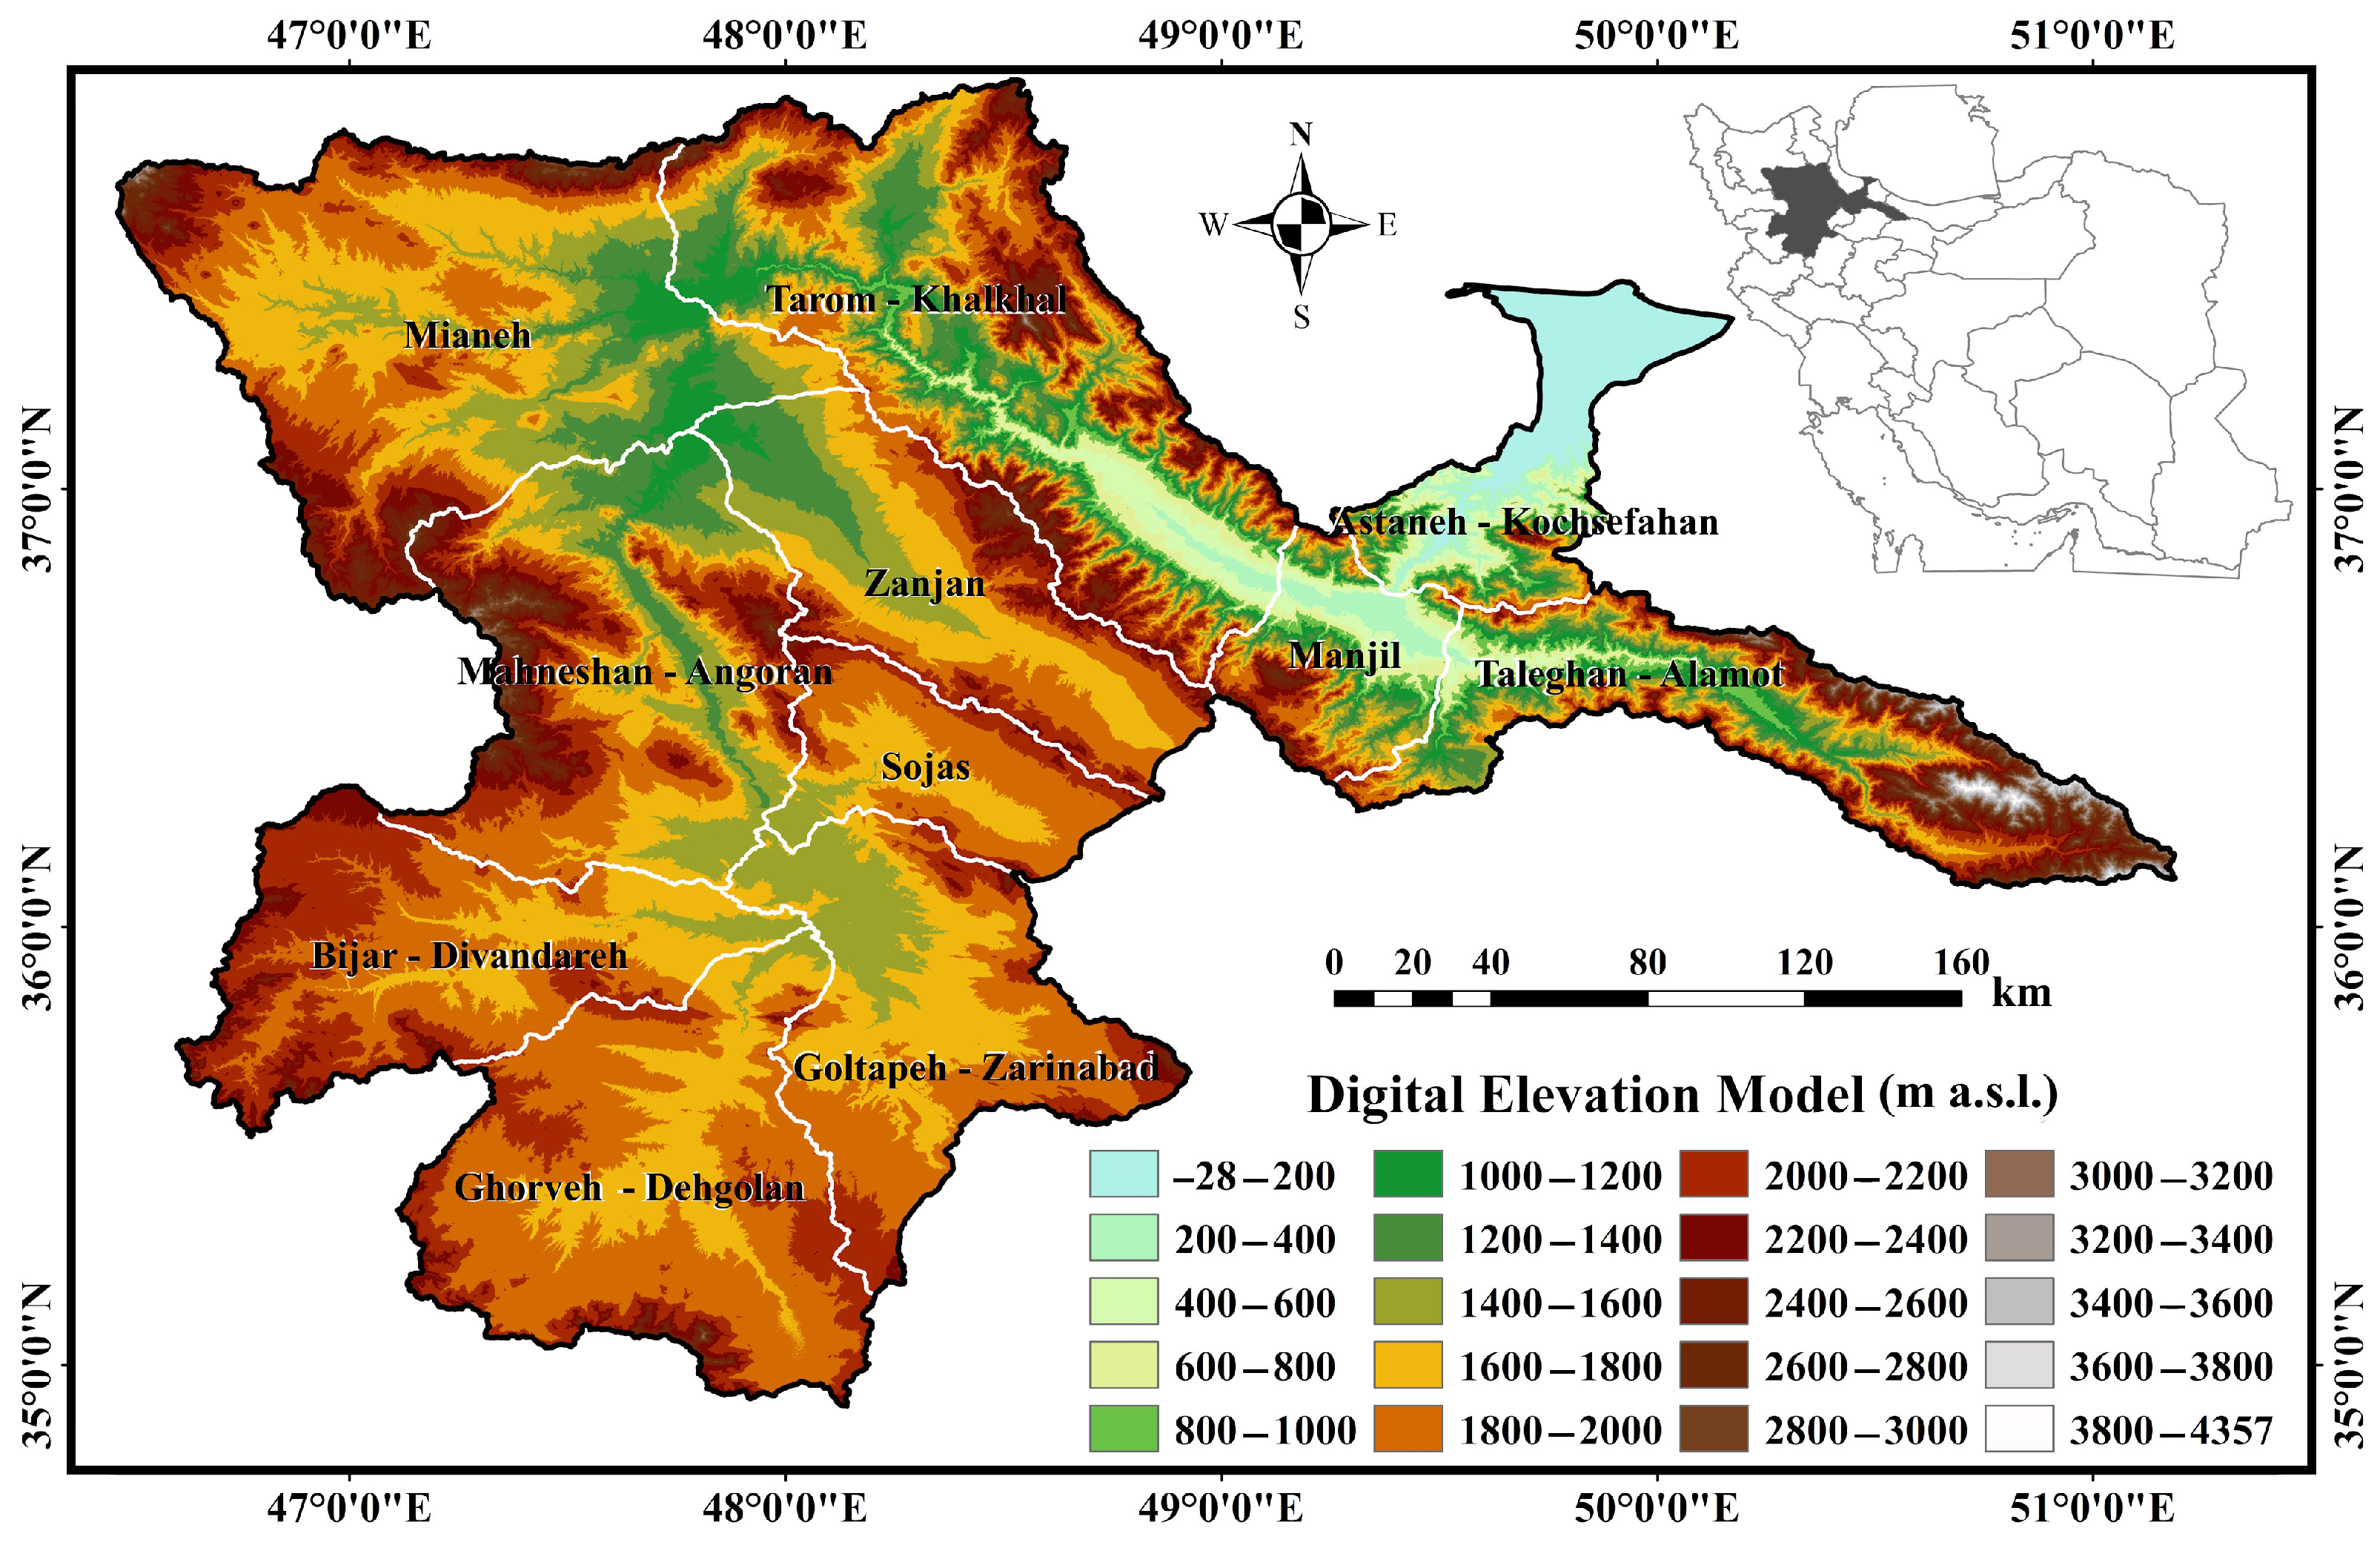
2.1. Study Region

Sefid-Rud (white river) basin, with an area of more than 59,000 km2, is one of Iran’s largest basins and a subset of the Caspian Sea regional basin (Figure 1). Its main waterway is Sefid-Rud, the second longest river in Iran. Sefid-Rud has a length of about 750 km and is the greatest river in the north of Iran, formed by the combination of two rivers: Shah-Rud and Qezel-Ozan. The Sefid-Rud basin consists of 11 sub-basins, among which Mianeh is the largest and Manjil is the smallest. There is a great height variation in this basin. Based on this, the Astaneh-Kochsefahan sub-basin with a height of 28 m, with respect to the mean sea level (m.s.l.), on the coast of the Caspian Sea, has the lowest height, and the Taleghan-Alamot sub-basin in the Alborz Mountains, at about 4357 m, has the highest elevation. Due to the Zagros and Alborz Mountains and plains and flat areas, such as the beaches of the Caspian Sea, in this basin, the changes in slope are severe, ranging from 0 to 69 degrees. The most common slope of the basin is between 0 and 3 degrees. Regarding slope direction (aspect), north and south directions are the most frequent.
The Sefid-Rud basin, situated on the southwest coastal plain, has a high precipitation rate and a temperate, humid environment. On average, the basin receives between 1850 mm (Anzali synoptic station) and 1344 mm (Rasht synoptic station) of precipitation annually. The Anzali, Lahijan, and Rasht synoptic stations have an annual mean temperature of about 16 °C [40]. In the study region, summers are usually warm and dry, with temperatures that can reach above 30 °C, while winters are usually cold and wet, with significant snowfall in the higher areas. Its proximity to the Caspian Sea results in high humidity levels being widespread. Elevation, closeness to the Caspian Sea, and dominant wind patterns all affect this climate.

2.2. Datasets and Preprocessing

Table 1 lists the datasets employed in the present study. To determine the extent of snow, the snow cover products of the MODIS sensor were utilized. For this purpose, MOD10A2 snow cover images with an 8-day sequence for the period 2000–2019 were downloaded; see [41] and Table 20 of [42]. The MOD10A2 product was employed due to the high accuracy in determining the snow cover and the short-time interval between the images. The MODIS snow cover data are based on a snow mapping model over an 8-day period which utilizes the Normalized Difference Snow Index [41]. The quality assessment (QA) data associated with this product are utilized to flag the pixels with high uncertainty due to clouds and according to the L1B input data and solar zenith angle data; see the product guide, Section 9 of [42]. After cloud masking, the MOD10A2 snow cover pixels were extracted to produce the binary snow cover product, i.e., snow covered and not snow covered [18,37].
To investigate the relationships between snow cover and land cover dynamics, the MODIS land cover images (MCD12Q1) at a 500 m spatial resolution for the period 2001–2019 were also utilized herein, 19 images in total (one image per year). These images were obtained from user-based classifications of the MODIS reflectance data (both the Terra and Aqua satellites). The MCD12Q1 annual product employed in the present research is based on the annual leaf area index and has 11 land cover types (LC type 3). Image subsetting within the basin and sub-basins was implemented though the open-source Quantum Geographic Information System (QGIS) software (version 2.18 https://qgis.org/).
To perform correlation analysis, draw the height map of the basin, and investigate the changes in snow at different heights, the Global Digital Elevation Model (GDEM) of the Advanced Spaceborne Thermal Emission and Reflection Radiometer (ASTER) sensor with a 30 m spatial resolution, created by the Sensor Information Laboratory Corporation (SILC) in Tokyo, Japan, was also utilized [43]. To perform the correlation analysis, GDEM was downsampled to 500 m by a median technique to align with the resolution of the MODIS snow cover images.

2.3. Methods

The workflow of the present study is illustrated in Figure 2. This research investigates and calculates monthly, seasonal, and annual snow cover areas for the Sefid-Rud basin during the period 2000–2019 using MODIS products.
To calculate the annual snow area, the water year is considered, which starts from the first of September (the beginning of the rainy season). Various methods are applied to investigate the trend in snow cover changes. In the first method, after calculating the snow cover of the basin in the months of the study period, the snow cover images for the months of the snowy season of the basin are prepared in sequence in all the years of the study period to verify the possible changes in the snow trend visually. In another method, the percentage of snow cover of the basin and sub-basins for the statistical period 2000–2001 to 2018–2019 is compared and drawn in a graph. The percentage snow cover at annual, seasonal, or monthly scales is given by Equation (1).
SC = 100 k = 1 n S k / ( n A ) ,
where SC is snow cover for a year in percent, n is the number of images for the year (e.g., n = 46 ), S k is the snow cover of the clipped image k to the basin or its sub-basin, and A is the basin or sub-basin area. For the monthly scale, n is the number of images within the month (e.g., n = 4 ), and for the seasonal scale, n is the number of images within the season. Note that S k can be calculated by counting the number of snow pixels at a 500 m spatial resolution within a given region, and A can be determined by counting the total number of pixels at a 500 m spatial resolution within the given region.

2.3.1. Mann–Kendall and Sen’s Slope Estimator

To determine whether there is a statistically significant snow cover trend over the years at pixel level or sub-basin level, the modified MK test is utilized [28]. Furthermore, the Sen’s slope estimator is used to estimate the slope rate [29]. The slope rate of the changes per decade is calculated for all the pixels of the basin surface and for each sub-basin and the Sefid-Rud basin. This method is commonly utilized in analyzing trends in hydrological and meteorological time series [31,32]. An advantage of this model is its capability for processing time series that do not follow any particular distribution. However, the MK test is sensitive to seasonality and serial correlation. The zero hypothesis of this test indicates no statistically significant trend in the time series, and rejecting the null hypothesis signifies that there is a statistically significant trend in the time series. In the present study, the Sen’s slope estimator is also applied to estimate the slope of trend.
Mathematically, let x i be the values of the time series ( 1 i n ). The MK statistic S is expressed as
S = i = 1 n 1 j = i + 1 n sgn ( x j x i ) ,
where
sgn ( θ ) = + 1 , if θ > 0 , 0 , if θ = 0 , 1 , if θ < 0 .
The distribution of S is almost normal with an average equal to zero and standard deviation equal to σ = n ( n 1 ) ( 2 n + 5 ) / 18 when n 8 . The MK test statistic Z is provided by the following equation (standardized):
Z = ( S 1 ) / σ , if S > 0 , 0 , if S = 0 , ( S + 1 ) / σ , if S < 0 .
From this test, the time series has an increasing trend when Z > 0 , otherwise, the time series has a decreasing trend. When | Z | > Z 1 α / 2 , the trend is statistically significant, where α is the critical value. The Z value is checked against the two-tailed test Z 1 α / 2 (the theoretical value). The Sen’s slope estimator is also defined as
β = Median y j y i j i , 1 i < j n .
If β < 0 , a downward trend exists in the time series whose magnitude is | β | ; otherwise, an upward trend exists whose magnitude is β .

2.3.2. Pearson’s r

Pearson’s r describes the linear dependency between two variables u and v, defined by
r = i = 1 n ( u i u ¯ ) ( v i v ¯ ) i = 1 n ( u i u ¯ ) 2 i = 1 n ( v i v ¯ ) 2 ,
where n is the total number of data points, and u ¯ and v ¯ are the averages of u and v, respectively. Pearson’s r ranges from 1 to 1, where values from 0.3 to 0.3 signify an insignificant correlation, and values from 0.7 to 0.3 and from 0.3 to 0.7 signify linear dependency that is fuzzy. Also, when the values are less than 0.7 or more than 0.7 , there is a significant linear dependency [44]. In the present research, the Pearson’s r between snow cover (u) and elevation (v) is also calculated for each year. For this, for pixel i, the average snow cover of the winter season is calculated for the given year to obtain u i , where its corresponding aligned elevation value is v i . Herein, index i in Equation (6) ranges from 1 to n, where n is the total number of pixels at a resolution of 500 m, covering the entire basin.

3. Results

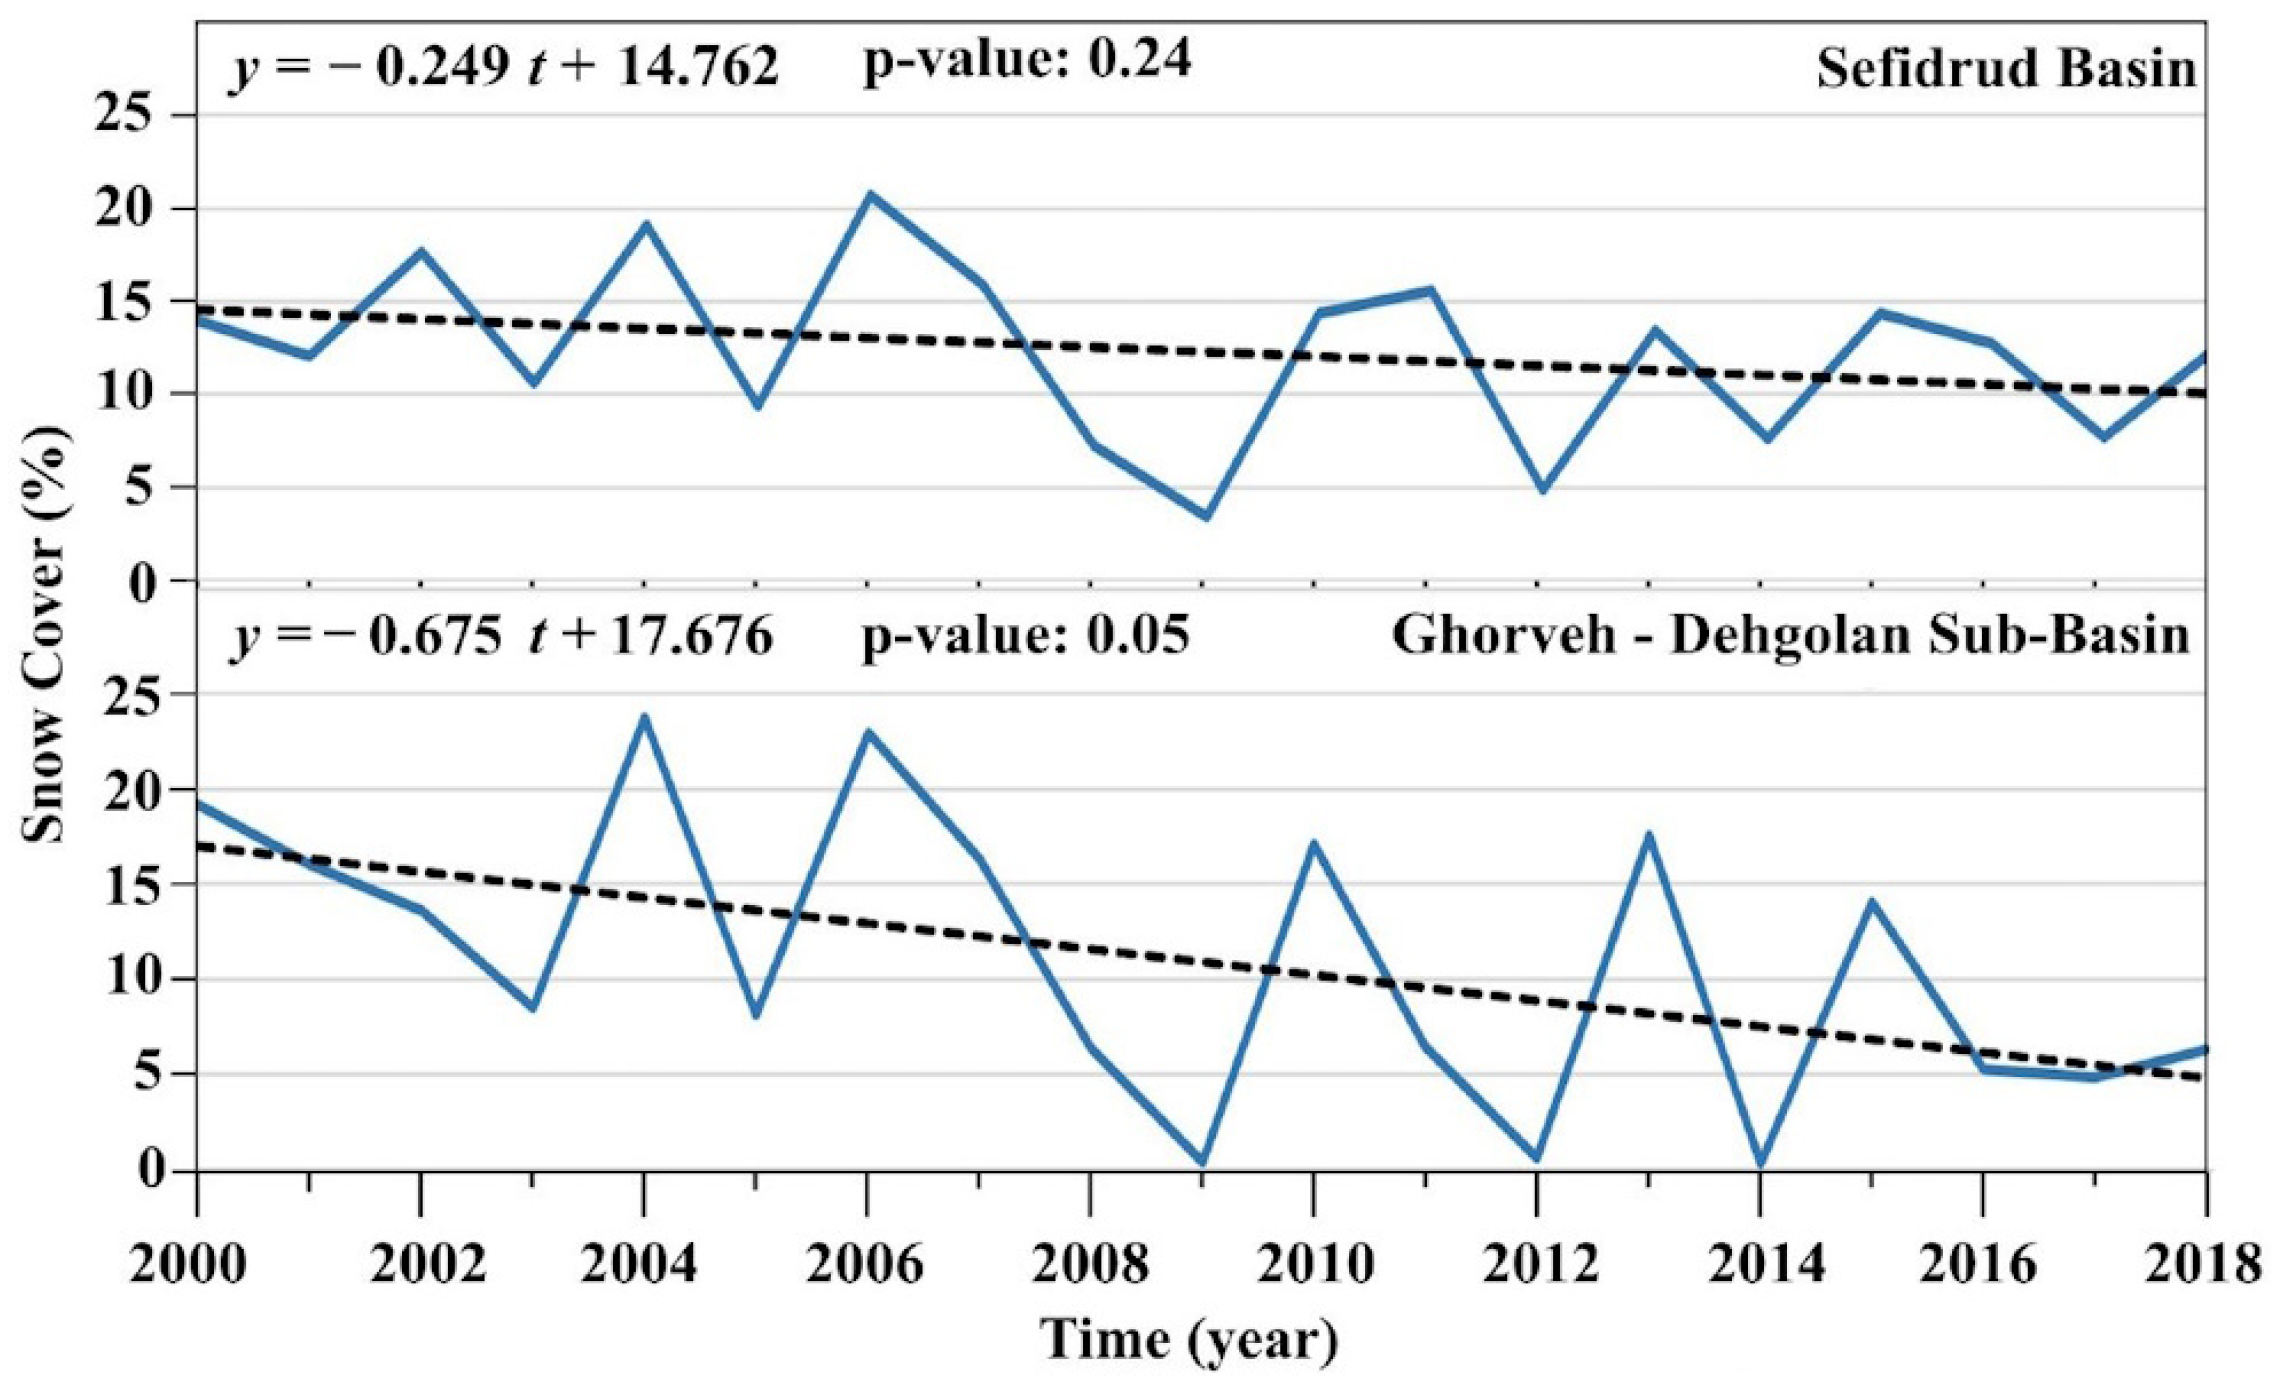
3.1. Temporal Analysis of Snow Cover

To investigate possible time differences and changes in the snow season in the Sefid-Rud basin, the time interval between the presence of snow cover and the end of snow melting during the years of the entire study period is verified. Figure 3 shows the temporal graph of the snow cover for the Sefid-Rud basin for the first and the last two years of the study period. The results indicate no significant inter-annual changes in the timing of the snow cover season. However, the amount of snow cover has decreased during the study period, but the time of the beginning and ending of the snow cover has not changed significantly.

3.2. Spatiotemporal Dynamic of Snow Cover

Based on the MODIS snow cover images for the period 2000–2019, the snow cover results of the Sefid-Rud basin for different winter months and years are produced. Figure 4 shows the spatiotemporal variations in snow cover for (a) December, (b) January, and (c) February. Note that the spatial resolution of these images is 5 km, and the percentage snow cover amount for each pixel (5 km) is obtained by counting the number of snow pixels (500 m) from MOD10A2 within the larger pixel (5 km), and then, normalizing it. Four classes are defined, namely, negligible snow cover (0–10%, in red), low snow cover (10–30%, in yellow), medium snow cover (30–70%, in green), and high snow cover (70–100%, in blue).
From Figure 4, December in 2002, 2006, 2015, January in 2005, 2007, 2008, 2011, and February in 2005, 2011, and 2017 exhibit relatively higher snow cover compared to other years. In addition, January shows the highest percentage of snow cover in most years compared to other months, meaning that January is the snowiest month of the year in the study region. In a few years, February and December show the highest snow cover.

3.3. Snow Cover Trends for the Sefid-Rud Basin and Its Sub-Basins

To examine the change process, an MK trend analysis is applied to the annual average snow cover for the Sefid-Rud basin and its sub-basins. The annual time series and their estimated trends for the Sefid-Rud basin and Ghorveh-Dehgolan sub-basin are displayed in Figure 5 as an example. The Sen’s slope and their p-values are listed in Table 2, showing that the Goltapeh-Zarinabad and Ghorveh-Dehgolan sub-basins have declining rates during 2000–2019, which are statistically significant at the 95% confidence level. Table 2 also shows seven sub-basins and the Sefid-Rud basin have decreasing trend during the study period, but they are statistically insignificant. The sub-basins of Tarom-Khalkhal and Taleghan-Alamot also have statistically insignificant increasing trends in snow cover during the study period.

3.4. Snow Cover Trend Results and Their Statistical Significance

To investigate changes in snow cover at the pixel level, an MK trend analysis is applied to the time series corresponding to each pixel to generate slope results. At this stage, the trend in changes is analyzed at annual, seasonal, and monthly scales. From Figure 6a,c, annually and for the winter season, most of the areas with a decreasing trend in the central and southern parts of the basin are significant at the 90% confidence level.
According to the results, the greatest reduction in the snow area throughout the year happened in the winter season and the months of this season, i.e., December, January, and February. The declining trend in the snow area in this season is evident in most parts of the basin. Like the annual trend, in the winter season, the trend is significant in most of the decreasing areas, and the lack of significance is seen mostly in the areas where there is no decreasing trend and there is stability; see Figure 6c.
Figure 6b,d show that a statistically significant decline can almost only be seen in areas with reduced snow cover. Considering that there is no snow cover in most areas of the basin during the autumn and spring seasons, the results mostly show stability and unchanging trends, and the decreasing/increasing trends in these seasons are relatively much less and insignificant.
At the monthly scale, January, with the highest snow area, has the largest decrease in snow area compared to other months, and its trend results and their significance are as for the winter season, Figure 7c. The months of December and February, shown, respectively, in Figure 7b,d, also have a decreasing trend in most areas of the basin. March and April, illustrated, respectively, in Figure 7e,f, are considered representative of the spring season, and November, Figure 7a, is representative of the autumn season. In these three months, most of the areas of the basin have no snow, and in other areas where there are few days with snow cover, the trend in changes is mostly insignificant or decreasing.

3.5. Correlation Analysis Between Elevation and Snow Cover

The condition of snow cover in relation to elevation during the study period is also investigated. The Pearson correlation results for each year are listed in Table 3.
One can observe that elevation is positively correlated with snow cover for all the years. The years 2007 and 2011 have the highest correlation ( r 0.8 ), and the years 2015 and 2017 have the lowest correlation ( r 0.6 ).

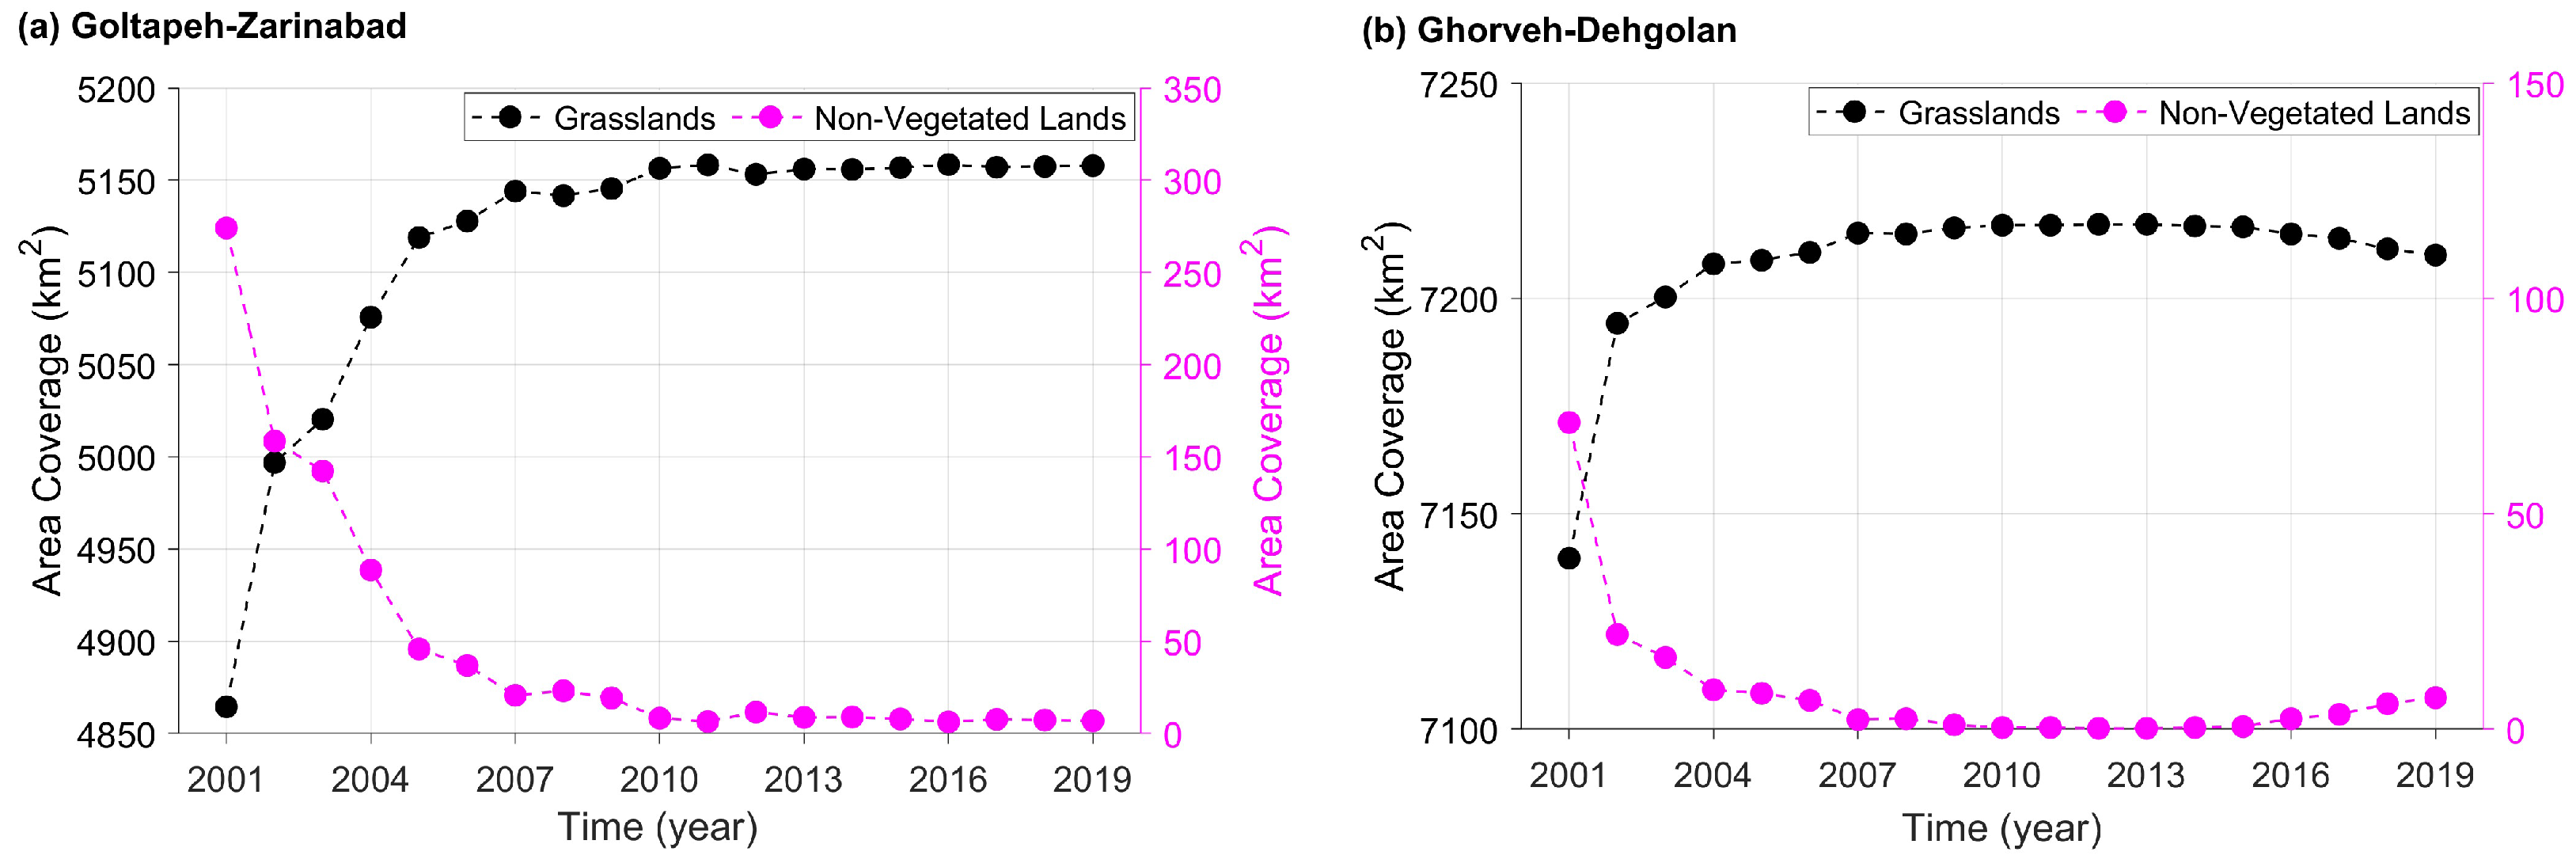
3.6. Land Cover Change Results

The MODIS land cover images of the Sefid-Rud basin for the years 2001, 2005, 2010, 2015, and 2019 are depicted in Figure 8. The pixel count is obtained for each type of land cover shown in Figure 8. It is found that the amount of grassland (in yellow) has increased from 89.8% in 2001 to 95.2% in 2019 across the basin, particularly in the central part. On the other hand, the amount of non-vegetated land (in pink) has decreased from 5% in 2001 to 1% in 2019, and the amount of shrubland (in gray) has decreased from 2% in 2001 to 1% in 2019 across the basin, particularly in the central part. As an example, the area of each type of land cover for each sub-basin is calculated to demonstrate the land cover dynamics across the years. To investigate the interaction between the dynamics of snow cover and land cover within the sub-basins, the Goltapeh-Zarinabad and Ghorveh-Dehgolan sub-basins are selected as examples for further analysis because these two sub-basins have statistically significant declining trends (see Table 2) and their dominant land cover types are displayed in Figure 9. From Figure 9, one can observe that a significant change occurred in land cover transformation from 2001 to 2007 with a smaller change after 2007.

4. Discussion

4.1. Snow Cover Dynamics in Time and Space

This study was dedicated to monitoring the snow cover dynamics of the Sefid-Rud basin and its eleven sub-basins. Employing the MODIS snow cover images during 2000–2019, geospatial results of snow cover were produced, and the geospatial results of the snow cover trends and their statistical significance, from an MK trend analysis, were illustrated for annual, seasonal, and monthly scales. In addition, the correlation between elevation and snow cover for each year during the winter season was estimated for the Sefid-Rud basin.
In general, it can be deduced that the snow cover on the surface of the Sefid-Rud basin had a fluctuating trend during the study period. For the Sefid-Rud basin, the highest snow cover was observed in January 2007 while the lowest snow cover was observed in December 2001 and December 2008 (Figure 4). The results indicate that there exists a declining trend in snow cover in most areas of the basin. In the areas where decreasing trends were not observed, the changes were not statistically significant.
As mentioned earlier, most of the snow cover in the Sefid-Rud basin occurs in the winter season, as confirmed by the test results. Because the greatest decrease in snow cover was related to the winter season, the trend in changes in this season was similar to the annual trend, although the amount of decrease in this season was more than the annual decrease. Because of the shortage of snow cover in the autumn and spring seasons, a wide declining trend was not observed in these two seasons. During the period 2000–2019, many areas of the basin did not have snow, or they had little snow in spring and autumn.

4.2. Comparisons with Similar Studies

The observed decreasing trend in snow cover across most areas of the Sefid-Rud basin aligns with findings from other studies conducted in Iran and globally. Examples of such studies include Taheri Dehkordi et al. [45] in the Zainde-Rud basin of Iran, Fattahi [46] in the northwest of Iran, Solaimani et al. [47] in the Kurdistan province of Iran, and Singh et al. [48] in the Himalaya, all of which confirmed the decreasing trend.
On the other hand, there are also some studies that show increasing trends, such as the study by Azizi et al. [33], who confirmed the increase in winter snow on the southern slopes of Alborz in Iran. The results of the present research near Alborz agrees with the findings for Alborz in [33]. Table 2 shows that except for the three northern sub-basins located on the Alborz highlands and the coast of the Caspian Sea, the snow cover has been decreasing in other sub-basins. It appears that the absence of these conditions in the three northern sub-basins is related to the presence of the Caspian Sea, the air masses passing over it, and the high altitude of the Taleghan-Alamot sub-basins. Some other regions across the world have experienced an increasing snow cover trend as well. For example, Rathore et al. [39] observed a snow cover increase for Chenab basin in India.

4.3. Interrelations Between Snow Cover, Climate Change, and Land Cover

Water scarcity has become a major issue in Iran due to several factors, such as unsustainable water consumption for agriculture and climate change [49]. Figure 8 shows a general increase in grasslands and decrease in non-vegetated lands, more pronounced in the central part, with relatively lower elevation, which agrees with the results in [49]. The topographic conditions, gradual temperature and CO2 increase, anthropogenic activities, and decline in precipitation and snow cover are potential contributing factors in the increasing area of grasslands in the Sefid-Rud basin.

4.4. Limitations and Future Work

The limitations of this work are as follows: (1) The input snow cover data have a moderate resolution, and errors due to clouds and atmospheric noise as well as sensitivity to solar zenith angles can introduce biases in the snow cover measurements [50]; (2) the MK trend test is sensitive to seasonality and serial correlation; however, in this study, the time series are produced so that there is one observation per year for each of the annual, seasonal, and monthly scales, eliminating the seasonality. Yet, the potential inter-annual fluctuations could be investigated in more detail by other techniques, such as wavelet analysis [51]; and (3) this study only focused on snow cover dynamics in the Sefid-Rud basin and its relationships with elevation and land cover. Other remote sensing datasets and ground based measurements, such as vegetation indices, land surface temperature, and streamflow could be used to further investigate the interconnection between snow cover, climate change, and streamflow.

5. Conclusions

In this research, the snow cover dynamics of the Sefid-Rud basin was studied for the period 2000–2019. Applying the MK trend analysis, the trends in snow cover dynamics for the whole basin and its sub-basins were estimated. The trend results of snow cover were produced at annual, seasonal, and monthly scales. The correlation between snow cover and elevation was estimated. Moreover, the annual MODIS land cover images were employed to study the land cover change across the basin and how it might have impacted the snow cover during the study period.
The results revealed that there exists a declining snow cover trend in most of the sub-basins. In Tarom-Khalkhal and Taleghan-Alamot sub-basins, there is no tangible decreasing trend, and it even seems that an increasing trend can be seen in some of them. This issue is probably due to the two conditions of proximity to the sea and their high altitude. The estimated trends were not statistically significant in the whole basin and this insignificance was observed in nine of the sub-basins showing a decreasing trend. Only the Goltapeh-Zarinabad and Ghorveh-Dehgolan sub-basins showed statistically significant decreasing snow cover trends at the 95% confidence level during 2000–2019. The land cover change results in Figure 8 show a significant increase in grasslands and a significant decrease in non-vegetated lands, mainly toward the central part of the basin with relatively lower elevation. As an example, the time series of dominant land cover (i.e., grasslands and non-vegetated lands) for Goltapeh-Zarinabad and Ghorveh-Dehgolan were also shown in Figure 9. Due to demographic and economic conditions and strong dependence on water resources, the declining trend in snow cover poses a major concern for the availability of fresh water in the region, which requires proper planning and water resource management.
Examining the trend in changes in different seasons and months showed that in the winter season and the months of this season, the trend of decreasing snow cover was more significant toward the central and southern parts of the basin, and it was like the annual changes. While this reduction was much less in spring and autumn, it was still stable. This is because in the Sefid-Rud basin most of the snowfall is in the winter season, while in other seasons the precipitation is much less and mostly in the form of rainfall. Therefore, no tangible decline was observed in these seasons.
Despite the annual decreasing trend in snow cover, the start and end times of snow cover did not show much change, which could be due to the maximum snowfall occurring in the winter season, with the biggest decrease observed in this season. In general, the comparison of different cases between different sub-basins showed that the sub-basins that were further away from rain-producing streams and water sources with lower altitudes had a greater reduction in snow cover. However, in discussing spatial and temporal changes in snow cover, not much difference was observed between the sub-basins. The results of this study can be useful for developing a sustainable environment and adaptation in a changing climate.

Author Contributions

H.E. and E.G. equally contributed to preparing the manuscript, including conceptualization, data curation, data analysis, and writing. F.M. and H.S. supervised the first author and contributed through writing/review and editing. All authors have read and agreed to the published version of the manuscript.

Funding

This research received no external funding.

Institutional Review Board Statement

Not applicable.

Informed Consent Statement

Not applicable.

Data Availability Statement

The ASTER GDEM and MODIS Snow Cover and Land Cover products employed in this research are publically available online at https://doi.org/10.5067/ASTER/ASTGTM.003 and https://doi.org/10.5067/MODIS/MOD10A2.006 and https://doi.org/10.5067/MODIS/MCD12Q1.061, accessed on 21 September 2024 respectively.

Acknowledgments

The authors thank the NASA researchers and engineers for preparing the MODIS products and SILC for GDEM utilized in this research. The authors also thank the reviewers for their time and insightful comments that significantly helped in improving the presentation of this research.

Conflicts of Interest

The authors declare no conflicts of interest.

References

  1. Foster, J.; Liston, G.; Koster, R.; Essery, R.; Behr, H.; Dumenil, L.; Verseghy, D.; Thompson, S.; Pollard, D.; Cohen, J. Snow Cover and Snow Mass Intercomparisons of General Circulation Models and Remotely Sensed Datasets. J. Clim. 1996, 9, 409–426. [Google Scholar] [CrossRef]
  2. Yang, Z.L.; Dickinson, R.; Hahmann, A.; Niu, G.Y.; Shaikh, M.; Gao, X.; Bales, R.; Sorooshian, S.; Jin, J. Simulation of snow mass and extent in general circulation models. Hydrol. Process. 1999, 13, 2097–2113. [Google Scholar] [CrossRef]
  3. Cohen, S.; Koshida, G.; Mortsch, L. Climate and water availability indicators in Canada: Challenges and a way forward. Part III–Future scenarios. Can. Water Resour. J./Rev. Can. Ressour. Hydr. 2015, 40, 160–172. [Google Scholar] [CrossRef]
  4. Moore, T. Climate change and animal migration. Environ. Law 2011, 41, 393–405. [Google Scholar]
  5. Salomonson, V.; Appel, I. Estimating fractional snow cover from MODIS using the normalized difference snow index. Remote Sens. Environ. 2004, 89, 351–360. [Google Scholar] [CrossRef]
  6. Pan, M.; Zhao, F.; Ma, J.; Zhang, L.; Qu, J.; Xu, L.; Li, Y. Effect of Snow Cover on Spring Soil Moisture Content in Key Agricultural Areas of Northeast China. Sustainability 2022, 14, 1527. [Google Scholar] [CrossRef]
  7. Liang, S.; Li, X.; Zheng, X.; Jiang, T.; Li, X.; Qiao, D. Effects of Winter Snow Cover on Spring Soil Moisture Based on Remote Sensing Data Product over Farmland in Northeast China. Remote Sens. 2020, 12, 2716. [Google Scholar] [CrossRef]
  8. Safarianzengir, V.; Mahmoudi, L.; Meresht, R.; Abad, B.; Rajabi, K.; Kianian, M. Monitoring and Analysis of Changes in the Depth and Surface Area Snow of the Mountains in Iran Using Remote Sensing Data. J. Indian Soc. Remote Sens. 2020, 48, 1479–1494. [Google Scholar] [CrossRef]
  9. Barnett, T.; Adam, J.; Lettenmaier, D. Potential impacts of a warming climate on water availability in snow-dominated regions. Nature 2005, 438, 303–309. [Google Scholar] [CrossRef]
  10. Entezami, H.; Mojarrad, F.; Darand, M.; Shahabi, H. Investigating the Changes in Snow Cover in Sefidrood Drainage Basin using Remote Sensing. Geogr. Environ. Sustain. 2021, 11, 1–18. [Google Scholar]
  11. Barnett, T.; Adam, J.; Lettenmaier, D. Changing Arctic snow cover: A review of recent developments and assessment of future needs for observations, modelling, and impacts. Ambio 2016, 45, 516–537. [Google Scholar]
  12. Beniston, M.; Stoffel, M. Rain-on-snow events, floods and climate change in the Alps: Events may increase with warming up to 4 °C and decrease thereafter. Sci. Total Environ. 2016, 571, 228–236. [Google Scholar] [CrossRef] [PubMed]
  13. Manning, J.; Garton, E. Reconstructing historical snow depth surfaces to evaluate changes in critical demographic rates and habitat components of snow-dependent and snow-restricted species. Methods Ecol. Evol. 2012, 3, 71–80. [Google Scholar] [CrossRef]
  14. Muntán, E.; García, C.; Oller, P.; Martí, G.; García, A.; Gutiérrez, E. Reconstructing snow avalanches in the Southeastern Pyrenees. Nat. Hazards Earth Syst. Sci. 2009, 9, 1599–1612. [Google Scholar] [CrossRef]
  15. Zaghloul, M.; Ghaderpour, E.; Dastour, H.; Farjad, B.; Gupta, A.; Eum, H.; Achari, G.; Hassan, Q. Long Term Trend Analysis of River Flow and Climate in Northern Canada. Hydrology 2022, 9, 197. [Google Scholar] [CrossRef]
  16. Sharma, V.; Mishra, V.; Joshi, P. Snow cover variation and streamflow simulation in a snow-fed river basin of the Northwest Himalaya. J. Mt. Sci. 2012, 9, 853–868. [Google Scholar] [CrossRef]
  17. Zhao, Q.; Liu, Z.; Ye, B.; Qin, Y.; Wei, Z.; Fang, S. A snowmelt runoff forecasting model coupling WRF and DHSVM. Hydrol. Earth Syst. Sci. 2009, 13, 1897–1906. [Google Scholar] [CrossRef]
  18. Ahmad, S.; Israr, M.; Liu, S.; Hayat, H.; Gul, J.; Wajid, S.; Ashraf, M.; Baig, S.; Tahir, A. Spatio-temporal trends in snow extent and their linkage to hydro-climatological and topographical factors in the Chitral River Basin (Hindukush, Pakistan). Geocarto Int. 2020, 35, 711–734. [Google Scholar] [CrossRef]
  19. Immerzeel, W.; Droogers, P.; de Jong, S.; Bierkens, M. Large-scale monitoring of snow cover and runoff simulation in Himalayan river basins using remote sensing. Remote Sens. Environ. 2009, 113, 40–49. [Google Scholar] [CrossRef]
  20. Immerzeel, W.; Beek, L.V.; Bierkens, M. Climate change will affect the Asian water towers. Science 2010, 328, 1382–1385. [Google Scholar] [CrossRef]
  21. Kulkarni, A.V.; Rathore, B.P.; Singh, S.K.; Bahuguna, I.M. Understanding changes in the Himalayan cryosphere using remote sensing techniques. Int. J. Remote Sens. 2011, 32, 601–615. [Google Scholar] [CrossRef]
  22. Pant, N.; Kumar, M.; Rawat, J.; Rani, N. Study of snow cover dynamics of pinder watershed in Central Himalaya using remote sensing and GIS techniques. Int. J. Adv. Earth Sci. Eng. 2014, 3, 122–128. [Google Scholar]
  23. Tahir, A.; Chevallier, P.; Arnaud, Y.; Ashraf, M.; Bhatti, M. Snow cover trend and hydrological characteristics of the Astore River basin (Western Himalayas) and its comparison to the Hunza basin (Karakoram region). Sci. Total Environ. 2015, 505, 748–761. [Google Scholar] [CrossRef] [PubMed]
  24. Dietz, A.; Kuenzer, C.; Gessner, U.; Dech, S. Remote sensing of snow—A review of available methods. Int. J. Remote Sens. 2012, 33, 4094–4134. [Google Scholar] [CrossRef]
  25. Crawford, C. MODIS Terra Collection 6 fractional snow cover validation in mountainous terrain during spring snowmelt using Landsat TM and ETM+. Hydrol. Process. 2015, 29, 128–138. [Google Scholar] [CrossRef]
  26. Nolin, A. Recent advances in remote sensing of seasonal snow. J. Glaciol. 2010, 56, 1141–1150. [Google Scholar] [CrossRef]
  27. Selkowitz, D.; Forster, R.R. An automated approach for mapping persistent ice and snow cover over high latitude regions. J. Glaciol. 2015, 8, 16. [Google Scholar] [CrossRef]
  28. Mann, H. Nonparametric tests against trend. Econom. J. Econom. Soc. 1945, 13, 245–259. [Google Scholar] [CrossRef]
  29. Sen, P. Estimates of the Regression Coefficient based on Kendall’s Tau. J. Am. Stat. Assoc. 1968, 63, 1379–1389. [Google Scholar] [CrossRef]
  30. Militino, A.; Moradi, M.; Ugarte, M. On the Performances of Trend and Change-Point Detection Methods for Remote Sensing Data. Remote Sens. 2020, 12, 1008. [Google Scholar] [CrossRef]
  31. Shawky, M.; Ahmed, M.; Ghaderpour, E.; Gupta, A.; Achari, G.; Dewan, A.; Hassan, Q. Remote sensing-derived land surface temperature trends over South Asia. Ecol. Inform. 2023, 74, 101969. [Google Scholar] [CrossRef]
  32. Ghaderpour, E.; Mazzanti, P.; Bozzano, F.; Scarascia Mugnozza, G. Trend Analysis of MODIS Land Surface Temperature and Land Cover in Central Italy. Land 2024, 13, 796. [Google Scholar] [CrossRef]
  33. Azizi, G.; Rahimi, M.; Mohammadi, H.; Khoshakhlagh, F. Spatio-temporal variations of snow cover in the southern slope of central Alborz. Phys. Geogr. Res. 2017, 49, 381–393. [Google Scholar] [CrossRef]
  34. Anjum, M.; Ding, Y.; Shangguan, D.; Liu, J.; Ahmad, I.; Ijaz, M.; Khan, M. Quantification of spatial temporal variability of snow cover and hydro-climatic variables based on multi-source remote sensing data in the Swat watershed, Hindukush Mountains, Pakistan. Meteorol. Atmos. Phys. 2019, 131, 467–486. [Google Scholar] [CrossRef]
  35. Gao, J.; Williams, M.; Fu, X.; Wang, G.; Gong, T. Spatiotemporal distribution of snow in eastern Tibet and the response to climate change. Remote Sens. Environ. 2012, 121, 1–9. [Google Scholar] [CrossRef]
  36. Nemat, K. Analysis of Climate Change Impact on Glacier by Using Remote Sensing Data (Case Study: Alamkouh Glacier). Ph.D. Thesis, Tarbiat Modarres University, Tehran, Iran, 2014. [Google Scholar]
  37. Shafiq, M.; Ahmed, P.; ul Islam, Z.; Joshi, P.; Bhat, W. Snow cover area change and its relations with climatic variability in Kashmir Himalayas, India. Geocarto Int. 2019, 34, 688–702. [Google Scholar] [CrossRef]
  38. Malmros, J.; Mernild, S.; Wilson, R.; Tagesson, T.; Fensholt, R. Snow cover and snow albedo changes in the central Andes of Chile and Argentina from daily MODIS observations (2000–2016). Remote Sens. Environ. 2018, 209, 240–252. [Google Scholar] [CrossRef]
  39. Rathore, B.; Singh, S.; Jani, P.; Bahuguna, I.; Brahmbhatt, R.; Rajawat, A.; Randhawa, S.; Vyas, A. Monitoring of snow cover variability in Chenab Basin using IRS AWiFS sensor. J. Indian Soc. Remote Sens. 2018, 46, 1497–1506. [Google Scholar] [CrossRef]
  40. Molavi-Arabshahi, M.; Arpe, K.; Leroy, S. Precipitation and temperature of the southwest Caspian Sea region during the last 55 years: Their trends and teleconnections with large-scale atmospheric phenomena. Int. J. Climatol. 2016, 36, 2156–2172. [Google Scholar] [CrossRef]
  41. Hall, D.; Salomonson, V.; Riggs, G. MODIS/Terra Snow Cover 8-Day L3 Global 500 m SIN Grid; Version 5; NASA: Washington, DC, USA, 2006. [CrossRef]
  42. Riggs, G.; Hall, D.; Román, M. MODIS Snow Products Collection 6.1 User Guide; National Snow and Ice Data Center: Boulder, CO, USA, 2019. [Google Scholar]
  43. NASA/METI/AIST/Japan Spacesystems; U.S./Japan ASTER Science Team. ASTER Global Digital Elevation Model V003; NASA EOSDIS Land Processes Distributed Active Archive Center: Sioux Falls, SD, USA, 2019.
  44. Ratner, B. The correlation coefficient: Its values range between +1/−1, or do they? J. Target. Meas. Anal. Mark. 2009, 17, 139–142. [Google Scholar] [CrossRef]
  45. Taheri Dehkordi, A.; Valadan Zoej, M.; Ghasemi, H.; Ghaderpour, E.; Hassan, Q. A New Clustering Method to Generate Training Samples for Supervised Monitoring of Long-Term Water Surface Dynamics Using Landsat Data through Google Earth Engine. Sustainability 2022, 14, 8046. [Google Scholar] [CrossRef]
  46. Fattahi, E. Investigation of snow cover changes affected by climate change in North West of Iran. J. Appl. Res. Geogr. Sci. 2019, 19, 47–63. [Google Scholar] [CrossRef]
  47. Solaimani, K.; Darvishi, S.; Shokrian, F.; Rashidpour, M. Monitoring of temporal-spatial variations of snow cover using the MODIS image (Case Study: Kurdistan Province). Iran. J. Remote Sens. GIS 2018, 10, 77–104. [Google Scholar]
  48. Singh, D.; Gusain, H.; Mishra, V.; Gupta, N. Snow cover variability in North-West Himalaya during last decade. Iran. J. Remote Sens. GIS 2018, 11, 579. [Google Scholar] [CrossRef]
  49. Behling, R.; Roessner, S.; Foerster, S.; Saemian, P.; Tourian, M.; Portele, T.; Lorenz, C. Interrelations of vegetation growth and water scarcity in Iran revealed by satellite time series. Sci. Rep. 2022, 12, 20784. [Google Scholar] [CrossRef] [PubMed]
  50. Hall, D.K.; Riggs, G.A. Accuracy assessment of the MODIS snow products. Hydrol. Process. 2007, 21, 1534–1547. [Google Scholar] [CrossRef]
  51. Ghaderpour, E.; Pagiatakis, S.; Mugnozza, G.S.; Mazzanti, P. On the stochastic significance of peaks in the least-squares wavelet spectrogram and an application in GNSS time series analysis. Signal Process. 2024, 223, 109581. [Google Scholar] [CrossRef]
Figure 1. Map of Sefid-Rud basin and its sub-basins.
Sustainability 16 09381 g001
Figure 2. The workflow of the present study. The numbers displayed in red follow the same order of the subsections in Section 3.
Sustainability 16 09381 g002
Figure 3. Graphs of temporal snow cover changes in the Sefid-Rud basin during the years 2000, 2001, 2018, and 2019.
Sustainability 16 09381 g003
Figure 4. The percentage of snow cover in the Sefid-Rud basin for (a) December, (b) January, and (c) February.
Sustainability 16 09381 g004
Figure 5. Annual snow cover time series and their estimated linear trends (dashed lines) using an MK trend analysis for the Sefid-Rud basin and Ghorveh-Dehgolan.
Sustainability 16 09381 g005
Figure 6. The trend results for the Sefid-Rub basin for (a) annual, (b) autumn, (c) winter, and (d) spring, based on the MK test. The statistical significance of the trends at the 90% confidence level are also illustrated by smaller panels, placed at the southeast part of the basin.
Sustainability 16 09381 g006
Figure 7. The trend results for the Sefid-Rub basin for (a) November, (b) December, (c) January, (d) February, (e) March, and (f) April based on the MK test. The statistical significance of the trends at the 90% confidence level are also illustrated by smaller panels, placed at the southeast part of the basin.
Sustainability 16 09381 g007
Figure 8. The MODIS land cover change results for the Sefid-Rud basin.
Sustainability 16 09381 g008
Figure 9. The time series of dominant land covers for sub-basins: (a) Goltapeh-Zarinabad and (b) Ghorveh-Dehgolan.
Sustainability 16 09381 g009
Table 1. Outline of the datasets utilized in the present research.
ProductPeriodNumber of ImagesTemporal ResolutionSpatial Resolution
ASTER GDEMSince 2000130 m
DOI: 10.5067/ASTER/ASTGTM.003
MODIS Snow Cover2000–20199208 days500 m
DOI: 10.5067/MODIS/MOD10A2.006
MODIS Land Cover2001–201919Annual500 m
DOI: 10.5067/MODIS/MCD12Q1.061
Table 2. Annual rates of change in snow cover (%/year) for Sefid-Rud basin and its sub-basins.
Basin/Sub-BasinSen’s Slope (%/year)p-Value
Sefid-Rud basin 0.249 0.24
Goltapeh-Zarinabad 0.514 0.05
Ghorveh-Dehgolan 0.675 0.05
Sojas 0.511 0.13
Bijar-Divandareh 0.469 0.19
Mahneshan-Angoran 0.266 0.33
Zanjan 0.218 0.2
Mianeh 0.106 0.57
Manjil 0.064 0.62
Astaneh-Kochsefahan 0.022 0.59
Tarom-Khalkhal 0.013 0.83
Taleghan-Alamot 0.083 0.72
Table 3. The correlation between winter snow cover and elevation for each year from 2001 to 2020.
Year (Winter)Pearson’s rYear (Winter)Pearson’s r
20010.6820110.80
20020.7420120.64
20030.7220130.61
20040.7220140.70
20050.7420150.60
20060.7220160.78
20070.8120170.59
20080.7320180.70
20090.6920190.70
20100.63
Disclaimer/Publisher’s Note: The statements, opinions and data contained in all publications are solely those of the individual author(s) and contributor(s) and not of MDPI and/or the editor(s). MDPI and/or the editor(s) disclaim responsibility for any injury to people or property resulting from any ideas, methods, instructions or products referred to in the content.

