Abstract
This research applies the suggested photovoltaic solar system design to Jordan’s Al-Balqa Applied University. Twelve of the twenty-four college buildings are located on the main campus, while the remaining twelve remote colleges are dispersed throughout Jordan’s many geographic locations, ranging from the far north to the far south. Azimuth angle, irradiation effect, building size, location, power consumption, and student population are all taken into account in the suggested design. Additionally, in-site generation and remote-wheeling generation are two types of solar system installation designs that are taken into consideration. A method for calculating the optimal location of remote-wheeling generation is proposed based on the centroid mass theory. The proposed method is applied in four scenarios. The first three scenarios are single-point, two-point, and three-point centroid locations. The fourth scenario is based on three single points, considering the power distribution regions in Jordan, which cover three regions. The results of the four scenarios will be discussed and demonstrated along with a comprehensive comparison between in-site generation, single-centroid-point remote-wheeling generation, and three-centroid-point remote-wheeling generation.
1. Introduction
Global population growth, political unrest, and fast economic expansion have all been occurring in recent years. However, because of regional differences, some nations have a bigger impact than others. In Jordan alone, the population level is growing by 3.6% [1] and is expected to reach around 11,642,859 according to [2]. This massive increase in population is due to the ongoing conflicts in the Middle East, where Jordan serves as a safe haven as refugees flee from neighboring countries, such as Syria and Iraq. As a result, Jordan’s energy security is a high-priority issue, especially with the lack of conventional energy sources in Jordan [3]. The International Energy Agency (IEA) defines global energy security as predicated on the availability of resources and fair prices [4], yet 96% of Jordan’s electrical power generation is derived from the importation of fossil fuels from other nations [5].
Nevertheless, the tensions and political conflicts in the Middle East area have worsened the energy situation in Jordan. However, as a part of the strategy plans for 2035, as in [3], Jordan’s reliance on conventional fossil fuels should drop by 37% by increasing its dependency on alternative renewable sources, which form 11% of Jordan’s source of energy at present. Meanwhile, environmentally, PV solar energy has a particularly positive impact on the environment, emissions reduction, and environmental sustainability [6,7,8]. By converting solar radiation energy into electrical power, PV power produces zero air pollutants and greenhouse gases. A significant reduction in carbon footprint compared to fossil fuel-based energy can be achieved. That is, as PV solar energy is abundant and inexhaustible, it represents a reliable long-term source for clean energy production that can be extended by investing in such energy conversion. In addition, PV solar power systems have a minimal environmental impact when installed, requiring no fuel extraction, refining, or transportation, which helps preserve natural ecosystems and reduces the strain on finite resources. Additionally, as technology improves, PV systems will become more efficient, further enhancing their role in promoting environmental sustainability [9,10].
A PV generation system has three main types of installation, in-site generation (ISG), as shown in [11,12]; remote wheeling generation (RWG), as shown in [13]; and a PV-Generation-Only Station (GOS), as shown in [14], and all of these types are utilized in Jordan. While the price and purpose of each type vary based on power consumption, generation type, location, and load demands, ISG is a common setting for establishments with large areas in one single location. In Jordan, ISG is commonly used at private universities, such as Philadelphia University, Jerash University, and Al-Zerqa Private University. In addition, some public universities, such as Hashemite University, Mutah University, and Tafila Technical University, also use ISG. Other large companies, such as Al-Bashir Hospital and Capital Bank, also use this type of on-grid connection. Meanwhile, the second type of PV generation, RWG, is based on producing electrical energy in remote locations, while consumption occurs somewhere else. This type of project is common in Jordan, such as establishments with multiple locations spread across large geographical areas, and it is common in places where it is hard to implement ISG due to area limitations [15].
Examples of RWG in Jordan can be found in banks, such as Arab Bank; communications companies, such as Orange Communications; and hotels, such as Crowne Plaza Jordan and Dead Sea Spa. Another example where RWG is implemented is the Applied Science Private University (ASU), where remote generation is used due to the huge area required in crowded locations [16]. Therefore, as the transformation of the source of energy is increasingly moving toward renewable energy [17,18], several companies in Jordan have invested in PV generation since 2015. Starting with a 10 MW PV station installed by the private sector, at present, there are several high-power plants, such as the 200 MW Baynouna Solar Power Plant and the 160 MW Shams Ma’an Solar Power Plant [19]. That is, over the last decade, Jordanian PV on-grid connections formed around 15% of the total power generation, as large consumers and investors consider PV generation the future energy strategy with short payback investments [20]. In [21], the return on investment for PV designs in Jordan was investigated, and it was concluded that the payback period was around 3.8 to 4.6 years.
In [22,23], as solar energy forms a unique cost-effectiveness strategy compared to conventional fossil fuels, many researchers have investigated the most efficient system design and installation. Some have discussed PV designs in terms of sizing, grid connection, and metering type, as in [24]. Meanwhile, numerous works have focused on PV solar cells’ location and meteorological measurements, providing an analytical approach based on the electrical parameters of the power grid, as in [25,26]. In [27], the Genetic Reinforcement Learning Algorithm (GRLA) and deep learning were introduced as energy management strategies by proposing hybrid attention-enhanced GRU for correct solar predictions and for exploring the peek output setting. Others have addressed the sharing and allocation of energy issues based on theoretical simulations [28].
Nonetheless, other systems have been implemented based on their standards for impartiality, even though the sharing system hasn’t been applied to real systems [29,30]. As a result, considering the works that have been conducted in this field, no study has focused on large consumers with multiple locations scattered across different electrical distribution regions. Thus, this work analyzes real-time consumer demands and geographic characteristics. In addition, in this work, centroid mass theory is used to calculate the optimal location for energy generation and to provide simple calculations with acceptable accuracy, as it has not been used in this context before.
Meanwhile, as the load centroid algorithm is applied in IEEE 13-bus [31], IEEE 33-bus, and IEEE 69-bus, as in [32], the load centroid algorithm is widely applied in distribution networks to locate distribution generation (DG) with energy loss minimization, voltage stability, and optimum power flow. The proposed location method for power generation and distribution was applied in earlier works with several scenarios of centroid points. Yet, in [33], the location technique for PV solar cells was applied as a real case study in rural regions of Australia using a data mining algorithm. In [34,35], the IEEE 33-bus case study to locate the PV solar cell was applied using the Modified Reptile Search Algorithm (MRSA) and Particle Swarm Optimization (PSO). As a result, it was clear that the centroid mass algorithm technique was not used in previous PV solar cell locations as this work proposed.
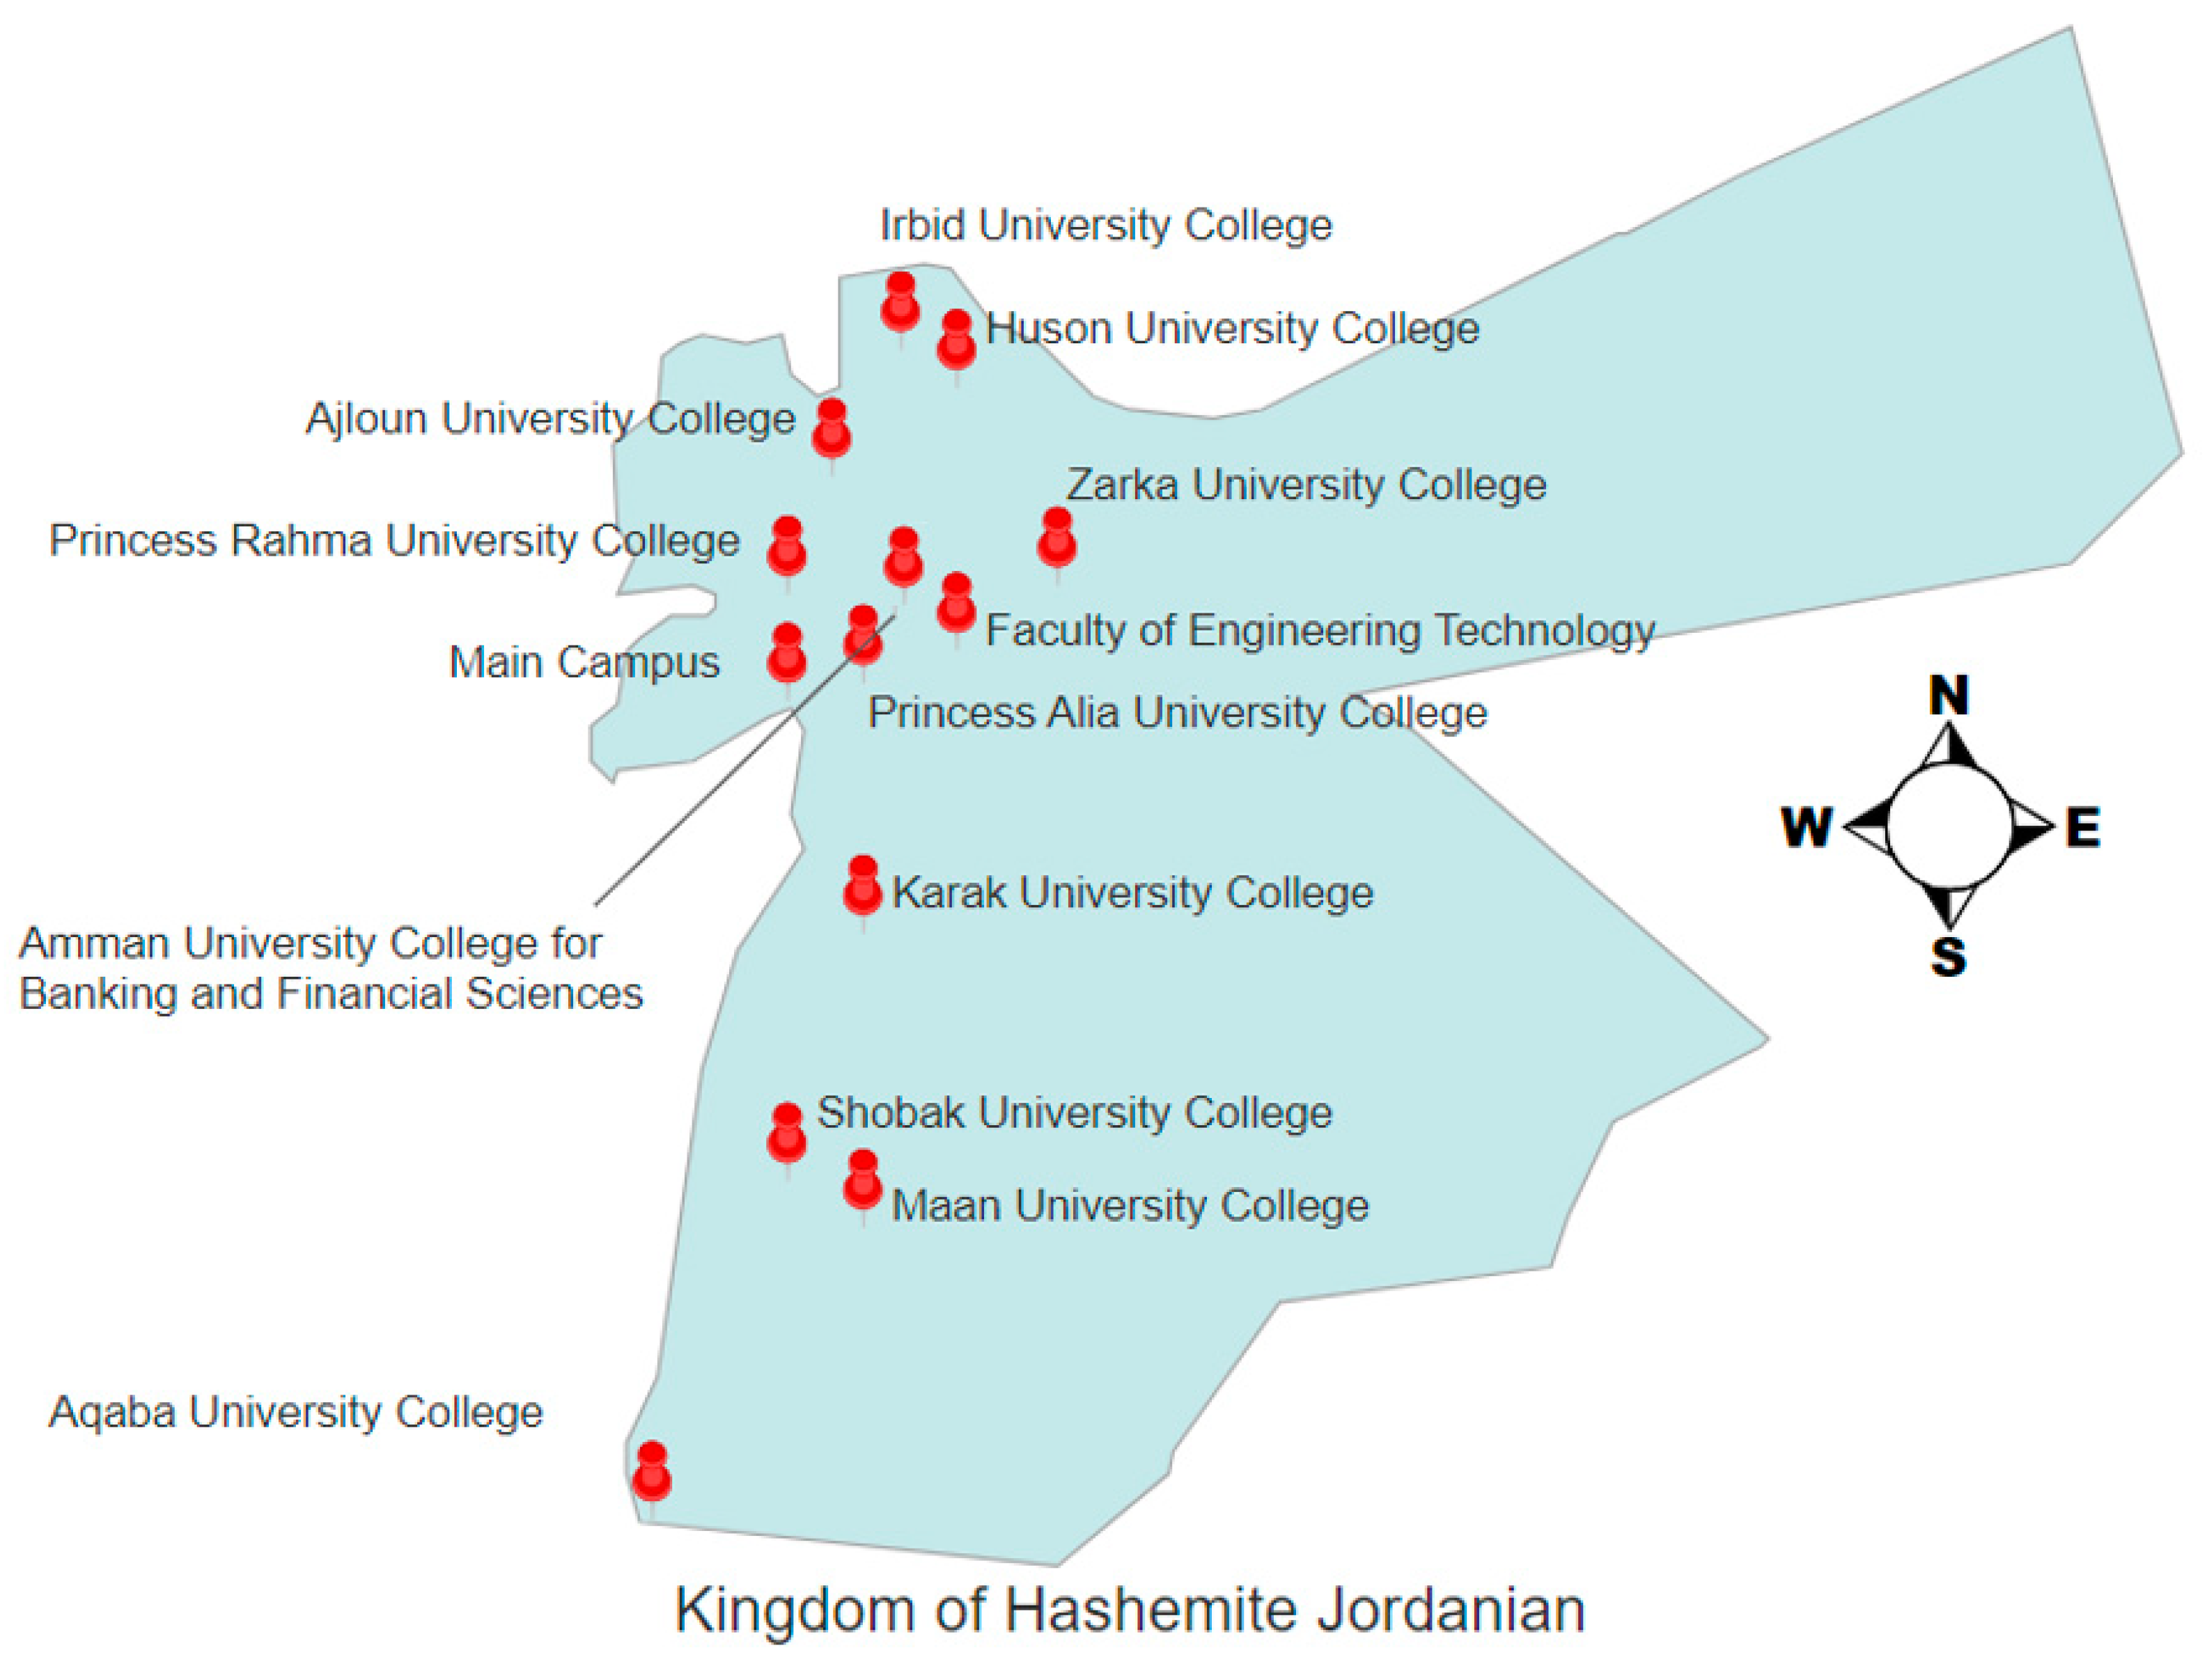
One of Jordan’s largest public universities, Al-Balqa Applied University (BAU), has twelve internal colleges and twelve external colleges distributed throughout the country; Figure 1 depicts the approximate locations and dispersal of these colleges. This paper’s suggested PV design is based on BAU. The location of the college’s buildings determines the optimal design for PV on-grid ISG and RWG, taking into account the effects of temperature and radiation.
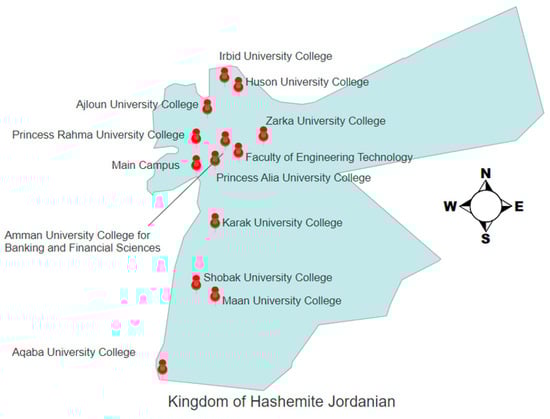
Figure 1.
Al-Balqa Applied University—main campus and external colleges.
2. Methodology
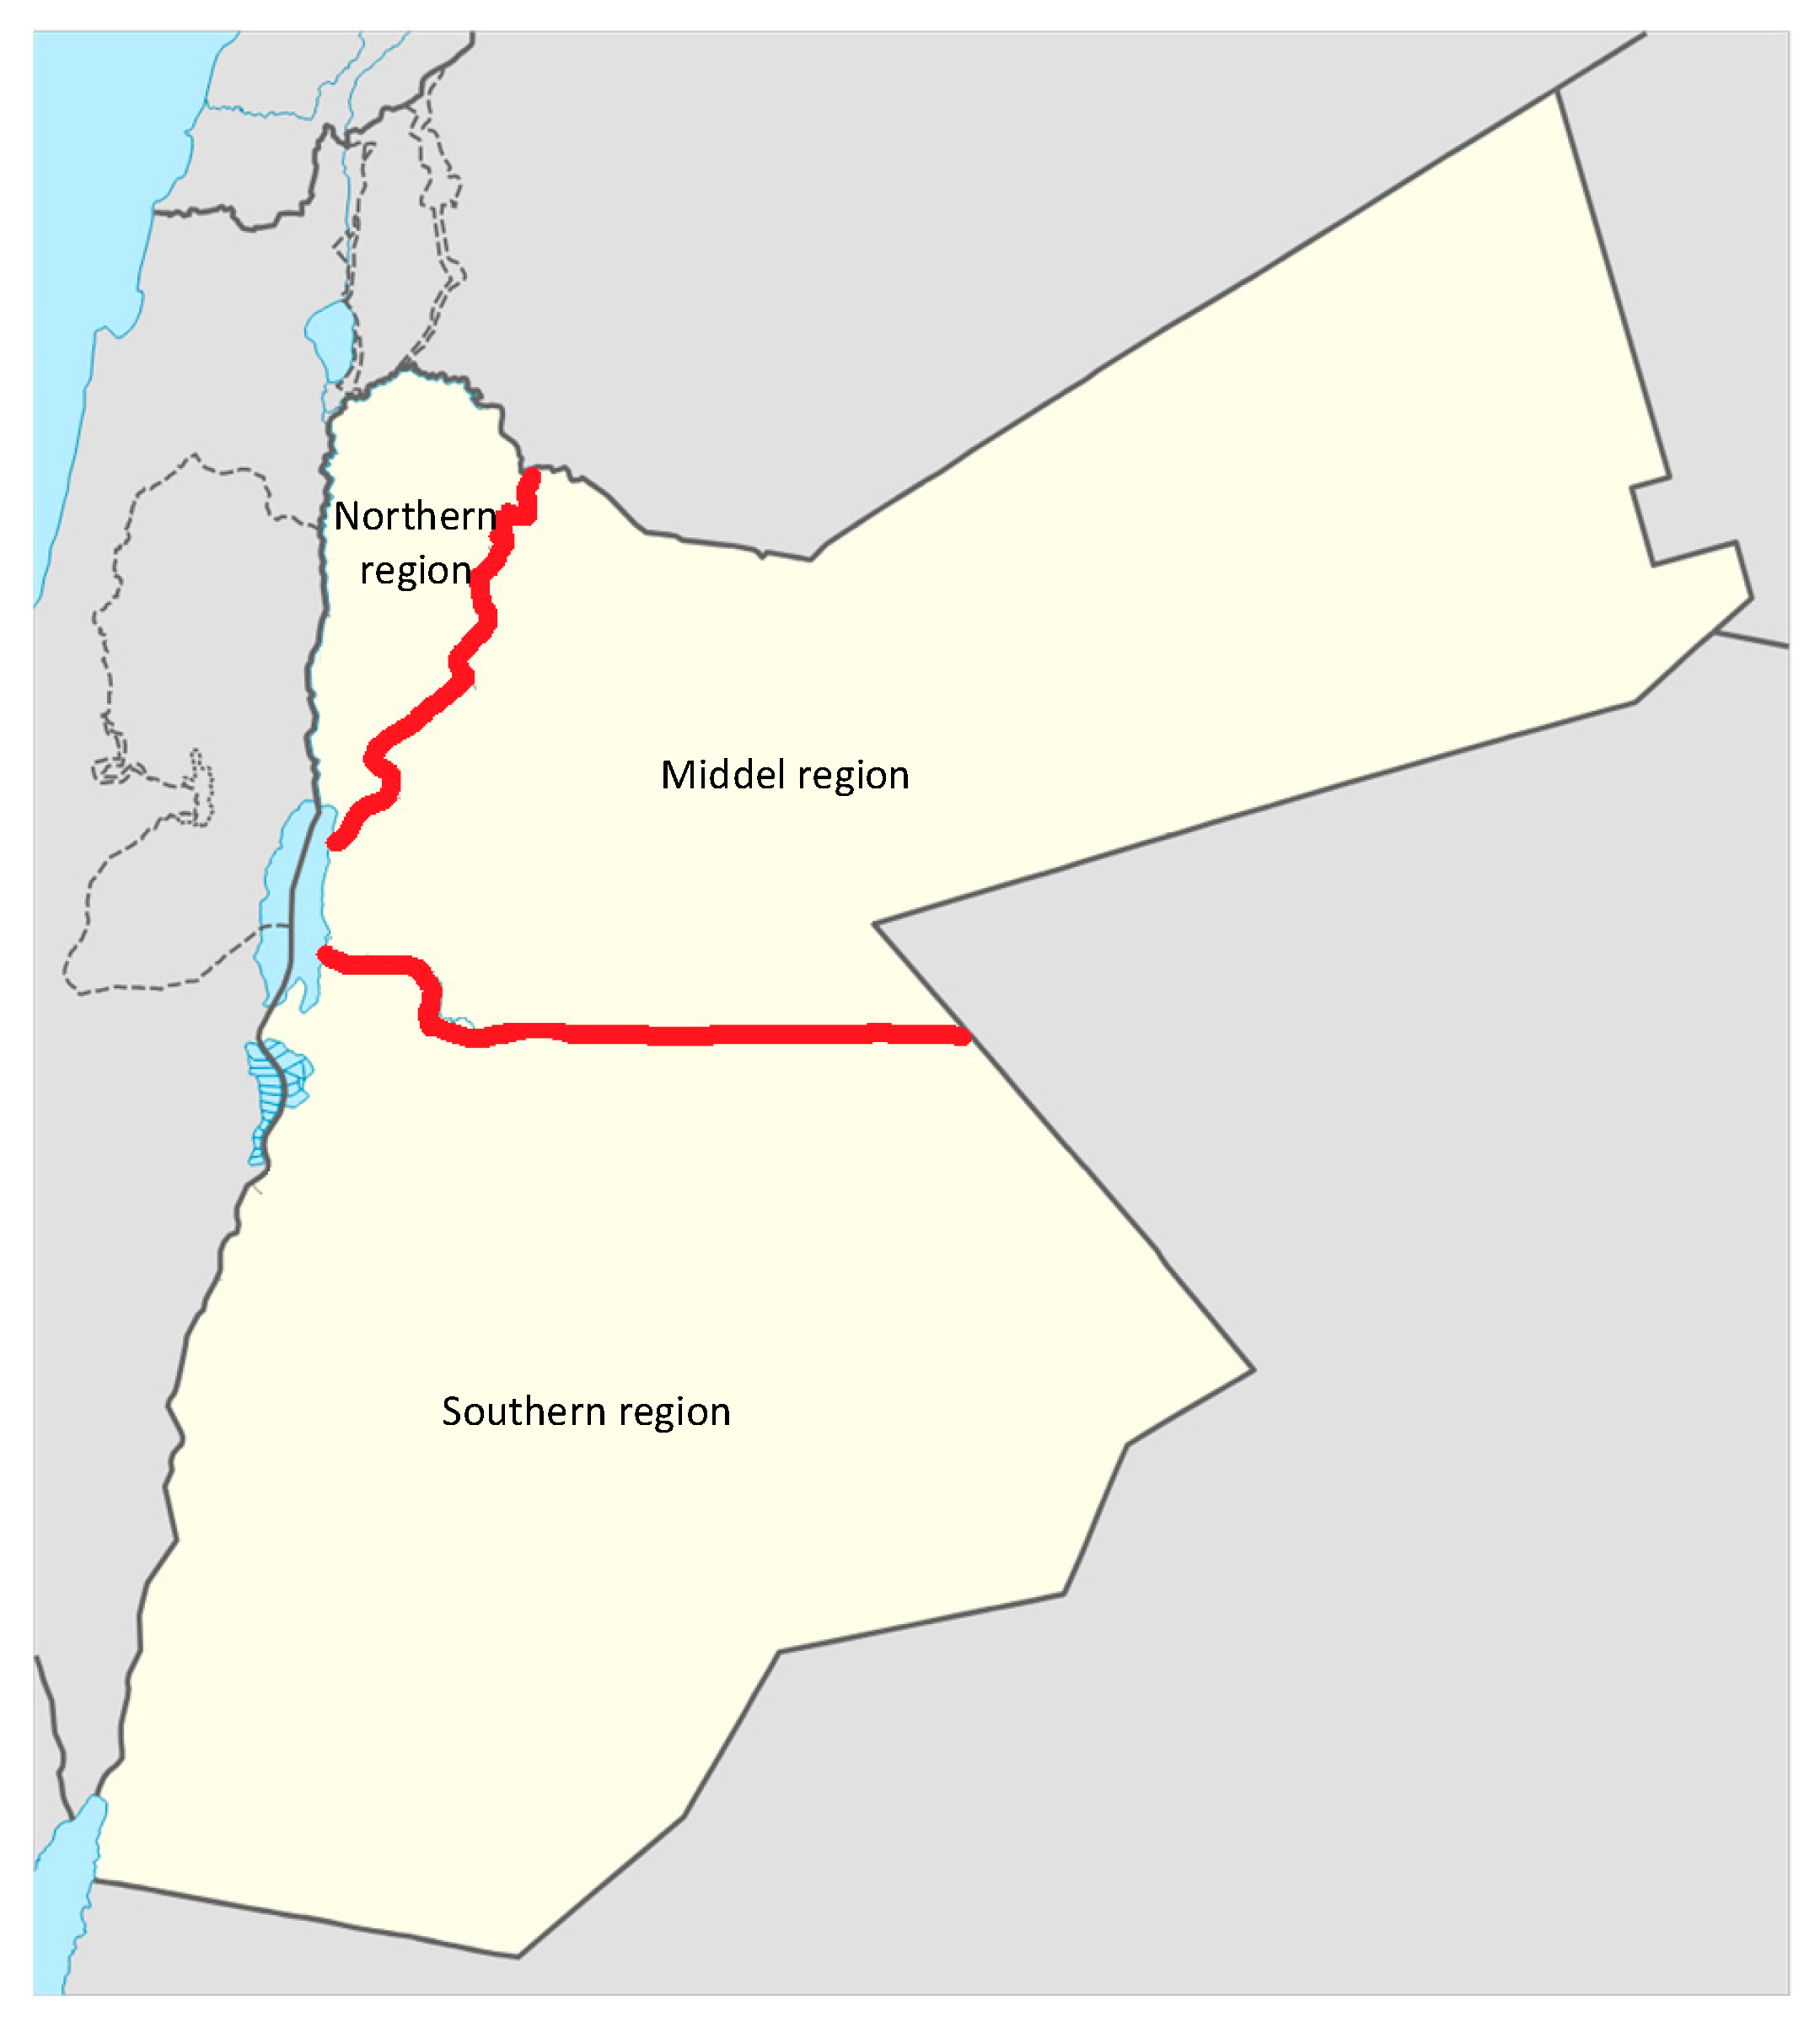
Due to Jordan’s small and uncomplicated national grid [36], the country’s electrical distribution businesses are split up into three regions [37]. As shown in Figure 2, these regions consist of the North (Irbid Distribution Electrical Company (IDECO)), Middle (Jordan Electric Power Company (JEPCO)), and South (Electricity Distribution Company (EDCO)) [36,38]. Yet, most of the electrical power is consumed by the middle region which contains the capital of Jordan (Amman) and covers the largest industrial plants in Jordan. Meanwhile, with transmission lines of 400 KV and 132 KV covering the entire country, the government of Jordan takes full responsibility for operation, security, and maintaining efficiency through the National Electric Power Company (NEPCO). On the other hand, BAU has a unique characteristic of scattered colleges around the country; BAU has faculties on the three distribution networks and pays electrical bills based on the faculty location region requirements. Therefore, since BAU is the only university in Jordan with so many widely distributed campuses, this work intends to generalize the proposed design to a widely affected area.
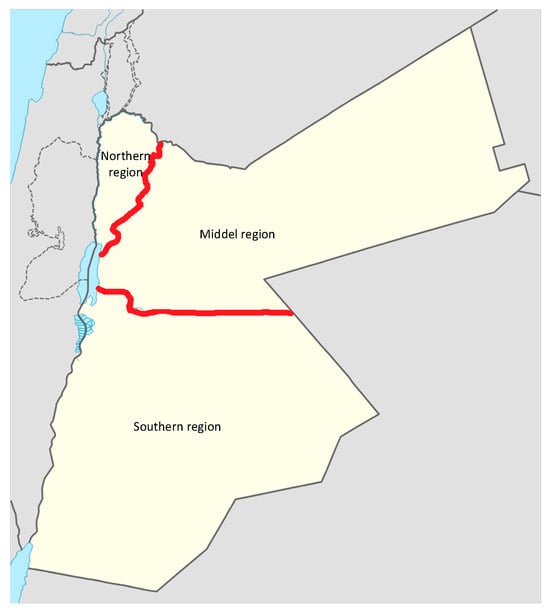
Figure 2.
Electrical distribution region in Jordan.
With 12 internal colleges and 12 external colleges, as illustrated in Table 1, this work proposes a practical PV design for BAU based on faculty approximated location, student number, and power consumption per campus. With 25,430 students, around 7624 students attend the main internal campus, forming 30% of the total number of BAU students. Based on a previous study, back in 2019, BAU required 12 MW of PV panels using ISG [19]. However, in this work, to estimate power consumption by each faculty, a calculation of the student percentage of each faculty will indicate the amount of power required. This methodology is used in designing ISG and RWG, as presented in the following sub-section.

Table 1.
BAU internal and external colleges.
2.1. Design of In-Site Generation (ISG)
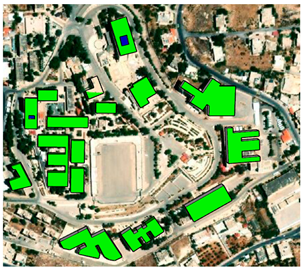
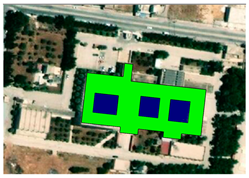
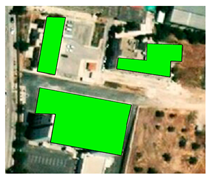
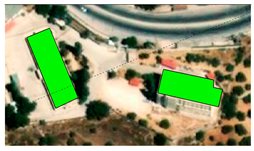
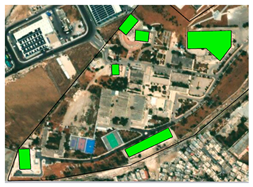
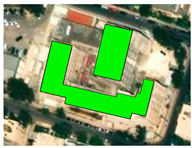
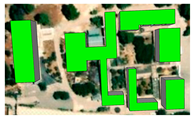
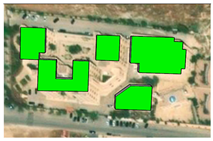
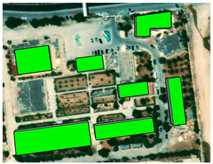
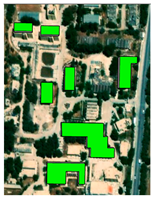
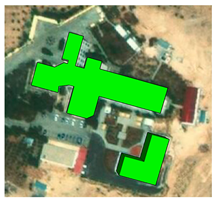
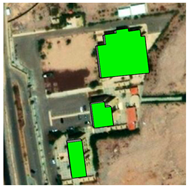
While all of the BAU faculties are connected to the main distribution networks and national grid, Jordan’s net-metering on-grid offers a bidirectional energy meter for prosumers. As the ISG depends on the in-site area and the azimuth angle of each faculty, the approximation of annual power provided by each PV can be calculated. As a result, the number of PV panels and the annual PV power generation can be determined. Based on the output results, additional PV panels may be needed in selected faculties, while others may have extra generation. In Table 2, an illustration of the area and azimuth angle of each faculty of BAU will be presented. As shown, the main campus has sixteen isolated buildings. Each building has a different area and azimuth angle. Due to area limitation, the monocrystalline PV type is usually used for rooftop applications as PV location affects PV design.
Table 2.
BAU faculty building number, area, azimuth, and estimated PV annual generation.
In PV design, the daily hours per year at STC are found to be around 5.5 h. Yet, with a typical climate of 310 sunny days, Jordan averages a minimum of 6.5 h of irradiation in the worst case as of December and a maximum of 13 h of irradiation in July [39]. In addition, with the common efficiency () of the PV monocrystalline at approximately 18%, and the effective azimuth angle, from true south to 90 degrees deviation, between 5% and 20% [40], the proposed design is set for a maximum azimuth angle of 45 degrees. As a result, the maximum power generation of each college can be determined using the following formula:
where E is the annual energy, A is the available area, is the average irradiation depending on the country (in Jordan: 2200 kWh/m2.y), is the efficiency of solar panels depending on the and the effect of the Azimuth angle on the solar cell, and P.R. is the PV performance ratio (default value: 0.8).
2.2. Remote Wheeling PV Design
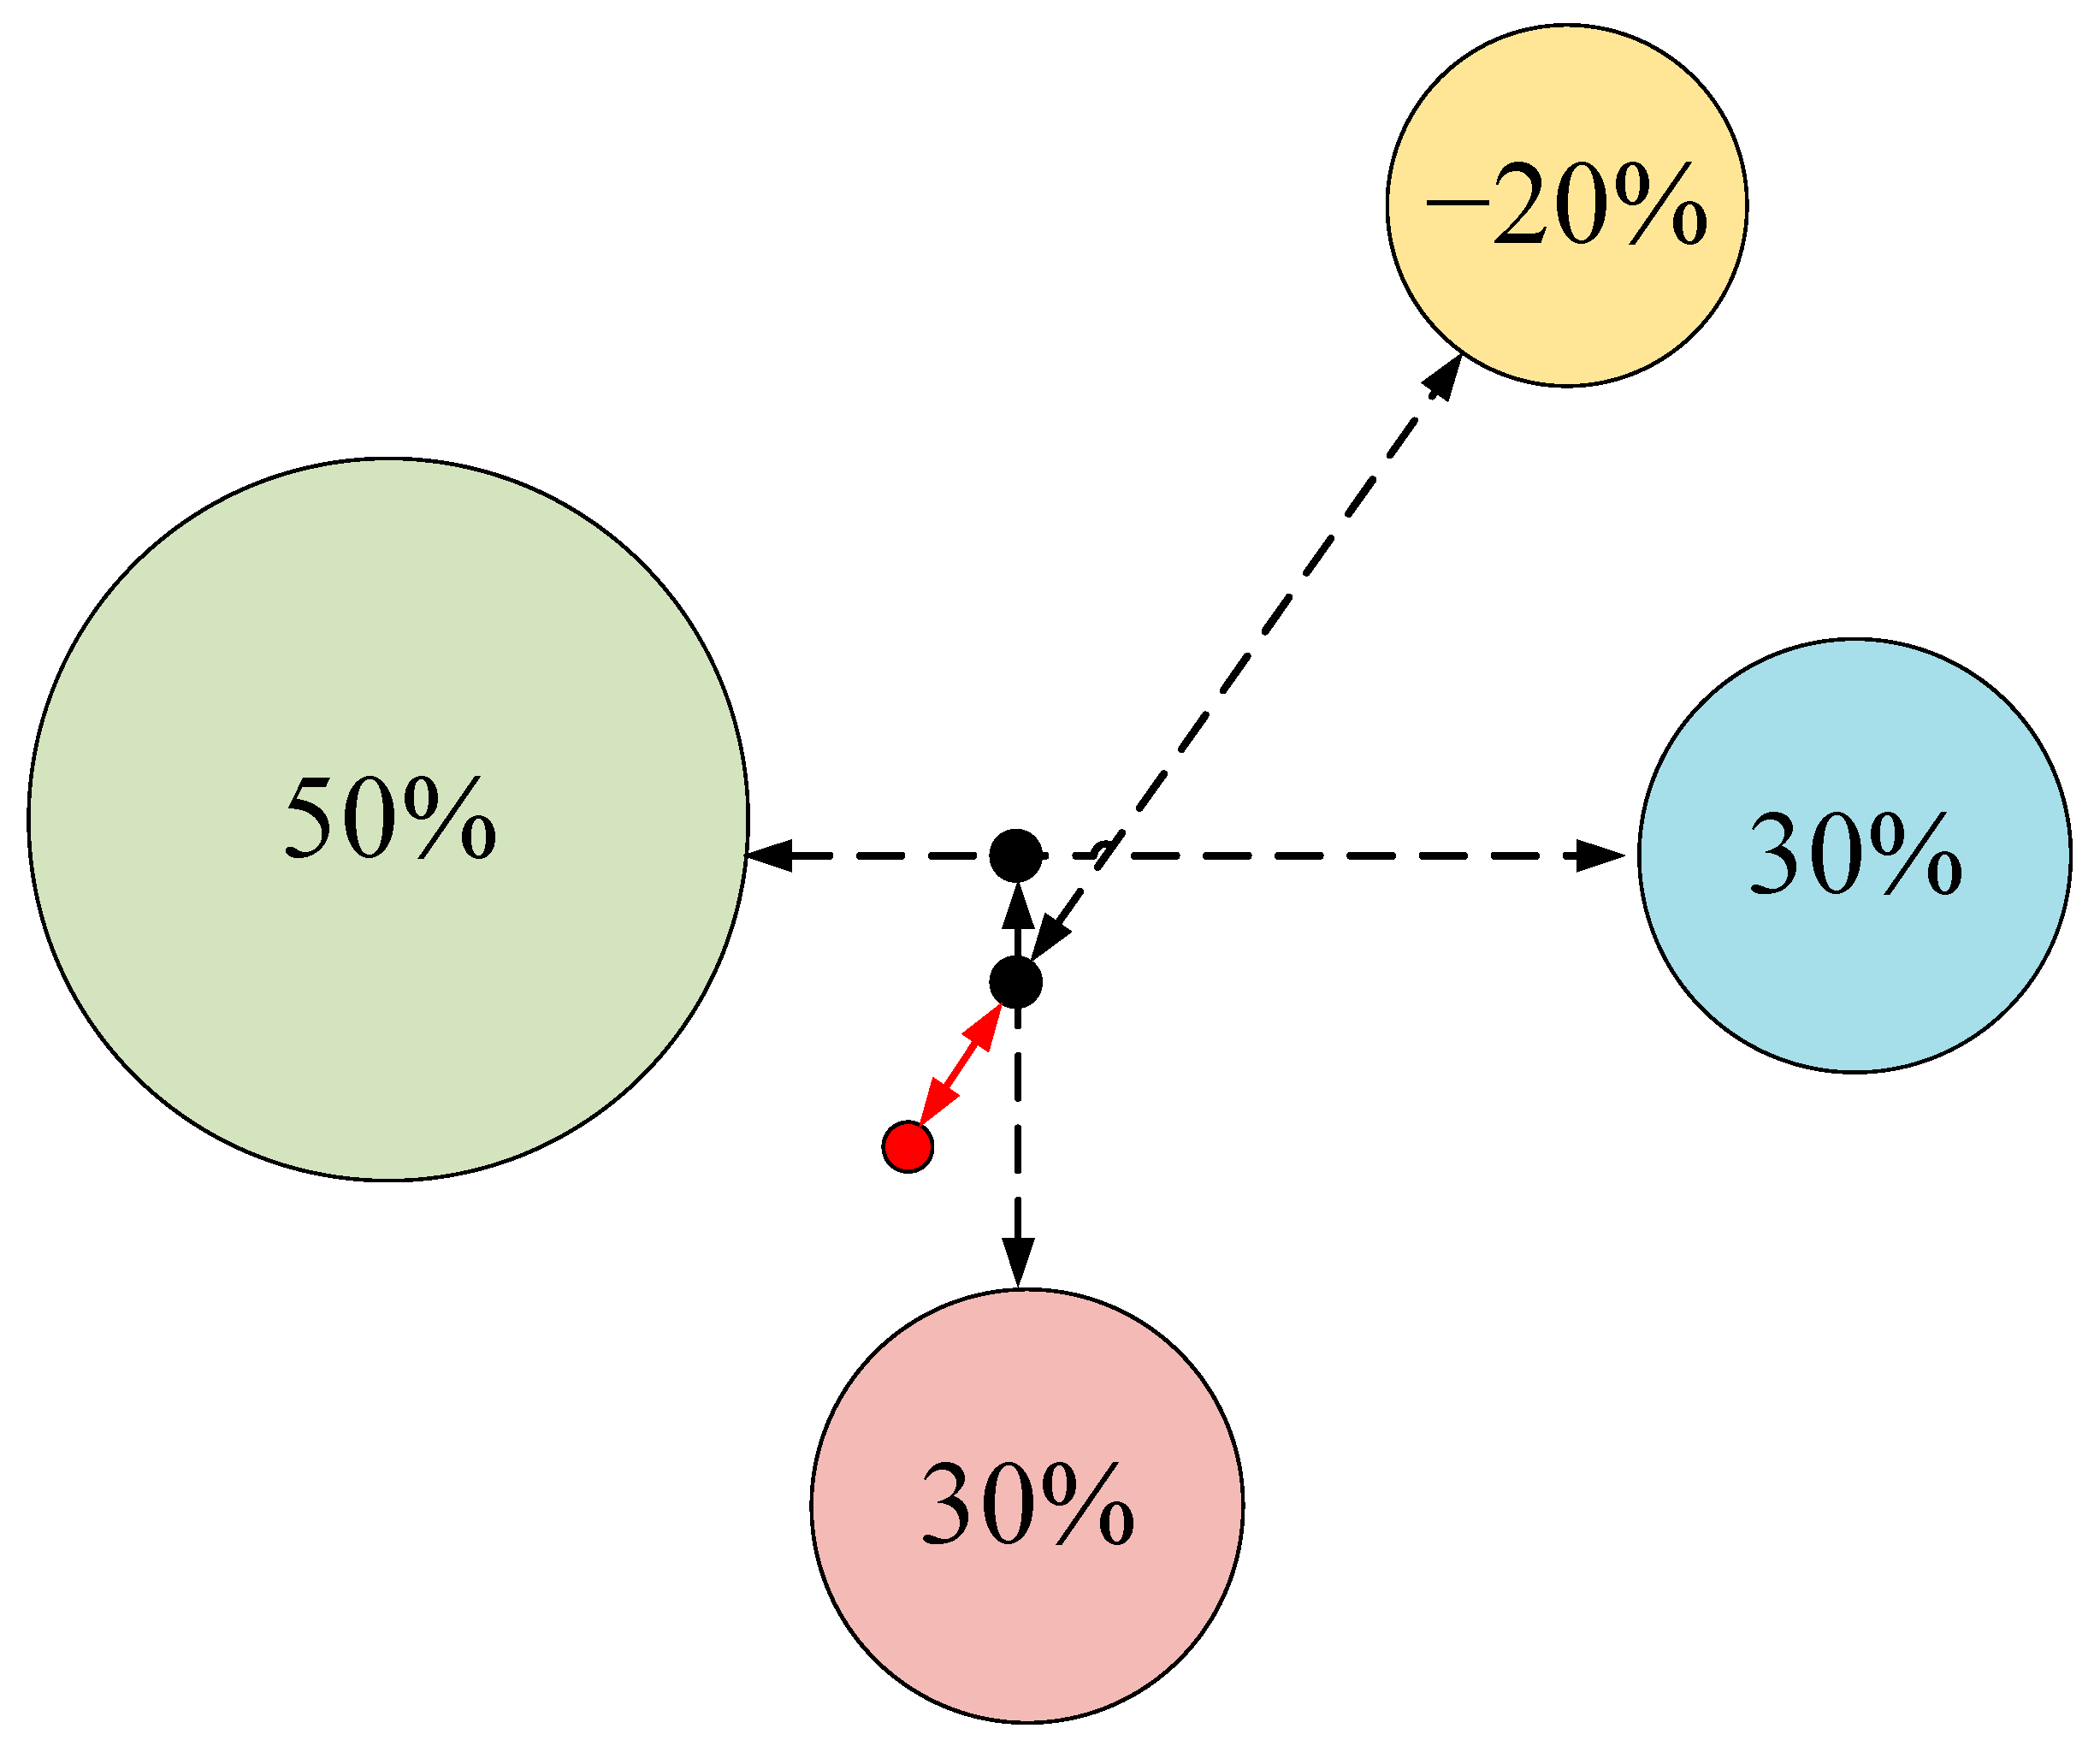
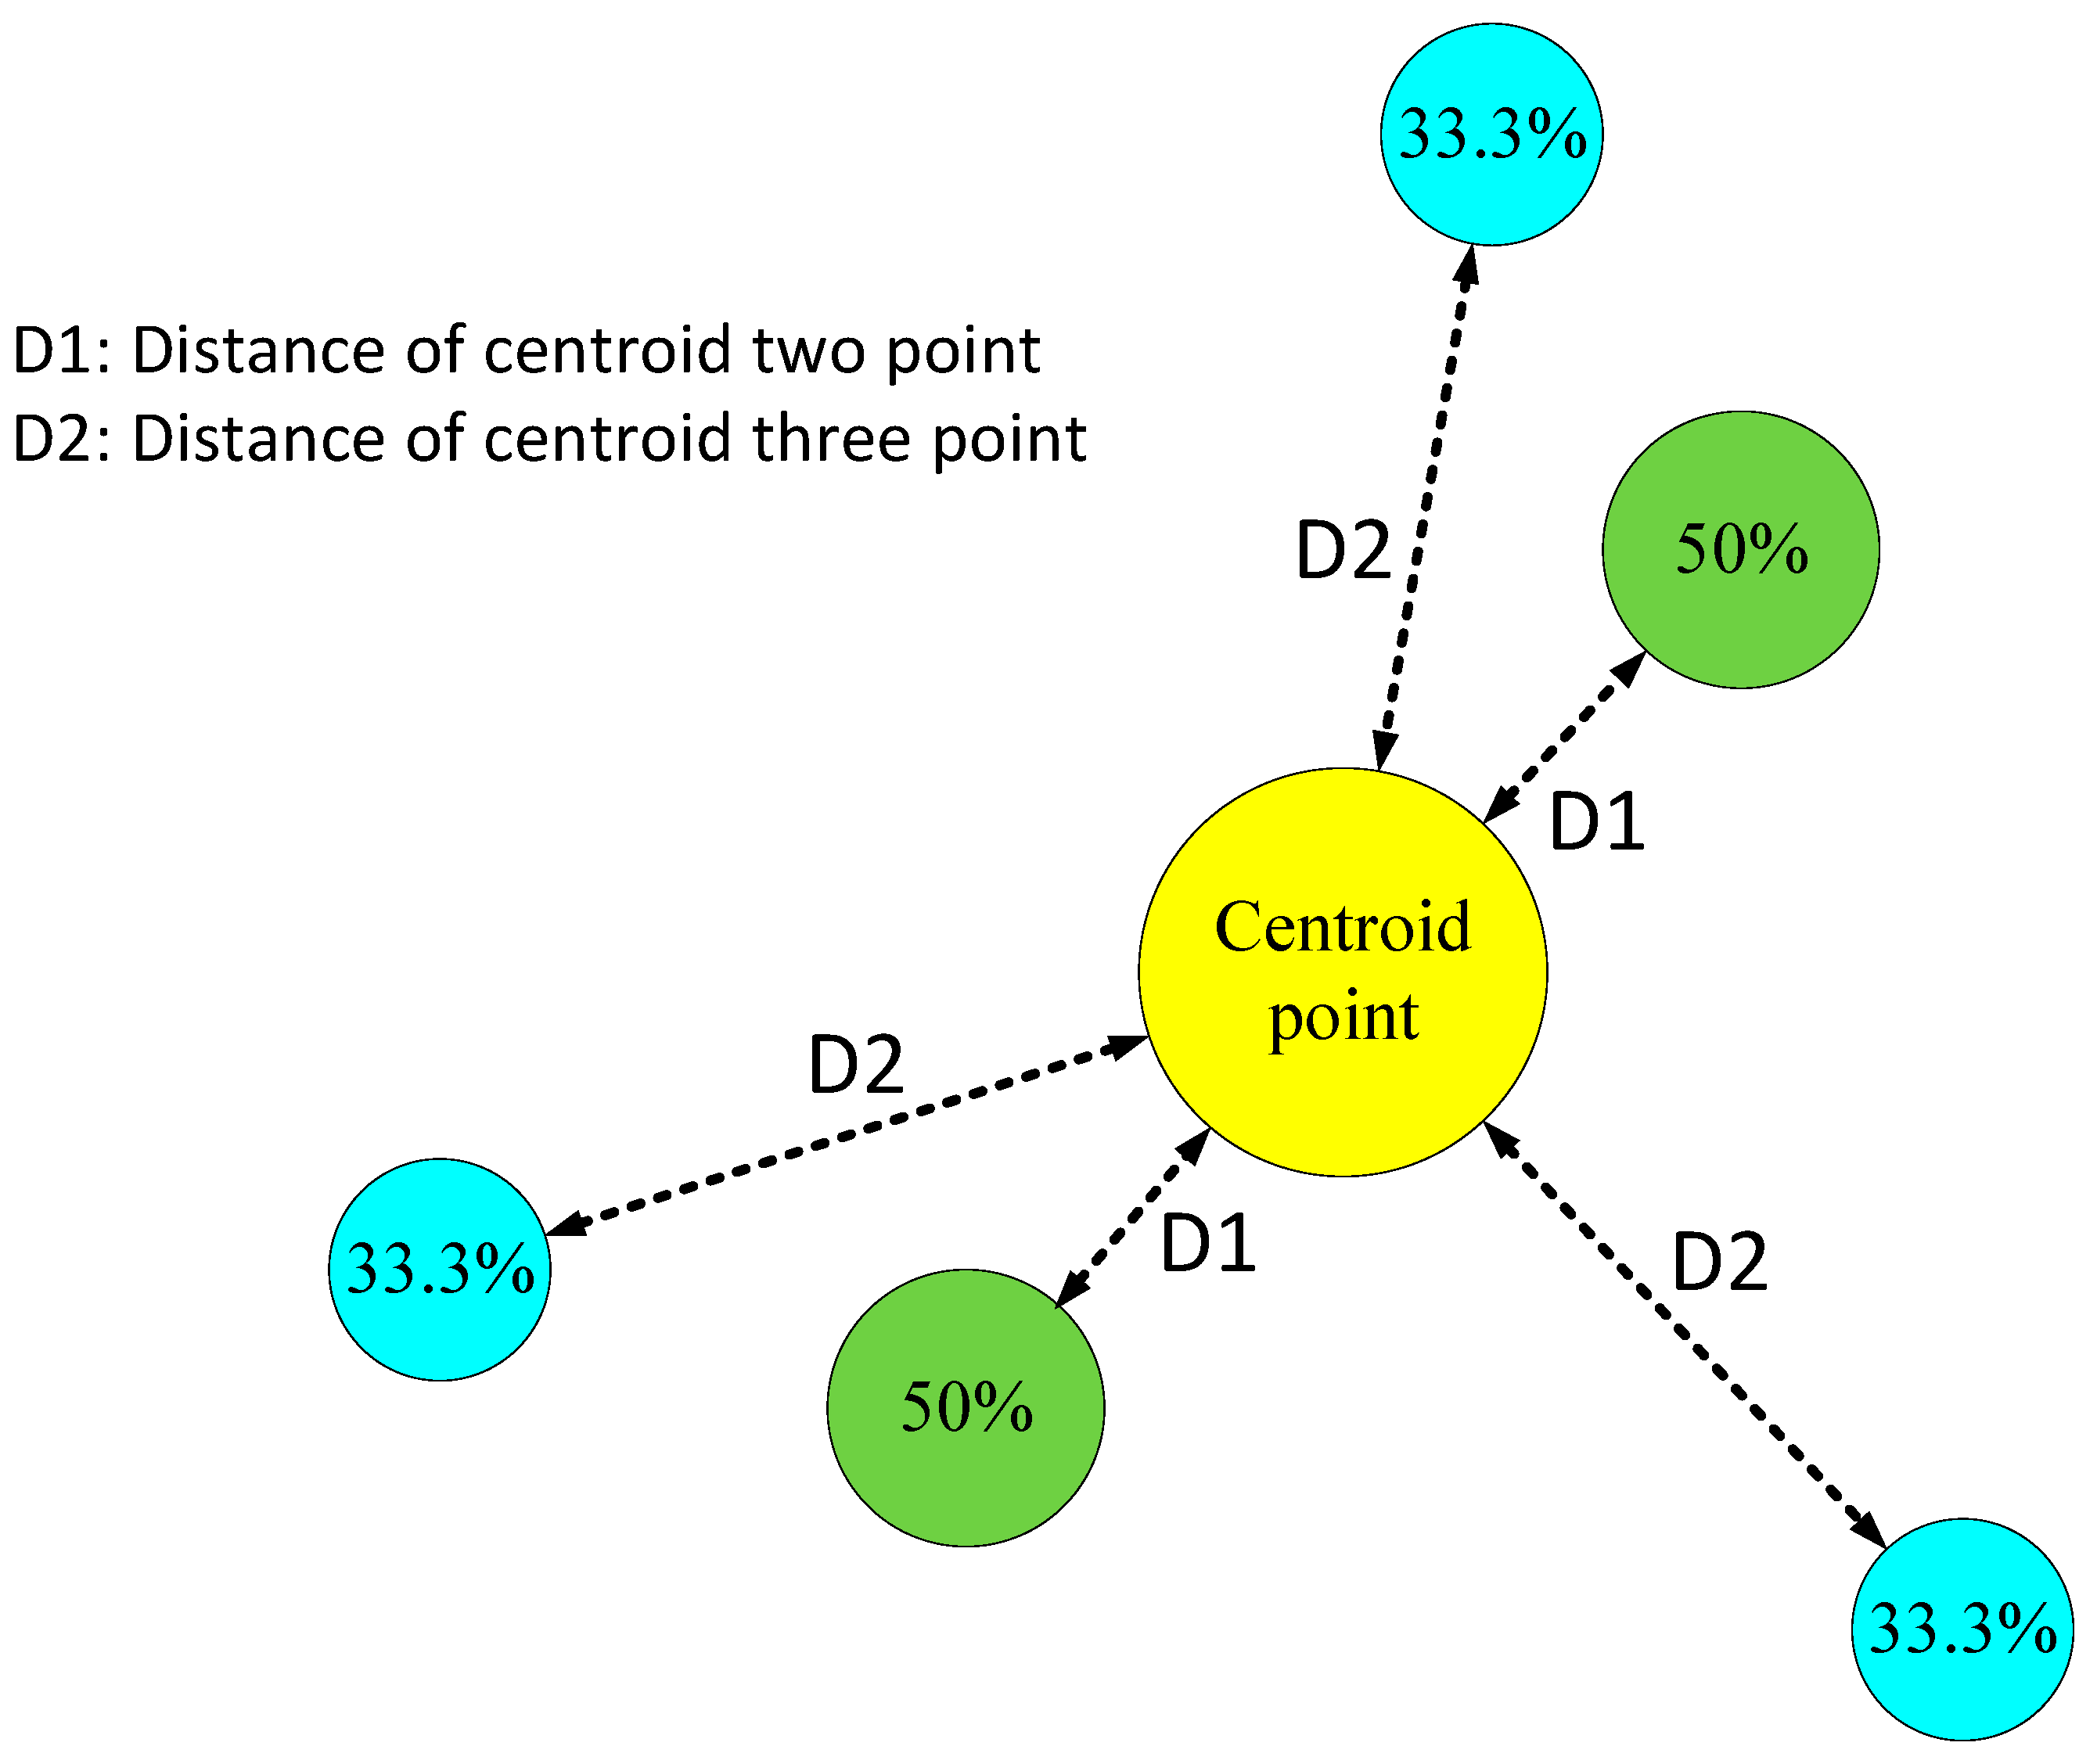
In RWG, the PV generation of the total demands of BAU is produced in a single location. The optimum location of PV is calculated using the centroid of mass theory. The method of centroid two demands is between two demands, where the weight (W) of both demands is affected. On the other hand, the PV generation location effect negatively affects the final centroid location. Figure 3 presents three demands, and single generations are located separately. The centroid of two points, 50% and 30% of demands, is located in the same line between two points closer to two high demands.
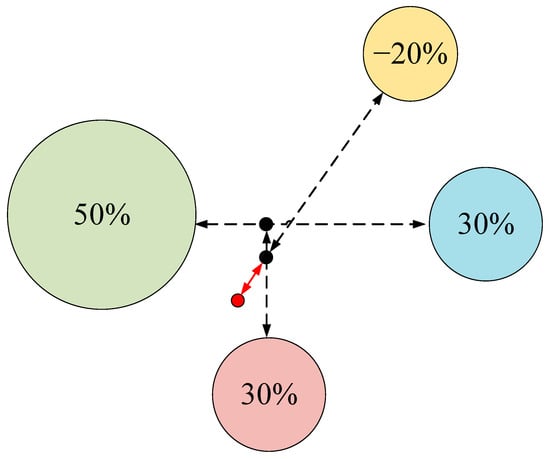
Figure 3.
Centroid mass theory of three demands and one generation location.
By adding another demand point such as another faculty of BAU, 20% of total demand will occur. In addition, the final centroid point may move toward new demand. Suppose a PV generation station covers 20% of total demand and is connected. In that case, the centroid point moves toward the opposite direction of the PV generation point; note that the generation point should be in a negative sign. The centroid of mass theory uses two-dimension equations, x-axes and y-axes, as the following equations:
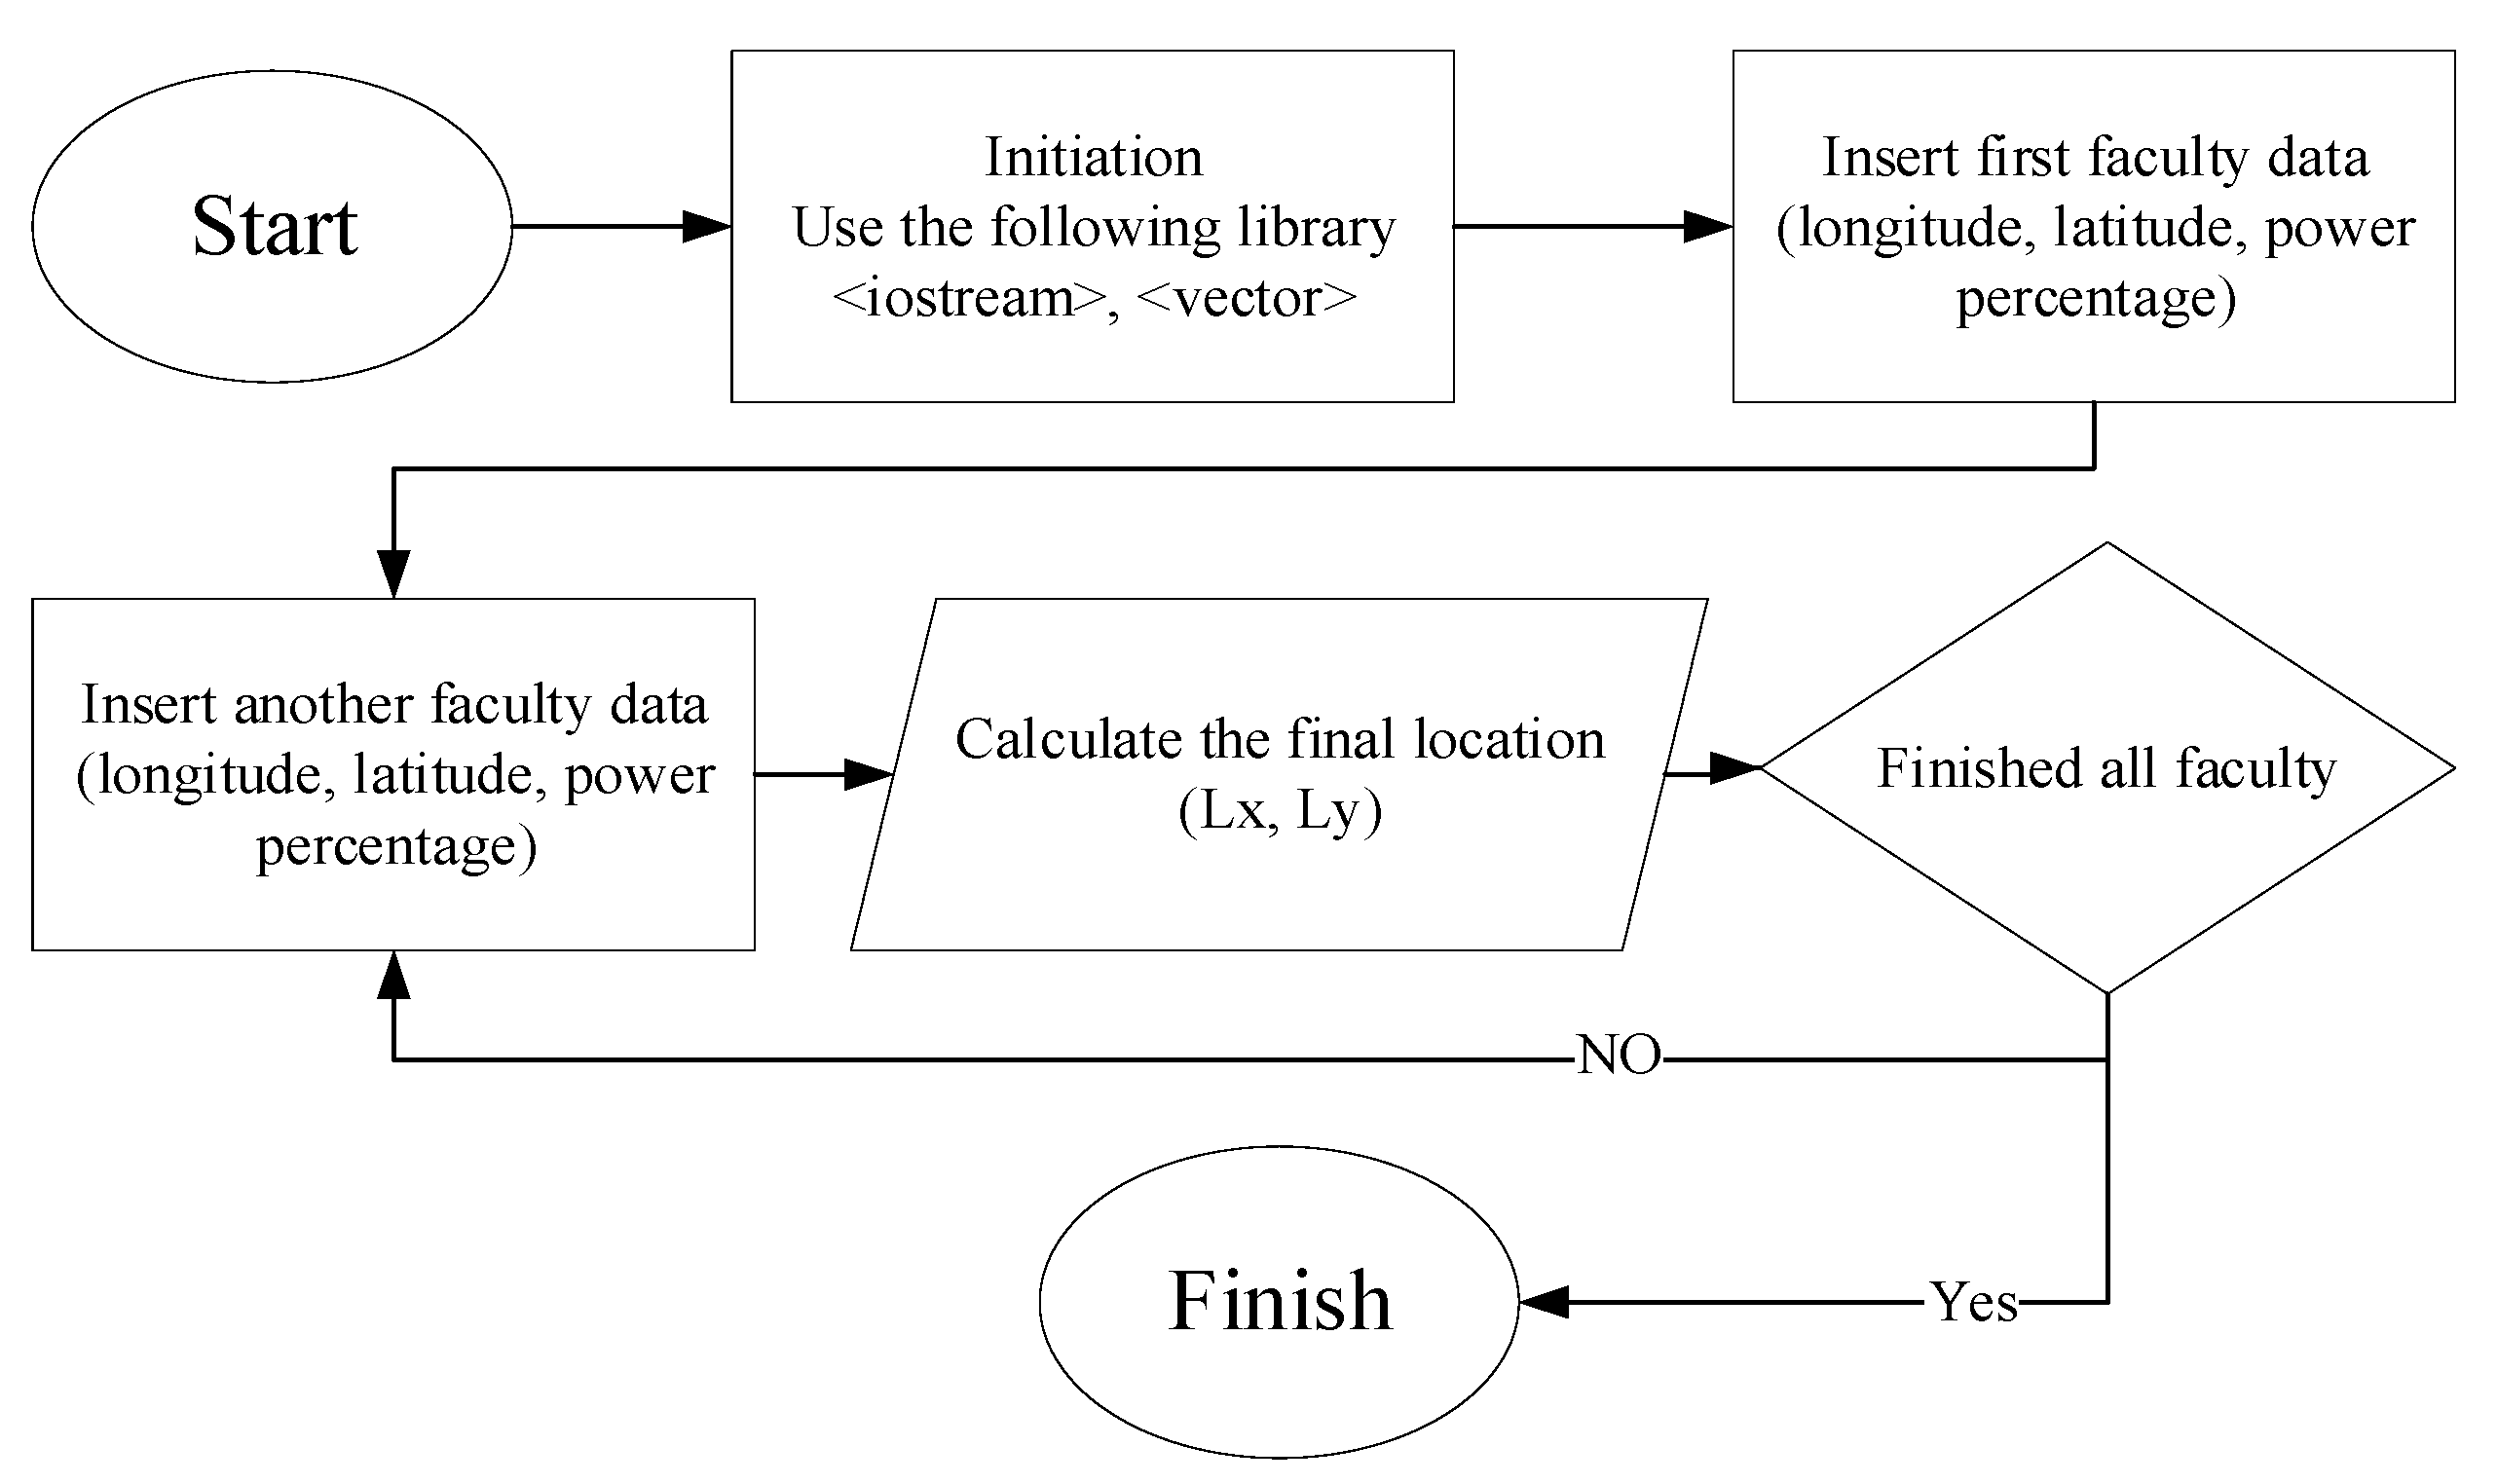
where Lx and Ly are the x-axes and y-axes of the final location of the centroid of mass theory, Wn is the demand percentage based on the total demands, and Ln,x and Ln,y are the x-axes and y-axes’ nth demands. It is worth mentioning that the x-axes and y-axes are the longitude and latitude of each faculty. Based on this, the multi-location of BAU faculties is used in Table 1 with its power percentage, and the program’s flowchart is presented in Figure 4. The final results of Table 1 data used in the Figure 4 methods are 31.9644° latitude and 35.8072° longitude, where 12 MW PV power is required.
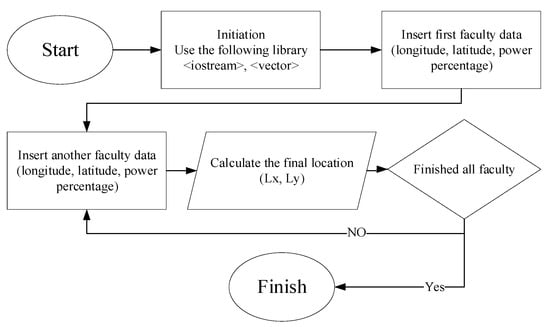
Figure 4.
Flow chart for centroid mass theory of multi demands and generations.
After the centroid of a single point is located and weighted as presented previously, the centroid design using two points or more can be determined. The methodology of two points and more is focused on a single point (centroid), whereas in centroid mass theory, the center point provides an equilibrium weight result. Figure 5 illustrates centroid power generation, showing two-point and three-point configurations, providing half and one-third power, respectively. These points are positioned opposite one another, corresponding to the location and magnitude of a single centroid’s demand.
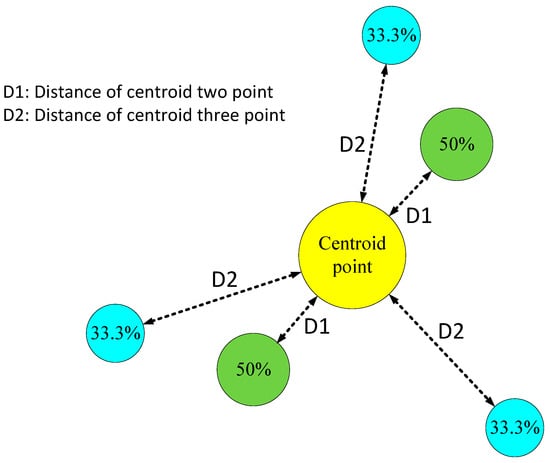
Figure 5.
Division of the centroid point of PV into two or three locations.
As a result, by applying two or three centroid points, the transmission line of 400 KV and 132 KV in Jordan is illustrated in Figure 6. Meanwhile, if the centroid point has difficulty installing the PV station due to price effects, limited area, rough terrain, or long distance from the transmission line, a multi-location design is proposed to divide the centroid point into two or more points. The new points can be equal, and the distance between the centroid and the latest points can be changed.
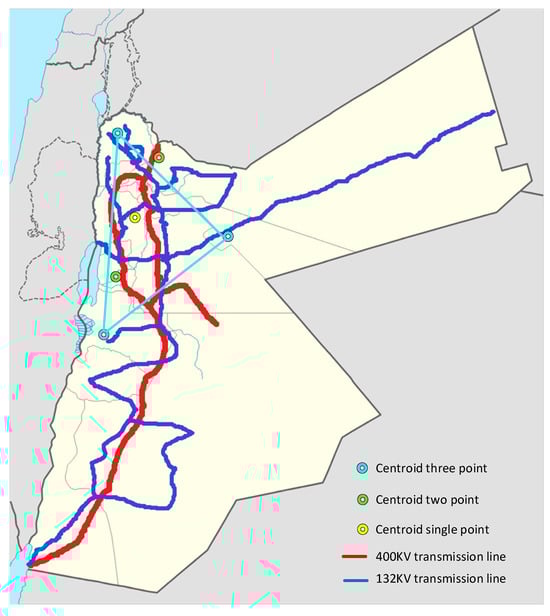
Figure 6.
The transmission lines of 400 KV and 132 KV in Jordan are also the single-, two-, and three-centroid points of the proposed RWG PV design [38].
Figure 6 presents an approximate two opposite generation point that could be used and connected to 400 KV. The two points are equal in demand and distance. Several two-point designs can be connected in 400 KV or 132 KV. Meanwhile, a three-centroid points design is presented by connecting to a 132 KV transmission line. That is, while the connecting of the three centroid points design in 400 KV is limited due to the transmission line zone, the proposed three centroid points should be equal to the one-point centroid in the 132 KV transmission line. The proposed three- and two-centroid points are calculated without considering the regional electrical distribution limitations and challenges.
The following section presents the optimizing case study of ISG and RWG. In addition, a brief discussion of the effect of the proposed design on temperature, irradiation, and the national grid will be presented.
3. Case Study Results
3.1. ISG Design
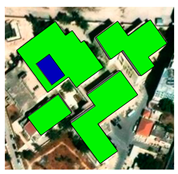
As all available BAU buildings were used, the total generation of ISG was found to be around 19,272 MWh, as presented in Table 2 for the rooftop design. However, 30,196 MWh is BAU’s annual electrical power demand, and the PV design in several faculties cannot meet the demand, as presented in Table 3. As covered and uncovered faculty rooftops present challenges in PV design, an additional area may be required for each faculty due to a covered rooftop and lack of roof space. Area sizing was determined using Equation (1), and the results are illustrated in Table 3.
Table 3.
PV generation of each faculty of BAU.
As a result, an extra area of 25,206 m2 is required for PV solar cells based on the calculation as the azimuth angle is truth south. It is worth mentioning that more than 80% of the required area is located between three faculties, the main campus, Irbid University College, and Ajloun University College, and these faculties are located in the north distribution network. Two design techniques can be considered to cover all faculties. While the first technique adds an extra area per building for each faculty, the second adds a centroid area of all of the uncovered roof faculties based on power demand, location, and solar angle.
If the distribution region is considered, the faculty should be classified north, middle, and south, as presented in the following sub-section where three single-point centroids are found.
3.2. RWG Based on Three Regions
As the power distribution in Jordan is divided into three regions, Huson University College, Irbid University College, and Ajloun University College are connected to the north region area. Meanwhile, Karak University College, Shobak University College, Ma’an University College, and Aqaba University College are connected to the south region. The rest of the faculties are linked to the middle region. The centroid point of the north region is located at 32.46127358 latitude and 35.83702166 longitude, respectively, where the total power is 3.099369 MW. In the same way, the centroid point of the middle and south regions is presented in Table 4, where the total power of each region is 7.8336084 and 1.4523516, respectively.
Table 4.
BAU colleges. Based on north, middle, and south regional electrical distribution.
3.3. Effect of Irradiation and Temprature
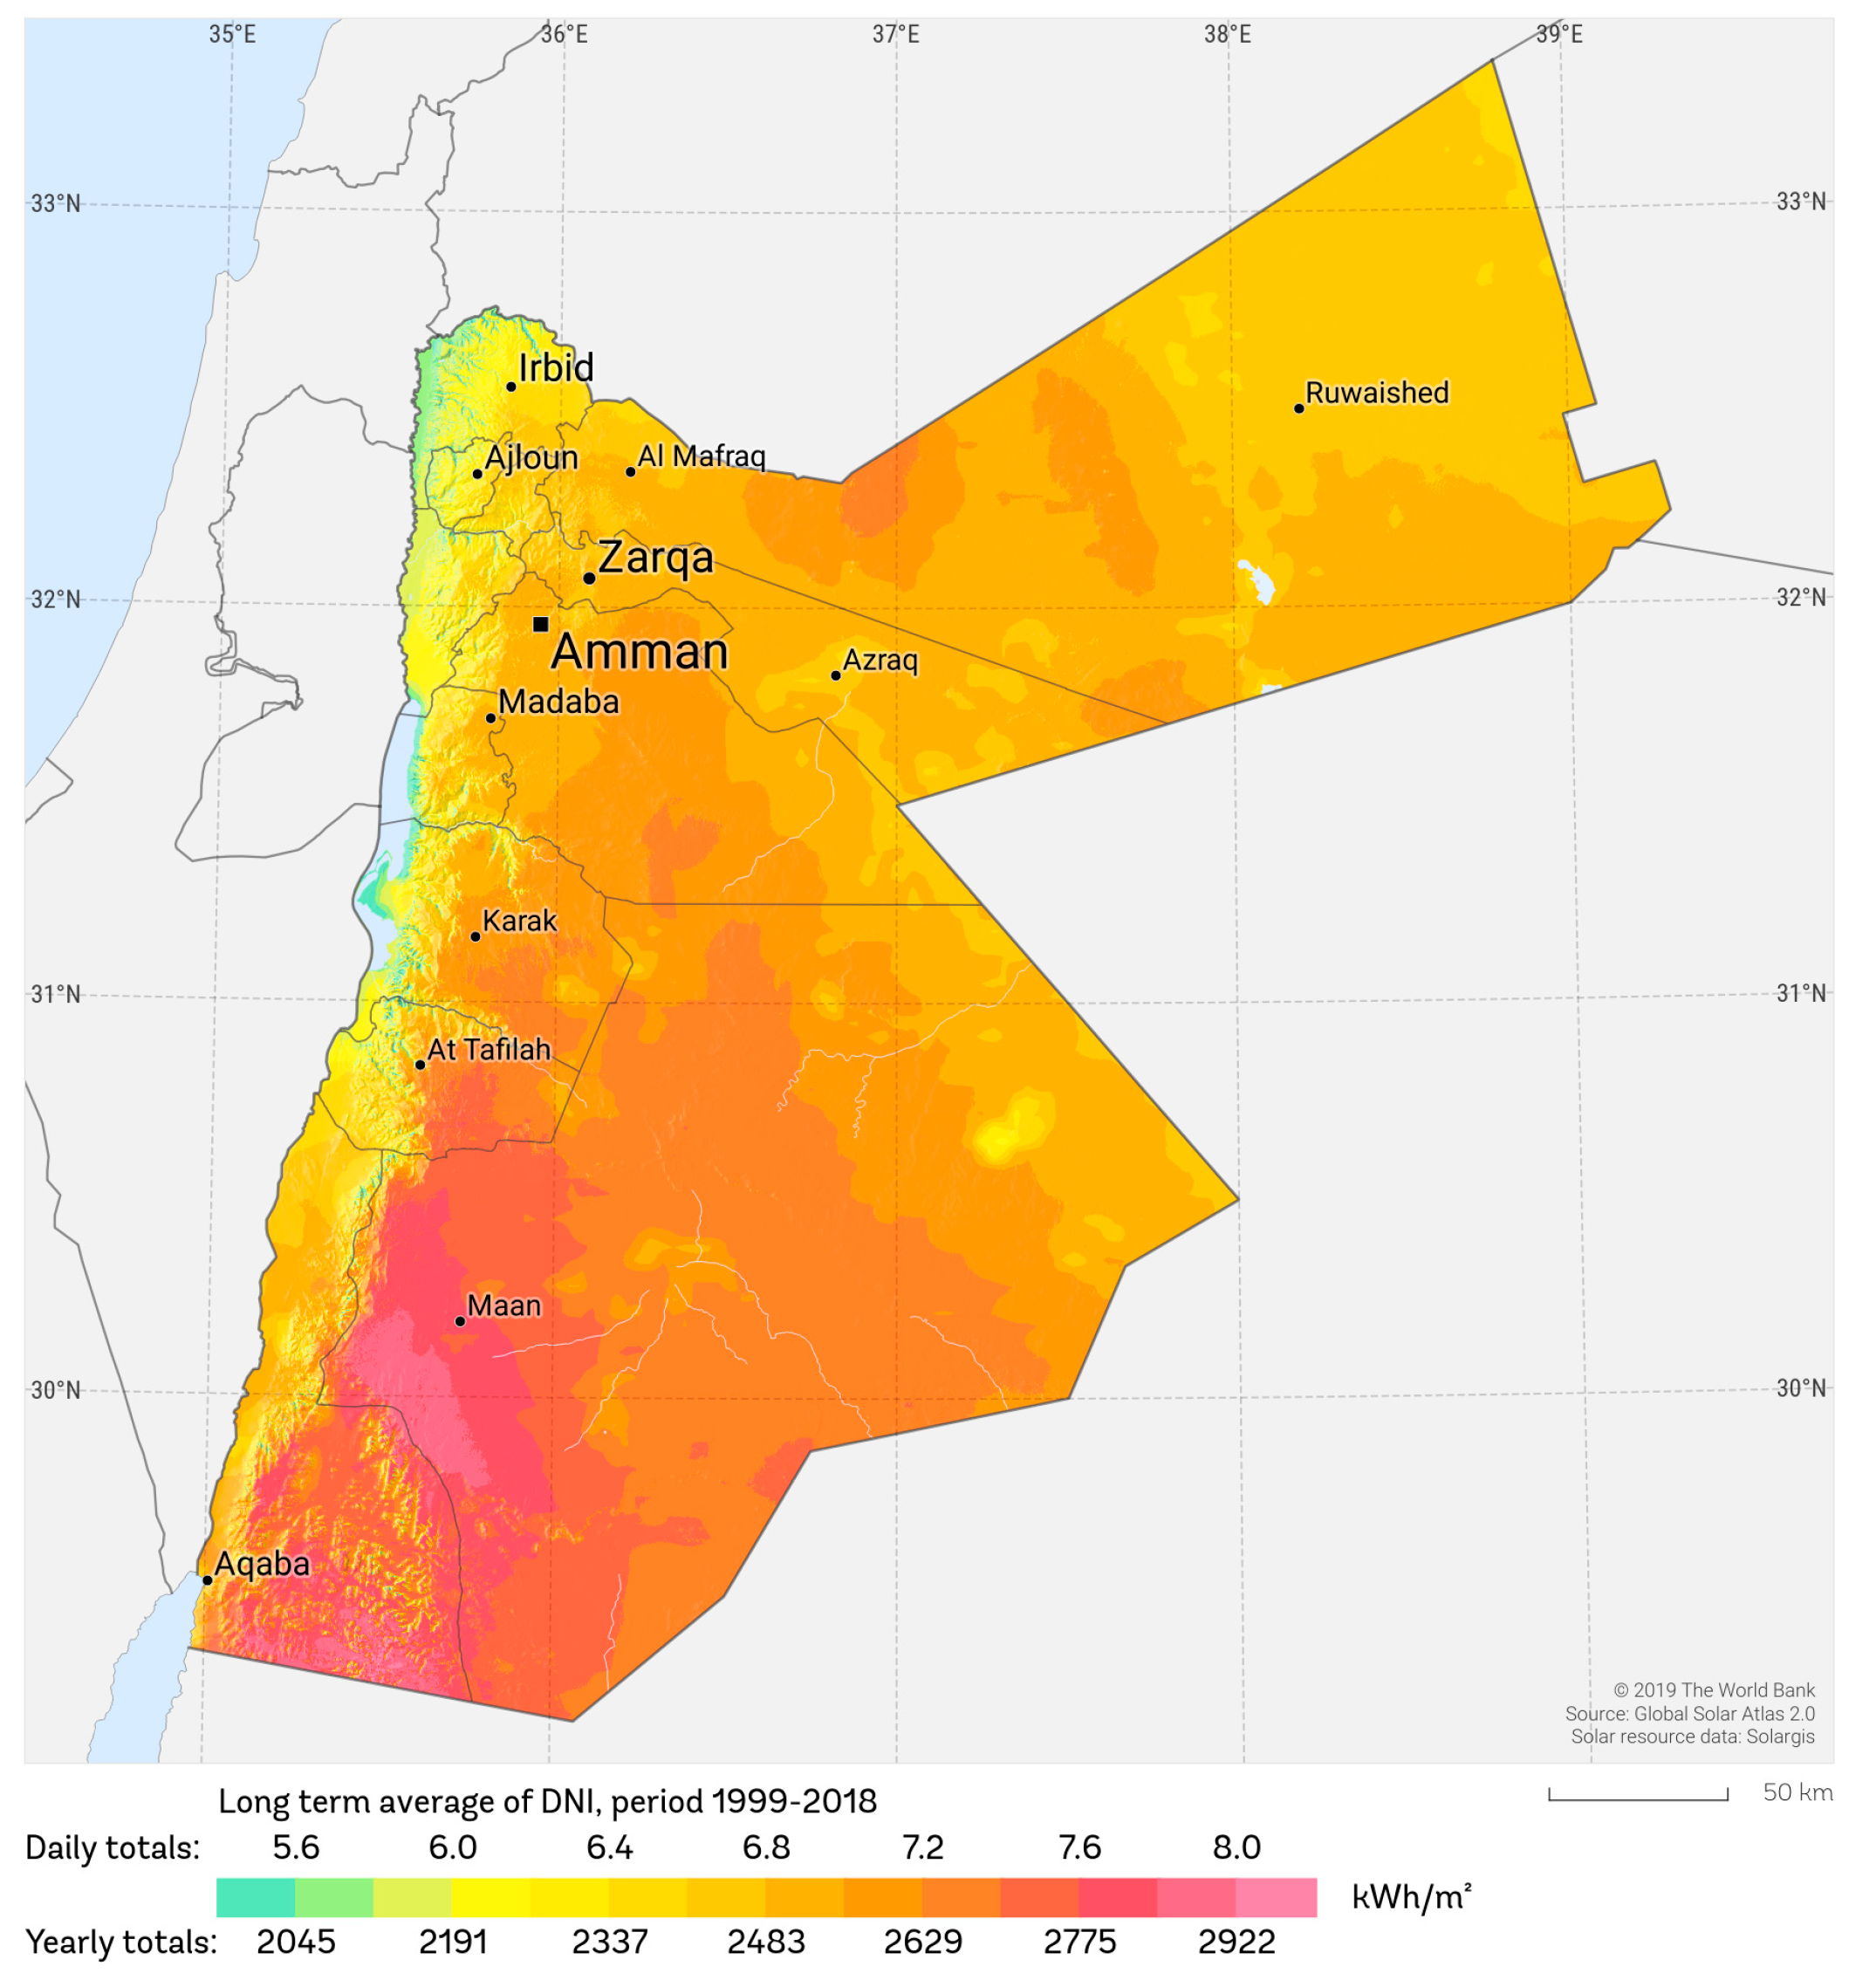
In general, Jordan has a higher irradiation value than other countries with moderate temperature values. Thus, PV solar cells are one of Jordan’s most common renewable energy resources [20]. Based on this, it is efficient to install PV farms in the southern part of Jordan, with high irradiation records, for all BAU facilities, as presented in Figure 7.
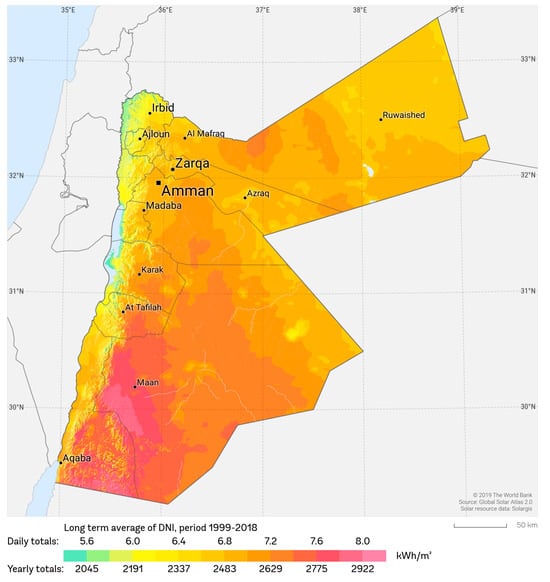
Figure 7.
Jordan’s horizontal irradiation [20].
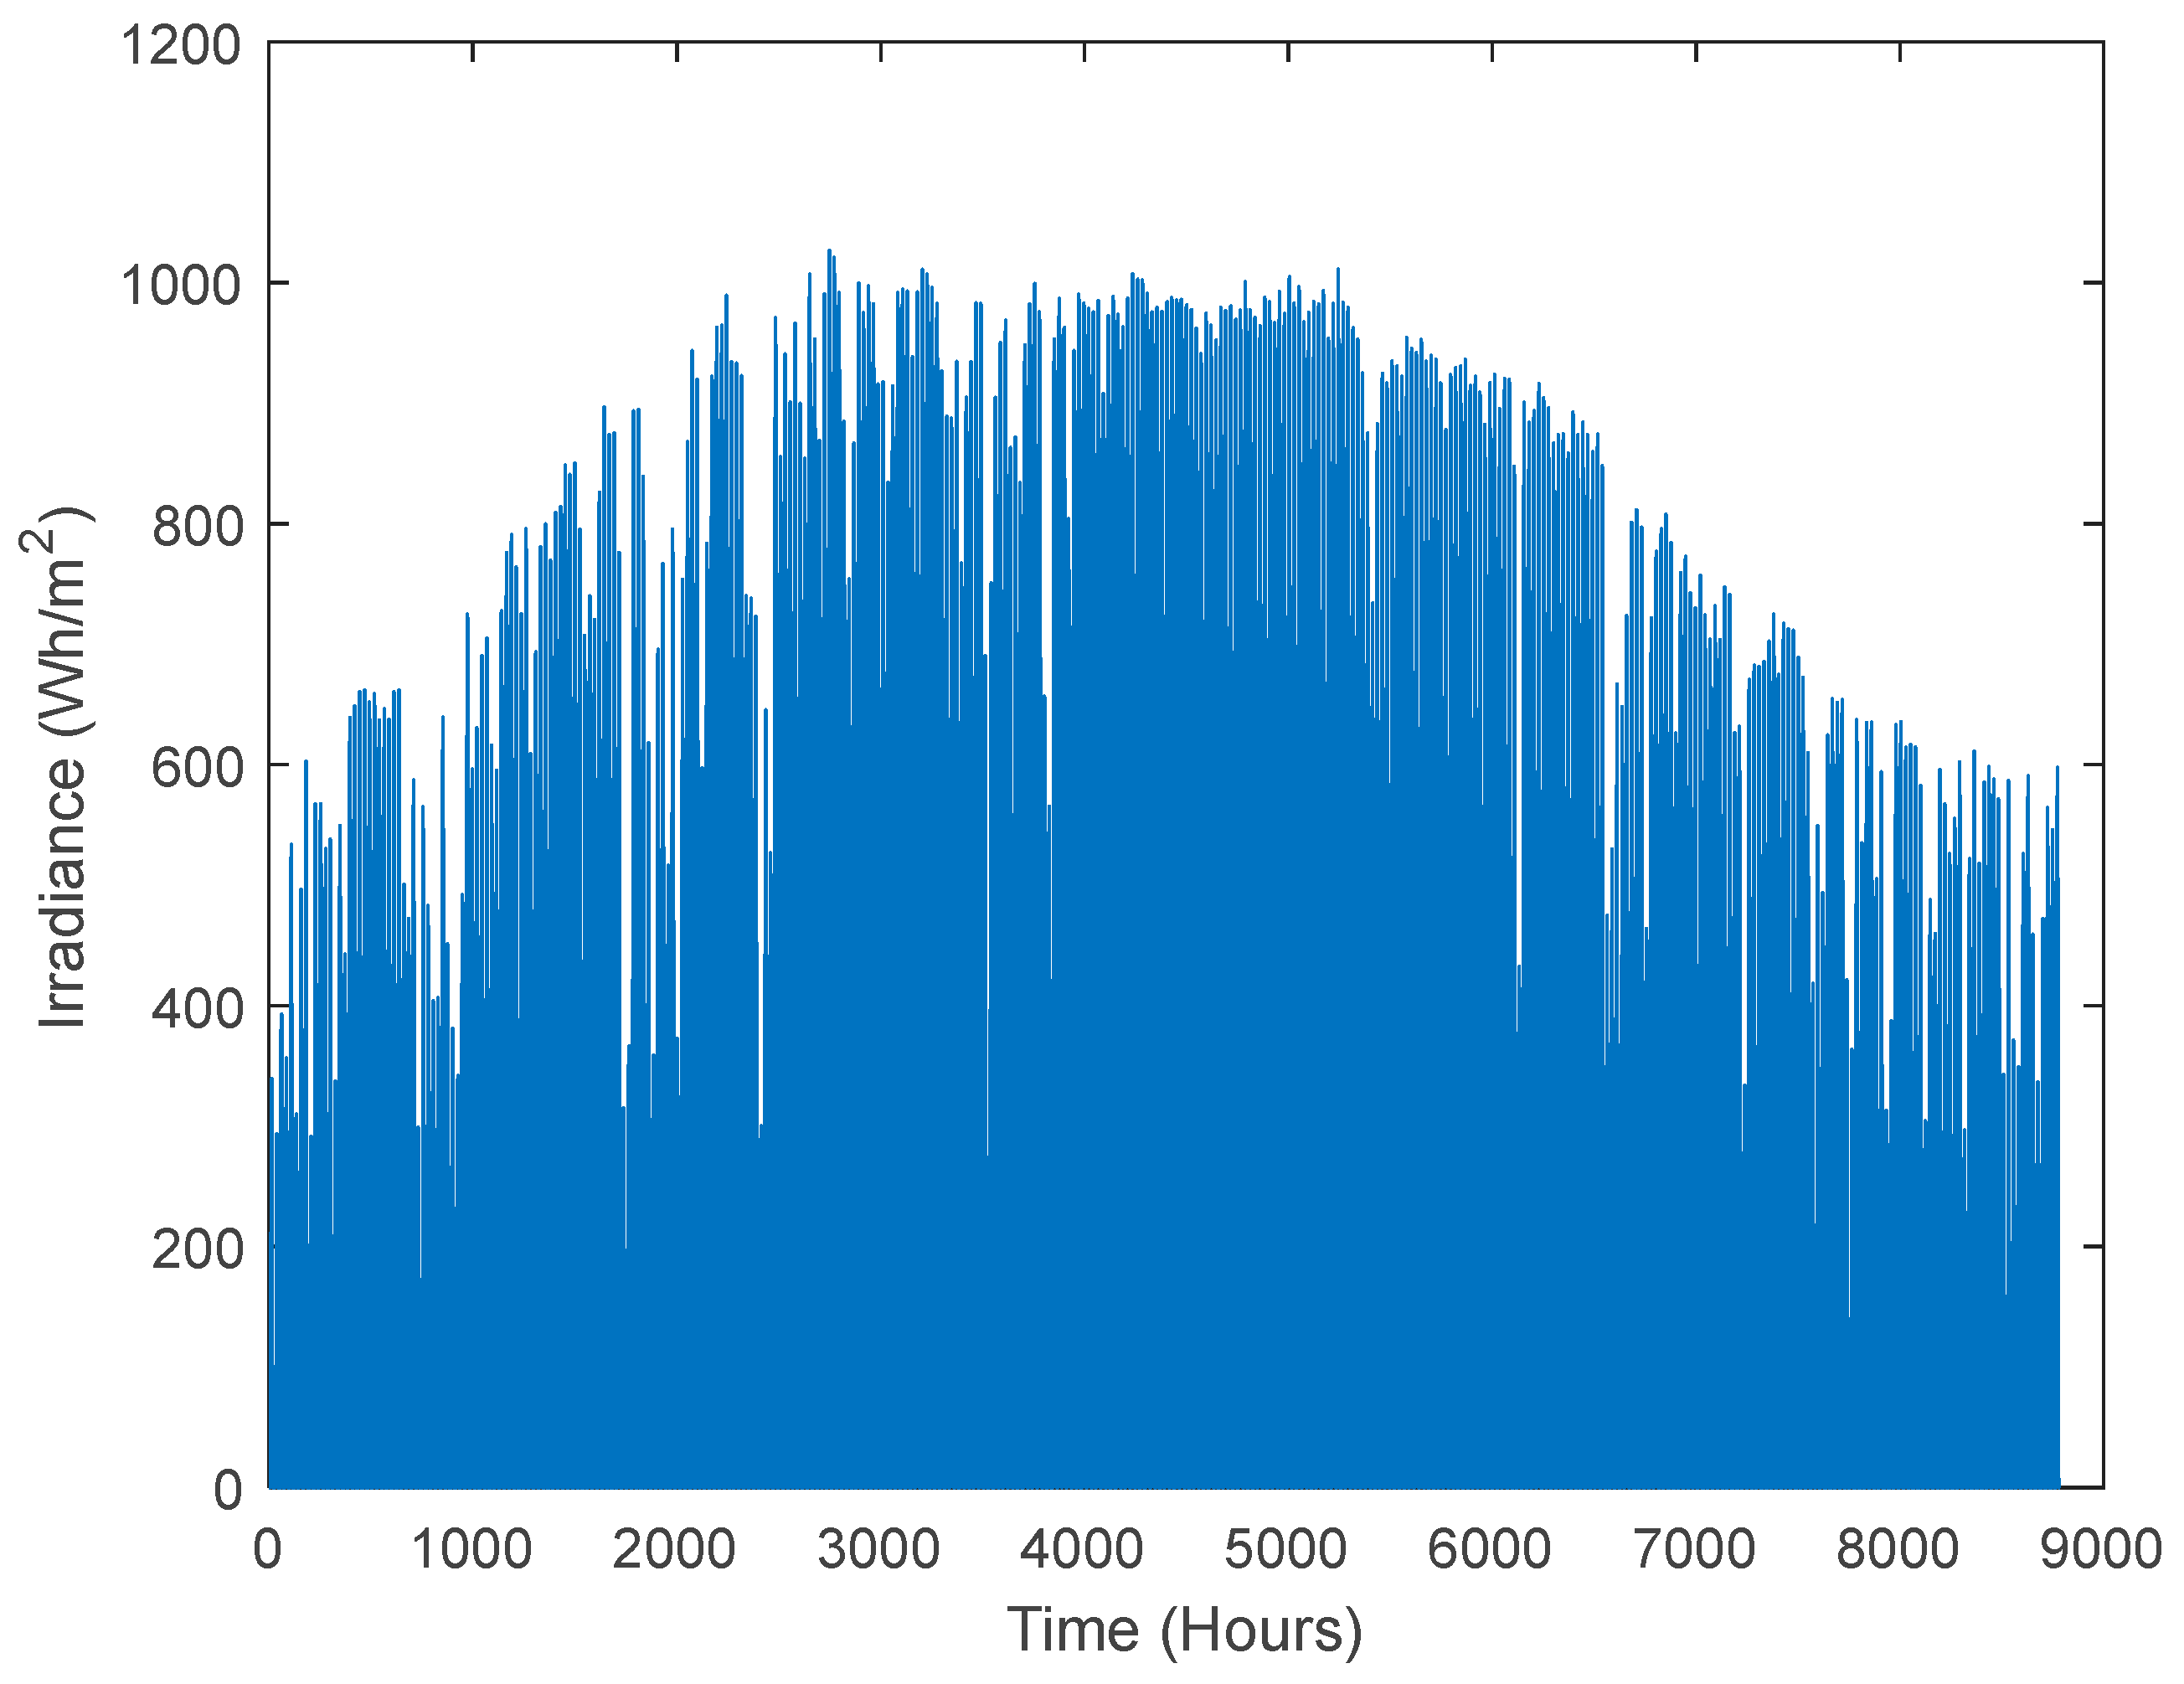
In 2023, as shown in Figure 8, the annual sun irradiation data in Jordan, registered by the NASA Surface Meteorology and Solar Energy database, showed a high and recommended recorded irradiation of 1000 Wh/m2 for the summertime. In winter, an acceptable irradiation value was recorded, reaching 600 Wh/m2 [41].
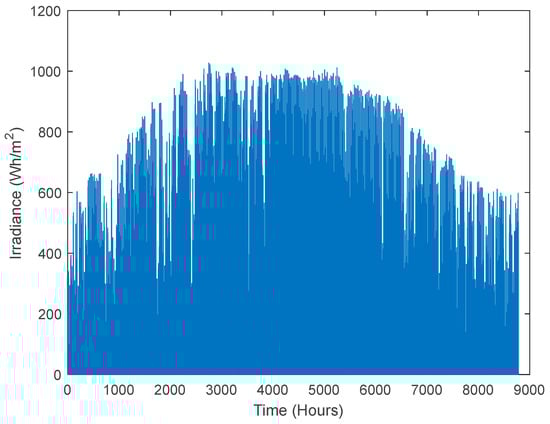
Figure 8.
Annual irradiation in Jordan per hour in 2023 (latitude: 31.95; longitude: 35.91).
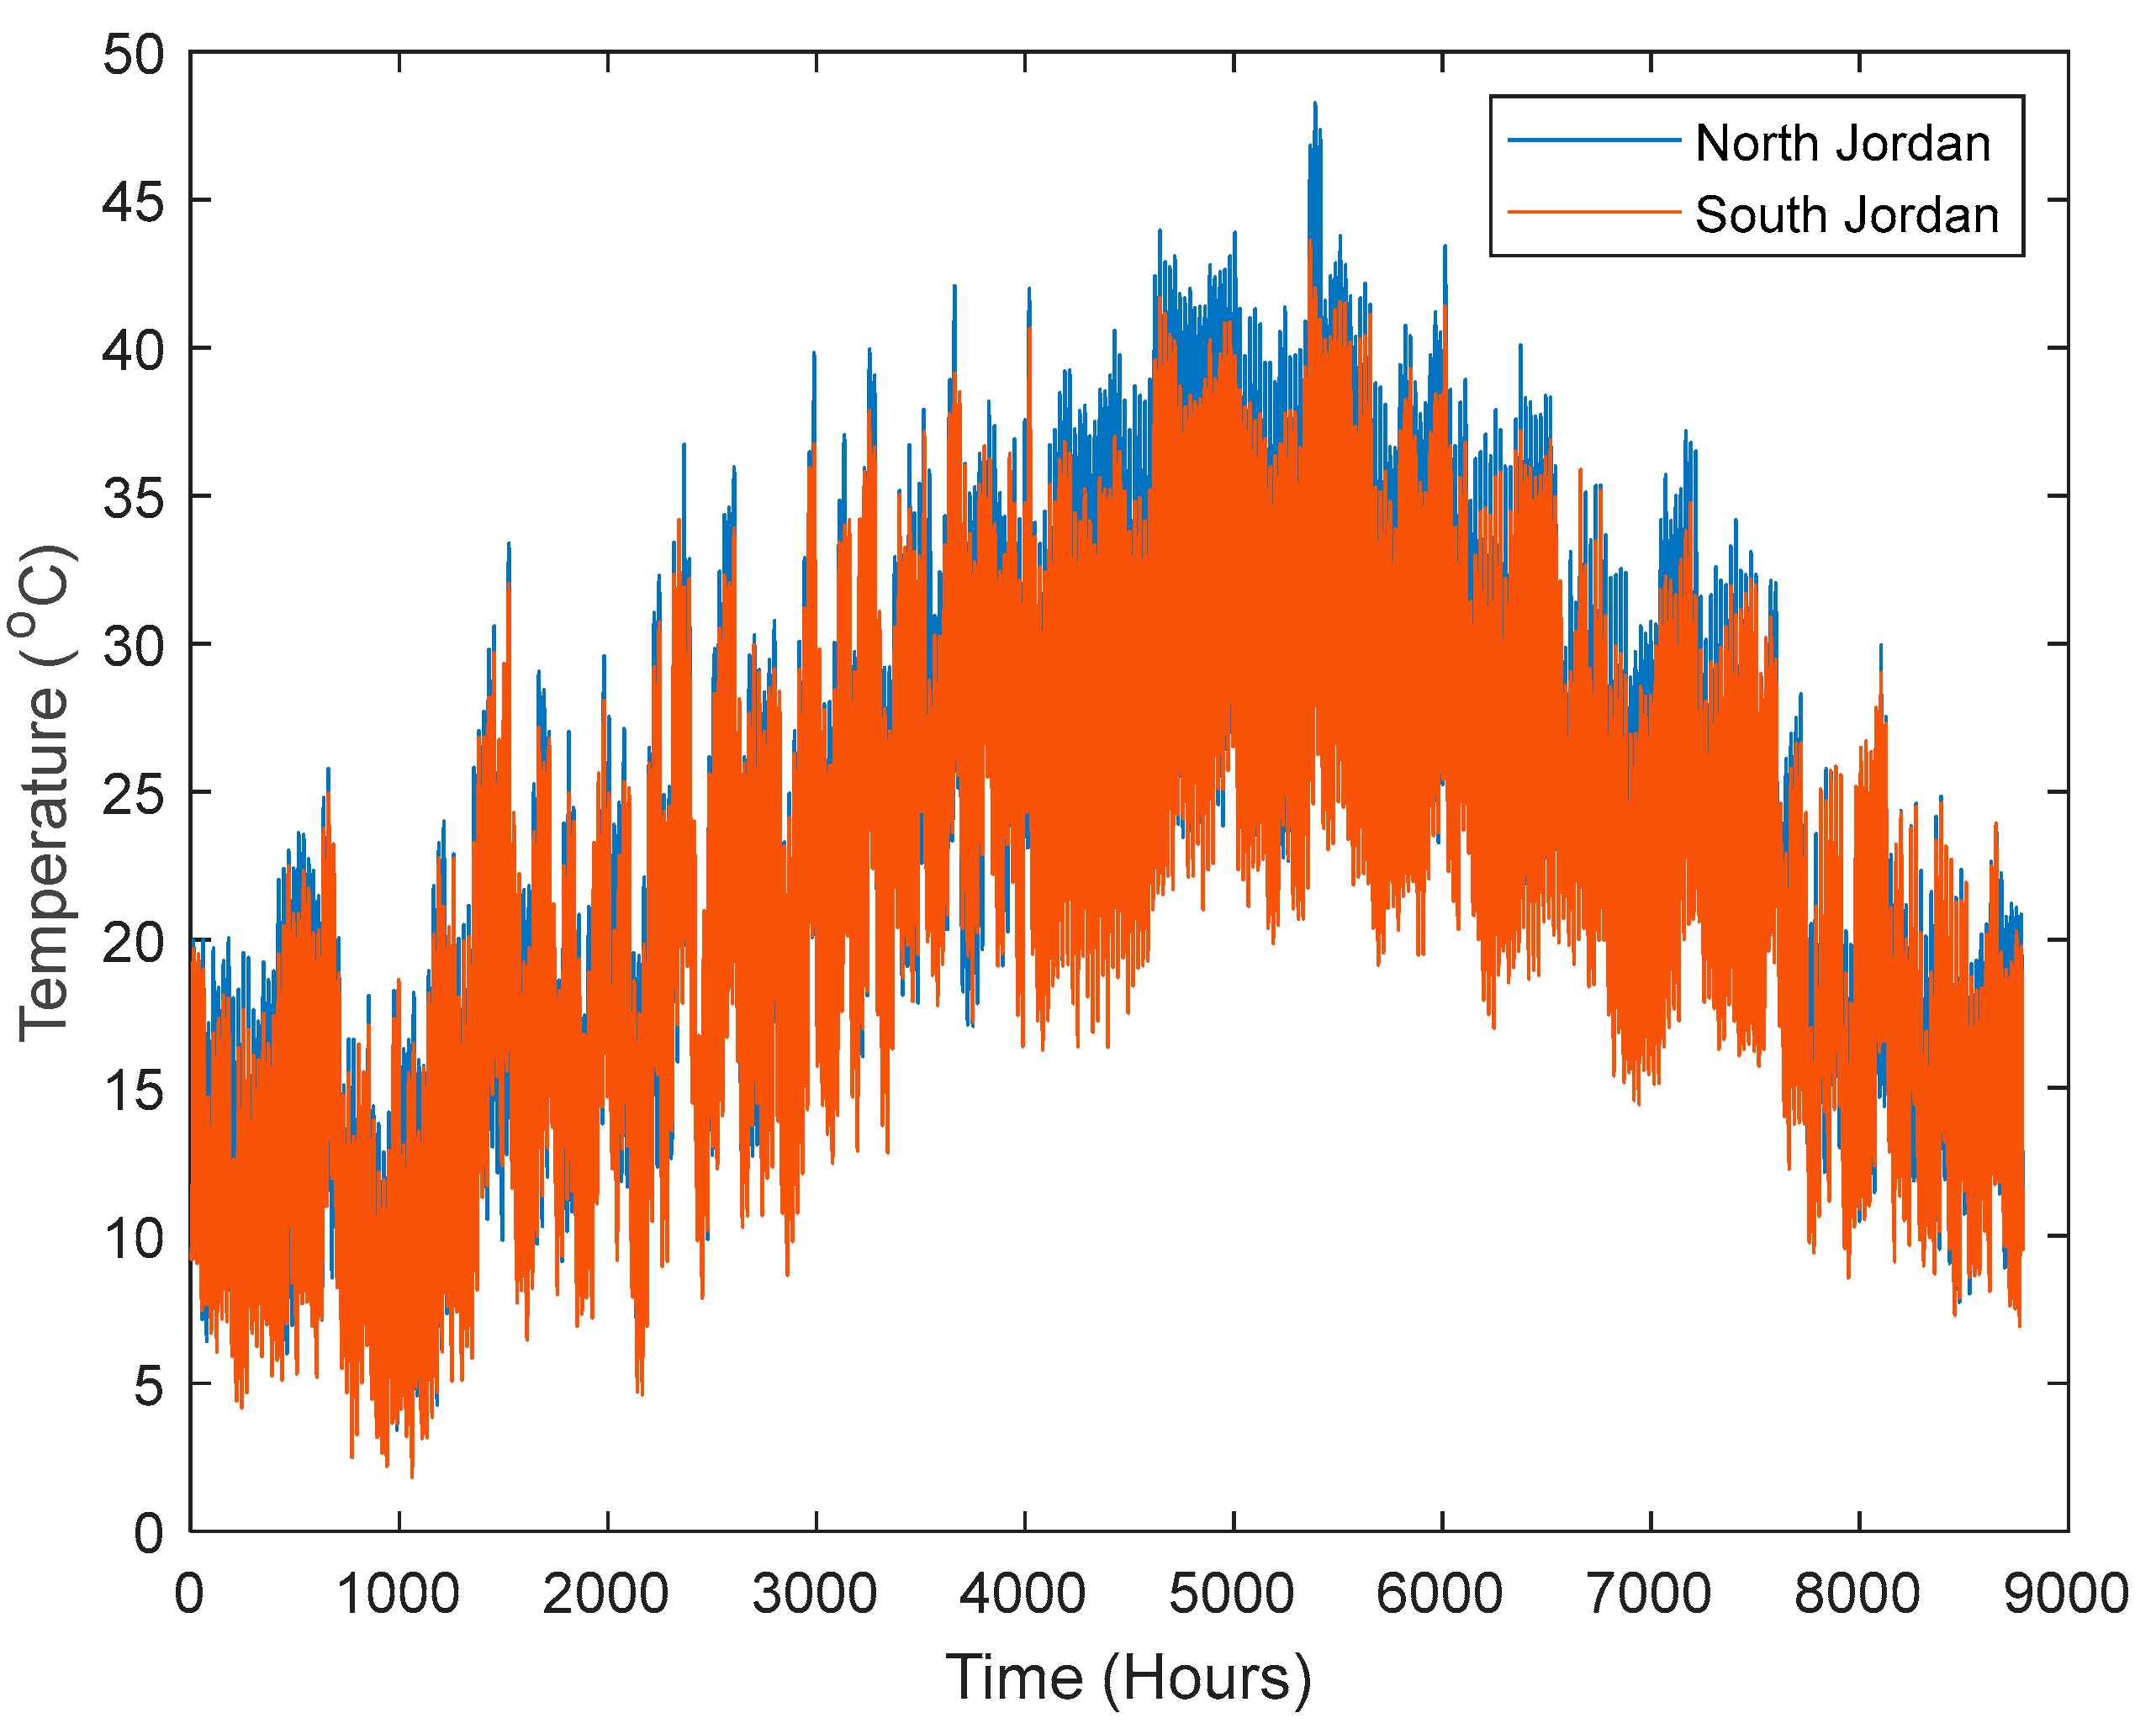
Although Jordan is known for its generally pleasant climate, summer temperatures, as shown in Figure 9, can reach as high as 45 °C [42]. In the southern region, particularly in Aqaba, temperatures are typically 5–10 °C higher than in northern areas like Irbid and Ajloun. As elevated temperatures negatively impact the power generation efficiency of PV solar cells [43], the temperature elevation in Jordan is minimal with minor effects besides the high irradiation.
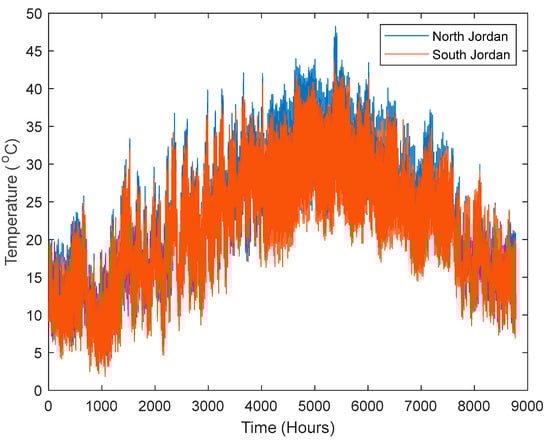
Figure 9.
Annual temperature in north and south Jordan per hour in 2023.
3.4. Effect of the Proposed Design on the National Grid
When ISG is utilized, the suggested design tends to reduce power flow in the national electric grid. The majority of the PV power is produced during the day while the university is open and classes are in session. As previously mentioned, in the design of ISG, certain facilities called for additional spaces for PV generation, like parking lots and open spaces, if they could be located nearby. However, in comparison to direct electricity use, covering the additional PV remotely also restricts the power flow in the national grid.
Using the RWG design also partially supports the national grid. In Jordan’s national grid, as most of the electrical generation is located on the southern side of Jordan, nearest to the Port of Aqaba, most PV generation farms are located in the southern part as well. Concentrating electrical generation in the southern part while the demand is in the north and middle, where the three major cities are located with 75% of the Jordanian population, leads to high power flow and losses, as shown in [2]. Table 5 is a presentation of all PV projects initiated in Jordan as of 2023 [3].
Table 5.
Installed PV projects in Jordan [3].
4. Comparison and Discussion
4.1. Comparison Between the Proposed Designs
A comprehensive comparison of proposed designs of ISG and RWG in both designs involving single and three points can be found in Table 6. The comparison of financial analysis contains a discussion of new land, area preparation, implementation, and maintenance. In addition, grid and distribution effect consideration is included to contain electrical bills and the network advantage. Below each discussion, an evaluation form using a five-star scale is used to illustrate effectiveness or quality and to give a resulting quantity interpretation of the comparison discussion.
Table 6.
Comprehensive comparison between ISG and RWG.
Extra new land is required in RWG, where three points of RWG are usually located closer to several faculties. Also, the land of three points of RWG can be modified and controlled to the optimal location. The PV location should not be crowded with tall buildings and should provide easy access to the transmission network. On the other hand, ISG does not need new land expansion where a rooftop is sufficient with building levels and strength considerations in mind.
In ISG, several obstacles were found, such as water tanks and chillers, thus giving two stars similar to RWG of single points, where a single location could be hard to prepare the area and not supported with electricity. The PV design should be implemented based on the university’s desire and privacy. A limited time of implementation is required in ISG design, where outside faculties do not allow implementation, especially for three-point RWG when the optimal location is determined.
In general, maintenance is limited in PV solar cell generation, where an increase in the number of locations makes maintenance more sophisticated compared to single or three points of RWG. RWG locations for both types of design could not be supported with roads and communication, where ISG maintenance is scheduled based on university education, which is why the maintenance scale has a maximum of three stars.
The comparison of the proposed design on the national grid and distribution network is briefly discussed, and the comparison focuses on power flow and the electrical bill effect. In ISG, the areas near the majority of BAU and international faculties experience significantly higher consumer demand compared to agricultural or desert regions; thus, the full mark on the scale of the stars is graded. In the RWG single-centroid point, the calculated location may occur in expensive properties, crowded buildings, or far away regions. Therefore, two stars on the scale are graded. In three-centroid point RWG, extra limited places can be found. Thus, four stars on the scale are graded.
In Jordan, three private distribution companies control the entire electrical distribution network. These companies act as intermediaries between the generation companies and consumers. Managing power flow across multiple buildings connected to different distribution networks can be challenging, especially when electricity is both consumed and generated at a single point within the network. Therefore, a system with a single control point is rated two stars, while a system with three control points (RWG) is rated four stars, as billing and payments are directly tied to the distribution network, with considerations for distance and voltage connections. In the ISG region, a five-star rating is given due to the use of net metering PV implementation. During weekdays, most of the PV-generated electricity is consumed by the faculties, while on weekends, it is used by the faculty area, which is typically crowded with consumers.
The highest number of stars is graded in three-centroid point RWG, with twenty-five stars. The minimum number of stars is graded in single-centroid point RWG, with a total of fifteen stars, and the total number of stars of ISG design is twenty stars. This means that the RWG design of a single centroid point is not recommended as the design needs an intensive study of several point locations to obtain the optimum location features. Otherwise, the ISG design could be used.
4.2. The Proposed Approach Generalization
The proposed design assumes that the BAU faculties are the only ones connected to the national grid for generating and consuming power. This would logically reduce the overall electrical power flow when non-BAU consumers are considered and partially reduce the overall electrical power flow. As a result, the stability of the power system is maintained due to the limited electrical power flow. In addition, the proposed theory design can be generalized to several applications of large or middle consumers with multi-locations scattered along certain sectors such as banks, malls, gas stations, and restaurants. The proposed design supports the national grid partially with stability and reduces power flow. Likewise, this proposed design can be further generalized by including several electrical generations of conventional and renewable energy. The generation points of any country can be centroid by one or more points; then, the centroid demand points can be calculated. Therefore, approximation results can be handled, and the calculation complexity can be controlled by reducing the centroid points of generations and demands.
5. Conclusions
This paper presents the ISG and RWG of PV electrical power generation designs using centroid mass theory at Al-Balqa Applied University. The design considered the faculty demand, location, building rooftop area, and azimuth angle. The results of both designs were discussed, and the effect of irradiation and temperature on the designs is illustrated. A general view of the effect of PV on the national grid of Jordan’s electricity is presented. In addition, a comprehensive comparison among ISG, single-centroid point RWG, and three-centroid point RWG is presented, where the proposed design of multi-centroid points of RWG is preferable based on intensive design. The ISG design showed a better star scale, twenty out of thirty stars. Meanwhile, single-centroid point RWG has a lower star scale, fifteen out of thirty, due to design limitations. However, as a rare study of mass theory in PV location design, the proposed approach cannot be compared with other similar approaches since there has been no other case study with a high level of similarity characteristics in PV solar cell design. Since other works have used the load centroid method in power supply to determine the location of the power source, this work investigated the ability to use centroid mass theory methods to determine the location of PV solar systems and allows for future work using this method.
Author Contributions
Conceptualization, A.A.-M. and E.A.; data curation, A.A.-M. and E.A.; formal analysis, E.A. and A.A.-M.; methodology, A.A.-M., E.A. and D.A.-M.; project administration, E.A. and A.A.-M.; resources, E.A., A.A.-M., W.A.-R. and D.A.-M.; software, A.A.-M. and D.A.-M.; supervision, A.A.-M., E.A. and W.A.-R.; validation, E.A., A.A.-M. and W.A.-R.; visualization, W.A.-R.; writing—original draft, A.A.-M. and W.A.-R.; writing—review and editing, E.A. All authors have read and agreed to the published version of the manuscript.
Funding
This research received no external funding.
Institutional Review Board Statement
Not applicable.
Informed Consent Statement
Not applicable.
Data Availability Statement
The raw data supporting the conclusions of this article will be made available by the authors upon request.
Acknowledgments
The authors are grateful to Al-Balqa Applied University and Philadelphia University in Amman, Jordan, for all of the support provided for this research project.
Conflicts of Interest
The authors declare no conflicts of interest.
References
- Jaber, J.O. Future energy consumption and greenhouse gas emissions in Jordanian industries. Appl. Energy 2002, 71, 15–30. [Google Scholar] [CrossRef]
- Jordanian Department of Statistics. Available online: https://dosweb.dos.gov.jo/ (accessed on 11 August 2024).
- Ministry of Energy and Mineral Resources (MEMR). Available online: https://www.memr.gov.jo/EN/ListDetails/Projects/72/21 (accessed on 15 July 2024).
- International Energy Agency. Available online: https://www.iea.org/ (accessed on 10 July 2024).
- Awada, E.; Radwan, E.; Abed, S.; Al-Mahrouk, A. Economic Analysis and Design of Sustainable Solar Electric Vehicle Carport at Applied Science Private University in Jordan. Energies 2024, 17, 4321. [Google Scholar] [CrossRef]
- Jia, H.; Liang, L.; Xie, J.; Zhang, J. Environmental Effects of Technological Improvements in Polysilicon Photovoltaic Systems in China—A Life Cycle Assessment. Sustainability 2022, 14, 8670. [Google Scholar] [CrossRef]
- Mustafa, R.J.; Gomaa, M.R.; Al-Dhaifallah, M.; Rezk, H. Environmental Impacts on the Performance of Solar Photovoltaic Systems. Sustainability 2020, 12, 608. [Google Scholar] [CrossRef]
- Al-Refaie, A.; Lepkova, N.; Hadjistassou, C. Using System Dynamics to Examine Effects of Satisfaction with PV Systems, Advertising, and Competition on Energy Security and CO2 Emissions in Jordan. Sustainability 2023, 15, 14907. [Google Scholar] [CrossRef]
- Zhou, Y.; Pan, M.; Urban, F. Comparing the International Knowledge Flow of China’s Wind and Solar Photovoltaic (PV) Industries: Patent Analysis and Implications for Sustainable Development. Sustainability 2018, 10, 1883. [Google Scholar] [CrossRef]
- Asif, M. Urban Scale Application of Solar PV to Improve Sustainability in the Building and the Energy Sectors of KSA. Sustainability 2016, 8, 1127. [Google Scholar] [CrossRef]
- Gulkowski, S. Specific Yield Analysis of the Rooftop PV Systems Located in South-Eastern Poland. Energies 2022, 15, 3666. [Google Scholar] [CrossRef]
- Monna, S.; Abdallah, R.; Juaidi, A.; Albatayneh, A.; Zapata-Sierra, A.J.; Manzano-Agugliaro, F. Potential Electricity Production by Installing Photovoltaic Systems on the Rooftops of Residential Buildings in Jordan: An Approach to Climate Change Mitigation. Energies 2022, 15, 496. [Google Scholar] [CrossRef]
- Weckx, S.; D’Hulst, R.; Driesen, J. Locational Pricing to Mitigate Voltage Problems Caused by High PV Penetration. Energies 2015, 8, 4607–4628. [Google Scholar] [CrossRef]
- Shafiullah, M.; Ahmed, S.D.; Al-Sulaiman, F.A. Grid Integration Challenges and Solution Strategies for Solar PV Systems: A Review. IEEE Access 2022, 10, 52233–52257. [Google Scholar] [CrossRef]
- Salah, A.A.; Shalby, M.M.; Basim Ismail, F. The status and potential of renewable energy development in Jordan: Exploring challenges and opportunities. Sustain. Sci. Pract. Policy 2023, 19, 2212517. [Google Scholar] [CrossRef]
- Al-Shammari, S.; Ko, W.; Al Ammar, E.A.; Alotaibi, M.A.; Choi, H.-J. Optimal Decision-Making in Photovoltaic System Selection in Saudi Arabia. Energies 2021, 14, 357. [Google Scholar] [CrossRef]
- Bouaouda, A.; Afdel, K.; Abounacer, R. Unveiling Genetic Reinforcement Learning (GRLA) and Hybrid Attention-Enhanced Gated Recurrent Unit with Random Forest (HAGRU-RF) for Energy-Efficient Containerized Data Centers Empowered by Solar Energy and AI. Sustainability 2024, 16, 4438. [Google Scholar] [CrossRef]
- Cacciuttolo, C.; Guardia, X.; Villicaña, E. Implementation of Renewable Energy from Solar Photovoltaic (PV) Facilities in Peru: A Promising Sustainable Future. Sustainability 2024, 16, 4388. [Google Scholar] [CrossRef]
- KAWARENERGY. Available online: http://kawarenergy.com/ (accessed on 12 June 2024).
- Shatnawi, N.; Abu-Qdais, H.; Abu Qdais, F. Selecting renewable energy options: An application of multi-criteria decision making for Jordan. Sustain. Sci. Pract. Policy 2021, 17, 209–219. [Google Scholar] [CrossRef]
- Abu Qadourah, J. Energy and economic potential for photovoltaic systems installed on the rooftop of apartment buildings in Jordan. Results Eng. 2022, 16, 100642. [Google Scholar] [CrossRef]
- Saraswathi, K. A Review Paper on Electricity Generation from Solar Energy. Int. J. Sci. Dev. Res. 2020, 5, 279–284. [Google Scholar]
- Güney, T. Solar energy, governance and CO2 emissions. Renew. Energy 2022, 184, 791–798. [Google Scholar] [CrossRef]
- Ahsan Kabir, M.; Farjana, F.; Choudhury, R.; Imrul Kayes, A.; Sawkat Ali, M.; Farrok, O. Net-metering and Feed-in-Tariff policies for the optimum billing scheme for future industrial PV systems in Bangladesh. Alex. Eng. J. 2023, 63, 157–174. [Google Scholar] [CrossRef]
- Chakraborty, S.; Sadhu, P.K.; Pal, N. New location selection criterions for solar PV power plant. Int. J. Renew. Energy Res. 2014, 4, 1020–1030. [Google Scholar]
- Budin, L.; Grdenić, G.; Delimar, M. A quadratically constrained optimization problem for determining the optimal nominal power of a pv system in net-metering model: A case study for Croatia. Energies 2021, 14, 1746. [Google Scholar] [CrossRef]
- Sun, Y.; Venugopal, V.; Brandt, A.R. Short-term solar power forecast with deep learning: Exploring optimal input and output configuration. Sol. Energy 2019, 188, 730–741. [Google Scholar] [CrossRef]
- Luz, G.P.; Brito, M.C.; Sousa, J.M.C.; Vieira, S.M. Coordinating shiftable loads for collective photovoltaic self-consumption: A multi-agent approach. Energy 2021, 229, 120573. [Google Scholar] [CrossRef]
- Gjorgievski, V.Z.; Cundeva, S.; Markovska, N.; Georghiou, G.E. Virtual net-billing: A fair energy sharing method for collective self-consumption. Energy 2022, 254, 124246. [Google Scholar] [CrossRef]
- Reis, I.F.G.; Gonçalves, I.; Lopes, M.A.R.; Antunes, C.H. Collective self-consumption in multi-tenancy buildings–To what extent do consumers’ goals influence the energy system’s performance? Sustain. Cities Soc. 2022, 80, 103688. [Google Scholar] [CrossRef]
- Elmitwally, A. A new algorithm for allocating multiple distributed generation units based on load centroid concept. Alex. Eng. J. 2013, 52, 655–663. [Google Scholar] [CrossRef]
- Mahmoud, K.; Yorino, N.; Ahmed, A. Optimal Distributed Generation Allocation in Distribution Systems for Loss Minimization. IEEE Trans. Power Syst. 2016, 31, 960–969. [Google Scholar] [CrossRef]
- Holloway, R.; Ho, D.; Delotavo, C.; Xie, W.Y.; Rahimi, I.; Nikoo, M.R.; Gandomi, A.H. Optimal location selection for a distributed hybrid renewable energy system in rural Western Australia: A data mining approach. Energy Strateg. Rev. 2023, 50, 101205. [Google Scholar] [CrossRef]
- Kamel, S.; Abdel-Mawgoud, H.; Hashim, F.A.; Bouaouda, A.; Dominguez-Garcia, J.L. Achieving Optimal PV Allocation in Distribution Networks Using a Modified Reptile Search Algorithm. IEEE Access 2024, 12, 42651–42666. [Google Scholar] [CrossRef]
- Adewuyi, O.B.; Adeagbo, A.P.; Adebayo, I.G.; Howlader, H.O.R.; Sun, Y. Modified analytical approach for pv-dgs integration into a radial distribution network considering loss sensitivity and voltage stability. Energies 2021, 14, 7775. [Google Scholar] [CrossRef]
- Abu Dyak, A.T.; Abu-Lehyeh, E.O.; Kiwan, S. Assessment of implementing Jordan’s renewable energy plan on the electricity grid. Jordan J. Mech. Ind. Eng. 2017, 11, 113–119. [Google Scholar]
- Electric Distribution Utilities of Jordan—Launch Partnership Program with USEA. Available online: https://usea.org/sites/default/files/page_files/Article_Jordan_Dist_EEV_May_2009.pdf (accessed on 16 June 2024).
- National Electric Power Company, Annual Report. 2022. Available online: https://www.nepco.com.jo/store/DOCS/web/2022_EN.pdf (accessed on 28 May 2024).
- Sunshine & Daylight Hours in Amman, Jordan. Available online: https://www.climate.top/jordan/amman/sunlight/ (accessed on 16 July 2024).
- Božiková, M.; Bilčík, M.; Madola, V.; Szabóová, T.; Kubík, Ľ.; Lendelová, J.; Cviklovič, V. The Effect of Azimuth and Tilt Angle Changes on the Energy Balance of Photovoltaic System Installed in the Southern Slovakia Region. Appl. Sci. 2021, 11, 8998. [Google Scholar] [CrossRef]
- NASA Power/DAV. Available online: https://power.larc.nasa.gov/data-access-viewer/ (accessed on 20 July 2024).
- AlShamaileh, E.; Moosa, I.S.; Al-Fayyad, H.; Lahlouh, B.; Kazem, H.A.; Abu-Afifeh, Q.; Al-Saqarat, B.S.; Esaifan, M.; Hamadneh, I. Performance Comparison and Light Reflectance of Al, Cu, and Fe Metals in Direct Contact Flat Solar Heating Systems. Energies 2022, 15, 8888. [Google Scholar] [CrossRef]
- Jordan Meteorological Department. Available online: http://jmd.gov.jo/en/Climate1/Details/3 (accessed on 2 August 2024).


Disclaimer/Publisher’s Note: The statements, opinions and data contained in all publications are solely those of the individual author(s) and contributor(s) and not of MDPI and/or the editor(s). MDPI and/or the editor(s) disclaim responsibility for any injury to people or property resulting from any ideas, methods, instructions or products referred to in the content. |
© 2024 by the authors. Licensee MDPI, Basel, Switzerland. This article is an open access article distributed under the terms and conditions of the Creative Commons Attribution (CC BY) license (https://creativecommons.org/licenses/by/4.0/).