
Digital Twin-Based Hydrogen Refueling Station (HRS) Safety Model: CNN-Based Decision-Making and 3D Simulation


Abstract
1. Introduction
1.1. Sensor Data Analysis and Real-Time Monitoring
- Various sensors at hydrogen refueling stations monitor the operational conditions, hydrogen, and surrounding environment of the station. AI analyzes these data in real-time to evaluate normal operations and detect abnormal conditions.
- For example, AI systems can analyze data, such as detected hydrogen leaks, high-pressure valve anomalies, and abnormal temperatures, to determine risk situations in real time.
1.2. Data-Driven Risk Prediction and Prevention
- AI models based on historical data can predict the risk factors that may arise during the operation of hydrogen refueling stations. For example, they can identify potential risks that may occur under specific weather conditions or usage patterns and suggest preventive measures in advance.
1.3. Safety Evaluation Through Simulation and Virtual Experimentation
- Simulations using digital twins can be used to test the operation of refueling stations under various scenarios. AI can analyze the results of these simulations to predict potential risks that may occur during actual operations and evaluate safety.
1.4. Emergency Response and Decision Support
- In the event of an accident or emergency, AI systems can quickly analyze data to support an immediate response. For example, if a leak occurs, AI can recommend appropriate response strategies by comprehensively considering the sensor data, environmental conditions, and surrounding situations.
2. Related Studies
2.1. Safety Guideline Research
2.2. Traditional Methods for HRS Safety Systems
2.3. AI-Based HRS Safety Systems
2.4. Digital Twin-Based HRS Safety Systems
2.5. Current Technology Issues and Solutions
3. System Overview
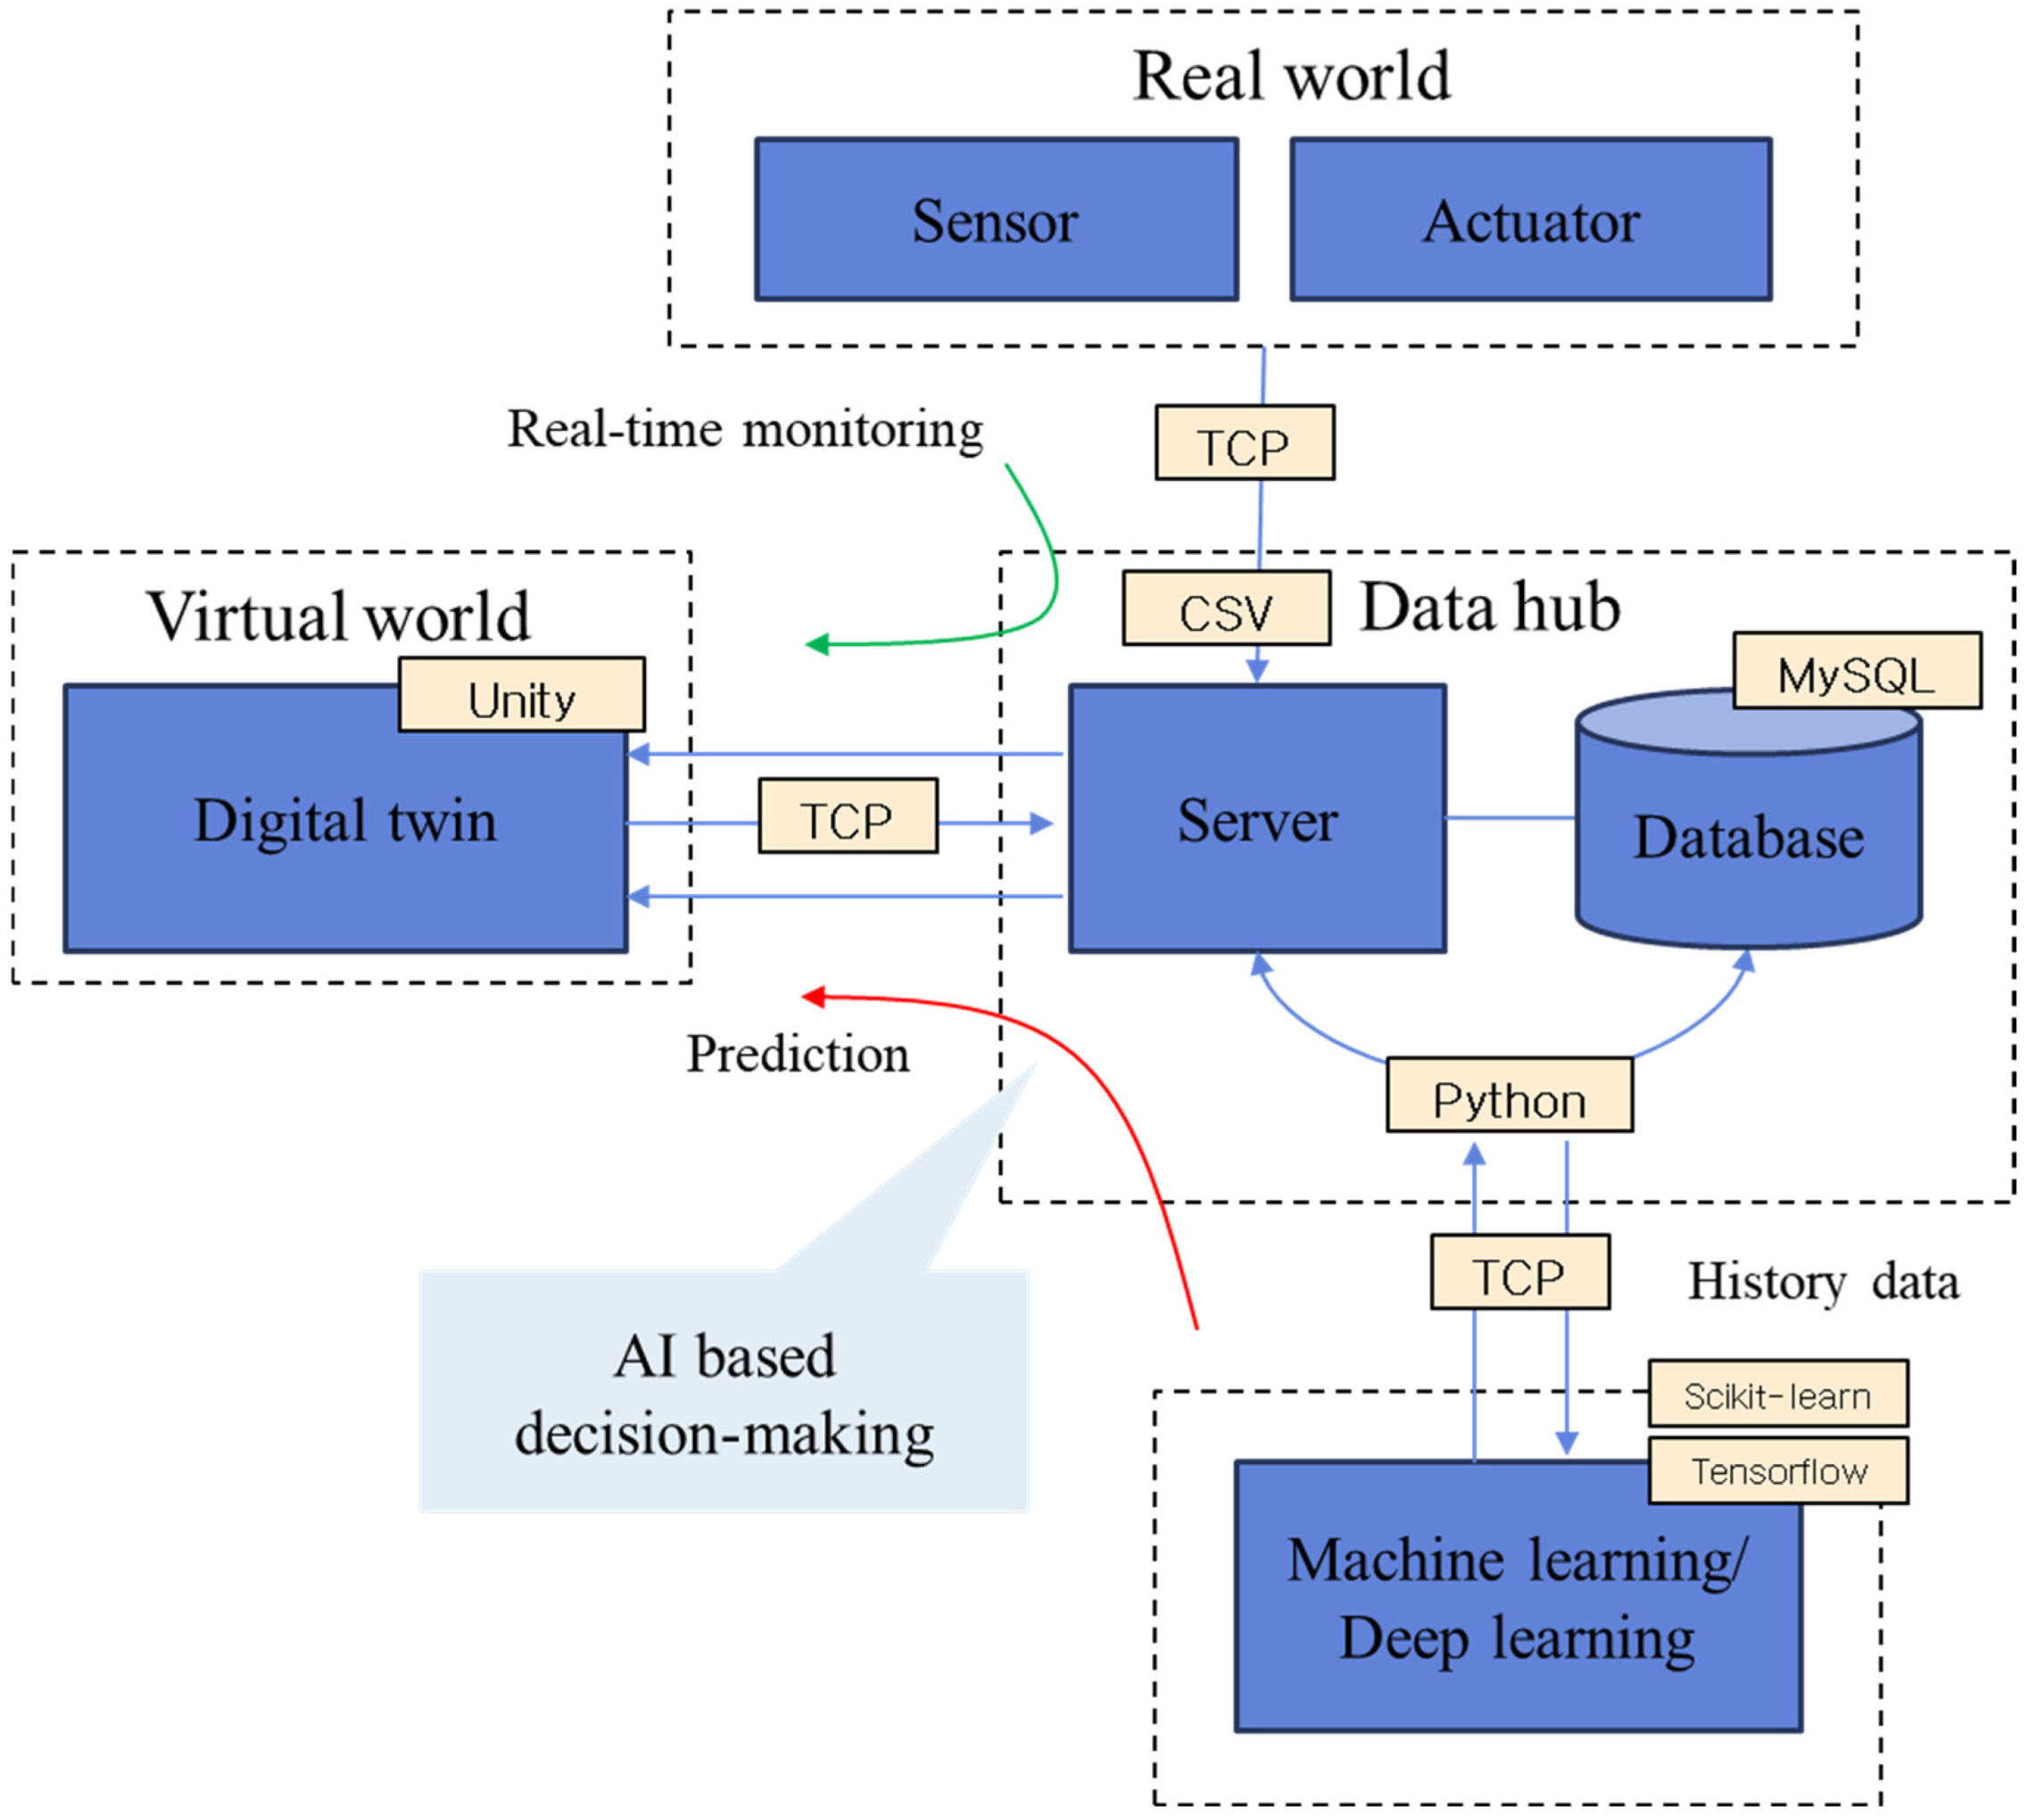
3.1. System Architecture
- Real World: The concept of the real world contrasts with the virtual or digital world, referring to the physical reality we experience and perceive in our daily lives. It includes all the elements that exist in the physical environment, such as objects, events, and interactions [23]. The real world possesses characteristics such as complexity and uncertainty, providing various challenges and opportunities for research and application. It is often difficult to conduct real-world experiments in controlled environments, making it a tool to provide practical solutions to real-world problems by training AI models using collected data [24,25].
- Virtual World: The virtual world refers to a digital environment created using computer technology and networks that offer a virtual space where users can interact. The virtual world possesses characteristics distinct from physical reality and is designed to provide an immersive experience for users [26]. It is used for various purposes and is created through digital technologies such as computer graphics, software algorithms, and databases. It operates according to programmed rules and logic [27]. This allows multiple users to connect and interact simultaneously, providing the functionality for users to create and share content directly. Digital twin technologies fall under this category [28].
- Cyber-Physical System (CPS): A CPS is a system in which computer-based algorithms closely interact with physical processes by integrating sensors, actuators, networks, and software, enabling seamless interaction between the physical and digital worlds. The main purpose of a CPS is to monitor and control the physical environment in real-time, providing high levels of autonomy and adaptability in various applications. CPSs are implemented by collecting and analyzing data and generating appropriate control commands [29]. They are utilized in fields such as smart grids and smart homes, providing innovative solutions [30] through the convergence of physical environments and digital technologies [31,32].
- Data Hub (Smart Hydrogen Safety System Server): A data hub is a centralized platform that integrates and manages data from various sources, storing, processing, and analyzing data to provide users with necessary information. The Smart Hydrogen Safety System Server is a specialized data hub [33] designed for the safe production, storage, distribution, and use of hydrogen energy sources. This system is a key component of hydrogen safety monitoring and management systems [34]. It ensures the safety of hydrogen-related facilities and infrastructure through real-time data collection and analysis, aiming to improve accident prevention and response capabilities [35].
- AI Training: AI training involves teaching an AI model to perform specific tasks using the given data and algorithms, enabling computers to recognize patterns and make predictions. It utilizes machine learning (ML) and deep learning technologies, acting as a key element in solving complex problems in various industries and research fields. The process involves data collection, preprocessing, model selection, training, evaluation, and deployment, with each stage significantly affecting the performance and accuracy of AI systems. The performance of an AI model relies heavily on the quality and quantity of training data, making it essential to secure high-quality, large-scale datasets, to remove noise through data preprocessing, normalize features, and ensure data diversity [36,37,38].
- Data Analytics: Data analytics involves organizing and interpreting data collected from various sources to derive meaningful insights. It includes stages such as data collection, preprocessing, analysis, visualization, and interpretation, and is used for multiple purposes, including decision support, problem-solving, and predictive model development. Types of data analytics include descriptive, diagnostic, predictive, and prescriptive analytics, which use methods such as statistical analysis and machine learning [39].
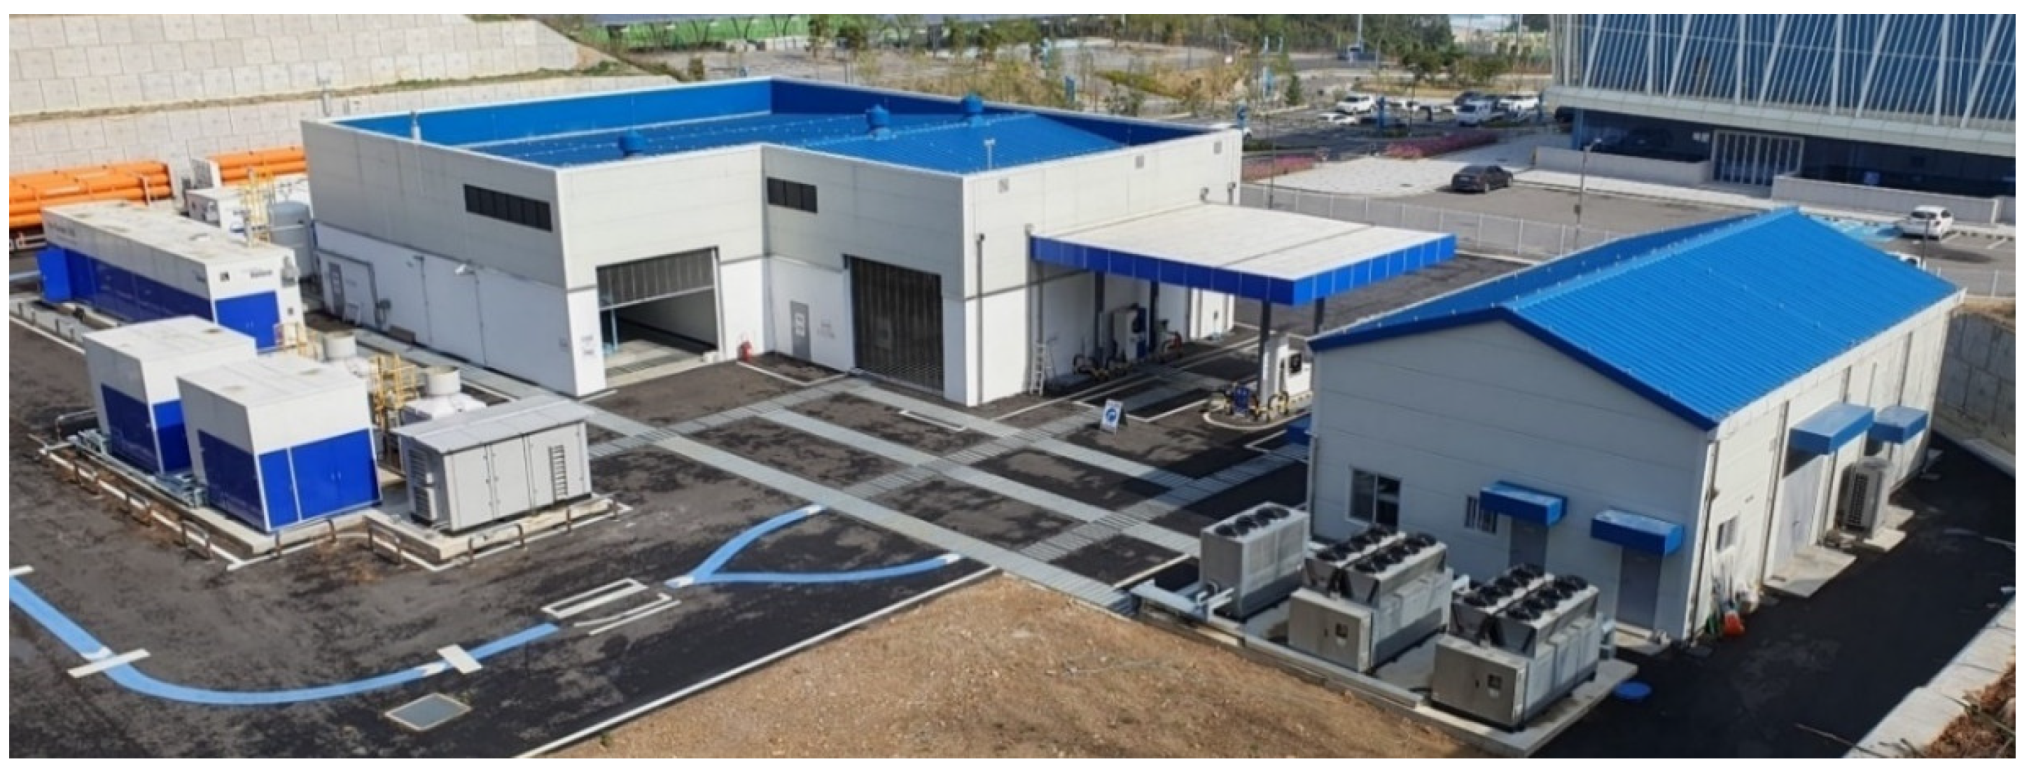
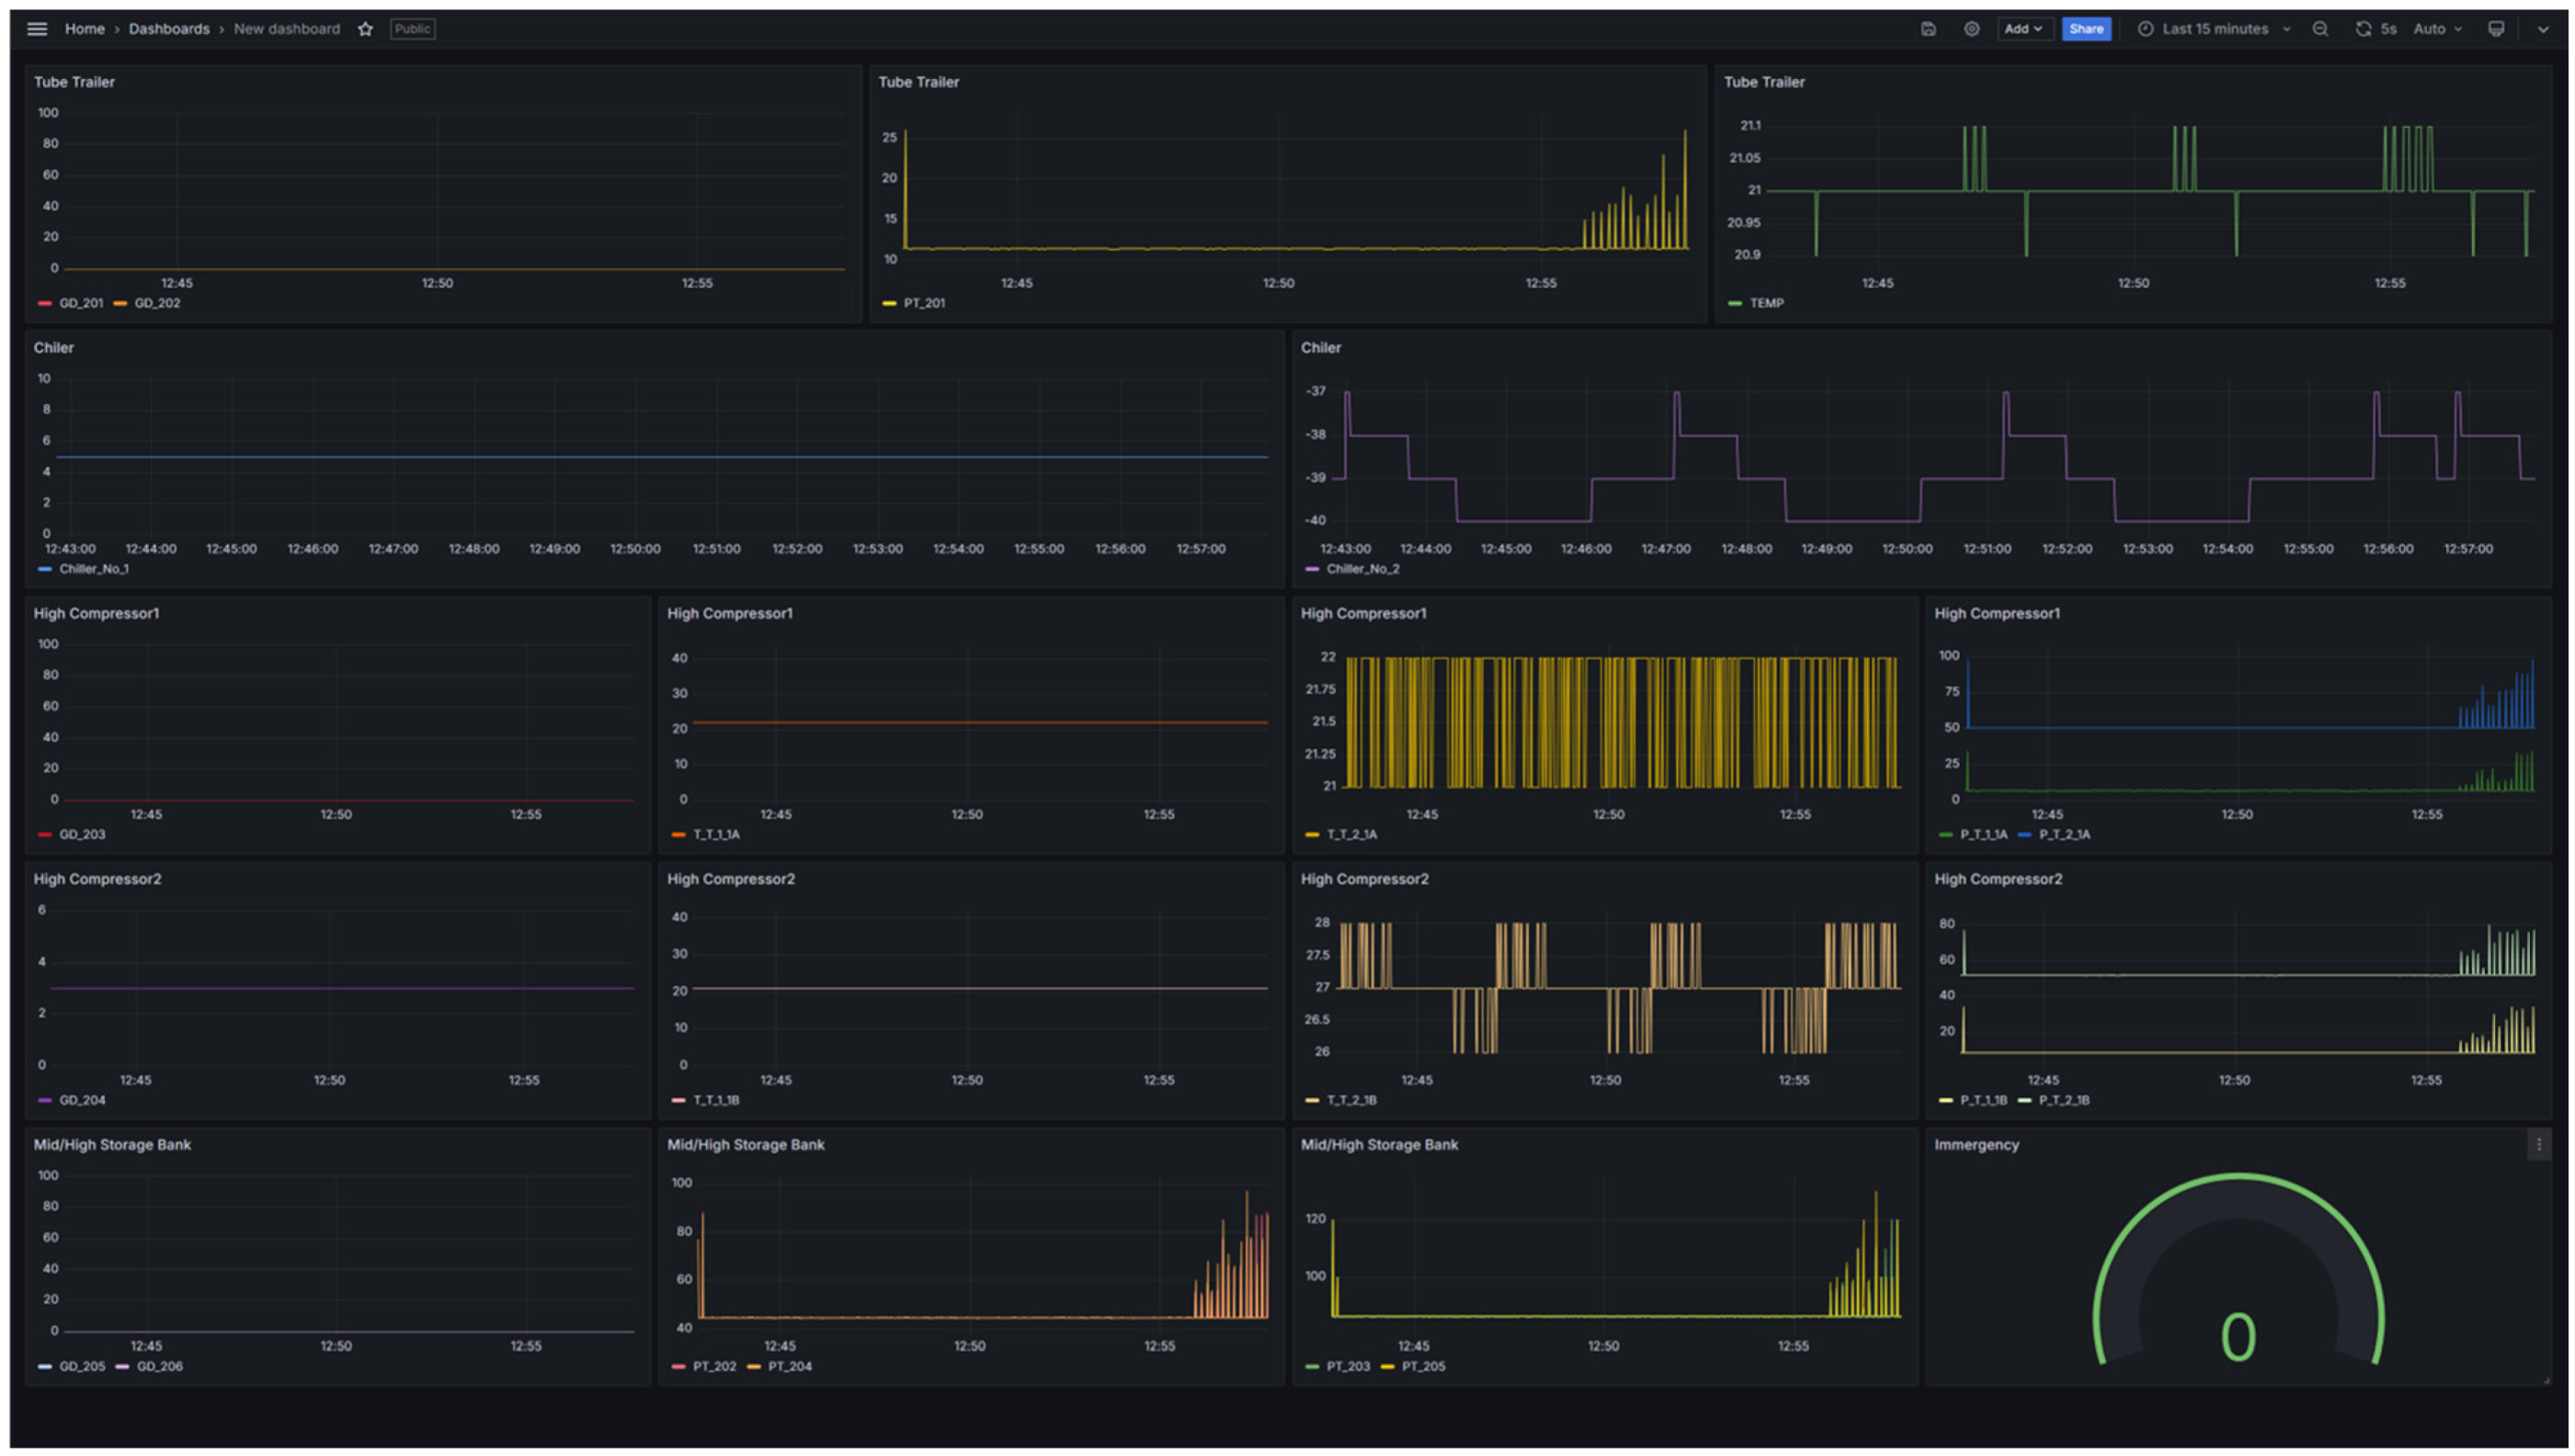
3.2. Status of Hydrogen Refueling Stations
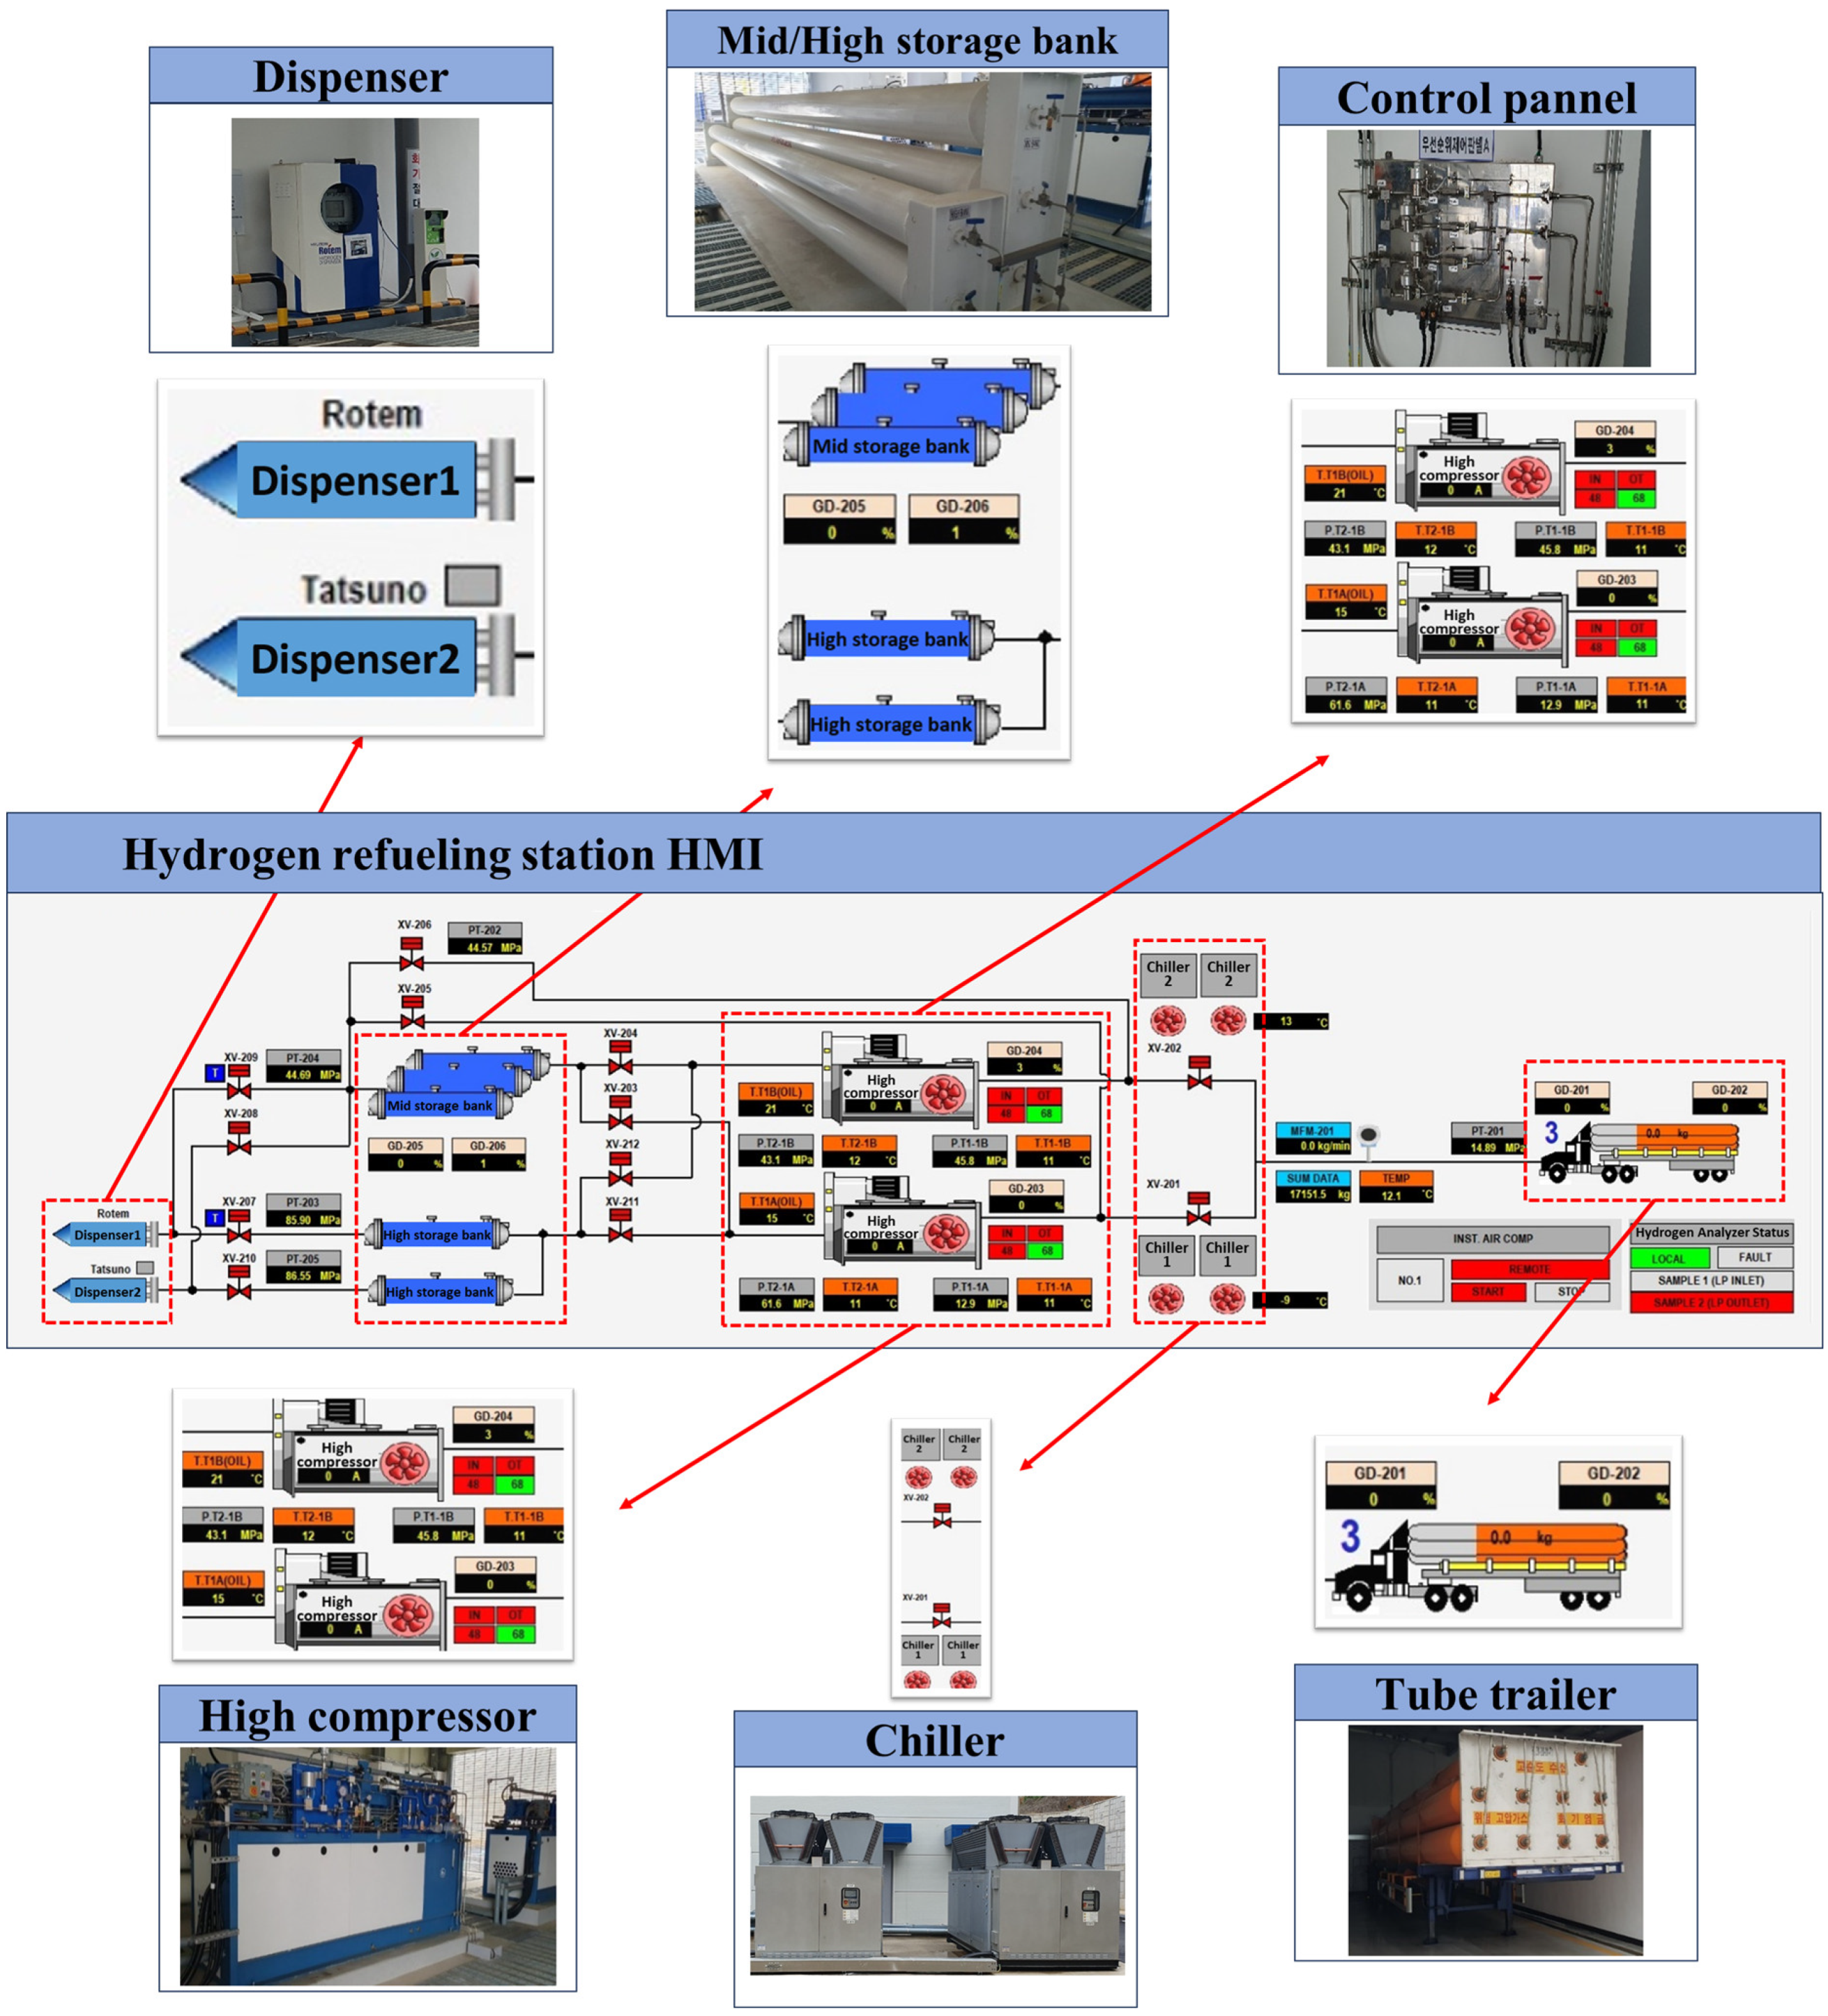
- Tube trailer: A mobile trailer for transporting hydrogen equipped with multiple tube-shaped containers that store high-pressure hydrogen. It is used to transport hydrogen from production facilities to refueling stations. Upon arrival, high-pressure hydrogen is transferred to storage tanks within the station. The pressure can typically reach 200–500 bar, and it is one of the primary hydrogen supply sources for refueling stations.
- Chiller: A cooling device used to control the temperature increase during hydrogen refueling. When hydrogen is compressed to high pressure or refueled, heat is generated. If the temperature of hydrogen is excessively high, safety issues can arise. A chiller is used to maintain a constant temperature for hydrogen prevention.
- High compressor: A device that compresses hydrogen to high pressure for storage in station tanks or for supplying hydrogen to vehicles. It typically compresses hydrogen to pressures above 700 bar, generating the high pressure required for rapid refueling of vehicles. This ensures the rapid and safe injection of hydrogen into the fuel tanks of hydrogen vehicles.
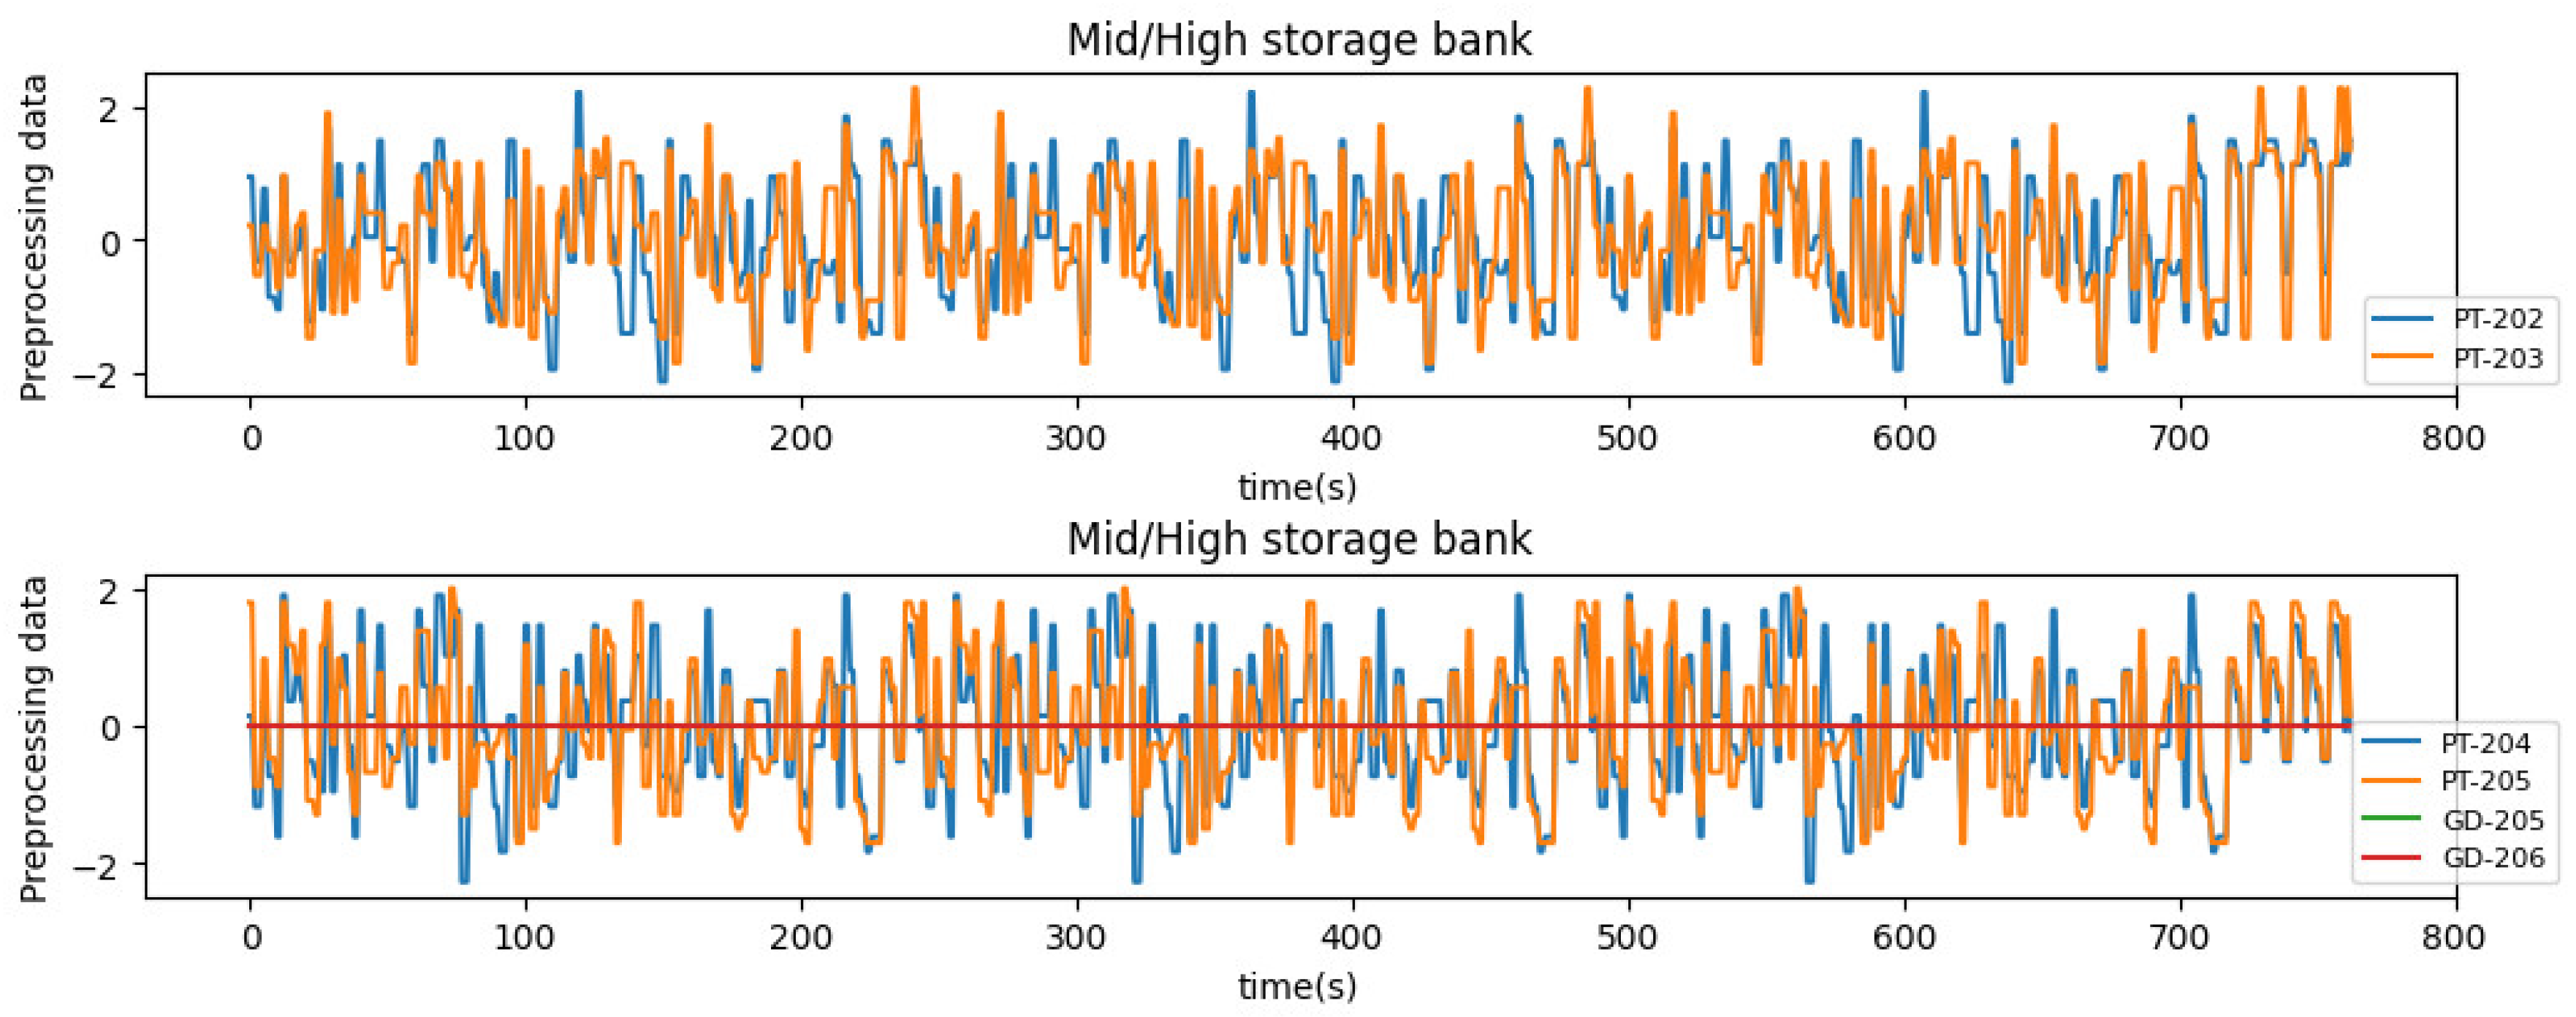
- Mid/high storage bank: A tank system for storing hydrogen at medium or high pressures. At the refueling station, hydrogen is stored at various pressure levels to supply vehicles at the appropriate pressure as needed. The mid-storage bank typically maintains a pressure of approximately 350 bar, whereas the high-storage bank maintains pressures above 700 bar, allowing for hydrogen refueling of various types of vehicles.
- Dispenser: A device for directly injecting hydrogen into vehicles. It functions similarly to a gas pump at a fuel station, where the driver connects the dispenser to the fuel tank of the vehicle to inject hydrogen. The dispenser precisely controls the flow rate and pressure of hydrogen, ensuring safety of the refueling process. It also displays necessary data to the user during refueling.
- Hydrogen charging station HMI: An interface for monitoring and controlling the operation of a hydrogen refueling station. The HMI allows the station operator to check the status of the hydrogen refueling station in real time, control the refueling process, and respond immediately to any issues. Through the HMI, key data such as the refueling process, pressure, and temperature can be monitored, and parameters can be adjusted as needed. This is a crucial element that enables interactions between the user and system.
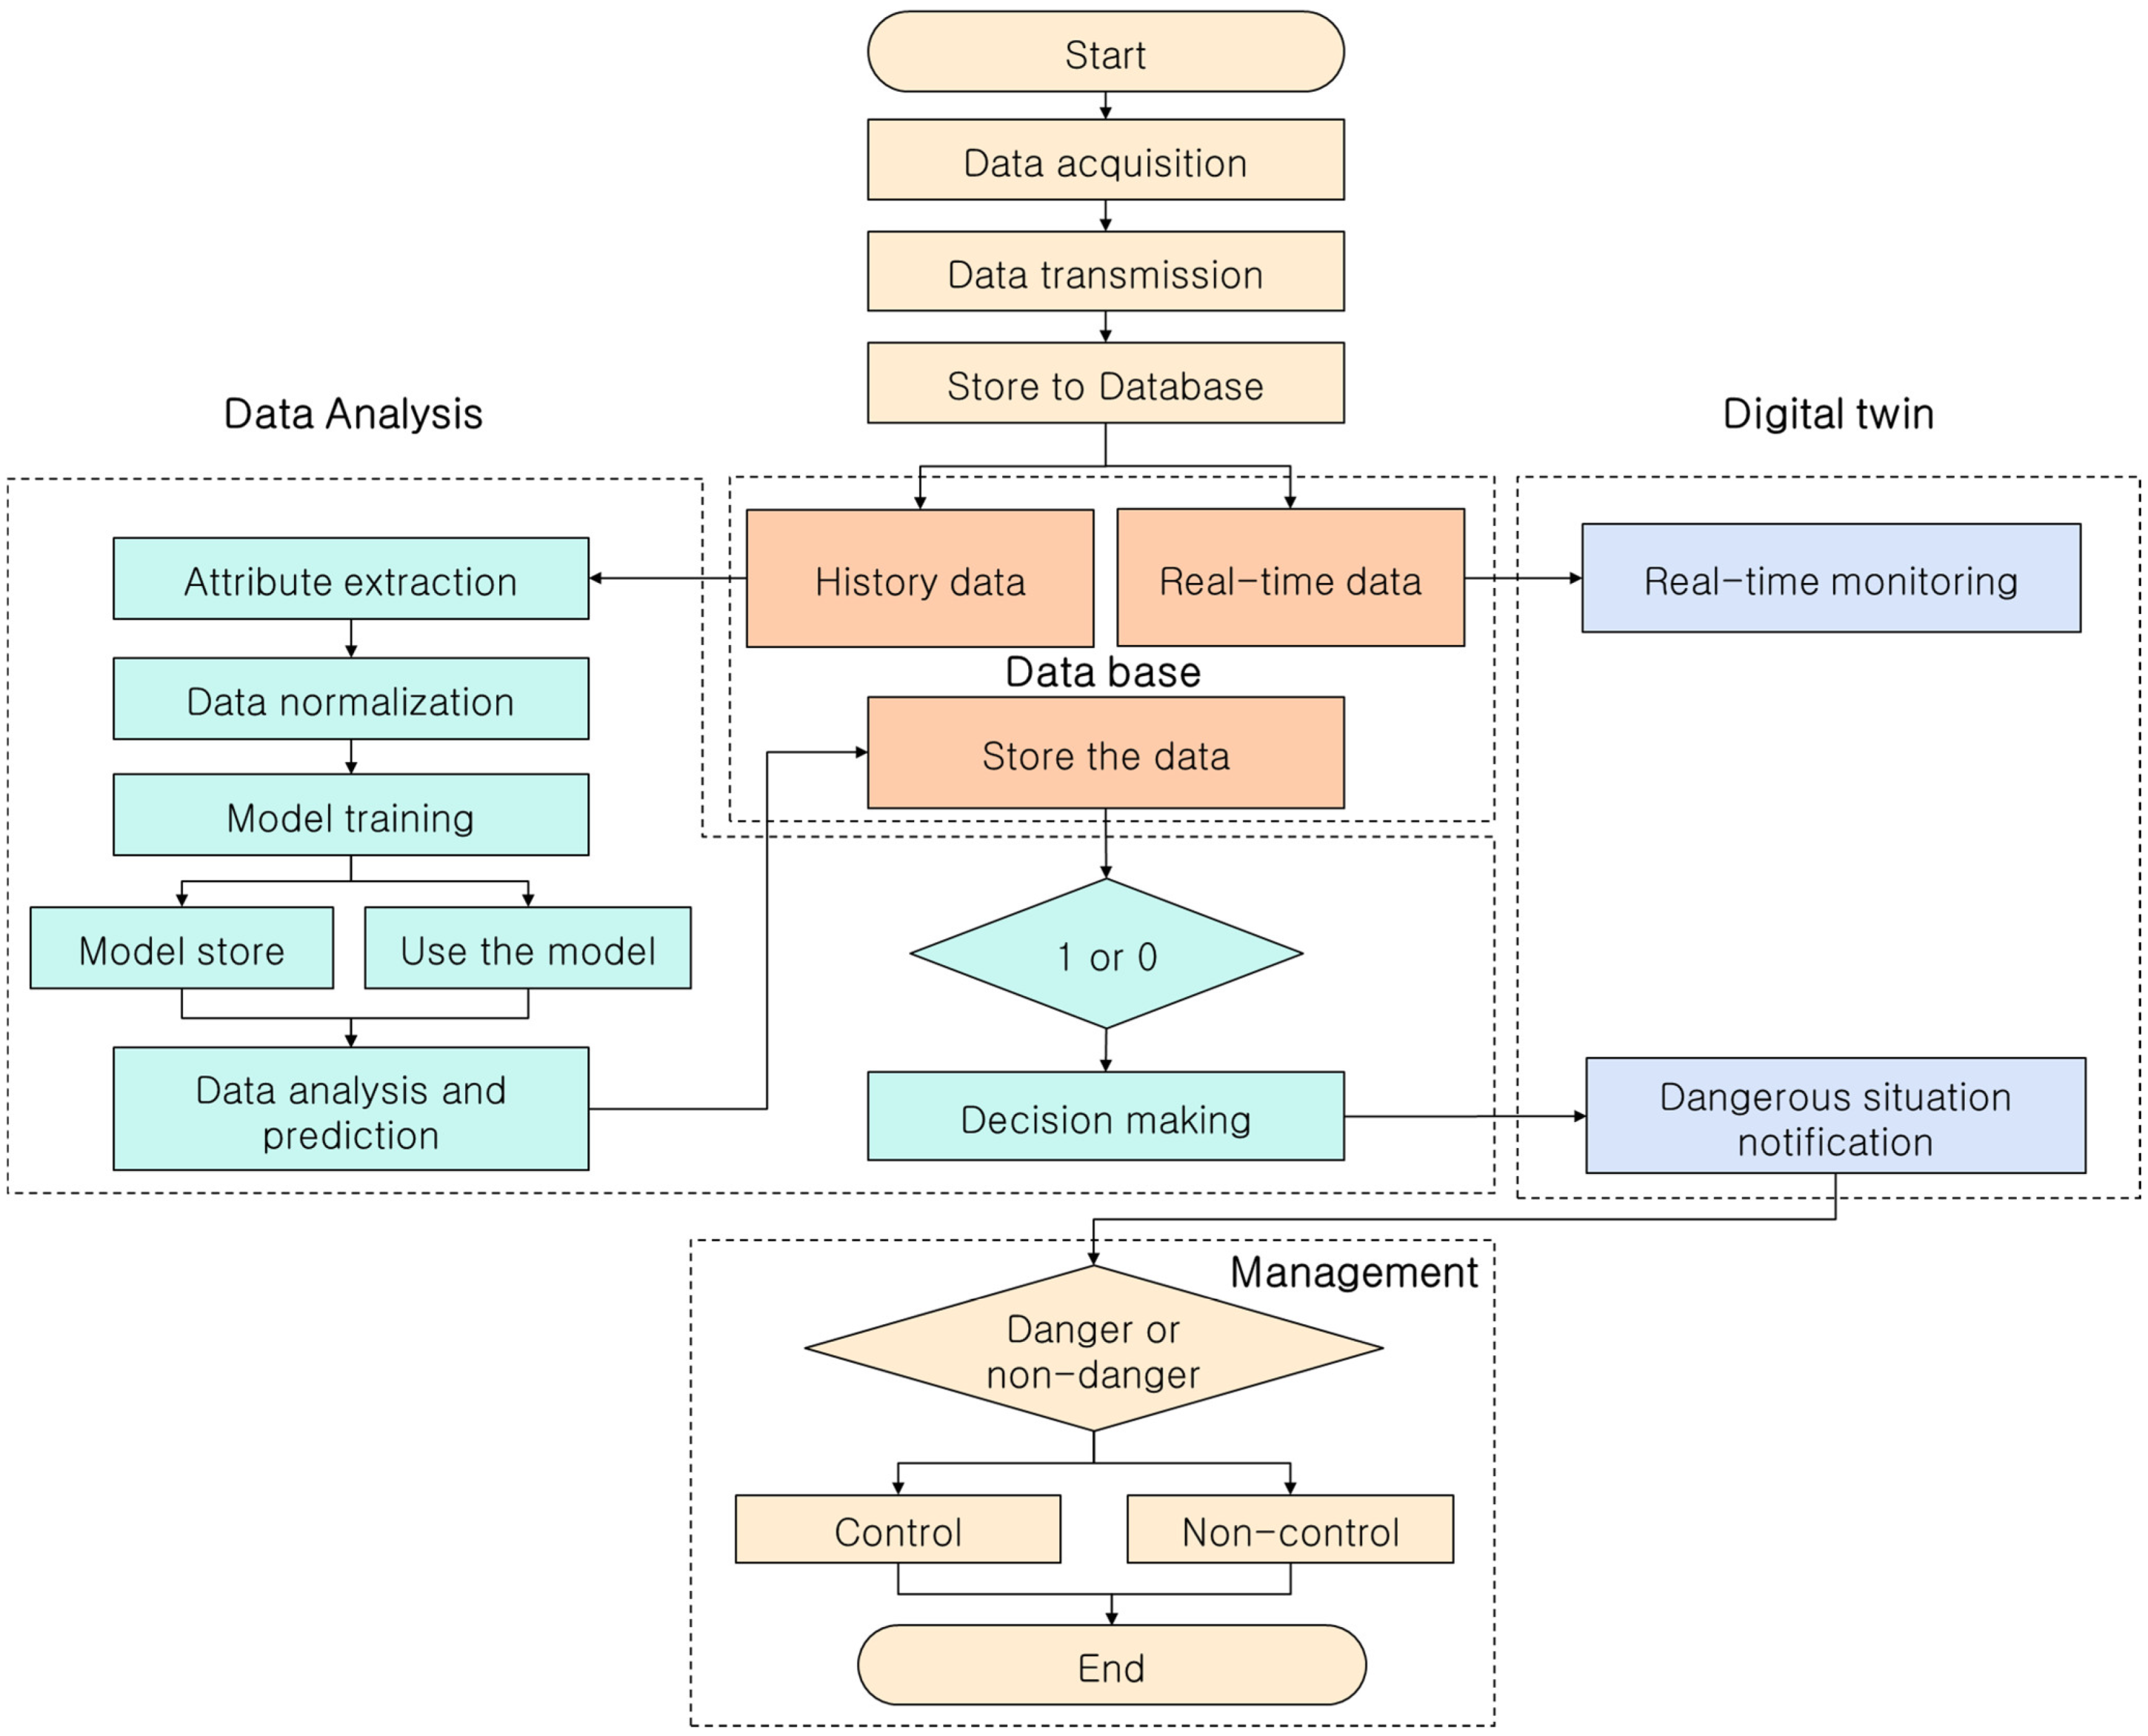
3.3. Overall System Operation Flowchart
4. Data Analysis Model
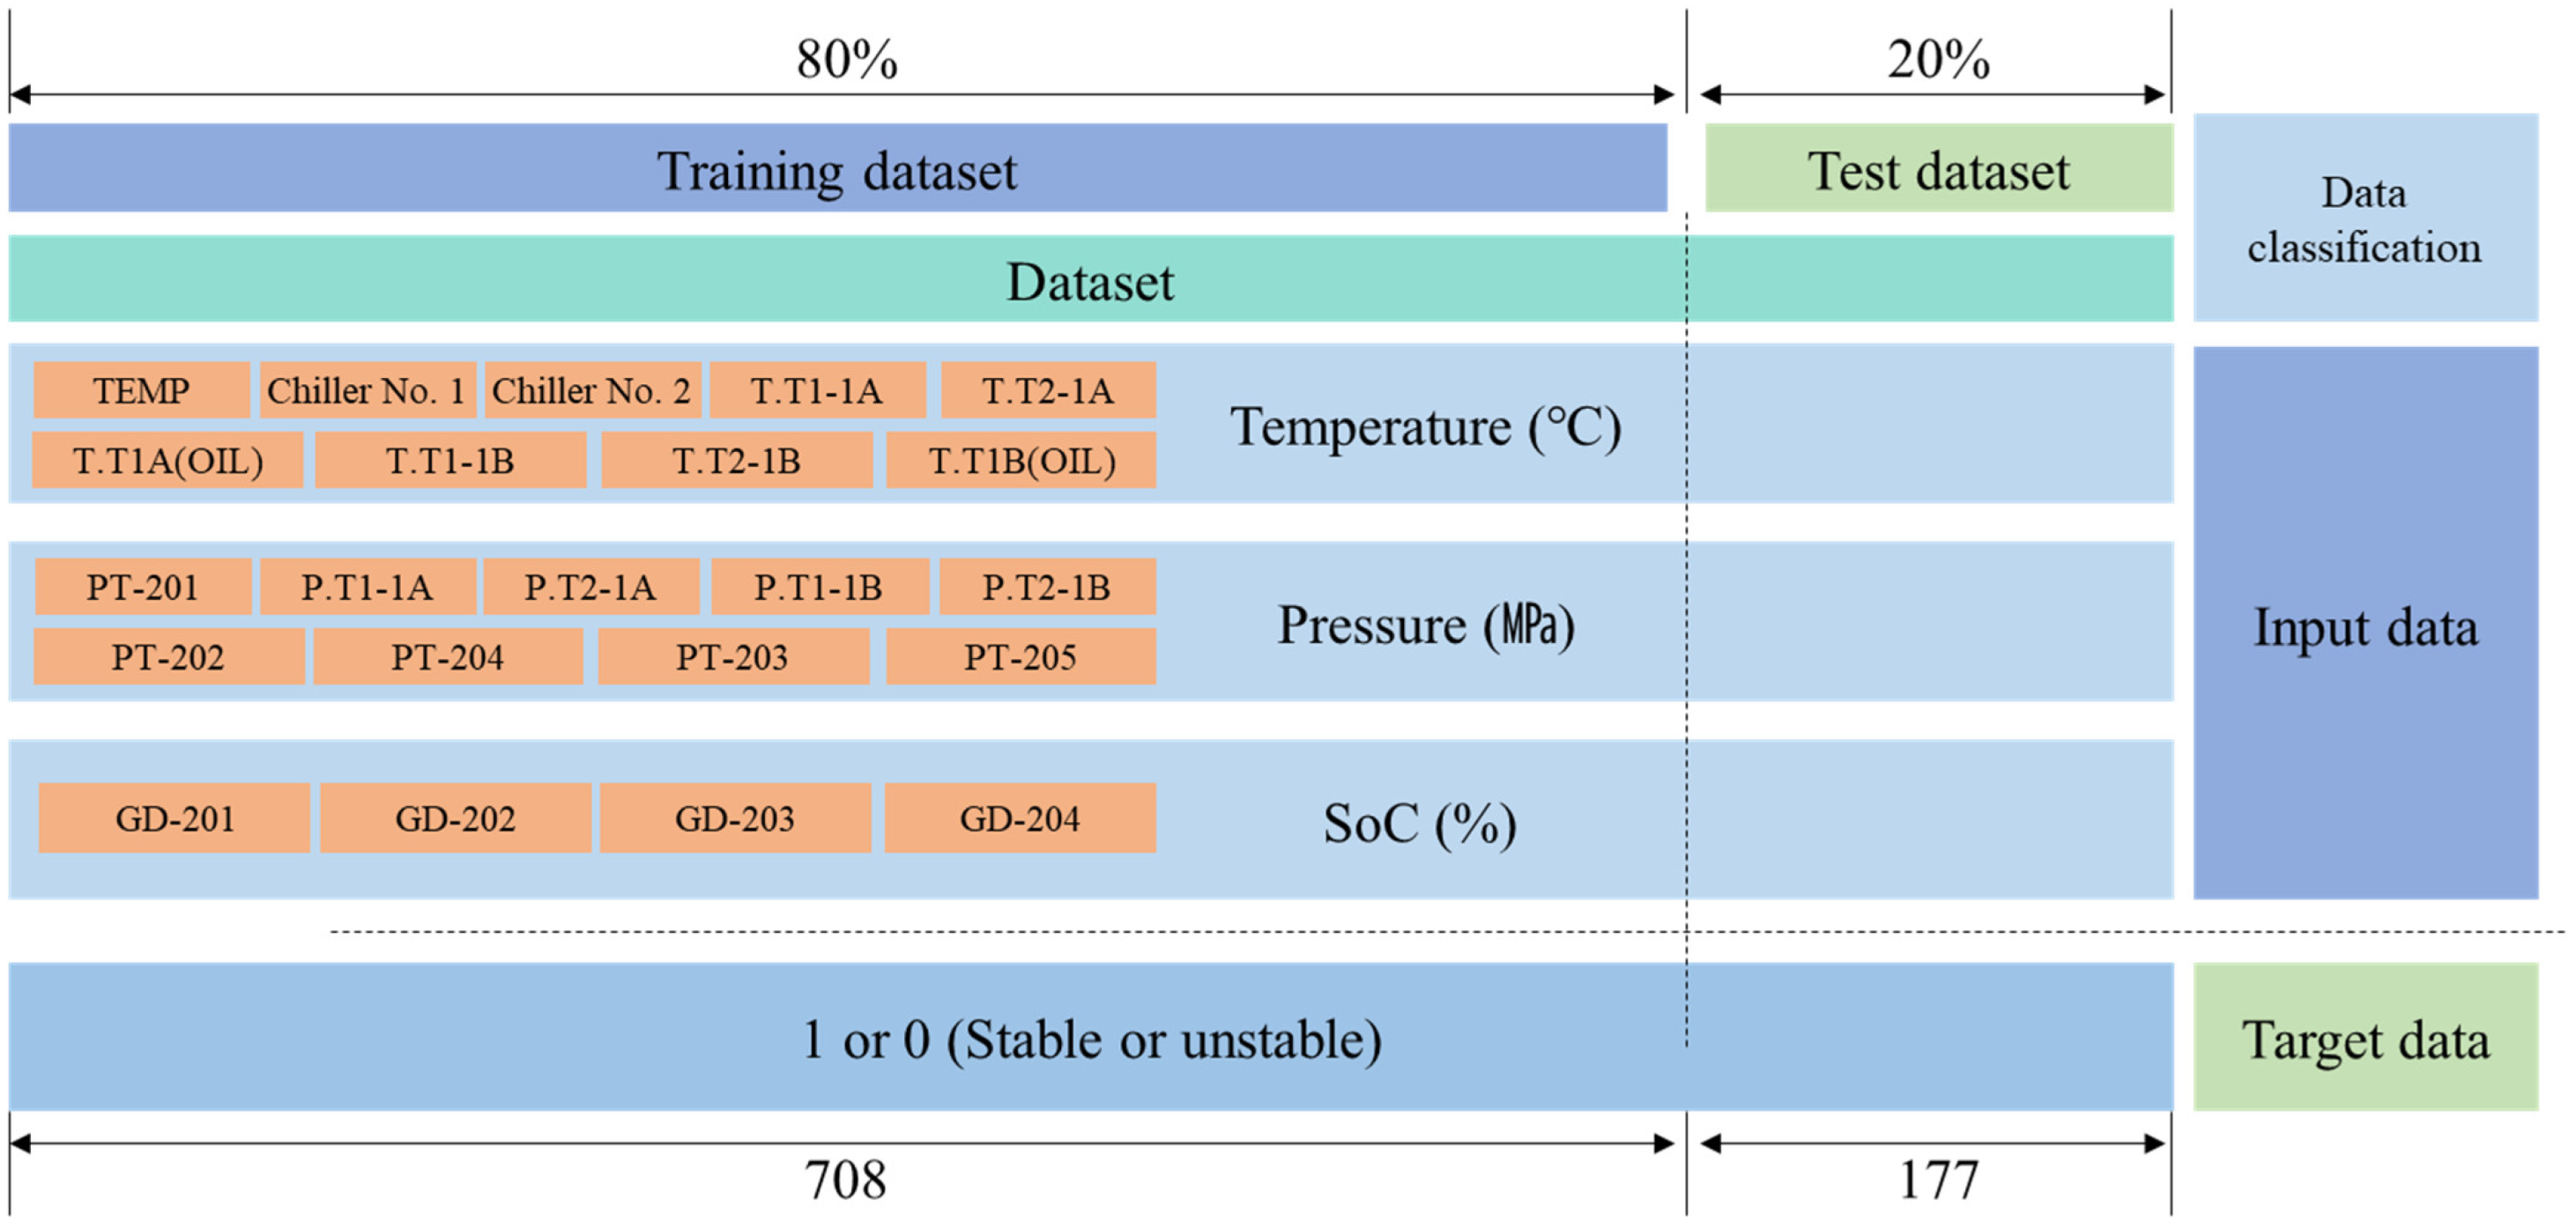
4.1. Data Collection
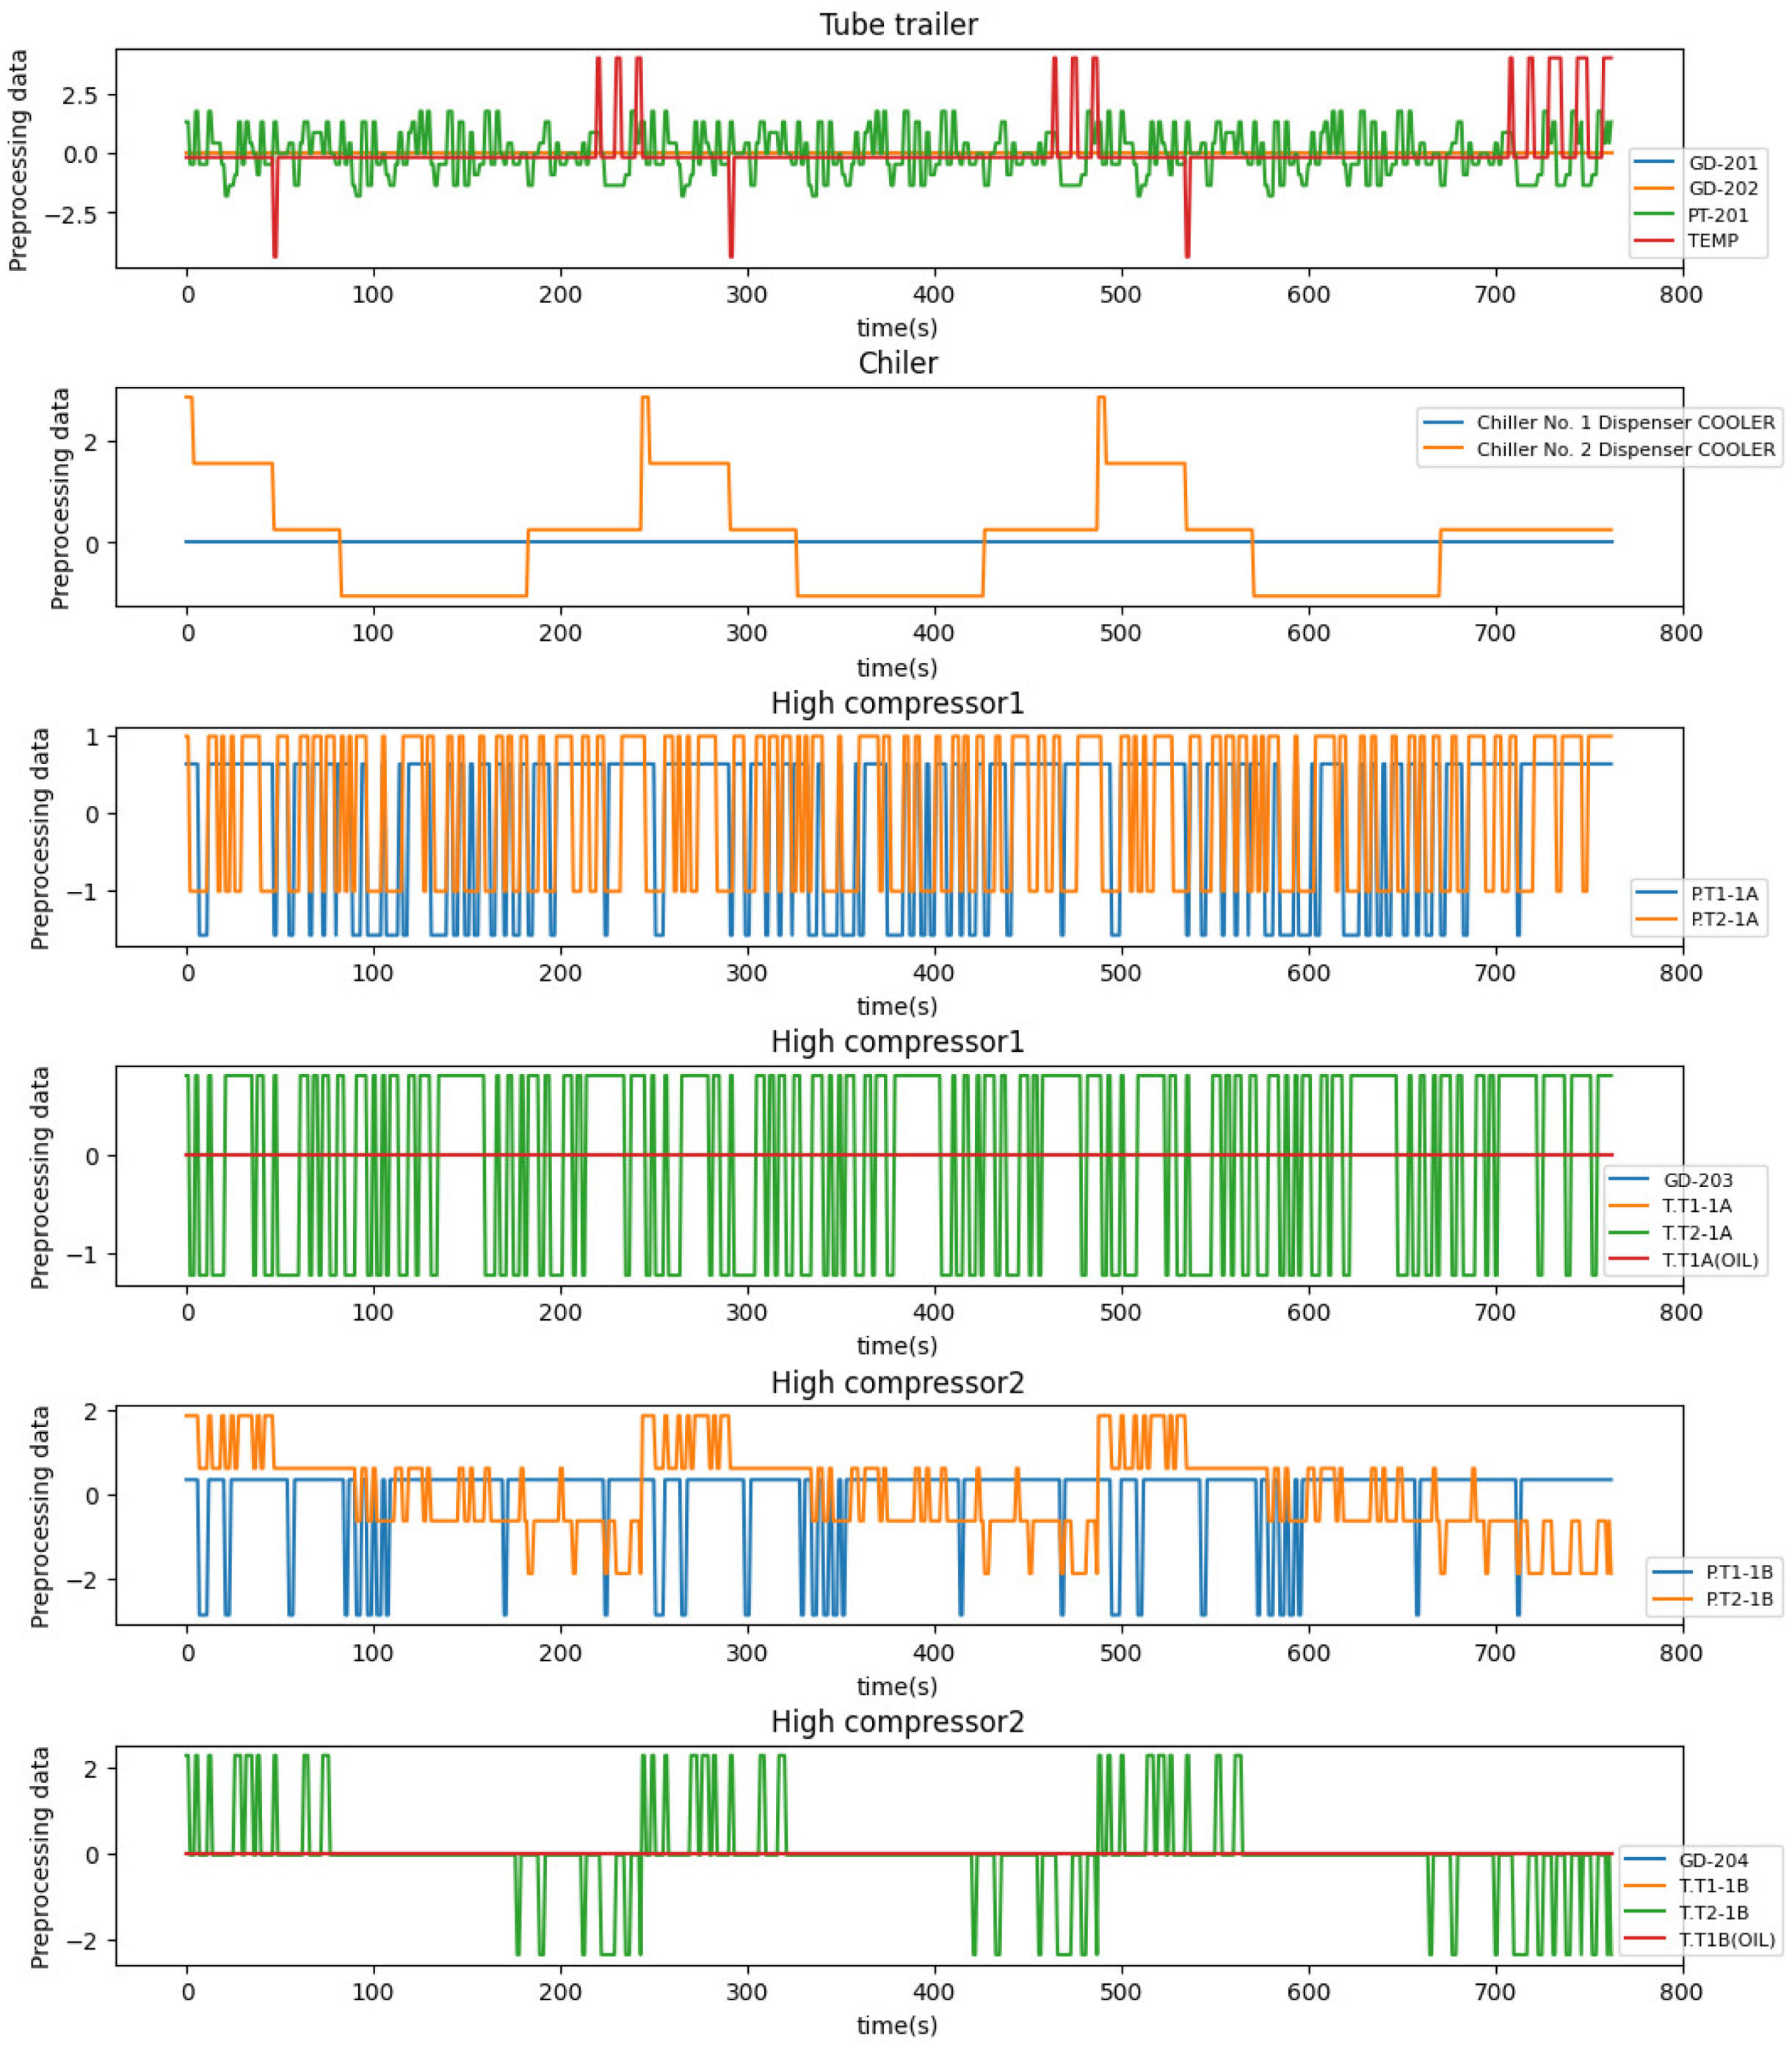
4.2. Data Preprocessing
- MinMaxScaler: A normalization method that assigns values uniformly within the 0–1 range based on the minimum and maximum values of each feature.
- StandardScaler: A method that normalizes the data by setting the mean of each feature column to zero and a standard deviation of 1.
4.3. Data Analysis Algorithms
4.3.1. Machine Learning Models
- KNN (K-nearest neighbor):
- Logistic regression:
- Decision tree classifier:
- Random forest classifier:
- Extra trees classifier:
- Gradient boosting classifier:
- Hist-gradient boosting classifier:
4.3.2. Deep Learning Models
- DNN (Deep neural network):
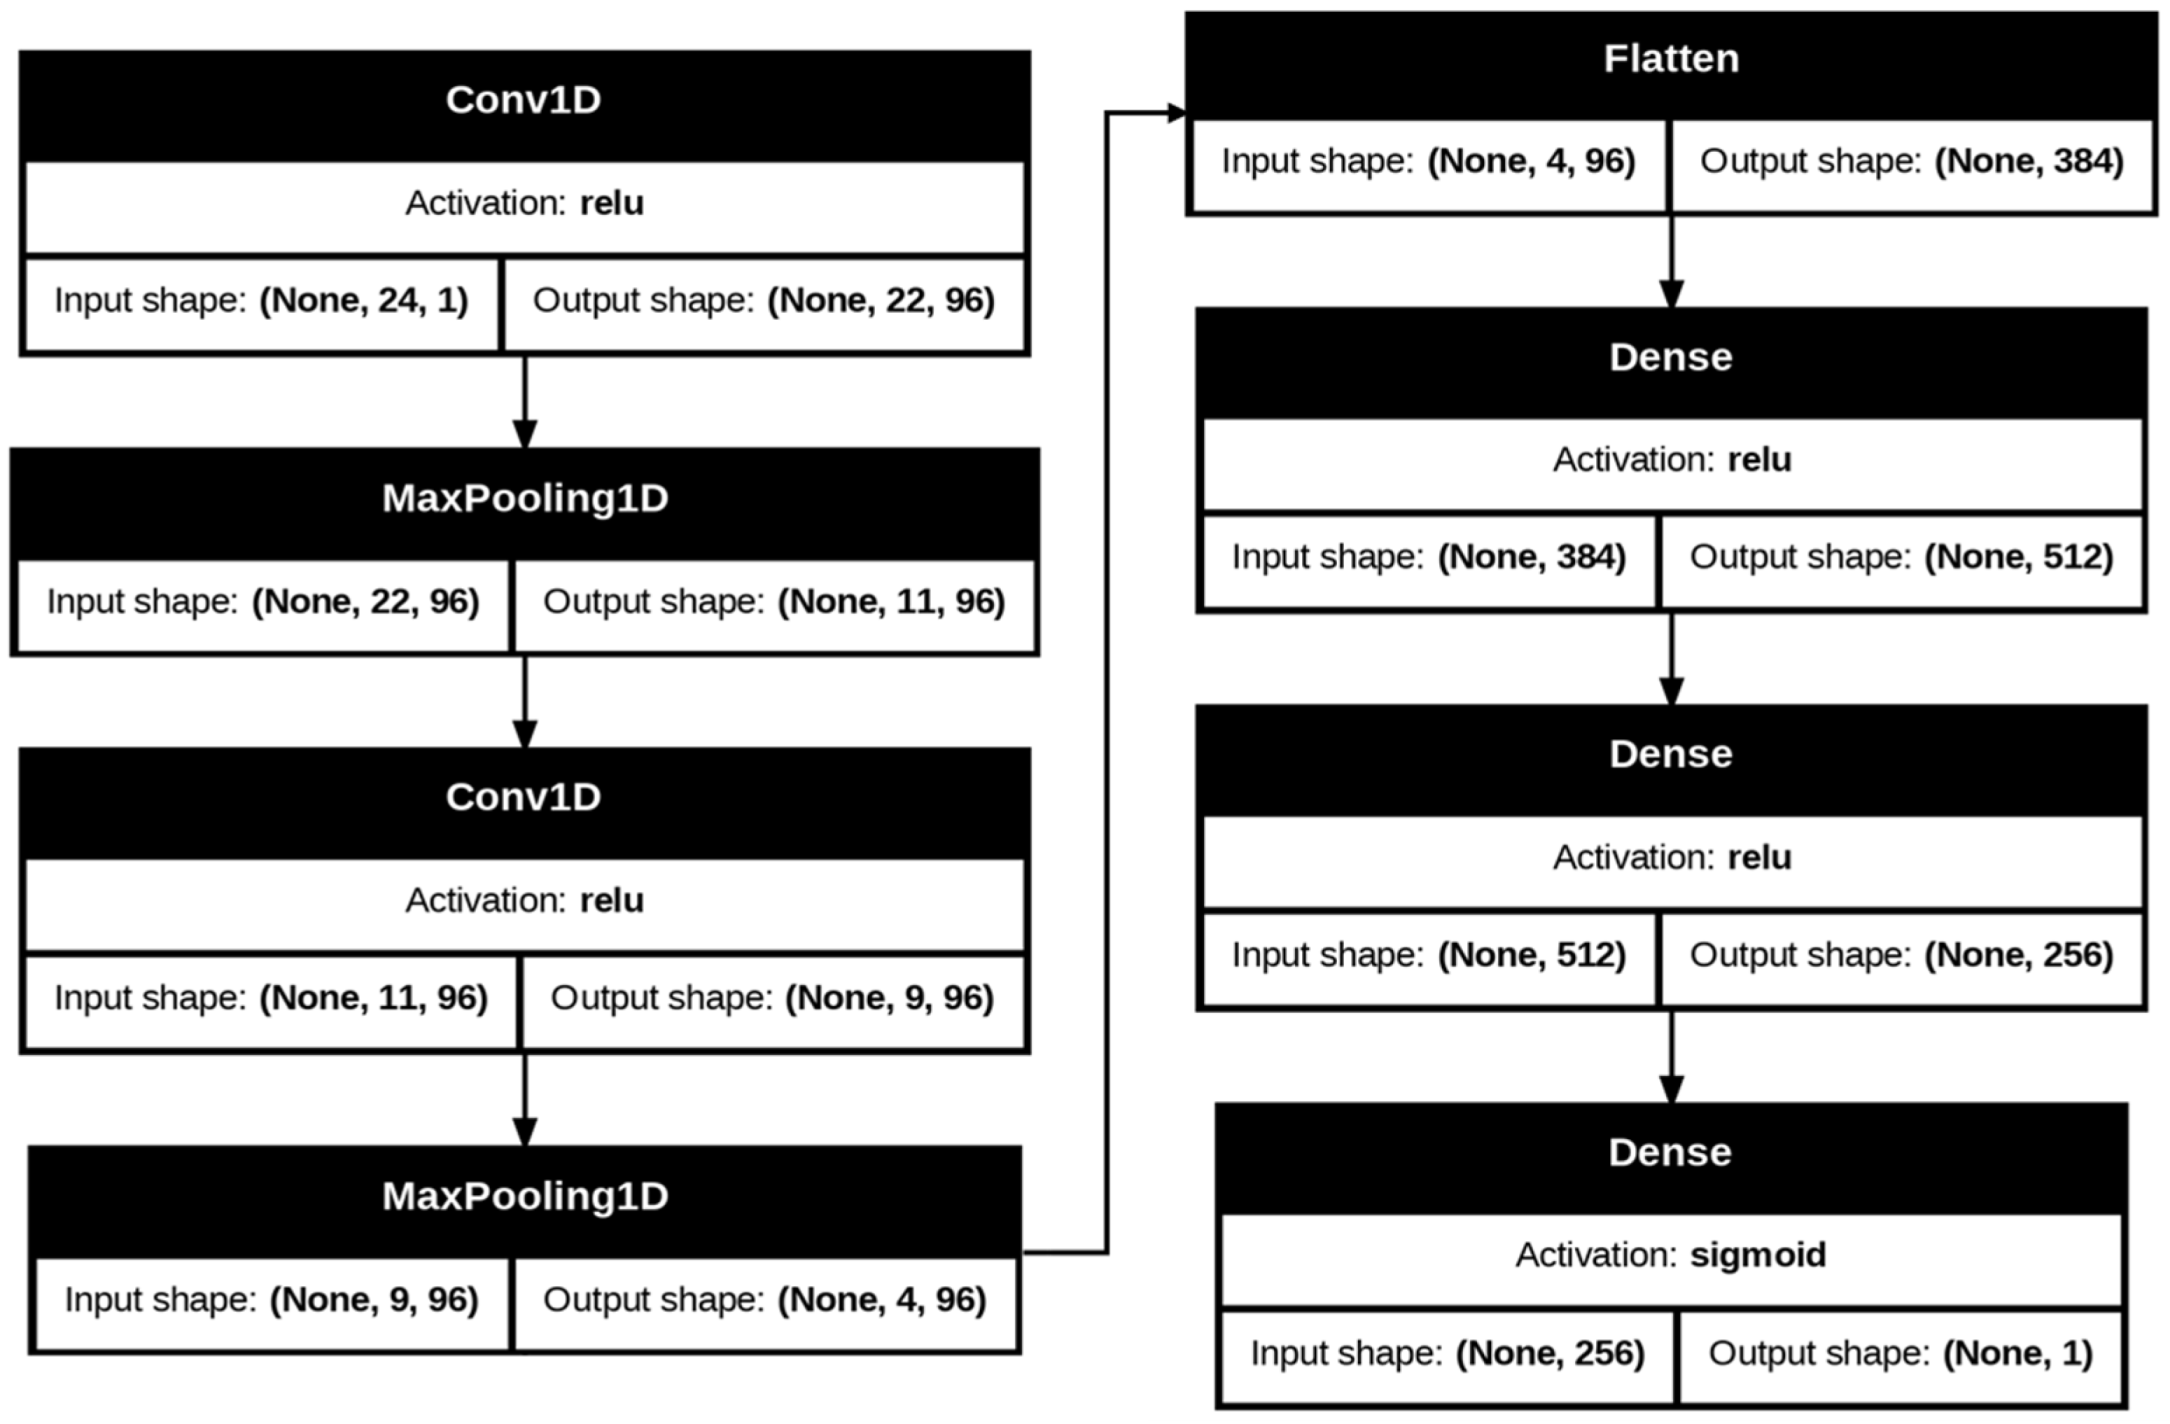
- CNN (Convolutional neural network):
4.3.3. Model Parameters
4.4. Model Training and Prediction
4.5. Evaluation
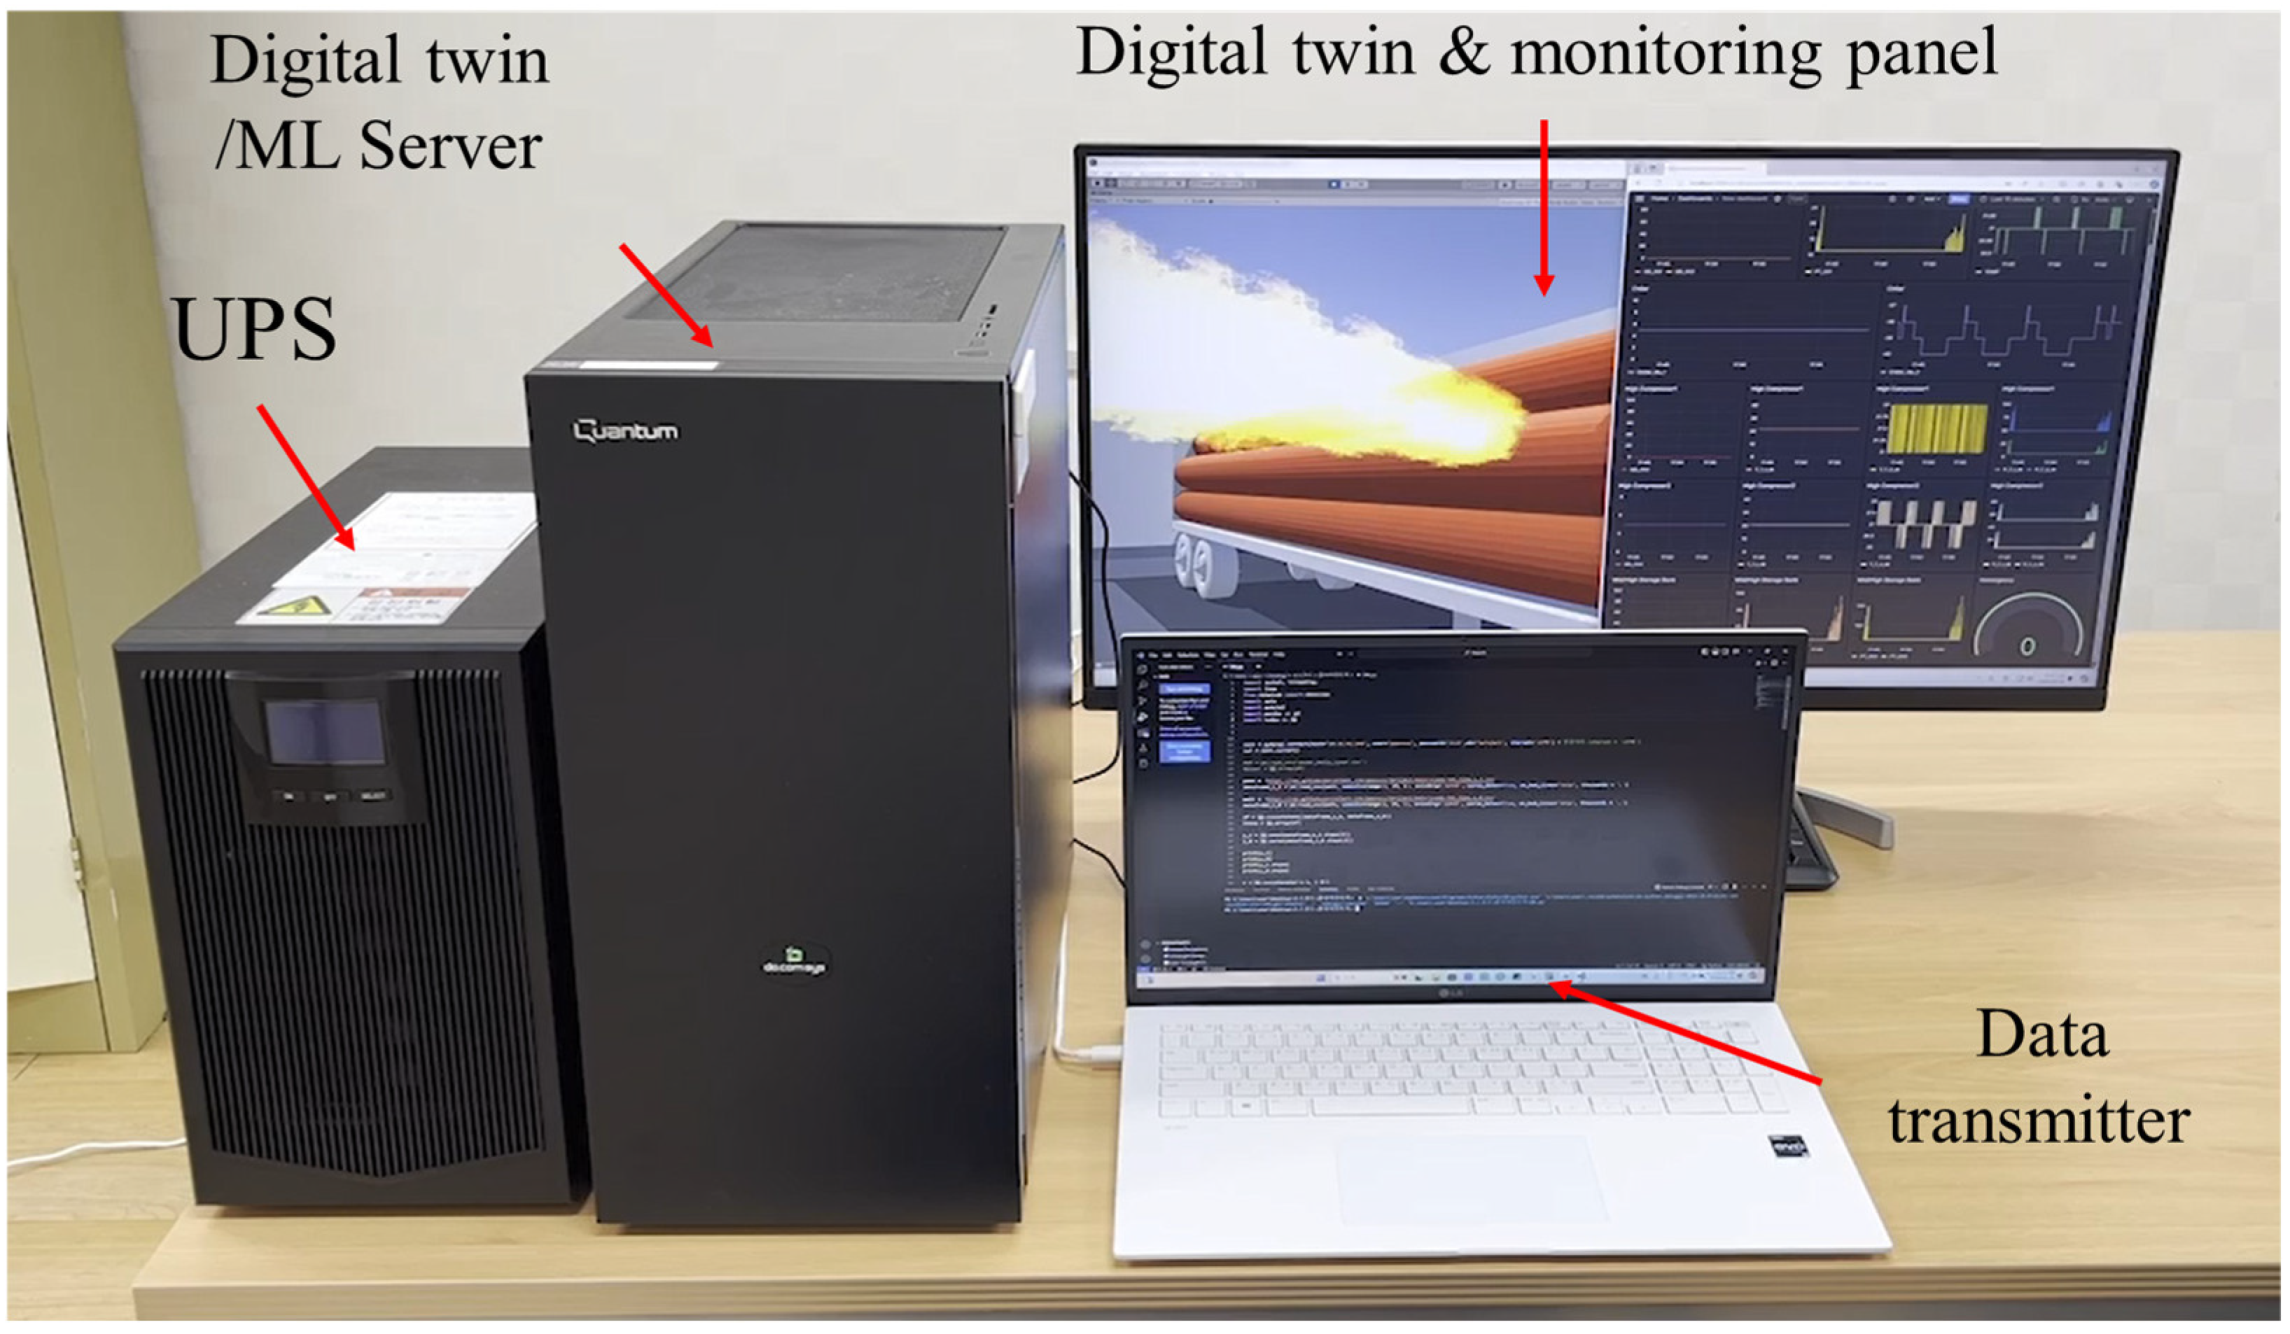
5. Implementation: Decision-Making-Based Digital Twin Smart Hydrogen Refueling Station Safety Management Model Implementation
5.1. IoT Infrastructure
5.2. Communication Protocol
5.3. Machine Learning/Deep Learning Model Training, Storage, and Prediction
5.4. Unity-Based Digital Twin 3D Modeling
5.5. Digital Twin Simulation
6. Conclusions
Author Contributions
Funding
Data Availability Statement
Conflicts of Interest
References
- Dawood, F.; Anda, M.; Shafiullah, G.M. Hydrogen production for energy: An overview. Int. J. Hydrogen Energy 2020, 45, 3847–3869. [Google Scholar] [CrossRef]
- Züttel, A.J.N. Hydrogen storage methods. Sci. Nat. 2004, 91, 157–172. [Google Scholar] [CrossRef] [PubMed]
- Graetz, J. New approaches to hydrogen storage. Chem. Soc. Rev. 2009, 38, 73–82. [Google Scholar] [CrossRef]
- Usman, M.R.; Reviews, S.E. Hydrogen storage methods: Review and current status. Renew. Sustain. Energy Rev. 2022, 167, 112743. [Google Scholar] [CrossRef]
- Brown, T.; Stephens-Romero, S.; Samuelsen, G.S. Quantitative analysis of a successful public hydrogen station. Int. J. Hydrogen Energy 2012, 37, 12731–12740. [Google Scholar] [CrossRef]
- Lin, R.-H.; Ye, Z.-Z.; Wu, B.-D. A review of hydrogen station location models. Int. J. Hydrogen Energy 2020, 45, 20176–20183. [Google Scholar] [CrossRef]
- An, S.; Oh, S.; Kim, E.; Lee, J. Optimization of Designing Barrier to Mitigate Hazardous Area in Hydrogen Refueling Stations. J. Hydrogen New Energy 2023, 34, 734–740. [Google Scholar] [CrossRef]
- Kim, H.; Kang, S. Analysis of damage range and impact of on-site hydrogen fueling station using quantitative risk assessment program (Hy-KoRAM). Trans. Korean Hydrogen New Energy Soc. 2020, 31, 459–466. [Google Scholar] [CrossRef]
- Gerard, B.; Carrera, E.; Bernard, O.; Lun, D. Smart design of green hydrogen facilities: A digital twin-driven approach. In Proceedings of the E3S Web of Conferences, Hyderabad, India, 15–17 December 2021; EDP Sciences: Les Ulis, France, 2022; p. 02001. [Google Scholar]
- Jaribion, A.; Khajavi, S.H.; Öhman, M.; Knapen, A.; Holmström, J. A digital twin for safety and risk management: A prototype for a hydrogen high-pressure vessel. In Proceedings of the 15th International Conference on Design Science Research in Information Systems and Technology, Kristiansand, Norway, 2–4 December 2020; Springer: Berlin/Heidelberg, Germany, 2020; pp. 369–375. [Google Scholar]
- Kang, S.-K. A study of jet dispersion and jet-fire characteristics for safety distance of the hydrogen refueling station. J. Korean Inst. Gas 2019, 23, 74–80. [Google Scholar] [CrossRef]
- Kim, H.J.; Jang, K.M.; Kim, S.H.; Kim, G.B.; Jung, E.S. A Study on Safety Guidelines for Hydrogen Refueling Stations at Expressway Service Area using Quantitative Risk Assessment. Trans. Korean Hydrogen New Energy Soc. 2021, 32, 551–564. [Google Scholar] [CrossRef]
- Zhou, J.; Zhang, J.; Zhang, J.; Yi, F.; Wang, X.; Sun, Y.; Zhang, C.; Hu, D.; Wu, G. Hydrogen leakage source positioning method in deep belief network based on fully confined space Gaussian distribution model. Int. J. Hydrogen Energy 2024, 63, 435–445. [Google Scholar] [CrossRef]
- Genovese, M.; Blekhman, D.; Fragiacomo, P.J.H. An exploration of safety measures in hydrogen refueling stations: Delving into hydrogen equipment and technical performance. Hydrogen 2024, 5, 102–122. [Google Scholar] [CrossRef]
- Hydrogen Charging Station, Real-Time Safety Management 24 Hours a Day. Available online: https://www.motie.go.kr/kor/article/ATCL3f49a5a8c/165645/view (accessed on 27 August 2024).
- Guido, G.; Haghshenas, S.S.; Haghshenas, S.S.; Vitale, A.; Gallelli, V.; Astarita, V.J.S. Development of a binary classification model to assess safety in transportation systems using GMDH-type neural network algorithm. Sustainability 2020, 12, 6735. [Google Scholar] [CrossRef]
- Eom, J.J. An Architecture of a Smart Safety Management System to prevent safety Accidents in Workplace. J. Digit. Contents Soc. 2020, 21, 817–823. [Google Scholar] [CrossRef]
- Jia, C.; Zhou, J.; He, H.; Li, J.; Wei, Z.; Li, K. Health-conscious deep reinforcement learning energy management for fuel cell buses integrating environmental and look-ahead road information. Energy 2024, 290, 130146. [Google Scholar] [CrossRef]
- He, X.; Kong, D.; Yang, G.; Yu, X.; Wang, G.; Peng, R.; Zhang, Y.; Dai, X. Hybrid neural network-based surrogate model for fast prediction of hydrogen leak consequences in hydrogen refueling station. Int. J. Hydrogen Energy 2024, 59, 187–198. [Google Scholar] [CrossRef]
- He, X.; Kong, D.; Yu, X.; Ping, P.; Wang, G.; Peng, R.; Zhang, Y.; Dai, X. Prediction model for the evolution of hydrogen concentration under leakage in hydrogen refueling station using deep neural networks. Int. J. Hydrogen Energy 2024, 51, 702–712. [Google Scholar] [CrossRef]
- Kim Tony, S. The Development of an Intelligent Risk Recognition System for Construction Safety by Combining Artificial Intelligence and Digital Twin Technology. J. Korea Inst. Build. Constr. 2023, 23, 405–406. [Google Scholar]
- Ye, Z.; Ye, Y.; Zhang, C.; Zhang, Z.; Li, W.; Wang, X.; Wang, L.; Wang, L. digital twin approach for tunnel construction safety early warning and management. Comput. Ind. 2023, 144, 103783. [Google Scholar] [CrossRef]
- Liu, F.; Panagiotakos, D. Real-world data: A brief review of the methods, applications, challenges and opportunities. BMC Med. Res. Methodol. 2022, 22, 287. [Google Scholar] [CrossRef]
- Kusters, R.; Misevic, D.; Berry, H.; Cully, A.; Le Cunff, Y.; Dandoy, L.; Díaz-Rodríguez, N.; Ficher, M.; Grizou, J.; Othmani, A.; et al. Interdisciplinary research in artificial intelligence: Challenges and opportunities. Front. Big Data 2020, 3, 577974. [Google Scholar] [CrossRef] [PubMed]
- Parmar, J.; Chouhan, S.; Raychoudhury, V.; Rathore, S. Open-world machine learning: Applications, challenges, and opportunities. ACM Comput. Surv. 2023, 55, 1–37. [Google Scholar] [CrossRef]
- Lastowka, F.G.; Hunter, D. The laws of the virtual worlds. In Popular Culture and Law; Routledge: London, UK, 2017; pp. 363–435. [Google Scholar] [CrossRef]
- Gaidon, A.; Wang, Q.; Cabon, Y.; Vig, E. Virtual worlds as proxy for multi-object tracking analysis. In Proceedings of the IEEE Conference on Computer Vision and Pattern Recognition, Las Vegas, NV, USA, 27 June 2016; pp. 4340–4349. [Google Scholar]
- Liaw, S.Y.; Carpio, G.A.C.; Lau, Y.; Tan, S.C.; Lim, W.S.; Goh, P.S. Multiuser virtual worlds in healthcare education: A systematic review. Nurse Educ. Today 2018, 65, 136–149. [Google Scholar] [CrossRef] [PubMed]
- Alguliyev, R.; Imamverdiyev, Y.; Sukhostat, L. Cyber-physical systems and their security issues. Comput. Ind. 2018, 100, 212–223. [Google Scholar] [CrossRef]
- Shim, S.; Kim, J.Y.; Hwang, S.W.; Oh, J.M.; Kim, B.K.; Park, J.H.; Hyun, D.J.; Lee, H. Computing. A Comprehensive Review of Cyber-physical System (CPS)-based Approaches to Robot Services. IEIE Trans. Smart Process. Comput. 2024, 13, 69–80. [Google Scholar] [CrossRef]
- Tao, F.; Qi, Q.; Wang, L.; Nee, A.J.E. Digital twins and cyber–physical systems toward smart manufacturing and industry 4.0: Correlation and comparison. Engineering 2019, 5, 653–661. [Google Scholar] [CrossRef]
- Yao, X.; Zhou, J.; Lin, Y.; Li, Y.; Yu, H.; Liu, Y. Smart manufacturing based on cyber-physical systems and beyond. J. Intell. Manuf. 2019, 30, 2805–2817. [Google Scholar] [CrossRef]
- Javid, S.S.M.; Derakhshan, G.; mehdi Hakimi, S. Energy scheduling in a smart energy hub system with hydrogen storage systems and electrical demand management. J. Build. Eng. 2023, 80, 108129. [Google Scholar] [CrossRef]
- Abohamzeh, E.; Salehi, F.; Sheikholeslami, M.; Abbassi, R.; Khan, F. Review of hydrogen safety during storage, transmission, and applications processes. J. Loss Prev. Process Ind. 2021, 72, 104569. [Google Scholar] [CrossRef]
- Calabrese, M.; Portarapillo, M.; Di Nardo, A.; Venezia, V.; Turco, M.; Luciani, G.; Di Benedetto, A.J.E. Hydrogen safety challenges: A comprehensive review on production, storage, transport, utilization, and CFD-based consequence and risk assessment. Energies 2024, 17, 1350. [Google Scholar] [CrossRef]
- He, K.; Zhang, X.; Ren, S.; Sun, J. Deep residual learning for image recognition. In Proceedings of the IEEE Conference on Computer Vision and Pattern Recognition, Las Vegas, NV, USA, 27 June 2016; pp. 770–778. [Google Scholar]
- Park, K. Towards intelligent agents to assist in modular construction: Evaluation of datasets generated in virtual environments for AI training. In Proceedings of the 38th International Symposium on Automation and Robotics in Construction (ISARC), Dubai, United Arab Emirates, 2–4 November 2021. [Google Scholar] [CrossRef]
- Ignjatović, D.; Bailey, D.W.; Bajić, L. The wormhole ai training processor. In Proceedings of the 2022 IEEE International Solid-State Circuits Conference (ISSCC), San Francisco, CA, USA, 20–26 February 2022; IEEE: Piscataway, NJ, USA, 2022; pp. 356–358. [Google Scholar]
- Runkler, T.A. Data Analytics; Springer: Berlin/Heidelberg, Germany, 2020. [Google Scholar]
- Bong, S.; Oh, S.C.P.; Joong, S.; Jang, J. A Study on Inference Methods for Functional Safety of Hydrogen Refueling Stations Through Analysis of Similar Device Health Data. J. Appl. Reliab. 2021, 21, 367–380. [Google Scholar]
- Bong, S.; Oh, D.S.S.; Yong, H.; Lee, Y.; Joong, J.S. Development of Technology for CBM+ Data Acquisition of Hydrogen Refueling Station Compressor. J. Appl. Reliab. 2023, 23, 51–72. [Google Scholar]
- Zhang, S.; Li, X.; Zong, M.; Zhu, X.; Wang, R. Efficient kNN classification with different numbers of nearest neighbors. IEEE Trans. Neural Netw. Learn. Syst. 2017, 29, 1774–1785. [Google Scholar] [CrossRef] [PubMed]
- Saadatfar, H.; Khosravi, S.; Joloudari, J.H.; Mosavi, A.; Shamshirband, S.J.M. A new K-nearest neighbors classifier for big data based on efficient data pruning. Mathematics 2020, 8, 286. [Google Scholar] [CrossRef]
- Syaliman, K.; Nababan, E.; Sitompul, O. Improving the accuracy of k-nearest neighbor using local mean based and distance weight. In Journal of Physics: Conference Series, Proceedings of the 2nd International Conference on Computing and Applied Informatics, Medan, Indonesia, 28–30 November 2017; IOP Publishing: Bristol, UK, 2018; p. 012047. [Google Scholar]
- Yu, Z.; Chen, H.; Liu, J.; You, J.; Leung, H.; Han, G. Hybrid $ k $-nearest neighbor classifier. IEEE Trans. Cybern. 2015, 46, 1263–1275. [Google Scholar] [CrossRef]
- Harrell, J.; Frank, E.; Harrell, F.E. Ordinal logistic regression. In Regression Modeling Strategies: With Applications to Linear Models, Logistic and Ordinal Regression, and Survival Analysis; Springer: Berlin/Heidelberg, Germany, 2015; pp. 311–325. [Google Scholar] [CrossRef]
- Zabor, E.C.; Reddy, C.A.; Tendulkar, R.D.; Patil, S. Logistic regression in clinical studies. Int. J. Radiat. Oncol. Biol. Phys. 2022, 112, 271–277. [Google Scholar] [CrossRef]
- Parvin, H.; MirnabiBaboli, M.; Alinejad-Rokny, H. Proposing a classifier ensemble framework based on classifier selection and decision tree. Eng. Appl. Artif. Intell. 2015, 37, 34–42. [Google Scholar] [CrossRef]
- Yoo, S.H.; Geng, H.; Chiu, T.L.; Yu, S.K.; Cho, D.C.; Heo, J.; Choi, M.S.; Choi, I.H.; Cung Van, C.; Nhung, N.V. Deep learning-based decision-tree classifier for COVID-19 diagnosis from chest X-ray imaging. Front. Med. 2020, 7, 427. [Google Scholar] [CrossRef]
- Charbuty, B.; Abdulazeez, A.; Trends, T. Classification based on decision tree algorithm for machine learning. J. Appl. Sci. Technol. Trends 2021, 2, 20–28. [Google Scholar] [CrossRef]
- Li, X.; Zhao, H.; Zhu, W.J.K.-B.S. A cost sensitive decision tree algorithm with two adaptive mechanisms. Knowl. Based Syst. 2015, 88, 24–33. [Google Scholar] [CrossRef]
- Parmar, A.; Katariya, R.; Patel, V. A review on random forest: An ensemble classifier. In Proceedings of the International Conference on Intelligent Data Communication Technologies and Internet of Things (ICICI), Coimbatore, India, 7–8 August 2018; Springer: Heidelberg, Germany, 2019; pp. 758–763. [Google Scholar]
- Paul, A.; Mukherjee, D.P.; Das, P.; Gangopadhyay, A.; Chintha, A.R.; Kundu, S. Improved random forest for classification. IEEE Trans. Image Process. 2018, 27, 4012–4024. [Google Scholar] [CrossRef] [PubMed]
- Masetic, Z.; Subasi, A. Congestive heart failure detection using random forest classifier. Comput. Methods Programs Biomed. 2016, 130, 54–64. [Google Scholar] [CrossRef] [PubMed]
- Sharaff, A.; Gupta, H. Extra-tree classifier with metaheuristics approach for email classification. In Advances in Computer Communication and Computational Sciences, Proceedings of the IC4S, Bangkok, Thailand, 20–21 October 2018; Springer: Berlin/Heidelberg, Germany, 2019; pp. 189–197. [Google Scholar]
- Zdravevski, E.; Lameski, P.; Kulakov, A.; Trajkovikj, V. Performance Comparison of Random Forests and Extremely Randomized Trees; Faculty of Computer Science and Engineering, Ss. Cyril and Methodius: Skopje, North Macedonia, 2016. [Google Scholar]
- Kocev, D.; Ceci, M. Ensembles of extremely randomized trees for multi-target regression. In Discovery Science, Proceedings of the 18th International Conference, DS 2015, Banff, AB, Canada, 4–6 October 2015; Springer: Berlin/Heidelberg, Germany, 2015; pp. 86–100. [Google Scholar]
- Velthoen, J.; Dombry, C.; Cai, J.-J.; Engelke, S.J.E. Gradient boosting for extreme quantile regression. Extremes 2023, 26, 639–667. [Google Scholar] [CrossRef]
- Bentéjac, C.; Csörgő, A.; Martínez-Muñoz, G. A comparative analysis of gradient boosting algorithms. Artif. Intell. Rev. 2021, 54, 1937–1967. [Google Scholar] [CrossRef]
- Tamim Kashifi, M.; Ahmad, I. Efficient histogram-based gradient boosting approach for accident severity prediction with multisource data. Transp. Res. Rec. 2022, 2676, 236–258. [Google Scholar] [CrossRef]
- Cui, J.; Hang, H.; Wang, Y.; Lin, Z. GBHT: Gradient boosting histogram transform for density estimation. In Proceedings of the 38th International Conference on Machine Learning, Virtual Event, 18–24 July 2021; pp. 2233–2243, PMLR: 2021. [Google Scholar]
- LeCun, Y.; Bengio, Y.; Hinton, G. Deep learning. Nature 2015, 521, 436–444. [Google Scholar] [CrossRef]
- Krizhevsky, A.; Sutskever, I.; Hinton, G.E. Imagenet classification with deep convolutional neural networks. Commun. ACM 2017, 60, 84–90. [Google Scholar] [CrossRef]
- Rawat, W.; Wang, Z. Deep convolutional neural networks for image classification: A comprehensive review. Neural Comput. 2017, 29, 2352–2449. [Google Scholar] [CrossRef]
- Zhang, J.; Zheng, Y.; Qi, D.; Li, R.; Yi, X. DNN-based prediction model for spatio-temporal data. In Proceedings of the 24th ACM SIGSPATIAL International Conference on Advances in Geographic Information Systems, Burlingame, CA, USA, 31 October–3 November 2016; pp. 1–4. [Google Scholar]
- Almatared, M.; Liu, H.; Abudayyeh, O.; Hakim, O.; Sulaiman, M. Digital-Twin-Based Fire Safety Management Framework for Smart Buildings. Buildings 2024, 14, 4. [Google Scholar] [CrossRef]
- Ariyachandra, M.R.M.F.; Wedawatta, G. Digital Twin Smart Cities for Disaster Risk Management: A Review of Evolving Concepts. Sustainability 2023, 15, 11910. [Google Scholar] [CrossRef]
- Park, S.; Park, S.H.; Park, L.W.; Park, S.; Lee, S.; Lee, T.; Lee, S.H.; Jang, H.; Kim, S.M.; Chang, H.; et al. Design and Implementation of a Smart IoT Based Building and Town Disaster Management System in Smart City Infrastructure. Appl. Sci. 2018, 8, 2239. [Google Scholar] [CrossRef]


| Current Research | Safety Guideline | Traditional Method | EMS | AI | Static Digital Twin | Dynamic Digital Twin | Novelty | ||||
|---|---|---|---|---|---|---|---|---|---|---|---|
| GMDH | DNN | CNN | RNN | GAN | |||||||
| Kang et al., 2019 [11] | √ | 65% | |||||||||
| Kim et al., 2021 [12] | √ | 50% | |||||||||
| Zhou et al., 2024 [13] | √ | 60% | |||||||||
| Genovese et al., 2024 [14] | √ | 60% | |||||||||
| Guido et al., 2020 [16] | √ | √ | 75% | ||||||||
| Eom et al., 2020 [17] | √ | √ | 80% | ||||||||
| Jia et al., 2024 [18] | √ | 45% | |||||||||
| He et al., 2024 [19] | √ | √ | √ | 85% | |||||||
| He et al., 2024 [20] | √ | 85% | |||||||||
| Kim et al., 2023 [21] | √ | √ | 70% | ||||||||
| Ye et al., 2023 [22] | √ | √ | 70% | ||||||||
| Proposed System | √ | √ | √ | ||||||||
| Classification | Data Name | Description |
|---|---|---|
| Tube trailer | GD-201 (%) | SoC of tube trailer |
| GD-202 (%) | SoC of tube trailer | |
| PT-201 (MPa) | Pressure of tube trailer | |
| TEMP (°C) | Temperature of input from tube trailer to chiller | |
| Chiller | Chiller No. 1 Dispenser COOLER (°C) | Temperature of chiller No. 1 |
| Chiller No. 2 Dispenser COOLER (°C) | Temperature of chiller No. 2 | |
| High compressor 1 | GD-203 (%) | SoC of high compressor 1 |
| T.T1-1A (°C) | Temperature of input of the high compressor 1 | |
| P.T1-1A (MPa) | Pressure of input of the high compressor 1 | |
| T.T2-1A (°C) | Temperature of output of the high compressor 1 | |
| P.T2-1A (MPa) | Pressure of output of the high compressor 1 | |
| T.T1A (OIL) (°C) | Temperature of T.T1A (OIL) | |
| High compressor 2 | GD-204 (%) | SoC of high compressor 2 |
| T.T1-1B (°C) | Temperature of input of the high compressor 2 | |
| P.T1-1B (MPa) | Pressure of input of the high compressor 2 | |
| T.T2-1B (°C) | Temperature of output of the high compressor 2 | |
| P.T2-1B (MPa) | Pressure of output of the high compressor 2 | |
| T.T1B (OIL) | Temperature of T.T1B (OIL) | |
| Mid/high storage bank | PT-202 (MPa) | Pressure of chiller to mid/high storage bank |
| PT-204 (MPa) | Pressure of mid storage bank | |
| PT-203 (MPa) | Pressure of high storage bank | |
| PT-205 (MPa) | Pressure of high storage bank | |
| GD-205 (%) | SoC of storage bank | |
| GD-206 (%) | SoC of storage bank |
| Time | GD-201 | GD-202 | PT-201 | TEMP | Chiller No. 1 Dispenser COOLER | Chiller No. 2 Dispenser COOLER | GD-203 | T.T1-1A | P.T1-1A | T.T2-1A | P.T2-1A | T.T1A(OIL) |
|---|---|---|---|---|---|---|---|---|---|---|---|---|
| 10:36:18 | 0 | 0 | 11.51 | 21.0 | 5 | −37 | 0 | 22 | 6.6 | 22 | 50.4 | 19 |
| 10:36:19 | 0 | 0 | 11.51 | 21.0 | 5 | −37 | 0 | 22 | 6.6 | 22 | 50.4 | 19 |
| 10:36:20 | 0 | 0 | 11.47 | 21.0 | 5 | −37 | 0 | 22 | 6.6 | 21 | 50.3 | 19 |
| 10:36:21 | 0 | 0 | 11.47 | 21.0 | 5 | −37 | 0 | 22 | 6.6 | 21 | 50.3 | 19 |
| 10:36:22 | 0 | 0 | 11.47 | 21.0 | 5 | −38 | 0 | 22 | 6.6 | 21 | 50.3 | 19 |
| … | … | … | … | |||||||||
| 10:48:56 | 0 | 0 | 11.49 | 21.1 | 5 | −39 | 0 | 22 | 6.6 | 22 | 50.4 | 19 |
| 10:48:57 | 0 | 0 | 11.49 | 21.1 | 5 | −39 | 0 | 22 | 6.6 | 22 | 50.4 | 19 |
| 10:48:58 | 0 | 0 | 11.51 | 21.1 | 5 | −39 | 0 | 22 | 6.6 | 22 | 50.4 | 19 |
| 10:48:59 | 0 | 0 | 11.49 | 21.1 | 5 | −39 | 0 | 22 | 6.6 | 22 | 50.4 | 19 |
| 10:49:00 | 0 | 0 | 11.51 | 21.1 | 5 | −39 | 0 | 22 | 6.6 | 22 | 50.4 | 19 |
| Time | GD-204 | T.T1-1B | P.T1-1B | T.T2-1B | P.T2-1B | T.T1B (OIL) | PT-202 | PT-204 | PT-203 | PT-205 | GD-205 | GD-206 |
| 10:36:18 | 3 | 21 | 8.4 | 28 | 52.1 | 31 | 44.66 | 44.75 | 86.10 | 86.53 | 0 | 0 |
| 10:36:19 | 3 | 21 | 8.4 | 28 | 52.1 | 31 | 44.66 | 44.75 | 86.10 | 86.53 | 0 | 0 |
| 10:36:20 | 3 | 21 | 8.4 | 27 | 52.1 | 31 | 44.59 | 44.69 | 86.06 | 86.40 | 0 | 0 |
| 10:36:21 | 3 | 21 | 8.4 | 27 | 52.1 | 31 | 44.59 | 44.69 | 86.06 | 86.40 | 0 | 0 |
| 10:36:22 | 3 | 21 | 8.4 | 27 | 52.1 | 31 | 44.59 | 44.69 | 86.06 | 86.40 | 0 | 0 |
| … | … | … | ||||||||||
| 10:48:56 | 3 | 21 | 8.4 | 27 | 51.9 | 31 | 44.67 | 44.79 | 86.21 | 86.52 | 0 | 0 |
| 10:48:57 | 3 | 21 | 8.4 | 27 | 51.9 | 31 | 44.67 | 44.79 | 86.21 | 86.52 | 0 | 0 |
| 10:48:58 | 3 | 21 | 8.4 | 26 | 51.8 | 31 | 44.69 | 44.74 | 86.16 | 86.45 | 0 | 0 |
| 10:48:59 | 3 | 21 | 8.4 | 27 | 51.9 | 31 | 44.67 | 44.79 | 86.21 | 86.52 | 0 | 0 |
| 10:49:00 | 3 | 21 | 8.4 | 26 | 51.8 | 31 | 44.69 | 44.74 | 86.16 | 86.45 | 0 | 0 |
| Hyperparameters | Model | Description | |||
|---|---|---|---|---|---|
| K-Neighbors | |||||
| n_neighbors | 5 | Number of neighbors to consider | |||
| metric | minkowski | The method for measuring the distance between neighbors | |||
| Hyperparameters | Model | Description | |||
| Logistic Regression | |||||
| Penalty | L2 | L2 regularization (Ridge) is used when applying regularization | |||
| c | 1.0 | Parameter to determine the strength of regularization | |||
| solver | lbfgs | Optimization algorithm | |||
| max_iter | 100 | Maximum number of iterations for the optimization algorithm | |||
| Hyperparameters | Model | Description | |||
| Decision Tree | Random Forest | Extra Trees | |||
| max_depth | None | None | None | Maximum depth of the tree | |
| min_samples_split | 2 | 2 | 2 | Minimum number of samples required to split a node | |
| min_samples_leaf | 1 | 1 | 1 | Minimum number of samples required to be at a leaf node | |
| Hyperparameters | Model | Description | |||
| Gradient Boosting | Hist Gradient Boosting | ||||
| loss | log_loss | log_loss | Defines the loss function to use | ||
| learning_rate | 0.1 | 0.1 | Rate at which each tree’s contribution is reduced | ||
| max_iter | 100 | 100 | Maximum number of trees to learn | ||
| max_leaf_nodes | 1.0 | 31 | Maximum number of leaf nodes that can be created for each tree | ||
| Hyperparameters | Model | Description | |||
| DNN | CNN | ||||
| Total params | 144,385 | 1,070,501 | Total number of parameters | ||
| Activation | sigmoid | sigmoid | Defines the activation function | ||
| Optimizer | adam | adam | Defines the optimization algorithm | ||
| loss | binary crossentropy | binary crossentropy | Defines the loss function for the binary classification model | ||
| epochs | 50 | 30 | Defines the maximum number of epochs | ||
| batch_size | 24 | 32 | Defines the batch size for training | ||
| Classification | Number |
|---|---|
| Number of data features | 24 |
| Number of data target | 1 |
| Number of samples | 885 |
| Training dataset | 708 |
| Test dataset | 177 |
| Model | 5-Fold Cross-Validation | Accuracy | Precision | Recall | F1-Score |
|---|---|---|---|---|---|
| K-Neighbors | 0.996 | 0.994 | 0.993 | 1.000 | 0.997 |
| Logistic Regression | 0.996 | 0.989 | 0.987 | 1.000 | 0.993 |
| Decision Tree | 0.996 | 0.994 | 0.993 | 1.000 | 0.997 |
| Random Forest | 0.984 | 0.983 | 0.980 | 1.000 | 0.990 |
| Extra Trees | 0.996 | 0.989 | 0.987 | 1.000 | 0.993 |
| Gradient Boosting | 0.999 | 0.994 | 0.993 | 1.000 | 0.997 |
| Hist Gradient Boosting | 0.954 | 0.955 | 0.949 | 1.000 | 0.974 |
| DNN | - | 0.989 | 0.987 | 1.000 | 0.993 |
| CNN | - | 1.000 | 0.987 | 1.000 | 0.993 |
| Layer | Output Shape | Activation | Number of Parameters |
|---|---|---|---|
| Conv1D | (22, 96) | relu | 384 |
| Max pooling1D | (11, 96) | - | 0 |
| Conv1D | (9, 96) | relu | 27,744 |
| Max pooling1D | (4, 96) | - | 0 |
| Flatten | 384 | - | 0 |
| Dense1 | 512 | relu | 197,120 |
| Dense2 | 256 | relu | 131,328 |
| Dense3 | 1 | sigmoid | 257 |
| Classification | Time |
|---|---|
| Training time (s) | 35 |
| Forecasting time (ms) | 68 |
| Data transmission interval (s) | 1 |
Disclaimer/Publisher’s Note: The statements, opinions and data contained in all publications are solely those of the individual author(s) and contributor(s) and not of MDPI and/or the editor(s). MDPI and/or the editor(s) disclaim responsibility for any injury to people or property resulting from any ideas, methods, instructions or products referred to in the content. |
© 2024 by the authors. Licensee MDPI, Basel, Switzerland. This article is an open access article distributed under the terms and conditions of the Creative Commons Attribution (CC BY) license (https://creativecommons.org/licenses/by/4.0/).
Share and Cite
An, N.Y.; Yang, J.H.; Song, E.; Hwang, S.-H.; Byun, H.-G.; Park, S. Digital Twin-Based Hydrogen Refueling Station (HRS) Safety Model: CNN-Based Decision-Making and 3D Simulation. Sustainability 2024, 16, 9482. https://doi.org/10.3390/su16219482
An NY, Yang JH, Song E, Hwang S-H, Byun H-G, Park S. Digital Twin-Based Hydrogen Refueling Station (HRS) Safety Model: CNN-Based Decision-Making and 3D Simulation. Sustainability. 2024; 16(21):9482. https://doi.org/10.3390/su16219482
Chicago/Turabian StyleAn, Na Yeon, Jung Hyun Yang, Eunyong Song, Sung-Ho Hwang, Hyung-Gi Byun, and Sanguk Park. 2024. "Digital Twin-Based Hydrogen Refueling Station (HRS) Safety Model: CNN-Based Decision-Making and 3D Simulation" Sustainability 16, no. 21: 9482. https://doi.org/10.3390/su16219482
APA StyleAn, N. Y., Yang, J. H., Song, E., Hwang, S.-H., Byun, H.-G., & Park, S. (2024). Digital Twin-Based Hydrogen Refueling Station (HRS) Safety Model: CNN-Based Decision-Making and 3D Simulation. Sustainability, 16(21), 9482. https://doi.org/10.3390/su16219482