Abstract
Museums are precious carriers of human civilization and history as well as important places for cultural inheritance and education. However, with the rapid development of science and technology, museums are now facing the challenge of enhancing visitors’ experiences. The use of immersive technology in museums can blur the real and virtual worlds to offer visitors a unique experience. Based on the TAM and flow theory, this study analyzes the influence of immersion technology in museums on visitors’ behavioral intention. The results of the study show that, according to the TAM, the perceived usefulness and ease of use of immersive technologies in museums affect visitors’ attitudes and satisfaction. Similarly, perceived enjoyment and concentration, as described in the flow theory, also influence these attitudes and satisfaction levels. Additionally, visitors’ attitudes and satisfaction with immersive technologies impact their behavioral intentions. The findings are instructive for museums to enhance visitor experience and promote sustainable museum development.
1. Introduction
Museums are essential institutions for the preservation, interpretation, study, and display of heritage. The Chinese government has introduced new requirements for the inheritance and development of traditional culture. These requirements emphasize that museums are crucial in protecting and passing on human civilization. In the wave of technological innovation, museums can improve the dissemination of history and culture and provide a more diversified platform for the public. On 24 May 2021, China’s State Administration of Cultural Heritage, along with nine other departments, issued a guideline. This guideline aims for China to become a leading museum nation by 2035. Many scholars have demonstrated in their studies that museums play a unique role in educational activities, culture, and tourism [1,2].
The traditional exhibition and visitation modes of museums no longer meet the needs of today’s audiences. As science and technology rapidly advance, many traditional industries, including museums, are adapting to the digital era. Museums have become more visitor-centered, prioritizing the visitor experience. Managers are keen to understand the background of visitors, their feelings during the visit, and their level of satisfaction and perceived value afterward [3,4,5]. In the information age, diverse communication methods and an ever-evolving technological environment have greatly enhanced the creativity and vitality of cultural communication in museums. This has led to significant progress in museum digitization.
Immersive technologies offer users engaging sensory experiences, encompassing visual, auditory, olfactory, and tactile elements [6]. Scholars have been very active in researching immersive technologies, focusing on virtual reality (VR), augmented reality (AR), mixed reality (MR), and three-dimensional content (3D). Li reviewed the existing literature on immersive technologies, particularly emphasizing trends in VR and user experience within museum exhibitions. He highlighted the rise of game-driven experiences and interactive 3D heritage as key areas of research [7]. Increasingly, museums are using immersive technologies, such as virtual reality (VR) and augmented reality (AR), to present history and culture in compelling ways, creating immersive environments that offer unique sensory experiences. For instance, the Shanghai Museum employs intelligent tours enhanced by VR and AR to increase visitor interaction and enrich exhibition narratives. Similarly, the Hunan Provincial Museum offers virtual experiences of its exhibitions, such as showcasing archeological findings from the “Mawangdui Han Tomb”. Nanjing Museum combines naked-eye 3D and high-precision digital 3D technologies to create a multifaceted online and offline experience, enhancing engagement and broadening the reach of knowledge dissemination. Overall, the application of these technologies significantly boosts exhibition appeal and visitor interest.
Museums are leveraging immersive technologies, such as VR, AR, and naked-eye 3D, to create more interactive and engaging exhibitions, enhancing the overall visitor experience. These technologies not only increase the appeal of museums but also modernize and broaden the dissemination of cultural heritage.
This paper integrates the TAM and flow theory to provide a more comprehensive understanding of visitors’ behavioral intentions than examining each theory in isolation. The TAM offers a framework for explaining and predicting individual technology adoption and sheds light on the psychological and behavioral factors involved in these decisions. Over time, the TAM has evolved through several iterations—TAM2, the Unified Theory of Acceptance and Use of Technology, and TAM3. Although new variables have been introduced in each version, the core elements of perceived usefulness and ease of use remain central. Through the TAM, this research explores how visitors perceive the ease of use and usefulness of immersive technologies in museums and analyzes how these perceptions influence their satisfaction and engagement. This insight allows museum managers to optimize their exhibitions, improving the overall visitor experience. Ultimately, this research not only deepens our understanding of the museum experience but also supports the effective integration of technologies, enabling museums to better cater to the needs of modern visitors.
In recent years, scholars have effectively applied this model. By incorporating flow theory, we can better capture elements related to entertainment and focus. When individuals enter a flow state, they lose track of time and self-awareness, filtering out irrelevant information to concentrate on specific goals and feedback. Visitors are likely to experience this state when engaging with immersive technologies in museums, as these technologies demand their full attention and participation. Therefore, we also employed flow theory to analyze the impact of immersive technology on visitors’ behavioral intentions.
This study combines the TAM and flow theory to develop a research model and propose relevant hypotheses. By examining how immersive technologies influence visitors’ behavioral intentions, this research seeks to offer museum managers more targeted strategies for enhancing visitor experiences and operational effectiveness.
2. Literature Review
2.1. Immersive Technology
Immersive technology, as represented in immersive technology research, allows for the “seamless” integration of natural environments or real scenarios in virtual environments. “Immersion” refers to a person’s feeling of detachment from the display while participating in a simulated environment [8]. Different scholars have defined immersive technology from various perspectives. Some scholars focus on its ability to deliver sensory information; for example, Slater defines immersive technology as a technology that provides the user with high-quality or abundant sensory input [9]. Other scholars focus on the immersive experience. Lee, Chung et al. suggest that immersive technology blurs the boundaries between the natural and virtual worlds, allowing users to step into immersive environments and experience virtual reality [10]. Barton argues that the definition of immersive technology depends on the level of immersion provided to its users [11].
Many scholars have made very detailed overview-type studies on immersive technologies. For example, Suh argues that there is currently very little academic research on the state of immersive technologies [12]. To fill this gap, he provides a detailed literature review of immersive technologies in various environments and suggests directions for future research. Pratisto’s study offers insights into the application of immersive technologies in tourism and highlights potential challenges [13]. The study encourages tourism providers to leverage these technologies to better promote tourist destinations.
In a study of the use of immersive technology, Liu focuses on how it can be used to enhance services for employers [14]. Newbutt examines the application of immersive technology within the autistic community during COVID-19 [15], aiming to assist practitioners, services, and others in overcoming the challenges faced by individuals with autism.
2.2. Technology Acceptance Model
The Theory of Reasoned Action (TRA) was proposed by Fishbein and Ajzen in 1975 [16]. The TRA states that actual behavior is determined by behavioral intention (BI), which reflects a person’s willingness to engage in a specific action. Behavioral attitude and subjective norms directly affect BI, which in turn directly determines actual behavior. Since its introduction, the TRA has garnered significant attention in academic circles, with scholars applying it to various aspects of everyday life.
The Technology Acceptance Model (TAM) was initially proposed by Fred Davis from the University of Michigan, as illustrated in Figure 1. TAM, which evolved from the TRA, is a widely recognized model for describing an individual’s acceptance of an information system. It mainly consists of four core elements: perceived usefulness, perceived ease of use, usage attitude, and behavioral intention. Perceived usefulness and ease of use are the two main factors in the TAM [17], with ease of use believed to influence perceived usefulness. The TAM shows that external variables affect both perceived usefulness and ease of use. Perceived usefulness not only affects attitude but also directly affects BI. The higher the perceived usefulness and ease of use, the more positive the user’s attitude will be. Ease of use influences perceived usefulness, which in turn indirectly affects attitudes and BI. Attitudes affect BIs, and BIs determine how users use the system.
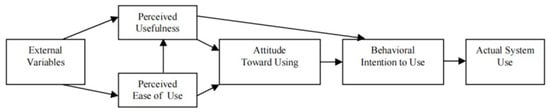
Figure 1.
Original technology acceptance model.
In recent years, scholars have applied this model extensively and with great sophistication. Chen et al. used the TAM to identify the social and psychological factors that affect the support for and adoption of smart meters [18]. Hong et al. explored preschool teachers’ acceptance of technology using a model adapted from the TAM and identified the key determinants of this acceptance [19]. Park et al. analyzed information technology acceptance in buildings based on the TAM [20], hoping to find the factors that maximize the accessibility and usefulness perceived by users. Acharya et al. extended the TAM and found that technology-related perceived data privacy and security also influence trust, attitude, and behavioral intent when using CV [21].
2.3. Flow Theory
Hungarian American psychologist Mihaly Csikszentmihalyi proposed the concept of flow in the 1975 [22]. Mihaly defines flow as the state in which a person is fully immersed in an activity, driven by intrinsic motivation, leading to a sense of pleasure and satisfaction.
Flow has been widely used across various fields, with most scholars applying flow theory in user research. Mahfouz et al. found that the theory of the mind involves multiple fields and plays a vital role in user experience [23]. Bölen et al. stated the importance of flow theory in user research to learn about the latest technology and future research agendas [24]. Yang et al. found, in a study based on flow theory, that flow is an important factor affecting the continuous intention of AR, providing a new approach to enhancing user experience [25].
Flow measurement is a complex problem; scholars have approached it in multiple ways. Ghani, Supnick, et al. concentrated on measuring two key aspects of flow: enjoyment and concentration [26]. Huang believes that flow problems can be solved through four structures: control, attention focus, curiosity, and intrinsic interest [27]. Li and Browne used four dimensions to measure focused attention, power, curiosity, and temporal dissociation [28]. In 2002, Koufaris proposed measuring perceived enjoyment, perceived control, and concentration as key components of flow. Lu uses perceived enjoyment and concentration to measure flow [29]. Scholars studying flow typically focus on measuring enjoyment, concentration, perceived control, and curiosity. In this study, I decided not to include curiosity as a research dimension when exploring the effects of flow theory on attitude and satisfaction, based on several key considerations. While curiosity is a crucial psychological factor that stimulates exploration and engagement, it is primarily associated with initial interest and motivation rather than being a core element of the flow experience. Jackson highlighted that curiosity mainly influences an individual’s decision to begin an activity, whereas the flow state develops during the activity itself. When museum visitors engage with immersive technology, their flow state emerges as a deeper psychological experience once they have already started and become invested in the activity. Additionally, previous research by Lu and Koufaris did not include curiosity as a dimension of flow theory [30,31]. Introducing curiosity might divert attention from the core aspects of flow and compromise the depth of analysis. Therefore, this study focuses on three key dimensions to measure flow: perceived enjoyment, concentration, and perceived control.
3. Hypothesis
3.1. The Relationship Among Perceived Usefulness, Perceived Ease of Use, Attitude, and Behavior Intention
The assumptions of this study regarding perceived usefulness, perceived ease of use, attitudes, and BIs are based on the suggestions of Davis, et al. [32]. In this study, perceived usefulness refers to the extent to which visitors believe immersive technology enhances their ability to complete tasks. In contrast, perceived ease of use refers to the extent to which visitors find immersive technology easy to use. When visitors perceive the museum’s immersive technology to be useful, their willingness to visit significantly increases. Previous studies have consistently shown that perceived ease of use has a direct effect on perceived usefulness, and attitude has a direct impact on BI. Combined with the relevant studies mentioned above, this study proposes the following hypotheses:
H1a.
Perceived ease of use has a positive effect on perceived usefulness.
H1b.
Perceived usefulness has a positive effect on attitude.
H1c.
Perceived ease of use has a positive effect on attitude.
H1d.
Perceived usefulness has a positive effect on BI.
H1e.
Attitude has a positive effect on BI.
3.2. The Relationship Among Perceived Usefulness, Perceived Ease of Use, and Satisfaction
From the perspective of satisfaction, Park et al. found that customer satisfaction is positively affected by perceived usefulness [33]. Similarly, further studies by Lee et al. prove that satisfaction is positively affected by perceived usefulness [34]. Chiu, Hsu, Sun, Lin, and Sun found that user satisfaction is key in determining the willingness to continue using a service [35]. In the context of museums, visitor satisfaction is highly influenced by the technology employed [36,37]. Previous studies have consistently demonstrated that perceived usefulness has a direct impact on both satisfaction and loyalty.
Rezaei’s findings show that perceived ease of use has a positive impact on satisfaction, and user satisfaction goes up when users perceive the technology they are using to be effortless and easy to learn and understand [38]. When using a new technology, users generally assess its complexity and potential challenges. Dissatisfaction arises when users find the technology difficult and time-consuming to use. Conversely, if the technology is easy to use and requires minimal time, it can enhance user satisfaction. Previous studies have consistently shown that perceived ease of use directly affects satisfaction. Based on the above related studies, the following hypotheses are proposed in this study:
H2a.
Perceived usefulness has a positive effect on satisfaction.
H2b.
Perceived ease of use has a positive effect on satisfaction.
3.3. The Relationship Among Flow, Attitude, and Satisfaction
Immersive technology can provide users with great enjoyment. As a result, perceived enjoyment enhances visitors’ emotional attitudes toward the technology and increases their willingness to visit the museum. Concentration is another critical component of the flow experience.
To enter a flow state, users must focus on a specific, limited area. If they attempt to multitask, their focus will be disrupted, preventing them from achieving a flow experience [26,30]. The higher the skill level, the greater the sense of control, leading to a heightened psychological state. On the other hand, if the user’s skill level is low, the user will feel inadequate and frustrated, leading to a low flow level. Visitors who feel immersed by the technology are more likely to be in a flow state. Perceived enjoyment, concentration, and perceived control will positively impact their attitude. Based on the related studies discussed above, this study proposes the following hypotheses:
H3a.
Perceived enjoyment has a positive effect on attitude.
H3b.
Concentration has a positive effect on attitude.
H3c.
Perceived control has a positive effect on attitude.
H3d.
Perceived enjoyment has a positive effect on satisfaction.
H3e.
Concentration has a positive effect on satisfaction.
H3f.
Perceived control has a positive effect on satisfaction.
3.4. The Relationship Between Satisfaction and Behavior Intention
Satisfaction is often seen as the buyer’s evaluation of a product’s quality and various aspects after its use. If the reviews are positive, then customer satisfaction is high. In tourism, attitude reflects a behavioral tendency, while satisfaction is a measure of whether a tourist’s psychological expectations have been met, both qualitatively and quantitatively. Satisfaction, dissatisfaction, and the degree of either can significantly influence the development of behavioral tendencies.
In previous studies, customer satisfaction positively impacts several aspects, such as buyback willingness, word-of-mouth behavior, repeat patronage, willingness to pay or pay more, and retention. Heung found that dining satisfaction significantly impacts BI, especially the intention to patronize restaurants again and recommend restaurants [39]. González-Viralta found that satisfaction positively impacts loyalty, word-of-mouth, and willingness to pay. At the same time, customer satisfaction with the product or service experience can firmly lock in the customer’s BI [40]. Based on the related studies discussed above, this study proposes the following hypotheses:
H4.
Satisfaction has a positive effect on BI.
4. Methodology
To enhance museum development in China and raise local museums to international standards, the Chinese government launched a joint initiative on 18 November 2009, involving the construction of state-level key museums by both central and regional governments. These museums were designated by the Ministry of Finance and the State Administration of Cultural Heritage, with support from both central and provincial governments. The goal is to showcase Chinese civilization, highlight Chinese cultural values, and meet international standards. Key national museums were constructed through this initiative, including the Shanghai Museum, Nanjing Museum, Hunan Museum, Liaoning Museum, Henan Museum, Shaanxi History Museum, Hubei Museum, and Zhejiang Museum. All eight museums incorporate immersive technology to enhance visitor experiences. For example, the Shanghai Museum allows visitors to use their own VR headsets to explore virtual spaces. At the Nanjing Museum, visitors can view cultural relics from multiple angles using naked-eye 3D technology. The Hunan Provincial Museum employs multimedia 3D images to transport visitors to different historical eras, while the Liaoning Provincial Museum offers 3D digital displays of exhibits from various perspectives. Henan Museum utilizes VR and other technologies to visualize cultural heritage and historical data. Visitors to the Shaanxi History Museum can wear advanced AR glasses to immerse themselves in historical narratives, while the Hubei Provincial Museum uses 3D simulations to bring cultural relics to life. The Zhejiang Provincial Museum combines 3D modeling, digital twin technology, and real-time cloud rendering to create a digital experience of cultural artifacts.
The measurement scales and items are derived from TAM and existing studies [3,22,32]. Questionnaires were distributed offline from 20 September 2023 to 20 October 2023 in Shanghai Museum, Nanjing Museum, Hunan Museum, Liaoning Museum, Henan Museum, Shaanxi History Museum, Hubei Museum, and Zhejiang Museum.
The questionnaire included the title, introduction, demographic information, the impact of visitors’ acceptance of immersive technology in museums on their willingness to revisit, and a conclusion. The questionnaire was divided into several parts: the first focuses mainly on demographic characteristics and basic information. According to the research of Yang and Zhang [41], this study considered demographic characteristics such as gender, age, occupation, and educational background. Cheng’s study shows that the frequency of technology use should also be considered, which was set as a multiple-choice question [42]. In the second part, a five-point Likert scale was used to measure factors influencing visitors’ acceptance of immersive technology, their psychological experience, and its impact on their BIs toward museum visits. Respondents rated their agreement on a scale from low to high, with three indicating neutral, four agreeing, and five strongly agreeing (Table 1). The full questionnaire can be found in Appendix A.

Table 1.
Variable measurement scale.
5. Data Analysis
The sample size was calculated using the formula n = z2σ2/d2, where Z represents the confidence interval, n is the sample size, d denotes the sampling error range, and σ is the standard deviation, typically set to 0.5. In this study, simple random sampling was adopted, which is effective in ensuring that everyone in the population has the same probability of being selected to respond [47]. Under the condition of simple random sampling, the sample size was calculated according to n = z2σ2/d2, with a sampling error of no more than 5% at a 95% confidence level, Z = 1.96, σ = 0.5, d = 5%. Therefore, n = 1.962 × 0.52/5%2 = 384, indicating that the minimum sample size required for this survey was 384. Considering the actual number of visitors to the museum halls, 800 questionnaires were prepared for distribution, divided equally, with 100 questionnaires distributed to each museum. A total of 880 questionnaires were distributed in total, before removing incomplete answers and questionnaires with obvious logical errors. After removing incomplete answers and questionnaires with obvious logical errors, 806 valid questionnaires were recovered, with a validity rate of 91.6%.
We analyzed the personal information of the 806 samples to understand the population distribution of the study sample. After sorting out the questionnaire samples, we found that 391 males and 415 females participated in the survey, accounting for 48.51% and 51.49% of the total number of respondents, respectively. This indicates that there were slightly more female participants than males. From the perspective of age, the respondents were mainly 41–48 years old, accounting for 32.75%, followed by 224 people aged 29–40, accounting for 27.79%. These data indicate that museum visitors are predominantly middle-aged. In terms of occupation, 26.30% of respondents were cultural, educational, and scientific researchers, likely due to the artistic nature of museums. In terms of education, most of the respondents were undergraduates and college students, accounting for 45.16% of the respondents, which means that museum visits are more popular among undergraduates and college students. Regarding monthly income, most respondents earned between 5000 and 7999 CNY, accounting for more than 34.12%, which indicates that people with higher incomes are willing to visit museums. The survey involved respondents with diverse characteristics in terms of gender, age, education, occupation, and monthly income.
6. Results
Cronbach’s alpha test was conducted to confirm whether the questionnaire met the reliability standards. According to the measurement results, the Cronbach’s alpha coefficients were higher than 0.8, indicating that the questionnaire used in this study had good reliability.
After that, the convergence validity and discriminative validity were evaluated. It can be seen from Table 2 that average variance extraction (AVE) and composite reliability (CR) are higher than 0.5 (AVE) and 0.7 (CR), respectively, indicating the convergence validity of this study.
Table 2.
Results of convergence validity analysis.
A variable is considered to have good discriminant validity when the square root of its average variance extracted (AVE) is greater than the correlation coefficients between that variable and others. As shown in Table 3, an advanced statistic program analysis of this study’s correlation coefficient matrix output showed that the measurement structure and items have sufficient discriminative validity.
Table 3.
Correlation and discriminant validity.
Structural equation modeling (SEM) is often used to describe the relationship between observed variables and it allows for the better validation of theoretical models, thus testing and extending the study’s theories [48]. In this study, the questionnaire was analyzed using SEM, which is considered a popular method in academia [49]. Model fit verification showed a chi-square/df value of 2.734 (<5), CFI of 0.958 (>0.9), IFI of 0.958 (>0.9), and RMSEA of 0.046 (<0.1). This means that the fitting index of the model meets the requirements. The maximum likelihood estimation method was used in this study.
As shown in Table 4, after analyzing the relationships among perceived usefulness, perceived ease of use, perceived enjoyment, concentration, perceived control, attitude, satisfaction, and BI, the following results were obtained.
Table 4.
Results of hypothesis testing.
As can be seen from Figure 2, perceived ease of use positively affects perceived usefulness (H1a is established). Perceived usefulness positively affects BI (H1d was established); perceived usefulness, perceived ease of use, perceived enjoyment, and attention positively affect visitors’ attitudes and satisfaction (H1b, H1c, H3a, and H3b were established); perceived usefulness, visitors’ attitudes, and visitor satisfaction and willingness to visit are significantly positively related, and the hypothesis is valid (H2a, H2b, H3d and H3e are valid). Attitude and satisfaction positively affect BI (H1e and H4 were established). However, perceived control has no significant effect on visitors’ attitudes and satisfaction, so the hypothesis is invalid (H3c and H3f are not valid) (Figure 3).
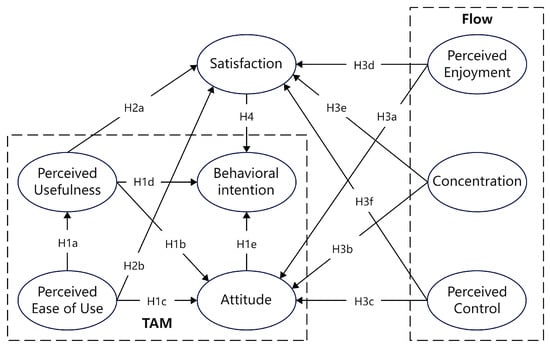
Figure 2.
Conceptual framework and hypotheses of this research.
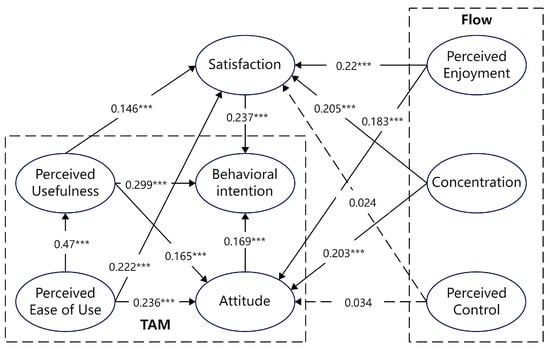
Figure 3.
Hypothesis testing results. Note: *** p < 0.001.
7. Discussion, Conclusions, Recommendations, and Limitations
7.1. Discussion
The primary purpose of this study was to explore the factors through which the use of immersive technology in museums influences visitors’ BIs. Through a structural equation model analysis of visitors’ BI, it was found that perceived usefulness, satisfaction, and attitude have a significant positive influence on BI. Considering the actual situation, it is evident that visitors perceived the museum’s immersive technology to be both practical and user-friendly during their visits. When visitors perceive immersive technology as both useful and easy to use, their attitudes and satisfaction levels tend to be more positive. Likewise, when visitors find enjoyment in using immersive technology and remain engaged, their attitudes and satisfaction improve as well. This makes then more willing to visit the museum. However, perceived control does not significantly impact visitors’ attitudes and satisfaction with immersive technology. This could be because some visitors prefer traditional museum experiences, show little interest in immersive technology, or even resist it, leading them to base their attitudes and satisfaction on the traditional exhibition content instead. In addition, factors in the museum environment may also affect visitors’ attitudes and satisfaction, and if visitors feel uncomfortable, this may affect their attitudes and overall satisfaction.
Perceived ease of use has a significant positive impact on the perceived usefulness of museum digital technologies. When visitors find the immersive technology easy to use, they can access information more quickly and smoothly. As a result, they are more likely to view the technology as helpful. Perceived usefulness, perceived ease of use, perceived enjoyment, and focus significantly impact visitors’ satisfaction with and attitude toward technology. When visitors find digital technologies in the museum easy to use, valuable, and enjoyable, and they can focus during their experience, they develop more positive attitudes and a preference for using these technologies. This, in turn, influences their future BIs. When visitors recognize the advantages of immersive technology and feel it meets their needs and brings satisfaction, they are more likely to return in the future. The findings show that greater enjoyment and focus on immersive technology can improve visitor attitudes and satisfaction. Museums should enhance the entertainment value of immersive technology and reduce interference factors; for example, enriching exhibitions’ expression and improving visitor immersion.
This study makes two main contributions. First, it explores the acceptance of immersive technology by museum visitors. In the existing literature, it is easy to find that most researchers pay attention to digital museums rather than the immersive technology in museums. Digital museums refer to online virtual museums, such as websites and mini-programs. Researchers are more inclined to explore the attitude and satisfaction of visitors from the perspectives of service quality, information quality, and security. However, this study focuses on the use of immersive technology in offline museums, a topic that has received little attention from researchers. It combines the TAM and flow theory to explain users’ BIs.
7.2. Conclusions
Based on the TAM, this study established a comprehensive model of visitors’ satisfaction, attitude, and BI by reviewing the existing literature. The study adopted Fred D. Davis’s 1986 TAM and incorporated three dimensions of flow theory into the model. Finally, the paper constructed a model of the aspects of immersive technology in museums that influence visitors’ BI, and verified this conceptual model through empirical research.
The data show that perceived usefulness, ease of use, enjoyment, and concentration significantly positively affect visitors’ satisfaction and attitudes toward technology. However, perceived control does not significantly influence visitors’ satisfaction or attitudes toward technology. In contrast, perceived usefulness, satisfaction, and attitude all have a significant positive effect on BI. Additionally, perceived ease of use positively impacts perceived usefulness. This study also confirms the findings of previous research on the TAM [20,50], demonstrating that the immersive technology used in museums can attract visitors by being easy to use and user-friendly. The results show that perceived usefulness and ease of use significantly influence visitors’ attitudes and satisfaction with immersive technology, which aligns with expectations.
This study supports the findings of previous research [51,52], confirming that the two dimensions of flow theory—perceived entertainment and concentration—positively impact visitors’ attitudes and satisfaction with immersive technology. However, the limited sample size and lack of diversity in this study may reduce the significance of perceived control regarding these factors. Since the sample was confined to a domestic context, it did not include international participants from varying cultural, economic, and social backgrounds, which could affect the study’s generalizability. Future research should aim to increase the sample size and incorporate more diverse geographical, cultural, and social backgrounds to better validate the effect of perceived control on attitudes and satisfaction, ultimately enhancing the broader applicability of the results. In addition, visitors’ attitudes toward immersive technology positively impact their willingness to visit museums, which is also consistent with previous research. The effect of visitor satisfaction with immersive technology on museum visit intentions is also supported by previous research. Finally, the impact of visitors’ attitudes and satisfaction with digital technologies on their willingness to visit aligns with the findings of previous studies. The findings on the determinants of visitor attitudes toward immersive technology strongly support this model. All hypotheses were confirmed except for the effect of perceived control on attitudes and satisfaction. This indicates that each factor positively influenced visitors’ attitudes, satisfaction, and BIs regarding immersive technology.
7.3. Recommendations
The empirical findings on the impact of immersive technology in museums show that visitors’ perceptions of its usefulness and ease of use significantly influence their attitudes and satisfaction with the technology. Additionally, perceived entertainment and concentration also play a role in shaping visitors’ attitudes and satisfaction. Perceived usefulness reflects how well the technology meets visitors’ needs, while perceived ease of use aims to enhance their overall experience. Based on these conclusions, museum management can implement specific strategies to optimize the use of digital and immersive technologies, thereby improving visitors’ behavioral intentions, satisfaction, and overall attitudes. Museum management should simplify the use of immersive technology to enhance its accessibility. Streamlining operations can ensure a smooth and user-friendly experience for visitors. By reducing potential frustration, visitors can focus more on their experience, ultimately boosting their satisfaction with and overall attitude towards the museum. In addition, enriching the content by providing diverse information about the exhibits, as well as background stories and interactive elements, can help visitors gain more knowledge and make immersive technology even more valuable. It is also essential that the design of these technologies caters to a wide range of visitors, including different age groups and those with varying physical conditions, ensuring that they are accessible and easy to use for everyone. Finally, museum management can implement specific strategies to further optimize the application of immersive technology, thereby improving the behavioral intentions, satisfaction, and attitude of visitors. Not only does this attract more visitors, but it also generates greater social and economic benefits for the museum.
7.4. Limitations
This study developed a model that explores the factors influencing visitors’ BI regarding the use of immersive technology in museums. However, the research has certain limitations that should be addressed in future studies. Due to constraints on time, energy, and budget, data were collected from only eight museums. To achieve more comprehensive and reliable results, future research should aim to increase the sample size, enhancing the diversity and representativeness of the findings.
Author Contributions
Conceptualization, Q.L. and C.S.; methodology, Q.L. and C.S.; software, Q.L.; validation, Q.L.; formal analysis, Q.L.; investigation, Q.L.; resources, Q.L.; data curation, Q.L.; writing—original draft preparation, Q.L.; writing—review and editing, Q.L. and C.S.; visualization, Q.L.; supervision, C.S. All authors have read and agreed to the published version of the manuscript.
Funding
This research received no external funding.
Institutional Review Board Statement
Not applicable.
Informed Consent Statement
All participation was voluntary.
Data Availability Statement
The raw data can be requested directly from the author.
Conflicts of Interest
The authors declare no conflicts of interest.
Appendix A
Questionnaire: The impact of immersive technology in museums on visitors’ behavioral intention.
Dear friends,
Thank you very much for your participation in this survey. In order to understand whether immersive technology in museums will have an impact on visitors’ behavioral intentions, enhance the museum visitors’ experience and promote the development of museums, we have launched a research on the theme of ‘The Impact of Immersive Technology in Museums on Visitors’ Behavioral Intention’. Please answer the questions below from your own point of view according to the actual situation! The results of the survey will be used for academic research only, and the principle of anonymity will be strictly adhered to.
Immersive technology can provide users with an immersive sensory experience, including visual, auditory, olfactory, and tactile senses of these experiences, of which Virtual Reality (VR) refers to a technology that generates interactive virtual environments, which feel immersive when a person enters a simulated environment. Augmented Reality (AR) is a technology that enables users to participate in the physical world by superimposing virtual information on the same picture or space in real time through the use of digital technology to superimpose virtual objects. Mixed Reality (MR) is a further development of VR and AR technology, a marvellous state of affairs between VR and AR, which is achieved by presenting a virtual scene in a real one. Three-dimensional is a technology that allows the human eye to see three-dimensional images directly through special display technology.
- 1.
- What is your gender?
☐Female ☐Male
- 2.
- What is your age?
☐18–28 ☐29–40 ☐41–48 ☐49–55 ☐56–65 ☐Above 65
- 3.
- What is your highest educational background?
☐Middle school and below ☐High school ☐Undergraduate degree ☐Master/PHD
- 4.
- What is your personal monthly income (yuan)?
☐Below 1000 RMB ☐1000–1999 RMB ☐2000–4999 RMB ☐5000–7999 RMB
☐8000–14,999 RMB ☐Above 15,000 RMB
- 5.
- What is your occupation?
☐Civil servant ☐Enterprise management personnel
☐Cultural, educational and scientific personnel ☐Service sales personnel
☐Worker ☐Student ☐Other
- 6.
- What channels do you use to learn about immersive technologies? (You may choose more than one options)
☐TV ☐Newspapers and magazines ☐Introduction of relatives and friends
☐Internet ☐ Other
- 7.
- What kind of immersive technologies do you know? (You may choose more than one options)
☐VR ☐AR ☐3D ☐MR ☐Other
- 8.
- Which immersive technologies are you interested in? (You may choose more than one options)
☐VR ☐AR ☐3D ☐MR ☐Other
- 9.
- What immersive technologies have you utilized? (You may choose more than one options)
☐VR ☐AR ☐3D ☐MR ☐Other
- 10.
- How frequently do you use immersive technology?
☐Quite ☐Sometimes ☐Frequently
| 1. Strongly Disagree | 2. Disagree | 3. Neutral | 4. Agree | 5. Strongly Agree | ||
| Perceived Usefulness | ||||||
| (1) Immersive technology in museum has been very helpful to me. | ☐ | ☐ | ☐ | ☐ | ☐ | |
| (2) The advantages of immersive technology in museum outweigh the disadvantages. | ☐ | ☐ | ☐ | ☐ | ☐ | |
| (3) Overall, immersive technology in museum is beneficial. | ☐ | ☐ | ☐ | ☐ | ☐ | |
| (4) Using immersive technology while visiting the museum would make it easier for me to understand the museum. | ☐ | ☐ | ☐ | ☐ | ☐ | |
| Perceived Ease of Use | ||||||
| (1) Using immersive technology in museum is easy for me. | ☐ | ☐ | ☐ | ☐ | ☐ | |
| (2) It is easy for me to become skillful at using immersive technology in museum. | ☐ | ☐ | ☐ | ☐ | ☐ | |
| (3) Overall, immersive technology is easy to use. | ☐ | ☐ | ☐ | ☐ | ☐ | |
| (4) Learning to use immersive technology is easy for me. | ☐ | ☐ | ☐ | ☐ | ☐ | |
| (5) My interaction with immersive technology while visiting the museum is clear and understandable. | ☐ | ☐ | ☐ | ☐ | ☐ | |
| Attitude | ||||||
| (1) Using immersive technology in museum is a good idea. | ☐ | ☐ | ☐ | ☐ | ☐ | |
| (2) I think there are benefits to using immersive technology in museums. | ☐ | ☐ | ☐ | ☐ | ☐ | |
| (3) I like using immersive technology in museum. | ☐ | ☐ | ☐ | ☐ | ☐ | |
| (4) Using immersive technology in museum is desirable. | ☐ | ☐ | ☐ | ☐ | ☐ | |
| (5) Overall, I have a positive opinion of immersive technology. | ☐ | ☐ | ☐ | ☐ | ☐ | |
| Perceived Enjoyment | ||||||
| (1) Using immersive technology in museum stimulates my curiosity. | ☐ | ☐ | ☐ | ☐ | ☐ | |
| (2) I enjoy using immersive technology in museum. | ☐ | ☐ | ☐ | ☐ | ☐ | |
| (3) I find using immersive technology in museum interesting. | ☐ | ☐ | ☐ | ☐ | ☐ | |
| (4) Immersive technology gives me pleasure. | ☐ | ☐ | ☐ | ☐ | ☐ | |
| Concentration | ||||||
| (1) When using immersive technology in museum, I do not realize the time elapsed. | ☐ | ☐ | ☐ | ☐ | ☐ | |
| (2) When using immersive technology in museum, I am not aware of things happening around me. | ☐ | ☐ | ☐ | ☐ | ☐ | |
| (3) When using immersive technology in museum, I often forget what I have to do. | ☐ | ☐ | ☐ | ☐ | ☐ | |
| Perceived Control | ||||||
| (1) I know exactly what I am doing when using immersive technology in museum. | ☐ | ☐ | ☐ | ☐ | ☐ | |
| (2) I feel calm because I understood the process when using immersive technology in museum. | ☐ | ☐ | ☐ | ☐ | ☐ | |
| (3) I feel in control when using immersive technology in museum. | ☐ | ☐ | ☐ | ☐ | ☐ | |
| (4) I feel agitated when using immersive technology in museum. | ☐ | ☐ | ☐ | ☐ | ☐ | |
| Satisfaction | ||||||
| (1) I feel very happy using immersive technology in museum. | ☐ | ☐ | ☐ | ☐ | ☐ | |
| (2) I feel very satisfied using immersive technology in museum. | ☐ | ☐ | ☐ | ☐ | ☐ | |
| (3) I think it was a wise decision to use immersive technology in museum. | ☐ | ☐ | ☐ | ☐ | ☐ | |
| (4) My experience with immersive technology in museum went very well. | ☐ | ☐ | ☐ | ☐ | ☐ | |
| Behavioral Intention | ||||||
| (1) I am willing to visit this museum again in the near future. | ☐ | ☐ | ☐ | ☐ | ☐ | |
| (2) I will make an effort to revisit this museum in the near future. | ☐ | ☐ | ☐ | ☐ | ☐ | |
| (3) I will encourage my family, friends, and others to visit this museum. | ☐ | ☐ | ☐ | ☐ | ☐ | |
| (4) I will say positive things about this museum. | ☐ | ☐ | ☐ | ☐ | ☐ | |
References
- Malcolm, C. The Importance of Museums to Rural and Small Towns in Manitoba, Canada. J. Rural Community Dev. 2023, 18, 85–104. [Google Scholar]
- Carayannis, E.G.; Bast, G.; Campbell, D.F. Conclusion: The Museum of the Future and the Future of Museums. In The Future of Museums. Arts, Research, Innovation and Society; Springer: Cham, Switzerland, 2018; pp. 145–148. [Google Scholar]
- Kim, J.; Chan, L. The consumption of museum service experiences: Benefits and value of museum experiences. J. Hosp. Mark. Manag. 2009, 18, 173–196. [Google Scholar]
- Harrison, P.; Shaw, R. Consumer satisfaction and post-purchase intentions: An exploratory study of museum visitors. Int. J. Arts Manag. 2004, 6, 23–32. [Google Scholar]
- Rivera, M.; Semrad, K.; Croes, R. The five E’s in festival experience in the context of Gen Y: Evidence from a small island destination. Rev. Española Investig. Mark. ESIC 2015, 19, 95–106. [Google Scholar] [CrossRef][Green Version]
- Soliman, M.; Peetz, J.; Davydenko, M. The impact of immersive technology on nature relatedness and pro-environmental behavior. J. Media Psychol. 2017, 29, 8–17. [Google Scholar] [CrossRef]
- Li, J.; Wider, W.; Ochiai, Y.; Fauzi, M.A. A bibliometric analysis of immersive technology in museum exhibitions: Exploring user experience. Front. Virtual Real. 2023, 4, 1240562. [Google Scholar] [CrossRef]
- Radianti, J.; Majchrzak, T.A.; Fromm, J.; Wohlgenannt, I. A systematic review of immersive virtual reality applications for higher education: Design elements, lessons learned, and research agenda. Comput. Educ. 2020, 147, 103778. [Google Scholar] [CrossRef]
- Slater, M.; Lotto, B.; Arnold, M.M.; Sanchez-Vives, M.V. How we experience immersive virtual environments: The concept of presence and its measurement. Anu. Psicol. 2009, 40, 193–210. [Google Scholar]
- Lee, L.G.; Chung, J.H. A Study on VR Game Production Techniques to Improvement of Visual Immersion. J. Digit. Converg. 2021, 19, 457–462. [Google Scholar]
- Barton, A.C.; Sheen, J.; Byrne, L.K. Immediate attention enhancement and restoration from interactive and immersive technologies: A scoping review. Front. Psychol. 2020, 11, 2050. [Google Scholar] [CrossRef]
- Suh, A.; Prophet, J. The state of immersive technology research: A literature analysis. Comput. Hum. Behav. 2018, 86, 77–90. [Google Scholar] [CrossRef]
- Pratisto, E.H.; Thompson, N.; Potdar, V. Immersive technologies for tourism: A systematic review. Inf. Technol. Tour. 2022, 24, 181–219. [Google Scholar] [CrossRef]
- Liu, R.; Peng, C.; Zhang, Y.; Husarek, H.; Yu, Q. A survey of immersive technologies and applications for industrial product development. Comput. Graph. 2021, 100, 137–151. [Google Scholar] [CrossRef]
- Newbutt, N.; Schmidt, M.M.; Riva, G.; Schmidt, C. The possibility and importance of immersive technologies during COVID-19 for autistic people. J. Enabling. Technol. 2020, 14, 187–199. [Google Scholar] [CrossRef]
- Fishbein, M.; Ajzen, I. Belief, Attitude, Intention, and Behavior: An Introduction to Theory and Research; Addison-Wesley: Reading, MA, USA, 1977. [Google Scholar]
- Venkatesh, V.; Davis, F.D. A theoretical extension of the technology acceptance model: Four longitudinal field studies. Manag. Sci. 2000, 46, 186–204. [Google Scholar] [CrossRef]
- Chen, C.F.; Xu, X.; Arpan, L. Between the technology acceptance model and sustainable energy technology acceptance model: Investigating smart meter acceptance in the United States. Energy Res. Soc. Sci. 2017, 25, 93–104. [Google Scholar] [CrossRef]
- Hong, X.; Zhang, M.; Liu, Q. Preschool teachers’ technology acceptance during the COVID-19: An adapted technology acceptance model. Front. Psychol. 2021, 12, 691492. [Google Scholar] [CrossRef]
- Park, E.S.; Park, M.S. Factors of the technology acceptance model for construction IT. Appl. Sci. 2020, 10, 8299. [Google Scholar] [CrossRef]
- Acharya, S.; Mekker, M. Public acceptance of connected vehicles: An extension of the technology acceptance model. Transp. Res. Part F Traffic Psychol. Behav. 2022, 88, 54–68. [Google Scholar] [CrossRef]
- Csikszentmihalyi, M. Beyond Boredom and Anxiety: The Experience of Play in Work and Games; Jossey-Bass: San Francisco, CA, USA, 1975; p. 75. [Google Scholar]
- Mahfouz, A.Y.; Joonas, K.; Opara, E.U. An overview of and factor analytic approach to flow theory in online contexts. Technol. Soc. 2020, 61, 101228. [Google Scholar] [CrossRef]
- Bölen, M.C.; Calisir, H.; Özen, Ü. Flow theory in the information systems life cycle: The state of the art and future research agenda. Int. J. Consum. Stud. 2021, 45, 546–580. [Google Scholar] [CrossRef]
- Yang, H.; Lee, H. Users’ continuance intention toward augmented reality from the flow theory perspective. Int. J. Mob. Commun. 2023, 21, 385–409. [Google Scholar] [CrossRef]
- Ghani, J.A. The experience of flow in computer-mediated and in face-to-face groups. In Proceedings of the Twelfth International Conference on Information Systems, New York, NY, USA, 16–18 December 1991. [Google Scholar]
- Huang, M.H. Designing website attributes to induce experiential encounters. Comput. Hum. Behav. 2003, 19, 425–442. [Google Scholar] [CrossRef]
- Li, D.; Browne, G.J. The role of need for cognition and mood in online flow experience. J. Comput. Inf. Syst. 2006, 46, 11–17. [Google Scholar]
- Jackson, S.A. Flow. In The Oxford Handbook of Human Motivation, 2nd ed.; Richard, R., Ed.; Oxford University Press: Oxford, UK, 2012; pp. 127–140. [Google Scholar]
- Lu, Y.; Zhou, T.; Wang, B. Exploring Chinese users’ acceptance of instant messaging using the theory of planned behavior, the technology acceptance model, and the flow theory. Comput. Hum. Behav. 2009, 25, 29–39. [Google Scholar] [CrossRef]
- Koufaris, M. Applying the technology acceptance model and flow theory to online consumer behavior. Inf. Syst. Res. 2002, 13, 205–223. [Google Scholar] [CrossRef]
- Davis, F.D. Perceived usefulness, perceived ease of use, and user acceptance of information technology. MIS Q. 1989, 13, 319–340. [Google Scholar] [CrossRef]
- Park, E.; Kim, K.J.; Del Pobil, A.P. An examination of psychological factors affecting drivers’ perceptions and attitudes toward car navigation systems. In IT Convergence and Security 2012; Springer: Amsterdam, The Netherlands, 2013. [Google Scholar]
- Lee, T.; Jun, J. Contextual perceived value? Investigating the role of contextual marketing for customer relationship management in a mobile commerce context. Bus. Process Manag. J. 2007, 13, 798–814. [Google Scholar] [CrossRef]
- Chiu, C.M.; Hsu, M.H.; Sun, S.Y.; Lin, T.C.; Sun, P.C. Usability, quality, value and e-learning continuance decisions. Comput. Educ. 2005, 45, 399–416. [Google Scholar] [CrossRef]
- Martín-Ruiz, D.; Castellanos-Verdugo, M.; de los Ángeles Oviedo-García, M. A visitors’ evaluation index for a visit to an archaeological site. Tour. Manag. 2010, 31, 590–596. [Google Scholar] [CrossRef]
- Jiang, Q.; Chen, J.; Wu, Y.; Gu, C.; Sun, J. A study of factors influencing the continuance intention to the usage of augmented reality in museums. Systems 2022, 10, 73. [Google Scholar] [CrossRef]
- Rezaei, S.; Amin, M. Exploring online repurchase behavioural intention of university students in Malaysia. J. Glob. Bus. Adv. 2013, 6, 92–119. [Google Scholar] [CrossRef]
- Heung, V.C.; Gu, T. Influence of restaurant atmospherics on patron satisfaction and behavioral intentions. Int. J. Hosp. Manag. 2012, 31, 1167–1177. [Google Scholar] [CrossRef]
- González-Viralta, D.; Veas-González, I.; Egaña-Bruna, F.; Vidal-Silva, C.; Delgado-Bello, C.; Pezoa-Fuentes, C. Positive effects of green practices on the consumers’ satisfaction, loyalty, word-of-mouth, and willingness to pay. Heliyon 2023, 9, e20353. [Google Scholar] [CrossRef] [PubMed]
- Yang, X.; Zhang, L. Smart tourism technologies towards memorable experiences for museum visitors. Tour. Rev. 2022, 77, 1009–1023. [Google Scholar] [CrossRef]
- Cheng, A.; Ma, D.; Pan, Y.; Qian, H. Enhancing museum visiting experience: Investigating the relationships between augmented reality quality, immersion, and TAM using PLS-SEM. Int. J. Hum. Comput. Interact. 2023, 40, 4521–4532. [Google Scholar] [CrossRef]
- Moon, J.W.; Kim, Y.G. Extending the TAM for a World-Wide-Web context. Inf. Manag. 2001, 38, 217–230. [Google Scholar] [CrossRef]
- Susanto, A.; Chang, Y.; Ha, Y. Determinants of continuance intention to use the smartphone banking services: An extension to the expectation-confirmation model. Ind. Manag. Data Syst. 2016, 116, 508–525. [Google Scholar] [CrossRef]
- Hong, S.; Thong, J.Y.; Tam, K.Y. Understanding continued information technology usage behavior: A comparison of three models in the context of mobile internet. Decis. Support Syst. 2006, 42, 1819–1834. [Google Scholar] [CrossRef]
- Han, H.; Hyun, S.S. Key factors maximizing art museum visitors’ satisfaction, commitment, and post-purchase intentions. Asia Pac. J. Tour. Res. 2017, 22, 834–849. [Google Scholar] [CrossRef]
- Noor, S.; Tajik, O.; Golzar, J. Simple random sampling. Int. J. Educ. Lang. Stud. 2022, 1, 78–82. [Google Scholar]
- Thakkar, J.J. Structural equation modelling. In Application for Research Practice; Springer: Berlin/Heidelberg, Germany, 2020. [Google Scholar]
- Mustafa, M.B.; Nordin, M.B.; Razzaq, A.B.A. Structural equation modelling using AMOS: Confirmatory factor analysis for taskload of special education integration program teachers. Univ. J. Educ. Res. 2020, 8, 127–133. [Google Scholar] [CrossRef]
- Weng, F.; Yang, R.J.; Ho, H.J.; Su, H.M. A TAM-based study of the attitude towards use intention of multimedia among school teachers. Appl. Syst. Innov. 2018, 1, 36. [Google Scholar] [CrossRef]
- Kim, D.; Ko, Y.J. The impact of virtual reality (VR) technology on sport spectators’ flow experience and satisfaction. Comput. Hum. Behav. 2019, 93, 346–356. [Google Scholar] [CrossRef]
- Zhang, R.; Abd Rahman, A. Dive in the flow experience: Millennials’ tech-savvy, satisfaction and loyalty in the smart museum. Curr. Issues Tour. 2022, 25, 3694–3708. [Google Scholar] [CrossRef]


Disclaimer/Publisher’s Note: The statements, opinions and data contained in all publications are solely those of the individual author(s) and contributor(s) and not of MDPI and/or the editor(s). MDPI and/or the editor(s) disclaim responsibility for any injury to people or property resulting from any ideas, methods, instructions or products referred to in the content. |
© 2024 by the authors. Licensee MDPI, Basel, Switzerland. This article is an open access article distributed under the terms and conditions of the Creative Commons Attribution (CC BY) license (https://creativecommons.org/licenses/by/4.0/).