


Supply Chain Stability and Enterprises’ Total Factor Productivity: From the Perspective of Development Sustainability

Abstract
:1. Introduction
- (1)
- Expanding the research on the factors influencing enterprise total factor productivity from the perspective of supply chain security, highlighting the crucial role of supply chain security in boosting the total factor productivity of core enterprises.
- (2)
- Offering a comprehensive framework for enterprises to maintain supply chain security and stability by focusing on both supply and demand aspects, emphasizing the importance of upstream and downstream partnerships within the supply chain network for maintaining dynamic stability.
- (3)
- Enriching the research on the economic outcomes of supply chain stability by revealing how it enhances enterprise total factor productivity through improved operational management and optimized resource allocation.
- (4)
- Providing clear guidance for enterprises of different ownership types, regions, and sizes. Non-state-owned enterprises should focus on building stable, long-term supply chain relationships to reduce uncertainty and ensure resource access and operational stability. For enterprises in China’s eastern region, leveraging the favorable economic environment and mature supply chains can enhance the positive impact of supply chain stability on productivity. Large-size enterprises should form strategic partnerships with supply chain partners to foster collaboration, enhance risk capacity, improve efficiency, and maximize scale advantages.
- (5)
- Drawing on social capital theory, this study explores the effect of supply chain stability on firms’ total factor productivity, thereby extending the application of social capital theory within the context of supply chain relationships and corporate management research.
2. Theoretical Analysis and Research Hypotheses
2.1. Supply Chain Stability and Total Factor Productivity of Enterprises
2.2. Technological Progress Effects
2.3. Resource Allocation Effects
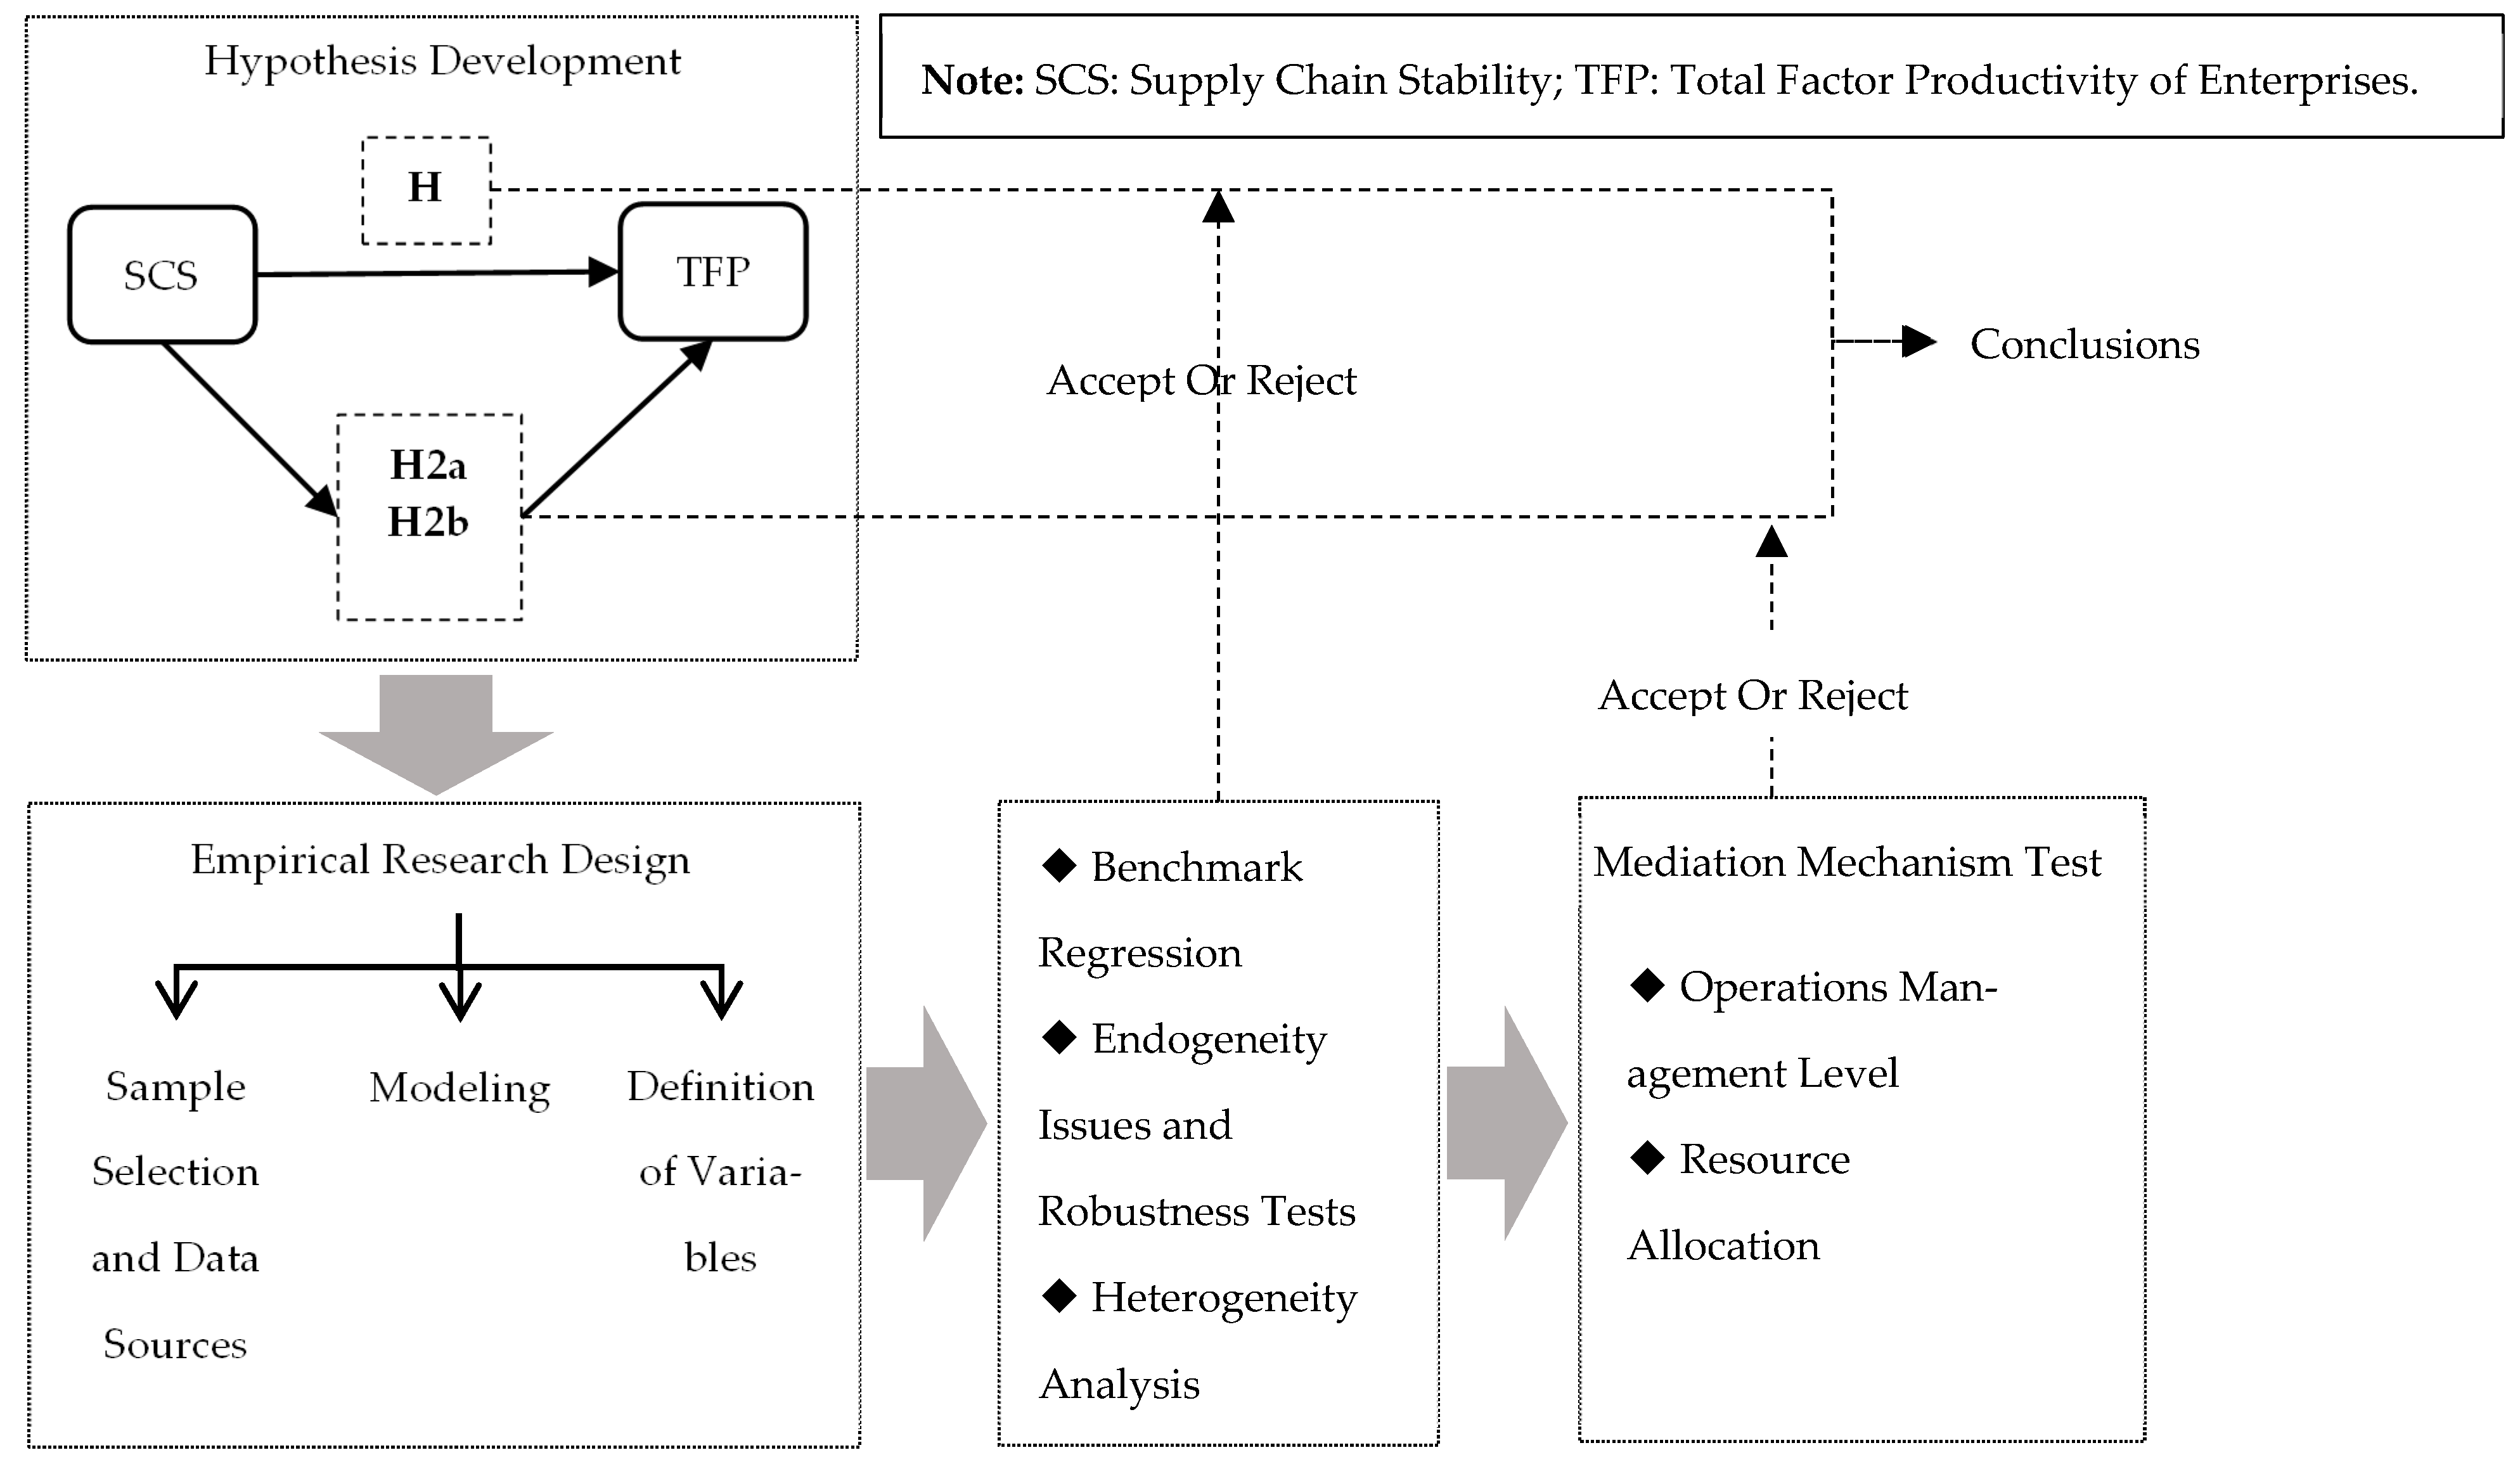
3. Empirical Research Design
3.1. Sample Selection and Data Sources
3.2. Modeling
3.3. Definition of Variables
3.3.1. Explained Variable: Total Factor Productivity of Enterprises
3.3.2. Explanatory Variable: Supply Chain Stability
3.3.3. Control Variable
4. Empirical Results and Analyses
4.1. Benchmark Regression
4.2. Endogeneity Issues and Robustness Tests
4.2.1. Endogenous Issues
- (1)
- Heckman Two-Stage Regression
- (2)
- Instrumental Variable Approach
4.2.2. Robustness Check
- (1)
- Alternative Methods: We re-calculate firms’ total factor productivity (Tfp_op, Tfp_gmm) using two alternative methods: the Olley–Pakes (OP) method and the generalized method of moments (GMM), as shown in columns (1) and (2) of Table 4.
- (2)
- Adjusting for COVID-19 Impact: Due to the significant disruption of global supply chains and business operations caused by the COVID-19 pandemic in 2020, we shorten the sample period and exclude data from 2020 onwards, as indicated in column (3) of Table 4.
- (3)
- Outlier Treatment: We further winsorize all continuous variables at the 2% and 5% levels, respectively, to minimize the impact of outliers, as detailed in columns (4) and (5) of Table 4.

| (1) | (2) | (3) | (4) | (5) | |
|---|---|---|---|---|---|
| Tfp_op | Tfp_gmm | tfp_lp | Tfp_lp | Tfp_lp | |
| Chainst1 | 0.027 *** | 0.030 *** | 0.032 *** | 0.023 *** | 0.018 ** |
| (3.581) | (3.557) | (3.614) | (3.147) | (2.529) | |
| CVs | Yes | Yes | Yes | Yes | Yes |
| ID | Yes | Yes | Yes | Yes | Yes |
| Year | Yes | Yes | Yes | Yes | Yes |
| N | 13,849 | 13,849 | 9791 | 13,849 | 13,849 |
| R2 | 0.504 | 0.411 | 0.578 | 0.592 | 0.586 |
5. Further Analysis
5.1. Impact Mechanism Testing
5.1.1. Supply Chain Stability, Operations Management Level, and Enterprise Total Factor Productivity
5.1.2. Supply Chain Stability, Resource Allocation, and Total Factor Productivity of Firms
5.2. Heterogeneity Analysis
5.2.1. Heterogeneity Analysis Based on the Nature of Business Ownership
5.2.2. Heterogeneity Analysis Based on the Region to Which the Firm Belongs
5.2.3. Heterogeneity Analysis Based on Firm Size
6. Conclusions and Insights
- (1)
- Enterprises need to establish an awareness of supply chain security and strive to build safe and reliable supply chain networks, promoting development through security and pursuing sustainable development paths. Supply chain risks are transmissive, with safety issues affecting the entire chain. The pursuit of short-term economic benefits by enterprises today is unadvisable. For enterprises to thrive in risk environments and attain high-quality long-term development, they must build strong partnerships within their upstream and downstream networks and improve the efficiency and stability of transferring both explicit and implicit resources between firms. Additionally, stable supply chain relationships do not mean static ones; rather, core enterprises must maintain dynamic stability in their upstream and downstream relationships based on their strategic development needs. This requires firms to continuously enhance their core competitiveness and supply chain discourse power, thereby having the ability to build stable supply chain relationships and choose partners.
- (2)
- Based on the mechanism testing results of this study, firms should focus on effective communication and integrated management with upstream and downstream enterprises in their daily operations, continuously optimizing resource allocation, reducing redundant costs, and increasing innovation investment to enhance economic efficiency. Furthermore, firms should manage supply chain risks based on their specific characteristics. Non-state-owned enterprises, those located in eastern regions, and large-scale enterprises should leverage the stability of supply chain relationships to enhance their total factor productivity and drive sustainable development.
- (3)
- Governments must understand the urgency of industrial and supply chain security with a bottom-line thinking approach, making the balance between development and security the main theme of economic governance. In the international environment, great power competition, wars, geopolitical issues, and public health crises threaten global industrial and supply chain security. Governments, as administrative bodies, should actively deepen international cooperation on industrial and supply chain security and stability, safeguard the common interests of countries, and firmly oppose the trend of “de-globalization.” Domestically, governments should refine industrial policies related to secure development and enhance governance capabilities for industrial and supply chain security. By creating a favorable development environment for market entities and accelerating the establishment of a new development pattern that prioritizes “domestic circulation as the mainstay while mutually reinforcing domestic and international circulations,” governments can support enterprises in achieving sustainable development.
Author Contributions
Funding
Institutional Review Board Statement
Informed Consent Statement
Data Availability Statement
Conflicts of Interest
References
- Tao, M.; Goh, L.T.; Zheng, Y.; Le, W. Do China’s anti-corruption efforts improve corporate productivity? A difference-in-difference exploration of Chinese listed enterprises. Socio-Econ. Plan. Sci. 2023, 87, 101594. [Google Scholar] [CrossRef]
- Wen, H.; Wen, C.; Lee, C.C. Impact of digitalization and environmental regulation on total factor productivity. Inf. Econ. Policy 2022, 61, 101007. [Google Scholar] [CrossRef]
- López, R.A.; Südekum, J. Vertical industry relations, spillovers, and productivity: Evidence from chilean plants. J. Reg. Sci. 2009, 49, 721–747. [Google Scholar] [CrossRef]
- Natividad, G. Integration and productivity: Satellite-tracked evidence. Manag. Sci. 2014, 60, 1698–1718. [Google Scholar] [CrossRef]
- Fatima, S.T. Productivity spillovers from foreign direct investment: Evidence from Turkish micro-level data. J. Int. Trade Econ. Dev. 2016, 25, 291–324. [Google Scholar] [CrossRef]
- Sari, D.W.; Khalifah, N.A.; Suyanto, S. The spillover effects of foreign direct investment on the firms’ productivity performances. J. Product. Anal. 2016, 46, 199–233. [Google Scholar] [CrossRef]
- Bagir, Y.K.; Seven, Ü. Access to finance and productivity growth: The role of own and suppliers’ financial constraints. Empir. Econ. 2022, 63, 3095–3119. [Google Scholar] [CrossRef]
- Chen, L.F.; Shen, Q.T.S.; Yu, X.L.; Chen, X.H. Knowledge spillovers along the sustainable supply chain of China’s listed companies: The role of long-term orientation. J. Innov. Knowl. 2024, 9, 100478. [Google Scholar] [CrossRef]
- Choi, T.Y.; Krause, D.R. The supply base and its complexity: Implications for transaction costs, risks, responsiveness, and innovation. J. Oper. Manag. 2006, 24, 637–652. [Google Scholar] [CrossRef]
- Ambulkar, S.; Blackhurst, J.; Grawe, S. Firm’s resilience to supply chain disruptions: Scale development and empirical examination. J. Oper. Manag. 2015, 33, 111–122. [Google Scholar] [CrossRef]
- He, J.; Liang, K.; Wu, P. Stability governance of e-commerce supply chain: Social capital and governance mechanism design perspective. Sustainability 2022, 14, 13320. [Google Scholar] [CrossRef]
- Shen, N.; Liao, H.; Deng, R.; Wang, Q. Different types of environmental regulations and the heterogeneous influence on the environmental total factor productivity: Empirical analysis of China’s industry. J. Clean. Prod. 2019, 211, 171–184. [Google Scholar] [CrossRef]
- Comin, D.; Hobijn, B. An exploration of technology diffusion. Soc. Sci. Electron. Publ. 2010, 100, 2031–2059. [Google Scholar] [CrossRef]
- Brandt, L.; Biesebroeck, J.V.; Zhang, Y. Creative accounting or creative destruction? Firm-level productivity growth in chinese manufacturing. J. Dev. Econ. 2012, 97, 339–351. [Google Scholar] [CrossRef]
- Habermann, M.; Blackhurst, J.; Metcalf, A.Y. Keep your friends close? Supply chain design and disruption risk. Decis. Sci. 2015, 46, 491–526. [Google Scholar] [CrossRef]
- Granovetter, M. Economic action and social structure: The problem of embeddedness. Am. J. Sociol. 1985, 91, 481–510. [Google Scholar] [CrossRef]
- Granovetter, M.S. The strength of weak ties. Am. J. Sociol. 1973, 78, 1360–1380. [Google Scholar] [CrossRef]
- Miotti, L.; Sachwald, F. Co-operative R&D: Why and with whom?: An integrated framework of analysis. Res. Policy 2003, 32, 1481–1499. [Google Scholar]
- Mohr, J.; Spekman, R. Characteristics of partnership success: Partnership attributes, communication behavior, and conflict resolution techniques. Strateg. Manag. J. 1994, 15, 135–152. [Google Scholar] [CrossRef]
- Wandfluh, M.; Hofmann, E.; Schoensleben, P. Financing buyer–supplier dyads: An empirical analysis on financial collaboration in the supply chain. Int. J. Logist. Res. Appl. 2016, 19, 200–217. [Google Scholar] [CrossRef]
- Zhuo, C.; Chen, J. Can digital transformation overcome the enterprise innovation dilemma: Effect, mechanism and effective boundary. Technol. Forecast. Soc. Change 2023, 190, 122378. [Google Scholar] [CrossRef]
- Ferracuti, E.; Stubben, S.R. The role of financial reporting in resolving uncertainty about corporate investment opportunities. J. Account. Econ. 2019, 68, 101248. [Google Scholar] [CrossRef]
- Zaheer, A.; Mcevily, B.; Perrone, V. Does trust matter? Exploring the effects of interorganizational and interpersonal trust on performance. Organ. Sci. 1998, 9, 141–159. [Google Scholar] [CrossRef]
- Cachon, G.P.; Randall, T.; Schmidt, G.M. In search of the bullwhip effect. Manuf. Serv. Oper. Manag. 2011, 9, 457–479. [Google Scholar] [CrossRef]
- Kukharskyy, B.; Pflüger, M. Time is on my side: Relational contracts and aggregate welfare. Oxf. Econ. Pap. -New Ser. 2019, 71, 709–732. [Google Scholar] [CrossRef]
- Bourdieu, P. The forms of social capital. In Handbook of Theory and Research for the Sociology of Education; Richardson, J., Ed.; Greenwood Press: New York, NY, USA, 1986; pp. 241–258. [Google Scholar]
- Demeter, K.; Golini, R. Inventory configurations and drivers: An international study of assembling industries. Int. J. Prod. Econ. 2014, 157, 62–73. [Google Scholar] [CrossRef]
- Bernanke, B.S. Irreversibility, Uncertainty, and Cyclical Investment. Q. J. Econ. 1983, 98, 85–106. [Google Scholar] [CrossRef]
- Hilary, G.; Hui, K.W. Does religion matter in corporate decision making in America? J. Financ. Econ. 2009, 93, 455–473. [Google Scholar] [CrossRef]
- Wang, Y.; Han, P. Digital transformation, service-oriented manufacturing, and total factor productivity: Evidence from a-share listed companies in China. Sustainability 2023, 15, 9974. [Google Scholar] [CrossRef]
- Bernard, A.B.; Redding, S.J.; Schott, P.K. Multiple-product firms and product switching. Am. Econ. Rev. 2010, 100, 70–97. [Google Scholar] [CrossRef]
- Jiang, D.; Lu, D. Changes of Supply Chain, Financing Constraints and Enterprise Innovation. Bus. Manag. J. 2022, 44, 56–74. [Google Scholar]
- Ellis, J.A.; Fee, C.E.; Thomas, S.E. Proprietary costs and the disclosure of information about customers. J. Account. Res. 2012, 50, 685–727. [Google Scholar] [CrossRef]
- Xu, N.; Li, X.; Yuan, Q.; Chan, K.C. Excess perks and stock price crash risk: Evidence from China. J. Corp. Financ. 2014, 25, 419–434. [Google Scholar] [CrossRef]
- Wen, Z.L.; Zhang, L.; Hou, J.T.; Liu, H.Y. Testing and application of the mediating effects. Acta Psychol. Sin. 2004, 36, 614–620. [Google Scholar]
- Wang, J.; Chen, J.; Huang, X.; Sun, D.; Song, Z. Principal SOE customers and corporate tax avoidance: Evidence from the government arrears clearance reform. Energy Econ. 2023, 128, 107157. [Google Scholar] [CrossRef]
- Gu, Q.; Kim, J.B.; Liao, K.; Si, Y. Decentralising for local information? Evidence from state-owned listed firms in China. Account. Financ. 2023, 63, 5245–5276. [Google Scholar] [CrossRef]
- Zhong, X.; Ren, L.; Ren, G. Performance shortfall, institutional logic and firms’ tax avoidance. Eurasian Bus. Rev. 2023, 13, 855–886. [Google Scholar] [CrossRef]
- Nie, Y.; Li, Q.; Wang, E.; Zhang, T. Study of the nonlinear relations between economic growth and carbon dioxide emissions in the Eastern, Central and Western regions of China. J. Clean. Prod. 2019, 219, 713–722. [Google Scholar] [CrossRef]
- Schwieterman, M.A.; Goldsby, T.J.; Croxton, K.L. Customer and supplier portfolios: Can credit risks be managed through supply chain relationships? J. Bus. Logist. 2018, 39, 123–137. [Google Scholar] [CrossRef]
- Chan, C.C.; Lin, B.H.; Chang, Y.H.; Liao, W.C. Does bank relationship matter for corporate risk-taking? Evidence from listed firms in Taiwan. North Am. J. Econ. Financ. 2013, 26, 323–338. [Google Scholar] [CrossRef]
| Variable Type | Variable Name | Variable Symbol | Variable Definition | N | Mean | SD |
|---|---|---|---|---|---|---|
| Implicit Variable | Total factor productivity of enterprises | Tfp_lp | total factor productivity calculated by the lp method | 13,849 | 8.360 | 0.990 |
| Independent Variable | Supply chain stability | Chainst1 | supplier stability × customer stability | 13,849 | 0.660 | 0.440 |
| Chainst2 | percentage of supplier and customer duplication compared to the prior year | 13,849 | 0.730 | 0.370 | ||
| Control Variable | Enterprise size | Size | the total assets of the enterprise are taken as the natural logarithm | 13,849 | 22.18 | 1.160 |
| Age of business | Age | the number of years the company has been listed plus one takes the natural logarithm | 13,849 | 2.230 | 0.620 | |
| Return on assets | Roa | net profit/total assets closing balance of the previous year × 100 | 13,849 | 4.310 | 7.800 | |
| Gearing | Lev | total liabilities/total assets | 13,849 | 0.420 | 0.200 | |
| Percentage of independent directors | Indrcrat | proportion of independent directors to the total number of all directors | 13,849 | 0.380 | 0.100 | |
| Board size | Board | the number of directors on the board of directors is taken as the natural logarithm | 13,849 | 2.240 | 0.290 | |
| Shareholding ratio of top five shareholders | Top5 | sum of shareholdings of the company’s top five largest shareholders | 13,849 | 0.510 | 0.150 | |
| Growth | Growth | (current period − prior year’s adjustments)/ABS prior year’s adjustments | 13,849 | 15.65 | 34.29 | |
| Fixed asset ratio | Tang | fixed assets/total assets | 13,849 | 0.210 | 0.150 | |
| Current asset ratio | Qr | current assets/current liabilities | 13,849 | 2.320 | 2.090 | |
| Whether or not the two posts are combined | Dual | the positions of chairman and general manager are assigned a value of 1 when combined; otherwise, it is 0 | 13,849 | 0.310 | 0.460 |
| (1) | (2) | (3) | (4) | |
|---|---|---|---|---|
| Tfp_lp | Tfp_lp | Tfp_lp | Tfp_lp | |
| Chainst1 | 0.027 *** | 0.036 *** | ||
| (3.536) | (4.896) | |||
| Chainst2 | 0.027 *** | 0.040 *** | ||
| (3.324) | (4.966) | |||
| Size | 0.483 *** | 0.483 *** | 0.537 *** | 0.537 *** |
| (61.932) | (61.982) | (85.666) | (85.741) | |
| Age | 0.108 *** | 0.108 *** | 0.091 *** | 0.091 *** |
| (4.857) | (4.848) | (7.259) | (7.219) | |
| Lev | 0.236 *** | 0.237 *** | 0.308 *** | 0.309 *** |
| (7.000) | (7.010) | (9.796) | (9.820) | |
| Indrcrat | −0.012 | −0.011 | −0.018 | −0.018 |
| (−0.371) | (−0.356) | (−0.588) | (−0.570) | |
| Growth | 0.002 *** | 0.002 *** | 0.002 *** | 0.002 *** |
| (29.162) | (29.167) | (27.387) | (27.410) | |
| Board | −0.011 | −0.011 | −0.008 | −0.008 |
| (-0.925) | (-0.939) | (−0.664) | (−0.678) | |
| Tang | −1.166 *** | −1.167 *** | −1.062 *** | −1.063 *** |
| (-28.214) | (-28.240) | (-28.428) | (-28.457) | |
| Qr | −0.013 *** | −0.013 *** | −0.016 *** | −0.016 *** |
| (−5.314) | (−5.295) | (−6.907) | (−6.886) | |
| Roa | 0.008 *** | 0.008 *** | 0.009 *** | 0.009 *** |
| (16.571) | (16.570) | (19.457) | (19.471) | |
| Dual | −0.005 | −0.005 | −0.011 | −0.011 |
| (−0.612) | (−0.593) | (−1.373) | (−1.344) | |
| Top5 | 0.036 | 0.037 | 0.127 *** | 0.127 *** |
| (0.776) | (0.791) | (3.184) | (3.198) | |
| _cons | −2.415 *** | −2.426 *** | −4.002 *** | −4.014 *** |
| (−14.409) | (−14.478) | (−26.164) | (−26.254) | |
| ID | Yes | Yes | ||
| Year | Yes | Yes | Yes | Yes |
| Province | Yes | Yes | ||
| Industry | Yes | Yes | ||
| N | 13,849 | 13,849 | 13,849 | 13,849 |
| R2 | 0.590 | 0.590 | 0.602 | 0.602 |
| (1) | (2) | (3) | |
|---|---|---|---|
| Tfp_lp | Chainst1 | Tfp_lp | |
| Chainst1 | 0.115 *** | 0.387 ** | |
| (9.945) | (1.994) | ||
| Mean_YP | 0.099 * | ||
| (1.835) | |||
| Mean_YA | 0.496 *** | ||
| (3.556) | |||
| IMR | 0.074 *** | ||
| (2.596) | |||
| CVs | Yes | Yes | Yes |
| ID | Yes | Yes | Yes |
| Year | Yes | Yes | Yes |
| N | 13,849 | 13,849 | 13,849 |
| F | 11.720 | 15.880 | |
| Sargan-P | 0.614 | ||
| A LM-P | 0.000 |
| Operations Management Level | Resource Allocation | |||||
|---|---|---|---|---|---|---|
| (1) | (2) | (3) | (4) | (5) | (6) | |
| Fxastto | Tfp_lp | Digitala | Tfp_lp | RD1 | Tfp_lp | |
| Fxastto | 0.001 *** | |||||
| (13.187) | ||||||
| Digitala | 0.001 *** | |||||
| (5.368) | ||||||
| RD1 | 6.852 *** | |||||
| (23.245) | ||||||
| Chainst1 | 3.351 ** | 0.025 *** | 1.339 *** | 0.026 *** | 0.001 ** | 0.023 *** |
| (2.407) | (3.311) | (2.722) | (3.411) | (2.272) | (3.076) | |
| CVs | Yes | Yes | Yes | Yes | Yes | Yes |
| ID | Yes | Yes | Yes | Yes | Yes | Yes |
| Year | Yes | Yes | Yes | Yes | Yes | Yes |
| N | 13,849 | 13,849 | 13,849 | 13,849 | 13,849 | 13,849 |
| R2 | 0.009 | 0.597 | 0.095 | 0.591 | 0.072 | 0.613 |
| (1) | (2) | (3) | (4) | (5) | (6) | |
|---|---|---|---|---|---|---|
| OW = 0 | OW = 1 | Eastern | Central–Western | Large-Size | Small-Size | |
| Chainst1 | 0.033 *** | 0.003 | 0.030 *** | 0.023 | 0.029 ** | 0.015 |
| (3.684) | (0.184) | (3.354) | (1.601) | (2.532) | (1.550) | |
| CVs | Yes | Yes | Yes | Yes | Yes | Yes |
| ID | Yes | Yes | Yes | Yes | Yes | Yes |
| Year | Yes | Yes | Yes | Yes | Yes | Yes |
| N | 9949 | 3900 | 9978 | 3871 | 6139 | 7710 |
| R2 | 0.603 | 0.569 | 0.583 | 0.606 | 0.503 | 0.494 |
Disclaimer/Publisher’s Note: The statements, opinions and data contained in all publications are solely those of the individual author(s) and contributor(s) and not of MDPI and/or the editor(s). MDPI and/or the editor(s) disclaim responsibility for any injury to people or property resulting from any ideas, methods, instructions or products referred to in the content. |
© 2024 by the authors. Licensee MDPI, Basel, Switzerland. This article is an open access article distributed under the terms and conditions of the Creative Commons Attribution (CC BY) license (https://creativecommons.org/licenses/by/4.0/).
Share and Cite
Liu, J.; Wang, G. Supply Chain Stability and Enterprises’ Total Factor Productivity: From the Perspective of Development Sustainability. Sustainability 2024, 16, 10265. https://doi.org/10.3390/su162310265
Liu J, Wang G. Supply Chain Stability and Enterprises’ Total Factor Productivity: From the Perspective of Development Sustainability. Sustainability. 2024; 16(23):10265. https://doi.org/10.3390/su162310265
Chicago/Turabian StyleLiu, Jingyi, and Guoqing Wang. 2024. "Supply Chain Stability and Enterprises’ Total Factor Productivity: From the Perspective of Development Sustainability" Sustainability 16, no. 23: 10265. https://doi.org/10.3390/su162310265
APA StyleLiu, J., & Wang, G. (2024). Supply Chain Stability and Enterprises’ Total Factor Productivity: From the Perspective of Development Sustainability. Sustainability, 16(23), 10265. https://doi.org/10.3390/su162310265