Article

Modest Method for Estimating CO2 Emissions from Container Handling Equipment at Ports

by
Muhammad Arif Budiyanto
1,*,
Faril Ichfari
1 and
Takeshi Shinoda
2
1
Department of Mechanical Engineering, Universitas Indonesia, Kota Depok 16424, Jawa Barat, Indonesia
2
Department of Marine System Engineering, Kyushu University, Fukuoka 819-0395, Japan
*
Author to whom correspondence should be addressed.
Sustainability 2024, 16(23), 10293; https://doi.org/10.3390/su162310293
Submission received: 15 October 2024 / Revised: 18 November 2024 / Accepted: 20 November 2024 / Published: 25 November 2024
(This article belongs to the Section Pollution Prevention, Mitigation and Sustainability)

Abstract

:
The maritime industry is under increasing pressure to reduce CO2 emissions, with the International Maritime Organization (IMO) setting a target to reduce greenhouse gas emissions, including emissions from the port sector, by 40% by 2030. However, accurate and reliable methods for estimating CO2 emissions at container ports, which are significant contributors to maritime emissions, are still lacking. This study aims to address this by evaluating a novel method for estimating CO2 emissions at container ports. The proposed method utilizes the cargo handling equipment movement theory, quantifying both vertical and horizontal movements based on the amount of container handling equipment at the port. The emissions for each piece of equipment are estimated by multiplying the movement quantity by the respective emission factor. To validate the model, a robustness test compares the estimated CO2 emissions with actual energy consumption data from the port. A case study was conducted at a container port with an annual capacity of over 500,000 TEUs and a parallel layout type. The estimated CO2 emissions were approximately 8183 tons per year, with container cranes contributing 56%, rubber-tire gantry cranes contributing 27%, terminal trucks contributing 14%, and reach stackers contributing 3%. The method demonstrated accuracy, with a deviation of less than 1%. This method offers a fast and reliable approach for estimating baseline CO2 emissions at container ports, providing valuable insights for port authorities and policymakers to develop more effective emission-reduction strategies.

1. Introduction

Maritime transportation is essential in global trade, connecting ports worldwide, making it possible to transport bulk goods between continents and countries efficiently and effectively. Maritime transportation annually carries more than 10 billion tons of containerized, solid, and bulk freight [1]. Container shipping comprises 66% of the total maritime transportation value [2]. With the large volume of ship and port activity occurring every year, environmental impacts such as increased greenhouse gas (GHG) emissions are significant concerns [3,4]. To address this issue, the International Maritime Organization (IMO), responsible for regulating the global maritime industry, has set an ambitious target of reducing carbon dioxide (CO2) emissions from the global shipping sector by at least 40% by 2030, when compared to 2008 levels [5]. State-of-the-art research has focused on various methods to measure and reduce CO2 emissions in the maritime industry [6]. Additionally, studies analyzing CO2 emissions at container terminals, using bottom-up methods, have provided new opportunities for assessing emissions per terminal, although further verification across multiple terminals is required [7]. This study applies the CEDEX standardized carbon footprint (CF) methodology to the Port of Vigo, Spain (2017–2020), revealing that fuel consumption from loading/unloading operations is the largest contributor to CF, at 14,161 kg CO2 eq per TEU [8].
Further studies have analyzed CO2 emissions using Visual Basic to calculate the carbon footprint in ports, based on the Intergovernmental Panel on Climate Change, addressing the challenge of comparing results by proposing a standardized method for benchmarking across ports [9,10]. Research estimating the carbon footprint at Chennai Port by using operational activity data and the bottom-up method estimated annual GHG CO2 emissions from port-related activities [11]. Comparisons between rubber-tire gantry (RTG) cranes and electric RTGs demonstrated significant energy savings and CO2 reductions, with electric cranes achieving an 86.60% energy savings and a 67.79% reduction in CO2 [12,13]. The estimation method that analyzes the operational modes of large ships and tugs based on position and speed data from AIS reveals that approximately 80% of port emissions occur while ships are hoteling at berth and during anchorage [14,15].
Efforts to reduce estimated CO2 emissions have focused on enhancing the efficiency of container ports. Research has explored methods to minimize total departure delays and transportation energy consumption by optimizing activity scheduling at container ports [16,17]. New integer programming models have been developed to optimize yard crane scheduling with minimal energy consumption, aiming to reduce carbon emissions [18,19]. An analysis of carbon emission reductions at an integrated logistics port by using a neural network model predicts that the growth rate of carbon emissions will gradually decrease over the next decade, ultimately reaching a peak in emissions [20].
Studies have also investigated CO2 emissions from different terminal operation models, identifying optimal strategies for energy savings and CO2 reductions to meet green port requirements [21]. Research on yard tractor emissions during loading and unloading processes has emphasized the importance of container location in emission calculations [22,23]. Reviews of initiatives and methodologies for calculating and reducing CO2 emissions have highlighted the lack of uniform methods across different operators, indicating the need for a simple and standardized estimation approach [9]. Despite extensive research, gaps remain in the development of a modest method for estimating total CO2 emissions per twenty-foot equivalent unit (TEU) from container terminal operations.
This study aims to evaluate a novel CO2 emission estimation model for cargo handling equipment in container ports. The evaluation results will provide insights into the contributions of different equipment to total CO2 emissions at container ports. The global contribution of this research is a practical method for calculating baseline CO2 emission values at container ports, facilitating mitigation efforts to achieve net-zero emission targets. This research contributes by introducing a modest method for estimating CO2 emissions based on cargo handling equipment operations, validated through case studies at container ports. It identifies the key contributors to CO2 emissions, provides a tool for calculating baseline emission values, and supports the development of effective reduction strategies. Additionally, it promotes the standardization of CO2 emission estimation methods for greater consistency across ports.

2. Methodology

In this research, CO2 emissions were estimated using two approaches simultaneously: one based on movement activities and one based on energy consumption. The movement-based method focuses on physical activities within the terminal, such as container handling and truck movements; this approach provides insights into the emissions generated by different types of equipment involved in both horizontal and vertical movements. Conversely, the energy consumption method relies on actual recorded data for fuel and electricity usage at the port; this method offers a direct measure of emissions. The dual use of these methods enables the cross-validation of CO2 emission estimates from movement activities with recorded energy consumption data, enhancing the robustness and reliability of our findings. This comparative approach ensures a comprehensive and accurate understanding of CO2 emissions at the container terminal, allowing for effective emission-reduction strategies.
The research activities are outlined in Figure 1, which systematically illustrates the study’s process. The study involved assessing movements and activities at the container port and identifying the cargo handling equipment used at the terminal. CO2 emissions were estimated based on these movements, utilizing data on both vertical and horizontal movements at the port, with each movement categorized by the number of containers loaded and unloaded. Additionally, CO2 emissions based on energy consumption were estimated using fuel and power consumption data, typically logged by port operators. One advantage of estimating CO2 emissions based on movement activity is that it does not require on-site data collection; instead, it relies on the number of containers handled annually and the methods employed at a port, which are generally available in a company’s annual report. Data on fuel and energy consumption, which are directly linked to CO2 emissions, are typically more reliable and accessible than data on other pollutants.

2.1. Evaluation of Container Movement and Cargo Handling Equipment at Container Ports

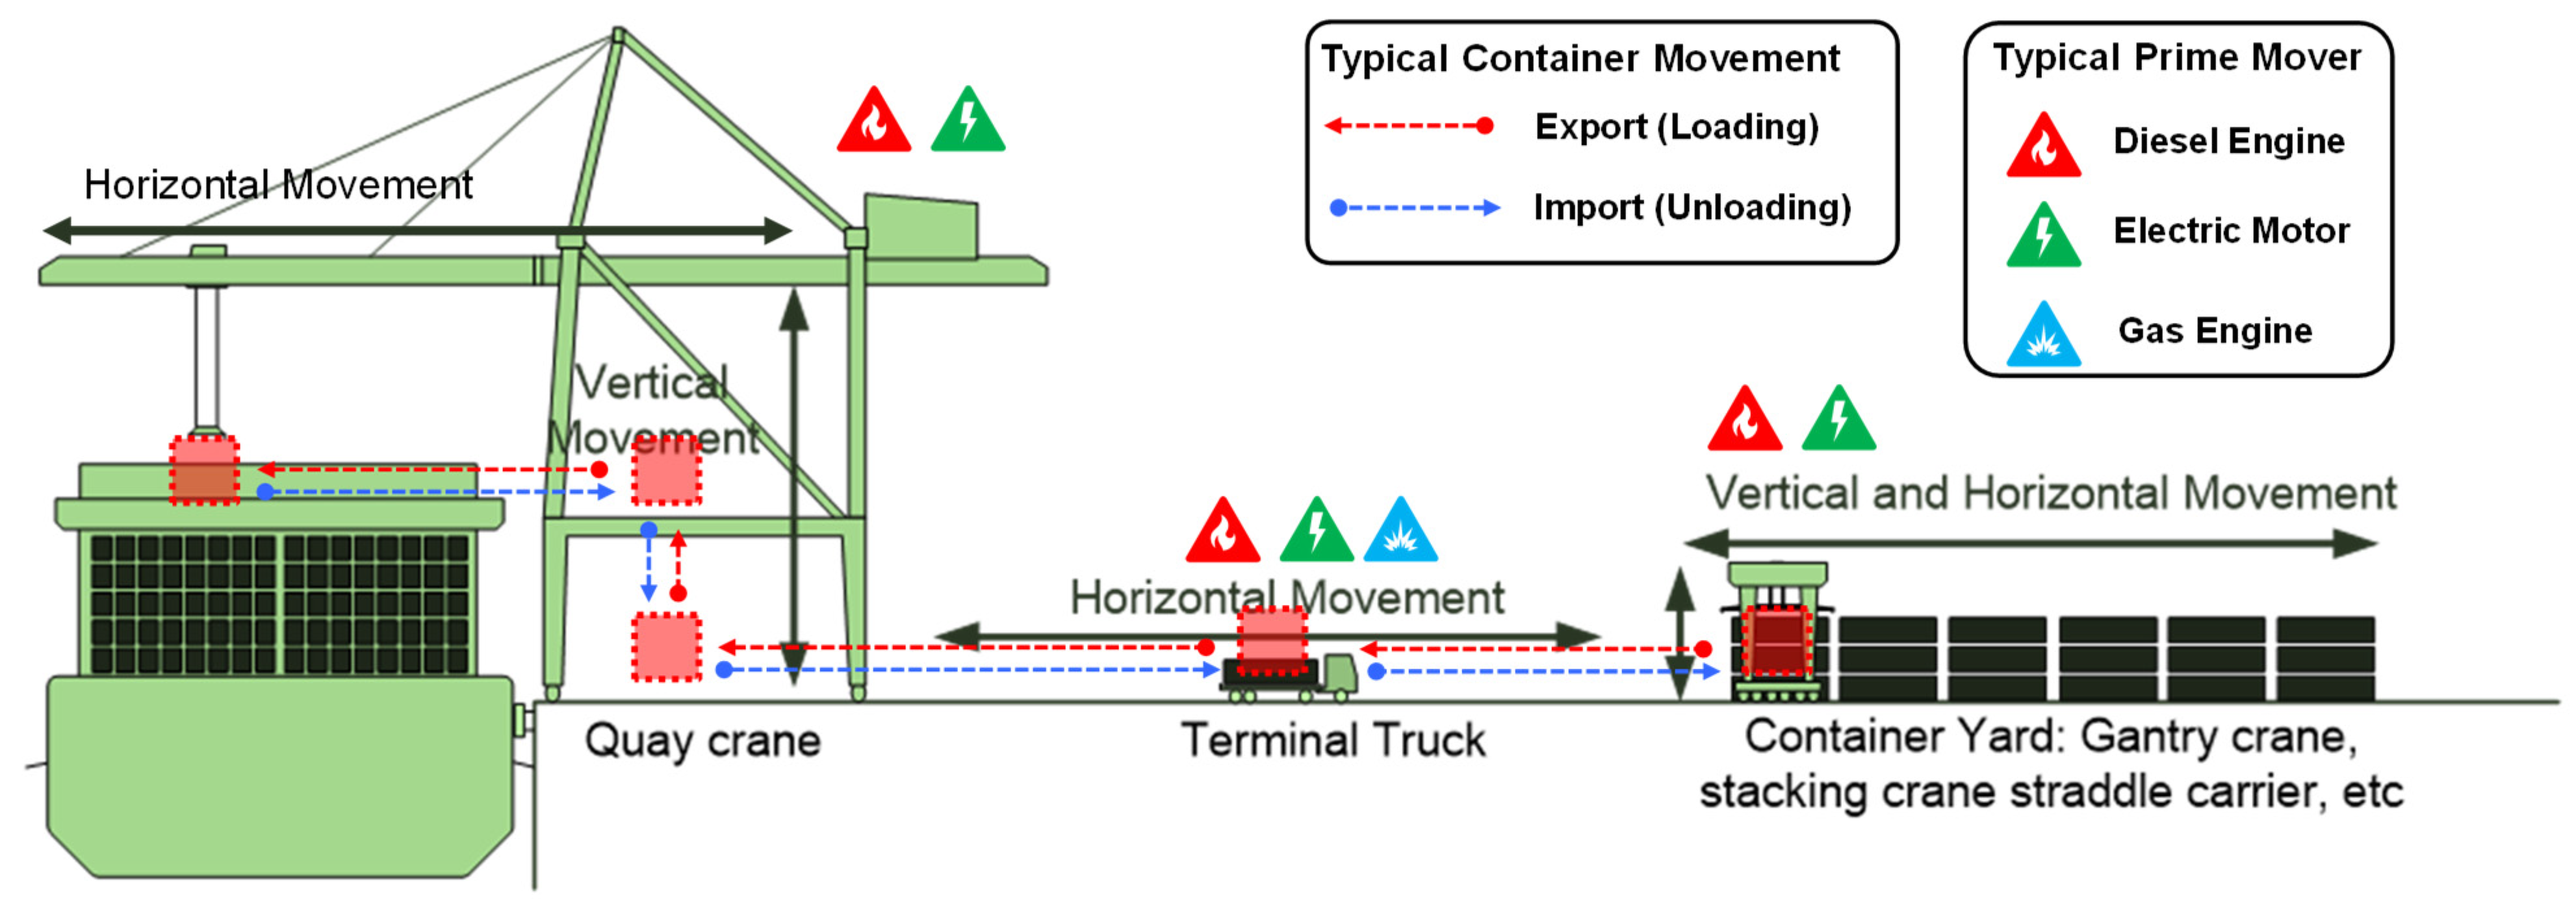
In general, the movement of containers at the container port is shown in Figure 2. The model presented in this paper is centered on the processes involved in container handling, which can be categorized into three main stages: handling at the quay crane, transfer by trucks, and handling at the storage yard. The movement of containers at the port is categorized into two main processes, namely import (unloading) and export (loading), where the container handling process is divided into two types, i.e., vertical movement and horizontal movement. The import process starts with the container ship docking at the port. The container is unloaded using a quay crane, with vertical and horizontal movement. From the quay crane, the container is placed on the terminal truck to be taken to the container yard; in this process, only horizontal movement occurs. At the specified container yard location, the container is transported using a gantry crane; there is vertical and horizontal movement in this process. After leaving the container yard, containers are usually stacked until an external truck, sent by the owner of the goods, arrives. For the export process, the opposite applies, where the process begins starts at the container yard, is transported by the head truck, and is loaded onto a ship using a quay crane.
Depending on the type of prime mover, each piece of container handling equipment is considered to contribute to CO2 emissions generated by the entire series of export and import activities. Quay cranes generally use diesel or electric motors. In the latest developments, quay cranes have begun using prime mover electric motors, supplied from on-grid electricity with hybrid technology, which can replace batteries when lowering containers with vertical movement. Prime movers in terminal trucks generally use diesel or internal combustion with gas fuel. In recent developments, terminal trucks have begun using electric motors powered by batteries with an unmanned autonomous driving system. Gantry cranes generally use diesel prime movers; in the latest developments, gantry cranes have begun using electric-motor prime movers, with a hybrid system and a bus bar, and feature a remote-control system controlled from the operating room.

2.2. CO2 Emission Estimation Method Based on Container Movement

The method for estimating CO2 emissions based on container movement is carried out by inventorying all vertical and horizontal movements for all cargo handling equipment. The CO2 estimation method based on container movement is calculated using Equation (1):
E C M , C O 2 = i = 1 n ( ( X i × f D , C O 2 ) + ( Y i × f E , C O 2 ) )
X i = n i × ( C i + c i x i ¯ )
Y i = n i × ( P i + p i x i ¯ )
where ECM,CO2 is the total CO2 emissions produced at one terminal in kilograms, Xi is the estimated energy consumption from diesel-energy-sourced devices in liters based on the movement of each device, Yi is the estimated energy consumption from electrical-energy-sourced devices in kWh units based on the movement of each device, fD,CO2 represents CO2 emission factors from diesel energy sources obtained from the guidelines for national greenhouse gas inventories, which are 2.67 kg of CO2/L [24], and fE,CO2 represents CO2 emission factors from electrical energy sources sourced from on-grid electricity. However, it is important to note that the emission factor for electricity from the grid is not a static value. The grid’s energy mix—comprising a variety of energy sources, such as thermoelectric plants (natural gas, coal, diesel, and nuclear), hydroelectric, wind, solar, and biomass—can significantly influence the CO2 emission factor. The emission factor for thermoelectric plants varies depending on the specific fuel used. For example, coal-fired power plants emit higher levels of CO2 compared to the levels for natural gas plants due to the higher carbon content in coal. On the other hand, renewable energy sources, including wind and solar, generally have negligible direct CO2 emissions during electricity generation, although some emissions may be associated with infrastructure development and maintenance.
Xi is the estimated energy consumption produced by each piece of loading and unloading equipment sourced from diesel in terms of liters, calculated by using Equation (2), where ni is the number of movements experienced based on the type of equipment used, including vertical and horizontal movement; Ci is the energy consumption variable from energy sources (diesel) for each tool per movement in terms of liters/movement; ci is the diesel fuel consumption variable per kilometer per movement in terms of liters/km/movement; and x i ¯ is the average distance traveled by the tool in kilometers.
Yi is the estimated energy consumption produced by each piece of loading and unloading equipment sourced from electrical energy in terms of kWh units, calculated using Equation (3), where ni is the number of movements experienced based on the type of equipment used, including vertical and horizontal movement, and Pi is the energy consumption variable for energy sources. The electricity for each device per movement is in terms of kWh/movement, pi is the energy consumption variable of the electrical energy source per kilometer per movement in terms of kWh/km/movement, and x i ¯ is the average distance traveled by the device in terms of kilometers.
The total movement of each tool is an essential variable in this calculation. There are two types of movement experienced by the equipment: vertical and horizontal. Vertical movements include container lift-on and lift-off services. Horizontal movement includes moving tools in the container yard area. Each type of tool experiences different movements; these movements become the input values for the total movement experienced by the equipment. Terminal truck equipment experiences horizontal movement, where the total movement (nT) is the total throughput of all containers in terms of TEUs that are transported/carried from the dock to the container yard or vice versa (T). Quayside cranes experience vertical movement; the total movement (nQC) is the total throughput of all containers in terms of TEUs served (T), as well as the number of hatch covers or ship holds served (opened or closed) during loading and unloading activities (H).
Yard cranes experience horizontal and vertical movement; the total movement is the total number of containers in terms of TEUs served (T) (vertical movement) and added with the total shifting carried out in the stacking area (S) (horizontal movement). Shifting is a movement experienced by a yard crane. One shift is calculated for every movement of the yard crane from one bay to another in one block. One shift occurs when the yard crane has stacked containers until it reaches the maximum capacity for stacking one bay, where the number of rows and tiers is the maximum capacity calculated in one block. The energy consumption of loading and unloading equipment also depends on the distance traveled. Each terminal is comprised of its layout and associated distances between various loading and unloading equipment and areas within them. The truck type of tool has a variable distance, which the layout of the terminal will determine. The distance is calculated based on the distance between a container stack and the pier, obtained from satellite photos.
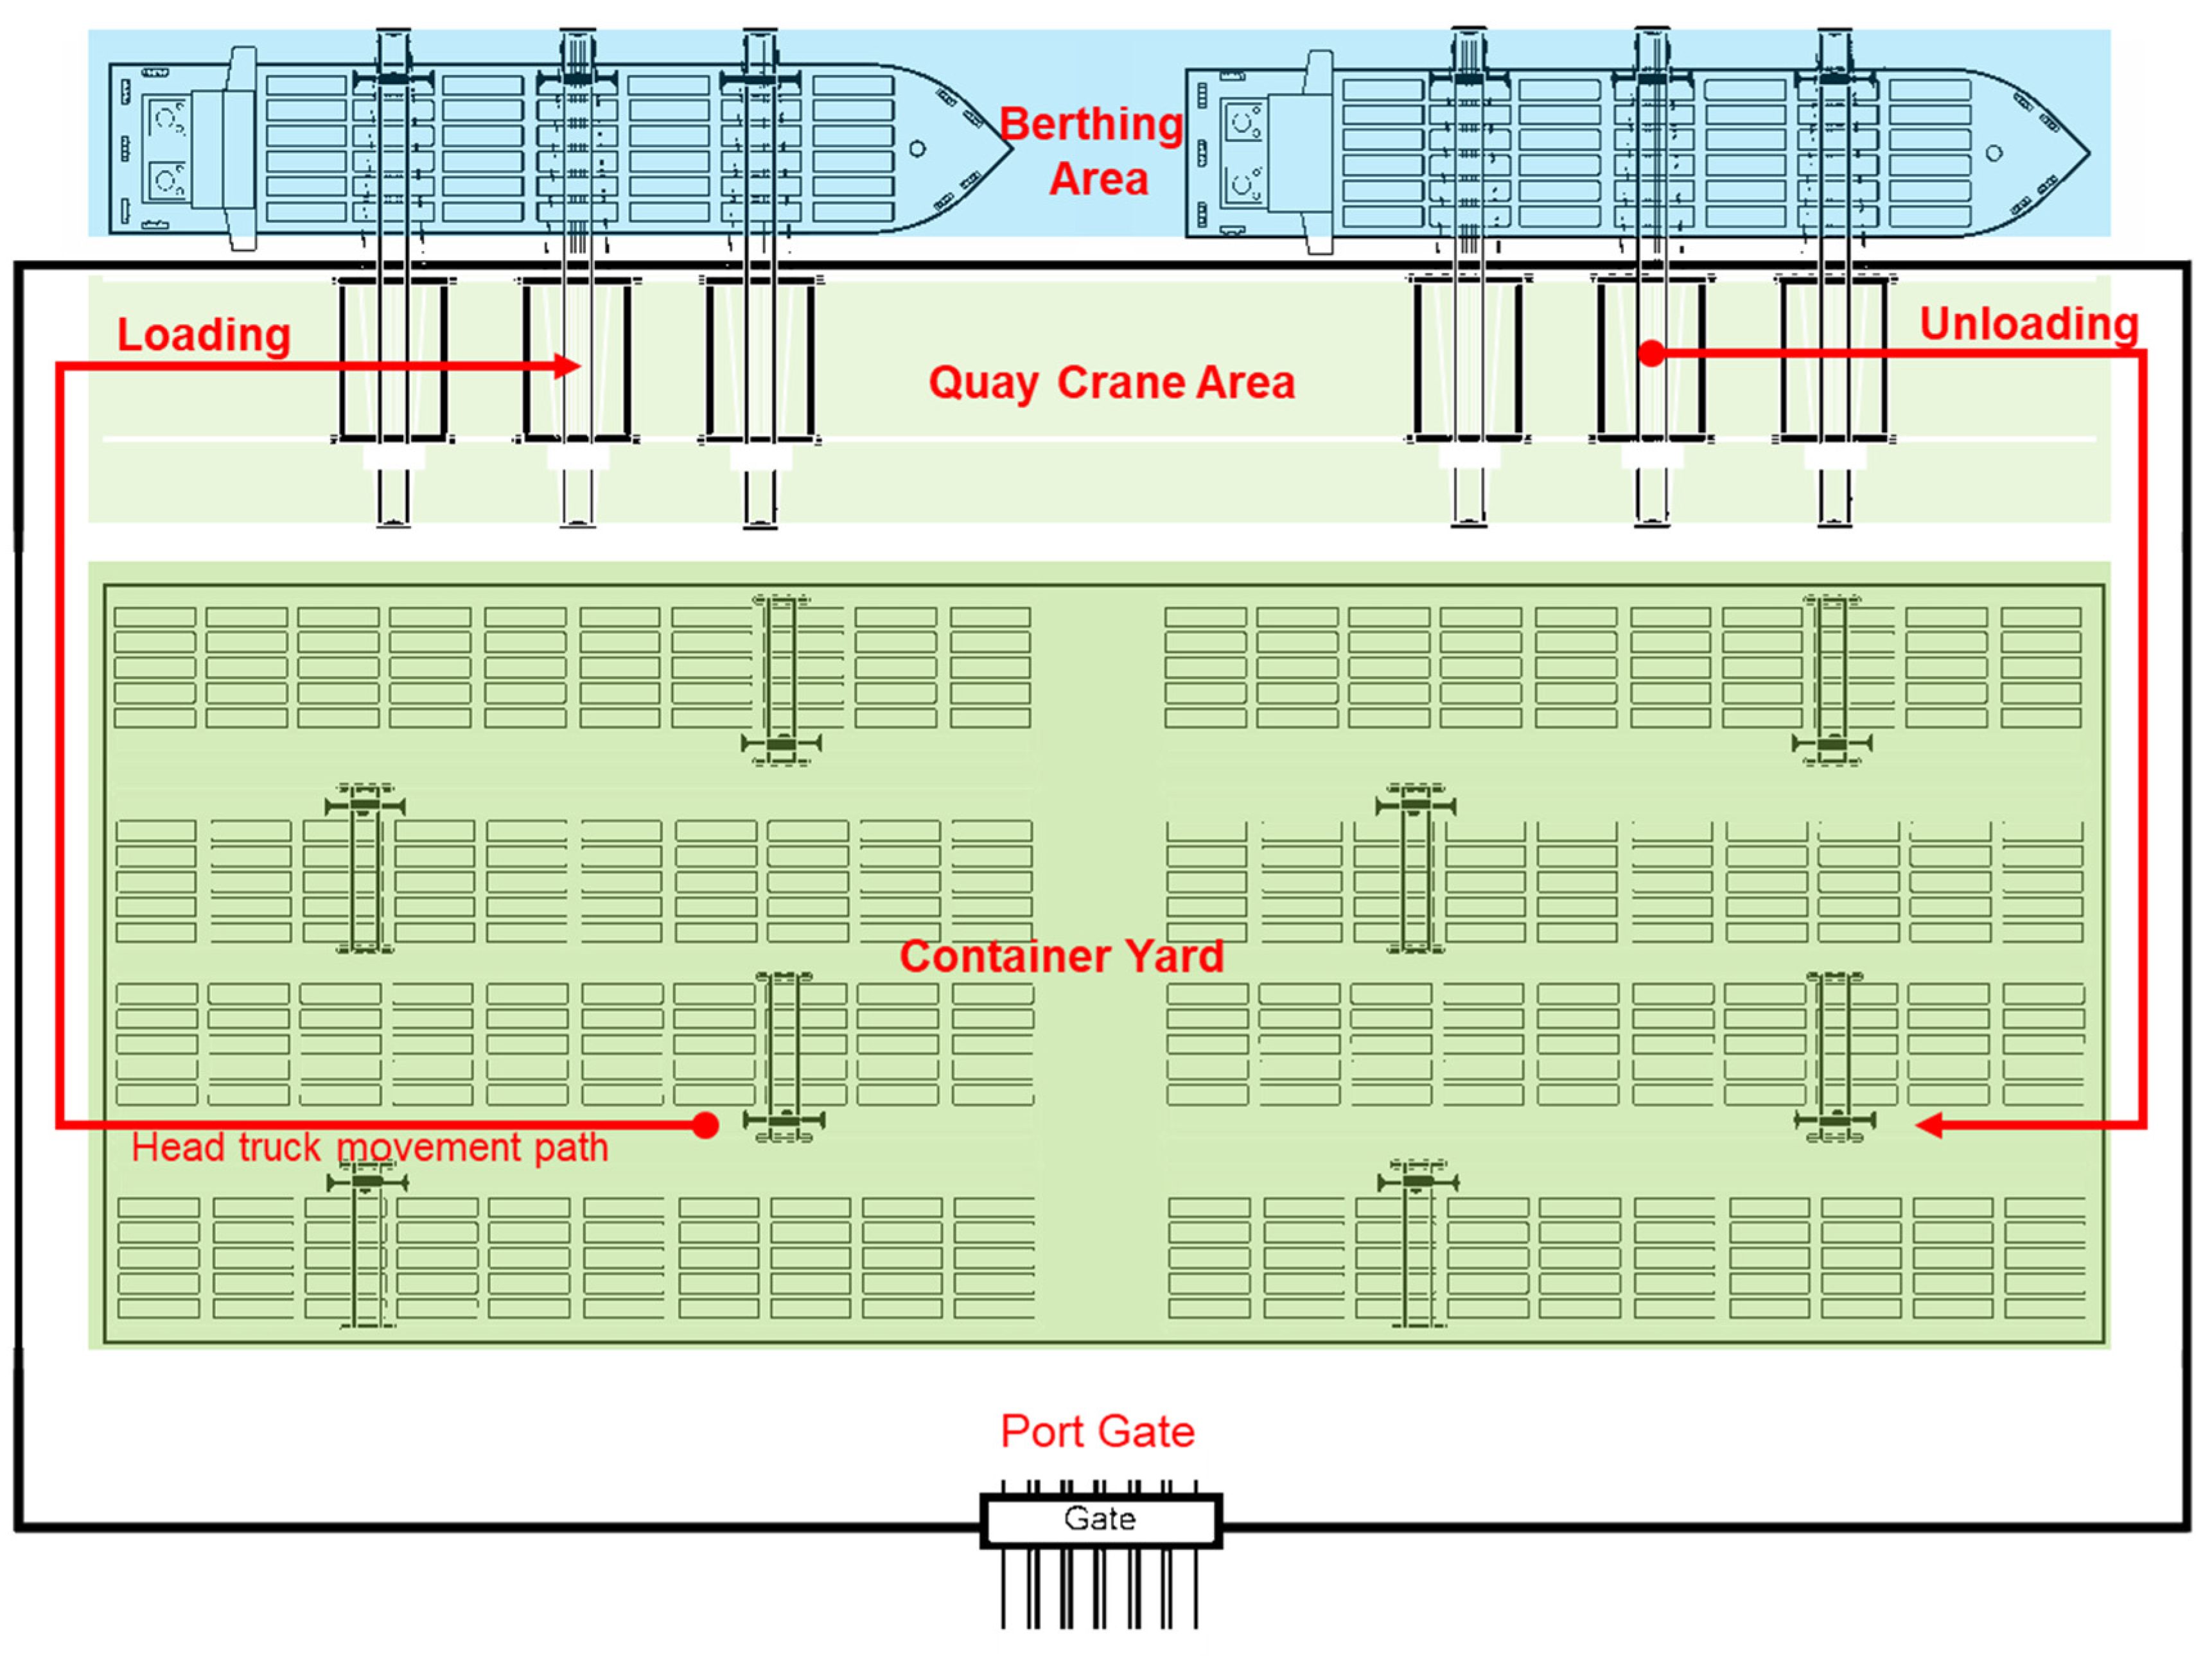
One of the essential parameters in this methodology is the travel distance, which is a critical factor influenced by the layout of a container terminal itself. An example of calculating the distance traveled by a terminal truck is shown in Figure 3. In it, the green area represents the container stacking area for each block, and the blue area denotes the dock area. The red line illustrates the distance traveled by the terminal truck for loading and unloading conditions. Distance calculations are based on the Manhattan distance metric system, which calculates the possible distance to move from one point to another using a straight motion pattern. This metric is particularly useful in a grid-like terminal layout, where movement paths are typically orthogonal. The distance variable used as an input value for the estimation calculation is the average distance traveled in each container movement process. This detailed consideration of travel distance ensures that our CO2 emission estimates accurately reflect the operational dynamics of the container terminal.

2.3. CO2 Emission Estimation Method Based on Recorded Energy Consumption

Estimating CO2 emissions based on recorded energy consumption uses data for diesel and electricity use for each device. Equation (4) shows the estimated CO2 emissions based on the recorded energy consumption.
E R E C , C O 2 = i = 1 n ( ( E C D i × f D , C O 2 ) + ( E C E i × f E , C O 2 ) )
where EREC,CO2 is the total CO2 emissions produced at one terminal in terms of kilograms, ECDi is the total recorded energy consumption from diesel-energy-sourced equipment in terms of liters within one year, ECEi is the recorded total energy consumption from electrical-energy-sourced equipment in terms of kWh units in one year, fD,CO2 is the CO2 emission factor from diesel energy sources, and fE,CO2 is the CO2 emission factor from electrical energy sources sourced from on-grid electricity. The results of this method are considered the most representative, close to the actual value, because the total energy consumption is based on records generally kept by port operators. All the dependent and independent variables utilized in the CO2 emission estimation model are systematically summarized in Table 1. Specifically, the total CO2 emissions produced at a terminal represent the dependent variable, while the total recorded energy consumption from diesel and electrical sources, as well as the CO2 emission factors for diesel and electrical sources, are the independent variables. The variables used in this method are considered the most representative and the closest to the actual values due to the reliance on energy consumption records maintained by port operators.

2.4. Robustness Test

The validation of the proposed model is achieved by comparing the estimated CO2 emissions derived from our model with actual CO2 emissions calculated based on daily fuel consumption data recorded at the port. The verification of the model involves a robustness test, which evaluates the consistency and reliability of the model’s estimates. Specifically, this test examines the deviation between CO2 emission estimates based on recorded daily fuel consumption and those calculated from container movement data. This dual approach of validation and verification provides a comprehensive assessment of the model’s performance, ensuring that it delivers reliable and accurate CO2 emission estimates.
A robustness test was carried out in this study through a linear regression test using a residual plot. A residual plot is a graph used to visualize the residuals from the regression model against the predicted values. The goal is to help identify patterns or trends in the residuals, which can provide insight into how the regression model fits the data. The residual value is calculated as the difference between the actual value and the predicted value using Equation (5):
e i = y i y i ^
where y i is the actual value of the dependent variable for the i-th observation; in this case, it is an estimate of CO2 based on energy consumption, and y i ^ is the value predicted by the regression model for the i-th observation; in this case, it is an estimate of CO2 emissions based on movement modalities. The residual in linear regression refers to the difference between the actual observed value of the dependent variable and the value predicted by the regression model. In this context, “residual” is also often referred to as “error” or “residual deviation”. Residuals reflect how far the actual value of the dependent variable differs from the expected value based on the regression model. If the residual is small, the model prediction is close to the actual value. However, if the residuals are significant, the model cannot correctly explain the variation in the data. Other factors not included in the model may influence the dependent variable.

2.5. Case Study of Typical Container Port Operation

This study used a case study of a typical container port operation with a capacity of more than 500,000 TEUs/year. This terminal was selected because its container handling equipment—rubber-tire gantry cranes, terminal trucks, and quay cranes—and its parallel layout are representative of the configurations commonly used in non-autonomous container terminal operation. Case studies use data approaches from primary and secondary sources. Primary sources can be obtained from container port data records, including fuel consumption per piece of equipment, throughput, equipment specifications, and port layout. In addition to primary data, secondary sources were collected from various open sources. These included annual reports available on the official port website, Google Maps data for layout analysis, information from manufacturers of container handling equipment, and emission factor data from various relevant sources. The use of secondary data supports the validity and accuracy of our analysis by providing additional context and reference points for the directly collected data.
The terminal characteristics of the container port used as a case study are shown in Table 2. This port has a pier length of 950 m with a depth of −10 m. This port has 10 quay container cranes, 25 RTGs, and 40 terminal trucks. Of all the existing container handlers, most prime movers used are the diesel type. The port used as a case study has a parallel-type layout, with a storage yard in one location, along with a wharf and office area. Satellite imagery of this case study is shown in Figure 4.

3. Results and Discussions

3.1. Estimation of Results of CO2 Emissions

The results of the CO2 emission estimations based on the proposed model are shown in Figure 5. From these estimation results, the CO2 estimate for container cranes is ±4581 tons/year, for rubber-tire gantry cranes it is ±2183 tons/year, for terminal trucks it is ±1184 tons/year, and for reach stackers it is ±234 tons/year; thus, the total CO2 emissions are ±8183 ton/year. These estimates highlight the dominant contribution of container cranes, accounting for over 50% of total emissions, followed by rubber-tire gantry cranes and terminal trucks. Moreover, this study confirms that CO2 emissions at container ports are influenced by the type of equipment used and the port layout.
In this case study, the total CO2 emissions were quantified and then normalized by the number of containers handled, resulting in a CO2 emission rate of 15.6 kg/TEU. This emission rate is considered average for container terminal CO2 emissions, aligning with the findings from previous research reporting values ranging from 9.3 to 26.5 kg/TEU [25,26,27]. As a comparison, CO2 emission rates at ports worldwide vary significantly depending on operational patterns and the specifications of container handling equipment, as detailed in Table 3. This variation highlights the influence of factors such as equipment type, fuel efficiency, and terminal layout on overall emission levels. The elevated emission rate observed in this study can be primarily attributed to the container cranes, which predominantly utilize diesel engines as their prime movers. This contrasts with recent advancements in the industry, where many manufacturers are transitioning to hybrid or fully electric cranes [28,29]. While older diesel-powered equipment tends to have higher emissions due to less efficient engine technology, this study focuses on a port that still predominantly relies on conventional diesel-powered cranes. Therefore, the emissions data in this study reflect the performance of such equipment, which is still common in many terminals worldwide.
Furthermore, the CO2 emissions were calculated based on the CO2 emission factors for each type of container handling equipment. Specifically, the CO2 emission factor for diesel engines is 2.67 kg CO2 per liter of diesel, as referenced in the 2006 IPCC Guidelines [30]. For electric energy, the CO2 emission factor depends on the national grid power plant, which varies by region. In this study, the emissions from electric-powered equipment were calculated based on the emission factors provided by the Ministry of Energy and Mineral Resources [31].
The comparison results of the two CO2 estimation models are shown in Figure 6. Based on the results of CO2 emission estimates using the energy consumption model, the total emissions were ±8322 ton/year, while the estimated CO2 emissions using the movement model were estimated at ±8183 ton/year. These results show that the estimated value based on energy consumption is greater than the estimate based on movement models, but is still within normal limits. Both models consistently show that the most significant contributions to emissions at container ports are from container cranes, with emission contributions of 56%, and rubber-tire gantry cranes, with contributions of 27%. In comparison, the remainder is contributed by terminal trucks, at 14%, while reach stackers contribute 3%. These results are consistent with those of previous research, where container terminals with parallel quay crane layouts contribute more significantly to emissions than do other types of container handling equipment [32,33]. These results can provide direction for research and development in container terminals; the greatest decarbonization can be carried out by electrifying quay cranes.
The findings from this study highlight several key points for discussion. Firstly, the higher-than-average emission rate underscores the significant environmental impact of diesel-powered container cranes compared to that of more modern, eco-friendly alternatives. This suggests a pressing need for ports to consider upgrading their equipment to reduce CO2 emissions. In comparison to similar studies, this research provides a benchmark within the range of reported CO2 emissions for container ports. By identifying container cranes as the largest contributors to emissions, this study emphasizes the critical area in which improvements can lead to substantial reductions in the carbon footprint.
From a managerial perspective, the results advocate for the adoption of hybrid or electric container handling equipment to mitigate emissions. Practical implications include the need for port operators to evaluate their current equipment and explore investments in newer, greener technologies. Implementing the approach used in this study can aid in assessing the emission profiles of container ports more accurately. By comparing daily fuel consumption data with CO2 emission estimates, port operators can better understand the effectiveness of different equipment types and operational practices. The results also provide a basis for setting more stringent environmental targets and developing strategies to achieve them, ultimately contributing to more sustainable port operation.

3.2. Robustness of the Proposed Models

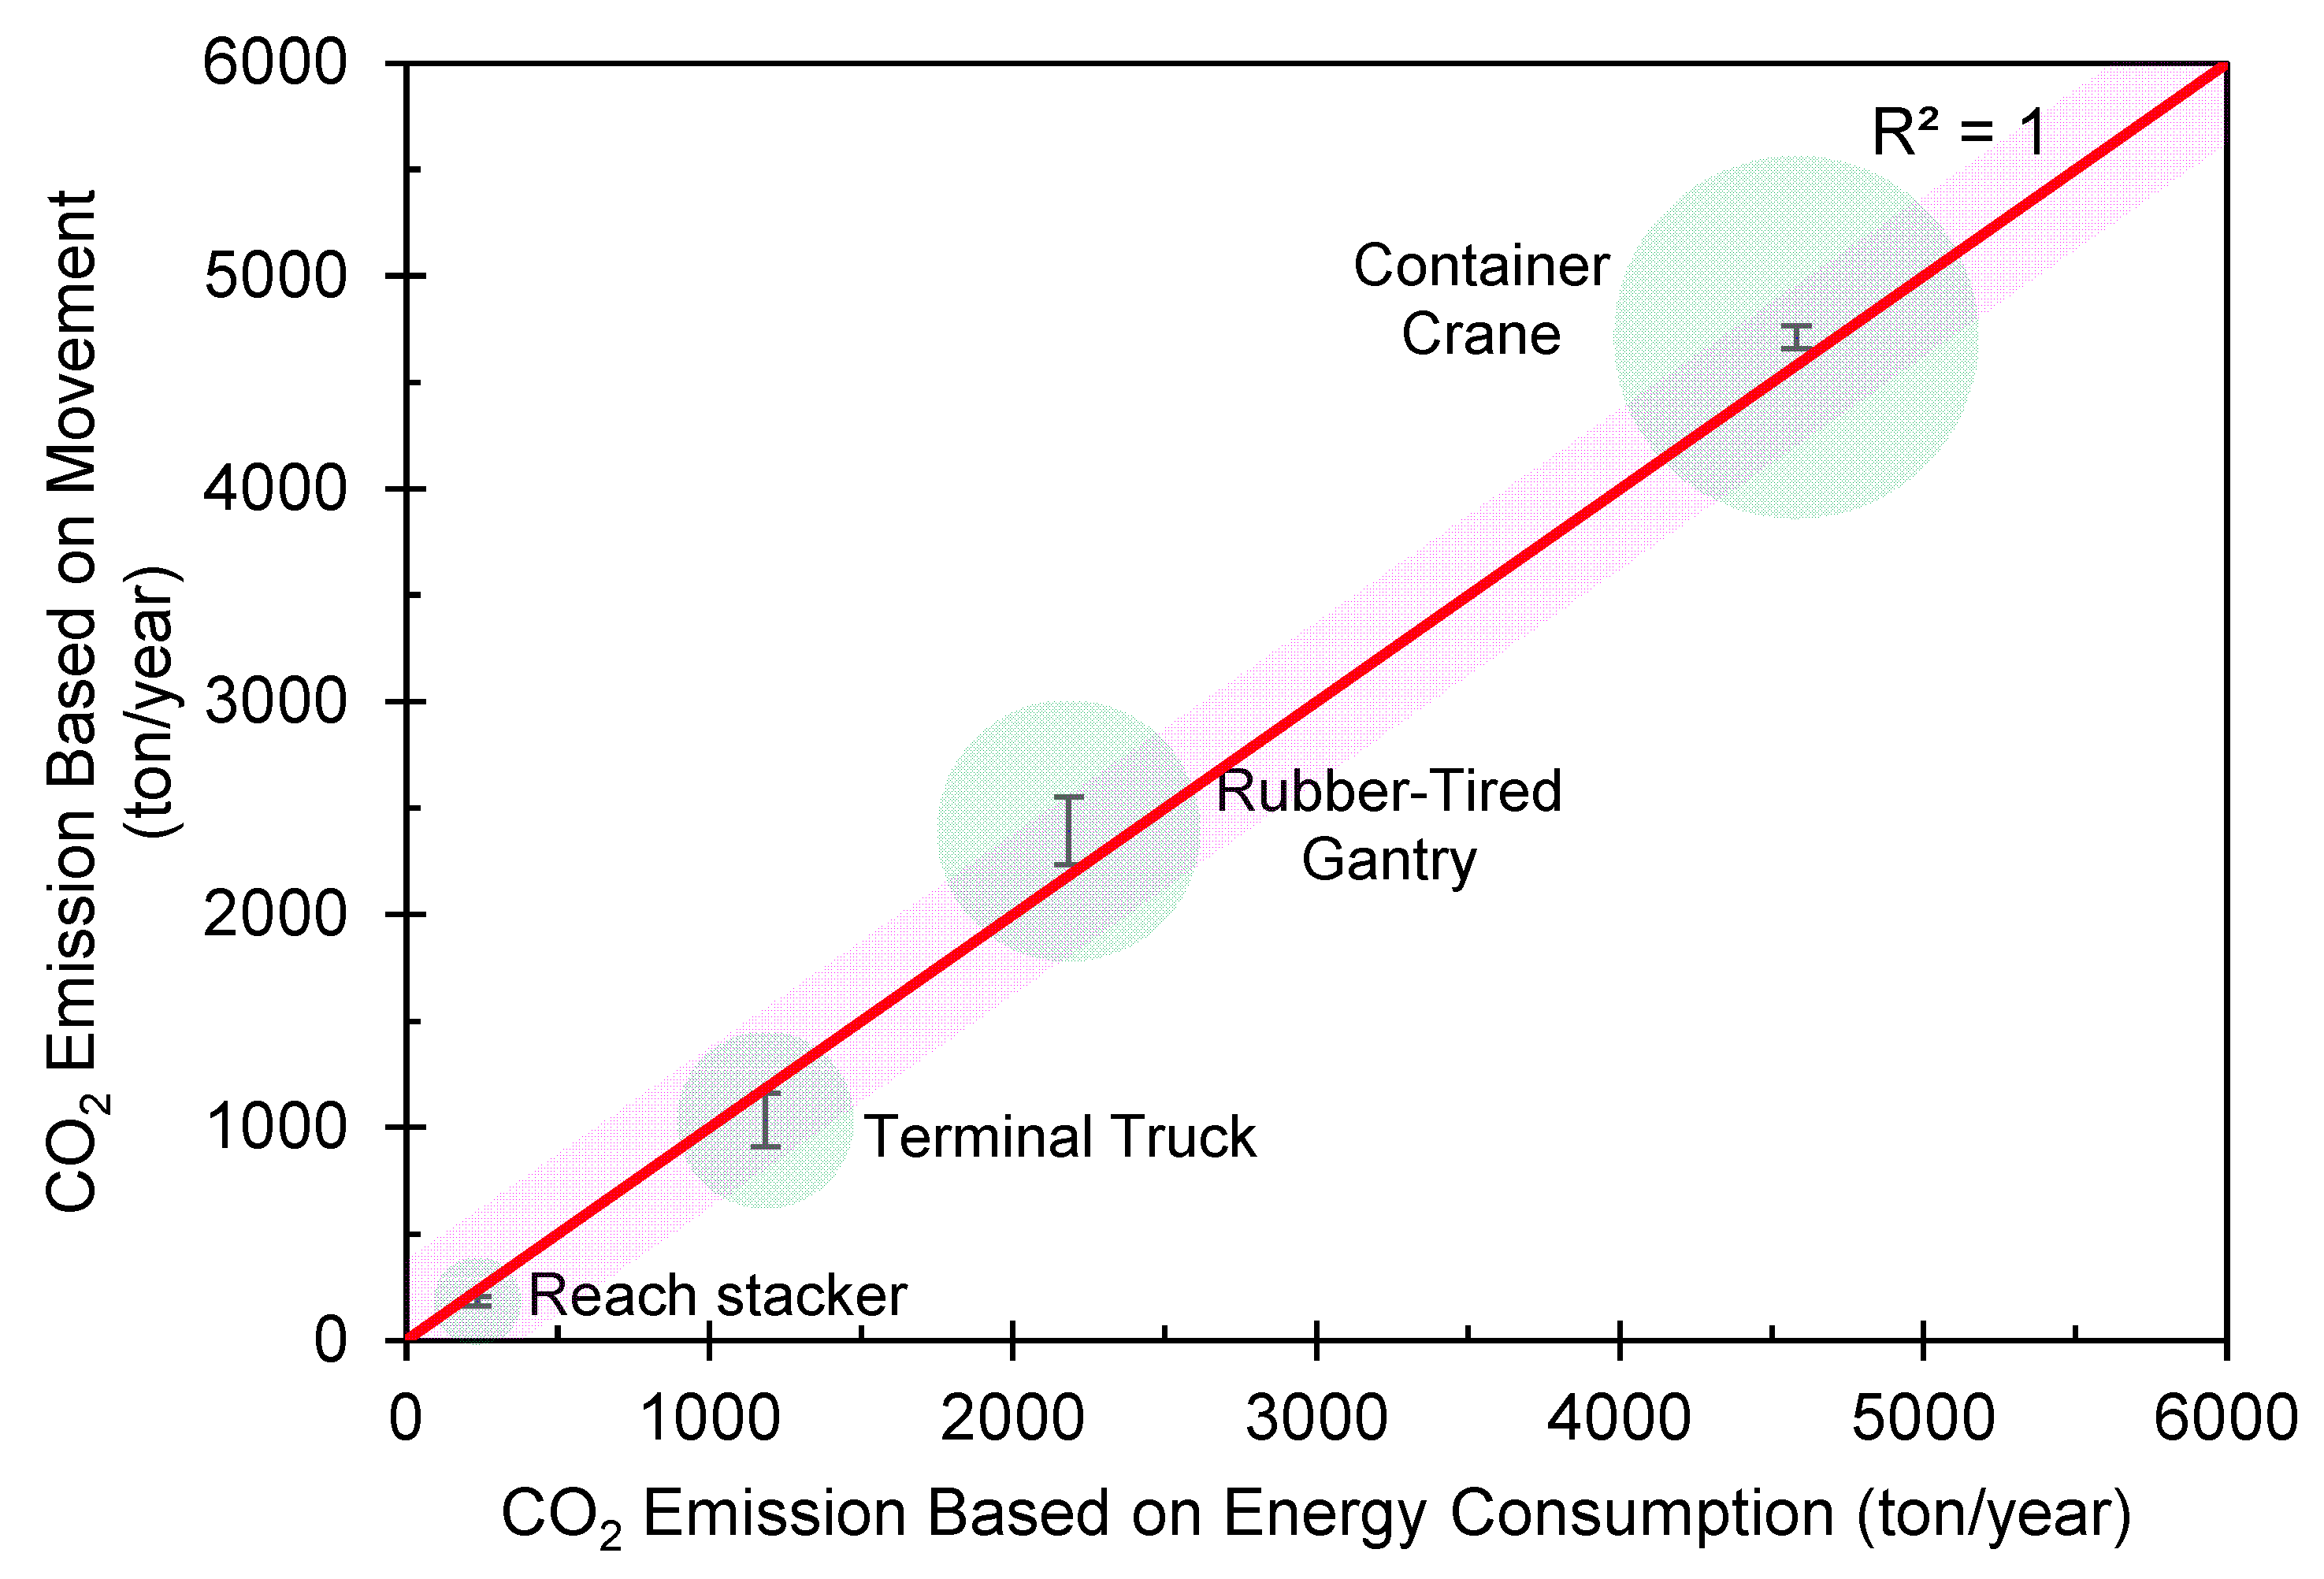
The results of the robustness test of the proposed model are shown in Figure 7, where the results of CO2 emission estimations based on the movement model are compared with those of CO2 emission estimations based on energy consumption. The results of the robustness test show that the emission estimates from the proposed model for each piece of container handling equipment are in good agreement, with an R-squared value close to 1, which indicates that predictions are identical to the observed values. The reach stacker obtained the lowest residual value, where the predicted value was below the observed value of 21.6 tons/year. Meanwhile, the rubber-tire gantry crane shows the highest residual value, with the predicted value above the observed value of 157.7 tons/year. If the residual value is compared with the emission value based on energy consumption record data, the deviation obtained is 0.01%. This result is consistent with operational patterns at container ports where reach stackers have limited movement and are generally only used to assist rehandled containers. Meanwhile, rubber-tire gantry cranes have an independent operating pattern and a wide operation range, in which they complete more vertical and horizontal movements than does other equipment. Furthermore, these results are consistent with those of several other studies that try to understand the operating patterns of rubber-tire gantry cranes, which influence productivity and fuel consumption [34,35].

4. Conclusions

This study presents a systematic approach for estimating CO2 emissions at container ports using both container movement data and recorded energy consumption for various pieces of cargo handling equipment. Through a detailed case study of a container terminal with an annual throughput capacity exceeding 500,000 TEUs, we estimated the total CO2 emissions to be approximately 8183 tons per year. Our analysis identified that quayside container cranes are the most significant contributors to emissions, accounting for 56% of the total, followed by rubber-tire gantry cranes at 27% and terminal trucks at 14%. The emissions per TEU for the terminal were calculated as 15.6 kg/TEU. The proposed models for estimating CO2 emissions demonstrated a high level of accuracy, with a strong agreement between estimated and recorded values. The R-squared value was close to 1, and the deviation between the estimated and observed results was under 1%. Notably, the reach stackers showed the lowest residual values, while the rubber-tire gantry cranes displayed the highest.
The significant contributions of this work include providing a robust methodology for CO2 emission estimations, which can be applied to similar container ports worldwide. The results highlight the need for targeted interventions to reduce emissions, particularly in quayside container cranes, which are identified as a major source of CO2 emissions. These findings underscore the importance of adopting cleaner technologies, such as hybrid or fully electric cranes, to achieve substantial reductions in emissions. However, this study has limitations, including its reliance on data from a single case study, which may affect the generalizability of the results. Future research should address these limitations by incorporating data from multiple ports and conducting a comprehensive cost–benefit analysis of emission-reduction strategies. This would provide a broader perspective regarding the feasibility and impact of various interventions. In conclusion, the results of this study support the development of policies aimed at reducing CO2 emissions and advancing sustainable practices in port operations. By establishing a reliable baseline for container port emissions, this research contributes to the formulation of effective strategies for achieving a greener and more sustainable port environment.

Author Contributions

Conceptualization, M.A.B.; Methodology, M.A.B.; Software, F.I.; Formal analysis, M.A.B.; Investigation, M.A.B.; Resources, F.I.; Writing—original draft, M.A.B.; Writing—review & editing, T.S. All authors have read and agreed to the published version of the manuscript.

Funding

This research was funded by Directorate Research and Development Universitas Indonesia (DRPM UI) grant number NKB-534/UN2.RST/HKP.05.00/2023 and The APC was funded by DRPM UI.

Informed Consent Statement

Not applicable.

Data Availability Statement

The data presented in this study are available on request from the corresponding author.

Acknowledgments

The authors thank the Directorate Research and Development Universitas Indonesia (DRPM UI) for providing the International Indexed Publication Grant (PUTI) Q1, number NKB-534/UN2.RST/HKP.05.00/2023, in support of this research.

Conflicts of Interest

The authors declare no conflict of interest.

References

  1. Walker, T.R.; Adebambo, O.; Feijoo, M.C.; Elhaimer, E.; Hossain, T.; Edwards, S.J.; Morrison, C.E.; Romo, J.; Sharma, N.; Taylor, S.; et al. Environmental Effects of Marine Transportation. In World Seas: An Environmental Evaluation Volume III: Ecological Issues and Environmental Impacts; Academic Press: Cambridge, MA, USA, 2019; pp. 505–530. [Google Scholar] [CrossRef]
  2. Notteboom, T.; Pallis, A.; Rodrigue, J.-P. Port Economics, Management and Policy; Routledge: London, UK, 2022. [Google Scholar] [CrossRef]
  3. Neves, R.A.; Lopes, A.; Naveira, C.; Rodrigues, N.; Silveira, R.B.; Guimarães, T.; Filardi, F.; Santos, L.N. Socio-economic impacts of a maritime industrial development area (MIDA) model in Latin America: The case of the Açu Port-Industrial Complex. WMU J. Marit. Aff. 2022, 21, 351–368. [Google Scholar] [CrossRef]
  4. Tokuslu, A. Estimating greenhouse gas emissions from ships on four ports of Georgia from 2010 to 2018. Environ. Monit. Assess. 2021, 193, 385. [Google Scholar] [CrossRef] [PubMed]
  5. International Maritime Organization (IMO). IMO’s Work to Cut GHG Emissions from Ships. Available online: https://www.imo.org/en/MediaCentre/HotTopics/Pages/Cutting-GHG-emissions.aspx (accessed on 11 November 2024).
  6. Romano, A.; Yang, Z. Decarbonisation of shipping: A state of the art survey for 2000–2020. Ocean Coast. Manag. 2021, 214, 105936. [Google Scholar] [CrossRef]
  7. Budiyanto, M.A.; Huzaifi, M.H.; Sirait, S.J.; Prayoga, P.H.N. Evaluation of CO₂ emissions and energy use with different container terminal layouts. Sci. Rep. 2021, 11, 5476. [Google Scholar] [CrossRef]
  8. Ros Chaos, S. The Transport and Environmental Impacts of Cruise Ships: Application to the Case of the Port of Barcelona. Ph.D. Thesis, Departament d’Enginyeria Civil i Ambiental, Universitat Politècnica de Catalunya (UPC), Barcelona, Spain, 2020. Available online: http://hdl.handle.net/2117/340974 (accessed on 11 November 2024). [CrossRef]
  9. Azarkamand, S.; Wooldridge, C.; Darbra, R.M. Review of initiatives and methodologies to reduce CO2 emissions and climate change effects in ports. Int. J. Environ. Res. Public Health 2020, 17, 3858. [Google Scholar] [CrossRef]
  10. Azarkamand, S. Development of a Standardized Tool to Calculate Carbon Footprint in Ports. Ph.D. Thesis, Universitat Politècnica de Catalunya, Barcelona, Spain, 2021. Available online: https://upcommons.upc.edu/handle/2117/360344 (accessed on 11 November 2024).
  11. Misra, A.; Panchabikesan, K.; Ayyasamy, E.; Ramalingam, V. Sustainability and Environmental Management for Ports. In International Solutions to Sustainable Energy, Policies and Applications; River Publishers: Aalborg, Denmark, 2020; pp. 303–320. [Google Scholar]
  12. Roh, S.; Thai, V.V.; Jang, H.; Yeo, G.T. The best practices of port sustainable development: A case study in Korea. Marit. Policy Manag. 2023, 50, 254–280. [Google Scholar] [CrossRef]
  13. Yang, Y.C.; Chang, W.M. Impacts of electric rubber-tired gantries on green port performance. Res. Transp. Bus. Manag. 2013, 8, 67–76. [Google Scholar] [CrossRef]
  14. Lee, H.; Park, D.; Choo, S.; Pham, H.T. Estimation of the Non-Greenhouse Gas Emissions Inventory from Ships in the Port of Incheon. Sustainability 2020, 12, 8231. [Google Scholar] [CrossRef]
  15. Chen, S.; Meng, Q.; Jia, P.; Kuang, H. An operational-mode-based method for estimating ship emissions in port waters. Transp. Res. Part D Transp. Environ. 2021, 101, 103080. [Google Scholar] [CrossRef]
  16. Iris, Ç.; Lam, J.S.L. A review of energy efficiency in ports: Operational strategies, technologies and energy management systems. Renew. Sustain. Energy Rev. 2019, 112, 170–182. [Google Scholar] [CrossRef]
  17. He, J.; Huang, Y.; Yan, W.; Wang, S. Integrated internal truck, yard crane and quay crane scheduling in a container terminal considering energy consumption. Expert. Syst. Appl. 2015, 42, 2464–2487. [Google Scholar] [CrossRef]
  18. Yao, L.; Ng, A.K.; Liu, B.; Li, D.; Feng, L. A study on multiple types of yard cranes rescheduling in ports considering carbon emission. Marit. Policy Manag. 2024, 7, 1–35. [Google Scholar] [CrossRef]
  19. Sha, M.; Zhang, T.; Lan, Y.; Zhou, X.; Qin, T.; Yu, D.; Chen, K. Scheduling optimization of yard cranes with minimal energy consumption at container terminals. Comput. Ind. Eng. 2017, 113, 704–713. [Google Scholar] [CrossRef]
  20. Zeng, Y.; Yuan, X.; Hou, B. Analysis of Carbon Emission Reduction at the Port of Integrated Logistics: The Port of Shanghai Case Study. Sustainability 2023, 15, 10914. [Google Scholar] [CrossRef]
  21. Yang, Y.C. Operating strategies of CO2 reduction for a container terminal based on carbon footprint perspective. J. Clean. Prod. 2017, 141, 472–480. [Google Scholar] [CrossRef]
  22. Yu, H.; Ge, Y.E.; Chen, J.; Luo, L.; Tan, C.; Liu, D. CO₂ emission evaluation of yard tractors during loading at container terminals. Transp. Res. D Transp. Env. 2017, 53, 17–36. [Google Scholar] [CrossRef]
  23. Tan, C.; Qin, T.; He, J.; Wang, Y.; Yu, H. Yard space allocation of container port based on dual cycle strategy. Ocean Coast. Manag. 2024, 247, 106915. [Google Scholar] [CrossRef]
  24. 2006 IPCC Guidelines for National Greenhouse Gas Inventories—IPCC n.d. Available online: https://www.ipcc.ch/report/2006-ipcc-guidelines-for-national-greenhouse-gas-inventories/ (accessed on 24 January 2024).
  25. Geerlings, H.; van Duin, R. A new method for assessing CO2 -emissions from container terminals: A promising approach applied in Rotterdam. J. Clean. Prod. 2011, 19, 657–666. [Google Scholar] [CrossRef]
  26. Martínez-Moya, J.; Vazquez-Paja, B.; Gimenez Maldonado, J.A. Energy efficiency and CO2 emissions of port container terminal equipment: Evidence from the Port of Valencia. Energy Policy 2019, 131, 312–319. [Google Scholar] [CrossRef]
  27. Hasan, K.R.; Zhang, W.; Shi, W. A Sustainable Port-Hinterland Container Transport System: The Simulation-Based Scenarios for CO2 Emission Reduction. Sustainability 2023, 15, 9444. [Google Scholar] [CrossRef]
  28. Rijsenbrij, J.C.; Wieschemann, A. Automation and electric drives: A powerful union for sustainable container terminal design. In Handbook of Terminal Planning; Operations Research/Computer Science Interfaces Series; Springer: Berlin/Heidelberg, Germany, 2020; pp. 101–123. [Google Scholar] [CrossRef]
  29. Vlahopoulos, D.; Bouhouras, A.S. Solution for RTG crane power supply with the use of a hybrid energy storage system based on literature review. Sustain. Energy Technol. Assess. 2022, 52, 102351. [Google Scholar] [CrossRef]
  30. United Nations Environment Programme (UNEP). IPCC Guidelines for National Greenhouse Gas Inventories. Intergovernmental Panel on Climate Change (IPCC). 2006. Available online: https://www.ipcc-nggip.iges.or.jp/public/2006gl/ (accessed on 19 November 2024).
  31. Ministry of Energy and Mineral Resources (ESDM RI). Greenhouse Gas (GHG) Emission Factor for the National Power Grid System. 2019. Available online: https://gatrik.esdm.go.id/assets/uploads/download_index/files/96d7c-nilai-fe-grk-sistem-ketenagalistrikan-tahun-2019.pdf (accessed on 11 November 2024).
  32. Huzaifi, M.H.; Budiyanto, M.A.; Sirait, S.J. Study on the carbon emission evaluation in a container port based on energy consumption data. Evergreen 2020, 7, 97–103. [Google Scholar] [CrossRef]
  33. Budiyanto, M.A.; Huzaifi, M.H.; Sirait, S.J. Estimating of CO2 Emissions in a container port based on modality movement in the terminal area. Int. J. Technol. 2019, 10, 1618–1625. [Google Scholar] [CrossRef]
  34. Papaioannou, V.; Pietrosanti, S.; Holderbaum, W.; Becerra, V.M.; Mayer, R. Analysis of energy usage for RTG cranes. Energy 2017, 125, 337–344. [Google Scholar] [CrossRef]
  35. Kastner, M.; Jahn, C. Impact of Rubber-Tired Gantry Crane Dimension on Container Terminal Productivity. In Lecture Notes in Computer Science (Including Subseries Lecture Notes in Artificial Intelligence and Lecture Notes in Bioinformatics); Springer: Cham, Switzerland, 2022; Volume 13557, pp. 74–88. [Google Scholar] [CrossRef]
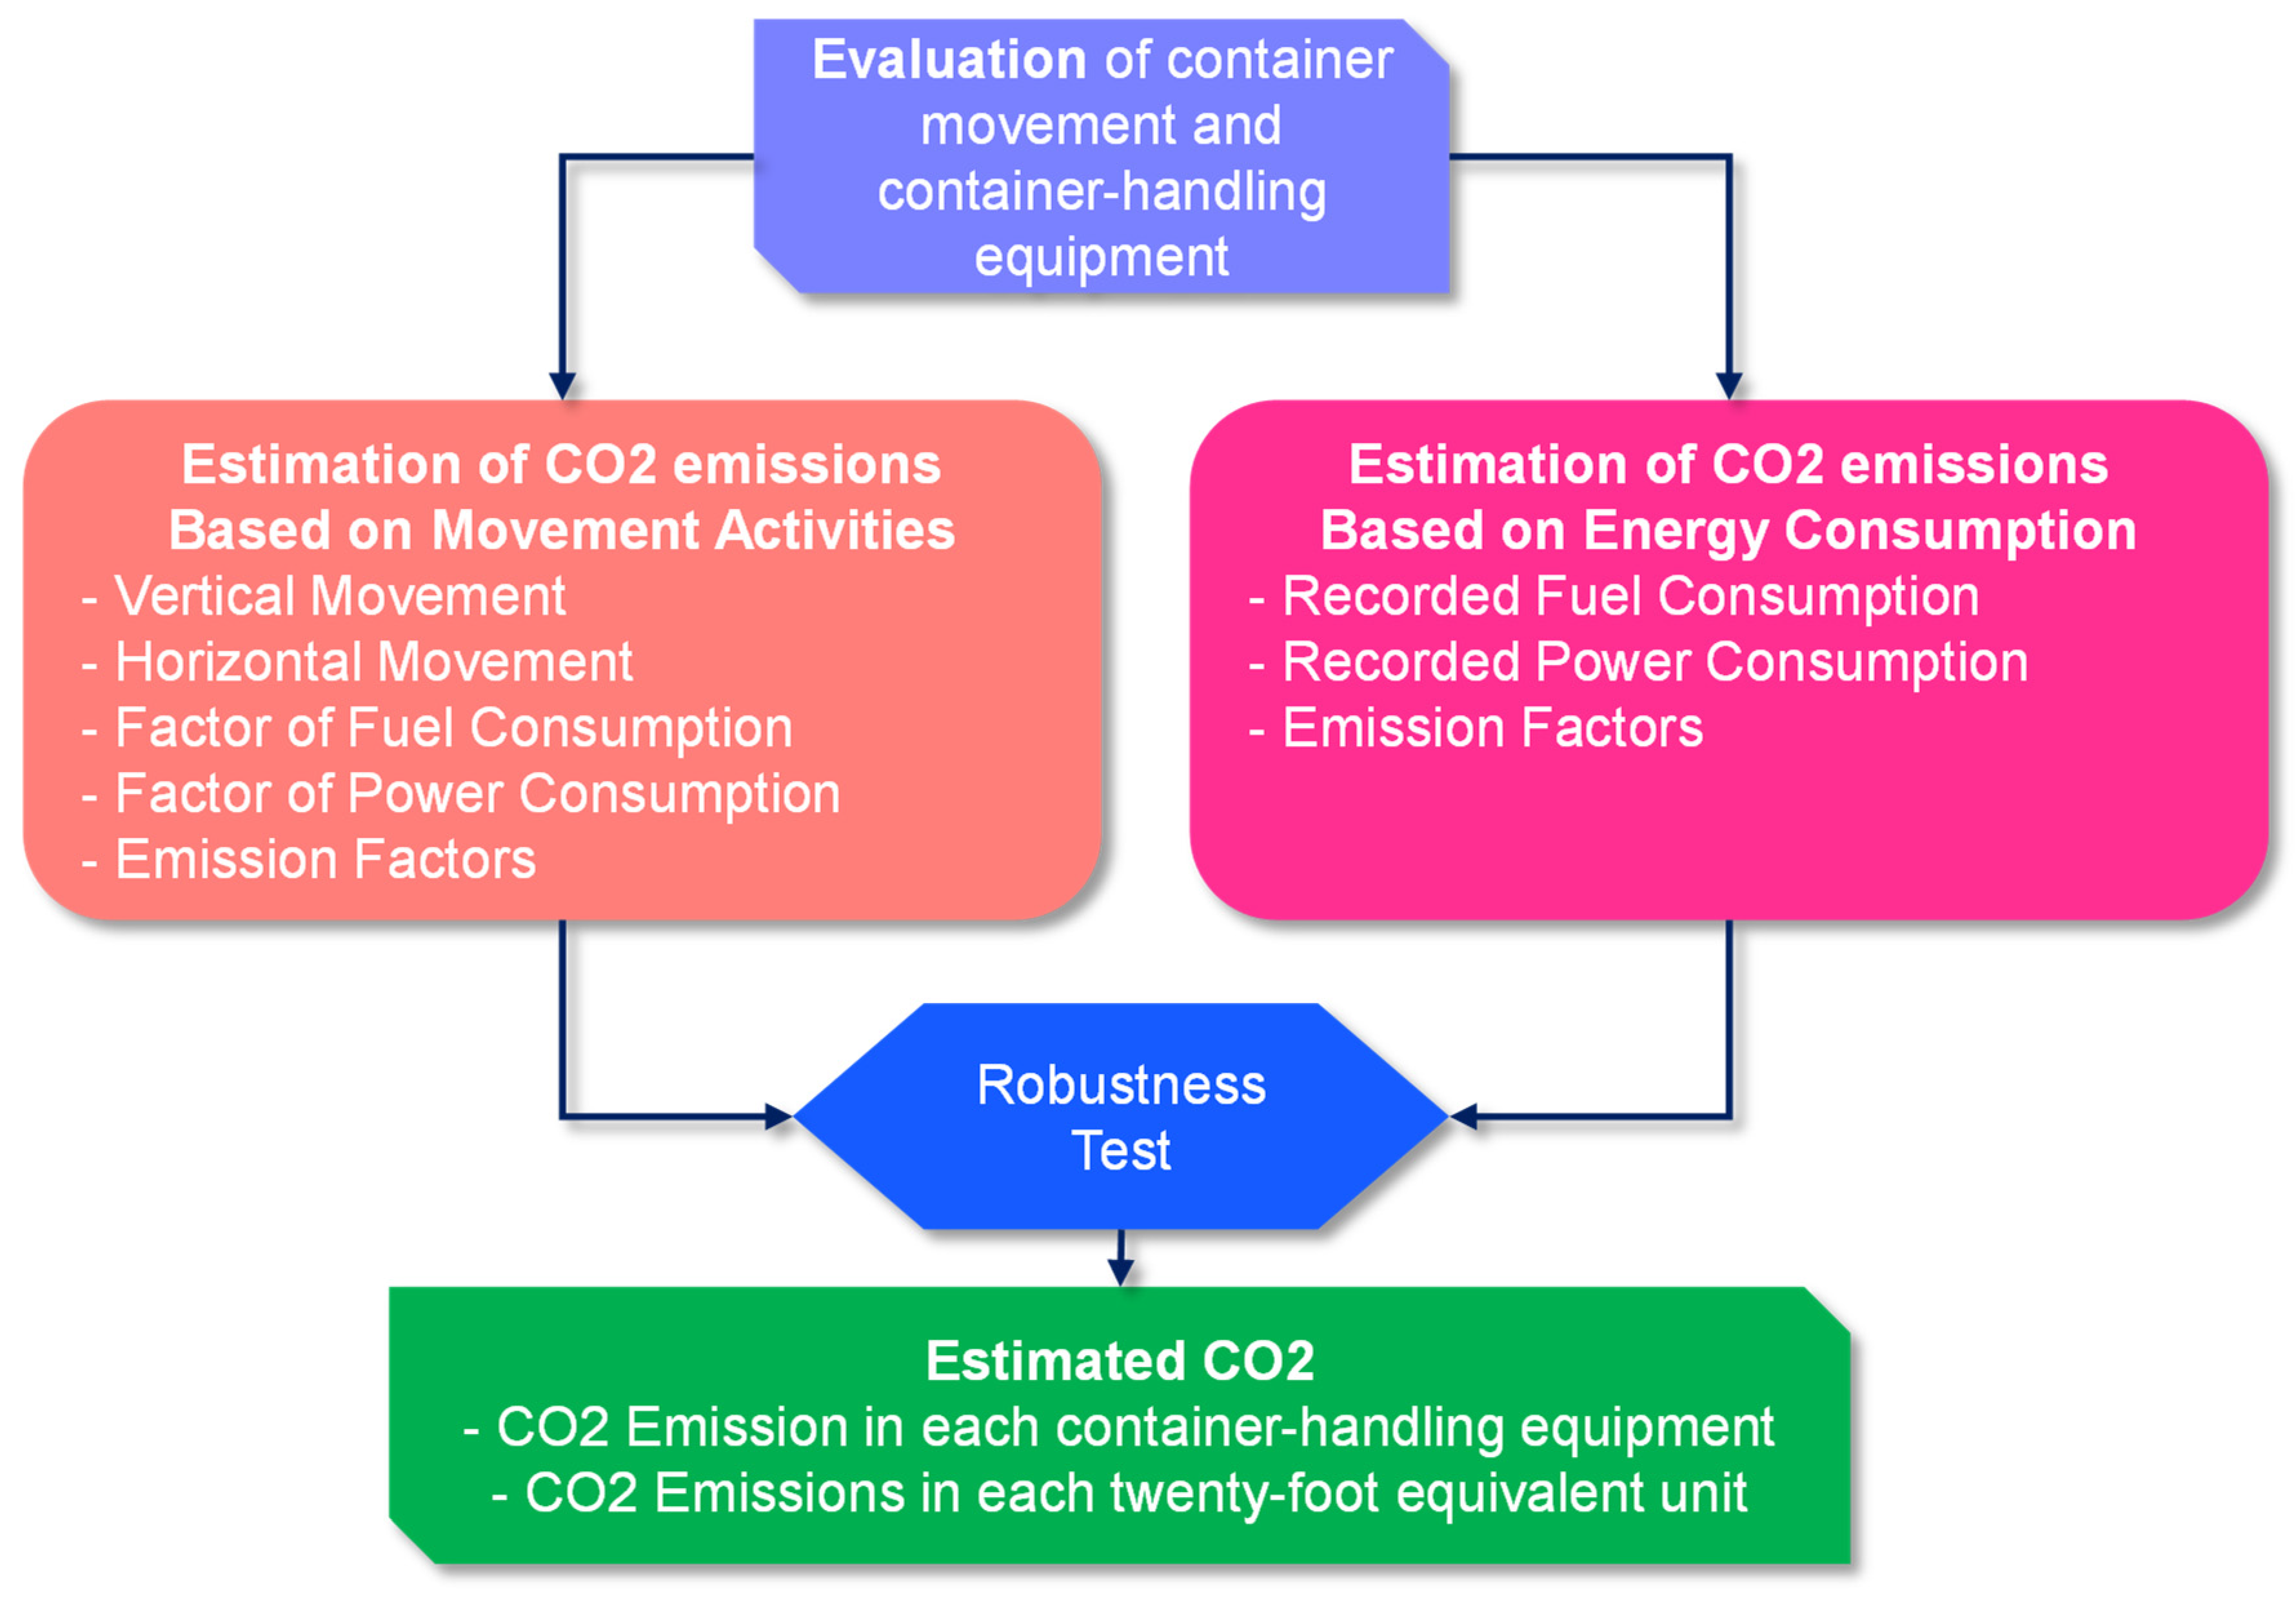
Figure 1. Systematic research methods for CO2 emissions.
Sustainability 16 10293 g001
Figure 2. Typical container movement and prime movers in container ports.
Sustainability 16 10293 g002
Figure 3. Illustration showing the calculation of the distance traveled by a container terminal truck.
Sustainability 16 10293 g003
Figure 4. Satellite imagery of the case study container port (retrieved from Google Maps on 4 January 2024).
Sustainability 16 10293 g004
Figure 5. Estimation result for CO2 emissions of the proposed models.
Sustainability 16 10293 g005
Figure 6. Estimation of CO2 emissions based on movement compared with those based on energy consumption.
Sustainability 16 10293 g006
Figure 7. Robustness of the proposed models.
Sustainability 16 10293 g007
Table 1. Variables used for the CO2 emission estimation model.
Independent VariableDependent Variable
Evaluation of container movement and cargo handling equipment.ype of equipment (quay crane, terminal truck, and gantry crane)CO2 emissions from equipment
CO2 emission estimation method based on container movement.Number of movements,
energy consumption variables for diesel and electricity,
average distance traveled
Total CO2 emissions
CO2 emission estimation method based on recorded energy consumption.Total recorded energy consumption from diesel and electrical sources
CO2 emission factors for diesel and electrical sources
Total CO2 emissions
Distance calculations and layout considerations.Terminal layout
Type of movement (vertical, horizontal)
Travel distance (used for CO2 estimation)
Distance traveled by terminal trucks.Container stacking area, dock area, and layout detailsDistance traveled by terminal trucks
Table 2. Container port characteristics of the case study port.
Terminal CharacteristicContainer Terminal
Layout typeParallel layout
Throughput526,039 TEUs/year
Wharf Data
Length950 m
Width31 m
Depth−10 m
Container Yard
Area124,847 m2
Capacity14,988 TEUs
Ground slot3342 TEUs
Reefer144
Amount of Equipment
Quay crane10
RTG 25
Truck40
Table 3. Comparison of CO2 emissions from several container terminals.
Case StudyCO2 EmissionsReference
Current study15.6 kg/TEU
Rotterdam Shortsea Terminal, The Netherlands9.3 kg/TEU[25]
Noatum Container Terminal, Valencia, Spain11.5 kg/TEU[26]
Port of Vigo, Spain14.1 kg/TEU[8]
Hanno Terminals, The Netherlands24.0 kg/TEU[25]
Chittagong Container Terminal, Bangladesh26.5 kg/TEU[27]
Disclaimer/Publisher’s Note: The statements, opinions and data contained in all publications are solely those of the individual author(s) and contributor(s) and not of MDPI and/or the editor(s). MDPI and/or the editor(s) disclaim responsibility for any injury to people or property resulting from any ideas, methods, instructions or products referred to in the content.