Article

Coordination Analysis Between Urban Livability and Population Distribution in China’s Major Urban Agglomerations

1
Chinese Academy of Surveying and Mapping, Beijing 100036, China
2
Department of Natural Resources of Shanxi Province, Taiyuan 030024, China
3
Department of Housing and Urban-Rural Development of Shanxi Province, Taiyuan 030013, China
*
Authors to whom correspondence should be addressed.
Sustainability 2024, 16(23), 10438; https://doi.org/10.3390/su162310438
Submission received: 14 October 2024 / Revised: 17 November 2024 / Accepted: 25 November 2024 / Published: 28 November 2024

Abstract

:
The mismatch between urban livability and population distribution can result in overcrowding and excessive pressure on ecosystem services if population growth surpasses urban capacity. Conversely, if urban expansion outpaces population needs, it can lead to underutilized infrastructure and inefficient land use. This study aims to assess the coordination between urban livability and population distribution in five major urban agglomerations in China: Beijing–Tianjin–Hebei (BTH), Yangtze River Delta (YRD), Pearl River Delta (PRD), Mid-Yangtze River (MYR), and Chengdu–Chongqing (CC). A comprehensive index for urban livability is established, from the aspects of social–economic development and ecosystem service. Additionally, a Coordination Distance Index (CDI) is developed to measure the relationship between urban livability and population distribution. Data from 2010, 2015, and 2020 are analyzed to evaluate the coordination levels and trends across the five urban agglomerations. The results show that from 2010 to 2020, most cities within these urban agglomerations experience improvements in their coordination levels, with the most notable advancements in the PRD and YRD regions. By 2020, the PRD and YRD were classified as having “high coordination”, while BTH, MYR, and CC were categorized as having “moderate coordination”. However, certain cities, such as Chengde in BTH, Shanghai in YRD, Ya’an in CC, and Zhuhai in PRD, still exhibited “low coordination”, highlighting areas requiring spatial planning adjustments. This study introduces a method for quantitatively assessing the coordination between urban livability and population distribution, providing essential insights for policymakers and urban planners to refine urbanization development strategies and population regulation policies in China’s major urban agglomerations.

1. Introduction

Global urbanization is currently experiencing an unprecedented surge, particularly in developing countries, where rapid economic growth and demographic shifts are driving massive migrations to cities [1,2]. The expansion of metropolitan areas is not only altering landscapes but also transforming social and economic dynamics on a global scale [3]. As cities grow, they face various challenges in ecological management, including the sustainable provision of ecosystem services, the mitigation of environmental degradation, and the maintenance of biodiversity [1,4]. These issues underscore the need for integrated urban planning and policy frameworks that can balance the demands of urban development with the preservation of ecological integrity, ensuring that cities remain livable and resilient for future generations [5,6].
According to World Urbanization Prospects (WUP) data released by the United Nations, 55% of the world’s population lives in urban areas, and this proportion is expected to increase to 68% by 2050 [7]. The successful management of the relationship between urbanization and population dynamics not only ensures equitable access to ecosystem services but also mitigates potential negative impacts of urbanization, such as increased pollution, urban heat islands, decreased water resources, and heightened vulnerability to climate change impacts [8,9,10]. To achieve the UN’s Sustainable Development Goals (SDGs) by 2030 [11], particularly SDG 11 (making cities and human settlements inclusive, safe, resilient, and sustainable) and SDG 15 (protecting, restoring, and sustainably managing habitats), it is important to fully understand and quantitatively measure urban livability and its correlation with population distribution. Thus, fostering a balanced relationship between urban livability and demographic changes is not only crucial for the well-being of current urban residents but also for the long-term sustainability of urban development.
Taking into account the variations in geographical location, climate, and socioeconomic context across different cities, researchers have focused on studying city-specific urban livability challenges to align with the goals of sustainable development [12,13]. In India, rapid urbanization and population growth pose serious challenges to urban livability. Paul and Sen [14] point out that improving urban livability in Indian cities requires not only infrastructure enhancements but also attention to sociocultural factors, such as strengthening community safety and enhancing public services, to improve residents’ overall life satisfaction. Another study finds that due to the high population density, limited resources, and weak public infrastructure, the quality of life is generally low, further weakening the livability, and demonstrates the discoordination of development in Kolkata city of India [15]. The research by Parker and Simpson [16] in Australia shows that urban livability benefits from prioritizing green spaces. By planning for ample parks, recreational areas, and public green spaces, Australia not only provides residents with a high-quality living environment but also effectively alleviates environmental pressure caused by population growth. Through sustainable green infrastructure planning, Australia has managed to maintain urban livability while accommodating population growth. In Brazil [12], the rise in population density in metropolitan areas has led to insufficient infrastructure and public services, particularly in informal communities. Future urban planning should place greater emphasis on community involvement and sustainable development to improve residents’ living conditions and enhance urban livability. In the Metro Vancouver region of Canada, Martino et al. [17] propose that urban livability can be understood through four systemic dimensions: accessibility, social diversity, affordability, and economic vitality, and they use machine learning methods to analyze the relationship between urban livability and population dynamics; the result shows that in areas with different population densities, the main factors affecting livability vary. This indicates the need to emphasize different factors based on population density to achieve more coordinated development.
China has gone through an unprecedented urbanizing period and the number of cities increased from 193 to 691 from 1978 to 2022 [18,19]. Currently, there are 19 major urban agglomerations formed by closely located cities in China. The generation and development of the regional urban agglomeration brings many positive impacts, such as economic agglomeration, technological innovation, and cultural integration [20,21,22,23]. However, the rapid concentration of large populations within urban agglomerations can lead to urban livability issues such as resource depletion and degradation of life quality due to the increasing pressure on urban social security, healthcare services, and other critical infrastructures [24,25,26,27]. The Coupling Coordination Degree Model (CCDM) is often adopted by Chinese researchers to explore the interrelationships between urban livability and population dynamics [28,29]. It measures the level of coordination within complex systems by evaluating the coupling and coordination degrees among two or more subsystems [30,31,32,33]. Studies by Xu and Yin [34] and Zeng et al. [35] have applied CCDM to examine the relationship between ecological aspects of urban livability and population changes in the Yangtze River Delta (YRD) urban agglomeration. Their findings indicate that, despite fluctuations, the region generally demonstrates a moderate to high degree of coupling coordination. Some scholars use the indicator of elasticity coefficient to explore the relationship between urban livability and population growth [36]. This indicator measures the ratio of the rate of change between two systems and is used to assess the relative change relationship between variables [37]. Zhang et al. [29] conducted a study in Chongqing using the elasticity coefficient, revealing that during urban development, as the population grows, urban land expansion must consider the necessary requirements for maintaining livability. Cao et al. [38] found that even under favorable economic conditions, urban populations might still face out-migration. This implies that urban development strategies should not solely concentrate on economic growth but also integrate measures to improve various aspects of urban livability to ensure more harmonious and sustainable development.
In China’s ‘Fourteenth Five-Year Plan’ outlined in 2020, the emphasis was on promoting long-term balanced population development [39]. This highlights the urgent need for aligning demographic trends with urban expansion. The challenge of addressing coordinated development within urban agglomerations has become increasingly significant [40]. However, existing studies mostly emphasized the role of economic factors in shaping urban livability, often considering urban livability as an isolated phenomenon [28]. There is a scarcity of quantitative analyses examining the dynamic interrelationships between urban livability and population distribution in China’s urban agglomerations. This study aims to address this gap by developing a set of indices to understand the coordination and development trends within China’s major urban agglomerations. Our objective is to provide valuable insights for urbanization development and population management.

2. Materials and Methods
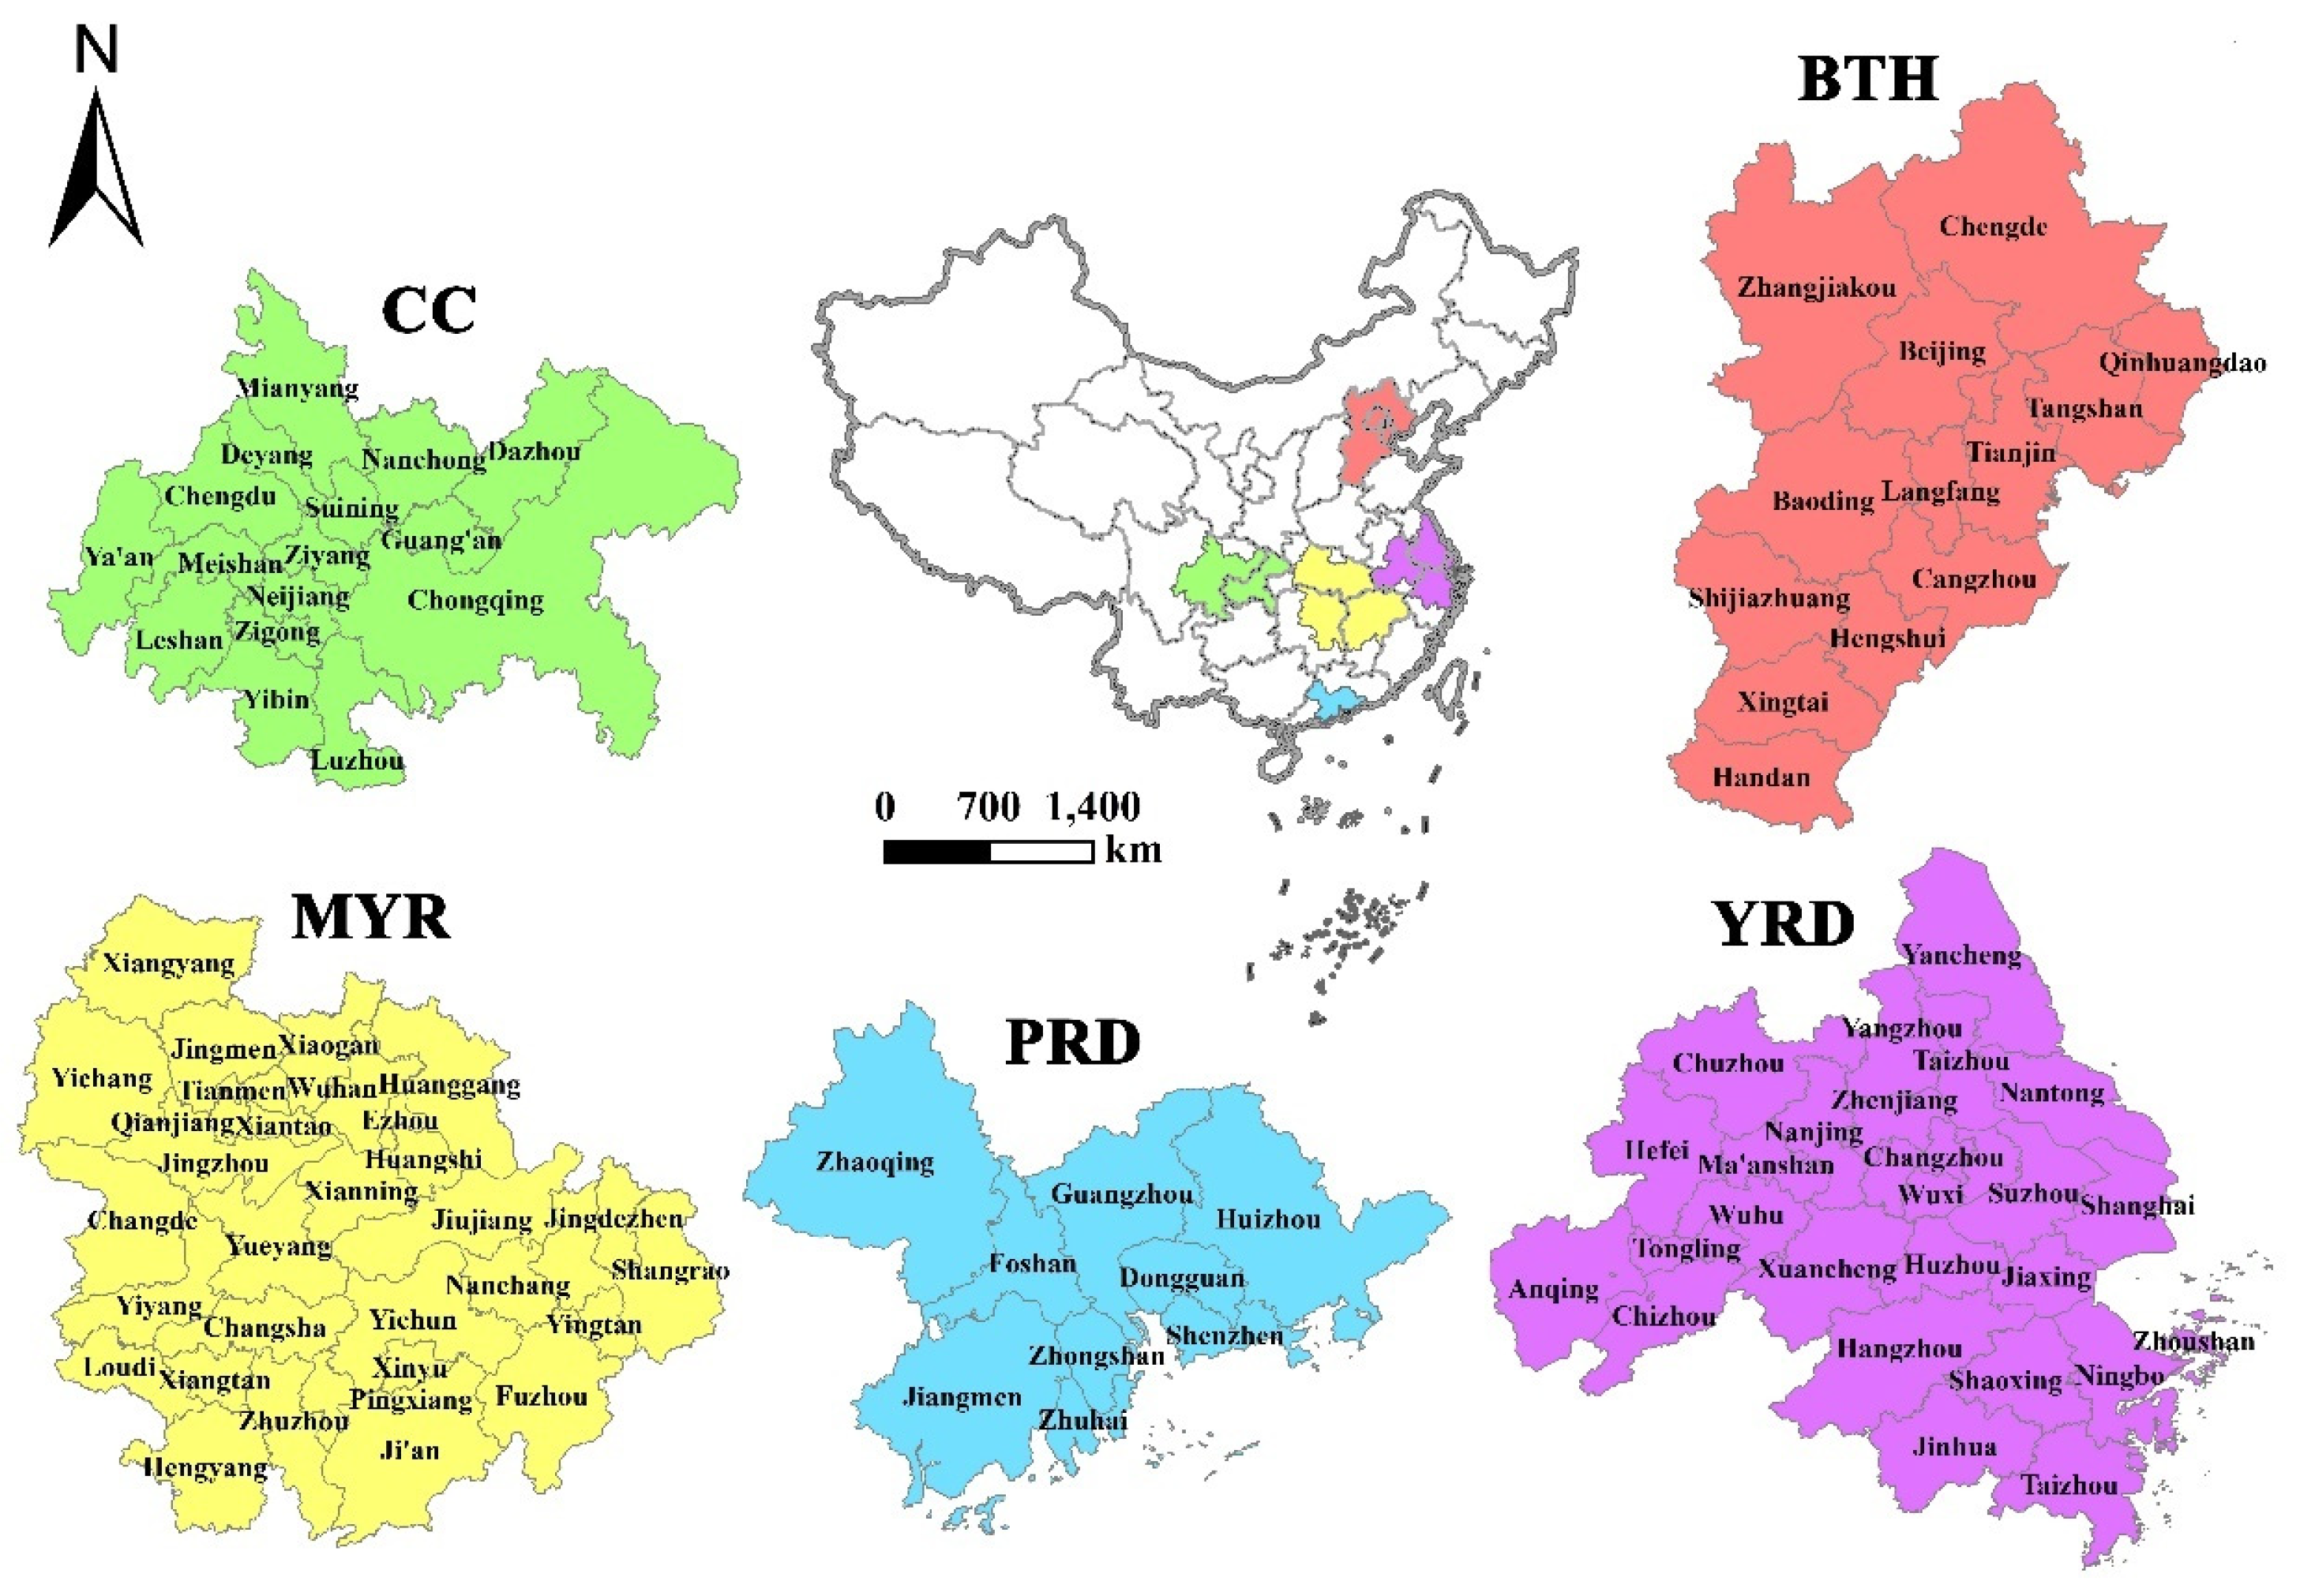
We conduct the coordination analysis at two spatial scales. First, for each city within the urban agglomeration, we evaluate the coordination level between its livability and population. To do this, an evaluation framework for urban livability is established from the aspects of social–economic development and ecosystem services. We then combine this with population distribution data to propose an index called the Coordination Distance Index (CDI), which assesses the coordination degree between urban livability and population distribution. Finally, we develop a comprehensive index to describe the coordination level of the entire urban agglomeration, enabling comparisons among different urban agglomerations.

2.1. Study Area

Five major national urban agglomerations in China are selected as study areas. The Yangtze River Delta (YRD) urban agglomeration is one of the most economically developed and highly urbanized regions in China. The Mid-Yangtze River (MYR) urban agglomeration is the fastest-growing urban area and the most economically advanced region in Central China. The Chengdu–Chongqing (CC) urban agglomeration is a key platform for development and the largest urban agglomeration in the Western region. The Beijing–Tianjin–Hebei urban agglomeration (BTH) is a core regional component of the Chinese economy and a significant contributor to national competitiveness. The Pearl River Delta (PRD) urban agglomeration is recognized as one of the world’s most rapidly growing urban areas. These urban agglomerations serve as exemplars of China’s urban development, situated across the eastern, central, western, northern, and southern regions of the country (Figure 1). They encompass 95 cities, including four municipalities directly under the central government and portions of nine provinces. With a combined population of approximately 560 million inhabitants, these regions occupy roughly 10% of China’s total land area. By the end of 2020, they accommodated 39% of China’s population and contributed to 57% of the nation’s Gross Domestic Product (GDP), thereby playing a pivotal role in terms of economic development and population concentration.
This paper employs data from the “Statistical Yearbook”, the “China Energy Statistical Yearbook”, and the “National Economic and Social Development Statistical Bulletin” in the years 2010, 2015, and 2020. Specifically, the datasets include GDP, per capita GDP, urban per capita disposable income, urban resident population, total resident population, number of hospital beds, and number of registered students for the relevant provinces and cities. Additionally, spatial datasets are also applied in this study, such as net primary productivity (NPP) products for the years 2010, 2015, and 2020 (sourced from http://modis.gsfc.nasa.gov, accessed on 24 November 2024), as well as land cover maps at a 30 m resolution adapted from the research [41], including nine categories: arable land, forest, shrub, grassland, water body, ice/snow, wasteland, impervious surface, and wetland.

2.2. Indices for Urban Livability

In consideration of the urban livability goals outlined by the government and informed by existing research [42,43], this study acknowledges the varying degrees of urbanization development among different urban agglomerations in China. Based on the principles of representativeness, data availability, and comparability in selecting indices, we have chosen a set of indices that reflect urban livability across two indicators: social–economic development (SD) and ecosystem service (ES). The selected indicators and descriptions can be found in Table 1. NPP denotes the net quantity of photosynthetic organic matter assimilated by vegetation per unit area over a given period, serving as an indicator of the region’s vegetation carbon sequestration capability [44]. Indicators for carbon emission reflect the potential pressure to achieve carbon neutrality. The consumption of fossil fuels constitutes 80% to 90% of total carbon emissions [45]. For the purposes of this study, carbon emissions for each city have been calculated based on the consumption of eight primary energy sources, including coal, coke, crude oil, gasoline, kerosene, diesel, fuel oil, and natural gas. The areas of construction land, forest, grassland, and water bodies are derived through the statistical analysis of land cover datasets. The sub-indicator per capita urban green/blue space reflects the relationship between the supply and demand of urban ecosystem services.
Due to the variances in scale across diverse indices and the inclusion of both positive and negative index types, a linear normalization method is used for preprocessing the indices [46]. This approach ensures that all indicators are adjusted to same range, facilitating a comprehensive analysis.
Normalization of positive sub indicators:
X k = X k min X k max X k min X k
Normalization of negative sub indicators:
X k = max X k X k max X k min X k
where X k represents the normalized value of the sub indicator for each city; X k represents the original value of the index; and the functions m i n ( ) ,   m a x ( ) are used to calculate the minimum and maximum indicator values across all cities.
In this study, the indicators are considered equally important to the livability of cities. Therefore, an equal-weight method is adopted to calculate the comprehensive Urban Livability Index (ULI). The ULI for each city is calculated by summing the values of the ten indices of SD and ES, each weighted equally.
U L I = k = 1 n ω × X k
where U L I stands for Urban Livability Index; X k is the normalized value of each sub indicator; n is the number of indices; and ω is the indicator weight, which is 0.1 in this study.

2.3. Index for the Coordination Between Urban Livability and Population Distribution

The Z-score method transforms data of varying scales into a new dataset standardized to have a mean of 0 and a standard deviation of 1, thus mitigating the impact of differing scales on comparative analyses. This method is robust, ensuring that extreme values do not disproportionately influence the entire dataset [47,48]. Consequently, the indicators of U L I and population size for each city within the urban agglomerations are standardized using the Z-score method. The formula for this transformation is as follows:
U L I j = U L I j m e a n U L I s t d U L I
P O P j = P O P j m e a n P O P s t d P O P
where P O P j is the population of city j, and P O P j is the standardized value of the P O P j ; U L I j is the standardized value of the U L I for city j. The functions m e a n ( ) and std ( ) denote the calculations of the mean and standard deviation, respectively.
If a city’s U L I is equal to its P O P , it indicates that the urban livability of the city is in balance with its population size within the urban agglomeration. The distance between a city point ( P O P , U L I ) to the coordination line ( U L I = P O P ) reflects the degree of coordination between urban livability and population distribution. It is quantified in this paper as the Coordination Distance Index ( C D I ).
C D I j = U L I j P O P j 2
If U L I j < P O P j , it indicates an overcrowding of the population in the city compared to its urban livability, and vice versa. In addition, we calculated the Urban Agglomeration Coordination Distance Index (UACDI), reflecting the overall coordination between urban livability and population distribution across cities within the urban agglomeration.
U A C D I = j = 1 J a j × a b s C D I j A
where C D I j and a j represent the Coordination Distance Index and area for a city j. J is the city number within the urban agglomeration and A is the total area of the urban agglomeration. The function a b s ( ) denotes the absolute value. A higher value of U A C D I indicates a greater imbalance and lower coordination degree for the urban agglomeration. The CDI range is categorized into distinct levels for assessing the degree of coordination for an individual city and urban agglomeration (see Table 2).

3. Results

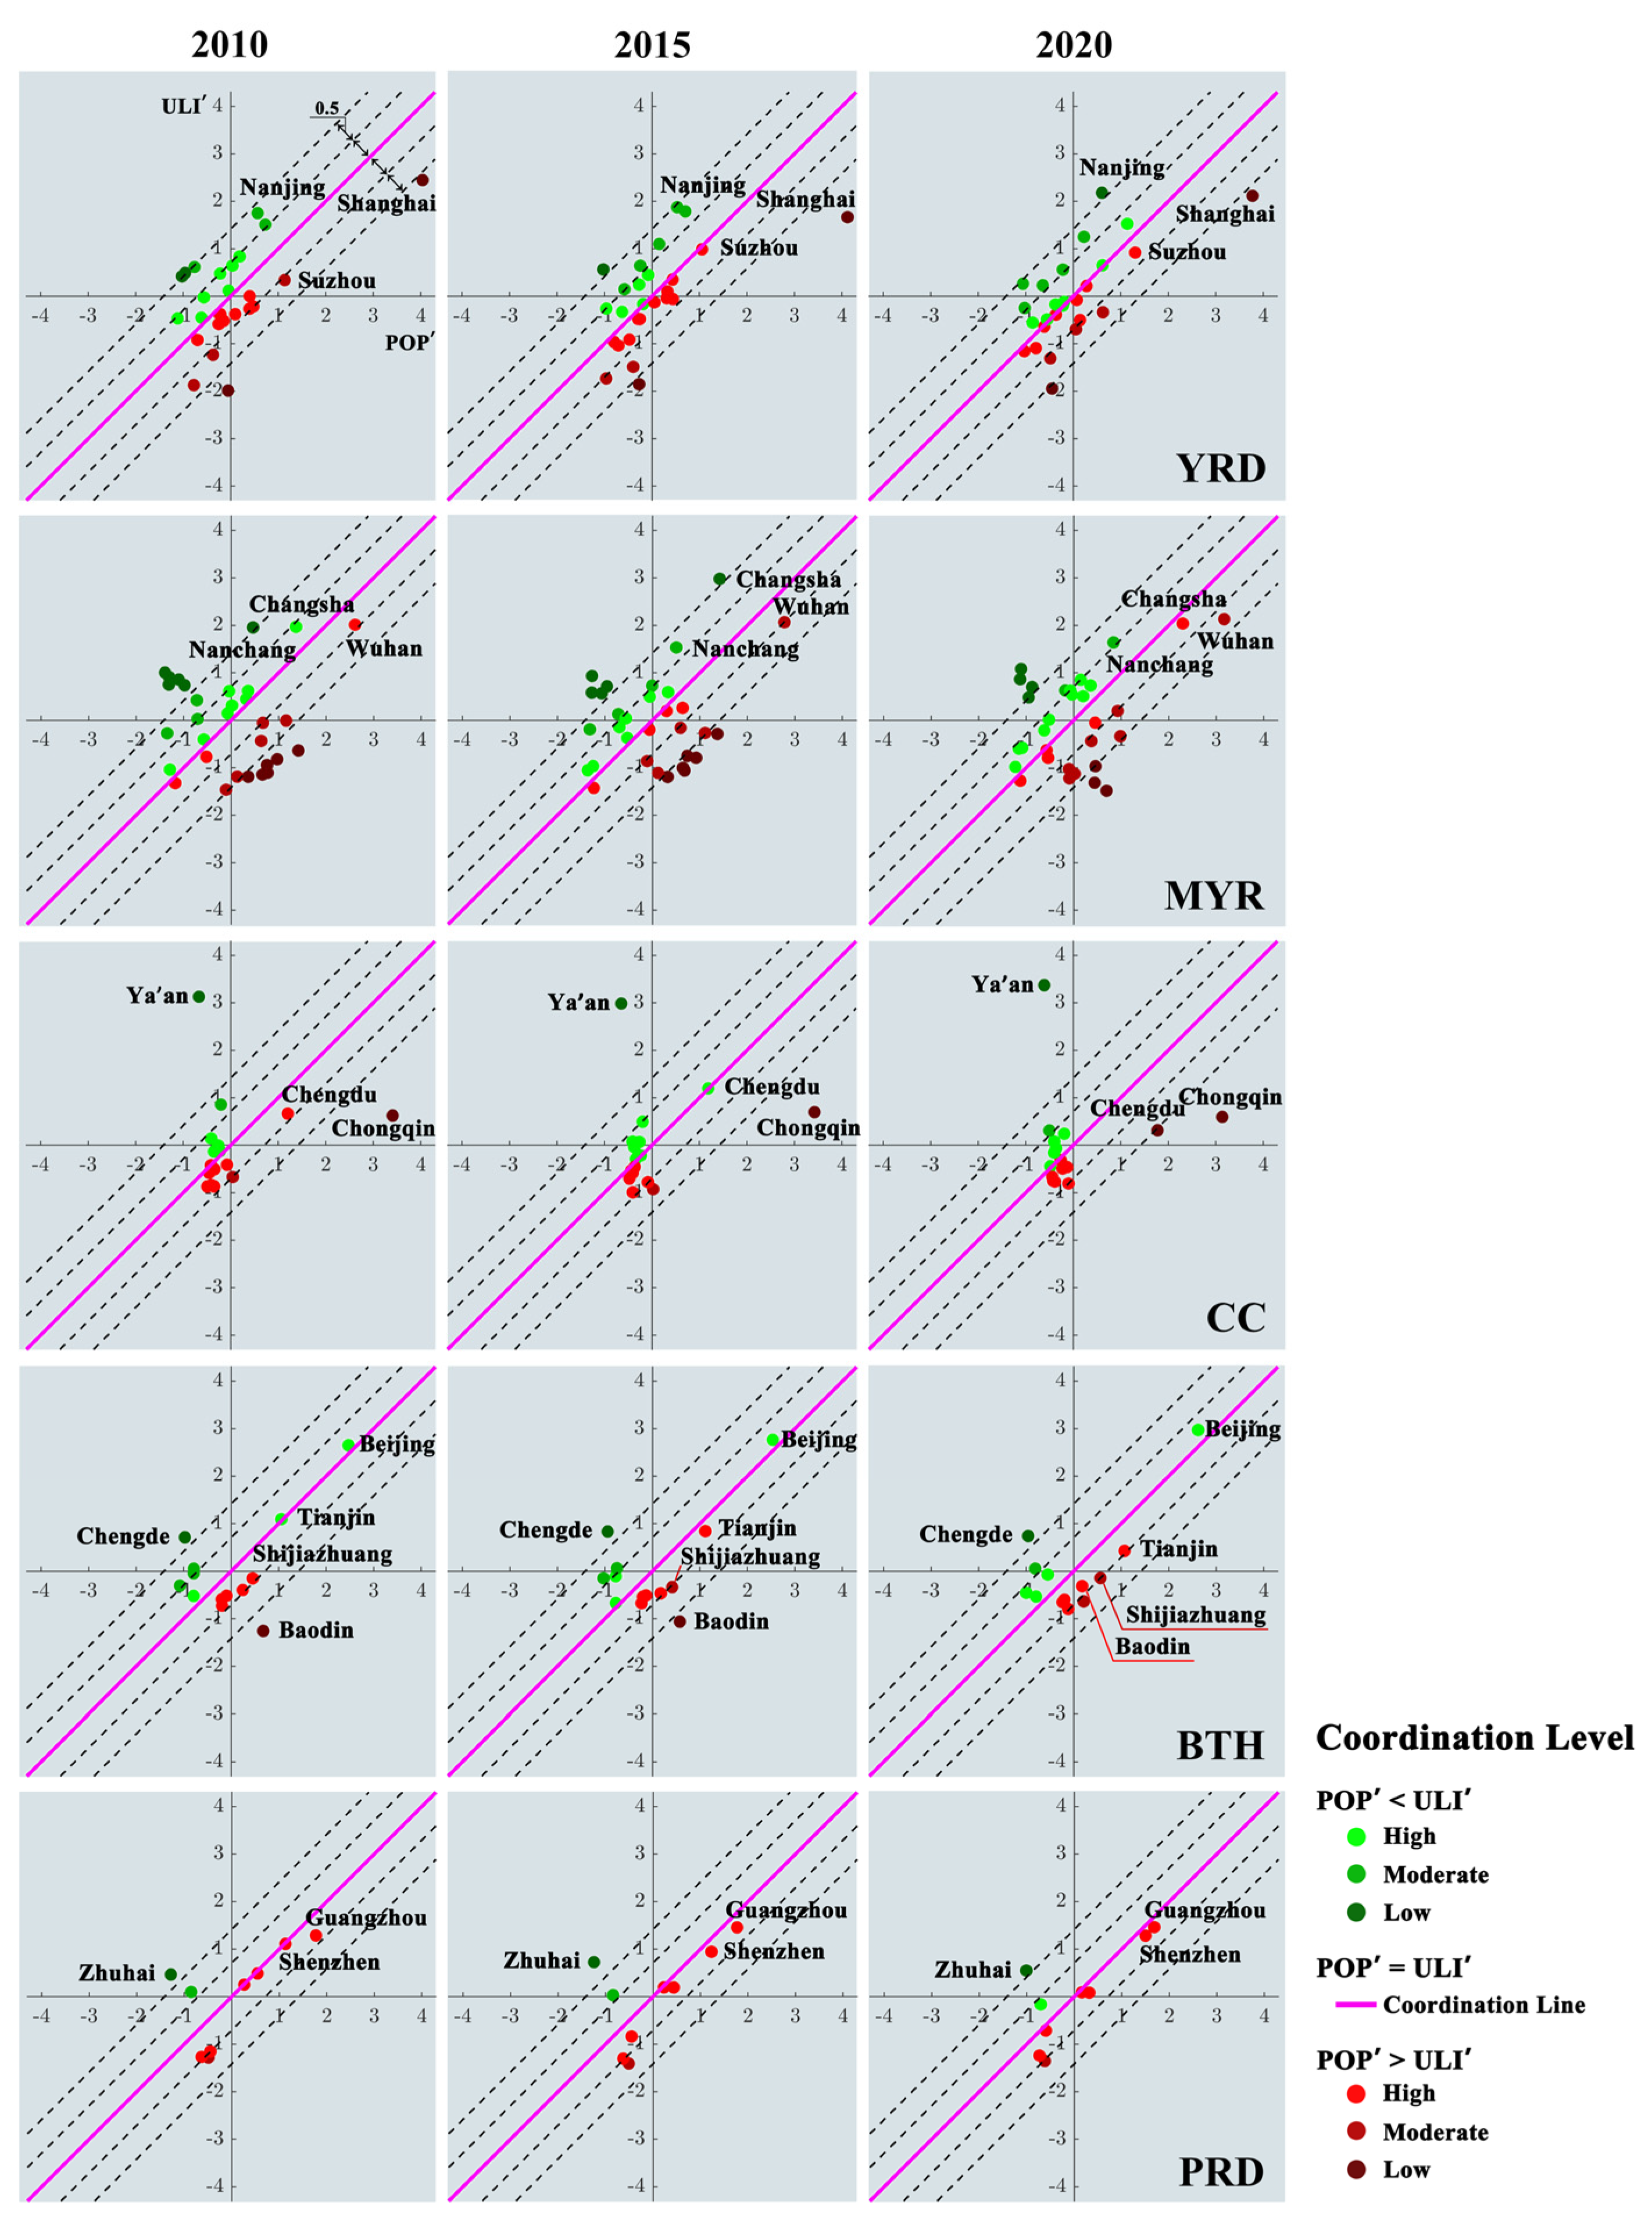
3.1. Coordination Evaluation for Cities Within Urban Agglomerations

Figure 2 shows the distribution of ULI and POP for each city in the five urban agglomerations, with values standardized using the Z-Score method based on Formulas (4) and (5). The coordination line (denoted as purple line in Figure 2) indicates a state of absolute coordination between urban livability and population. The dashed lines represent the distance to the coordination line on both sides with a distance interval of 0.5. The closer a city’s point is to the coordination line, the higher the degree of coordination. If a city’s point is positioned above the coordination line (greenish dots in Figure 2), it means that the city has a relatively smaller population in comparison to its level of urban livability within the urban agglomeration. Conversely, if a city’s point is positioned below the coordination line (reddish dots in Figure 2), it indicates a relatively larger population distribution in comparison to its level of urban livability.
During the study period, most cities were close to the coordination line, with only a minority showing “low coordination”. Specifically, in the YRD, there were four cities in a low coordination state in 2010, three in 2015, and three in 2020. Among them, Shanghai had a significantly larger population relative to its level of urban livability. Nanjing’s level of urban livability exceeded its population and increased over time, resulting in a low coordination state in 2020. On the other hand, Suzhou’s coordination improved from 2010 to 2015 and remained at a high coordination level from 2015 to 2020. In the MYR, many cities were in a low coordination state during the study period. Although overall coordination improved, there were still 12, 11, and 7 cities in a low coordination state in 2010, 2015, and 2020, respectively. The coordination levels of the three core cities, i.e., Nanchang, Changsha, and Wuhan, showed varying trends. Nanchang and Changsha progressed from low coordination to moderate and high coordination levels, respectively, while Wuhan experienced a decline from high coordination to moderate coordination. In the CC, most cities were close to the coordination line during the study period. In 2010, 2015, and 2020, there were only two, two, and three cities in a low coordination state, respectively. Among these, Chongqing and Ya’an exhibited low coordination, with Chongqing’s population significantly exceeding its urban livability level, while Ya’an’s urban livability level was higher compared to its population. Chengdu, another core city, maintained a high coordination state between 2010 and 2015 but deteriorated to a low coordination state by 2020. In the BTH, most cities were in a high or moderate coordination state during the study period. In 2010, 2015, and 2020, there were two, two, and one city in low coordination state, respectively. Among these, Chengde consistently remained in a low coordination state, with its urban livability level higher than its population. Baoding improved from low coordination to high coordination. On the other hand, Shijiazhuang showed little change in coordination, and Beijing and Tianjin consistently maintained a high coordination state. In the PRD, only one city, Zhuhai, was in a low coordination state as its urban livability level exceeded its population during the study period. The other cities were in high or moderate coordination states. Specifically, in 2020, seven cities were in a high coordination state, while Guangzhou and Shenzhen consistently maintained a high coordination state throughout the period.
In general, the number of cities with low coordination decreased in the YRD, MYR, and BTH. However, the CC region saw an increase of one city with low coordination, while the Pearl River Delta (PRD) remained unchanged. Among the five major urban agglomerations, Ya’an in the CC has the lowest coordination level, primarily due to its relatively good livability but small population. The second lowest is Chongqing, which, despite having a relatively high livability, suffers from an excessively large population as a mega-city. In the MYR, the proportion of cities with low coordination reached 39% in 2010, making it the agglomeration with the highest proportion of low coordination cities during the study period. In contrast, in the PRD, 78% of cities exhibited high coordination levels by 2020, making it the agglomeration with the largest proportion of highly coordinated cities.
Figure 2. Scatter plots based on the standardized value of ULI and POP for each urban agglomeration in 2010, 2015, and 2020. (The greenish dots indicate that their populations are high compared to the level of urban livability; the reddish dots indicate their populations are low compared to the level of urban livability; and the purple line indicates absolute coordination between population and urban livability).
Sustainability 16 10438 g002
The CDI for each city was calculated (using Formula (6)) based on the ULI′ and POP′ of the city, and the evaluation results (according to Table 2) are shown in Figure 3. In the YRD, cities in a high coordination state were concentrated in the northern, central, and southern regions, while cities in the eastern and western regions were mostly in a moderate coordination or low coordination state. In the MYR, most cities were in a moderate coordination or low coordination state, with high coordination cities concentrated in the northern and central areas. The northern, central, and southern parts of CC exhibited high coordination. The megacity Chongqing in the eastern region of CC, located in the mountainous regions of China, was densely populated with highly concentrated settlements and industrial activities. During the process of rapid economic development, conflicts often arose between policies aimed at protecting the environmental quality of mountainous areas and the demands of economic growth, resulting in relatively low overall development coordination [49]. In the BTH, cities in a high coordination state were mainly concentrated in the central and southern areas, with Beijing being a prime example of high coordination in the region. As the capital, Beijing experienced rapid economic growth, with indicators such as GDP per capita and per capita disposable income ranking the highest in the BTH region. As its natural environment improved gradually, Beijing maintained a good livability and achieved a high level of coordinated development. This is partly related to its strict population control policy adapted in the Beijing Master Plan (2016–2035) [50]. In the PRD, most cities were in a high coordination state, primarily Guangzhou and Shenzhen located in the north. Zhuhai, Jiangmen and Zhongshan were in a low coordination or moderate state in the south, while Zhongshan improved to a high coordination state in 2020.
There were variations in the spatial distribution of coordination among cities within the urban agglomerations. In the YRD and CC, the central regions had better coordination, while the eastern and western regions had relatively lower coordination. The coordination distribution in MYR was more fragmented, with some cities in the northeast, central, and southern regions showing higher coordination. In BTH, the southern region had higher coordination, while the northern region had lower coordination. In contrast, the northern region in PRD had better coordination, while the southern region had lower coordination.
Figure 3. The coordination level of cities in the five urban agglomerations in 2010, 2015, and 2020 ((a) YRD, (b) MYR, (c) CC, (d) BTH, (e) PRD).
Sustainability 16 10438 g003

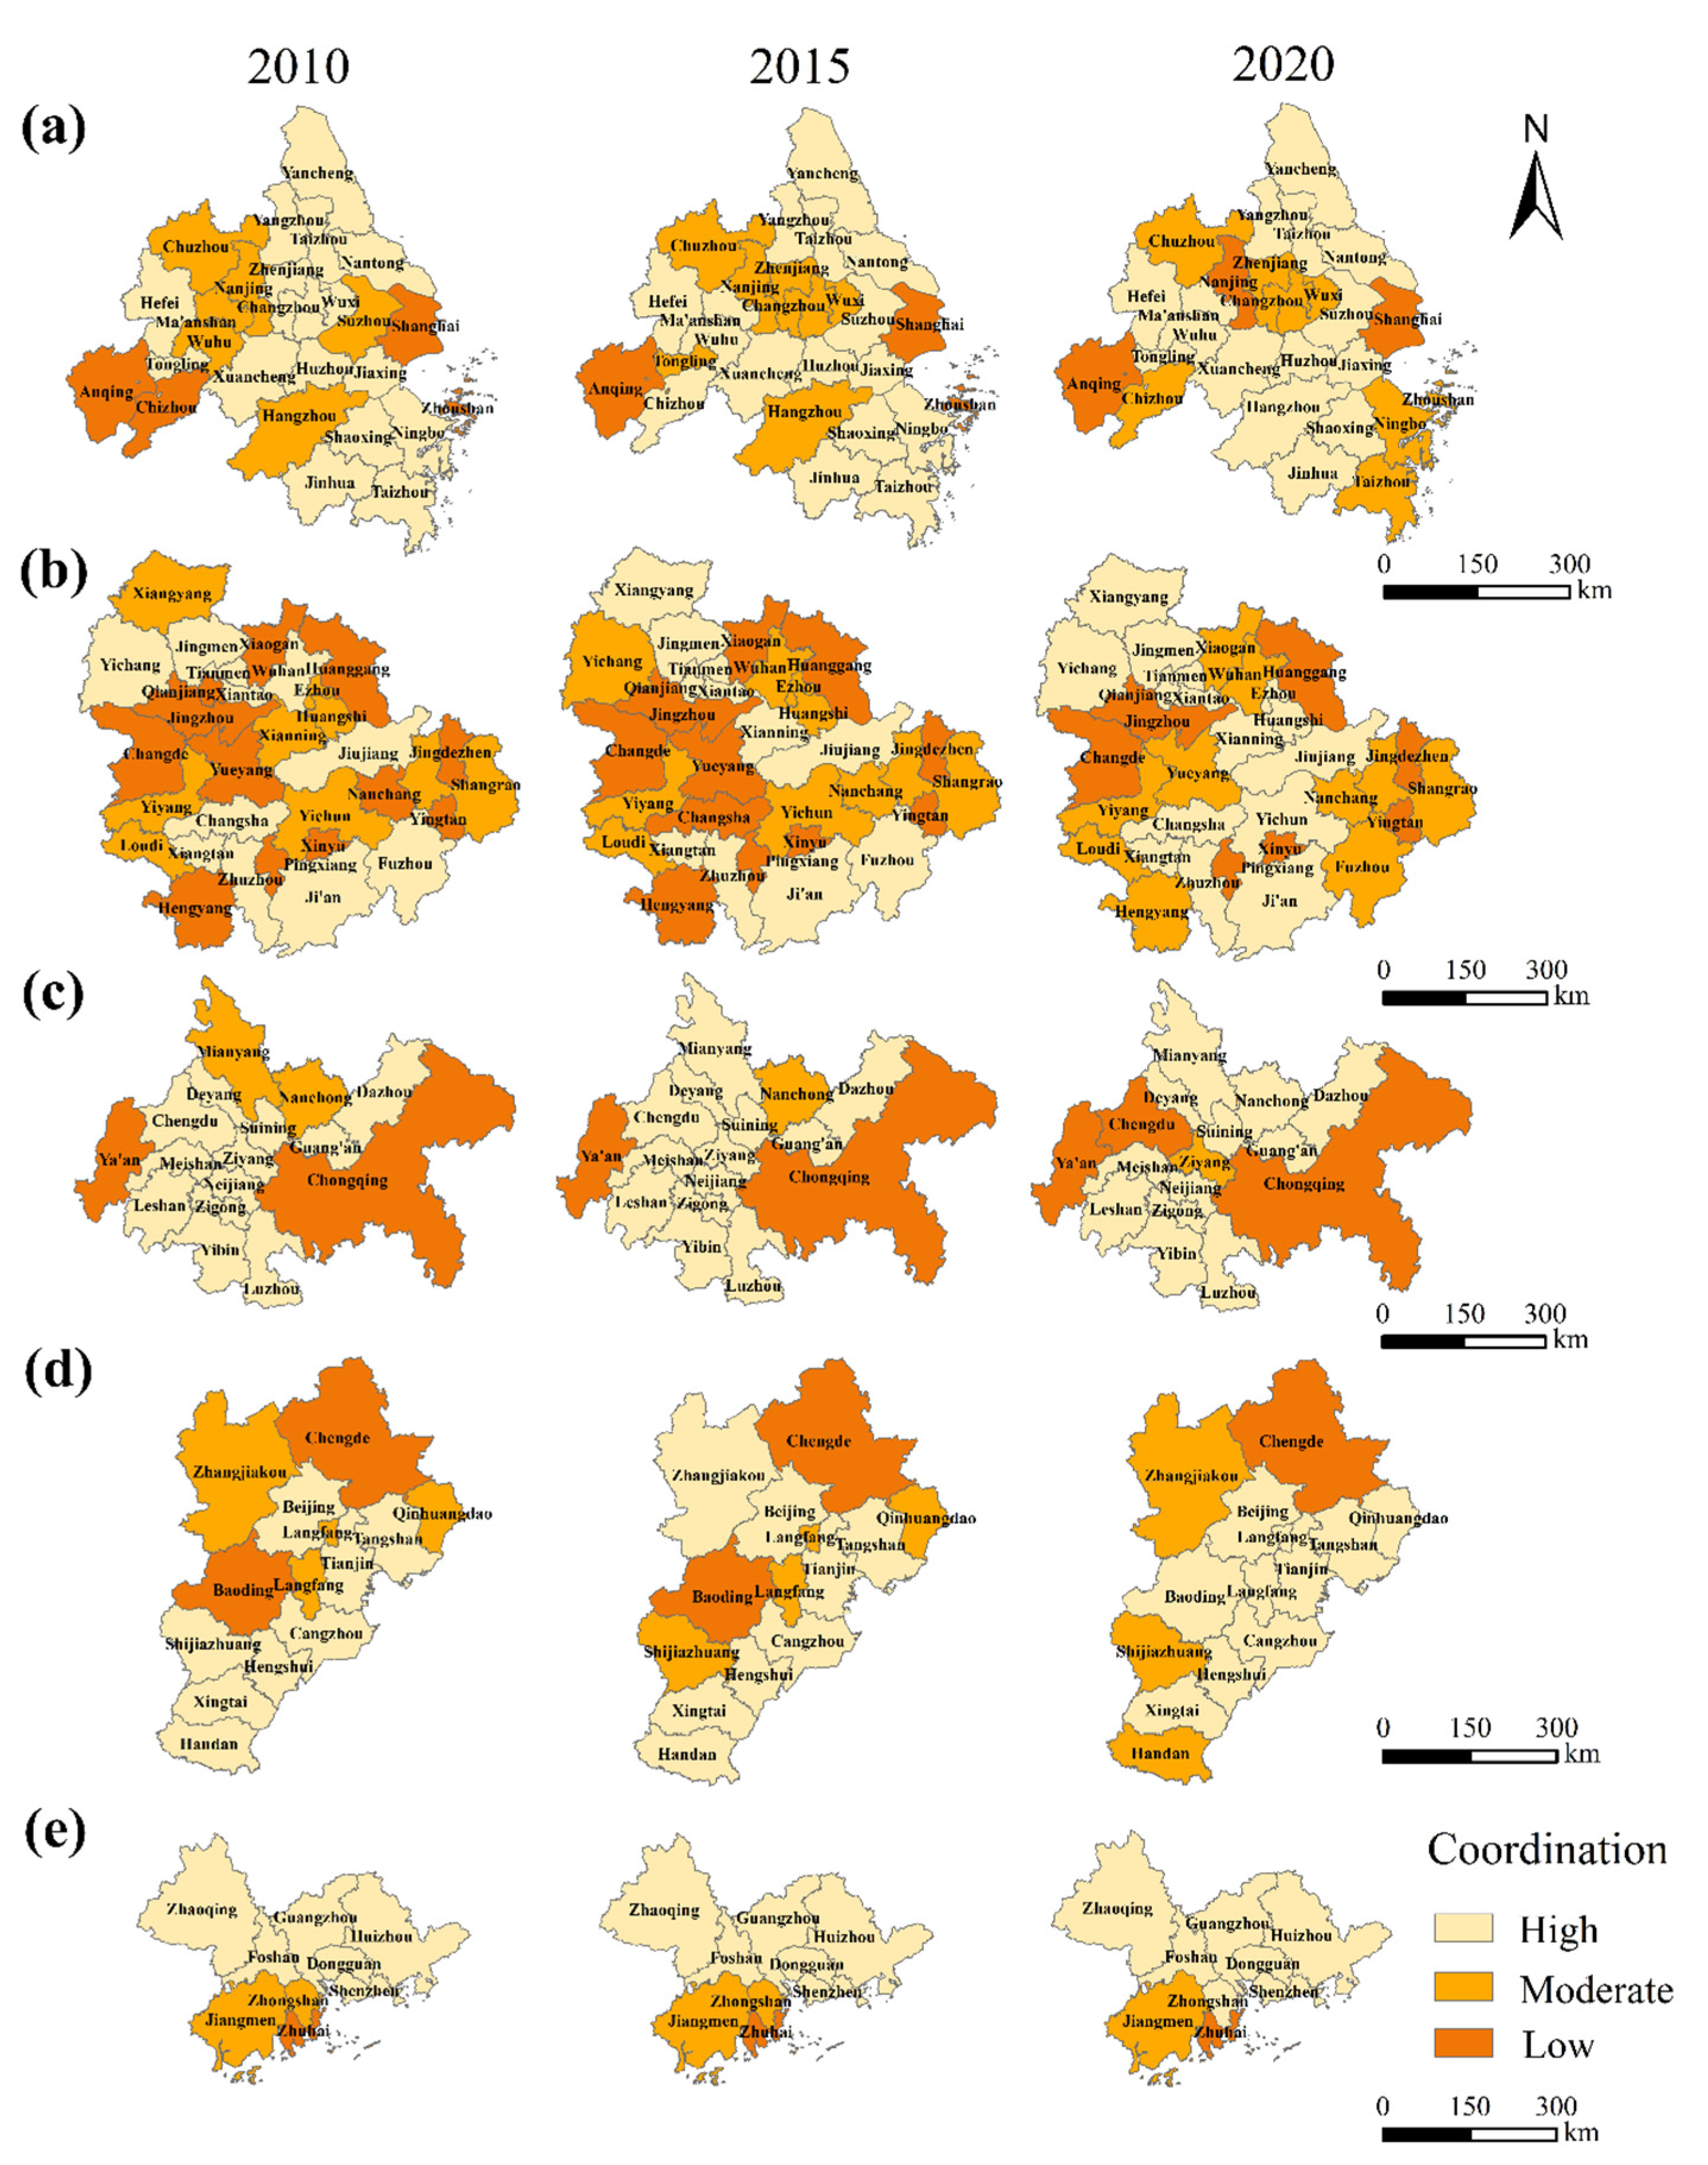
3.2. Coordination Levels of Urban Agglomerations

At the urban agglomeration scale, the UACDI was calculated based on the CDI and area of each city (using Formula (7)), and the results are shown in Figure 4. The index UACDI represents the accumulated gaps of all cities within the urban agglomeration to the absolute coordination. Therefore, the larger UACDI value, the lower the coordination level of the urban agglomeration. In addition, the area of the cities is also considered in the calculation of UACDI, as larger cities have a greater impact on the coordination of the entire urban agglomeration. Among the five urban agglomerations, the PRD exhibited the highest coordination level (indicated by the lowest UACDI value), whereas the CC urban agglomeration demonstrated the lowest level of coordination (reflected by the highest UACDI value) across all years. The YRD, BTH, and MYR regions ranked second, third, and fourth, respectively, in terms of coordination level. The UACDI value for the CC region was 1.039 in 2010, declining to 0.991 in 2015 and increasing to 0.996 in 2020. Despite improving from a low to a moderate coordination level, the CC’s UACDI value remained relatively high compared to the other urban agglomerations. This is mainly because its key city Chongqing maintained relatively high CDI values, with its area constituting 34% of the total CC region. This significant contribution leads to CC’s overall higher UACDI values from 2010 to 2020. The MYR region’s UACDI value decreased to 0.609 in 2020, indicating moderate coordination but still above the critical threshold of 0.5, because many cities, including Nanchang and Wuhan, failed to achieve high coordination. The BTH region experienced a slight improvement in coordination level from 2010 to 2020. Cities, such as Beijing and Tianjin, had achieved a high level of coordination in 2020. However, the BTH region’s UACDI value remained relatively high, suggesting that substantial efforts are still required to enhance the coordination level of individual cities, e.g., Shijiazhuang and Chengde. Both the YRD and PRD regions maintained relatively lower UACDI values compared to the other urban agglomerations and showed significant improvement. By 2020, although cities like Shanghai in the YRD had lower coordination, the overall coordination level was high because most cities, such as Hangzhou and Suzhou, had achieved high coordination. In contrast, most cities in the PRD, such as Guangzhou and Shenzhen, had reached a high level of coordination, resulting in a higher overall coordination level for the PRD.
Overall, between 2010 and 2020, the coordination levels in the PRD, YRD, BTH, and MYR regions showed continuous improvement. In contrast, the CC region’s coordination level improved between 2010 and 2015 but then deteriorated slightly in 2020. The PRD experienced the most significant improvement in coordination development, while the CC saw the least improvement.
Figure 4. The UACDI values of the five urban agglomerations in 2010, 2015, and 2020.
Sustainability 16 10438 g004

4. Discussion

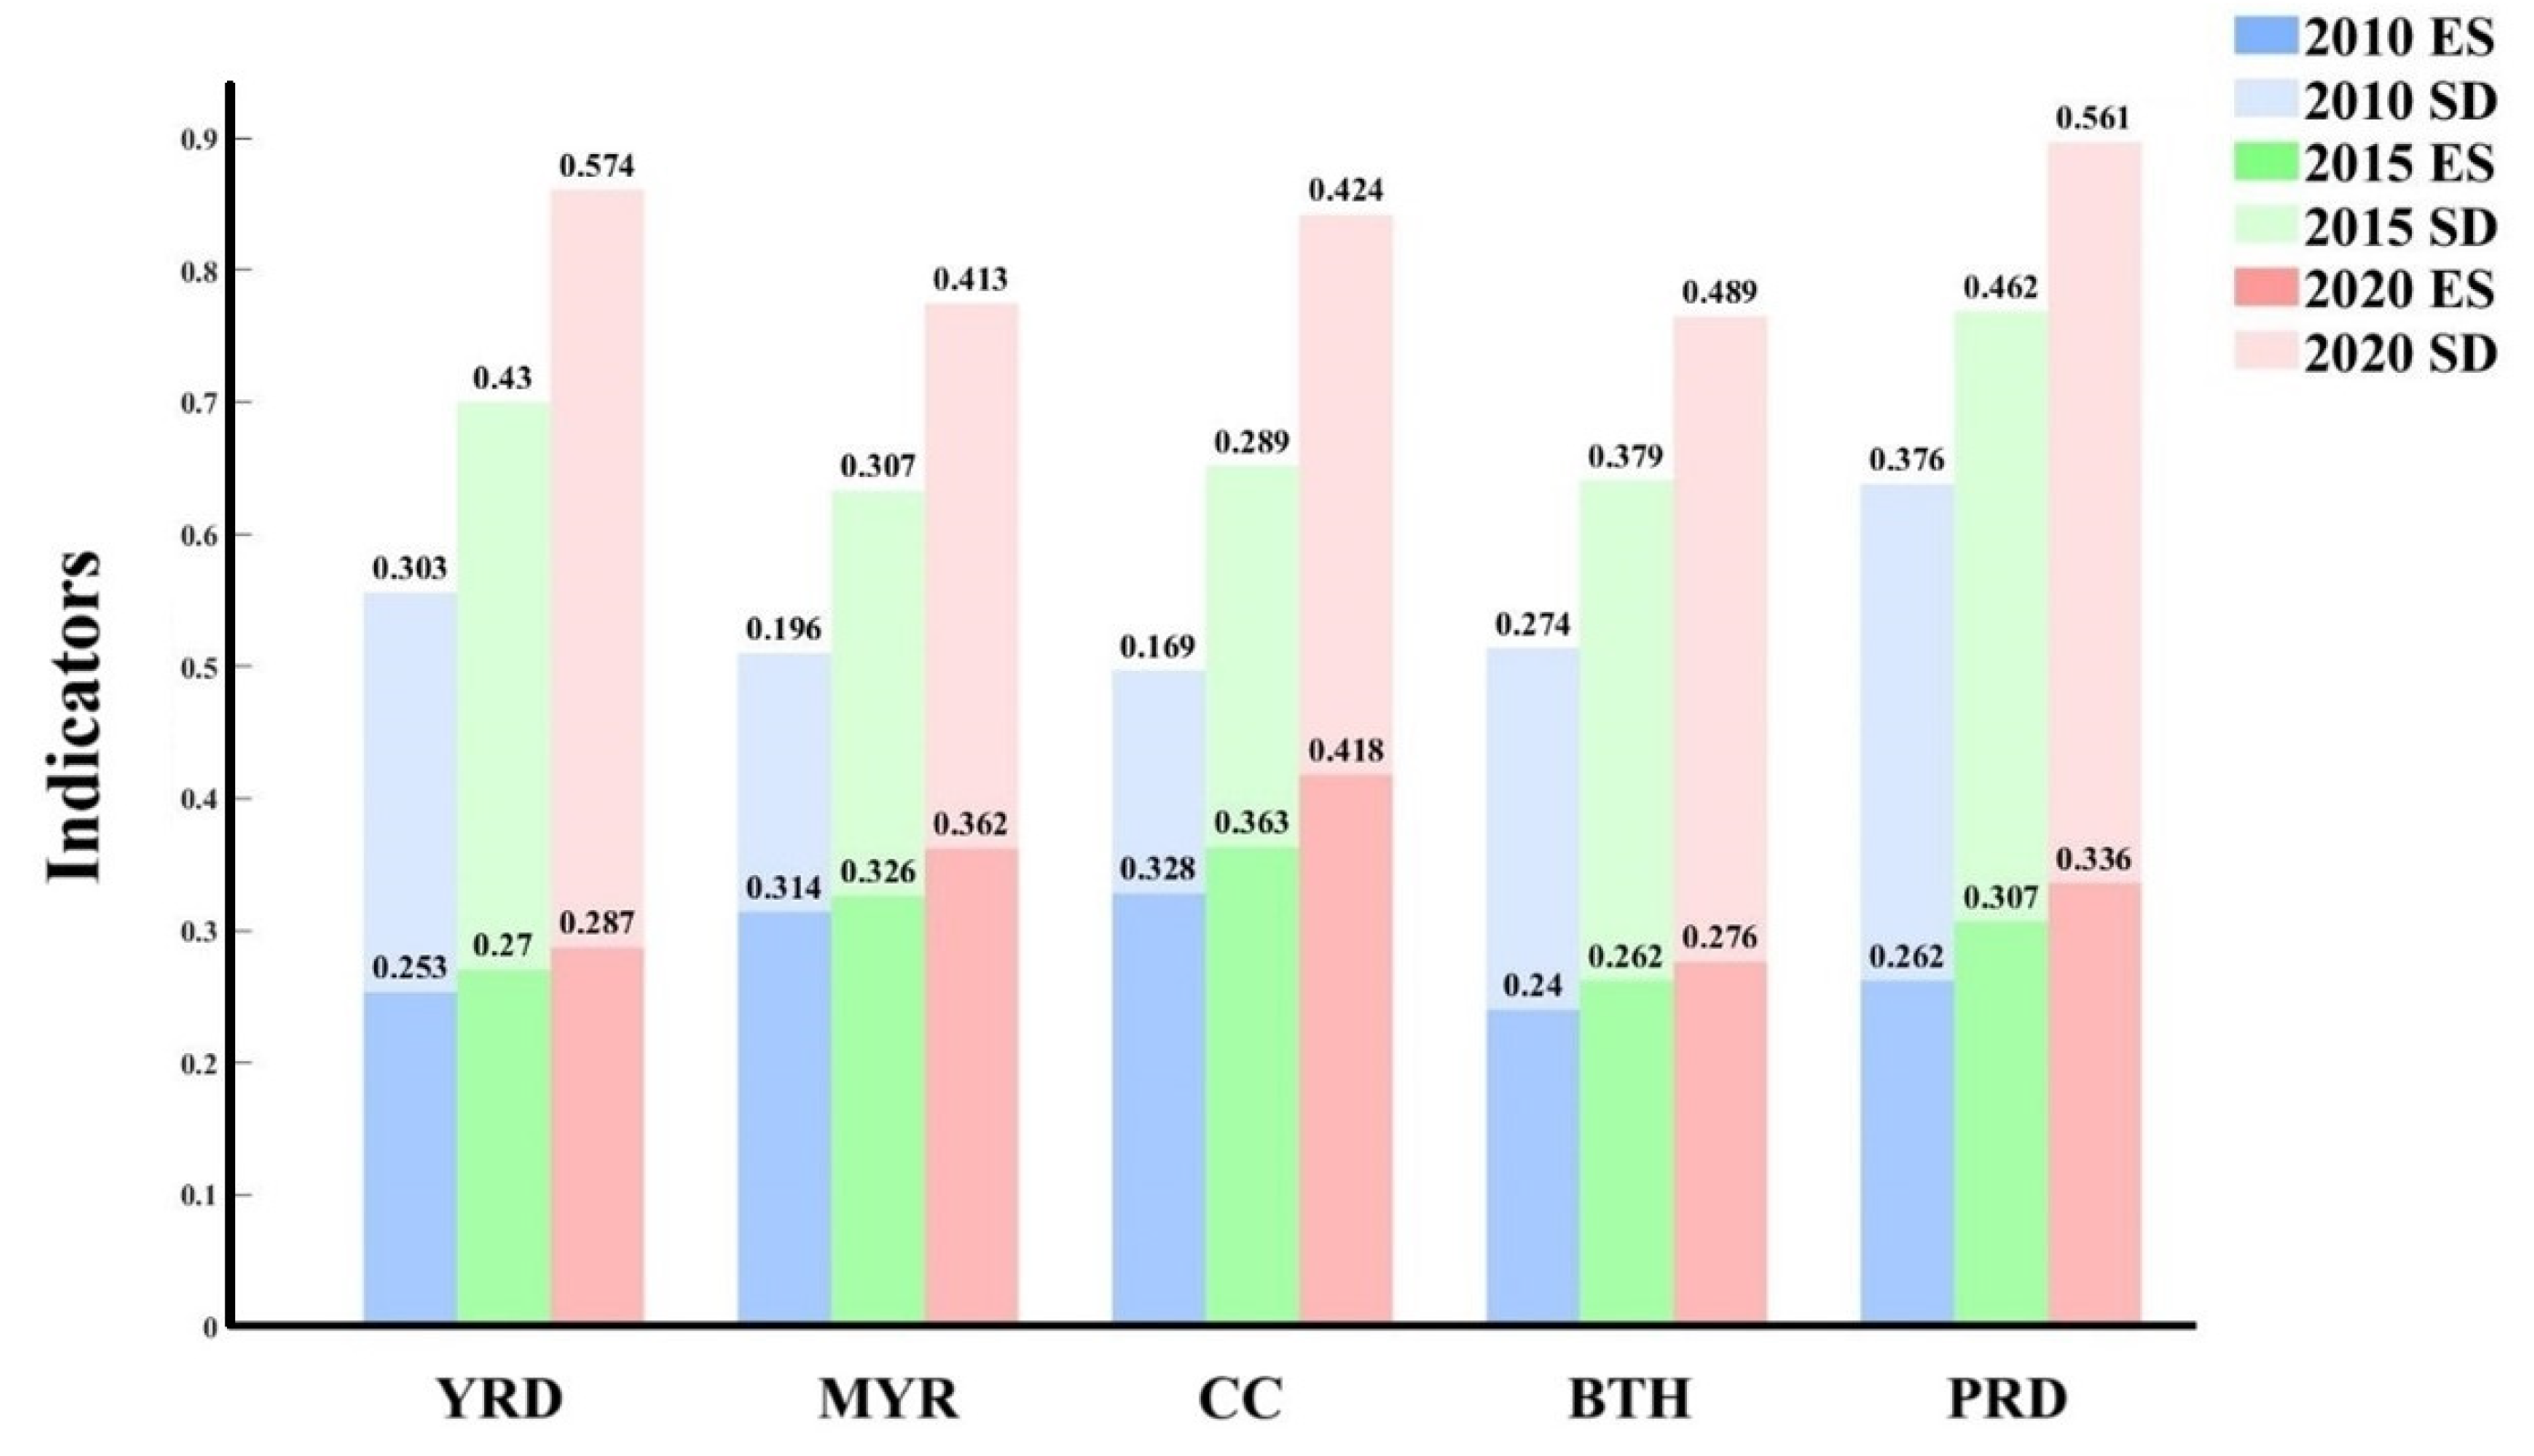
4.1. Indicators on Urban Livability Evaluation

In this study, the indicators used to evaluate urban livability are from two dimensions: social–economic development (SD) and ecosystem service (ES). We calculated the normalized indicators for each dimension across the urban agglomerations in the years 2010, 2015, and 2020 (see Figure 5). Specifically, the urban agglomeration YRD exhibited high levels of social–economic development, ranking first among the five urban agglomerations in 2020. This was the main driver of the rapid growth in its urban livability. However, regarding ES, significant efforts are needed for further improvement, such as strengthening environmental protection and nature conservation. The urban agglomeration MYR demonstrated relatively small improvements in the aspects of ES and it ranked second among the five urban agglomerations in 2020, but its urban livability remained low compared to the others. It needs to promote economic development and enhance livability to better meet the needs of the population [51]. From 2010 to 2020, the urban agglomeration CC made progress across all two dimensions. However, these improvements were relatively modest and could not accommodate the large population, leading to limited growth of ULI and low coordination. In 2020, due to the large proportion of urban green/blue space (UGS), CC’s ES ranked first. For the BTH region, the indicator of SD was the key factor in maintaining a high level of ULI. The overall ULI showed an upward trend, meeting the current demands of the population. From 2010 to 2020, its SD indicator increased significantly, while ES saw less growth, showing similar development patterns to the other urban agglomerations. In the PRD region, the levels of SD and ES were relatively high compared to the other urban agglomerations, which produced the highest ULI in 2020. This allowed the PRD region to support a large population.
Many existing studies on urban livability suggest that the evaluation of urban livability encompasses multiple dimensions, with the natural environment making a significant contribution to livability and public green spaces serving as a key factor [16,28,52]. Additionally, the cultural environment, living standards [52,53], and residents’ socioeconomic attributes also have a major impact on perceived livability [28]. In assessing socioeconomic development, this study incorporates not only GDP measures but also factors such as urban construction land, the number of hospital beds per 10,000 people, and the number of enrolled students per 10,000 people. Regarding the ecological environment, the evaluation considers not only green spaces and water resources but also includes carbon sequestration and carbon emissions to provide a comprehensive assessment of livability.
The economic development in the coastal regions (i.e., BTH, YRD and PRD) is relatively faster than that located in the central and western regions. Our results show that there is considerable potential for enhancing urban livability by focusing on the development of urban green spaces and carbon sinks in the future development of coastal regions. The amount of urban green spaces is an important factor influencing the ES, as these spaces are associated with NPP assessments and serve as key carbon sinks. This makes the ES value in the CC and MYR regions higher than the coastal urban agglomerations. But their SD indicators are lower. It shows that the urban agglomerations in the western regions have made progress in environmental protection, but their economic development still needs further improvement to meet population demands.
Figure 5. Change in indicators regarding urban livability for the five urban agglomerations in 2010, 2015, and 2020.
Sustainability 16 10438 g005

4.2. Limitations

The proposed CDI and UACDI are relative measures rather than absolute values for coordination. They are applied to compare the relative coordination state among the cities in the urban agglomeration and provide an assessment across the five urban agglomerations. They could be much more useful and meaningful in a long-term process for monitoring the development of the urban livability and population dynamic. As the study area includes county-level cities, the collection of certain data (such as fossil fuel usage and disposable income) faced limitations. To ensure data quality, we prioritized official data and public datasets, excluding data from online sources with uncertain quality. This approach led to two issues: first, the difficulty in data collection limited the ULI to two essential but constrained dimensions; second, the discontinuity of the data prevented a continuous temporal study of coordination changes. Future research could use more continuous data to describe urban livability, integrate more aspects in the index system, and conduct deeper analyses of livability and population distribution within urban agglomerations, thereby achieving more reliable research results.

5. Conclusions

This study established the Coordination Distance Index to evaluate the coordination level between the urban livability and population distribution within five national urban agglomerations in China. From 2010 to 2020, the coordination levels of the Mid-Yangtze River (MYR), Beijing–Tianjin–Hebei (BTH), Yangtze River Delta (YRD) and Pearl River Delta (PRD) experienced a steady improvement. The Chengdu–Chongqing (CC) region showed initial improvements followed by slight deterioration, and its highest coordination state was in 2015. The Pearl River Delta (PRD) showed significant improvements, maintaining a high coordination state during the study period. By 2020, the PRD and YRD regions reached a high coordination state, ranking first and second, respectively, followed by the BTH, MYR and CC regions, which were in a moderate coordination state. Notably, Beijing in the BTH, Guangzhou and Shenzhen in the PRD demonstrated excellent performance of well-coordinated development, exhibiting both a large population proportion and leading urban livability within their respective agglomerations. In this study, social development (SD) is the main driver influencing urban livability, while the other indicator, ecosystem services (ESs), shows relatively small changes due to the minimal variation in UGS during the study period, and improving urban livability through the enlargement of UGS has great potential to increase the quality of urbanization.
Our results can serve as a basis for policymakers to develop targeted strategies aimed at enhancing the coordination between urban livability and population distribution. The proposed indices highlight the need for monitoring and adaptive management to sustain and improve coordination levels. Cities and regions that have achieved “high coordination” can serve as models for best practices, while those lagging behind can benefit from tailored interventions to address specific imbalances. Furthermore, the insights gained from this study can inform future urban planning initiatives, helping to ensure more sustainable and equitable urban development across China’s major urban agglomerations.

Author Contributions

Conceptualization, W.H. and Y.R.; methodology, Y.R.; software, Y.R.; validation, Y.R., C.D., L.Z. and W.H.; formal analysis, J.S. and J.L.; investigation, J.S. and J.L.; resources, L.Z.; data curation, L.Z.; writing—original draft preparation, Y.R. and W.H.; writing—review and editing, W.H. and L.Z.; visualization, Y.R.; supervision, W.H.; project administration, L.Z.; funding acquisition, W.H. All authors have read and agreed to the published version of the manuscript.

Funding

This work was supported by the Fundamental Research Funds for Central Public-Interest Scientific Institution, grant number: AR2419 and AR2421.

Institutional Review Board Statement

Not applicable.

Informed Consent Statement

Not applicable.

Data Availability Statement

The data presented in this study are available on request from the corresponding author.

Conflicts of Interest

The authors declare no conflicts of interest.

References

  1. Jiang, L.; O’neill, B.C. Global urbanization projections for the Shared Socioeconomic Pathways. Glob. Environ. Chang. 2017, 42, 193–199. [Google Scholar] [CrossRef]
  2. Gu, C. Urbanization: Processes and driving forces. Sci. China Earth Sci. 2019, 62, 1351–1360. [Google Scholar] [CrossRef]
  3. Sun, L.; Chen, J.; Li, Q.; Huang, D. Dramatic uneven urbanization of large cities throughout the world in recent decades. Nat. Commun. 2020, 11, 5366. [Google Scholar] [CrossRef] [PubMed]
  4. Capps, K.A.; Bentsen, C.N.; Ramírez, A. Poverty, urbanization, and environmental degradation: Urban streams in the developing world. Freshw. Sci. 2016, 35, 429–435. [Google Scholar] [CrossRef]
  5. Ye, C.; Schröder, P.; Yang, D.; Chen, M.; Cui, C.; Zhuang, L. Toward healthy and livable cities: A new framework linking public health to urbanization. Environ. Res. Lett. 2022, 17, 064035. [Google Scholar] [CrossRef]
  6. Wang, Y.; Miao, Z. Towards the analysis of urban livability in China: Spatial–temporal changes, regional types, and influencing factors. Environ. Sci. Pollut. Res. 2022, 29, 60153–60172. [Google Scholar] [CrossRef]
  7. United Nations Department of Economic and Social Affairs (UNDESA). World Urbanization Prospects: The 2018 Revision. 2018. Available online: https://www.un.org/en/desa/2018-revision-world-urbanization-prospects (accessed on 24 November 2024).
  8. Qadeer, M.A. Urbanization by implosion. Habitat Int. 2004, 28, 1–12. [Google Scholar] [CrossRef]
  9. Liu, Y.; Zhang, X.; Pan, X.; Ma, X.; Tang, M. The spatial integration and coordinated industrial development of urban agglomerations in the Yangtze River Economic Belt, China. Cities 2020, 104, 102801. [Google Scholar] [CrossRef]
  10. Tan, R.; Zhou, K.; He, Q.; Xu, H. Analyzing the effects of spatial interaction among city clusters on urban growth—Case of Wuhan urban agglomeration. Sustainability 2016, 8, 759. [Google Scholar] [CrossRef]
  11. United Nations. Department of Economic and Social Affairs, Open Working Group Proposal for Sustainable Development Goals. 2015. Available online: https://sdgs.un.org/partnerships (accessed on 24 November 2024).
  12. Martins, M.S.; Fundo, P.; Kalil, R.M.L.; Rosa, F.D. Community participation in the identification of neighbourhood sustainability indicators in Brazil. Habitat Int. 2021, 113, 102370. [Google Scholar] [CrossRef]
  13. Valentin, A.; Spangenberg, J.H. A guide to community sustainability indicators. Environ. Impact Assess. Rev. 2000, 20, 381–392. [Google Scholar] [CrossRef]
  14. Paul, A.; Sen, J. Livability assessment within a metropolis based on the impact of integrated urban geographic factors (IUGFs) on clustering urban centers of Kolkata. Cities 2018, 74, 142–150. [Google Scholar] [CrossRef]
  15. Paul, A. Developing a methodology for assessing livability potential: An evidence from a metropolitan urban agglomeration (MUA) in Kolkata, India. Habitat Int. 2020, 105, 102263. [Google Scholar] [CrossRef]
  16. Parker, J.; Simpson, G.D. Public green infrastructure contributes to city livability: A systematic quantitative review. Land 2018, 7, 161. [Google Scholar] [CrossRef]
  17. Martino, N.; Girling, C.; Lu, Y. Urban form and livability: Socioeconomic and built environment indicators. Build. Cities 2021, 2, 220–243. [Google Scholar] [CrossRef]
  18. Yang, J.; Wu, T.; Gong, P. Implementation of China’s new urbanization strategy requires new thinking. Sci. Bull. 2017, 62, 81–82. [Google Scholar] [CrossRef]
  19. Ministry of Civil Affairs of the People’s Republic of China. Statistical Table of Administrative Divisions of the People’s Republic of China. Available online: http://xzqh.mca.gov.cn/statistics/ (accessed on 24 November 2024).
  20. Fang, C.; Yu, D. Urban agglomeration: An evolving concept of an emerging phenomenon. Landsc. Urban Plan. 2017, 162, 126–136. [Google Scholar] [CrossRef]
  21. Douglass, M. From global intercity competition to cooperation for livable cities and economic resilience in Pacific Asia. Environ. Urban. 2002, 14, 53–68. [Google Scholar] [CrossRef]
  22. Geng, Y.; Fujita, T.; Bleischwitz, R.; Chiu, A.; Sarkis, J. Accelerating the transition to equitable, sustainable, and livable cities: Toward post-fossil carbon societies. J. Clean. Prod. 2019, 239, 118020. [Google Scholar] [CrossRef]
  23. Henderson, J.V. Urbanization and economic development. Ann. Econ. Financ. 2003, 4, 275–342. [Google Scholar]
  24. Liu, S.; Liao, Q.; Liang, Y.; Li, Z.; Huang, C. Spatio–Temporal Heterogeneity of Urban Expansion and Population Growth in China. Int. J. Environ. Res. Public Health 2021, 18, 13031. [Google Scholar] [CrossRef] [PubMed]
  25. Zhang, R.; Jiang, G.; Zhang, Q. Does urbanization always lead to rural hollowing? Assessing the spatio-temporal variations in this relationship at the county level in China 2000–2015. J. Clean. Prod. 2019, 220, 9–22. [Google Scholar] [CrossRef]
  26. He, Q.; Zeng, C.; Xie, P.; Tan, S.; Wu, J. Comparison of urban growth patterns and changes between three urban agglomerations in China and three metropolises in the USA from 1995 to 2015. Sustain. Cities Soc. 2019, 50, 101649. [Google Scholar] [CrossRef]
  27. Seto, K.C.; Sánchez-Rodríguez, R.; Fragkias, M. The new geography of contemporary urbanization and the environment. Annu. Rev. Environ. Resour. 2010, 35, 167–194. [Google Scholar] [CrossRef]
  28. Zhan, D.; Kwan, M.-P.; Zhang, W.; Fan, J.; Yu, J.; Dang, Y. Assessment and determinants of satisfaction with urban livability in China. Cities 2018, 79, 92–101. [Google Scholar] [CrossRef]
  29. Zhang, Y.; Li, Y.; Chen, Y.; Liu, S.; Yang, Q. Spatiotemporal heterogeneity of urban land expansion and urban population growth under new urbanization: A case study of Chongqing. Int. J. Environ. Res. Public Health 2022, 19, 7792. [Google Scholar] [CrossRef]
  30. Hossein, A.; Sarkari, F.; Borhani, M. Coupling coordination analysis between urbanization and ecology in Iran. Front. Urban Rural. Plan. 2024, 2, 5. [Google Scholar]
  31. Cai, J.; Li, X.; Liu, L.; Chen, Y.; Wang, X.; Lu, S. Coupling and coordinated development of new urbanization and agro-ecological environment in China. Sci. Total Environ. 2021, 776, 145837. [Google Scholar] [CrossRef]
  32. Lv, T.; Wang, L.; Zhang, X.; Xie, H.; Lu, H.; Li, H.; Liu, W.; Zhang, Y. Coupling coordinated development and exploring its influencing factors in Nanchang, China: From the perspectives of land urbanization and population urbanization. Land 2019, 8, 178. [Google Scholar] [CrossRef]
  33. Wang, D.; Jiang, D.; Fu, J.; Lin, G.; Zhang, J. Comprehensive Assessment of Production–Living–Ecological Space Based on the Coupling Coordination Degree Model. Sustainability 2020, 12, 2009. [Google Scholar] [CrossRef]
  34. Xu, Z.; Yin, Y. Regional Development Quality of Yangtze River Delta: From the Perspective of Urban Population Agglomeration and Ecological Efficiency Coordination. Sustainability 2021, 13, 12818. [Google Scholar] [CrossRef]
  35. Zeng, P.; Wei, X.; Duan, Z. Coupling and coordination analysis in urban agglomerations of China: Urbanization and ecological security perspectives. J. Clean. Prod. 2022, 365, 132730. [Google Scholar] [CrossRef]
  36. Jiang, S.; Zhang, Z.; Ren, H.; Wei, G.; Xu, M.; Liu, B. Spatiotemporal characteristics of urban land expansion and population growth in Africa from 2001 to 2019: Evidence from population density data. ISPRS Int. J. Geo-Inf. 2021, 10, 584. [Google Scholar] [CrossRef]
  37. Regueiro-Ferreira, R.M.; Alonso-Fernández, P. Ecological elasticity, decoupling, and dematerialization: Insights from the EU-15 study (1970–2018). Ecol. Indic. 2022, 140, 109010. [Google Scholar] [CrossRef]
  38. Cao, Y.; Zhang, Z.; Fu, J.; Li, H. Coordinated Development of Urban Agglomeration in Central Shanxi. Sustainability 2022, 14, 9924. [Google Scholar] [CrossRef]
  39. Hepburn, C.; Qi, Y.; Stern, N.; Ward, B.; Xie, C.; Zenghelis, D. Towards carbon neutrality and China’s 14th Five-Year Plan: Clean energy transition, sustainable urban development, and investment priorities. Environ. Sci. Ecotechnol. 2021, 8, 100130. [Google Scholar] [CrossRef]
  40. Xiao, R.; Yu, X.; Xiang, T.; Zhang, Z.; Wang, X.; Wu, J. Exploring the coordination between physical space expansion and social space growth of China’s urban agglomerations based on hierarchical analysis. Land Use Policy 2021, 109, 105700. [Google Scholar] [CrossRef]
  41. Yang, J.; Huang, X. 30 m annual land cover and its dynamics in China from 1990 to 2019. Earth Syst. Sci. Data 2021, 13, 3907–3925. [Google Scholar] [CrossRef]
  42. Zhang, Q.; Kong, Q.; Zhang, M.; Huang, H. New-type urbanization and ecological well-being performance: A coupling coordination analysis in the middle reaches of the Yangtze River urban agglomerations, China. Ecol. Indic. 2024, 159, 111678. [Google Scholar] [CrossRef]
  43. Li, X.; Lu, Z. Quantitative measurement on urbanization development level in urban Agglomerations: A case of JJJ urban agglomeration. Ecol. Indic. 2021, 133, 108375. [Google Scholar] [CrossRef]
  44. Cramer, W.; Field, C.B. Comparing global models of terrestrial net primary productivity (NPP): Introduction. Glob. Chang. Biol. 1999, 5, 1–15. [Google Scholar] [CrossRef]
  45. Christopher, G. Potential scale-related problems in estimating the costs of CO2 mitigation policies. Clim. Chang. 2000, 44, 331–349. [Google Scholar]
  46. Jin, J.; Li, M.; Jin, L. Data normalization to accelerate training for linear neural net to predict tropical cyclone tracks. Math. Probl. Eng. 2015, 2015, 931629. [Google Scholar] [CrossRef]
  47. Patro, S.G.K.; Sahu, K.K. Normalization: A preprocessing stage. arXiv 2015, arXiv:1503.06462. [Google Scholar] [CrossRef]
  48. Abdi, H.; Lynne, J. Williams. Normalizing data. Encycl. Res. Des. 2010, 1, 935–938. [Google Scholar]
  49. Liu, Y.; Yue, W.; Fan, P.; Zhang, Z.; Huang, J. Assessing the urban environmental quality of mountainous cities: A case study in Chongqing, China. Ecol. Indic. 2017, 81, 132–145. [Google Scholar] [CrossRef]
  50. Fu, C.; Zhang, H. Evaluation of Urban Ecological Livability from a Synergistic Perspective: A Case Study of Beijing City, China. Sustainability 2023, 15, 10476. [Google Scholar] [CrossRef]
  51. Lv, T.; Geng, C.; Zhang, X.; Hu, H.; Li, Z.; Zhao, Q. Spatiotemporal evolution and influencing factors of urban industrial carbon emission efficiency in the Mid-Yangtze River urban agglomeration of China. Phys. Chem. Earth Parts A/B/C 2024, 135, 103607. [Google Scholar] [CrossRef]
  52. Wang, J.; Su, M.; Chen, B.; Chen, S.; Liang, C. A comparative study of Beijing and three global cities: A perspective on urban livability. Front. Earth Sci. 2011, 5, 323–329. [Google Scholar] [CrossRef]
  53. Cao, Y.; Li, F.; Xi, X.; van Bilsen, D.J.C.; Xu, L. Urban livability: Agent-based simulation, assessment, and interpretation for the case of Futian District, Shenzhen. J. Clean. Prod. 2021, 320, 128662. [Google Scholar] [CrossRef]
Figure 1. Locations of the five national urban agglomerations.
Sustainability 16 10438 g001
Table 1. Indicators for urban livability.
IndicatorsSub IndicatorsDescriptionType
Social-
economic Development (SD)
GDP per capitaStatistics of per capita GDP in each cityPositive
Disposable income of urban residentsStatistics of per capita disposable income in each cityPositive
Urban population ratioUrban population/total resident populationPositive
Per capita urban construction areaConstruction land area/total resident populationPositive
Number of hospital beds per 10,000 peopleNumber of beds/total resident population (per 10,000 people)Positive
Number of enrolled students per 10,000 peopleNumber of enrolled students (nursery school, primary school, middle school, university)/total resident population (per 10,000 people)Positive
Ecosystem Service
(ES)
Per capita NPPTotal NPP/total resident populationPositive
Per capita urban green/bule space(Forest + grassland + water area)/total resident populationPositive
Per capita carbon emissionsTotal carbon emissions/total resident populationNegative
Energy efficiencyGDP/total carbon emissionsPositive
Table 2. Classification of coordination level between urban livability and population distribution.
CDI RangeCoordination LevelImplication
CDI < −1LowThe current population is excessively high compared to the level of urban livability.
−1 ≤ CDI < −0.5ModerateThe current population is relatively high compared to the level of urban livability.
−0.5 ≤ CDI < 0.5HighThe current population is well-coordinated with the level of urban livability.
0.5 ≤ CDI < 1ModerateThe current population is relatively low compared to the level of urban livability.
1 ≤ CDILowThe current population is excessively low compared to the level of urban livability
Disclaimer/Publisher’s Note: The statements, opinions and data contained in all publications are solely those of the individual author(s) and contributor(s) and not of MDPI and/or the editor(s). MDPI and/or the editor(s) disclaim responsibility for any injury to people or property resulting from any ideas, methods, instructions or products referred to in the content.

