Abstract
This study presents a techno-economic and environmental analysis of hybrid renewable energy systems to identify the optimal configuration for supplying the planned 850 MW renewable energy plant in Yanbu city, Saudi Arabia. Ten grid-connected system designs combining photovoltaic (PV), wind turbine (WT), and battery storage were simulated and optimized using the HOMER Grid software (1.10.2 pro edition). A site suitability analysis was conducted to evaluate potential locations based on climatic, topographic, and infrastructure-related factors. A sensitivity analysis considered variations in solar irradiation, wind speed, temperature, load demand, and economic parameters. The results showed that the PV-only system with an 850 MW capacity achieved the lowest net present cost (NPC) of USD 201 million and levelized cost of energy (LCOE) of 0.0344 USD/kWh, making it the most economically feasible option. However, a hybrid WT–PV configuration of 212.5 MW WT and 637.5 MW PV was also proposed to support local manufacturing. All proposed systems provided over a 91% renewable energy contribution while reducing CO2 emissions by 53% compared to grid supply only. Up to 1152 jobs are estimated to be created through renewable energy deployment in Yanbu city.
1. Introduction
The Kingdom of Saudi Arabia has a national renewable energy program, which is a strategic initiative under the custodian of the two holy mosques initiative for renewable energy and the 2030 Saudi Arabian vision. This program targets increasing the Kingdom’s share in producing renewable energy up to the net zero target, achieving a balance in the combination of local energy sources, and achieving the Kingdom’s commitment toward avoiding carbon emissions. Moreover, Saudi Arabia has a special geographic location and excellent climate conditions, which make investments in renewable energy resources economically feasible and support the Kingdom’s efforts towards diversifying its energy sources [1,2]. The ministry of energy is working through the program to diversify the local energy mix used in producing electricity via increasing the natural gas share and renewable energy sources, which the Kingdom is targeting to achieve the perfect, most efficient, and cost-effective energy mix, producing electricity by reducing the use of liquid fuel and compensating for it by using natural gas and renewable energy sources, which will form approximately 50% each from the energy mix used in electricity generation by 2030 [3,4]. The first phase of the national renewable energy program has been already launched and includes the project of a photovoltaic (PV) station for Sakaks city, with a capacity of 300 MW and a 0.0234 USD/kWh cost of energy, and the project of a wind energy station for Dumat Al Jandal city, with a capacity of 400 MW and a 0.0199 USD/kWh cost of energy, breaking an international record for the lowest cost of purchasing electricity produced from wind energy in the world. Moreover, the second phase of the program has also been launched, including seven projects for solar photovoltaic energy with a capacity of 2970 MW in the following locations: Al Shueayba, Rabigh, Jeddah, Al Qurayyat, Al Madinah Munawwarah, Rafha, and Sadder [1,5].
Electricity generation via solar PV technology was increased by 26% in 2022, which represents the largest growing renewable energy generation among other types and technologies. Countries like the USA, China, the European Union, and India are putting a lot of effort into solar PV supply chain development and driving enhancements in their supporting policies, which is expected to make PV solar energy sprint in growth. China is the leading country in increasing the growth of solar PV energy by increasing its PV generation to 100 GW, the European Union has increased its PV generation by 50% (38 GW) as a response to the energy crisis, India has increased its generation by 40% (18 GW), Brazil is doubling its generation by adding 11 GW of PV capacity, and the USA has increased funding for solar PV as a move to reduce inflation [6]. The generation of wind energy was increased by 14% in 2022, which represents the second-largest growing renewable energy generation among other types and technologies behind PV solar energy. China is also the leading country in this, increasing the growth of wind energy by 37 GW in onshore wind and offshore farms, the European Union has increased its capacity for wind energy by 13 GW as a response to the energy crisis, while the United Kingdom has increased its capacity by 3 GW of offshore wind [7].
Literature Review
There are many studies focused on finding the optimal energy mix (hybrid energy system), whether the system is connected to the grid or islanded. A techno-economic analysis for different hybrid energy configurations such as PV–On Grid, WT–On Grid, and PV–WT–On Grid for power generation in Chandigarh in India is investigated in [8]. The results emphasized that the PV–On Grid configuration is the optimal system, considering the system that has the least levelized cost of energy (LCOE), while the PV–WT–On Grid configuration generates more electric power than other configurations, and both configurations are feasible for power generation. In [4], the authors conducted a feasibility study from a techno-economic point of view for a PV–On Grid system for Makkah city using HOMER software, considering different tracking systems, which are horizontal axis (monthly/weekly/daily/continuous) adjustments, vertical axis continuous adjustments, and fixed axes. The results showed that the optimal option was the vertical continuous adjustment tracking system because it had the lowest net present cost (NPC) and the lowest LCOE. The researchers in [9] found in their study, which is about finding the best energy mix between PV–WT–Generator–Battery Storage–Off Grid and PV–WT–Battery Storage–On Grid system configurations, that the PV–WT–Battery storage–On Grid system is efficient and economical for rural areas in India more than the conventional system. The results in [10] showed that the PV–WT–On Grid system is the best alternative for conventional energy sources because it reduces the dependence on liquid fuel and also reduces the LCOE in the future. Ref. [3] is a study for Yanbu city that investigates the feasibility of 15 hybrid system configurations with Off Grid and On Grid options by conducting an optimization analysis using the HOMER pro software. The researchers found that the optimal system configuration was the PV–On Grid system with a 850 MW sizing. In [11], Ahmed et al. conducted an optimization analysis to find the optimal hybrid PV system for supplying a healthcare center in a rural area of Bangladesh. Their results showed that the optimal configuration was a PV–Generator–On Grid system, providing 24.3 kW with an NPC of USD 28,705 and achieving a 98% renewable penetration. Similarly, Nkambule et al. [12] performed a performance optimization study to determine the optimal configuration for supplying electrical needs to the mining industry in South Africa. Their findings indicated that a PV (5 MW)–WT (1 MW)–battery storage (1 MW/4 MW)–On Grid configuration was the optimal system, achieving an 86% performance rating [11,12].
There are also many studies on finding the optimal system taking into consideration a sensitivity analysis, which covers increases in load consumption, changes in grid tariff, and changes in environmental conditions. Kumar et al. [13] conducted a study on green buildings in southern India, revealing that a PV–WT–Battery Storage–On Grid system, with sizes of 180 kW, 150 kW, 79.2 kW, and 600 kW respectively, is the most economical option for meeting the electrical needs of a building with a load profile of 6.7 MWh/d. This configuration not only reduces CO2 emissions by 38.3%, but also demonstrates the ability to withstand dynamic external changes, such as variations in wind speed, solar radiation, and energy consumption [13]. In [2], the authors conducted a study with a similar approach for grid-connected solar PV systems for residential buildings in Saudi Arabia [14,15,16,17]. Nurunnabi et al. [14] conducted an optimization and sensitivity analysis for hybrid renewable energy systems in several cities in Bangladesh, including Dinajpur, Sitakunda, Kuakata, Magnama, and Rangpur. The results, based on NPC, LCOE, and renewable fraction, indicated that the WT–On Grid system configuration was optimal for Magnama, Kuakata, and Sitakunda, while the PV–On Grid system configuration was the best option for Dinajpur and Rangpur. Shezan et al. [15] performed an optimization analysis on five control dispatch strategies for a WT–PV–diesel generator–battery storage off-grid system, including load following, combined dispatch, HOMER predictive dispatch, cycle charging, and generator order. They found that the load following strategy was optimal, achieving the lowest cost of energy, reduced CO2 emissions, and the lowest NPC. Nallolla et al. [16] conducted a techno-economic sensitivity analysis for various architectures of hybrid off-grid renewable energy systems in remote areas of India. The results from HOMER simulations revealed that the winning architecture consisted of PV and battery storage, with a PV capacity of 1476 kW, NPC of USD 7.01 million, LCOE of USD 0.244, and 84% renewable penetration. Aziz et al. [17] designed a grid-connected PV system for a residential house in Iraq, utilizing HOMER simulation for optimization and sensitivity analysis. Their findings demonstrated that the system, comprising PV modules and battery storage with grid support, achieved an NPC of USD 33,747 through their modified dispatch strategy via MATLAB linked to the HOMER software. Saqr et al. [18] conducted a comprehensive evaluation of groundwater exploitation using solar energy in the El-Saloum depression, Egypt. The study integrated regional characteristics and topography with the three pillars of sustainability outlined by the SDGs agenda, which resulted in the identification of suitable zones for solar-based groundwater exploitation using a multi-criteria analysis (MCA-GIS integrated model). Their findings emphasized the importance of considering economic, technical, and environmental factors in site selection for solar energy projects.
The Yanbu city renewable energy station is one of the future projects under the Saudi Arabia renewable energy program, with capacity of 850 MW produced by renewable energy. The novelty of this research lies in its comprehensive methodology for identifying the optimal sites for solar PV and wind energy deployment in Yanbu city, Saudi Arabia. Previous studies have typically focused on a single aspect of hybrid energy systems. In contrast, this research integrates a detailed techno-economic and environmental analysis of ten different grid-connected hybrid energy system configurations. Additionally, the study incorporates a sensitivity analysis to determine the optimal system design capable of withstanding variations in key parameters such as solar radiation, wind speed, temperature, load consumption, and economic factors. This holistic approach not only aims to cover the electrical loads of Yanbu city, but also evaluates the systems’ feasibility from economic, environmental, and social perspectives, including job creation estimation. The assessment of the study depends on the following factors to choose the optimal system configuration, which are covering the electrical loads of Yanbu city, NPC, LCOE, renewable fraction, which is the energy delivered to serve the load from renewable resources, CO2 emissions reduction, and the ability of the system to withstand uncontrollable changes in aspects such as the nominal discount rate, inflation rate, solar radiation, wind speed, and increases in energy consumption while preserving its efficiency and feasibility from an economic and environmental point of view. A sensitivity analysis is performed to determine the optimal system design that can withstand variations in key parameters such as solar radiation, wind speed, temperature, load consumption, and economic factors. Furthermore, the social impacts of the proposed systems are evaluated through job creation estimation methods.
The findings of this research directly contribute to several Sustainable Development Goals (SDGs), thereby promoting broader environmental, economic, and social benefits. Specifically, the study aligns with SDG 7: Affordable and Clean Energy, by identifying the optimal hybrid energy systems that enhance energy efficiency and increase the share of renewable energy in the energy mix. This shift reduces reliance on fossil fuels, thereby aligning with SDG 13: Climate Action, by mitigating greenhouse gas emissions and helping to combat climate change. Furthermore, the economic analysis ensures that the proposed systems are cost-effective, supporting SDG 8: Decent Work and Economic Growth, through the creation of green jobs in the renewable energy sector and stimulating local economies. The social impact assessment, including job creation and community benefits, aligns with SDG 1: No Poverty and SDG 10: Reduced Inequalities, by providing new employment opportunities and promoting inclusive economic growth. The integration of these goals into the research framework ensures a holistic approach to sustainable development, addressing the environmental, economic, and social dimensions simultaneously. Studies such as [19,20,21] have highlighted the importance of considering these multifaceted impacts in renewable energy projects, reinforcing the relevance of this research to the global sustainability agenda.
2. Materials and Methods
We utilized the HOMER grid software to optimize and conduct a sensitivity analysis for ten grid-connected system configurations proposed for the Yanbu renewable project. HOMER is a hybrid optimization software designed for multiple energy resources, making it well-suited for modeling grid-connected systems. To function efficiently, HOMER requires input data, including economic factors, load profiles, site-specific renewable resource data, temperature data, and system component and parameter specifications.
2.1. Site Suitability Analysis
Site suitability analysis is an important part of planning renewable energy projects. It involves evaluating potential areas based on key factors that impact the productivity and performance of solar or wind power generation systems [22]. These criteria are typically categorized as climatic, geographic, environmental, and socioeconomic. Data related to these criteria are collected and analyzed using geographic information system (GIS) tools. Multi-criteria decision-making (MCDM) methods such as weighted linear combination (WLC) and the analytical hierarchy process (AHP) are applied to integrate multiple criteria and determine ideal locations. The AHP is a widely recognized MCDM tool for decision making and prioritization in various fields, including renewable energy. It compares and prioritizes different factors influencing site suitability. This analysis considers on-site conditions like solar irradiation, wind speed, as well as proximity to existing infrastructure. It also accounts for any geographical or land restrictions. Through the standardized mapping and ranking of suitable zones, site suitability analysis identifies the prime territories best positioned for renewable energy development. This helps to inform evidence-based decision making and optimize the sites for new power plants.
This section presents a GIS-based MCDM analysis to assess the site suitability for solar PV and wind energy systems in Yanbu City. The AHP, a widely recognized MCDM tool for decision making and prioritization in various fields, including renewable energy, was employed for this analysis. AHP compares and prioritizes different factors that influence site suitability.
2.1.1. Study Area
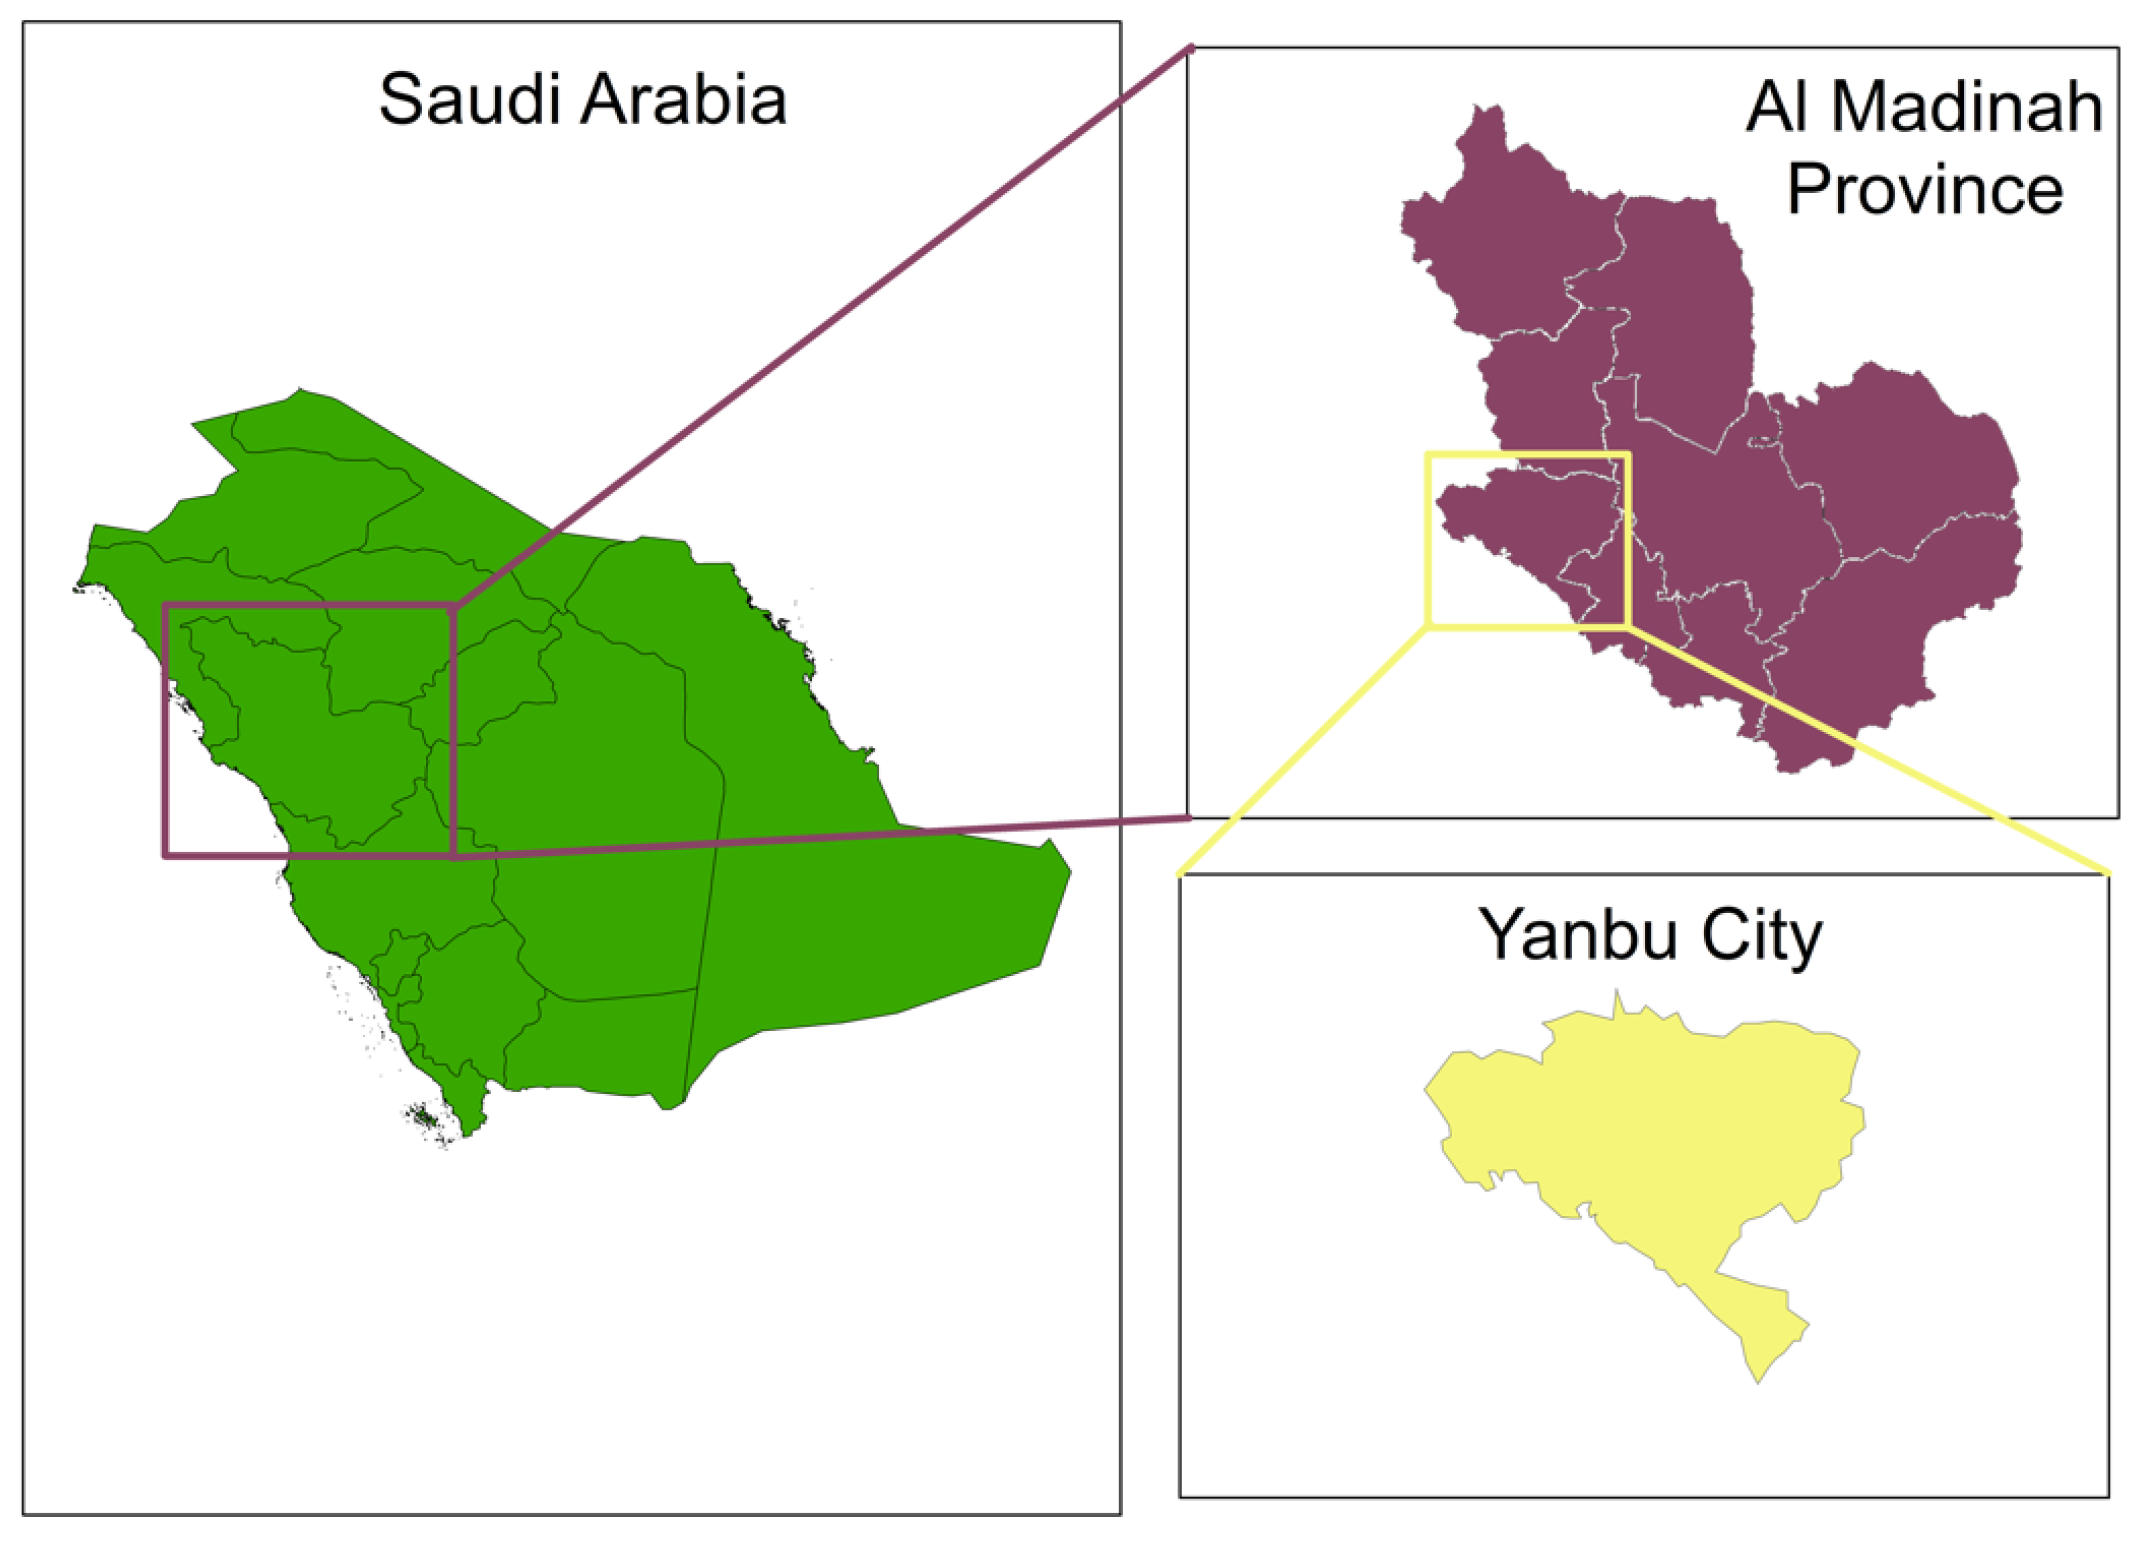
Yanbu City (Figure 1), located in Al Madinah province on the western coast of Saudi Arabia along the Red Sea, presents a unique and promising setting for renewable energy development due to several compelling factors. The city possesses a high solar irradiance and average wind speeds, which are essential for efficient wind energy generation. Additionally, the geographic features of Yanbu, including its available land area and suitable topography, facilitate the establishment of renewable energy projects. The existing infrastructure, such as proximity to transmission lines and roads, further enhances the feasibility of developing wind energy projects in this area [3]. Moreover, the development of renewable energy in Yanbu aligns with broader energy policy objectives that emphasize the importance of effective policy frameworks. A successful energy policy is characterized by its effectiveness in meeting objectives, efficiency in reducing costs, equity in the distribution of benefits, and feasibility. These criteria are crucial for inciting investment in renewable energy projects, ensuring that the development of wind energy in Yanbu not only contributes to local energy needs, but also supports national sustainability goals [23].
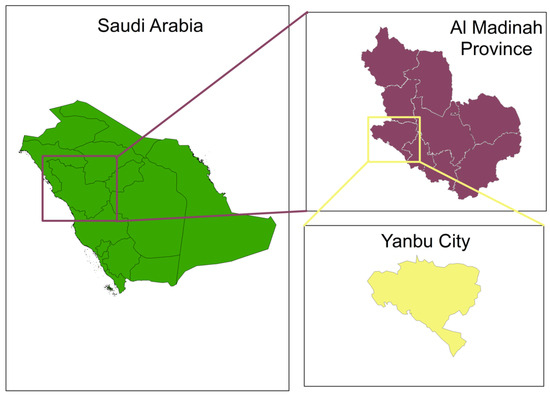
Figure 1.
Study area.
2.1.2. Criteria Selection and Weighting
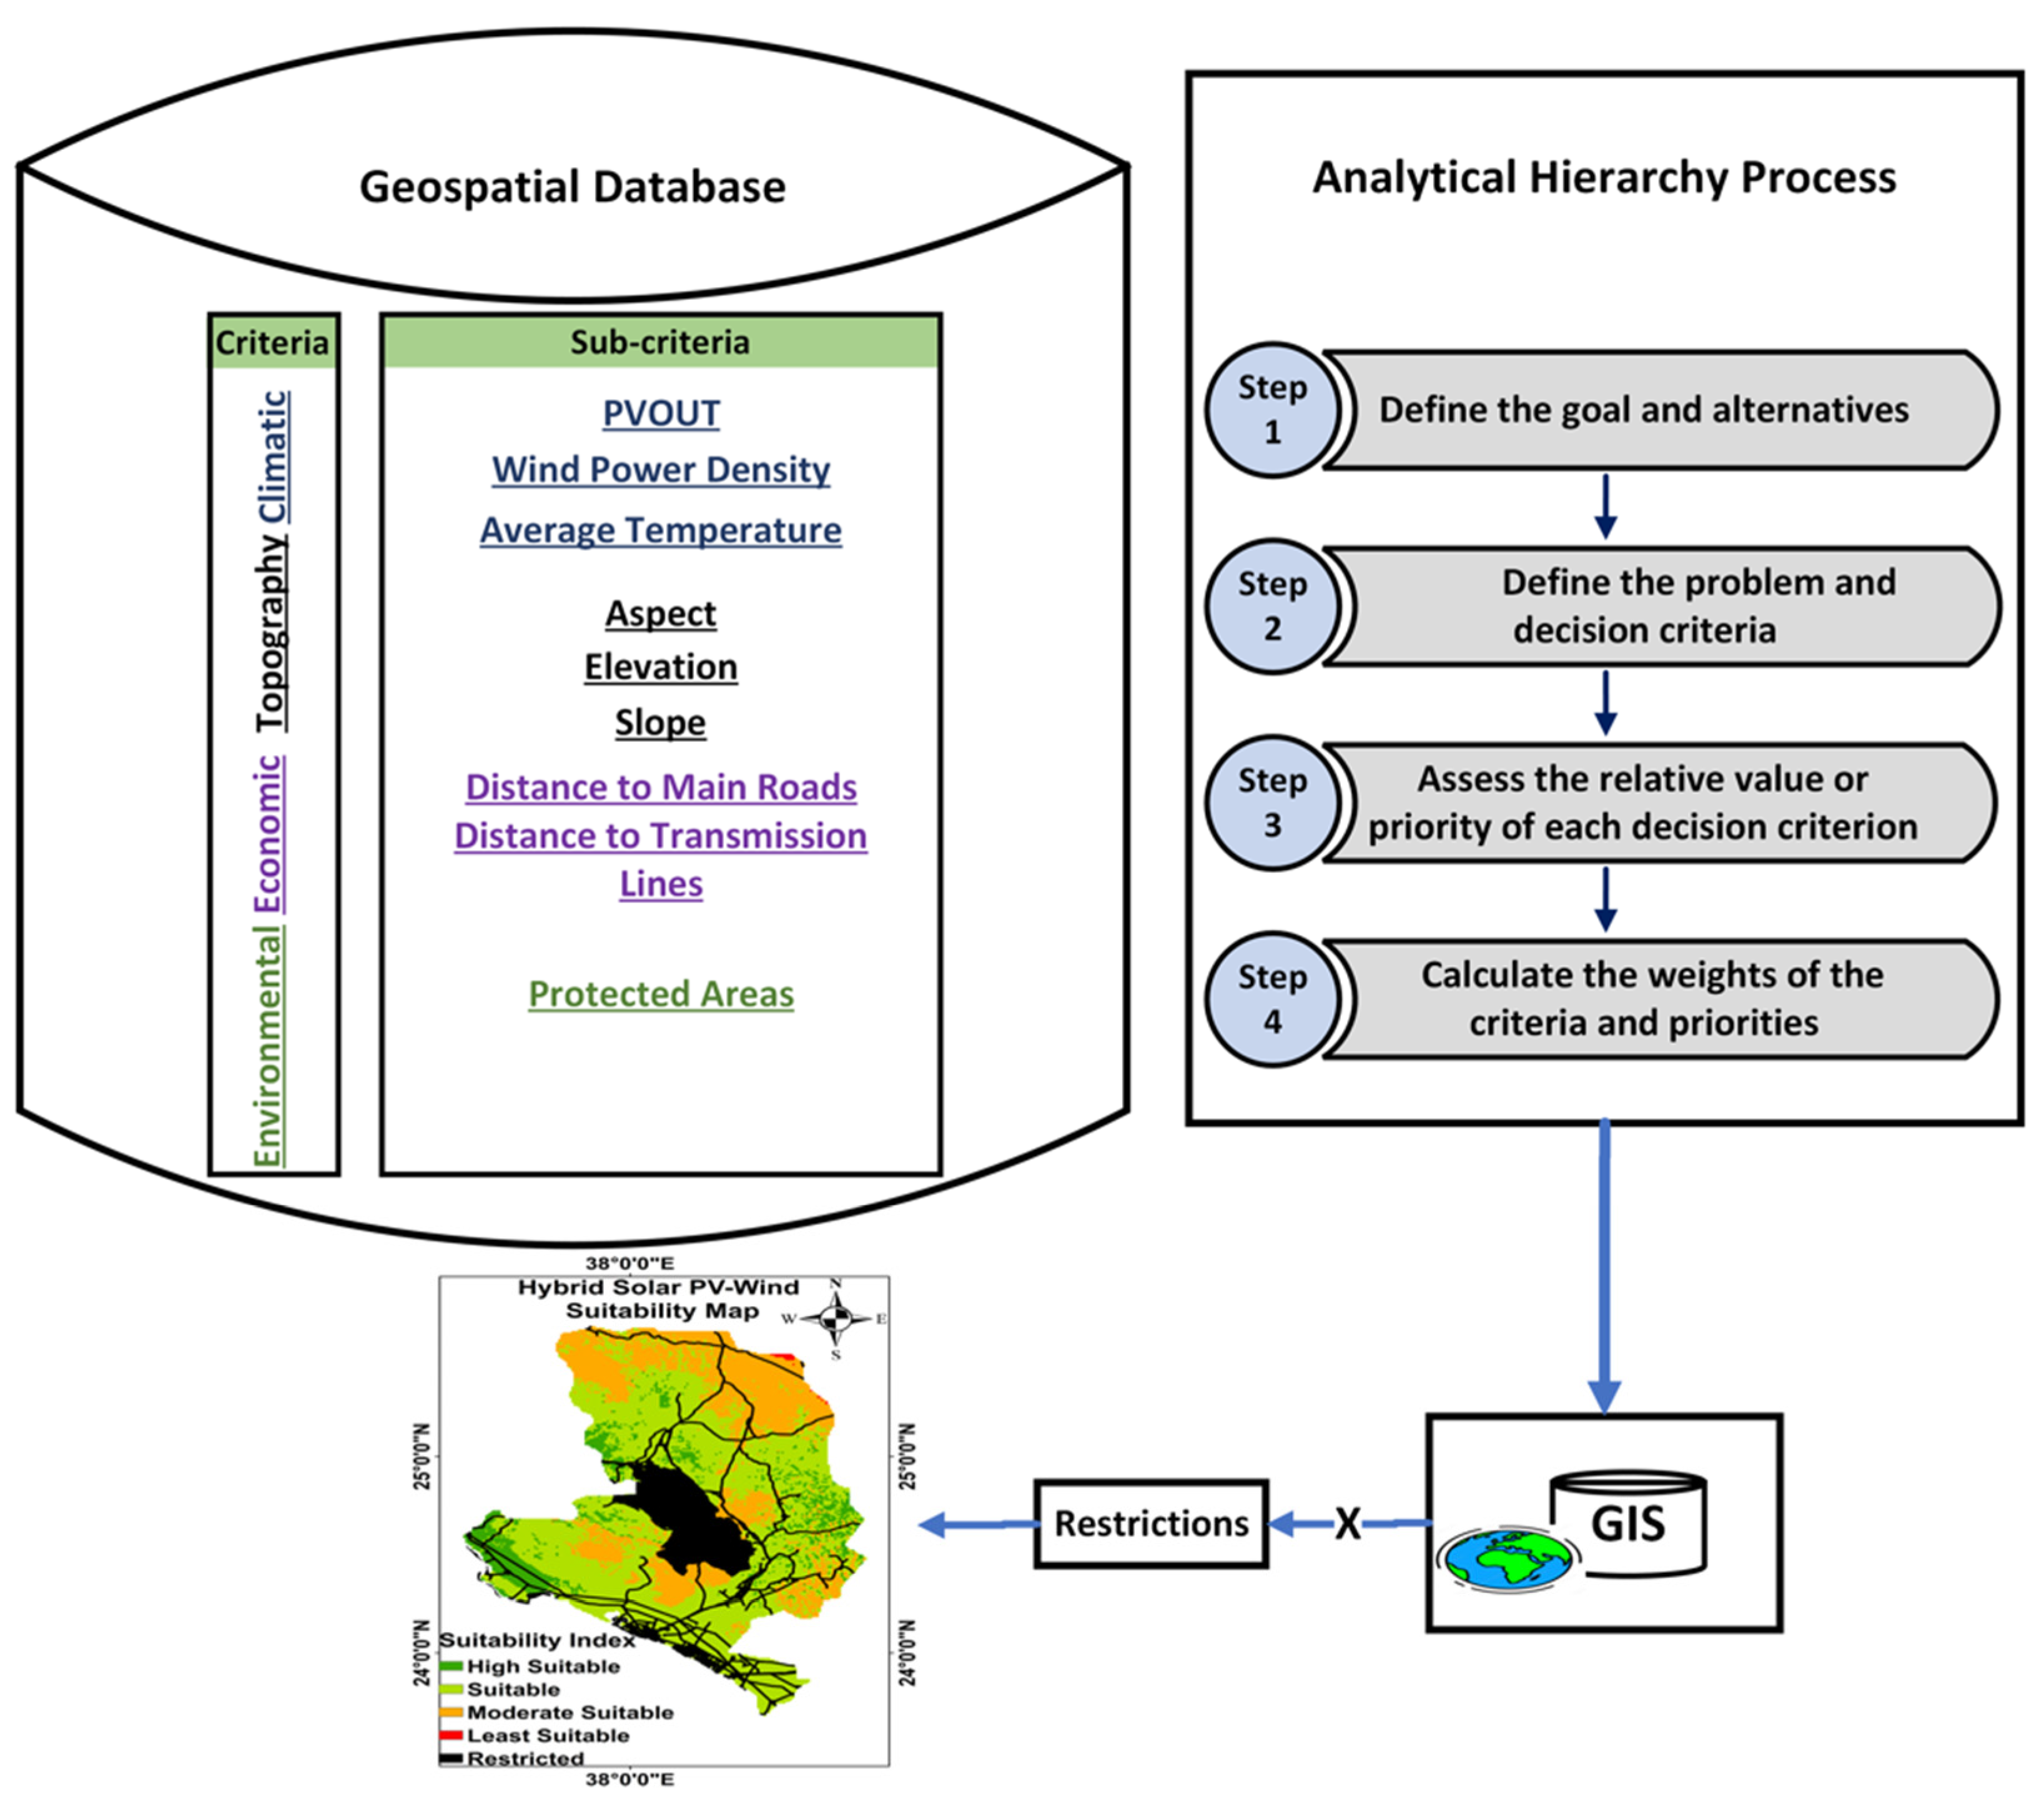
The first step involved identifying relevant criteria that affect the performance and feasibility of solar PV and wind energy systems. As illustrated in Figure 2, the criteria were categorized into the following four main groups: climatic factors, topographic factors, economic factors, and environmental factors. A total of ten criteria were considered, including the following:
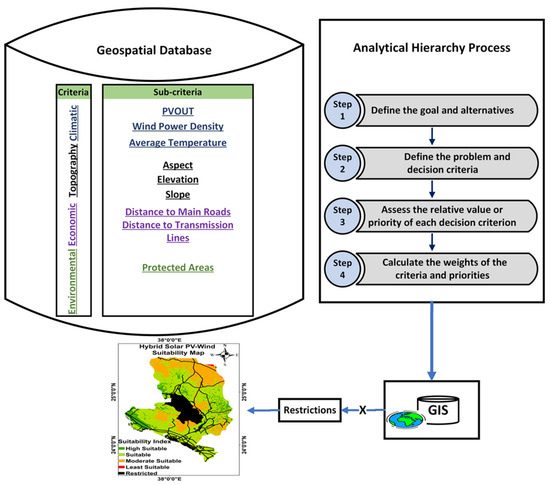
Figure 2.
Site suitability analysis methodology.
- Climatic factors: Solar PV output (PVOUT), wind energy density, average temperature, and precipitation.
- Topographic factors: Aspect, elevation, and slope.
- Economic factors: Proximity to transmission lines and proximity to roads.
- Environmental factors: Proximity to protected areas.
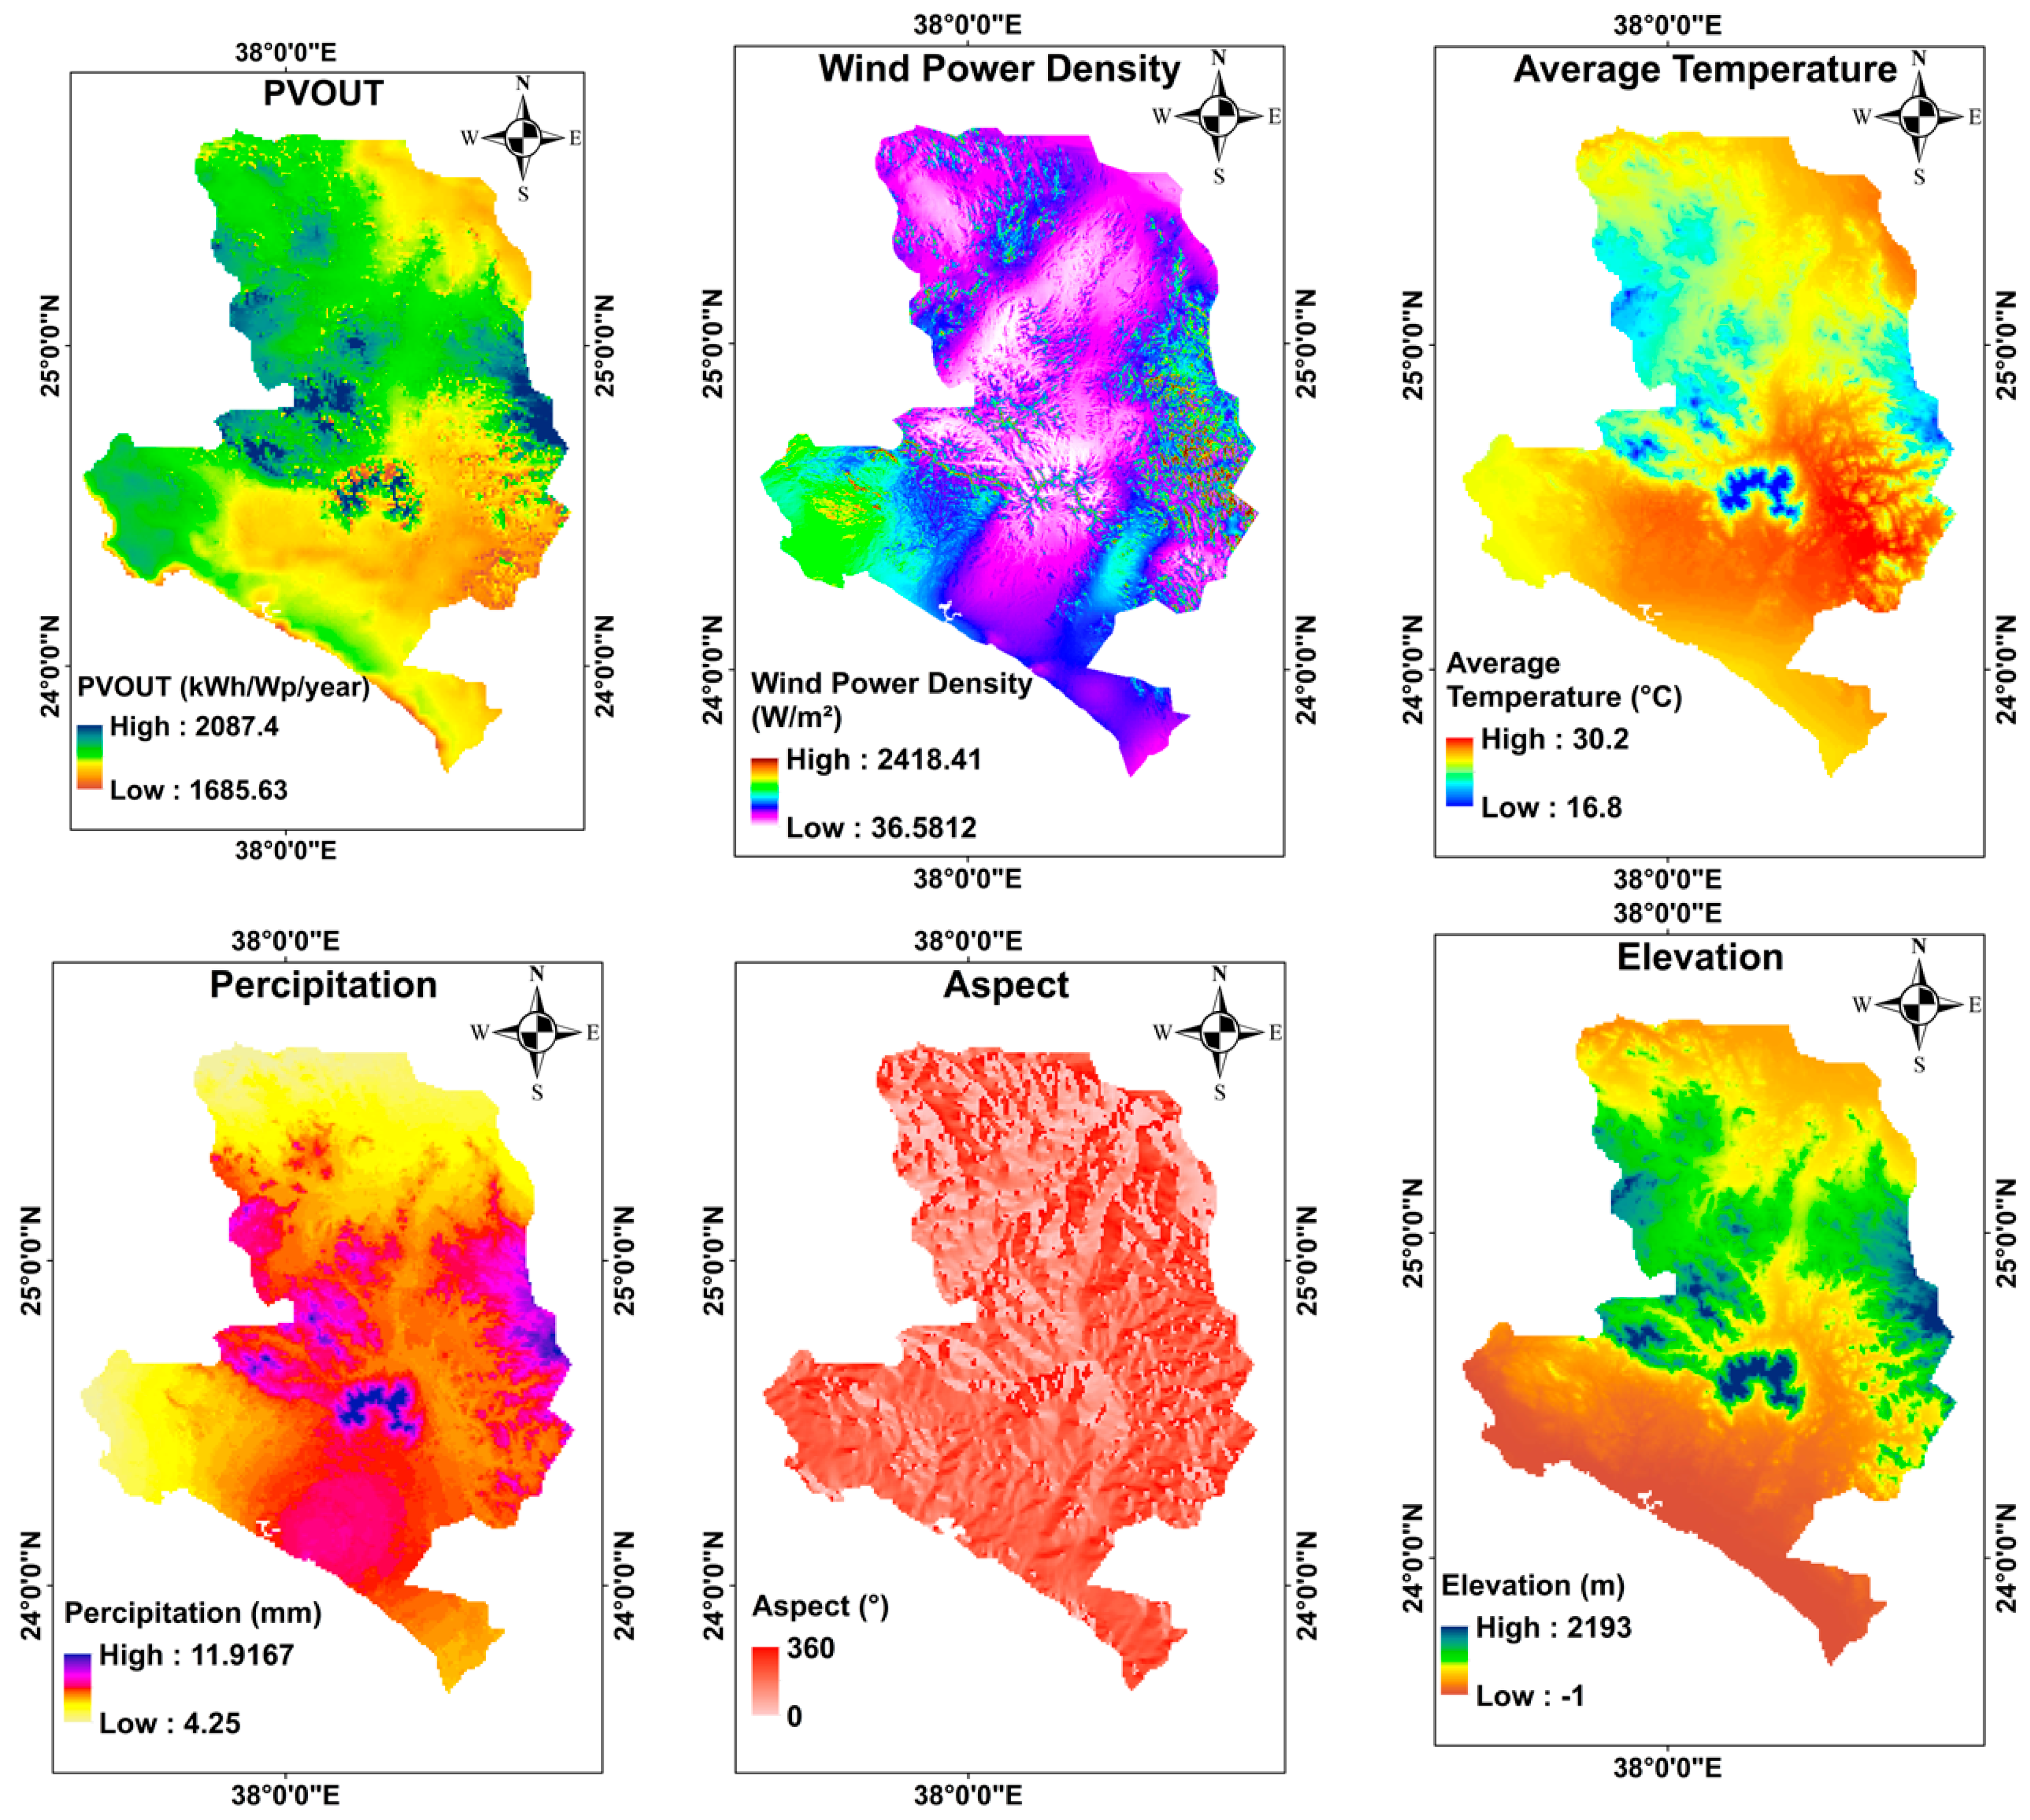
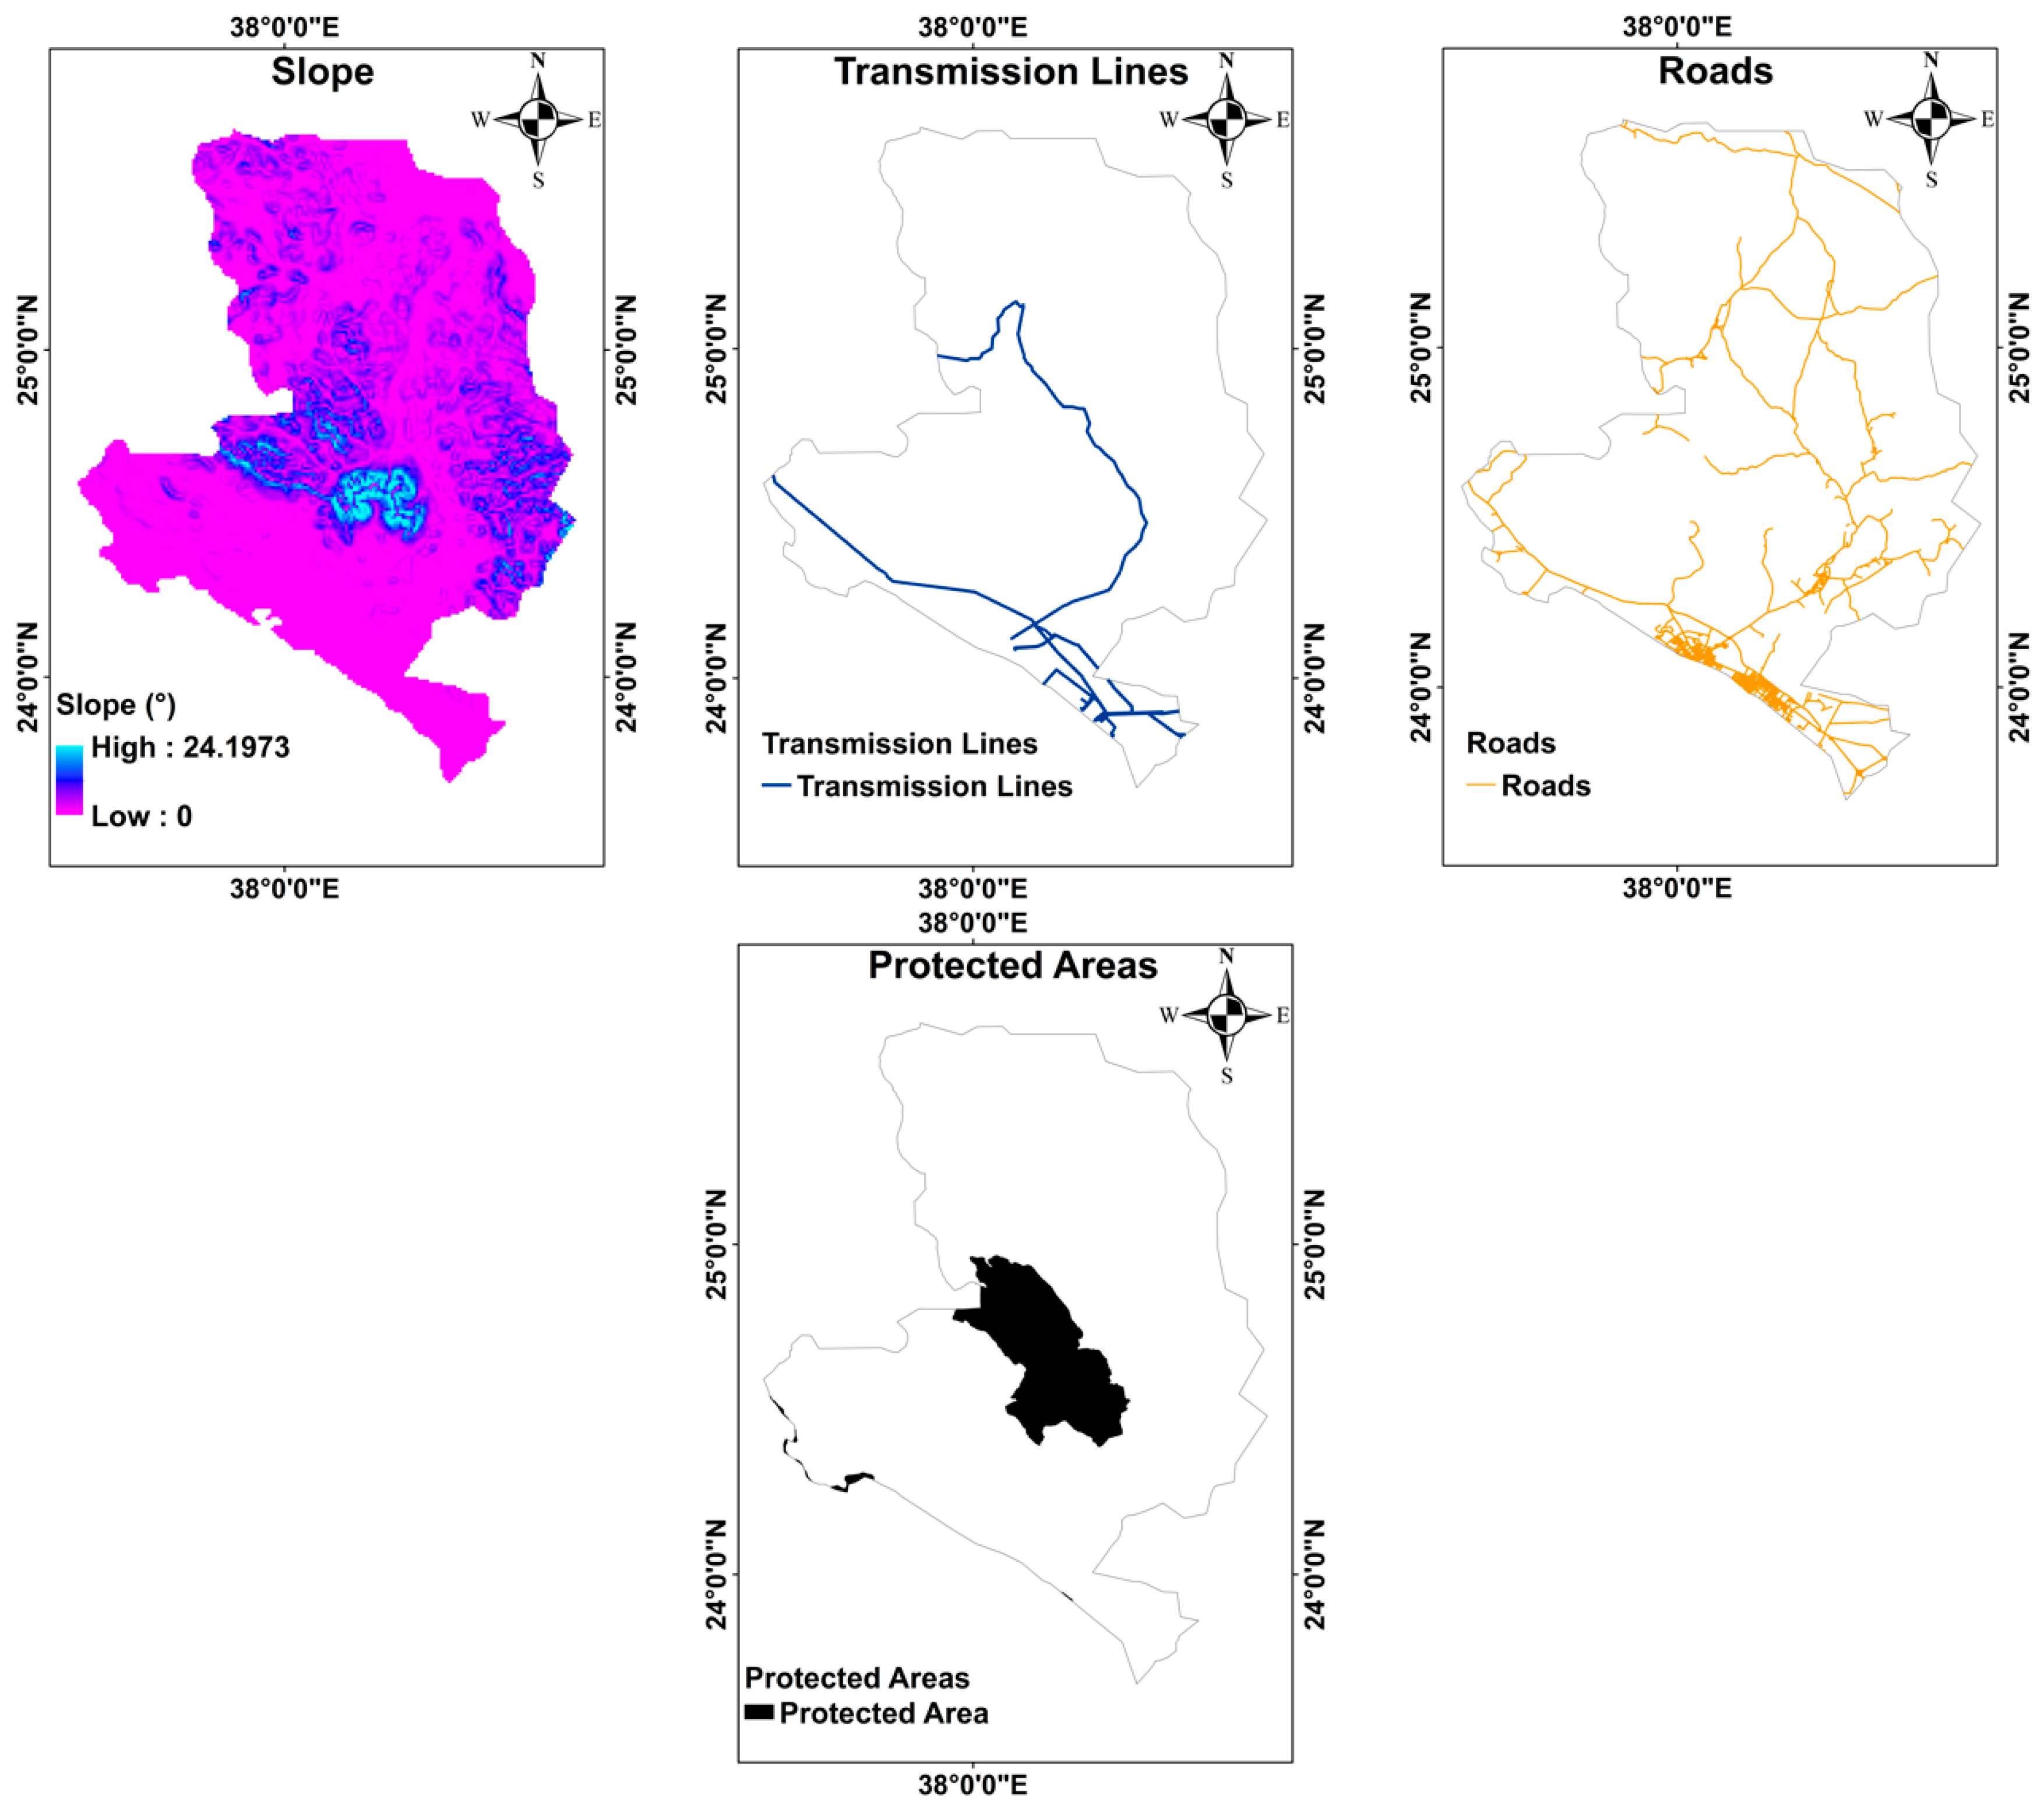
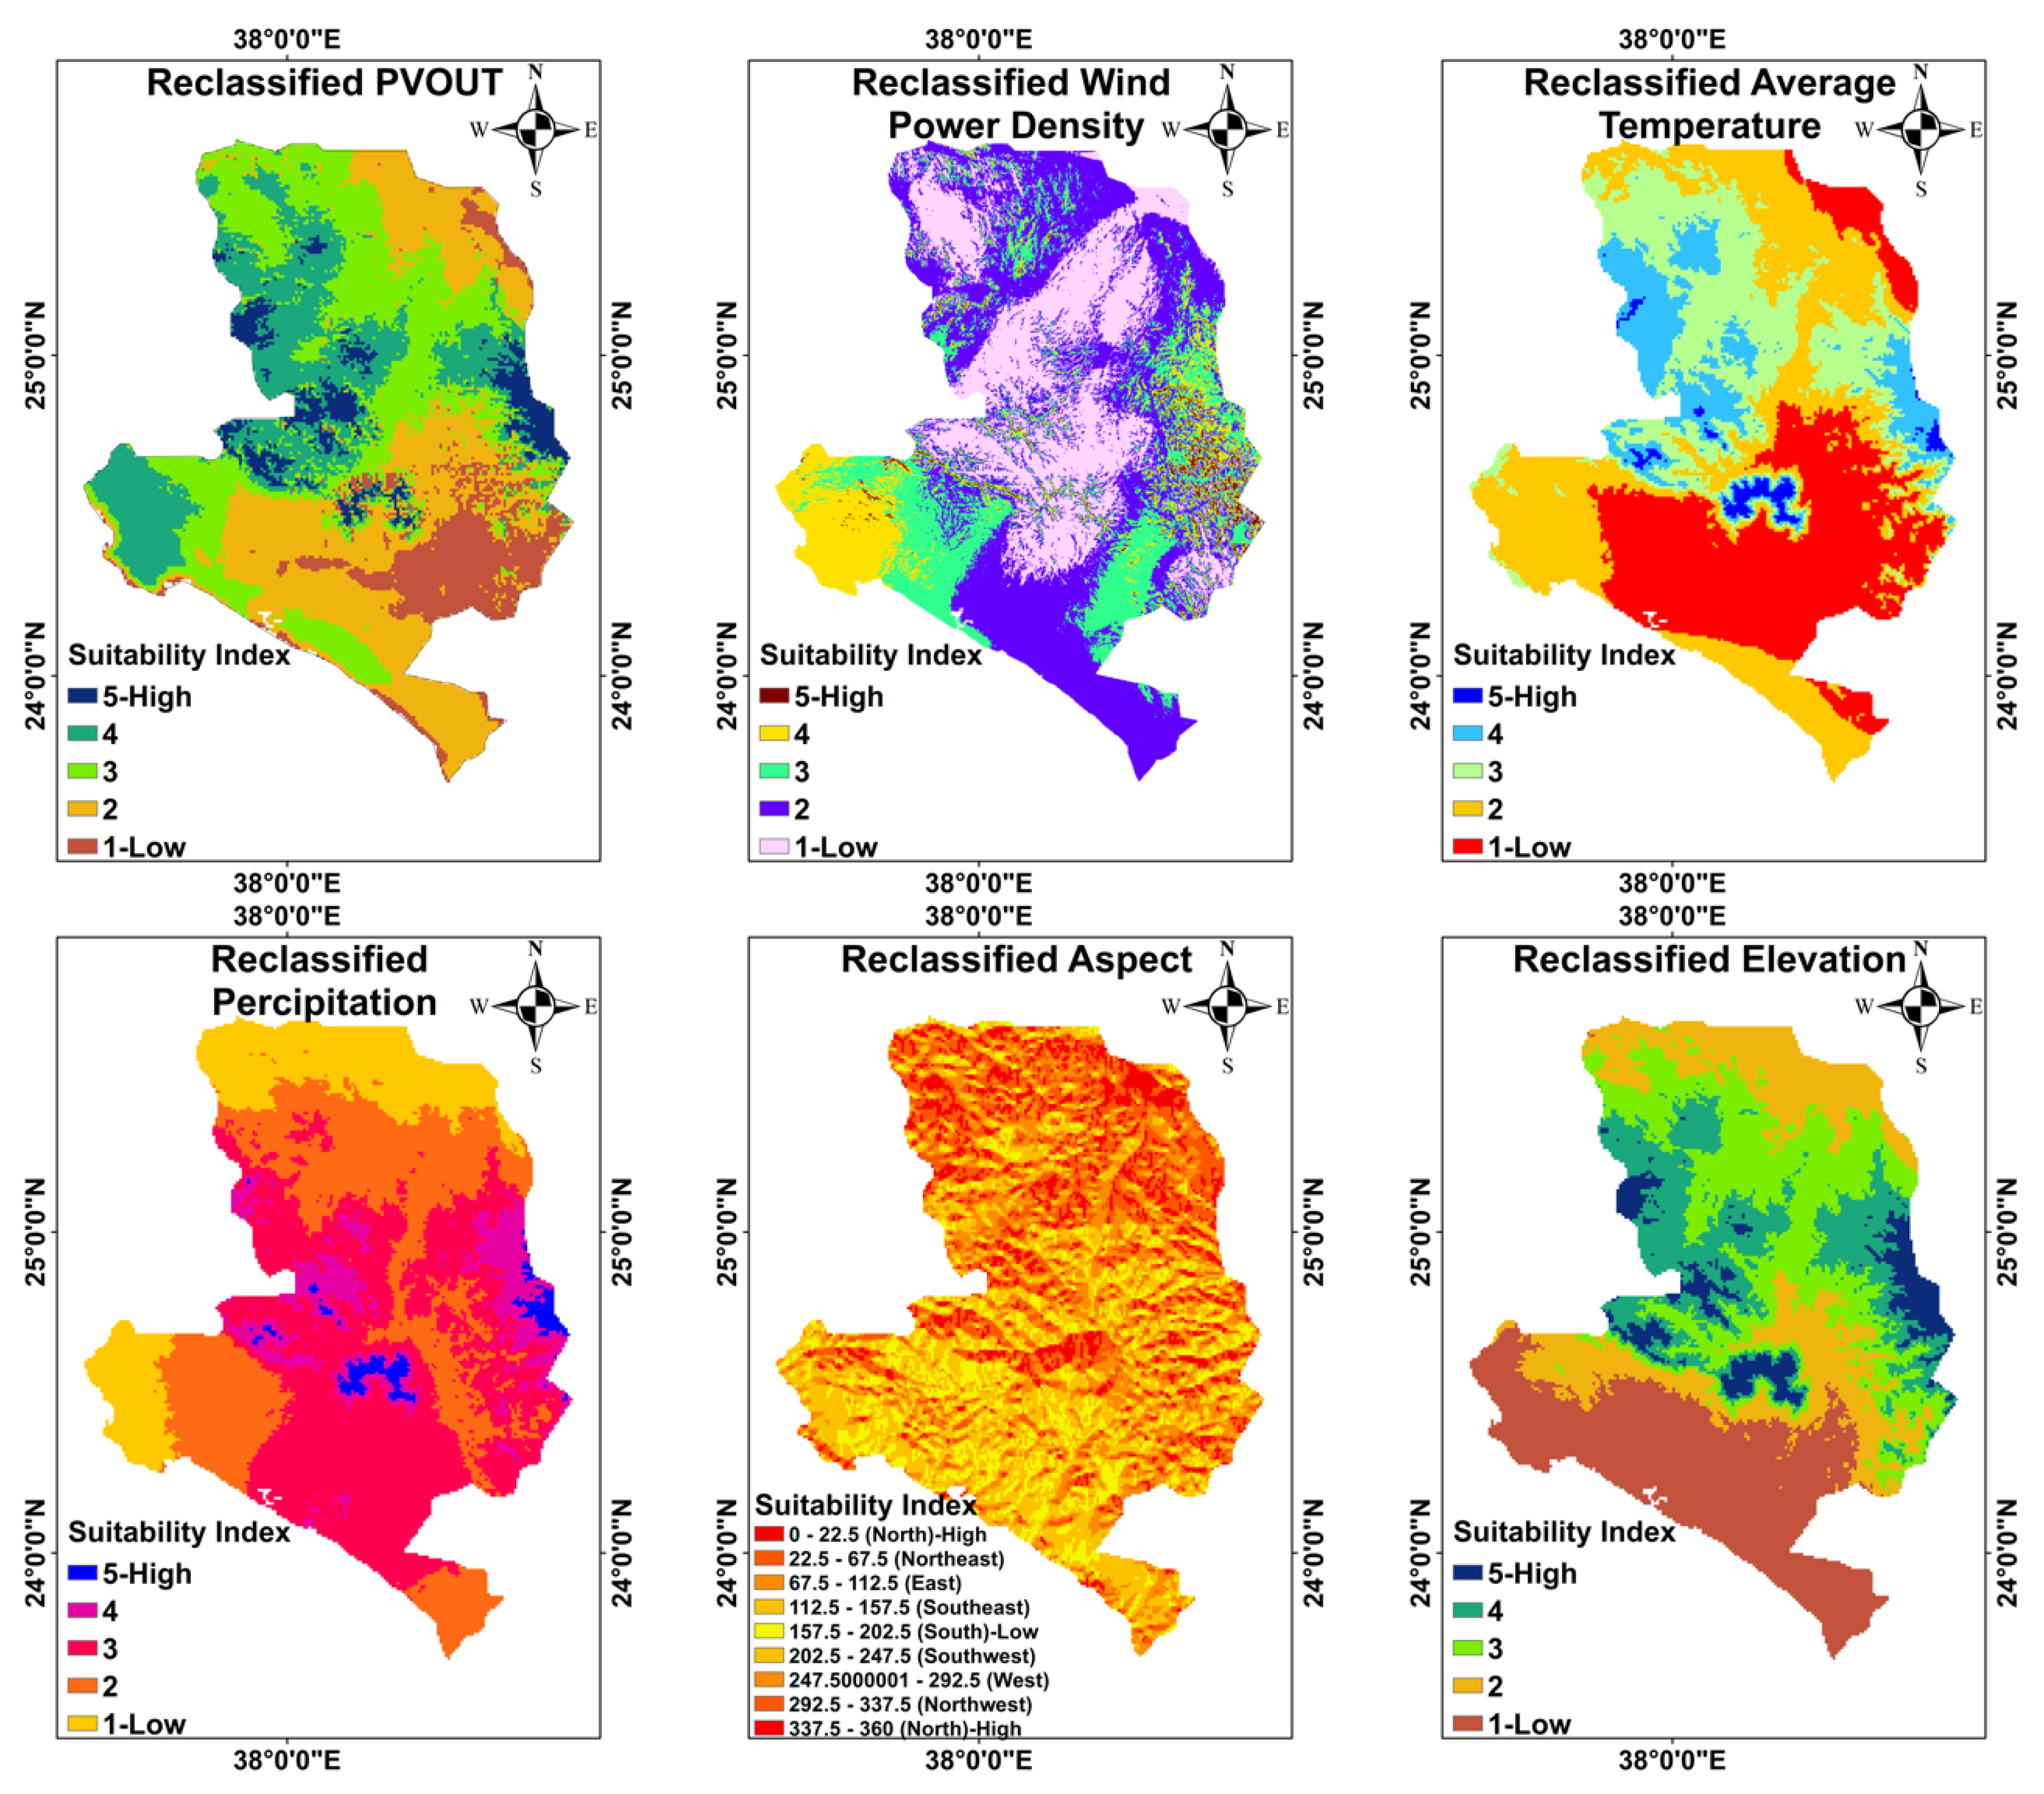
Geospatial data for all the criteria layers were processed in ArcGIS environment and are presented in Figure 3. Each dataset was represented as a separate feature layer within the GIS software. Since the criteria datasets utilized different measurement units and scales, the standardization of the layers was required to transform them onto a uniform scale for analysis purposes. The reclassification tool in ArcGIS was employed to standardize each criteria layer on a common scale from 1 to 5, as shown in Figure 4. This ensured the comparability and integration of the geospatial criteria datasets.
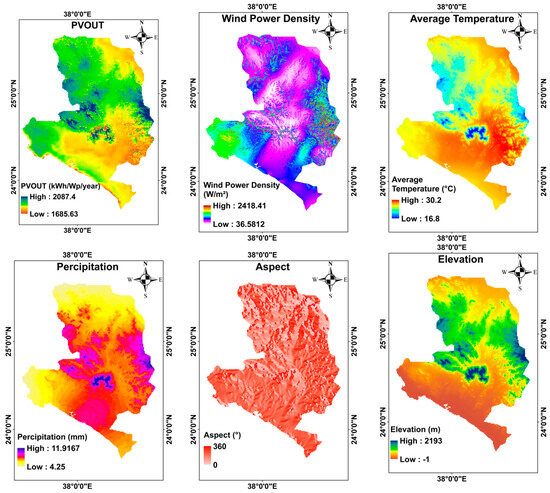

Figure 3.
Evaluation criteria.

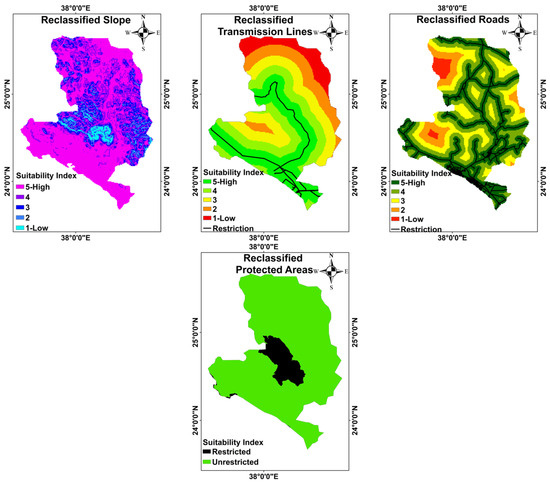
Figure 4.
Standardized criteria.
The relative importance of each criterion was determined using the AHP method. A group of experts familiar with the local conditions and renewable energy development in Saudi Arabia participated in pairwise comparisons to determine the relative weights of each evaluation criterion. The experts assigned scores based on a 1–9 scale, where 1 indicates equal importance and 9 indicates extreme importance. These scores were then used to calculate the weights for each criterion, ensuring a systematic and objective approach to weighting. The results of this analysis are presented in Table 1 for solar PV and Table 2 for wind energy. Although the results presented an acceptable inconsistency in the expert opinions, as indicated by the different consistency ratio (CR) values, all experts unanimously agreed on the significance of climatic factors in selecting optimal sites for solar PV and wind energy projects. The weights assigned to the main and sub-criteria for the solar PV suitability map can be found in Table 1, while Table 2 displays the criterion weights for the wind energy site mapping. The application of the AHP methodology provided a structured approach to quantifying the importance of each assessment metric and prioritizing the factors that have the greatest impact on PV and wind project siting.

Table 1.
Main and sub-criteria weights and CRs for solar PV suitability map.
Table 2.
Main and sub-criteria weights and CRs for wind suitability map.
2.1.3. Weighted Linear Combination (WLC)
Weighted linear combination (WLC) is a mathematical tool used to integrate different standardized criteria. Higher weights mean that a particular criterion contributes more to the final score. The result is an overall score for each option that takes into account how well it performed on all weighted criteria simultaneously. A higher combined score means that the option better satisfies the evaluation based on the criteria deemed the most important. The WLC provides an aggregate view of multi-criteria assessments through a simple weighted averaging approach. The equation for WLC is as follows [24]:
where S is the calculated suitability score for each pixel, Wi represents the weight of criterion i, and Xi is the criterion score of factor i.
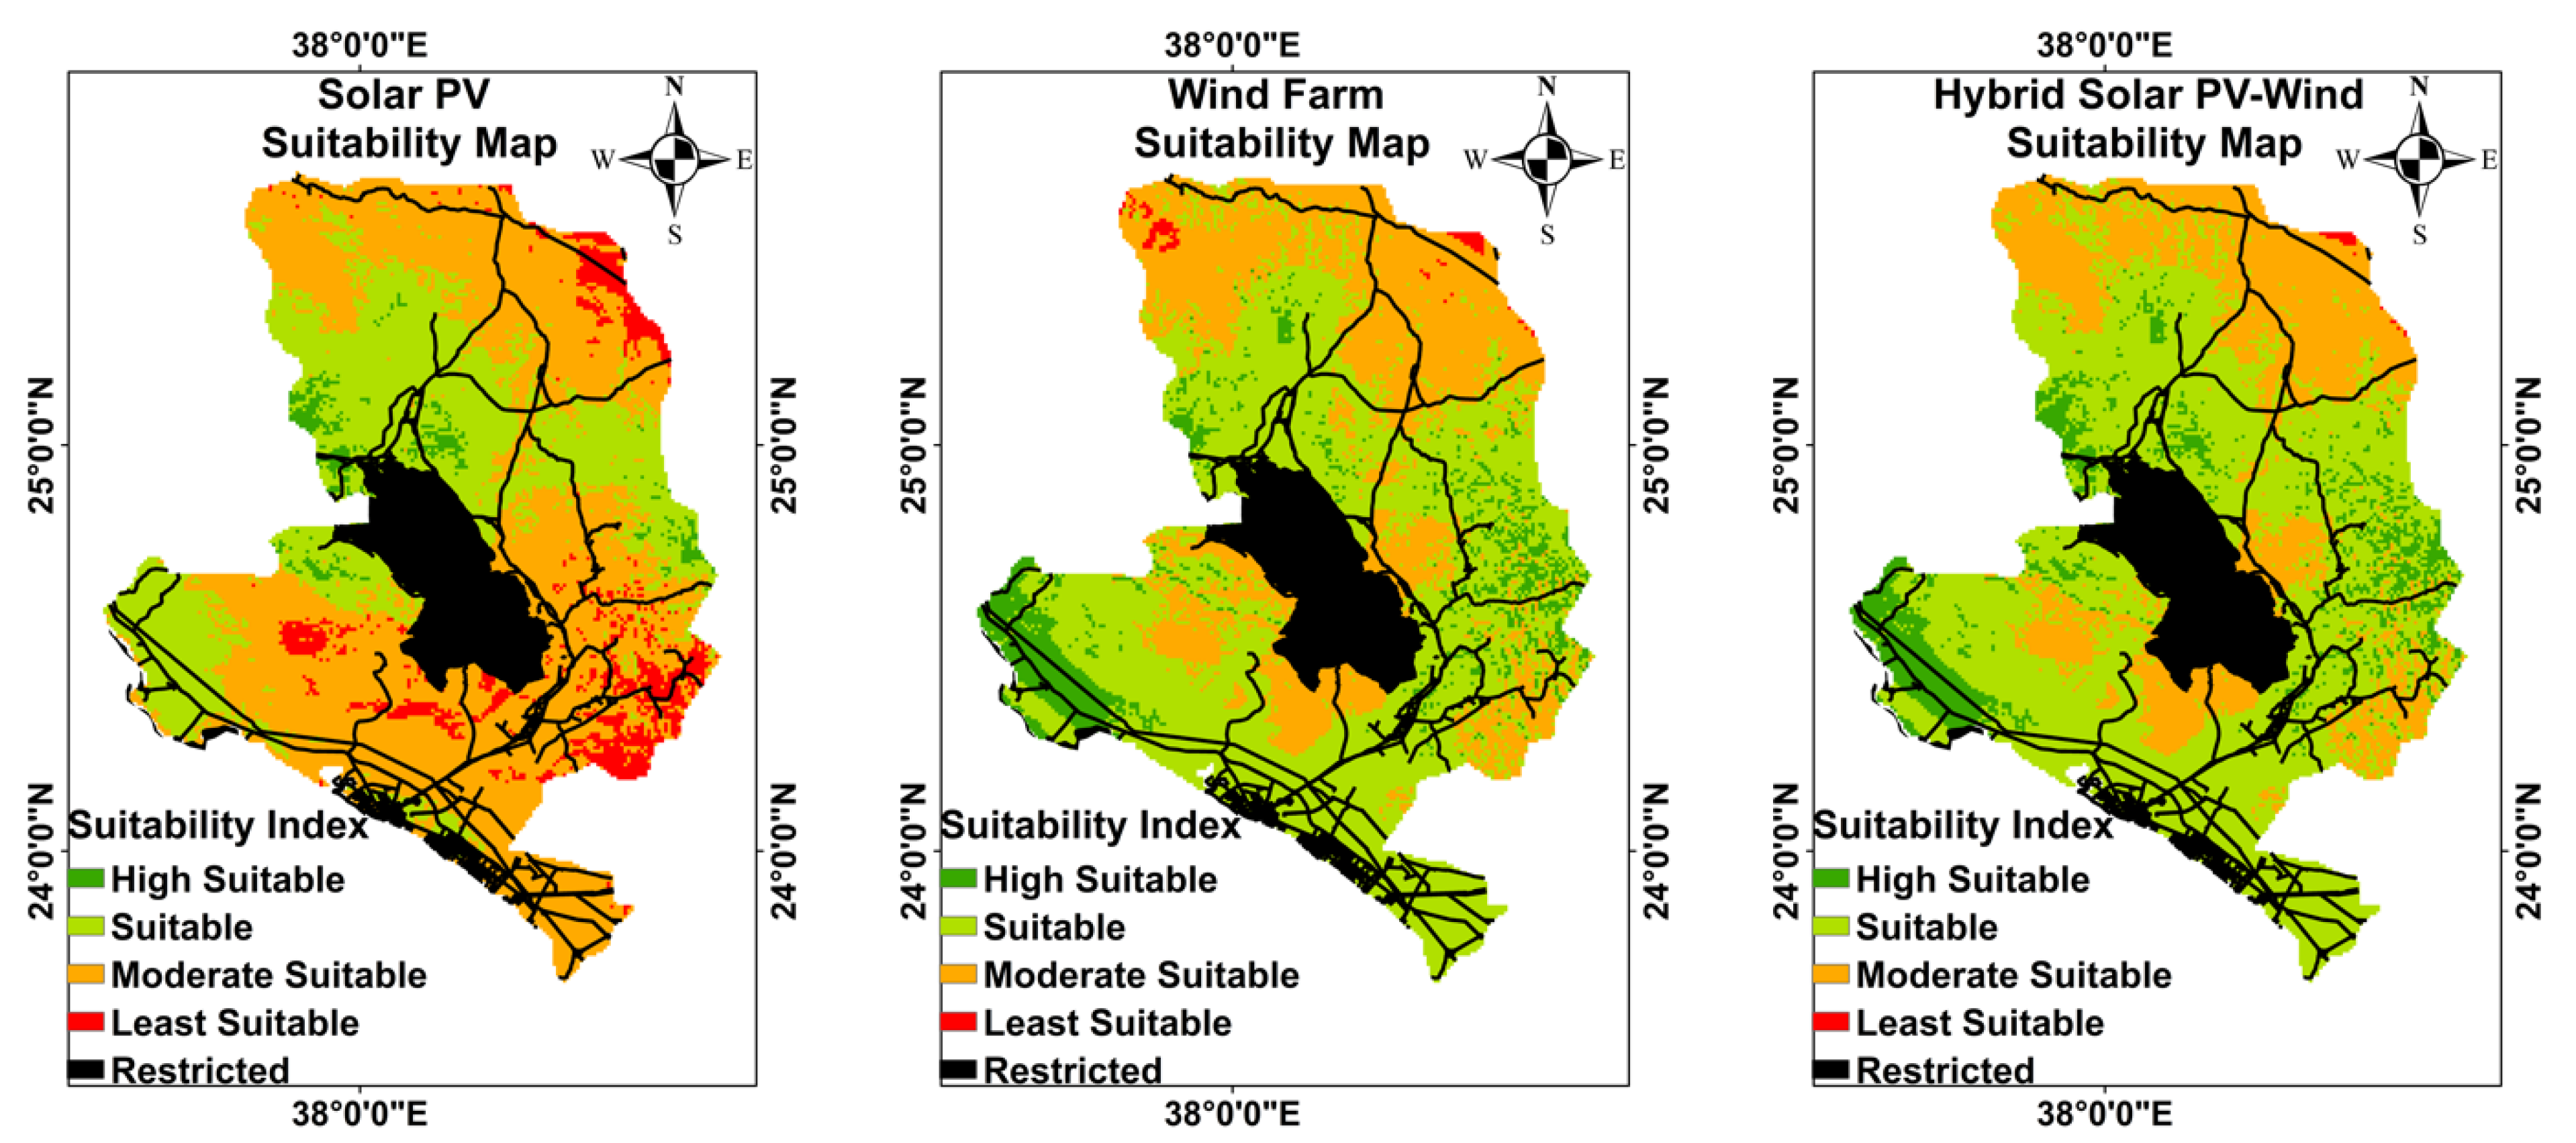
The WLC analysis resulted in separate suitability maps for solar PV and wind energy systems. These maps were classified into suitability classes, ranging from 5 (representing the highest suitability) to 1 (representing the lowest suitability), to facilitate interpretation and decision making. Thereafter, restricted or constrained areas unsuitable for development, such as environmentally protected zones, were identified. The restriction layer was combined using the Boolean AND operator in ArcGIS to create a consolidated restricted areas map masking these locations. With the standardized criteria layers and mapped restricted zones, the site suitability analysis could accurately evaluate and rank potential sites based on the evaluation factors. The suitable site maps for solar PV (Figure 5—left), wind farm (Figure 5—center), and hybrid solar PV–wind (Figure 5—right) systems are presented in Figure 5.
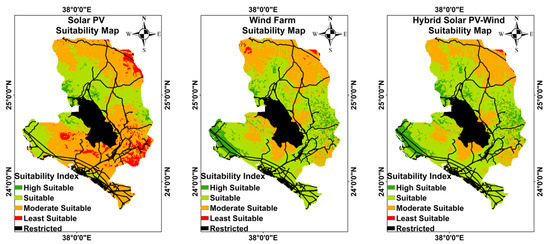
Figure 5.
Sites suitability maps.
The suitability maps identified several promising areas for solar PV and wind energy development in Yanbu city. These areas exhibit favorable climatic conditions, suitable topography, and minimal environmental constraints. Additionally, they are located near existing infrastructure, reducing transmission and connection costs. The next section is devoted to performing techno-economic feasibility studies for specific sites within the identified suitable areas. These studies consider factors such as the load profile, resources evaluation, system design and technology selection, associated costs, energy production potential, and grid integration requirements.
2.2. Techno-Economic Analysis
2.2.1. Location and Load Profile
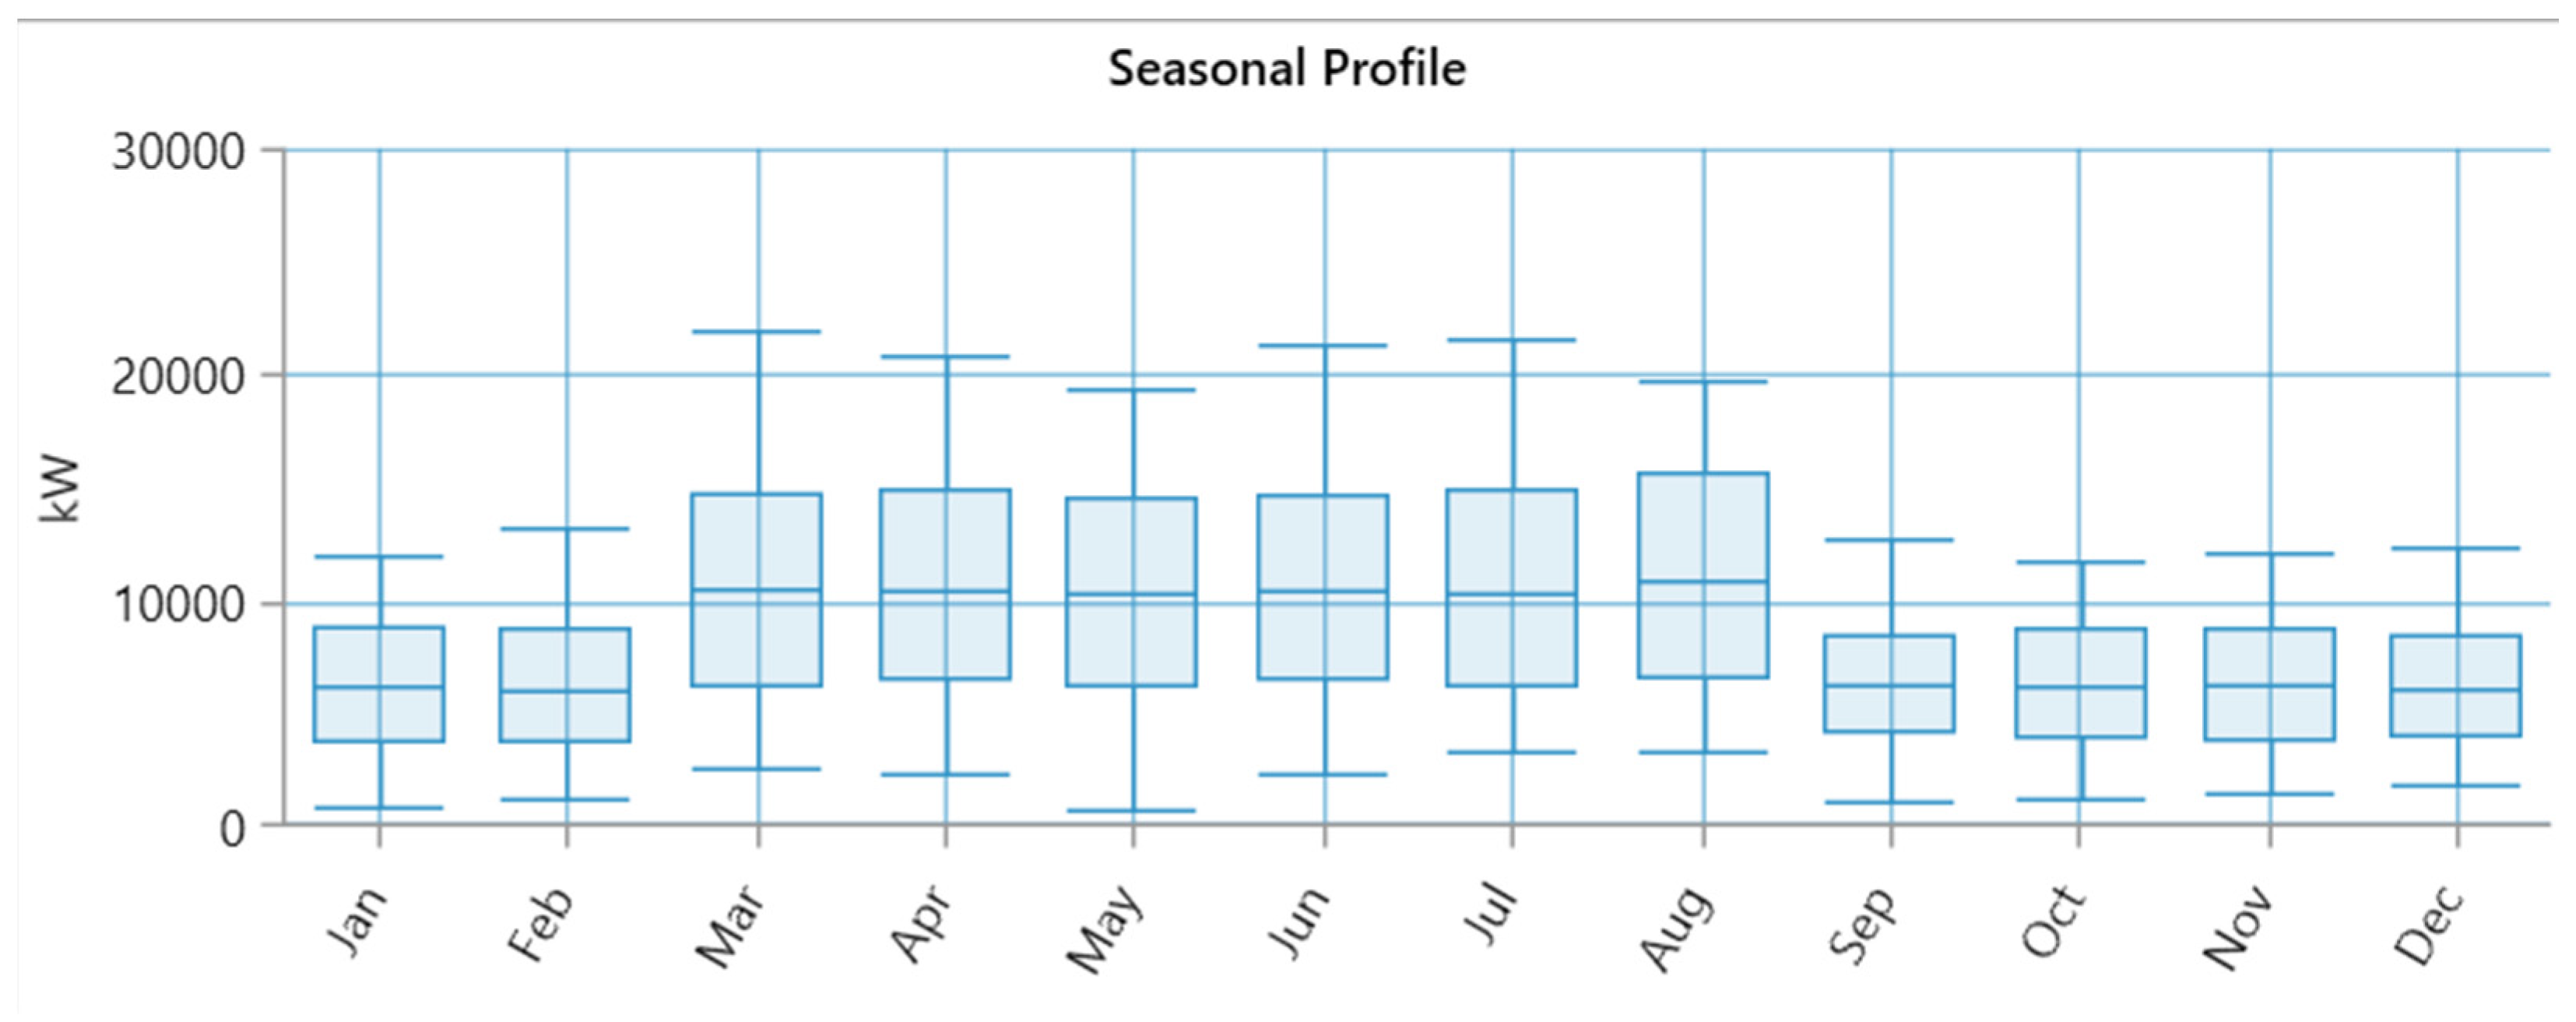
From the behavior of energy consumption in Saudi Arabia, assumptions were taken into consideration when modeling the load profile of Yanbu, which are 40% for seasonal changes, 10% for day and night changes, and 50% for weekend and workday changes. Figure 6 shows the seasonal load profile for Yanbu [25]. The average load consumption for Yanbu is 200 MWh/day, the peak demand is 21.9122 MW, and the average load is 8.3333 MW. Yanbu witnesses the minimum load consumption in the months of February and September, while the maximum load is in March and August.
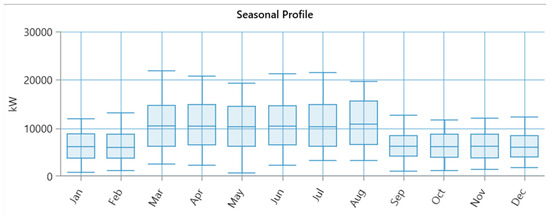
Figure 6.
Yanbu city load profile.
2.2.2. Solar and Temperature Resources
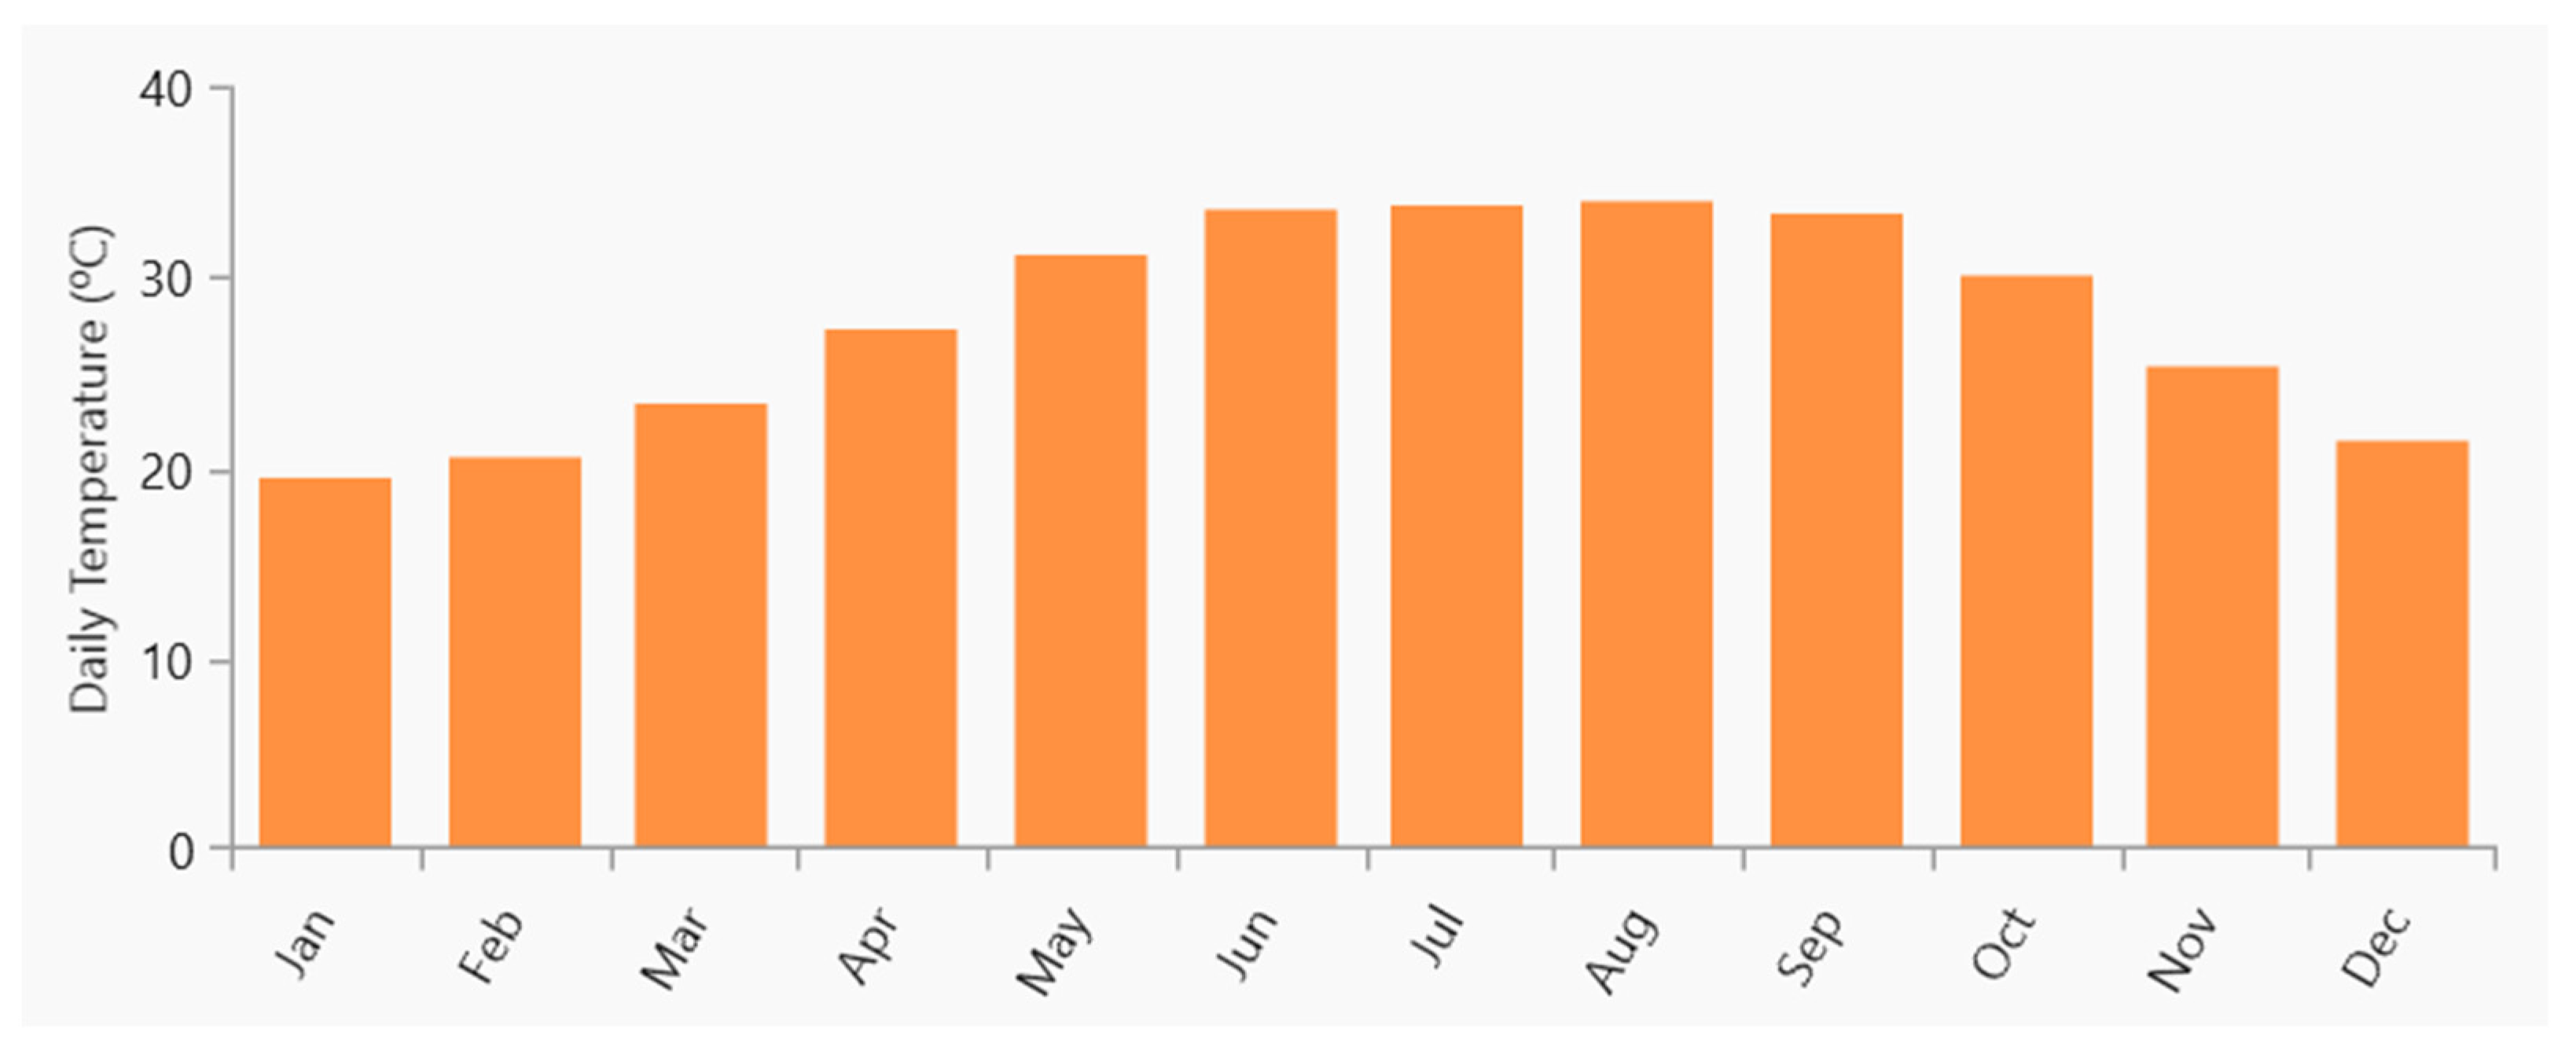
The HOMER Grid software helped in automatically obtaining the ambient temperature and solar global horizontal irradiance from NASA forecasting data and showed that the annual average ambient temperature is 27.79 °C, the maximum temperature is 33.99 °C, which was recorded in August, and the minimum temperature is 19.54 °C, which was recorded in January, as shown in Figure 7.

Figure 7.
Yanbu City average temperature.
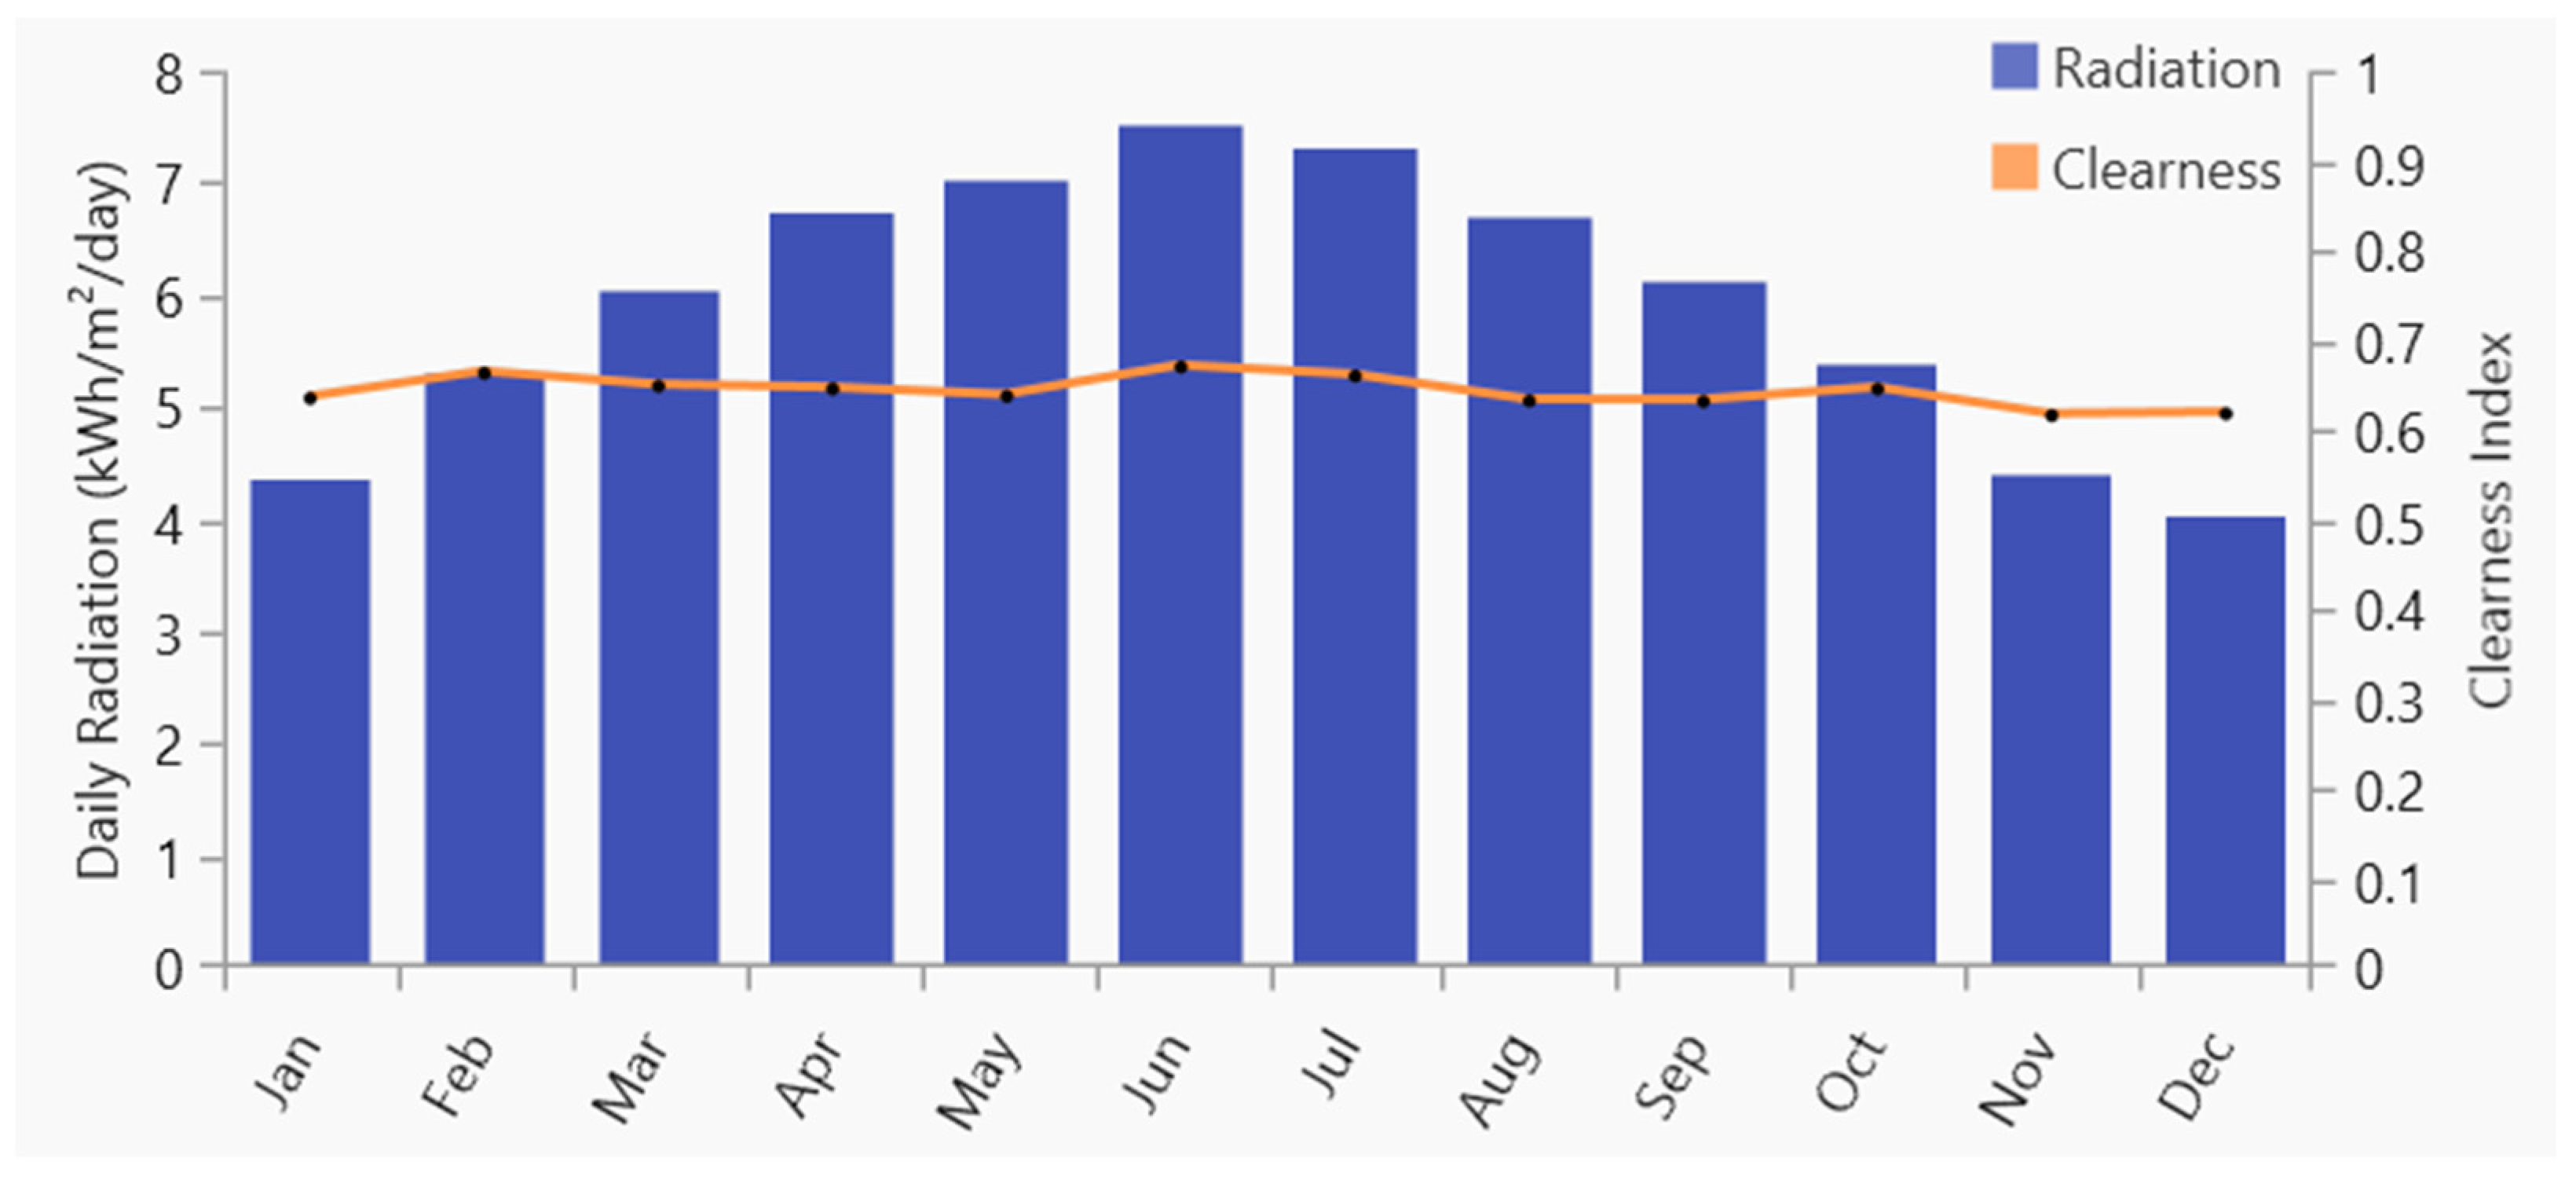
Moreover, the data showed the yearly average solar radiation for Yanbu, which is 5.9 kWh/m2/day, and the maximum and minimum solar radiation, recorded in June and December, respectively, which are 7.49 kWh/m2/day and 4.02 kWh/m2/day, respectively, as shown in Figure 8. According to the data mentioned above, Yanbu has a significant potential for solar energy investment via PV installations.

Figure 8.
Radiation data for Yanbu city.
2.2.3. Wind Resources
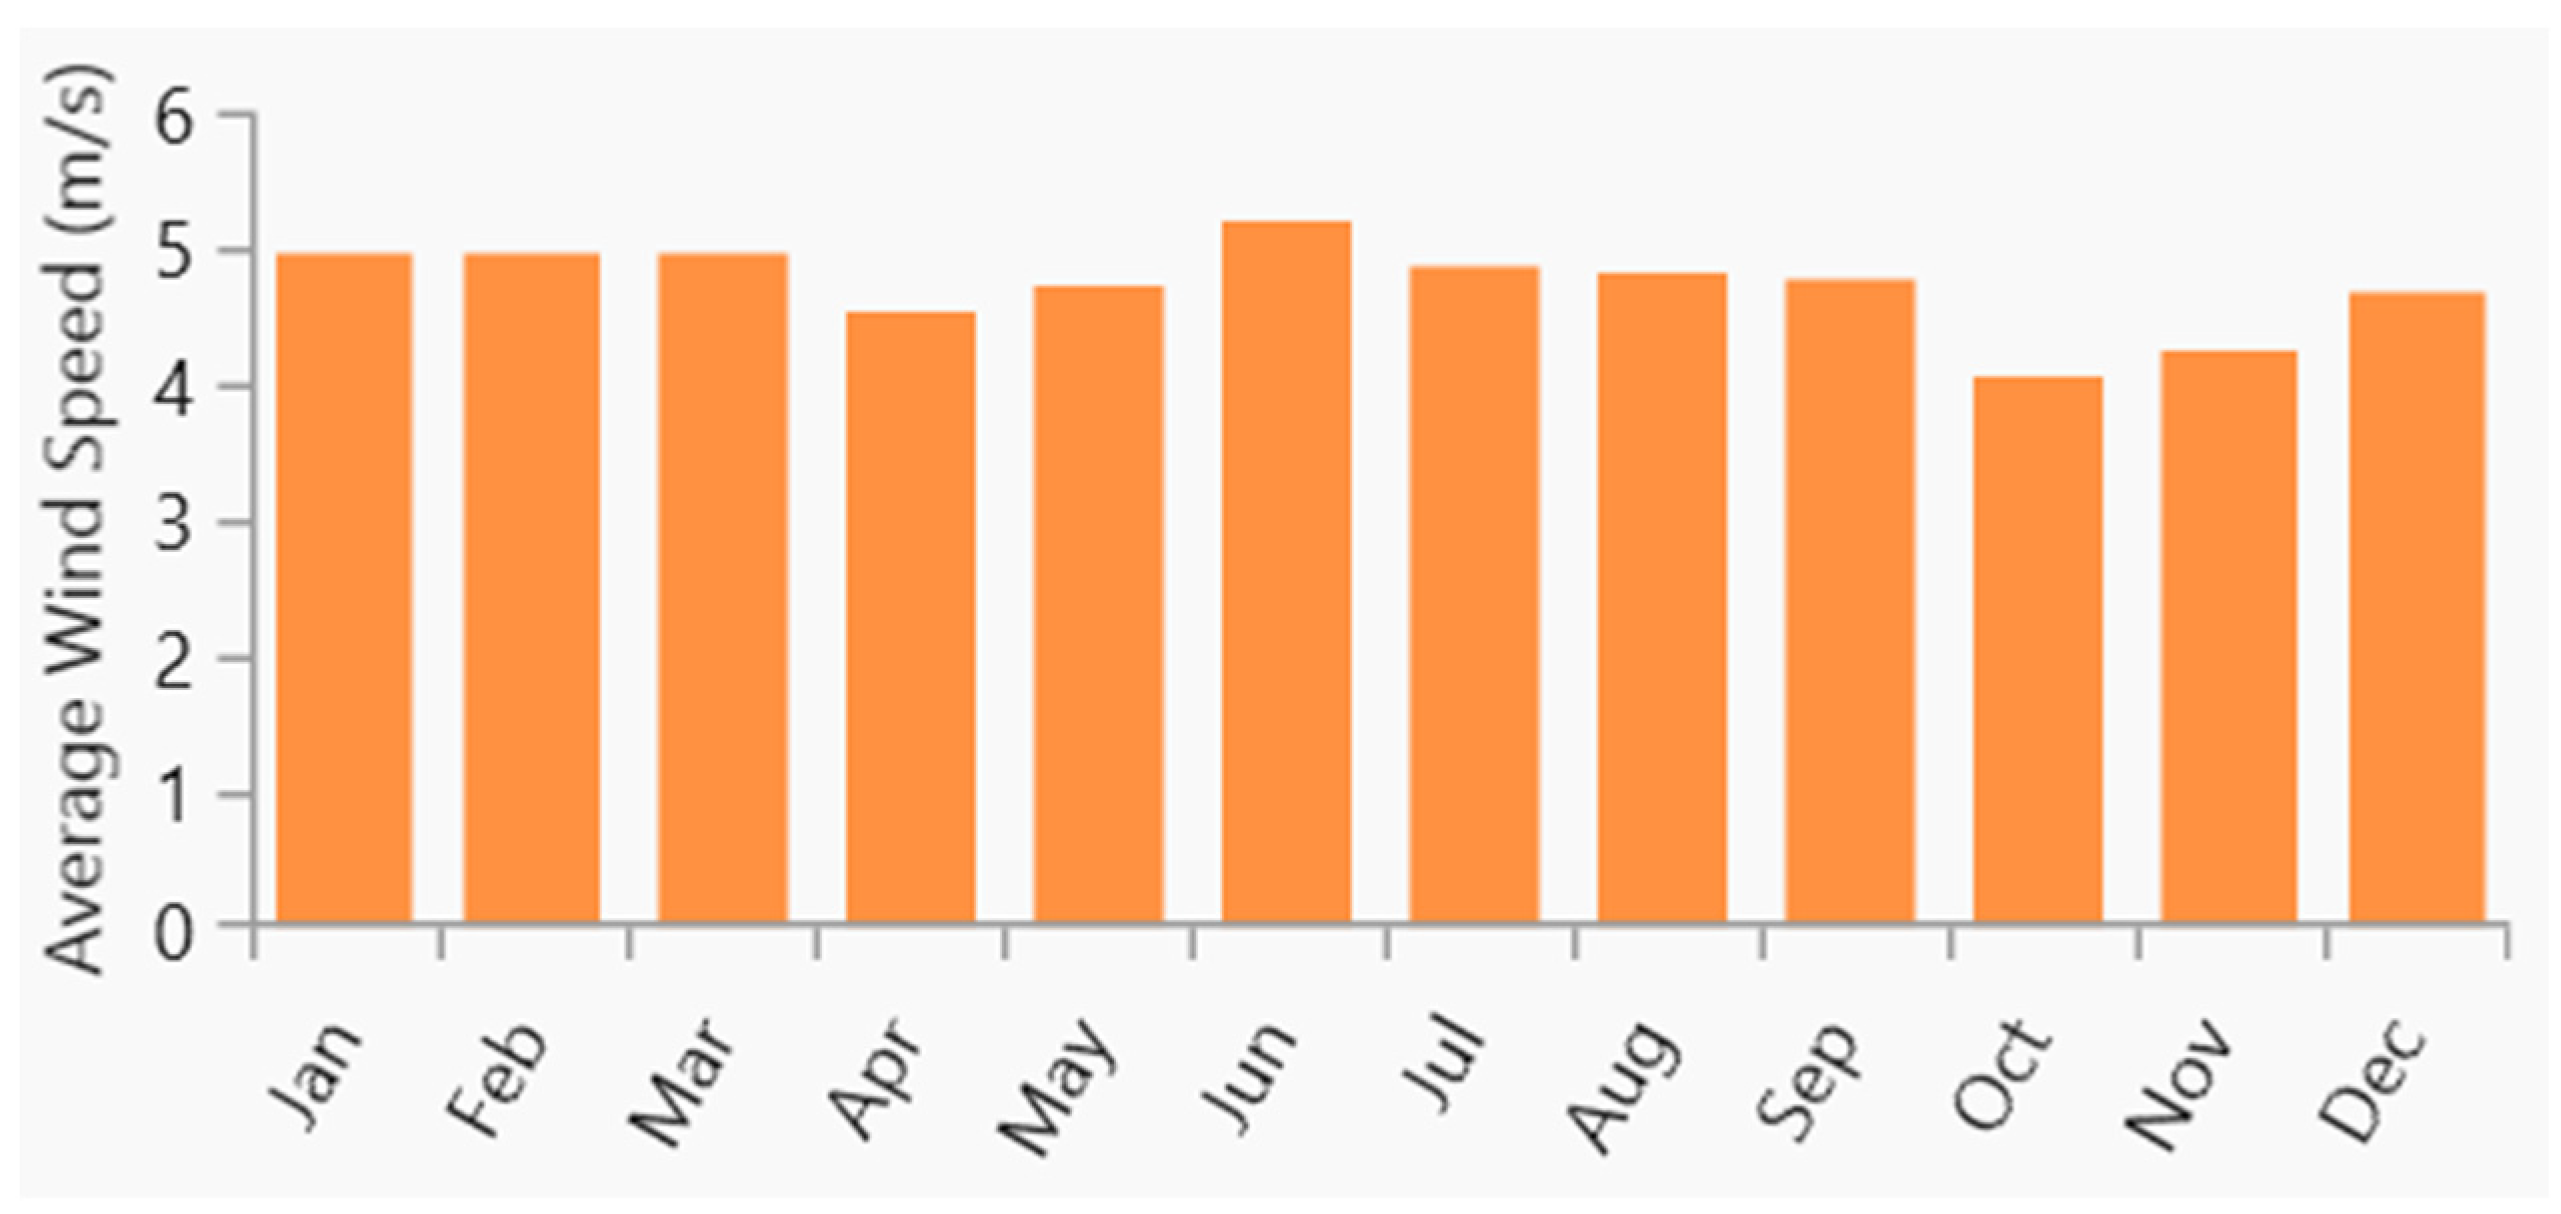
The HOMER Grid software was also used to automatically obtain the wind speed from NASA forecasting data, and the annual average wind speed was found to be 4.72 m/s. The windiest month was June with a 5.18 m/s wind speed, while the least windy month that Yanbu witnessed was October with a 4.07 m/s wind speed, as shown in Figure 9.

Figure 9.
Wind speed data for Yanbu city.
2.2.4. System Design and Component Parameters
The components used in this study are PV, WT, battery storage (BS), a grid, and a converter. The 10 system design configurations that are under the study scope of this paper, in order to choose the optimal system configuration for Yanbu city, are connected to the grid, and their configurations are as follows:
- WT (850 MW) system
- PV (850 MW) system
- WT (425 MW)–PV (425 MW) system
- WT (212.5 MW)–PV (637.5 MW) system
- WT (637.5 MW)–PV (212.5 MW) system
- WT (600 MW)–BS (250 MW) system
- PV (600 MW)–BS (250 MW) system
- WT (300 MW)–PV (300 MW)–BS (250 MW) system
- WT (150 MW)–PV (450 MW)–BS (250 MW) system
- WT (450 MW), PV (150 MW)–BS (250 MW) system
According to the Saudi Arabia National Renewable Energy Program, the capacity of the renewable system proposed for Yanbu city should be 850 MW in order to supply the load and sell back the excess energy to the grid [3,5], hence, this was considered while proposing the 10 proposed system configurations mentioned above, either by using PV only or WT only carrying an 850 MW capacity or by dividing this capacity between PV, WT, and BS components, not necessarily with an equal division, so we could check the effects of PV and WT prices on the NPC and LCOE.
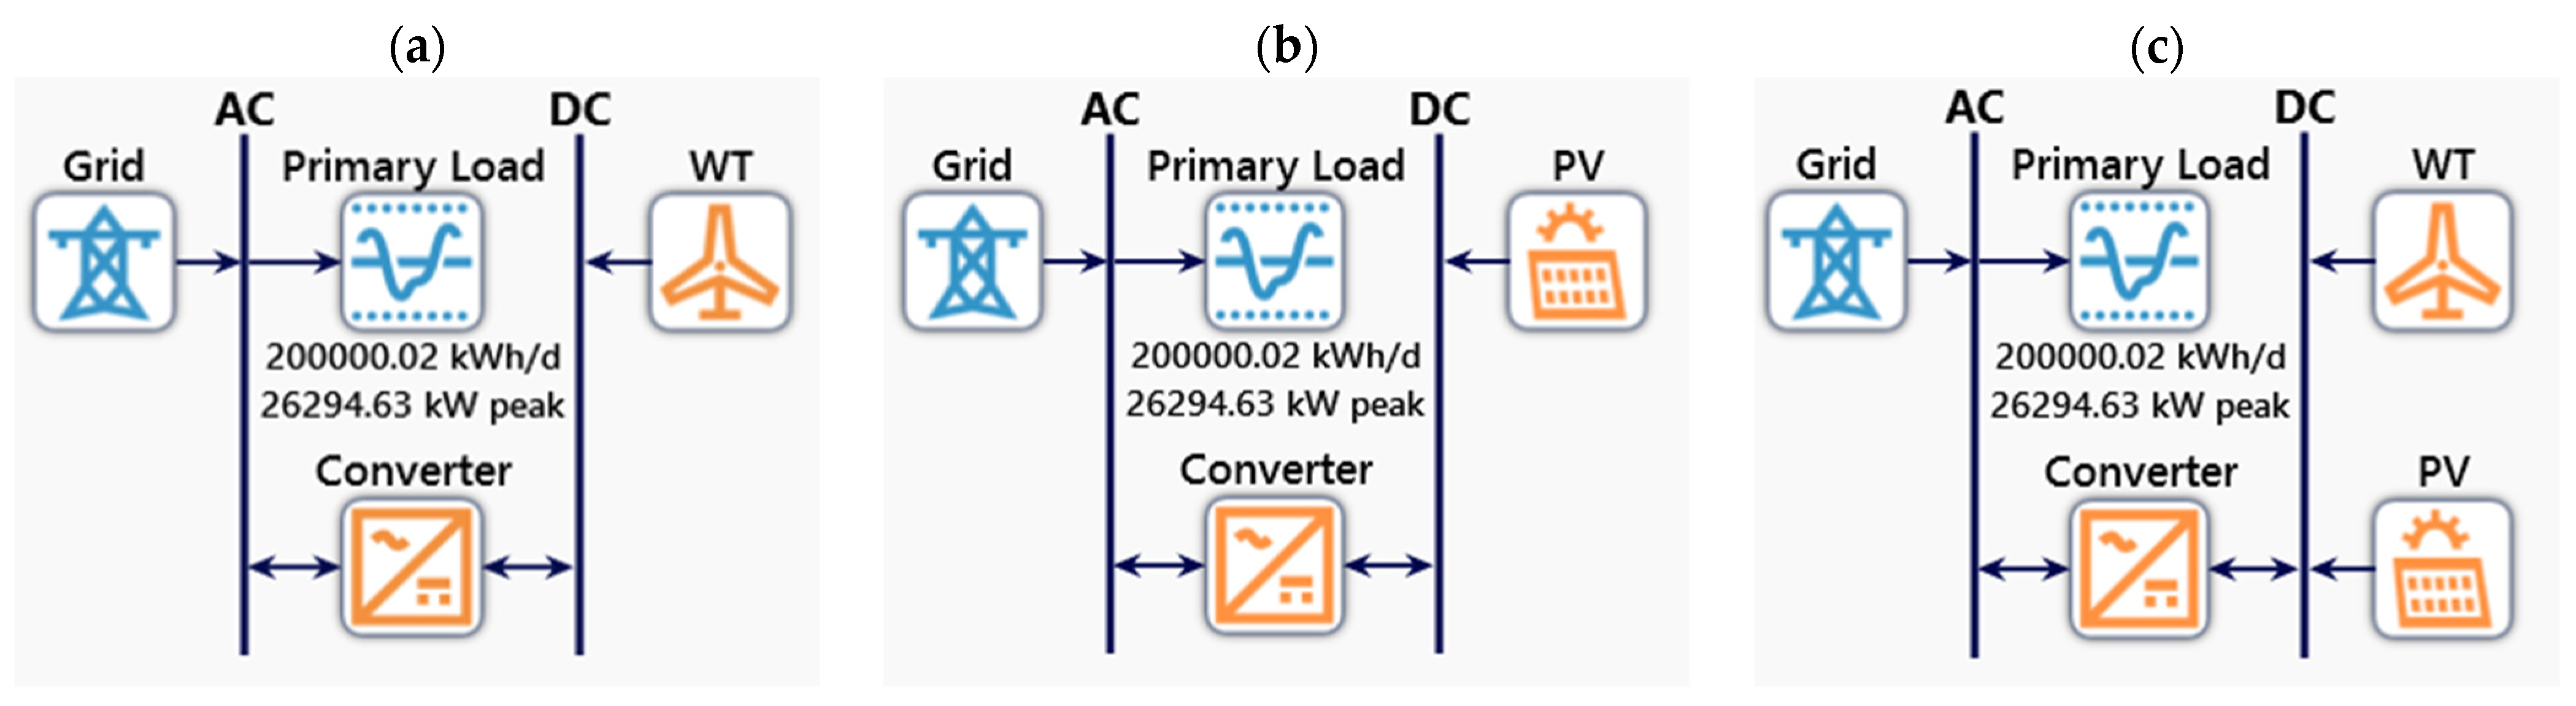
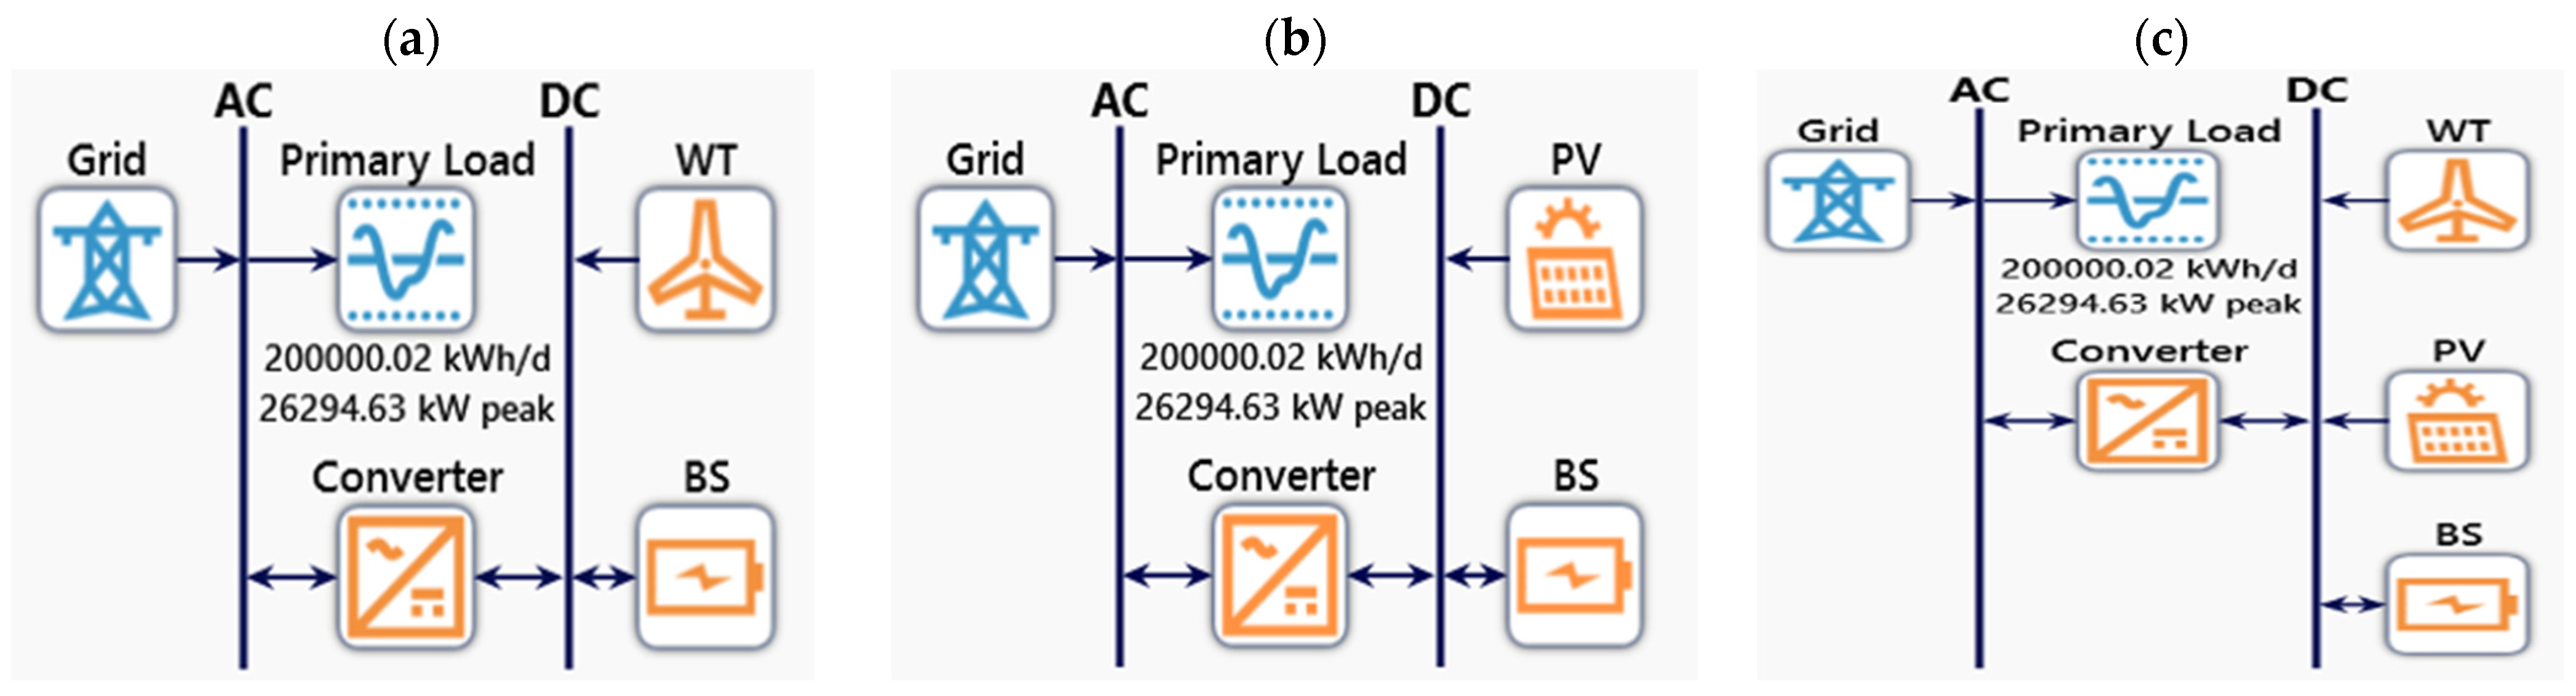
Figure 10 presents a general scheme for system configurations that do not incorporate battery storage in their designs. The sub-figures in Figure 10 include: (a) an on-grid wind turbine, (b) an on-grid photovoltaic (PV) system, and (c) an on-grid system combining both PV and wind energy. On the other hand, Figure 11 illustrates the scheme for systems that include battery storage in their designs. The sub-figures in Figure 11 are: (a) an on-grid wind turbine with energy storage, (b) an on-grid PV system with energy storage, and (c) an on-grid system combining PV, wind, and energy storage.

Figure 10.
Scheme for system configurations that do not include battery storage.
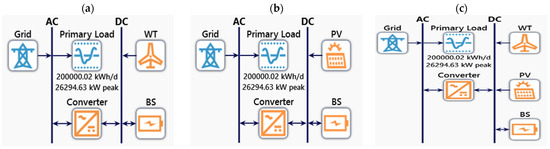
Figure 11.
Scheme for system configurations that contain battery storage.
Table 3 shows the technical parameters that are used in this study for the components of the system. Also, interpolation was performed to find the differences in prices between the work of this paper and the references for wind turbine units and photovoltaic modules. Moreover, the grid parameter used in this work is the Saudi electricity company real grid tariff.
Table 3.
System components and its parameters.
2.2.5. Mathematical Modeling for Wind Turbine Module
The quantity of electricity produced by a wind turbine during each time step is calculated by HOMER using a three-stage approach. First, HOMER calculates the wind speed at the wind turbine’s hub height. The amount of power produced by the wind turbine at the specified wind speed and a constant air density is then calculated. Finally, HOMER adjusts the power output figure as needed to reflect the actual air density. HOMER uses the formula below to calculate the wind speed at the hub height [3].
where is the wind speed at the wind turbine’s hub height, is the wind speed at the anemometer height (in m/s), and , , and are the wind speeds at the wind turbine’s hub height and its hub height and anemometer height above the surface roughness length, respectively, all given in m.
2.2.6. Sensitivity Factors
The following sensitivity factors were chosen in this study for the purpose of finding the optimal system that can withstand variations in the external and uncontrollable conditions of the project, which are: variations in ambient temperature from 19 °C to 34 °C, a solar global horizontal irradiance between 4 and 7 kWh/m2/day, a wind speed range from 4 m/s to 5 m/s, an electrical load increased by 20%, a discount rate from 8% to 10%, and an inflation rate from 2% to 3% [14,27]. Moreover, the temperature effect on wind turbines is considered in the simulation, so this will help in obtaining both an optimal and reliable solution for Yanbu city.
2.2.7. Job Creation
This study identified the social impact of the proposed configurations for the renewable energy system through its ability to create job opportunities for society. Reference [28] helped in providing methods for estimating the jobs created from the transition towards generating electricity by renewable energy systems, and it is tailored to fit with the objective of this current research by using it for the proposed system capacity and its elements, which differ between the ten proposed configurations with onshore WT, utility-scale PV, and large-scale batteries. The following four equations were used for estimating the job creation opportunities provided by each configuration for Yanbu city and its regional western area of Saudi Arabia.
where MFG Jobs is manufacturing jobs, MFG EF is the manufacturing employment factor, Capex DF is a declining factor based on capital expenditure, the Local MFG factor represents the local manufacturing factor, and regional EM is a regional employment multiplier.
where C&I Jobs is construction and installation jobs and C&I EF is the construction and installation employment factor.
where O&M EF is the operation and maintenance employment factor and Opex DF is a decline factor based on operational expenditure.
3. Results and Discussion
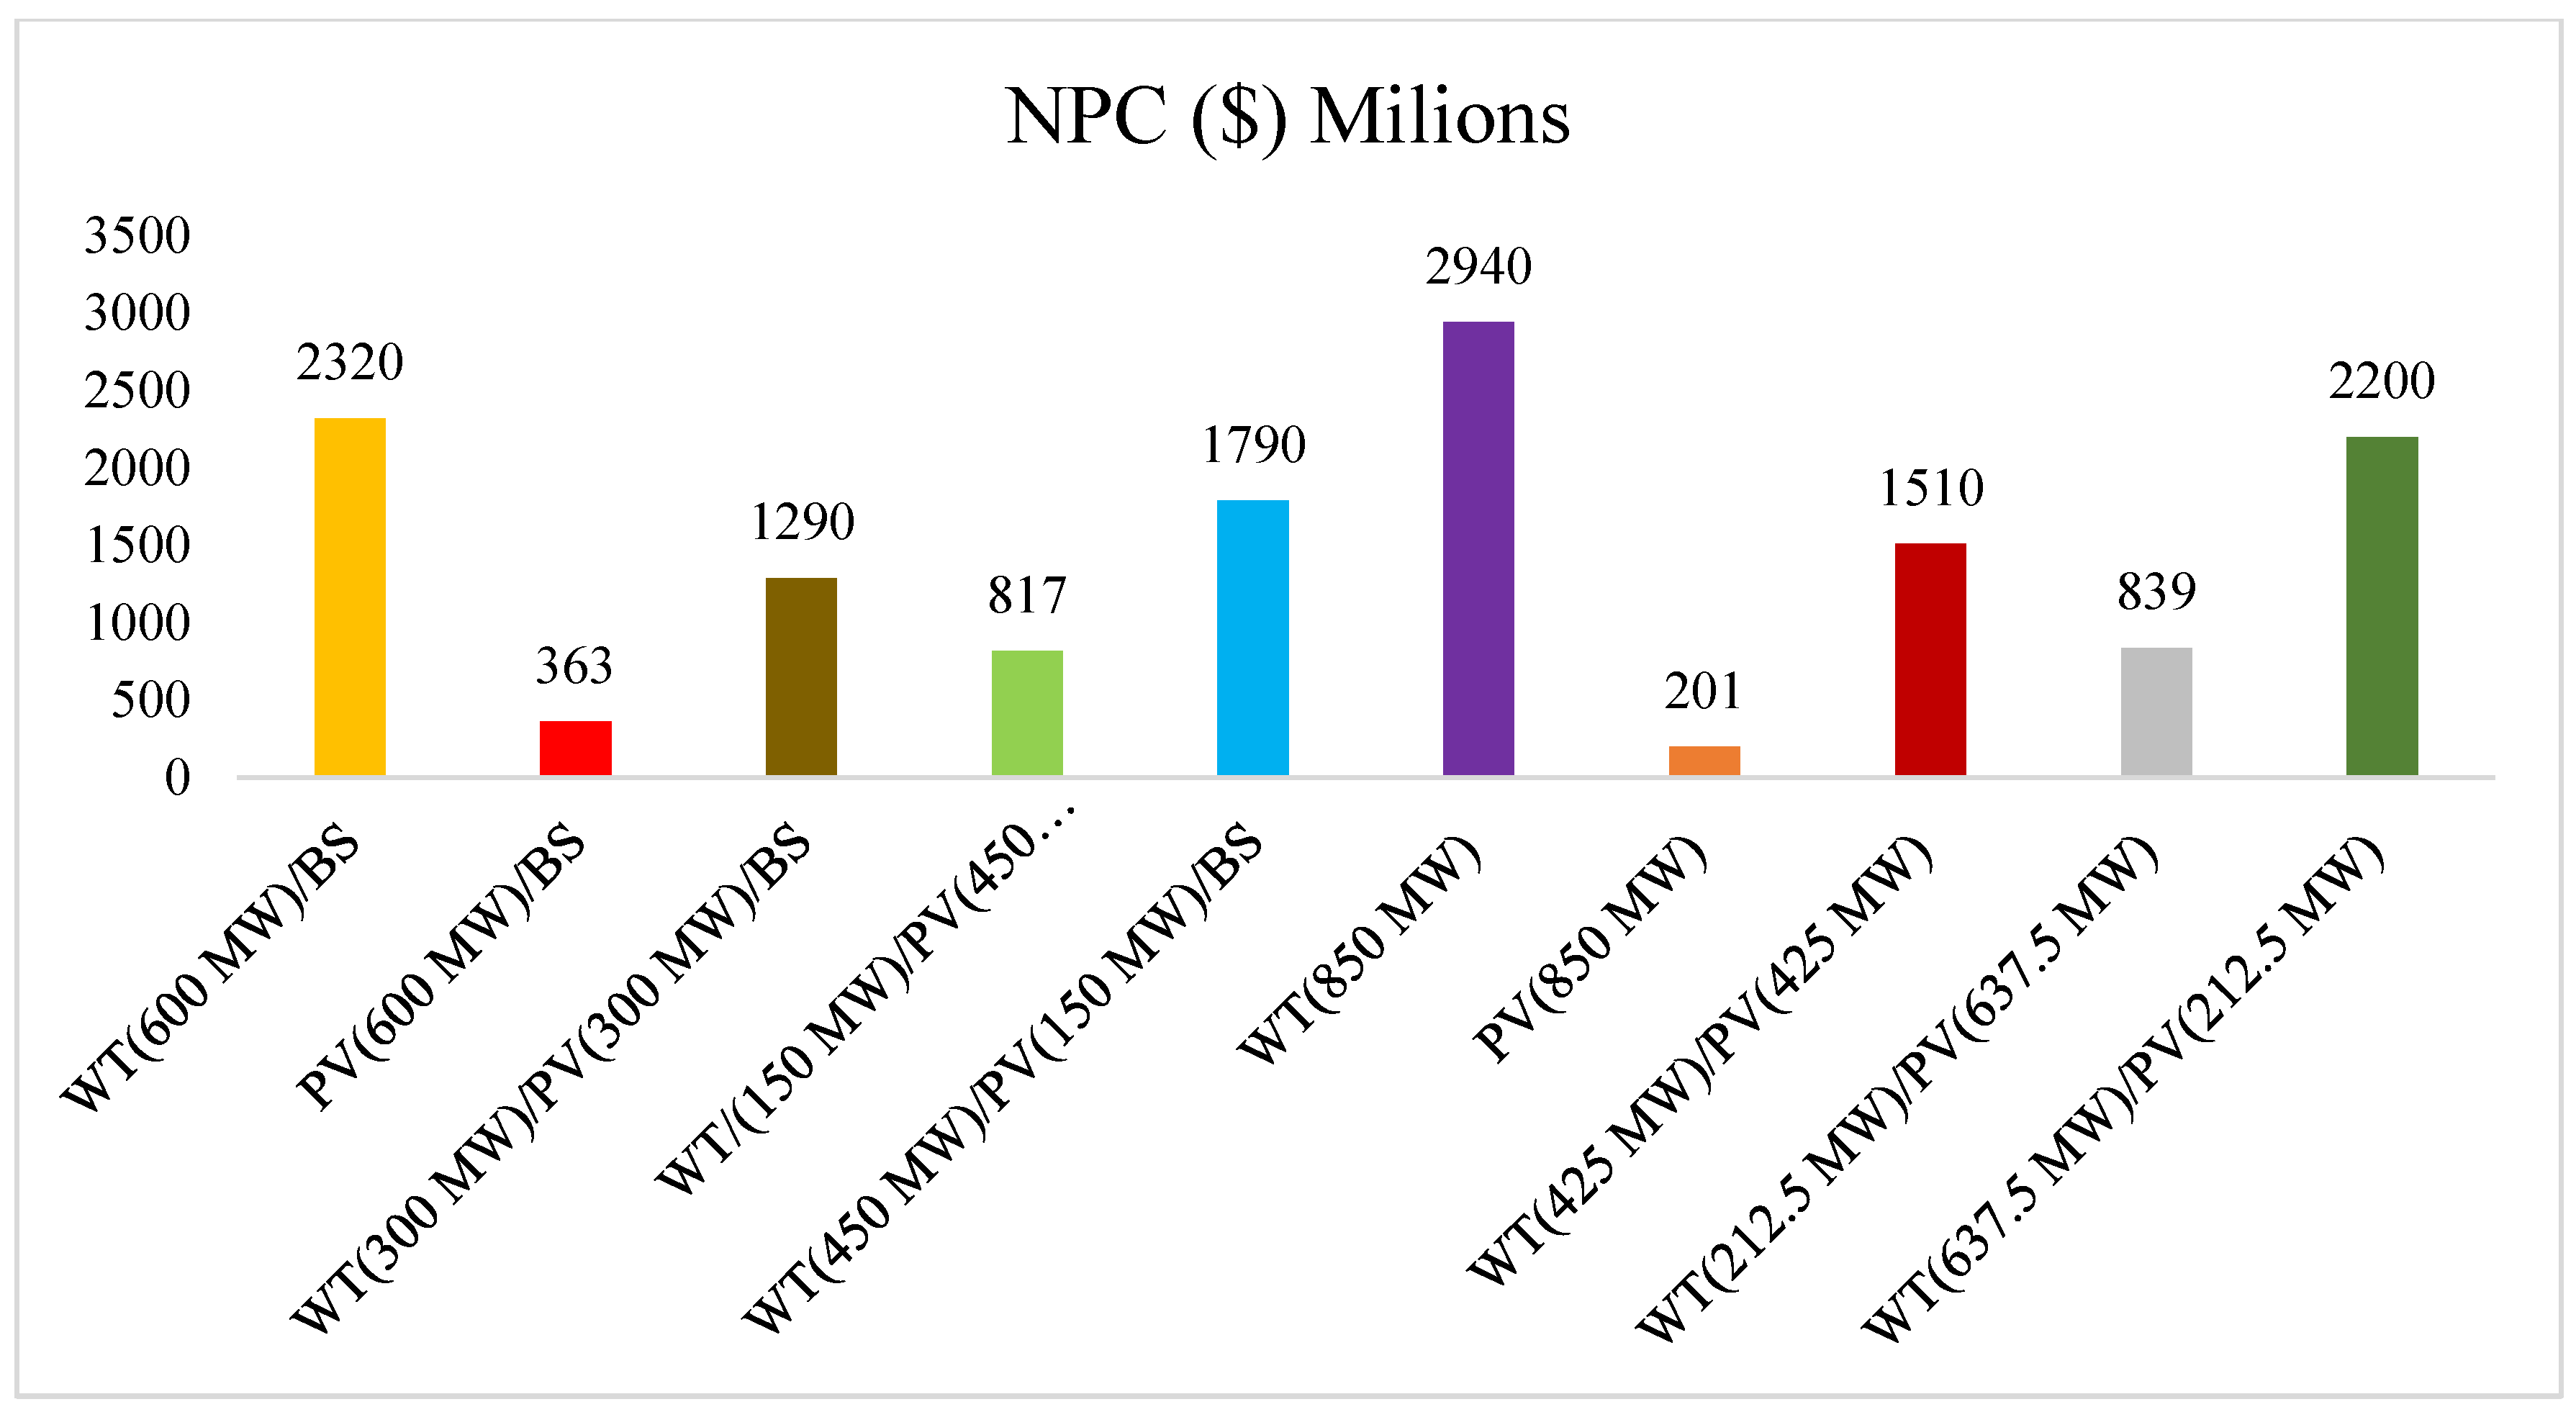
The following values were taken from the HOMER grid simulation software with the worst case scenario, which were a 10% discount rate, 3% inflation rate, 19 °C temperature degree, 4 kWh/m2/day global horizontal solar irradiance, 4 m/s wind speed, and an increase in the average annual electrical load by 20%, which represents 240 MWh/day, which is all for the purpose of making sure that the optimal system can withstand the worst conditions that it would encounter during the life cycle of the project. Moreover, all the suggested system configurations were feasible according to the simulation, but based on the following economic and technical parameters, the optimized system was selected.
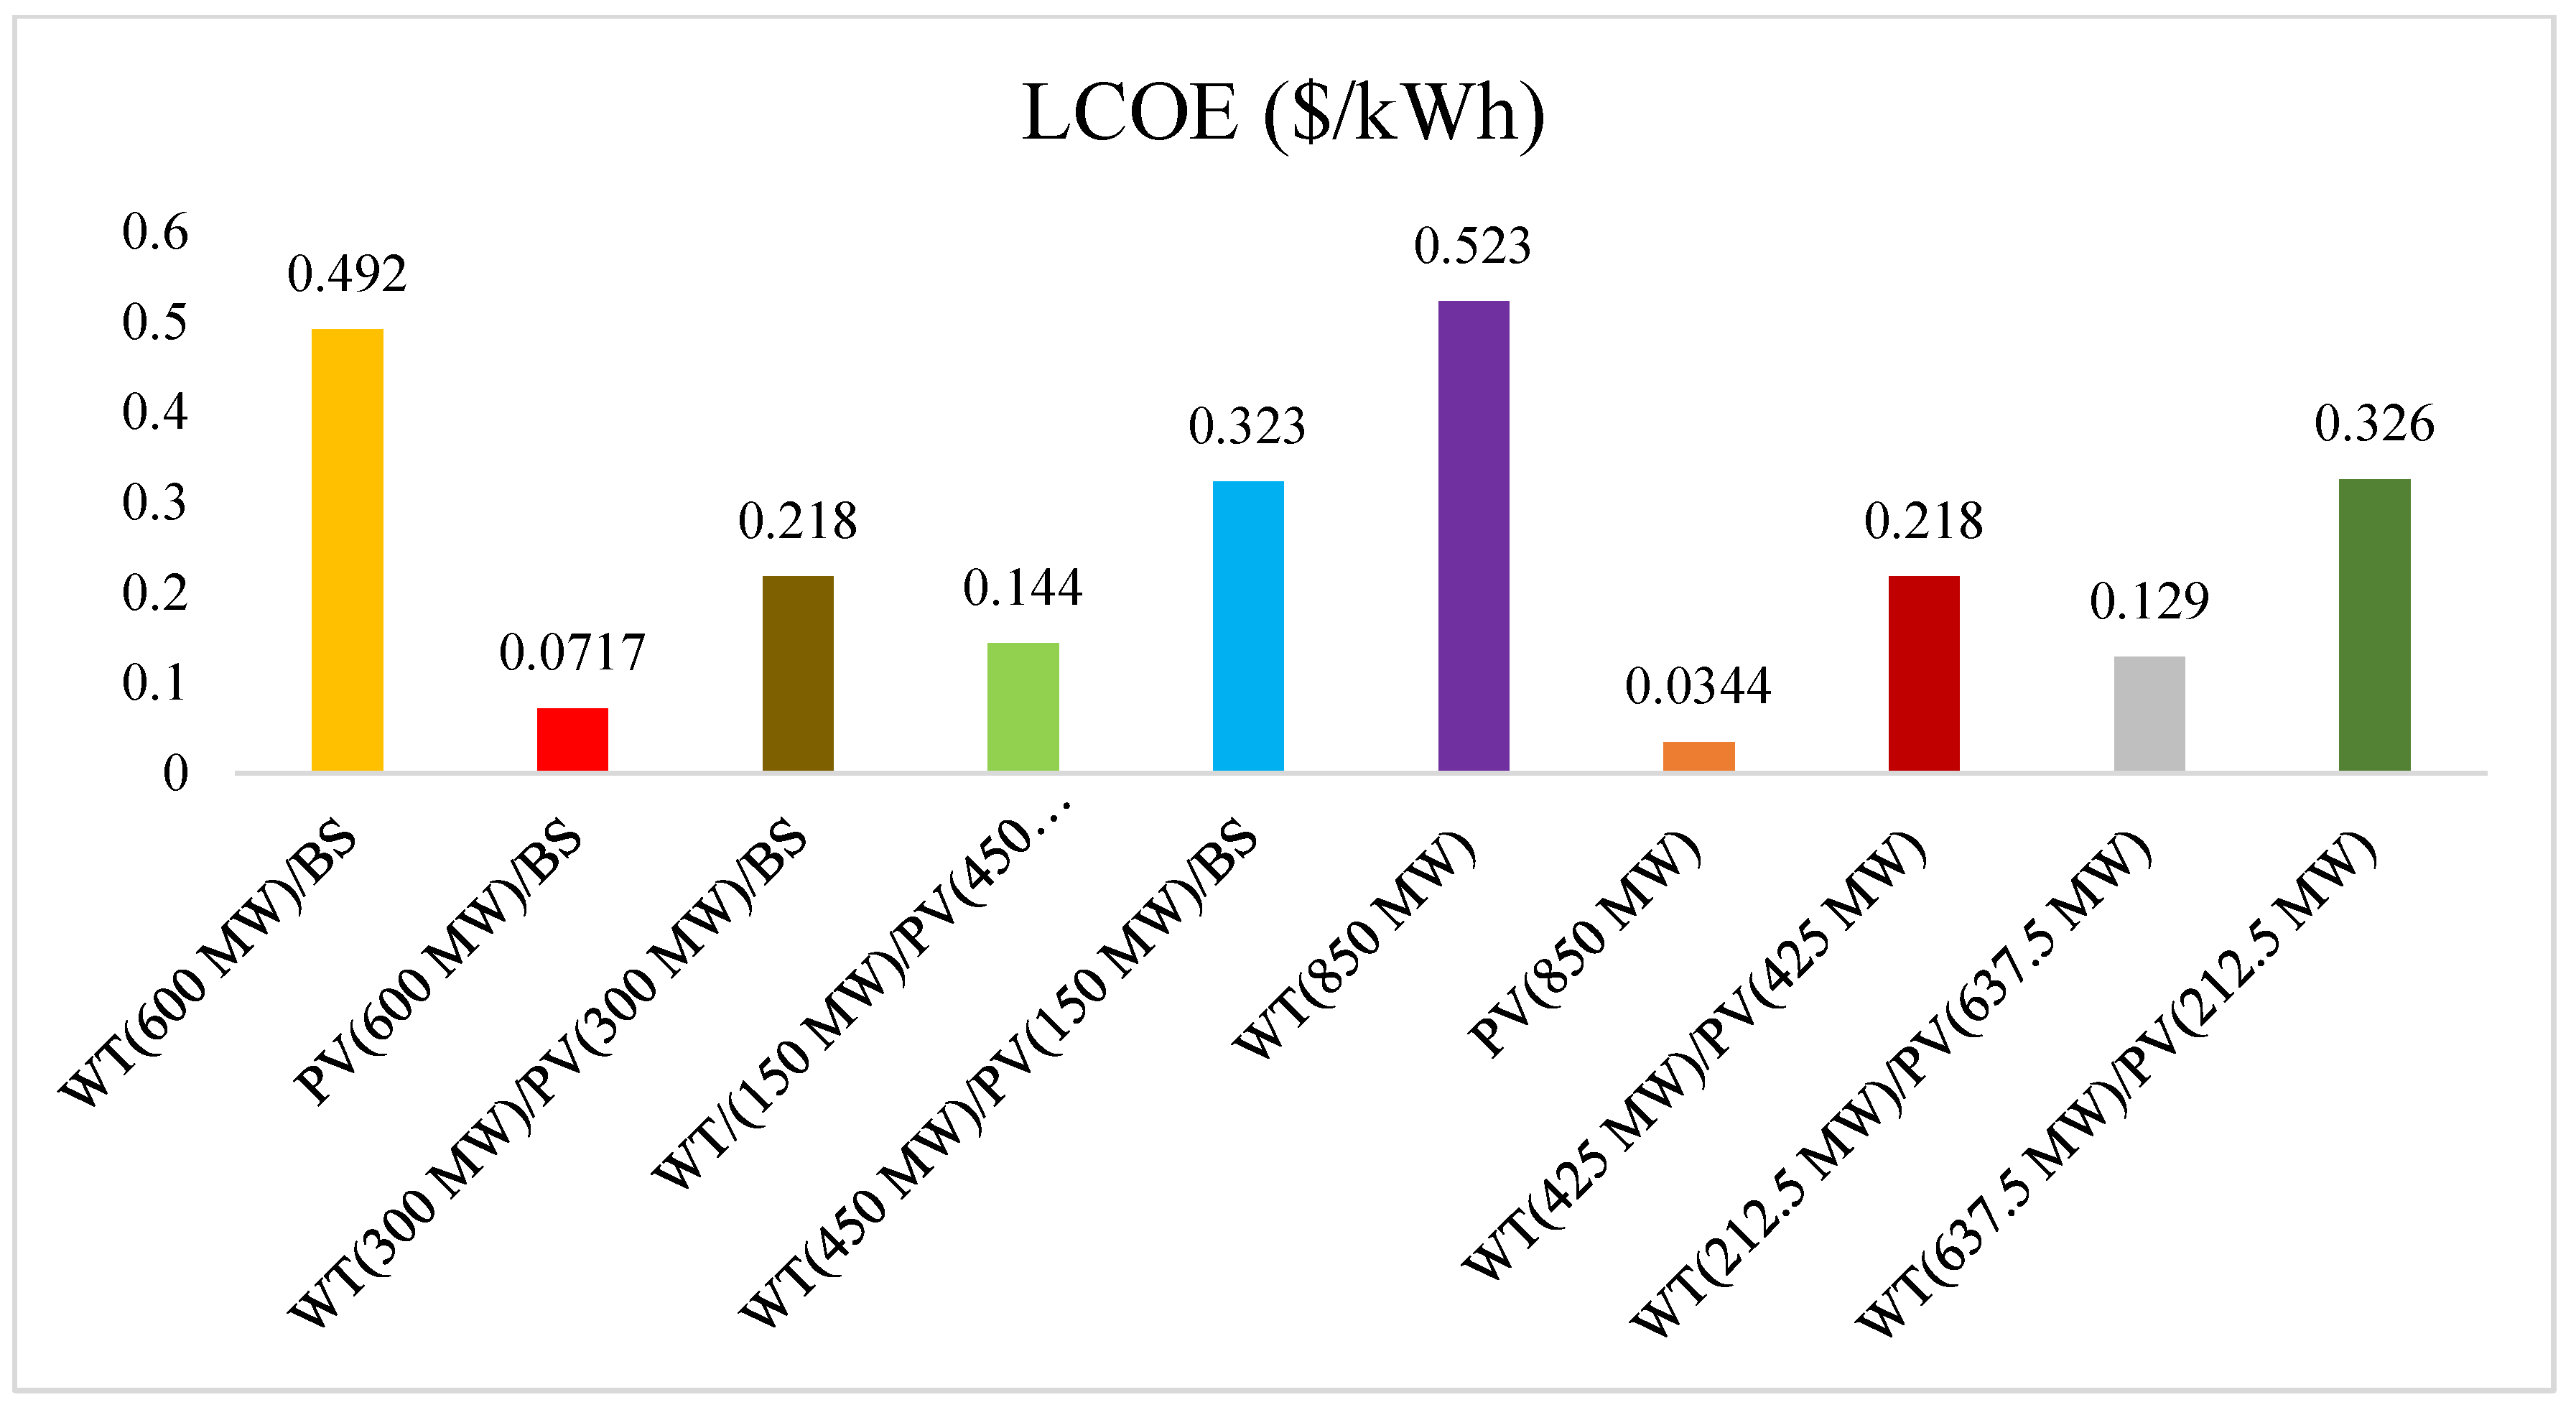
In Figure 12, the NPCs for all system are presented, where the lowest NPC is USD 201 million for a PV (850 MW) system while the highest NPC is USD 2940 million for a WT (850 MW) system. In Figure 13, the LCOEs for all the systems are shown, where the cheapest cost of energy among all the other systems is PV (850 MW) with 0.0344 USD/kWh, while the highest cost of energy is for WT (850 MW) with 0.523 USD/kWh.

Figure 12.
NPC for all systems.

Figure 13.
LCOE for all systems.
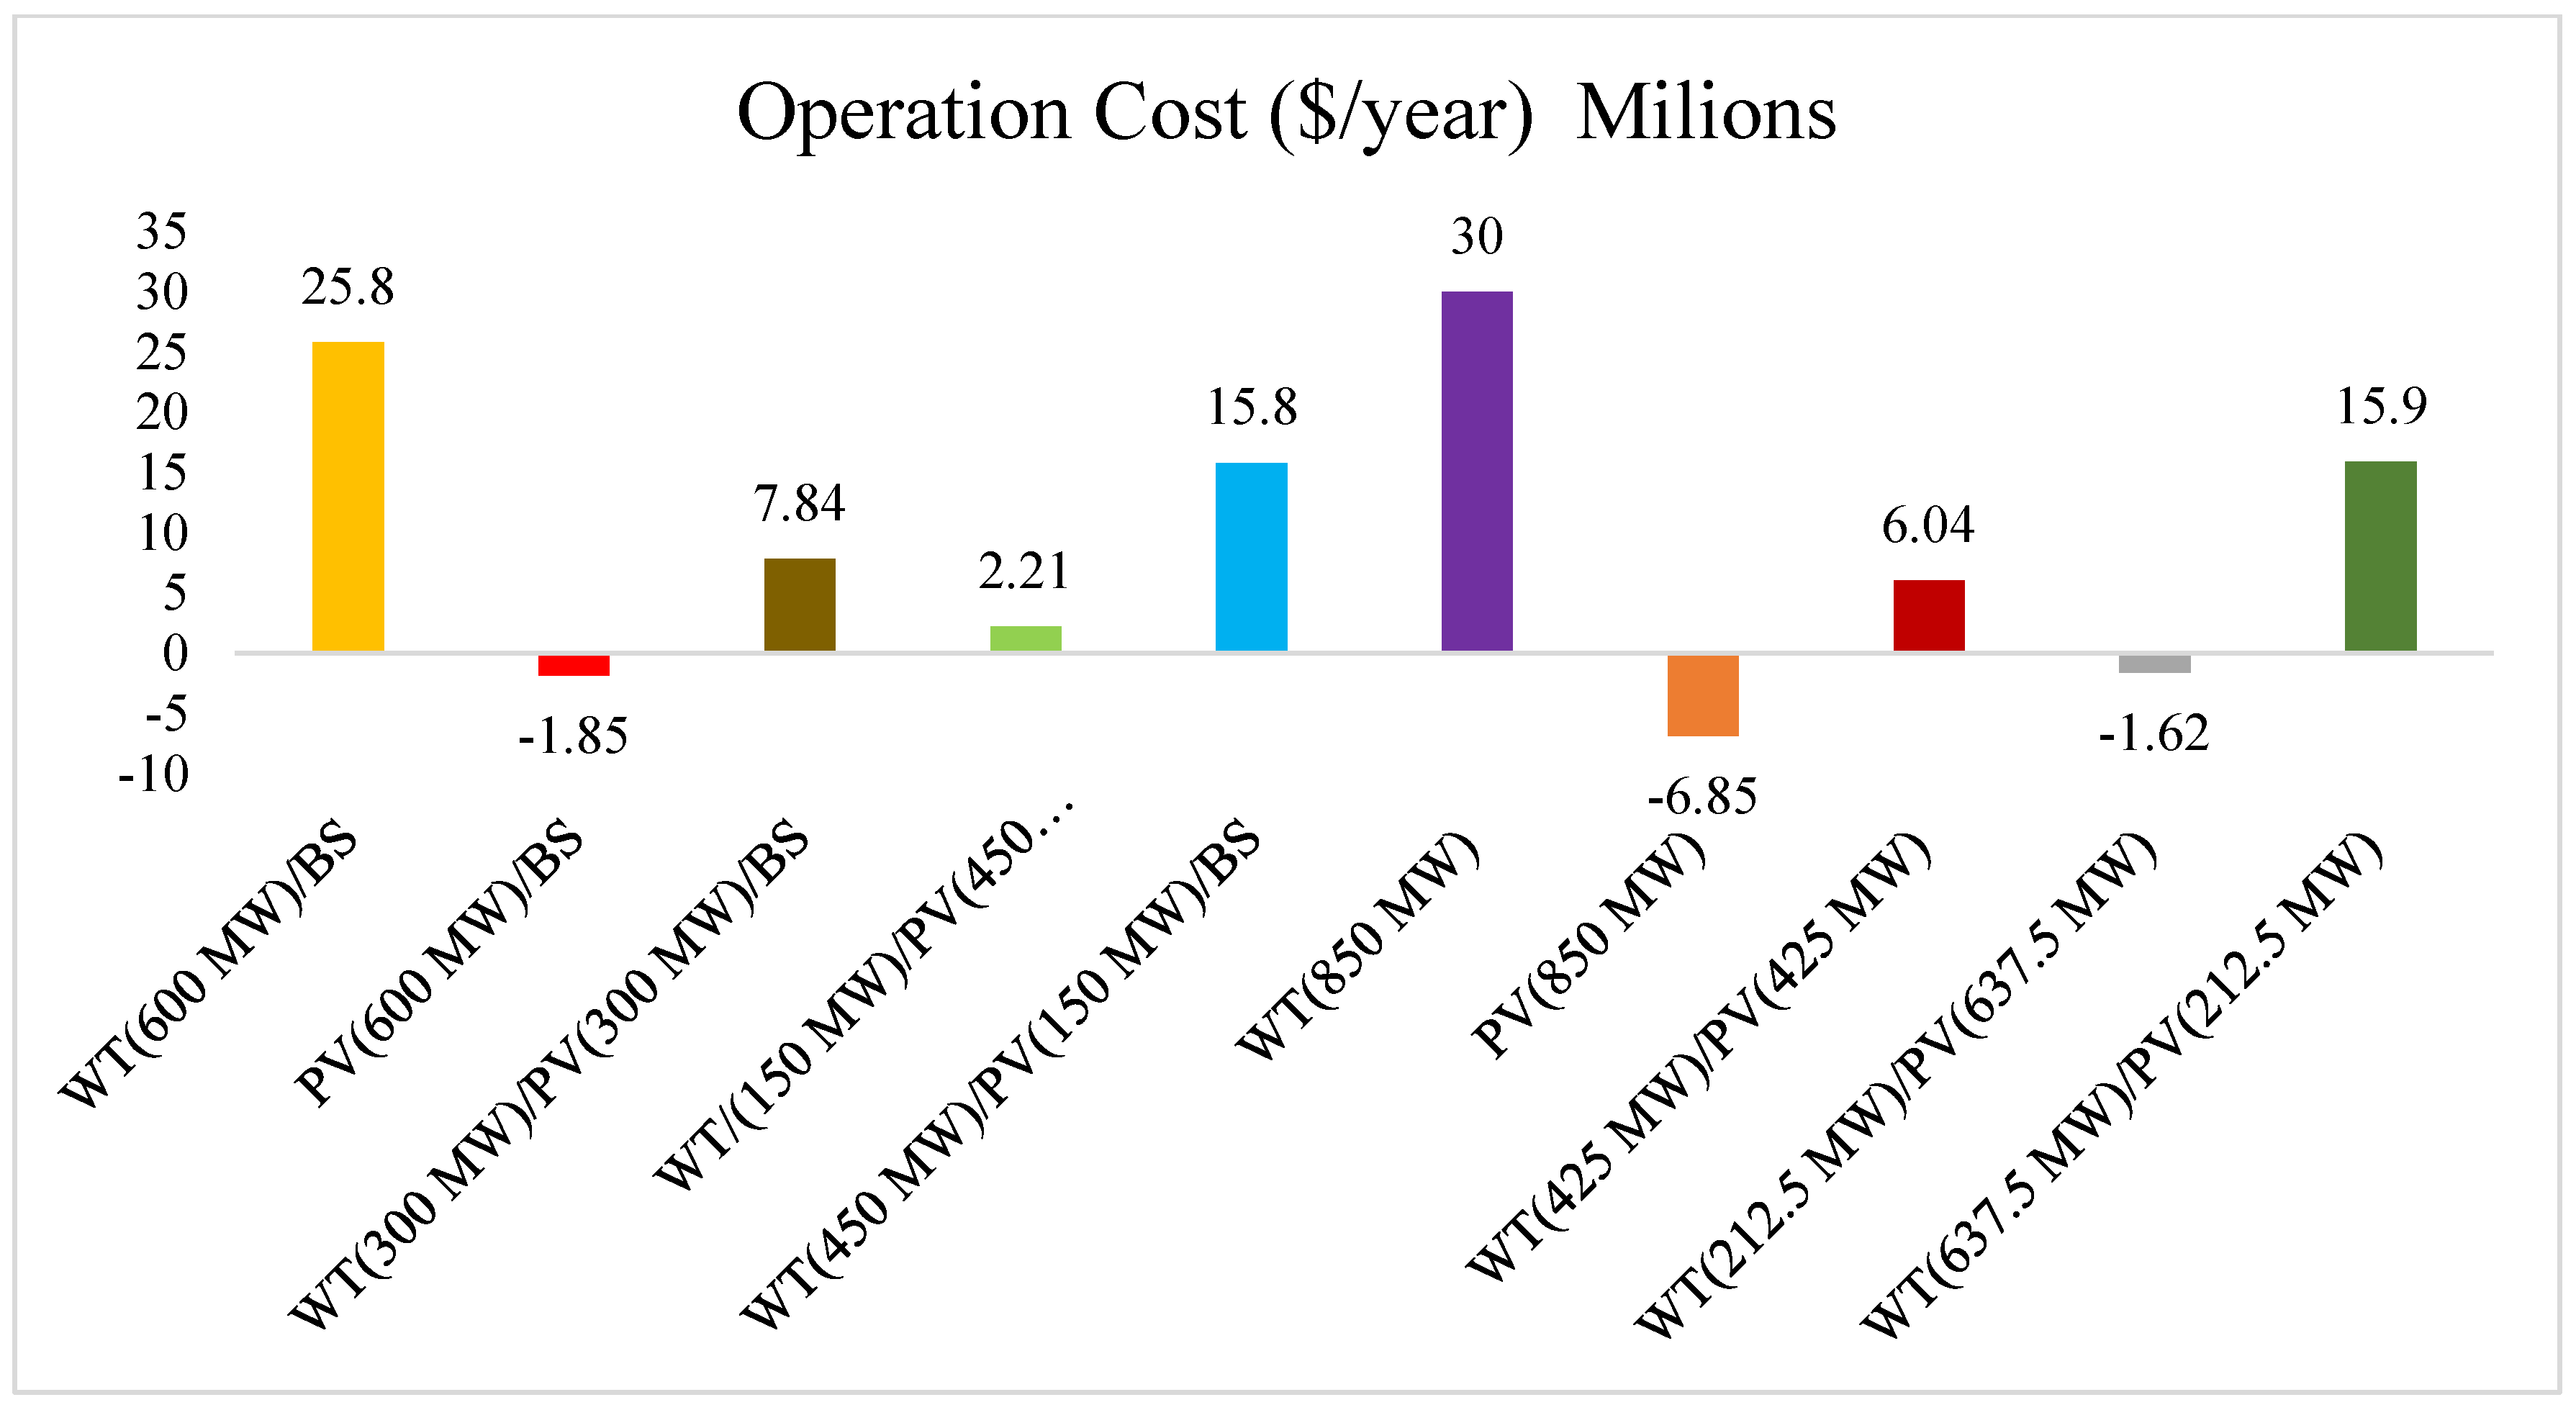
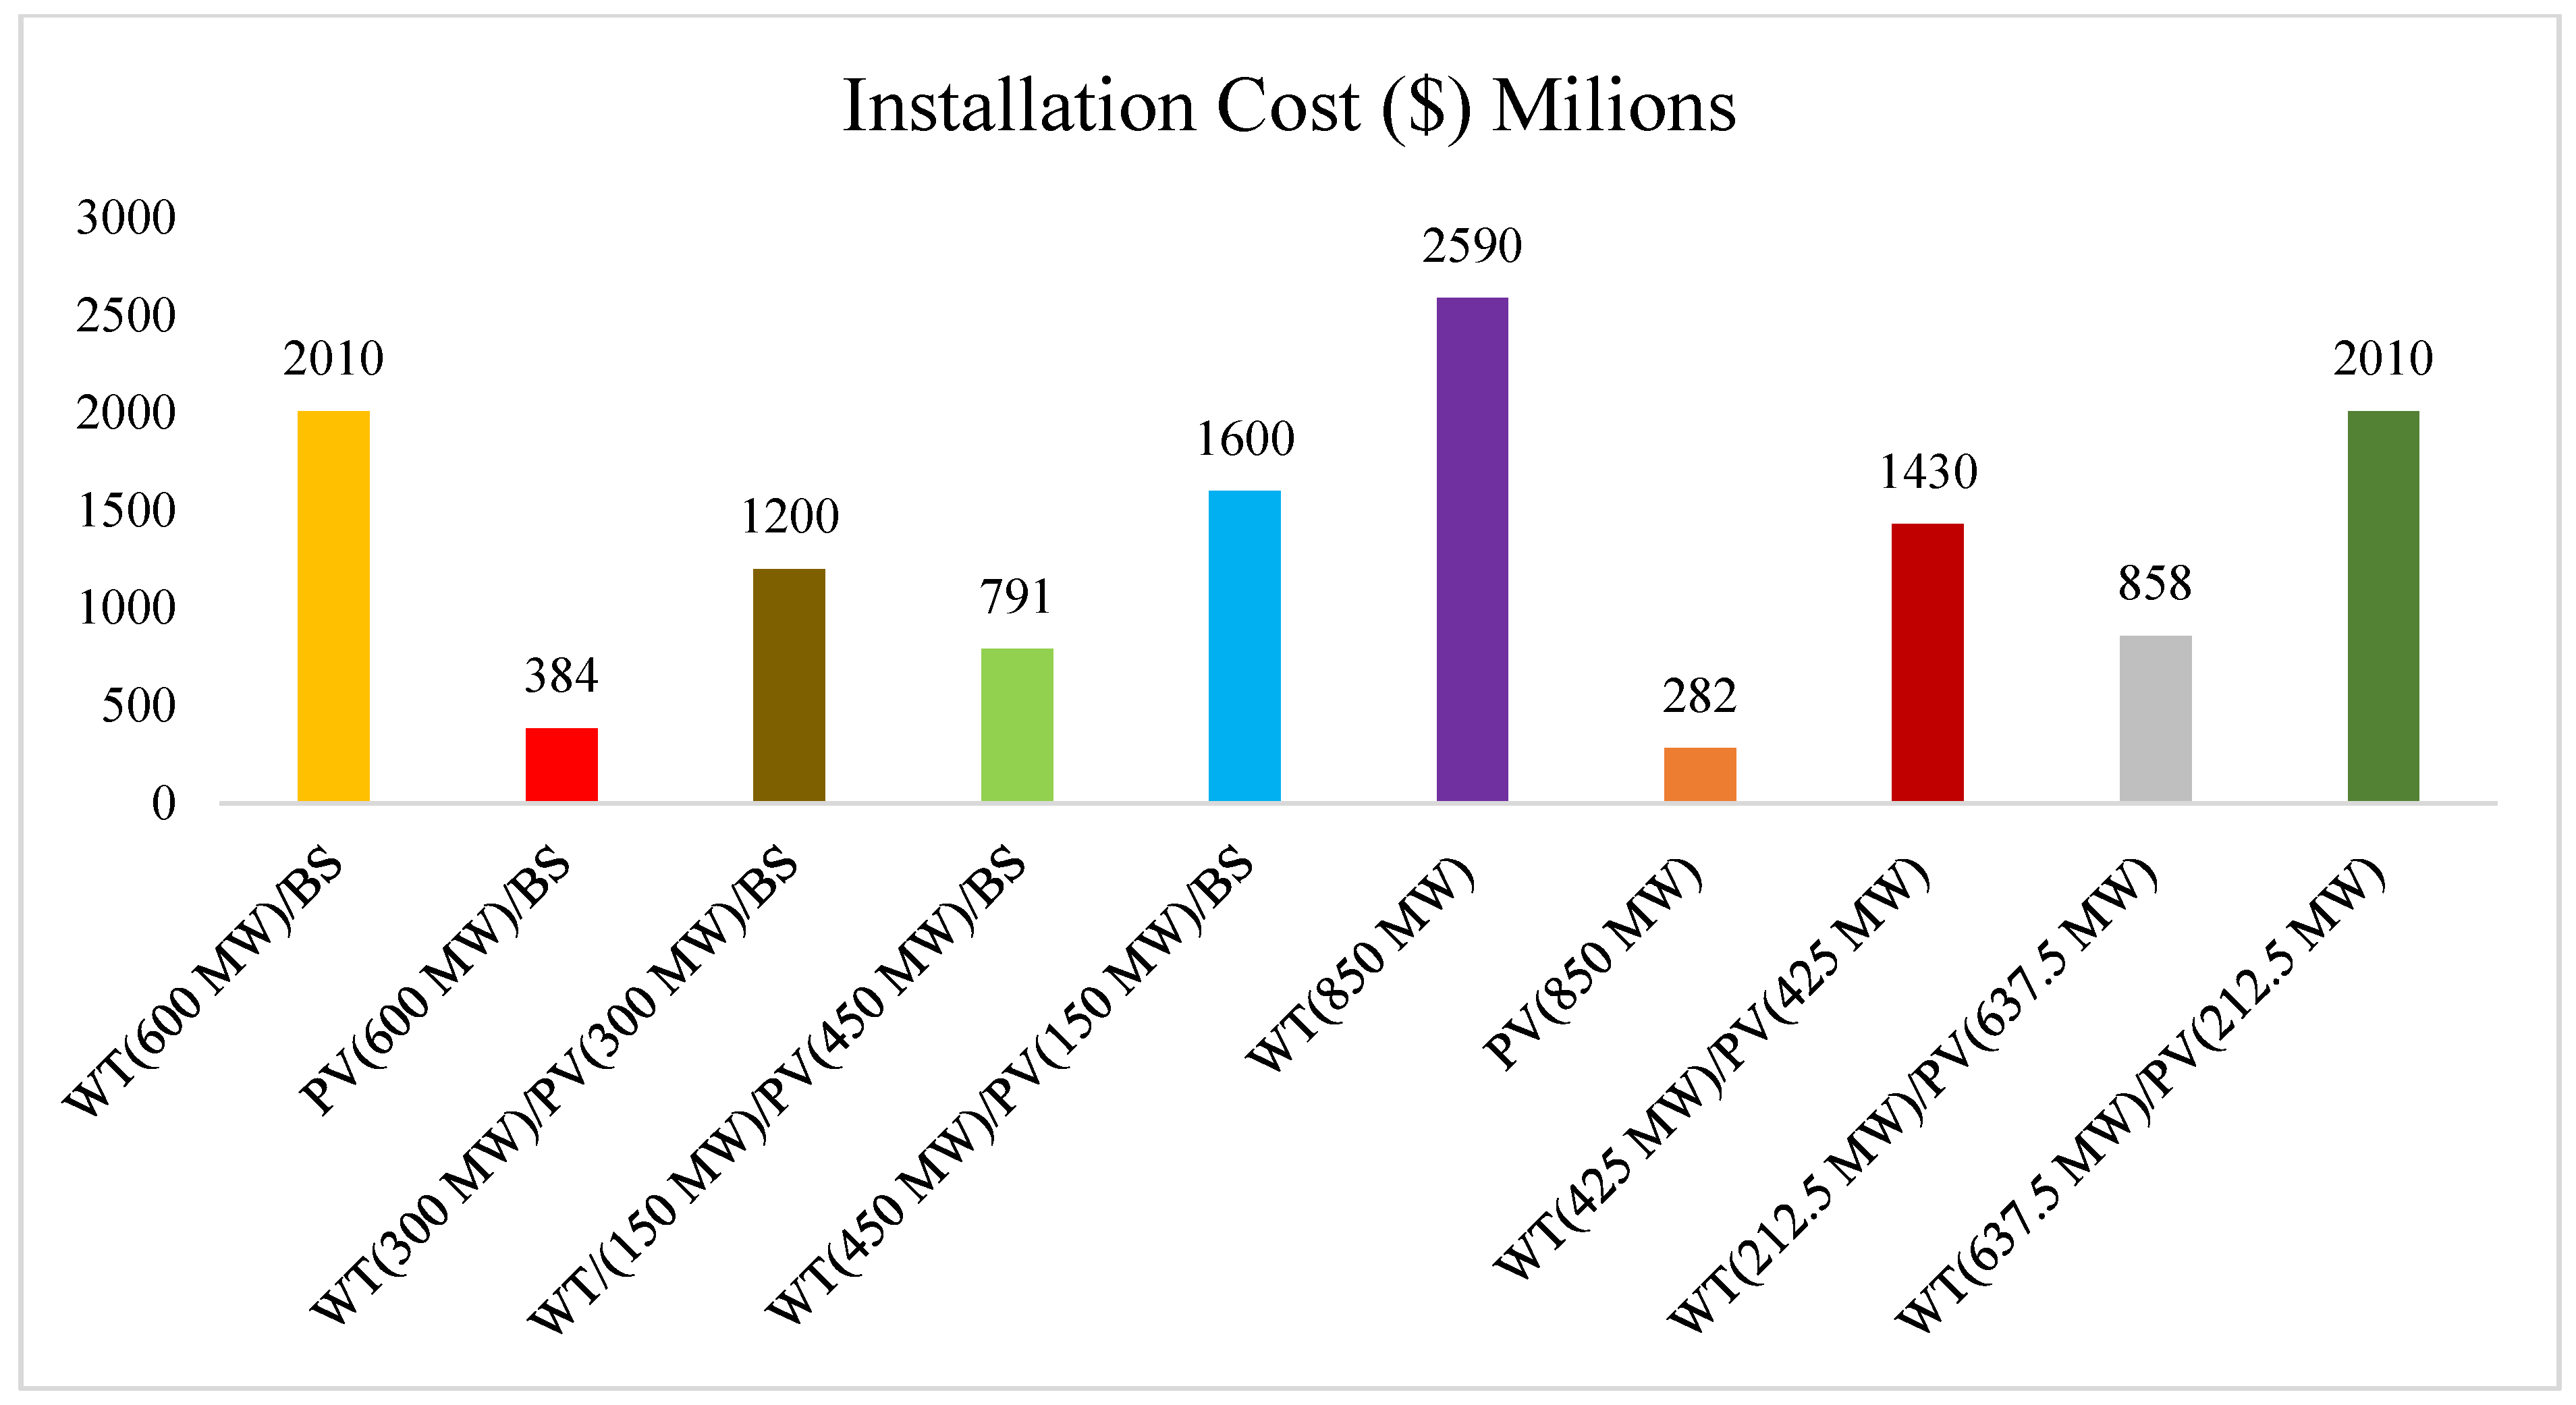
Figure 14 shows that the PV (850 MW) system has the lowest cost of operation, with −6.85 USD/year, and Figure 15 shows that the PV (850 MW) system also achieves the lowest installation cost, with USD 282 million, while the WT (850 MW) system has the highest costs for operation and installation at 30 million USD/year and USD 2590 million, respectively. The reason behind the high costs incurred by WT systems or systems with WT in their higher-capacity configuration is because of their very high capital and replacement costs, as mentioned earlier in Table 3.
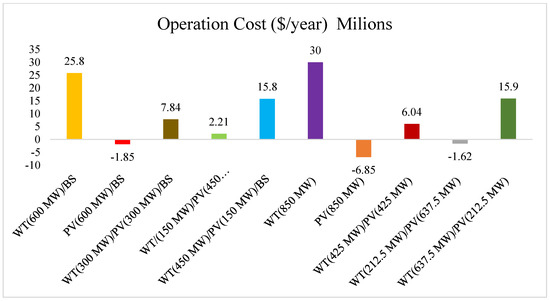
Figure 14.
Operation cost for all system.

Figure 15.
Installation cost for all systems.
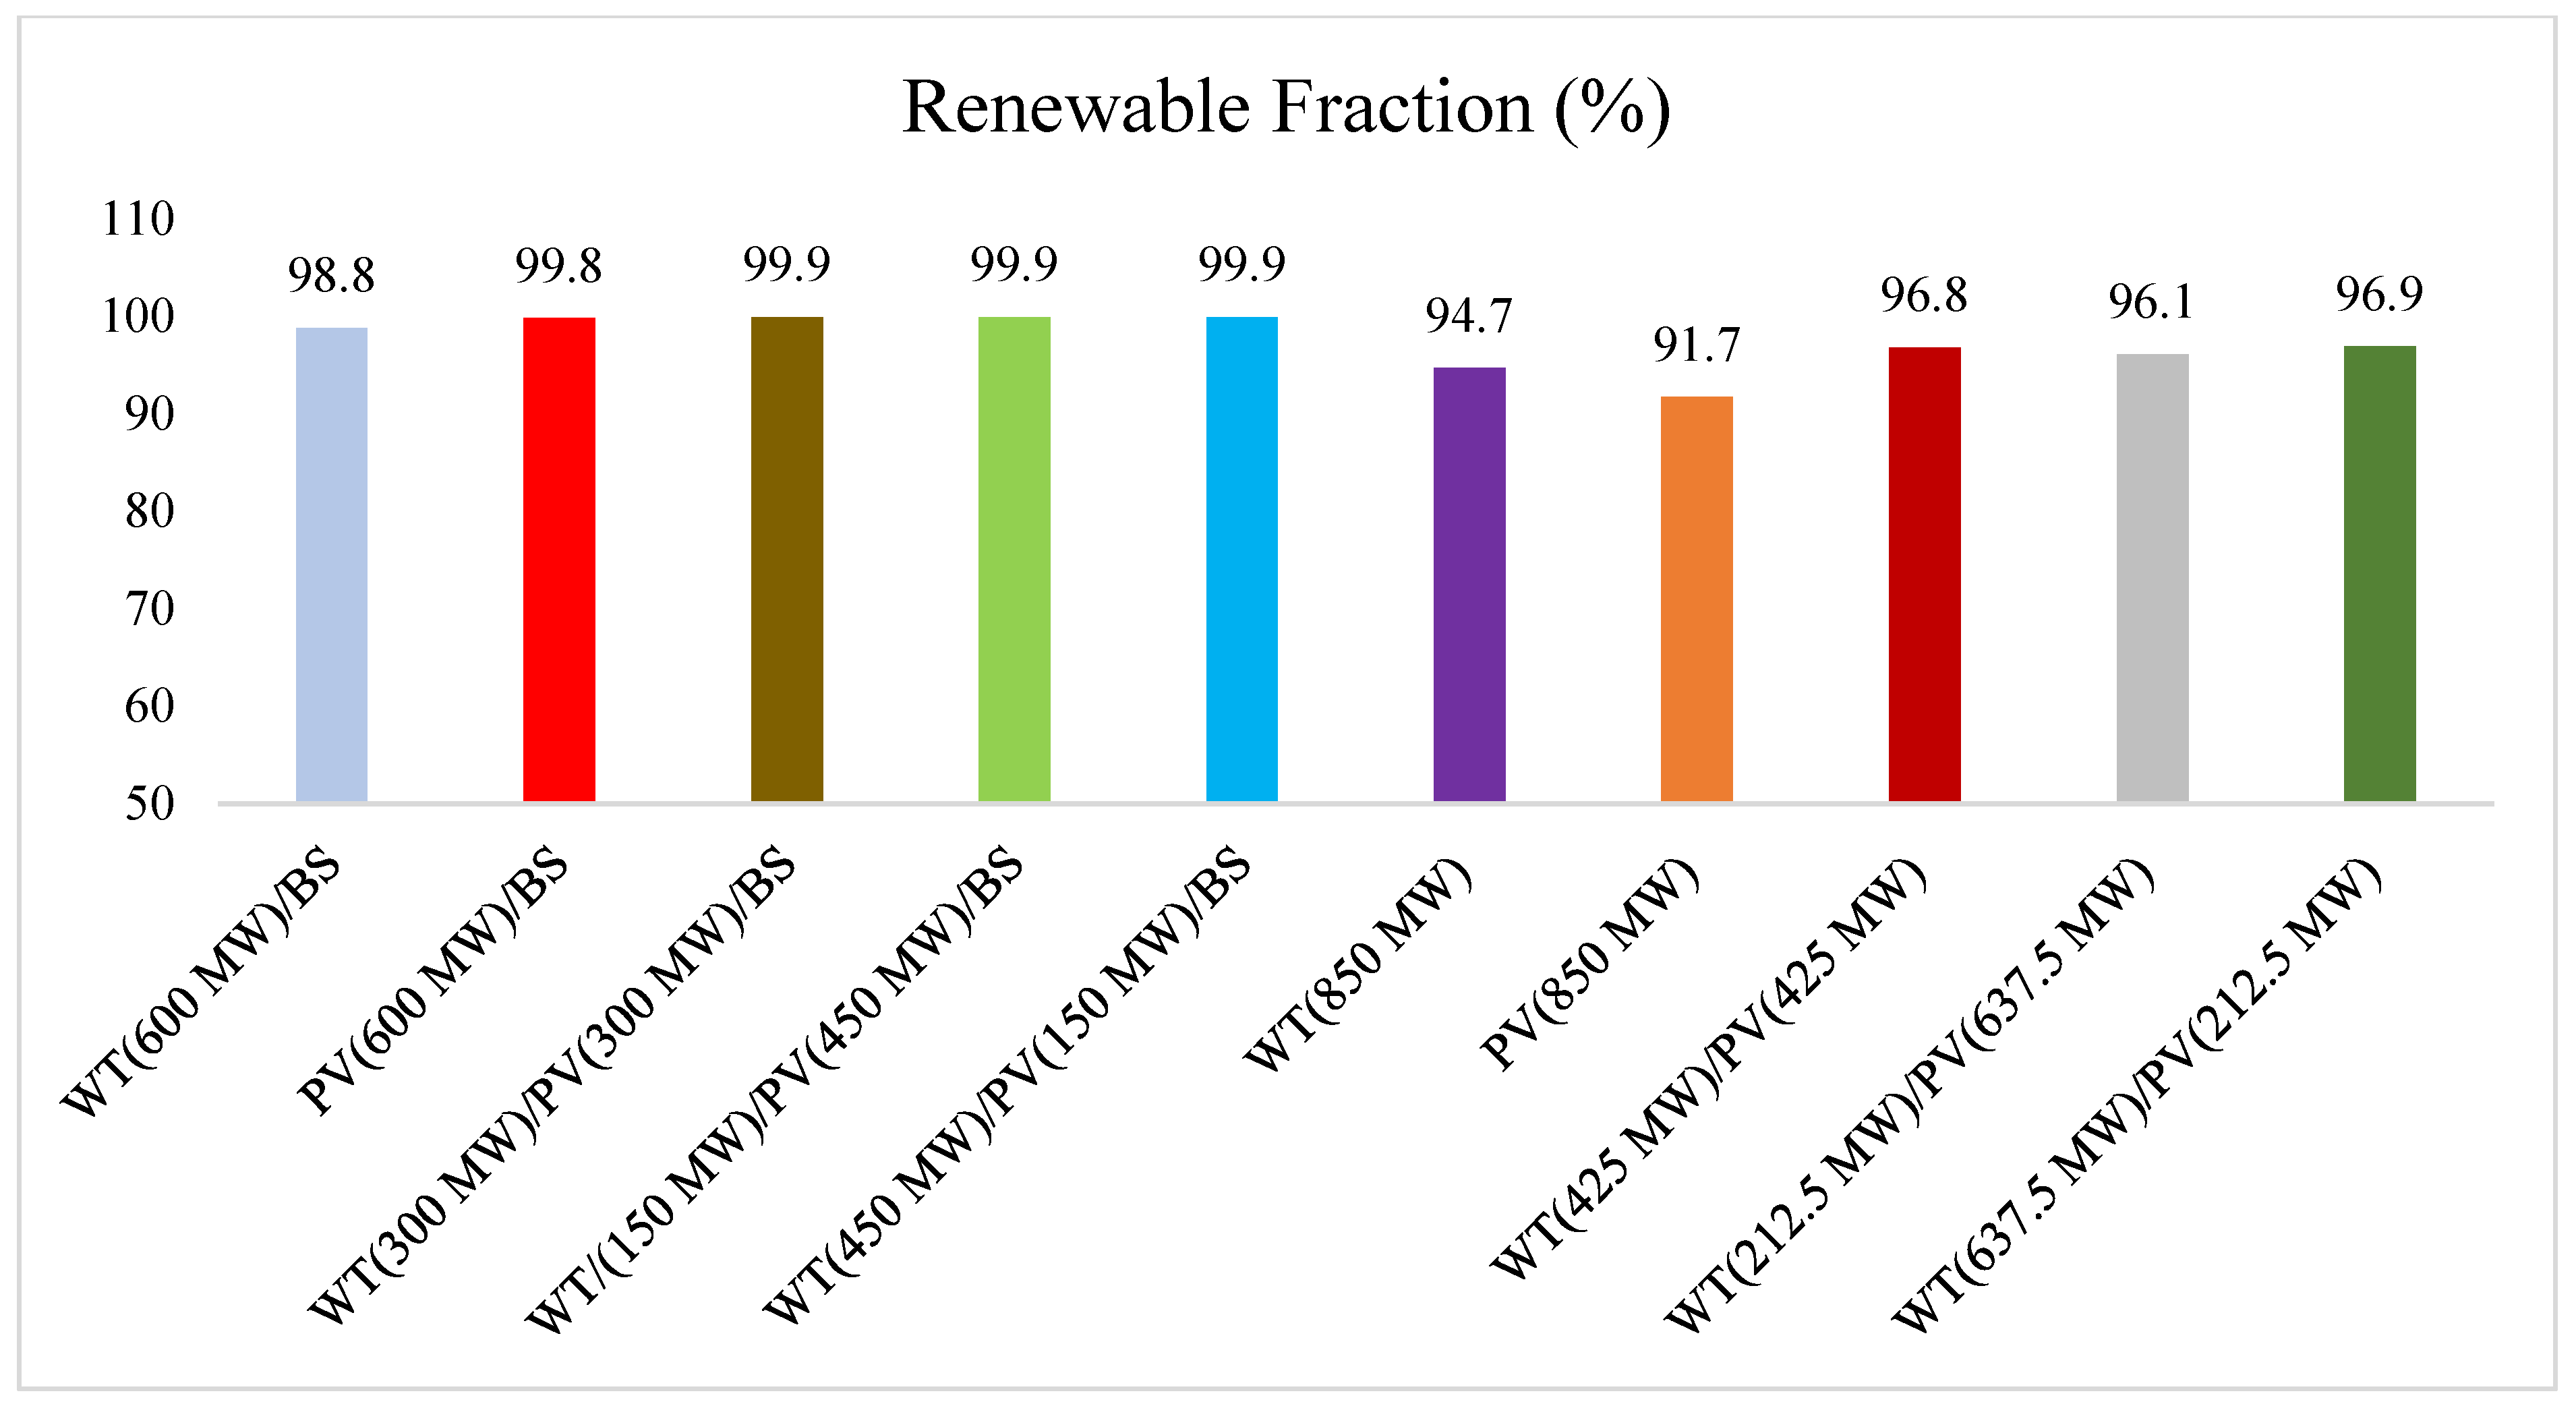
Figure 16 shows the renewable contributions of all systems to serve the load from their renewable parts, where all the values are high and very close to each other, so it is considered that all the suggested systems produce efficient and effective renewable energy. It is also noticeable in Figure 16 that any configuration that includes battery storage shows a more renewable fraction than other configurations that do not include battery storage, and this is because the battery stores the extra electricity produced from renewable resources in its availability time and then delivers it to the load when needed, especially on nights when there is no solar radiation or when wind speeds are low.
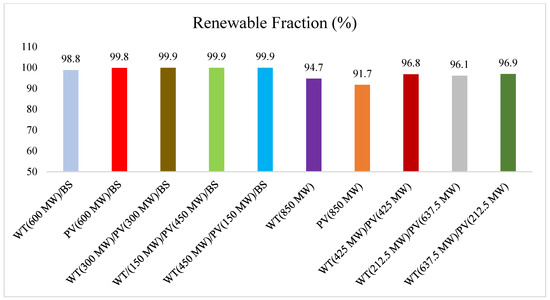
Figure 16.
Renewable fraction for all systems.
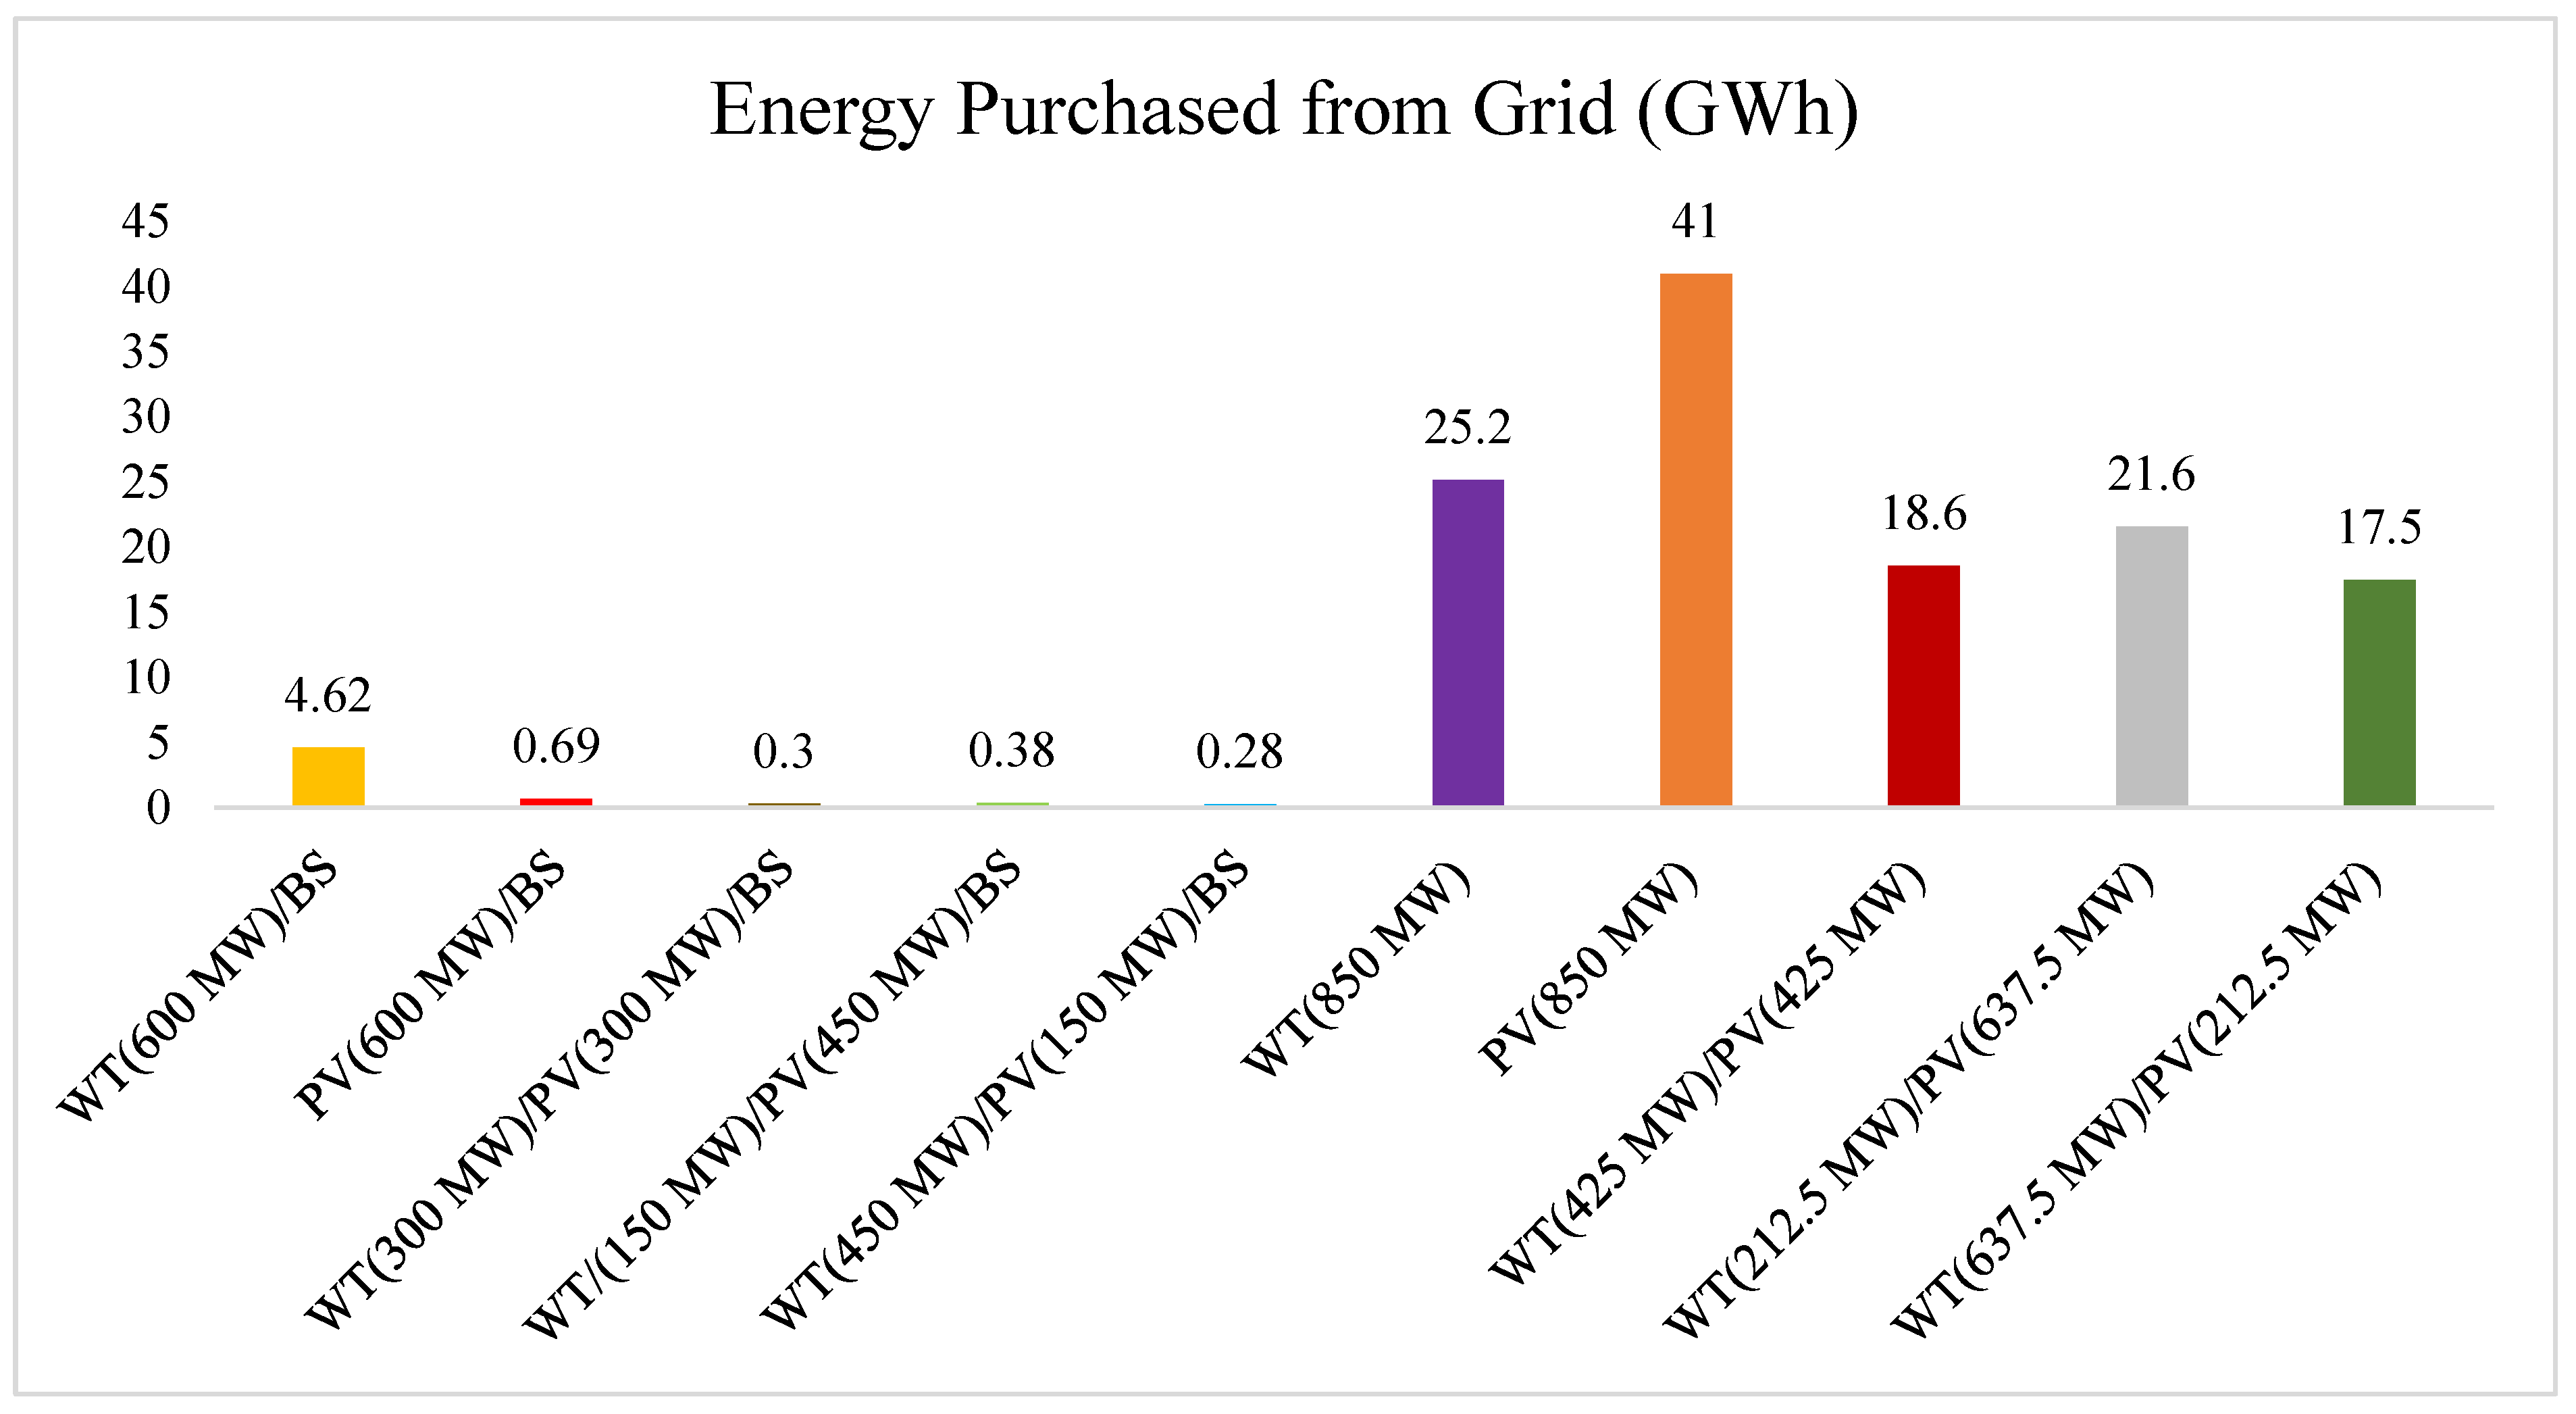
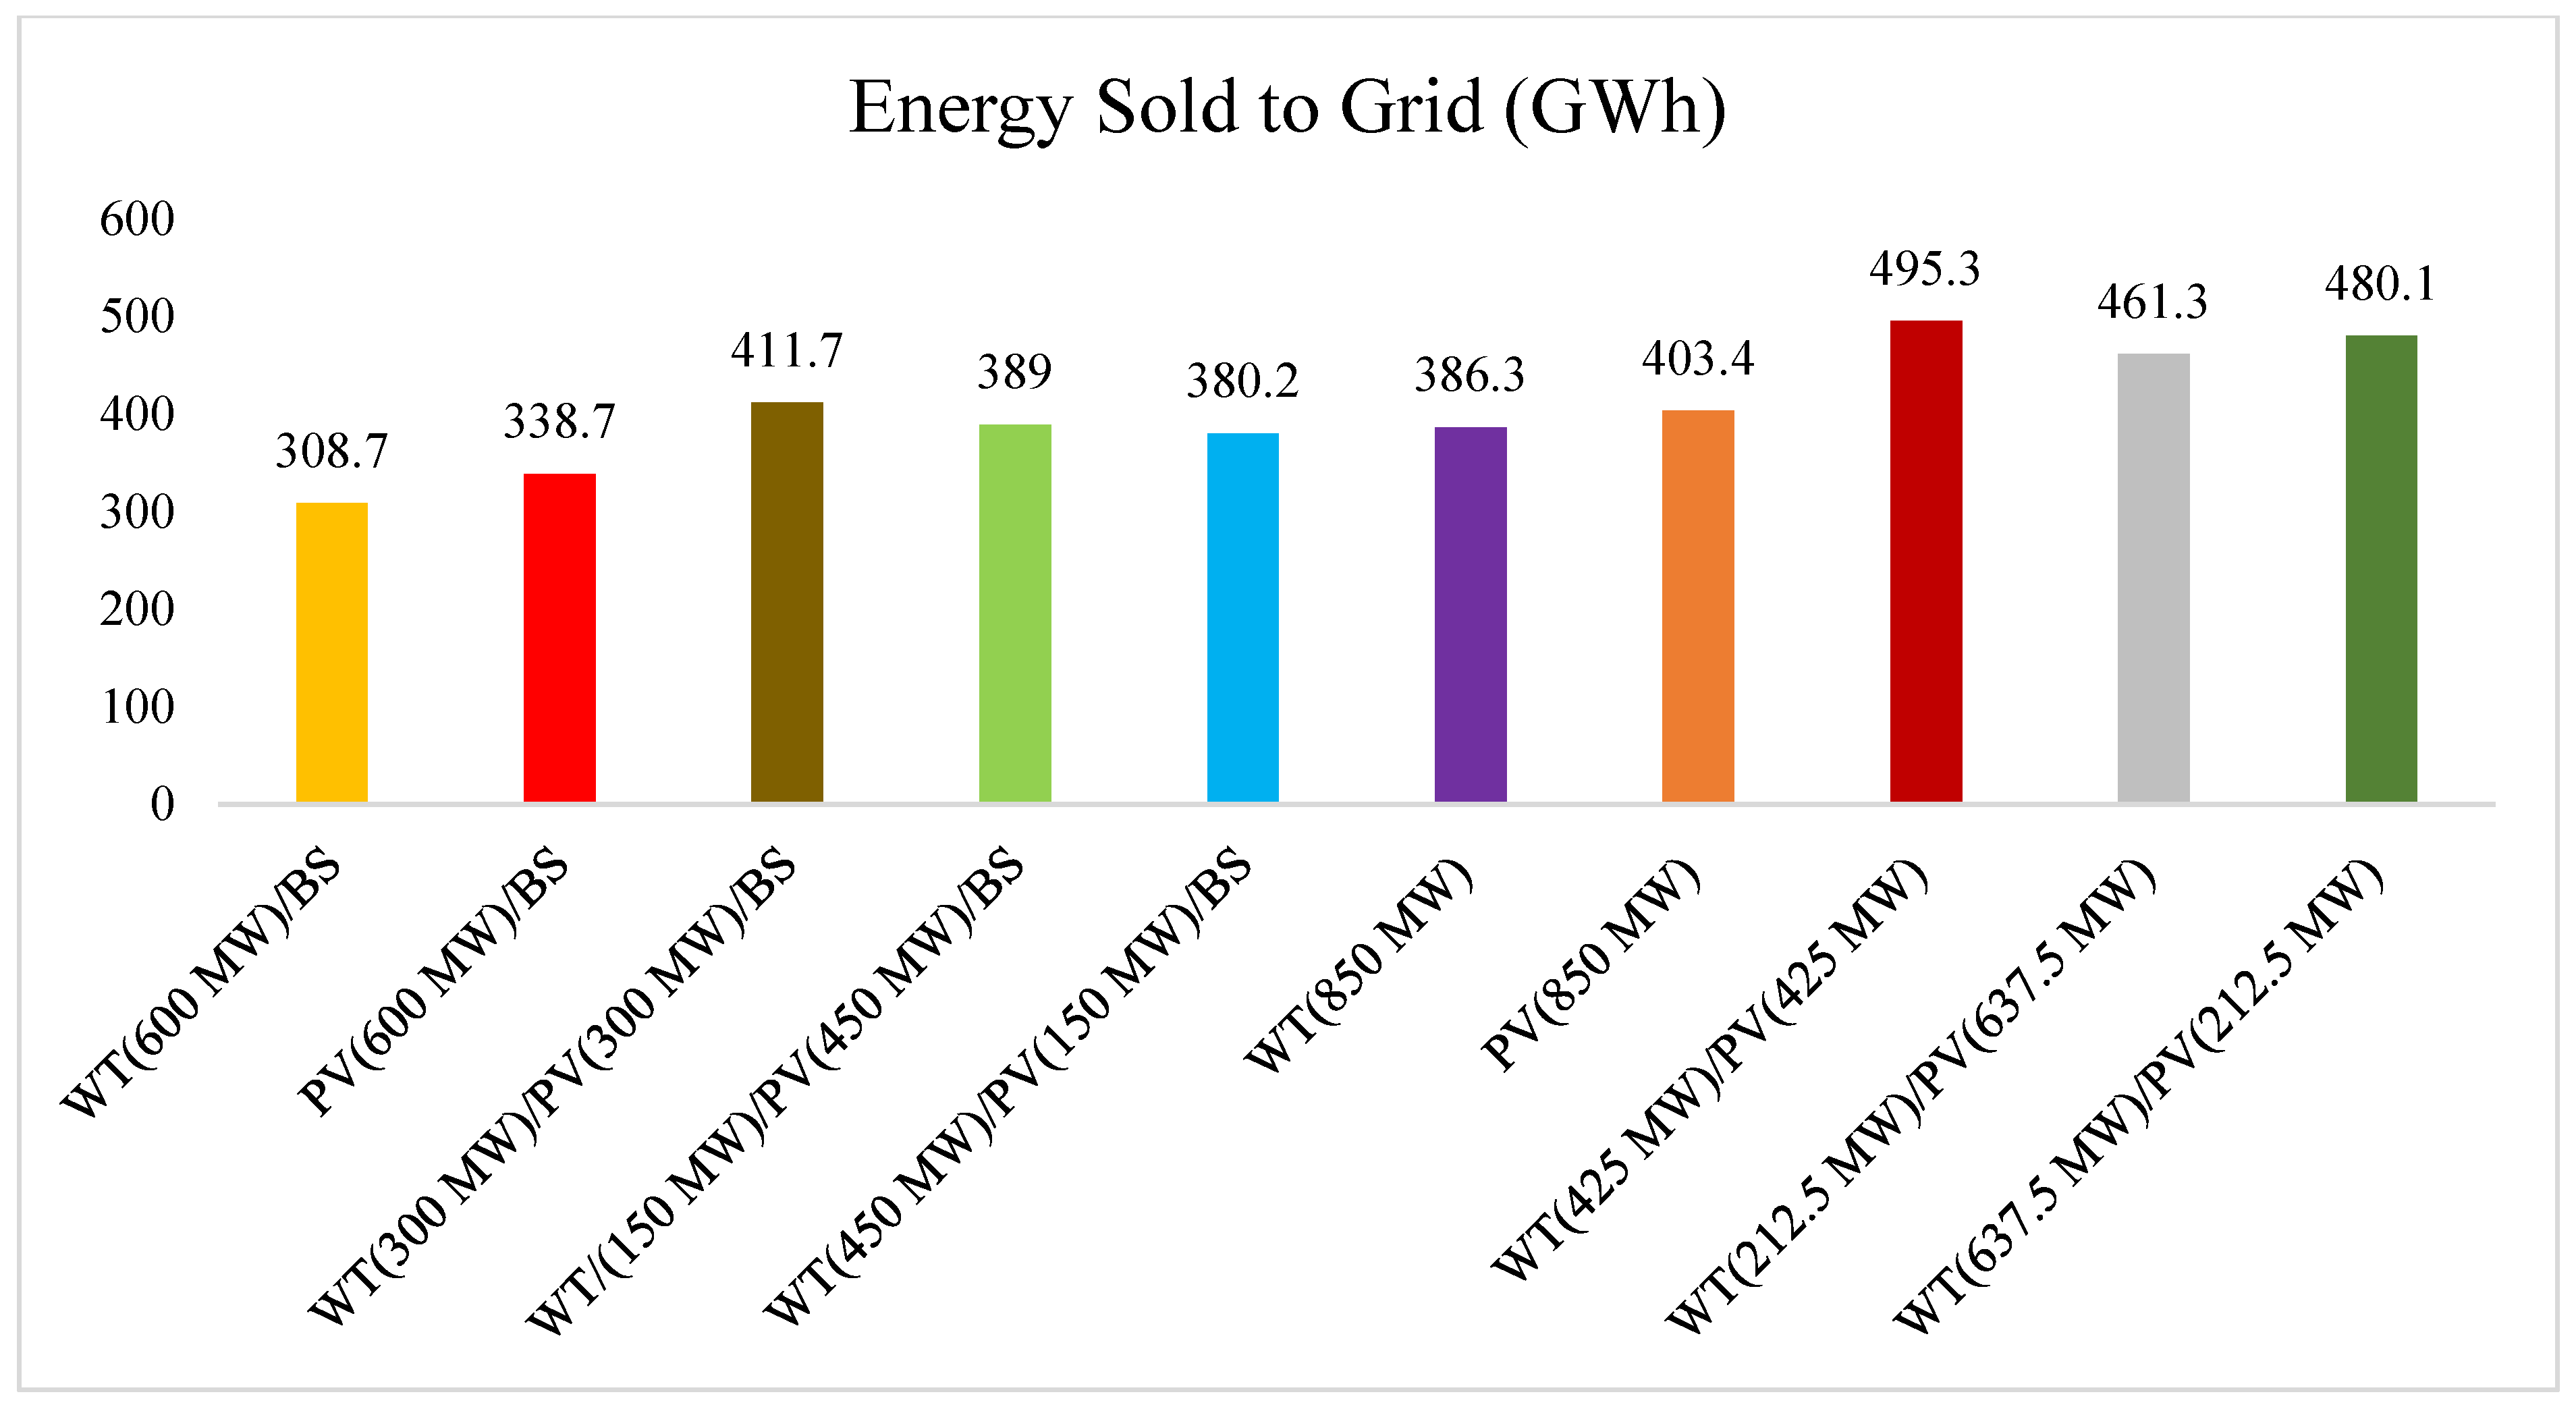
The system that has the highest energy purchased from the grid is PV (850 MW), as shown in Figure 17 and Figure 18, showing the energy sold back to the grid for all systems. The system that has the highest energy sales back to the grid is WT (425 MW)/PV (425 MW) with 495.3 GWh.

Figure 17.
Energy purchased from the grid.
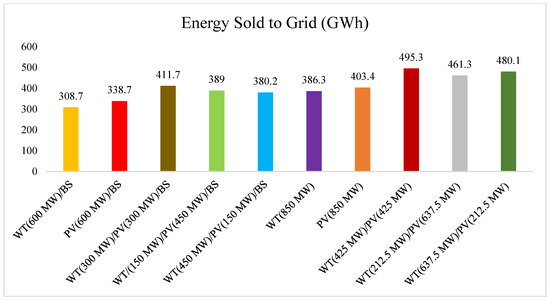
Figure 18.
Energy sold back to grid for all systems.
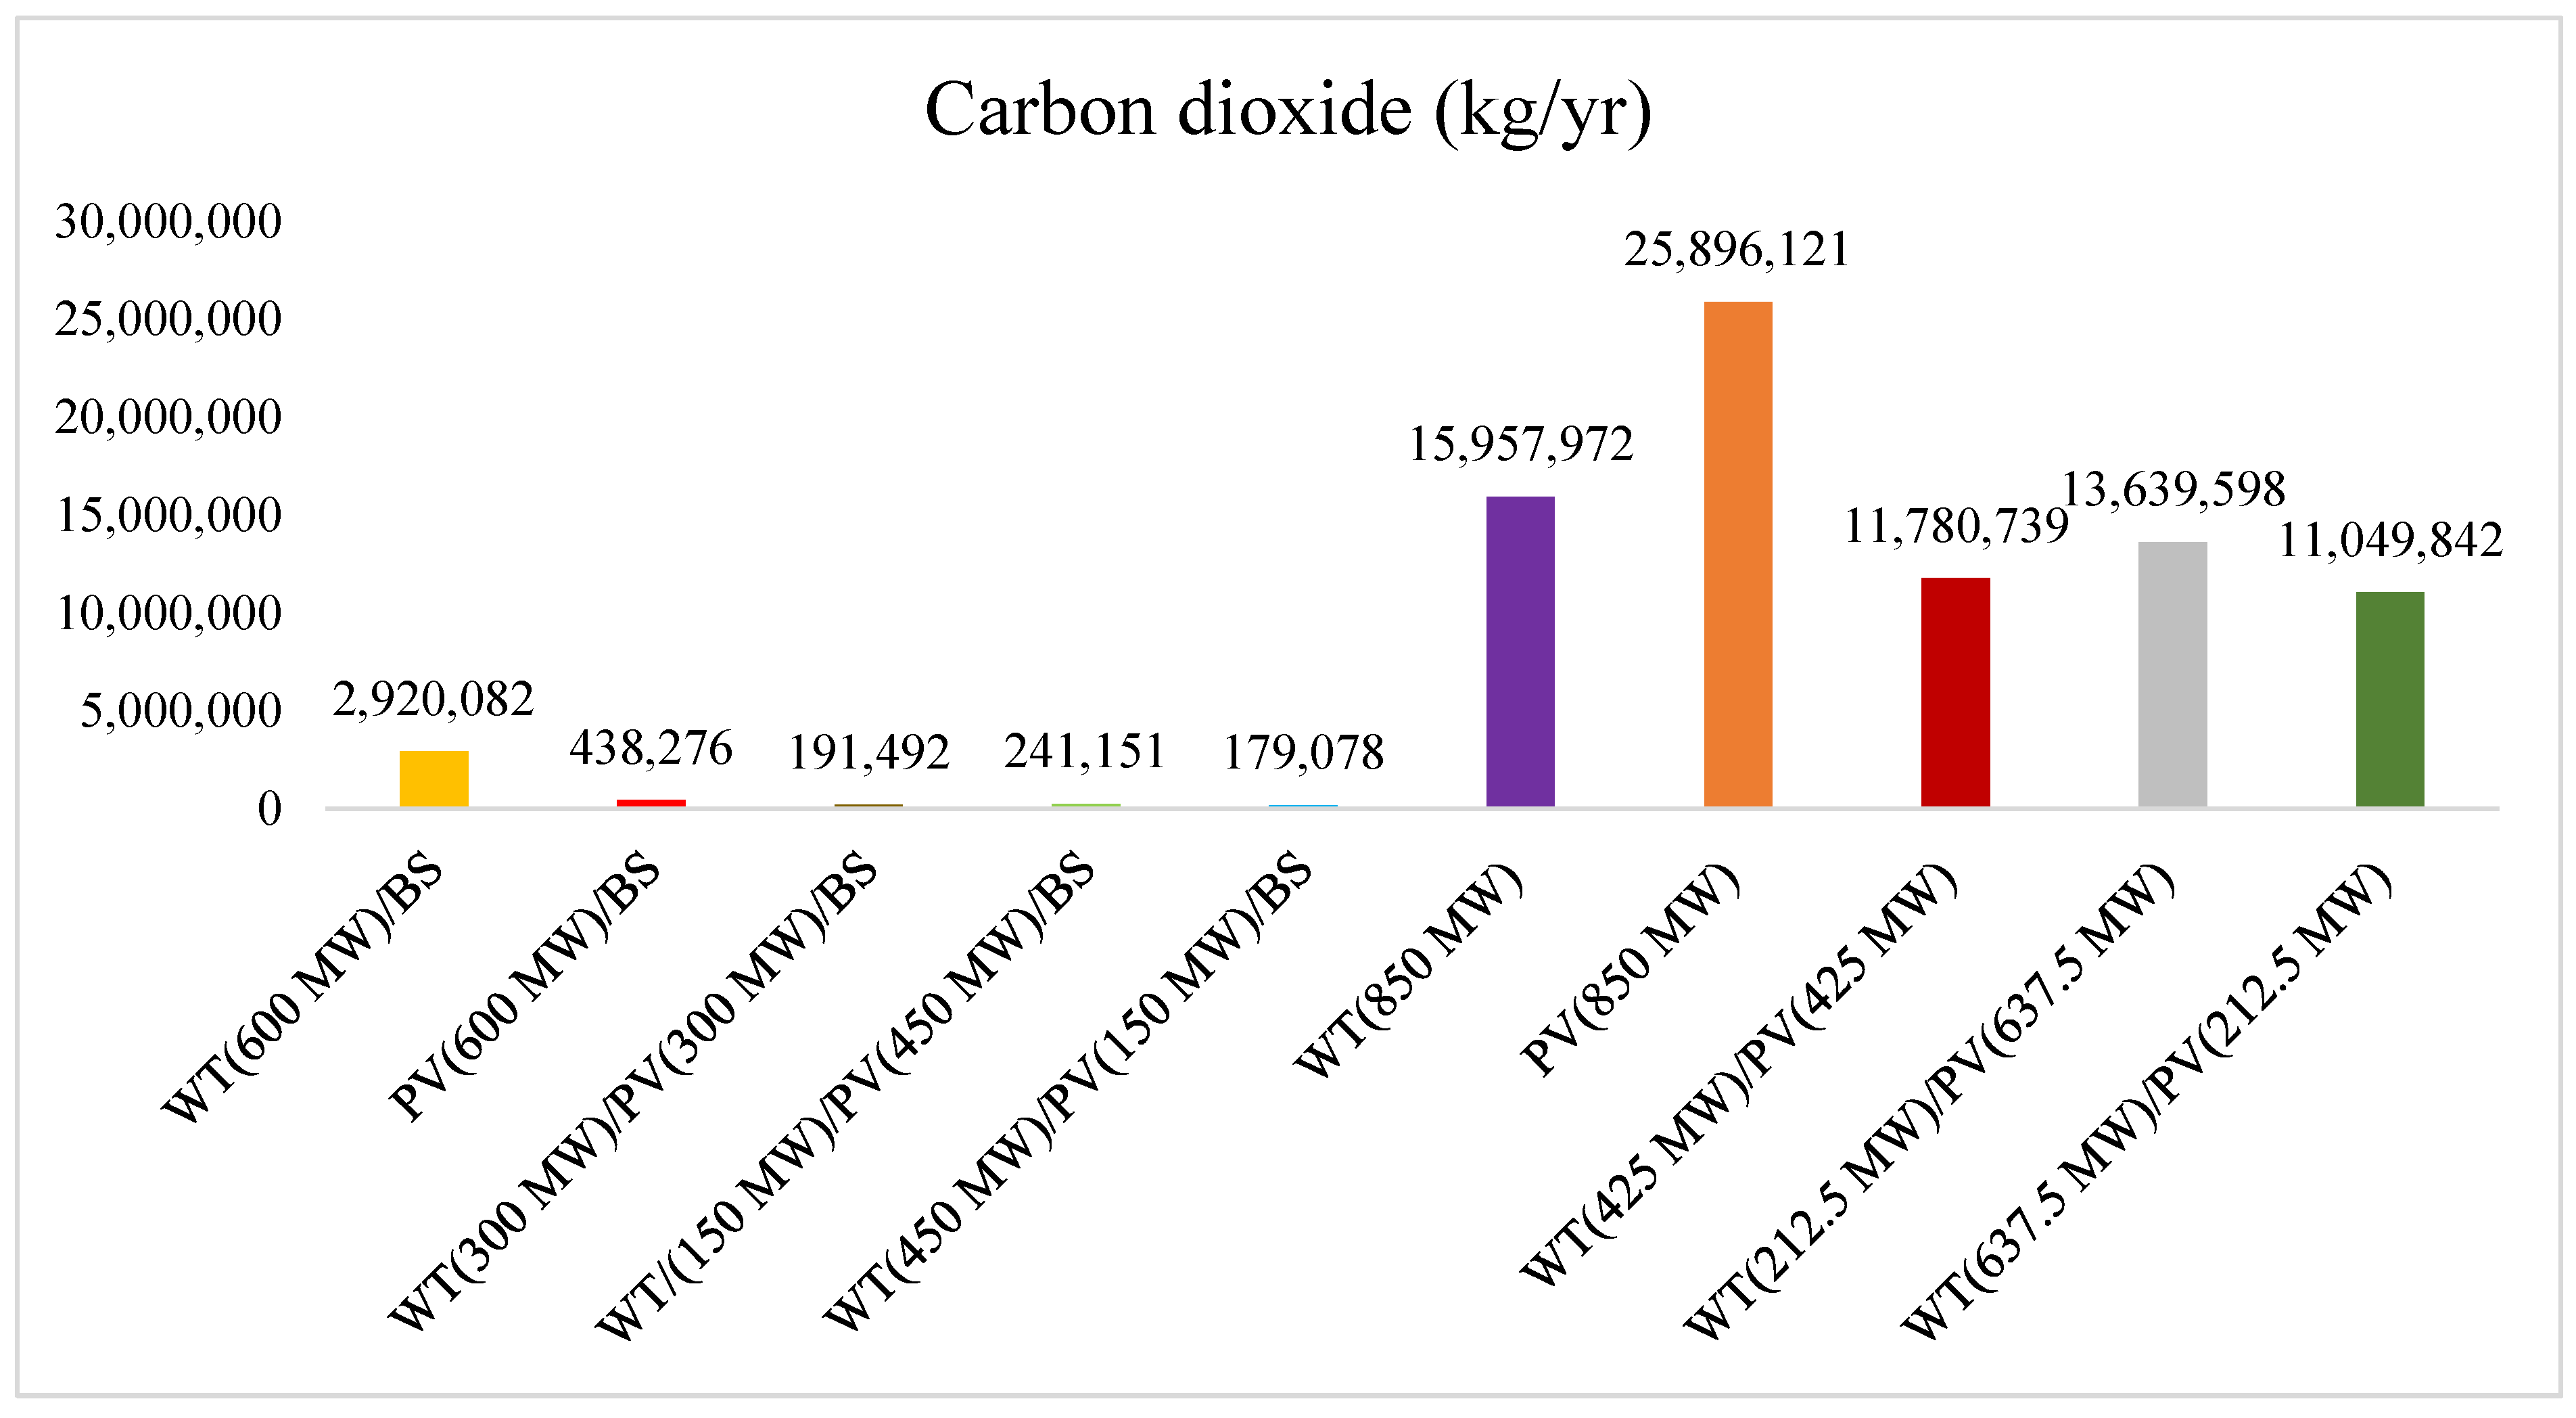
Figure 19 shows the CO2 emissions produced by all the suggested hybrid energy systems, while Figure 20 shows the emissions produced by the current system, which is grid dependence only, and by comparing the values of the two figures, it appears that all the proposed hybrid energy systems produce CO2 emissions maximally less than the current system by 53%, which is considered to be a huge environmental improvement by reducing harmful emissions such as CO2. Moreover, it is observed from Figure 19 that the systems that have battery storage produce less CO2 emissions than other systems, and this is because they have less dependency on the grid.

Figure 19.
Emissions produced by all systems.
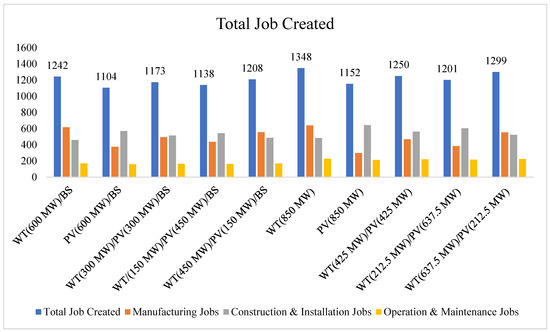
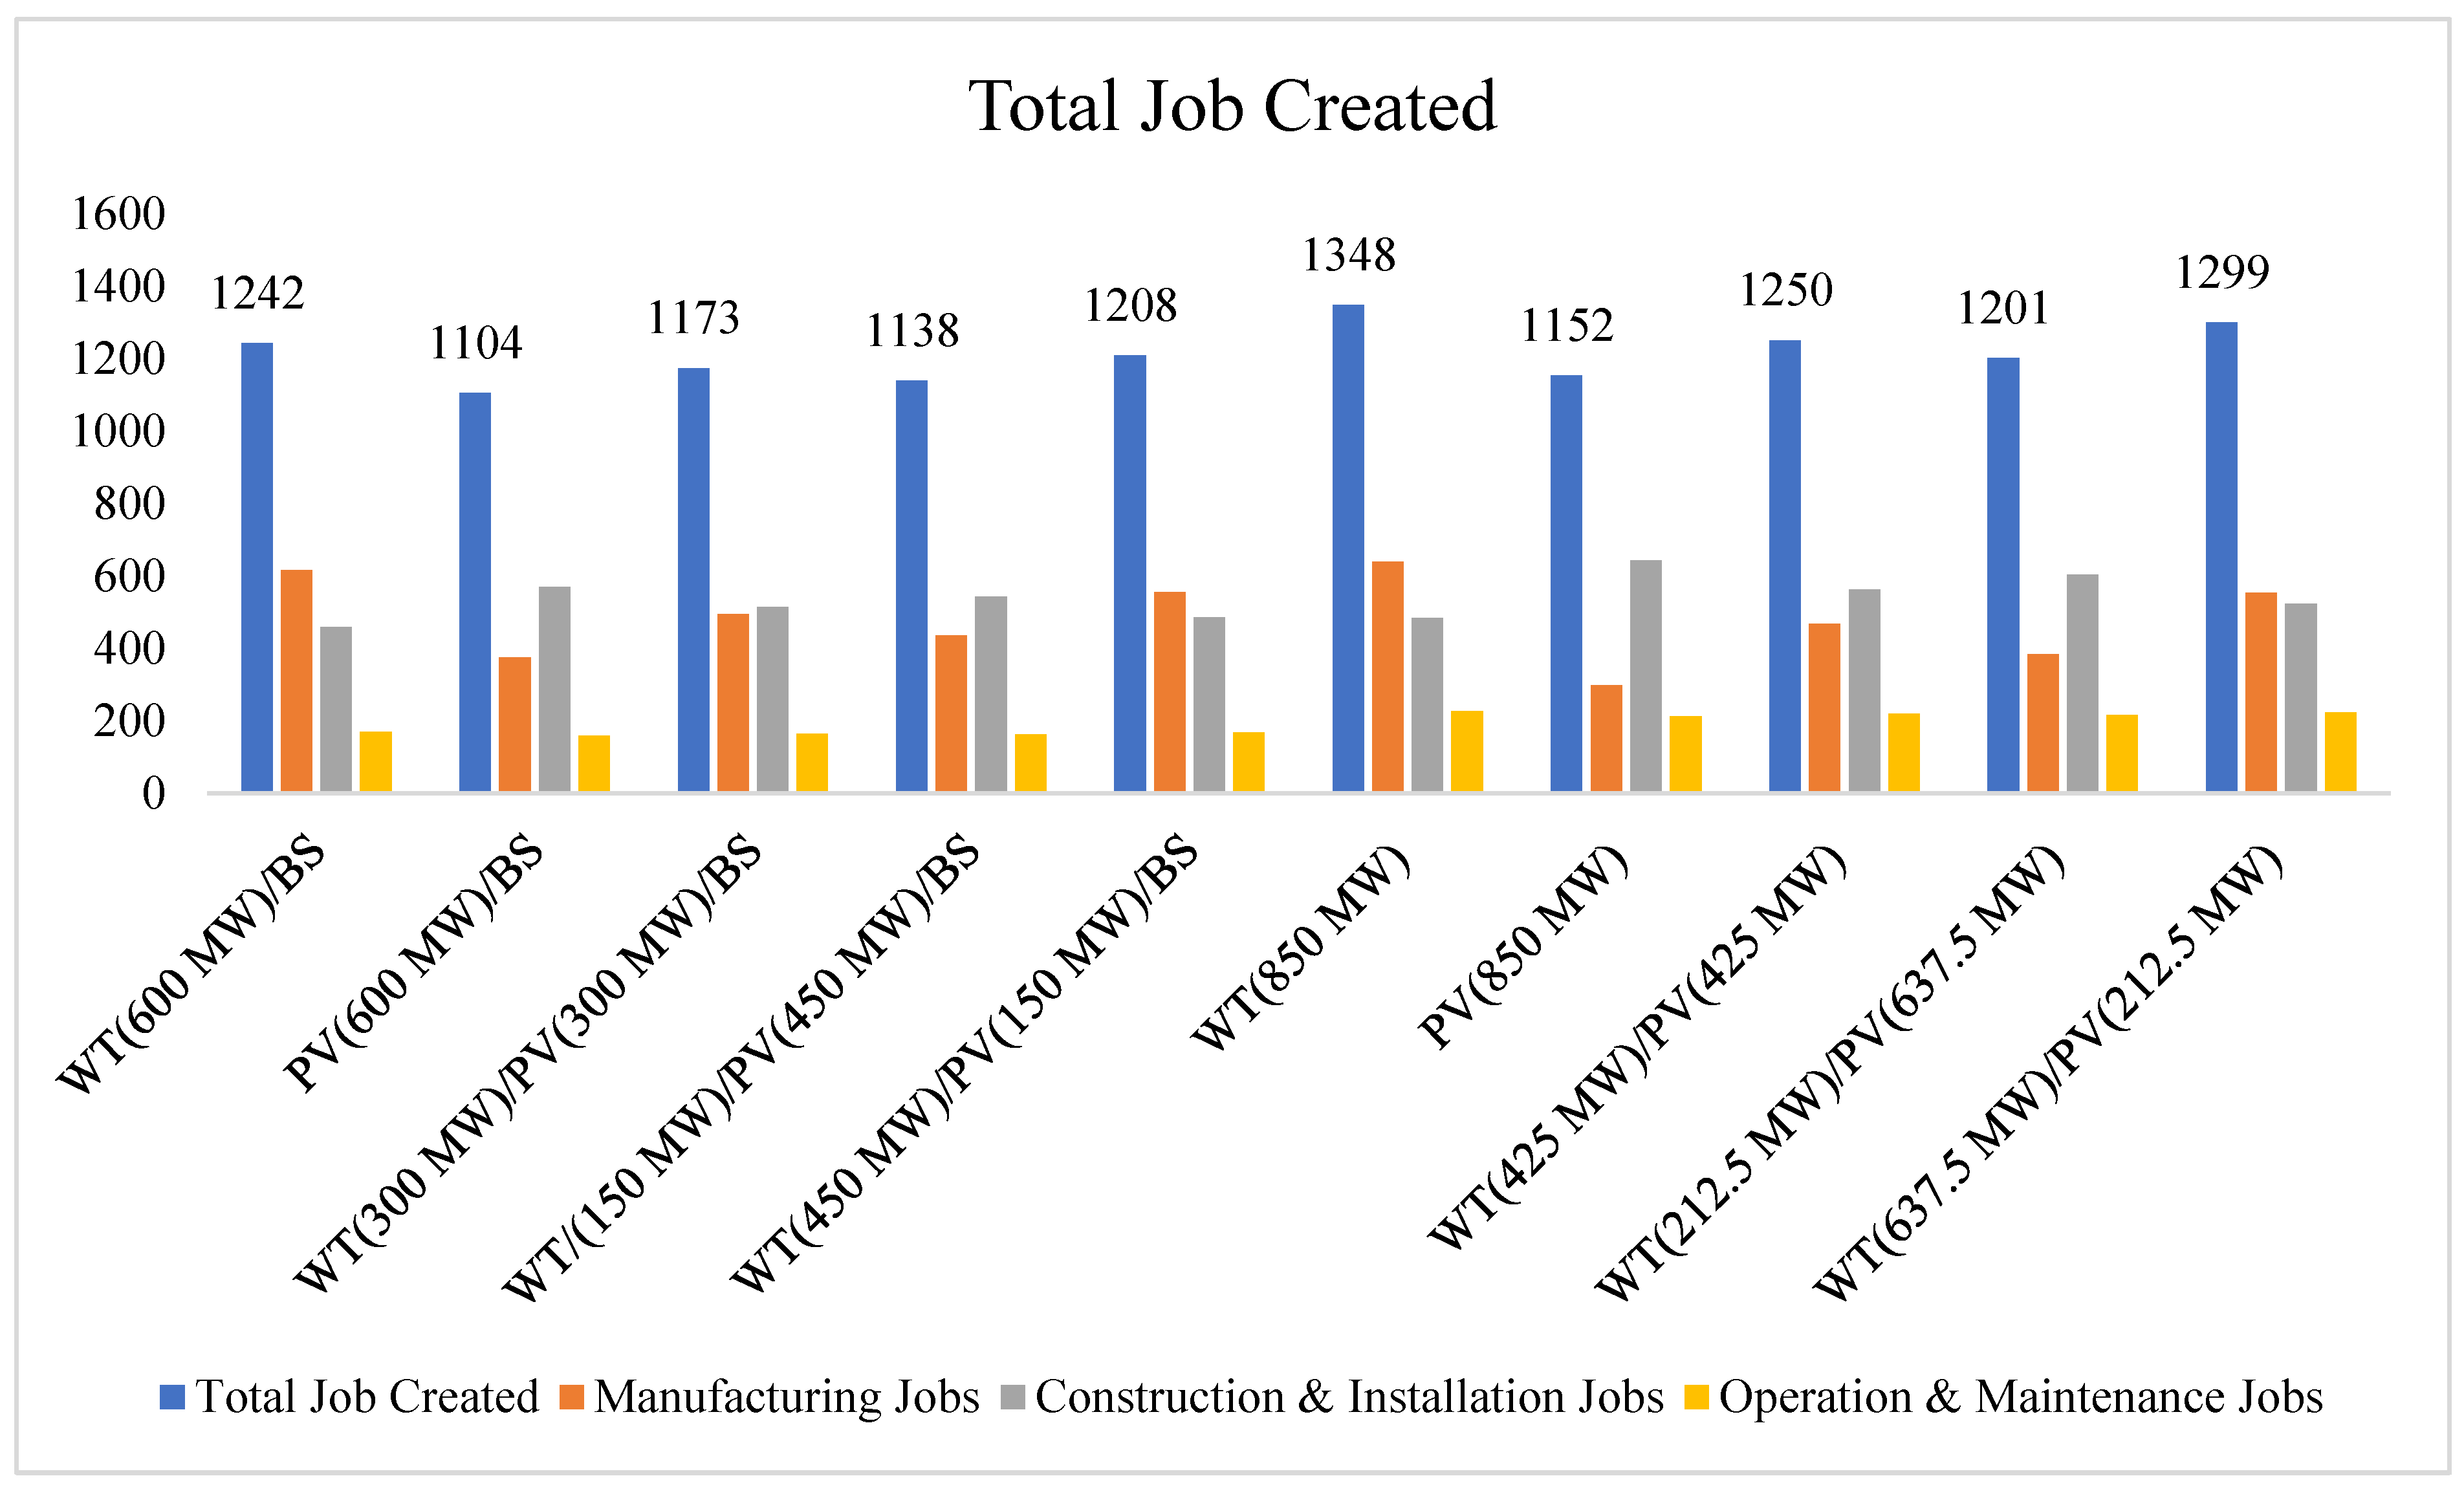
Figure 20.
Jobs created by each system.
Figure 20 shows the total jobs created by each system configuration and its variety of jobs, which are manufacturing jobs, construction and installation jobs, and operation and maintenance jobs. All the systems produced significant job opportunities for the society of Yanbu city and its regional western area. The lowest number of jobs created, as shown in the following figure, was 1104 job opportunities generated by the PV (600 MW)–battery storage system. This figure represents a substantial contribution, translating to an average of four job opportunities per month over a 25-year period.
According to the parameters mentioned earlier, the optimized solution is the PV (850 MW)–On Grid with USD 201 million and 0.0344 USD/kWh as its NPC and LCOE, respectively. Moreover, if the ministry of energy would like to invest in WT for the Yanbu renewable project for the purpose of localizing technologies, R&D, and the manufacturing of renewable resources such as WT and PV modules, there is also an optimized system for this case, which is the WT (212.5 MW)–PV (637.5 MW)–On Grid system with USD 839 million and 0.129 USD/kWh as its NPC and LCOE, respectively.
Table 4 and Table 5 show the economic and technical parameters for the first and second optimized solutions, which are the PV (850 MW)–On Grid system and WT (212.5 MW)–PV (637.5 MW)–On Grid system, respectively.
Table 4.
PV (850 MW)–On Grid system economical and technical parameters.
Table 5.
WT (212.5 MW)–PV (637.5 MW)–On Grid system economical and technical parameters.
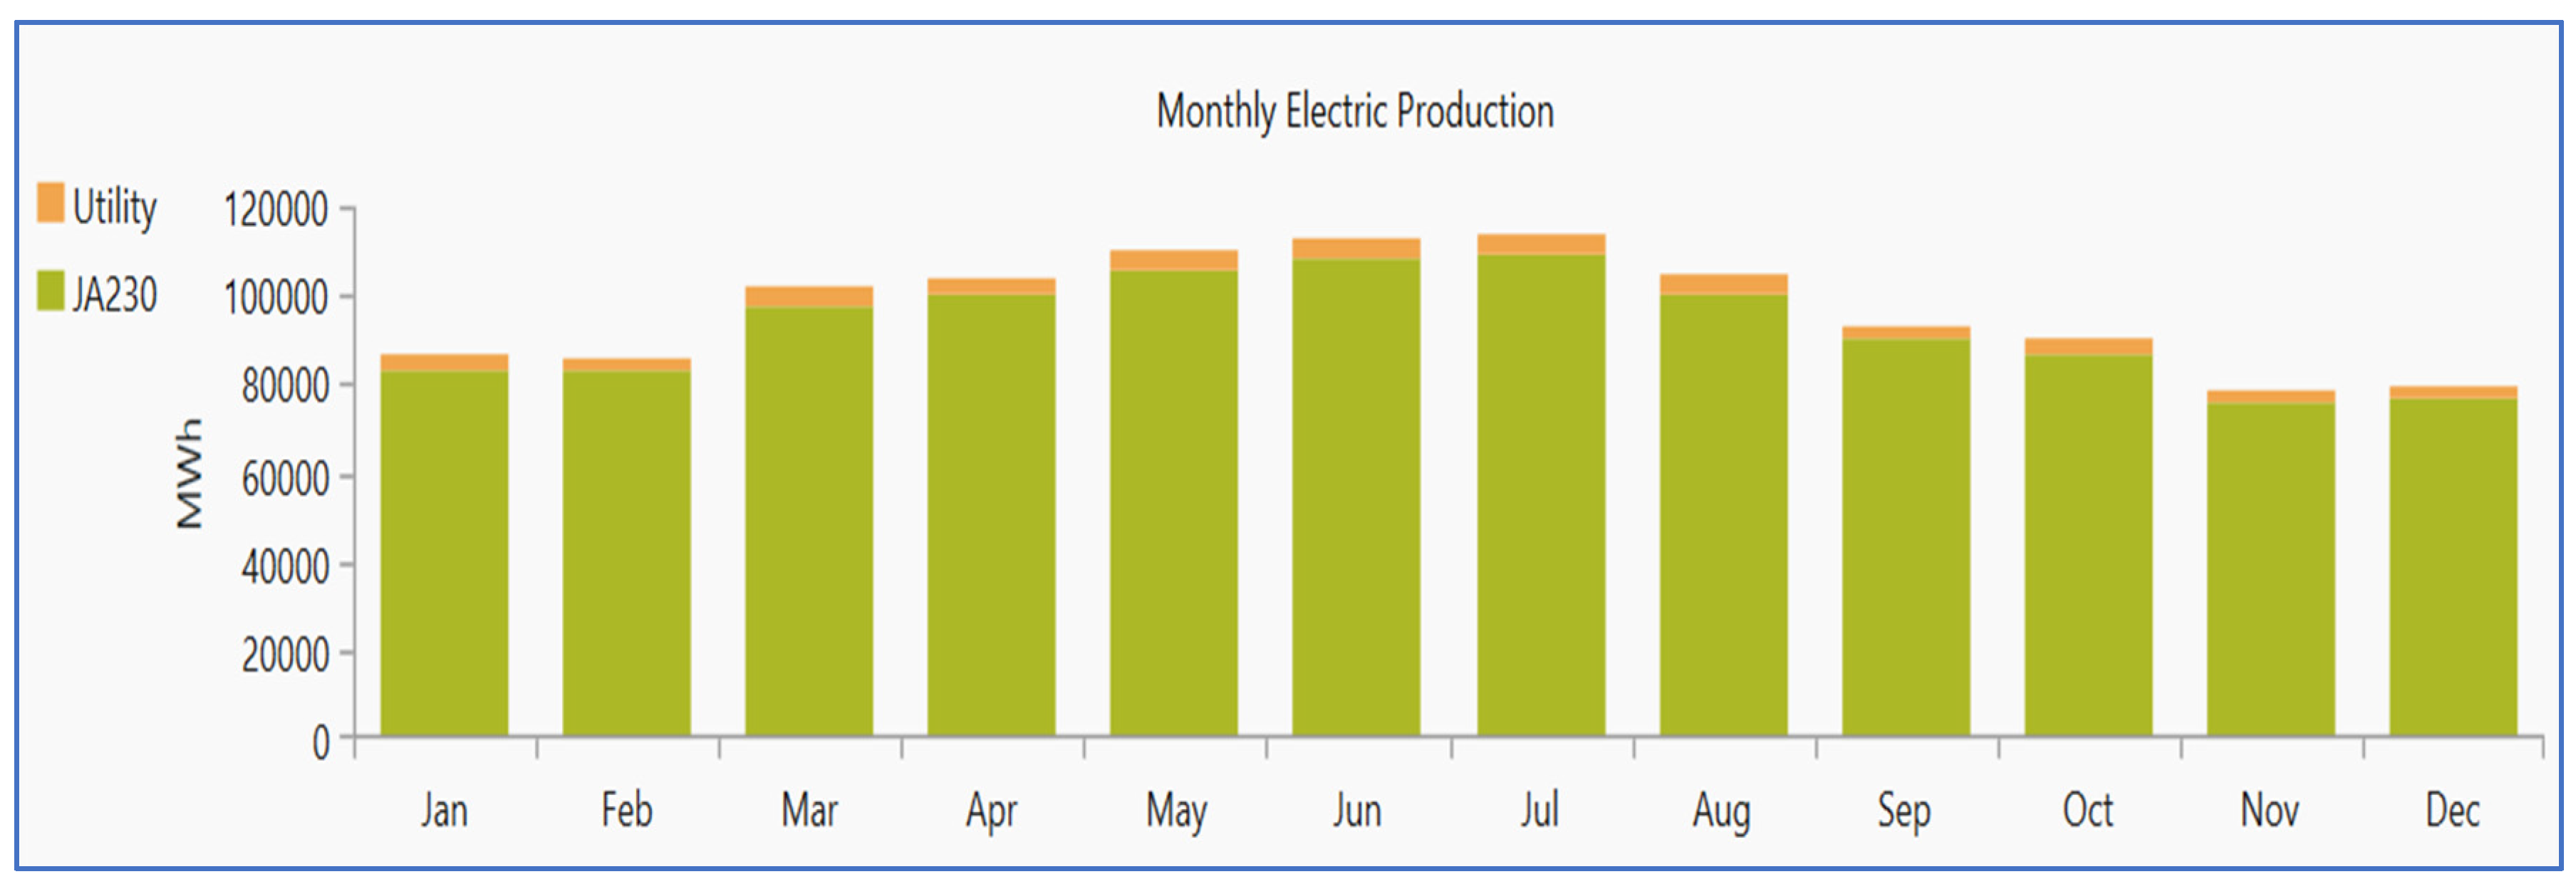
Figure 21 presents the monthly electrical production for the PV (850 MW)–On Grid system and Figure 22 shows the production of the WT (212.5 MW)–PV (637.5 MW)–On Grid system, with both figures showing that the renewable resources of PV and WT–PV cover the majority of the production for both systems, respectively, which significantly decreases the dependency on the grid.

Figure 21.
Monthly production of PV (850 MW)–On Grid system.
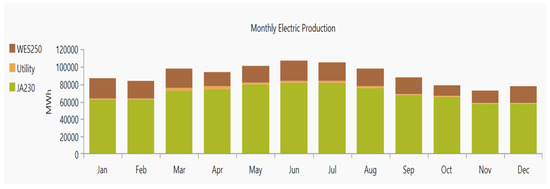
Figure 22.
Monthly production of WT (212.5 MW)–PV (637.5 MW)–On Grid system.
The findings of this study underscore the viability and benefits of hybrid renewable energy systems in Yanbu city, Saudi Arabia. The techno-economic analysis revealed that a solely PV system offers the most cost-effective solution, with significant reductions in NPC and LCOE. Moreover, hybrid WT–PV configurations also present a promising alternative, particularly in supporting local manufacturing initiatives. The high renewable energy contribution exceeding 91% and a substantial 53% reduction in CO2 emissions compared to traditional grid dependence highlight their environmental benefits. Additionally, the potential to create up to 1152 jobs emphasizes the social and economic advantages, contributing to broader sustainable development goals. Despite these promising results, several limitations need to be acknowledged as follows:
- Data Availability: The accuracy of the simulation results heavily depends on the availability and quality of the input data, such as weather patterns, load demand, and economic parameters. Any discrepancies or gaps in data could affect the reliability of the outcomes.
- Technological Assumptions: This study assumes current technological capabilities and costs for renewable energy systems. Future advancements or changes in technology and cost could alter the findings.
- Geographic Specificity: The results are specific to Yanbu city and may not be directly applicable to other regions with different climatic, topographical, or infrastructural conditions.
- Economic Factors: Fluctuations in economic variables such as inflation rates, discount rates, and energy prices could impact the cost-effectiveness and feasibility of the proposed systems.
- Environmental and Social Impact Assessments: While the study estimates job creation, it does not comprehensively address other social impacts, such as community acceptance or potential disruptions during the installation phase. Environmental impacts beyond CO2 emissions are also not fully explored.
- Sensitivity Analysis Scope: Although a sensitivity analysis was performed, it may not cover all possible variations in key parameters, potentially overlooking some extreme scenarios or unexpected changes.
- Policy and Regulatory Framework: The study does not account for potential changes in policies or regulations that could influence the deployment and operation of renewable energy systems.
4. Conclusions
Energy production in Saudi Arabia has traditionally depended heavily on domestic fossil fuel reserves such as oil and natural gas. However, in recent years, the country has placed an increasing focus on developing its renewable energy resources and diversifying away from hydrocarbon dependence as part of its vision 2030 reforms. A national renewable energy program targeting 32% renewable electricity generation by 2030 has been launched to support this clean energy transition. As part of these efforts, this study aimed to harness local solar and wind resources for a baseload power supply by adopting an 850 MW renewable energy plant project in Yanbu city. The study presented techno-economic and environmental analyses of different hybrid renewable energy system configurations for the Yanbu plant through simulation and optimization using the HOMER Grid software. The objectives were to facilitate the energy transition vision by identifying technically feasible, economically affordable, and environmentally friendly solutions for utility-scale renewable deployment at the site. A geographic-information-system-based multi-criteria analysis was also performed to evaluate suitable locations based on various climatic, topographical, and infrastructural factors influencing solar and wind energy production potentials and economics. The major findings of this study are as follows:
- Ten grid-connected hybrid system designs combining solar PV, wind turbines, and battery storage were simulated and optimized using the HOMER Grid software.
- Techno-economic evaluation showed that a PV-only system with an 850 MW capacity achieved the lowest NPC of USD 201 million and LCOE of 0.0344 USD/kWh, making it the most cost-effective solution. Despite the fact that solar PV systems offer economic advantages and efficient energy production, their spatial requirements are a significant consideration. PV installations demand considerable land area, which can be a limitation in regions with competing land use pressures such as agriculture, urban development, or conservation. Nevertheless, the advantages of PV systems often outweigh this concern. In Saudi Arabia, the availability of vast free land mitigates concerns about the spatial footprint of solar PV systems. The country’s extensive arid and semi-arid landscapes provide ample space for the deployment of large-scale solar farms. However, the benefits that solar PV offers in terms of energy generation and cost-effectiveness outweigh this consideration.
- A hybrid WT–PV configuration of 212.5 MW WT and 637.5 MW PV was also proposed to support local manufacturing objectives.
- Sensitivity analysis demonstrated the robustness of the results under variations in key parameters like solar irradiation, wind speed, temperature, and load demand.
- All proposed systems provided over a 91% renewable energy contribution to meet Yanbu city’s load while reducing CO2 emissions by 53% compared to grid supply only.
- Up to 1152 jobs were estimated to be created through the development of renewable energy projects in Yanbu city.
Based on the findings, the following recommendations are proposed:
- Integrate large-scale energy storage solutions to further enhance grid flexibility and accommodate higher renewable energy penetration levels.
- Perform time series simulations considering intra-hour solar–wind complementarity patterns to optimize hybrid system component sizing.
- Develop regional renewable energy master plans integrating the multiple nearby suitable sites identified through this study.
- Conduct further techno-economic analyses incorporating demand response strategies and evolving power market conditions.
This study provides valuable insights for the effective planning and implementation of utility-scale renewable energy projects aimed at transitioning Yanbu city towards a greener energy future. However, future studies should consider the following recommendations to enhance the applied methodology:
- Incorporate Dynamic Modeling: Future research could benefit from dynamic modeling that accounts for real-time changes in environmental and economic conditions to provide more robust and adaptable solutions.
- Expand Geographical Scope: Similar studies should be conducted in various regions with different climatic and topographical features to generalize the findings and enhance their applicability.
- Advanced Data Analytics: Advanced data analytics and machine learning techniques can be utilized to improve the accuracy and predictive capabilities of the models used in techno-economic assessments.
- Policy Analysis: A thorough analysis of potential policy changes and their impacts on the feasibility and sustainability of renewable energy systems should be performed.
- Broader Social Impact Assessment: The assessment of social impacts can be expanded to include community acceptance, potential displacement, and other socio-economic factors that may influence the deployment of renewable energy projects.
- Waste Management Strategy for PV Systems: The long-term sustainability of PV systems extends beyond their operational efficiency to include the management of waste generated at the end of their life cycle. Establishing a comprehensive waste management strategy for the disposal and recycling of PV panels is essential, particularly given their lifespan of 25 to 30 years. In Yanbu city, integrating circular economy principles can facilitate responsible disposal and recycling, involving collaboration with manufacturers and recycling facilities to ensure that materials are reclaimed and reused.
These future research suggestions can provide a more comprehensive understanding of the challenges and opportunities in deploying hybrid renewable energy systems, leading to more effective and sustainable energy solutions.
Author Contributions
Conceptualization, S.M.Y., A.A.A. and S.A.; methodology, S.M.Y., A.A.A. and S.A.; software, S.M.Y. and A.A.I.; validation, S.M.Y. and A.A.I.; formal analysis, S.M.Y. and F.H.; investigation, S.M.Y. and A.A.A.; resources, S.A. and M.R.; data curation, M.R. and A.A.I.; writing—original draft preparation, S.M.Y. and A.A.I.; writing—review and editing, A.A.A., S.A. and F.H.; visualization, M.R. and F.H.; supervision, A.A.A. and M.R.; project administration, M.R. and F.H.; funding acquisition, M.R. and F.H. All authors have read and agreed to the published version of the manuscript.
Funding
This Project was funded by the Deanship of Scientific Research (DSR) at King Abdulaziz University, Jeddah, under grant no. (GPIP: 1895-135–2024).
Institutional Review Board Statement
Not applicable.
Informed Consent Statement
Not applicable.
Data Availability Statement
The article contains the data.
Acknowledgments
This Project was funded by the Deanship of Scientific Research (DSR) at King Abdulaziz University, Jeddah, under grant no. (GPIP: 1895-135–2024). The authors, therefore, acknowledge with thanks DSR for technical and financial support.
Conflicts of Interest
The authors declare no conflicts of interest.
References
- Ministry of Energy Gate Saudi Ministry of Energy. Renewable Energy. Available online: https://www.moenergy.gov.sa/ar/OurPrograms/RenewableEnergy/Pages/default.aspx (accessed on 29 June 2024).
- Imam, A.A.; Al-Turki, Y.A.; Sreerama Kumar, R. Techno-Economic Feasibility Assessment of Grid-Connected PV Systems for Residential Buildings in Saudi Arabia-A Case Study. Sustainability 2020, 12, 262. [Google Scholar] [CrossRef]
- Alghamdi, O.A.; Alhussainy, A.A.; Alghamdi, S.; AboRas, K.M.; Rawa, M.; Abusorrah, A.M.; Alturki, Y.A. Optimal Techno-Economic-Environmental Study of Using Renewable Energy Resources for Yanbu City. Front. Energy Res. 2023, 10, 1115376. [Google Scholar] [CrossRef]
- Zidan, A.; Gabbar, H.A. A Zidan; Gabbar, H.A.Comparative analyses of scheduling scenarios to facilitate optimal operation of interconnected micro energy grids. In Proceedings of the 2017 IEEE International Conference on Smart Energy Grid Engineering (SEGE), Oshawa, ON, Canada, 14–17 August 2017; pp. 90–95. [Google Scholar] [CrossRef]
- Renewable energy project development office. Saudi Arabia National Renewable Energy Program. Available online: https://powersaudiarabia.com.sa/web/index.html (accessed on 17 November 2024).
- Piotr Bojek Iea. Available online: https://www.iea.org/energy-system/renewables/solar-pv#tracking (accessed on 17 November 2024).
- Piotr Bojek Iea. Available online: https://www.iea.org/energy-system/renewables/wind#tracking (accessed on 17 November 2024).
- Khan, M.J.; Yadav, A.K.; Chatterji, S.; Mathew, L. Techno Economic Analysis of PV-Wind-Grid Connected Systems for Power Generation in India. In Proceedings of the 2015 Annual IEEE India Conference (INDICON), New Delhi, India, 17–20 December 2015; IEEE: Piscataway, NJ, USA, 2015; pp. 1–5. [Google Scholar]
- Ritu, K.R.; Wadhwani, A.K.; Rajoria, A. Techno-Economic Comparison of On Grid and Off Grid Hybrid WT/Solar Photo Voltaic Connected Power Generating Unit Using HOMER. In Proceedings of the 2018 International Conference on Advanced Computation and Telecommunication (ICACAT), Bhopal, India, 28–29 December 2018; IEEE: Piscataway, NJ, USA, 2018; pp. 1–9. [Google Scholar]
- Oueslati, H.; Ben Mabrouk, S.; Ben Mabrouk, A.; La Cascia, D.; Zizzo, G.; Dusonchet, L.; Favuzza, S.; Massaro, F. Feasibility Analysis and Study of a Grid-Connected Hybrid Electric System: Application in the Building Sector. In Proceedings of the 2016 IEEE 16th International Conference on Environment and Electrical Engineering (EEEIC), Florence, Italy, 7–10 June 2016; IEEE: Piscataway, NJ, USA, 2016; pp. 1–6. [Google Scholar]
- Ahmed, P.; Rahman, M.F.; Mahmudul Haque, A.K.M.; Mohammed, M.K.A.; Ishraque Toki, G.F.; Ali, M.H.; Kuddus, A.; Rubel, M.H.K.; Hossain, M.K. Feasibility and Techno-Economic Evaluation of Hybrid Photovoltaic System: A Rural Healthcare Center in Bangladesh. Sustainability 2023, 15, 1362. [Google Scholar] [CrossRef]
- Nkambule, M.S.; Hasan, A.N.; Shongwe, T. Performance and Techno-Economic Analysis of Optimal Hybrid Renewable Energy Systems for the Mining Industry in South Africa. Sustainability 2023, 15, 16766. [Google Scholar] [CrossRef]
- Pavan Kumar, Y.V.; Bhimasingu, R. Renewable Energy Based Microgrid System Sizing and Energy Management for Green Buildings. J. Mod. Power Syst. Clean Energy 2015, 3, 1–13. [Google Scholar] [CrossRef]
- Nurunnabi, M.; Roy, N.K.; Hossain, E.; Pota, H.R. Size Optimization and Sensitivity Analysis of Hybrid Wind/PV Micro-Grids- A Case Study for Bangladesh. IEEE Access 2019, 7, 150120–150140. [Google Scholar] [CrossRef]
- Shezan, S.A.; Ishraque, M.F.; Muyeen, S.M.; Abu-Siada, A.; Saidur, R.; Ali, M.M.; Rashid, M.M. Selection of the Best Dispatch Strategy Considering Techno-Economic and System Stability Analysis with Optimal Sizing. Energy Strategy Rev. 2022, 43, 100923. [Google Scholar] [CrossRef]
- Nallolla, C.A.; Vijayapriya, P. Optimal Design of a Hybrid Off-Grid Renewable Energy System Using Techno-Economic and Sensitivity Analysis for a Rural Remote Location. Sustainability 2022, 14, 15393. [Google Scholar] [CrossRef]
- Aziz, A.S.; Tajuddin, M.F.N.; Zidane, T.E.K.; Su, C.L.; Mas’ud, A.A.; Alwazzan, M.J.; Alrubaie, A.J.K. Design and Optimization of a Grid-Connected Solar Energy System: Study in Iraq. Sustainability 2022, 14, 8121. [Google Scholar] [CrossRef]
- Saqr, A.M.; Nasr, M.; Fujii, M.; Yoshimura, C.; Ibrahim, M.G. Delineating Suitable Zones for Solar-Based Groundwater Exploitation Using Multi-Criteria Analysis: A Techno-Economic Assessment for Meeting Sustainable Development Goals (SDGs). Groundw. Sustain. Dev. 2024, 25, 101087. [Google Scholar] [CrossRef]
- Abd-Elmaboud, M.E.; Saqr, A.M.; El-Rawy, M.; Al-Arifi, N.; Ezzeldin, R. Evaluation of Groundwater Potential Using ANN-Based Mountain Gazelle Optimization: A Framework to Achieve SDGs in East El Oweinat, Egypt. J. Hydrol. Reg. Stud. 2024, 52, 101703. [Google Scholar] [CrossRef]
- Saqr, A.M.; Nasr, M.; Fujii, M.; Yoshimura, C.; Ibrahim, M.G. Monitoring of Agricultural Expansion Using Hybrid Classification Method in Southwestern Fringes of Wadi El-Natrun, Egypt: An Appraisal for Sustainable Development; Springer: Singapore, 2023; pp. 349–362. [Google Scholar]
- Saqr, A.M.; Nasr, M.; Fujii, M.; Yoshimura, C.; Ibrahim, M.G. Optimal Solution for Increasing Groundwater Pumping by Integrating MODFLOW-USG and Particle Swarm Optimization Algorithm: A Case Study of Wadi El-Natrun, Egypt; Springer: Singapore, 2023; pp. 59–73. [Google Scholar]
- Imam, A.A.; Abusorrah, A.M.; Marzband, M. Potential of Concentrated Solar Power in the Western Region of Saudi Arabia: A GIS-Based Land Suitability Analysis and Techno-Economic Feasibility Assessment. IEEE Access 2024, 12, 1570–1598. [Google Scholar] [CrossRef]
- Lu, Y.; Khan, Z.A.; Alvarez-Alvarado, M.S.; Zhang, Y.; Huang, Z.; Imran, M. A Critical Review of Sustainable Energy Policies for the Promotion of Renewable Energy Sources. Sustainability 2020, 12, 5078. [Google Scholar] [CrossRef]
- Imam, A.A.; Abusorrah, A.; Marzband, M. Potentials and Opportunities of Solar PV and Wind Energy Sources in Saudi Arabia: Land Suitability, Techno-Socio-Economic Feasibility, and Future Variability. Results Eng. 2024, 21, 101785. [Google Scholar] [CrossRef]
- Ministry of Energy Gate Saudi Ministry of Energy. Available online: https://www.moenergy.gov.sa/en/DigitalDocuments/OpenData/Pages/default.aspx (accessed on 29 June 2024).
- SEC Website Saudi Electricity Company. Available online: https://www.se.com.sa/en/Ourservices/ColumnC/Bills-and-Consumption/ConsumptionTariffs (accessed on 29 June 2024).
- Website Saudi General Authority of Statistics. Available online: https://www.stats.gov.sa/en/news/475 (accessed on 29 June 2024).
- Ram, M.; Aghahosseini, A.; Breyer, C. Job Creation during the Global Energy Transition towards 100% Renewable Power System by 2050. Technol Forecast. Soc Chang. 2020, 151, 119682. [Google Scholar] [CrossRef]


Disclaimer/Publisher’s Note: The statements, opinions and data contained in all publications are solely those of the individual author(s) and contributor(s) and not of MDPI and/or the editor(s). MDPI and/or the editor(s) disclaim responsibility for any injury to people or property resulting from any ideas, methods, instructions or products referred to in the content. |
© 2024 by the authors. Licensee MDPI, Basel, Switzerland. This article is an open access article distributed under the terms and conditions of the Creative Commons Attribution (CC BY) license (https://creativecommons.org/licenses/by/4.0/).