Abstract
With rising populations and increasing food consumption, the demand for food is placing significant strain on freshwater resources. Exploring crops that can thrive under saline conditions is crucial to ensuring food security. Although brackish and seawater is abundant, it is generally unsuitable for irrigation. However, some plants exhibit tolerance to moderate levels of salinity. This study investigated the effects of varying light intensities (150 and 250 photosynthetic photon flux densities) and salinity levels (<1.5, 5, 10, and 17 parts per thousand, equivalent to <26, 86, 171, and 291 millimolars) on the growth and nutrient composition of Russian kale (Brassica oleracea) grown in indoor hydroponics. The experiment was conducted over five months, from September 2023 to January 2024. The results revealed that a light intensity of 250 PPFD and salinity levels of <1.5–5 ppt (<26–86 mM) were optimal for maximizing the biomass yield of the kale, whereas a significant reduction in the yield was observed at salinity levels exceeding 10 ppt (171 mM). In contrast, the dry matter percentage was significantly higher at 17 ppt (291 mM). The macronutrient contents, particularly the total Kjeldahl nitrogen (TKN), total phosphorus (TP), and magnesium (Mg), were consistent across both light intensities (150–250 PPFDs) and at salinity levels between <1.5 and 10 ppt (<26–171 mM) but were reduced at 17 ppt (291 mM). The micronutrient concentrations, such as those of copper (Cu), iron (Fe), and zinc (Zn), were higher at the lower light intensity (150 PPFD) across the salinity levels. These findings suggest that optimizing the light conditions is essential for enhancing the nutritional value of kale in saline environments. These outcomes are particularly vital for improving agricultural productivity and resilience in salt-affected regions, thereby supporting broader food security and sustainability goals.
1. Introduction
The global population, which reached 7.9 billion in 2022, is projected to grow to 8.5 billion by 2030 and to nearly 10 billion by 2050 [1], necessitating a significant increase in crop production to meet rising food demands. However, the growing prevalence of salinization poses a major challenge to agricultural productivity worldwide. Salinization, exacerbated by climate change, prolonged droughts, and rising sea levels, is reducing the area of arable land suitable for conventional farming. Drought conditions intensify the accumulation of salts in the soil by limiting the natural leaching of saline water, while rising sea levels contribute to salt intrusion into coastal farmlands. These processes collectively result in significant crop losses and degraded soil quality, jeopardizing global food security [2]. Today, more than 1.2 billion hectares of topsoil and subsoil are affected by salinization, with this area expanding by approximately 1.5 million hectares yearly [3]. In addition, marine and brackish aquaculture produces saline water with excess nutrients. Salinity can suppress plant growth and development and degrades the soil quality for most edible crops. Exploring crops that can thrive under saline conditions and that use abundant saline water is crucial to ensuring food security and water preservation. One promising solution lies in the cultivation of salt-tolerant crops. Kale (Brassica oleracea), a member of the Brassicaceae family, has been identified as a potential candidate for saline agriculture due to its moderate tolerance to salinity. Known for its nutritional benefits, kale is rich in vitamins A, C, and K, as well as essential minerals such as calcium and iron, making it a “superfood” [4,5,6,7]. Kale is also rich in bioactive phytochemicals, such as carotenoids, phenolic compounds, and the sulfur-containing phytonutrients known as glucosinolates. These compounds benefit human health, offer anti-cancer and anti-inflammatory properties, and contribute to plants’ resilience against environmental stressors [5,8]. Moreover, the United States Department of Agriculture (USDA) has compiled numerous nutritional benefits in its database, including protein, carbohydrates, fiber, lipids, and folic acids [9]. The adaptability of kale to maintain growth and yields at moderate salinity levels makes it suitable for cultivation in areas where traditional crops may fail [6]. This adaptability is critical in a changing climate and with shrinking arable land, where crops must be resilient to abiotic stresses and salinized soils.
Light intensity influences kale’s growth, morphology, and nutritional quality [10,11]. In a controlled-room experiment on baby leaf kale, conducted under 25/20 °C day/night temperatures and a 16 h photoperiod, supplemental lighting was applied to a base 300 PPFD white fluorescent light for 12 days. The supplemental lights included UV-A, B, G, R, and far-red (FR) LEDs at 18, 130, 130, 130, and 160 PPFDs, respectively. This treatment increased the anthocyanin concentrations by 11% and 31% with UV-A and B light, respectively, carotenoids by 12% with blue light, and phenolics by 6% with red light. In contrast, far-red light reduced the anthocyanins by 40%, carotenoids by 11%, and chlorophyll by 14% but significantly enhanced the growth metrics, including the fresh weight (28%), dry weight (15%), and leaf size (44% longer and 15% wider leaves) [12]. Similarly, “Winterbor” kale grown in nutrient solution culture within growth chambers at irradiance levels of 125, 200, 335, 460, and 620 PPFDs showed the highest tissue concentrations of lutein, β-carotene, and chlorophyll at 335 PPFD, with significant differences in the lutein and β-carotene accumulation observed across the irradiance levels [13].
While salinity is an environmental stressor that negatively impacts plant health [6,14,15,16], applying controlled abiotic stresses could improve the health benefits of kale [17]. Previous studies have shown that kale moderately tolerates salt stress under intermittent salt application. However, its growth under continuous exposure to saline environments, such as those found in salinized soils near coastal areas, has not yet been investigated [18,19,20]. Thus, we conducted this study to examine the effects of varying light intensities and salinity levels on the kale growth and nutrient composition in indoor hydroponics. We hypothesized that there would be a significant effect of the light intensity, salinity, and their interactions on the kale growth, yield, and nutrient composition. Understanding the combined effects of salinity and light intensity in cultivating kale will provide information that can enhance its productivity in regions affected by salt intrusion.
2. Materials and Methods
Study site. This study was conducted at the D. S. Weaver Laboratory, Department of Biological and Agricultural Engineering, North Carolina State University, Raleigh, NC, USA, from September 2023 to January 2024. The experiment occurred in a semi-controlled room with an ambient temperature of 21 ± 2 °C and relative humidity levels between 35 to 65% throughout the observation period. The carbon dioxide (CO2) concentration was measured between 375 and 480 parts per million (ppm).
Experimental design. A simplified non-recirculating Kratky hydroponics method was adapted for this experiment [21]. The Kratky method is a non-circulating hydroponic technique that requires no electricity, pumps, or active water circulation, making it a simple and energy-efficient approach to growing plants. This system uses a container filled with a sufficient amount of nutrient solution wherein the seedlings are placed in net pots with a growing medium, supported by a cover over the container. Initially, a one-half portion of the net pot is immersed in the nutrient solution, which provides water and nutrients to the plants through capillary action. The water level in the boxes was adjusted to partially submerge the plant roots, ensuring they had access to both water and oxygen. This is a crucial technique of the Kratky method, which facilitates the healthy development of the roots [20]. Three plants were grown in six-liter plastic boxes at a 15 cm distance, each representing an experimental unit. The experiment was conducted in triplicate and randomly arranged in a split-plot design, with the light intensity as the main plot factor (A) and the salinity as the sub-plot factor (B). The light intensity treatments were A1 (150 PPFD) and A2 (250 PPFD), and the salinity levels included B1 (<1.5 ppt, ~26 mM), B2 (5 ppt, ~86 mM), B3 (10 ppt, ~171 mM), and B4 (17 ppt, ~191 mM). Split-plot design is commonly used for experiments with multiple-level factors to provide a more robust statistical analysis of the treatment effects [22]. The salinity ranges were selected to simulate brackish water and to determine the extent of the salinity tolerance of the white Russian kale variety. The plants were not exposed to salt stress from germination through the seedling stage. After two weeks in the hydroponic boxes, the plants’ root systems were established. Salt was then added to the nutrient-rich water at the desired amount to meet the salinity level treatments. One gram of Instant Ocean salt for every liter of tap water produced 1 ppt of saltwater. The experiment spanned 15 weeks, from seed germination to data collection.
Preparation of plant material. A White Russian kale variety was used for this study. The variety can withstand frost, and its flavor and sweetness are enhanced after exposure to cold [23]. The seeds were collected from a local garden in Raleigh, NC, USA, and germinated in a coco coir–perlite media combination. After 7 days of germination, seedlings of the same size and vigor were chosen and transplanted into a 1-inch rock wool cube and placed into a 1-½-inch net pot. The seedlings were grown in nutrient-rich water for 15 more days and were finally transplanted into the hydroponic boxes. The electrical conductivity (EC) during the seedling stage was maintained at 1.0 to 1.2 mS/cm, ensuring a sufficient but not too concentrated solution that could injure the roots of the sensitive seedlings [24].
Culture management. The kale seedlings were transplanted into hydroponic boxes 23 days after germination. The EC was maintained at 1.2 to 1.5 mS/cm for the first two weeks of growth and was gradually increased to 1.8 mS/cm for one month and then to 2.5 mS/cm after that until the end of the experiment. The plants were nourished with a hydroponic nutrient produced by GENERAL HYDROPONICS (Santa Rosa, CA, USA). The product consists of three components: FloraGro, FloraBloom, and FloraMicro. FloraGro provided 2.0% total nitrogen (N), 1.0% phosphate (P2O5), 6.0% potash (K2O), and 0.5% magnesium (Mg). FloraBloom contained 5.0% phosphate (P2O5), 4.0% potash (K2O), 1.5% magnesium (Mg), and 1.0% sulfur (S). FloraMicro contained 5.0% total nitrogen (N), 1.0% potash (K2O), and 1.0% calcium (Ca), along with an array of essential micronutrients, including 0.0005% cobalt (Co), 0.01% chelated copper (Cu), 0.1% chelated iron (Fe), 0.05% chelated manganese (Mn), 0.0008% molybdenum (Mo), and 0.015% chelated zinc (Zn). Combining 2 mL of each hydroponic nutrient with one liter of fresh tap water resulted in an EC of 2.3–2.5 mS/cm. The EC was measured using a multi-tester device (ExStik EC500, EXTECH Instruments, Waltham, MA, USA). The water temperature and pH levels were monitored using the same device.
The water temperature was measured at 19.5 to 23.5 °C, and the pH levels ranged from 5.4 to 7.2 throughout the growth period. The optimal temperature range for growing kale in a plant factory was reported to be between 20 and 23 °C [25], while under greenhouse conditions, it was 18–28 °C [26]. The EC and pH levels were continuously checked and altered as necessary to maintain the conditions. The pH modifications were performed by changing the water in the hydroponic box every two weeks, whenever it fell below 5.6 or exceeded 6.8, corresponding to the optimal pH range [24]. When dead roots accumulated and decomposed in the box, the water pH and dissolved oxygen (DO) levels decreased [27]. Algae growth also reduced the amount of dissolved oxygen in the water. Replacing the water in the hydroponic box every two weeks corrected these issues. The water salinity levels were regulated by incorporating sea salt obtained from Instant Ocean (Blacksburg, VA, USA) and were monitored using a PINPOINT Salinity Monitor (American Marine Inc., Ridgefield, CT, USA). When one gram of salt is combined with one liter of water, the resulting salinity level of the water is 1 ppt (17 mM). Throughout the experiment, constant monitoring and replenishing of the water with that of the same quality were carried out to ensure that the necessary salinity and electrical conductivity (EC) levels were maintained.
The kale plants were illuminated using 8–60 W T8 LED lights (6 FT, 8000 LM, 6000 K Cool White, V-Shape, Linkable T8 LED Ceiling Light Fixtures, SHOPLED). The LED lights were installed 10 cm apart. The light intensity was monitored and maintained at 150 and 250 PPFDs using a light meter (Modell LT45, EXTECH). Frequent manual adjustments were made as the plants grew to retain a 20 cm distance of the light fixtures from the topmost leaves of the plants. A 14 h daily photoperiod was maintained throughout the growing period.
Measurement of crop growth, yield, and water consumption. The plant height, leaf length and width, and stem diameter were measured biweekly using a standard ruler and caliper. The number of leaves was recorded at the same frequency. The plant height was measured from the rim of the net pot to the tip of the tallest leaf. The leaf length was recorded from the base of the stalk to the tip of the leaf blade, while the leaf width was taken at the widest point of the harvested leaves. The number of leaves included only those that were fully developed. Harvesting of leaves was conducted every two weeks one month after transplanting. The fresh weight was recorded immediately upon harvest, and the dry biomass was determined by oven drying it at 60 °C for 24 h until a constant weight was achieved [28]. The fresh biomass included the whole parts of the leaves, from the stalk to the leaf blade. Water consumption was measured by recording the volume of water added to the hydroponic box throughout the experiment. At the end of the study, the total water consumption was calculated by summing all the water added, minus the remaining water volume in the hydroponic box.
Nutrient content analysis in plant leaves. The oven-dried leaves were pulverized using a mortar and pestle until powdered samples were achieved and filtered using a 300-micron sieve. The powder samples with at least 1 g each were subjected to nutrient analysis for the total nitrogen (N), phosphorus (P), sodium (Na), potassium (K), calcium (Ca), magnesium (Mg), copper (Cu), zinc (Zn), iron (Fe), and manganese (Mn). The total N was determined using the total Kjeldahl nitrogen (TKN) method [19], while the P was determined by the ascorbic acid–phosphomolybdate method. The rest (Na, K, Ca, Mg, Cu, Zn, Fe, and Mn) were analyzed using inductively coupled plasma optical emission spectrometry (ICPOES) [29]. Laboratory analyses were conducted at the Environmental Analysis Laboratory (EAL), Department of Biological and Agricultural Engineering, North Carolina State University, Raleigh, NC, USA. The nutrient content was expressed in mg/g of dry weight.
Statistical analysis. A two-way analysis of variance (ANOVA) was employed to examine the effects of the two main factors, the light intensity and salinity, in response to the kale growth, yield, and nutrient composition. The experiment consisted of two levels of light intensity (Factor A: 150 and 250 PPFDs) and four levels of salinity (Factor B: <1.5, 5, 10, and 17 ppt, equivalent to <26, 86, 171, and 291 mM), with each combination replicated three times. The significance of the differences between the means was determined using Tukey’s Honest Significant Difference (HSD) test at a 5% significance level (p < 0.05). We also tested the normality of the residuals and homogeneity of variance using the Shapiro–Wilk test [30]. All statistical analyses were performed using R statistical software, version 4.3.2 (R Core Team, 2023) [31].
The following model was used for the analysis:
where Yijk is the response variable; μ is the overall mean; αi is the effects of the light intensity (Factor A); βj is the effects of the salinity (Factor B); (αβ)ij is the interaction effect between the light intensity and salinity; and ϵijk is the residual error term, assumed to follow a normal distribution with a mean of 0 and variance of σ2.
Yijk = μ+αi + βj + (αβ)ij + ϵijk
3. Results
3.1. Plant Growth Parameters (Plant Height, Leaf Length, Leaf Width, and Stem Diameter)
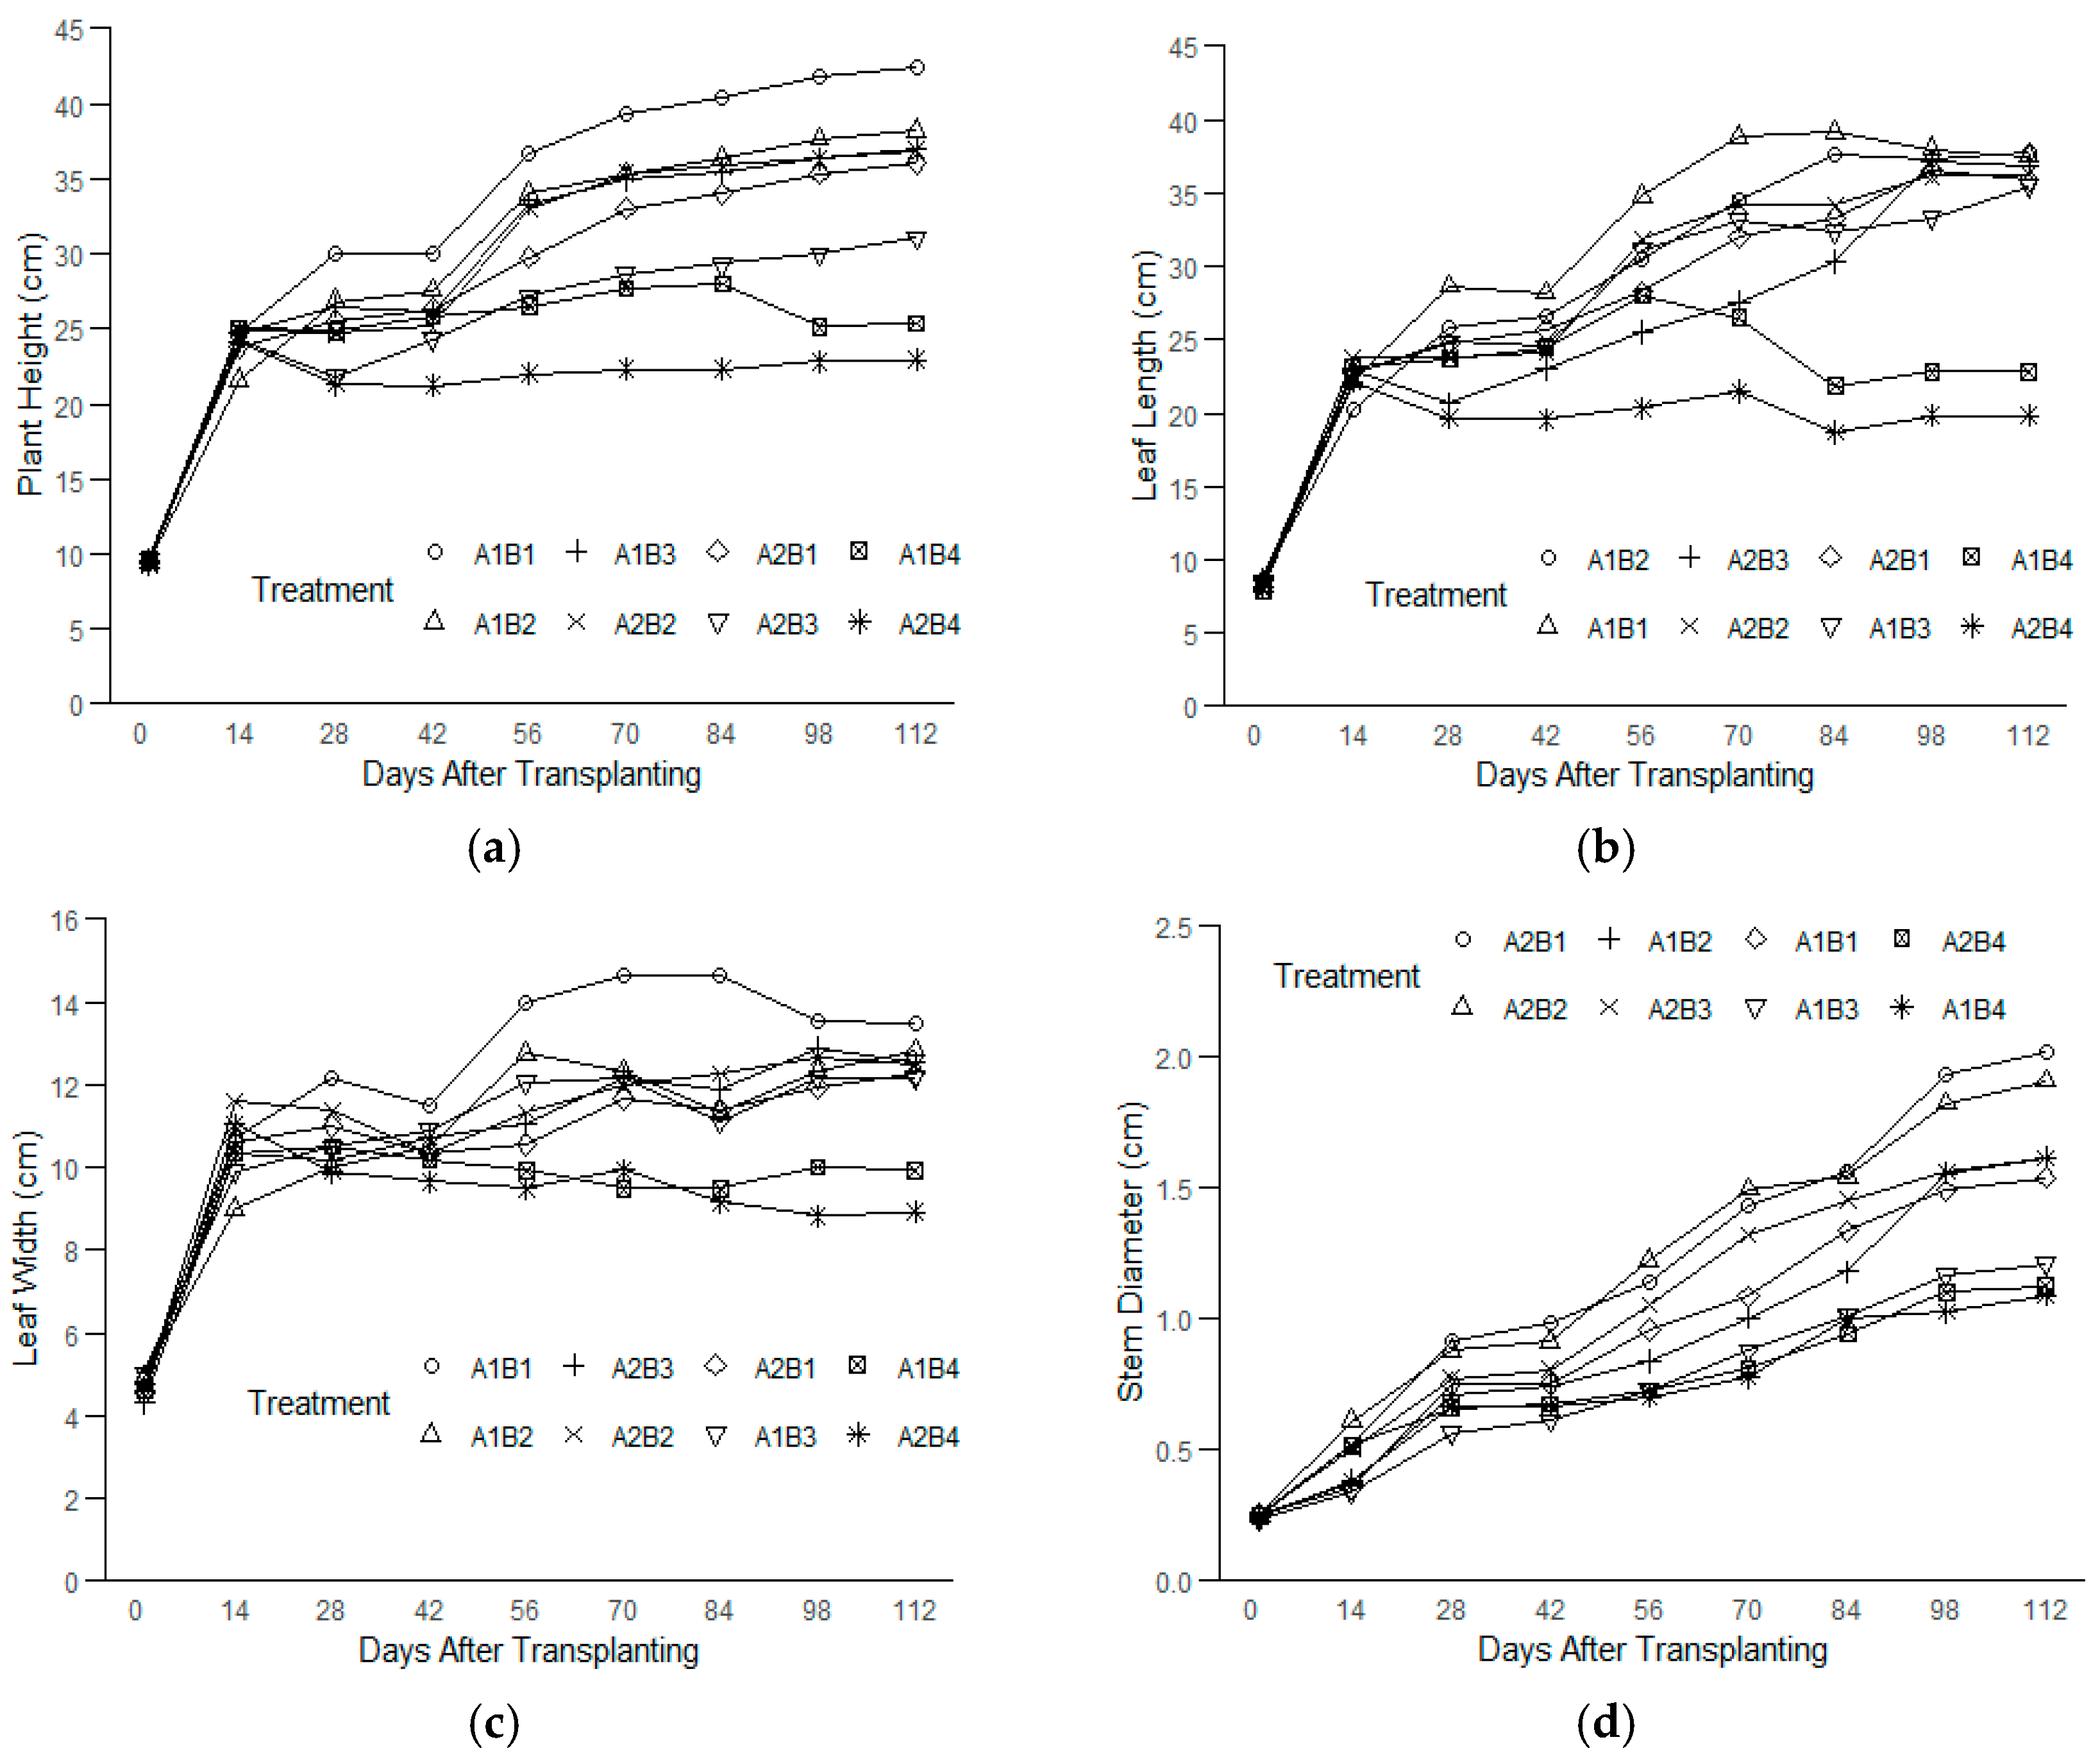
A rapid initial increase in the plant height was observed across all the treatment combinations from 0 to 14 days after transplanting (DAT), after which the growth rates began to slow (Figure 1a). The growth appeared to plateau after 56 DAT in most treatments, suggesting a reduction in the growth rates due to the treatments applied. A similar pattern was noted for the leaf length, with rapid growth in all the treatments from 0 to 14 DAT. However, only plants grown under salinity levels of <1.5–10 ppt (<26–171 mM) across both light intensities continued to grow steadily until 70 DAT, followed by a plateau (Figure 1b). In contrast, plants under the highest salinity level (17 ppt, ~291 mM) at both light intensities began to show a reduction in their leaf lengths between 14 and 28 DAT, followed by stagnation up to 70 DAT and further decline towards the end of the experiment.
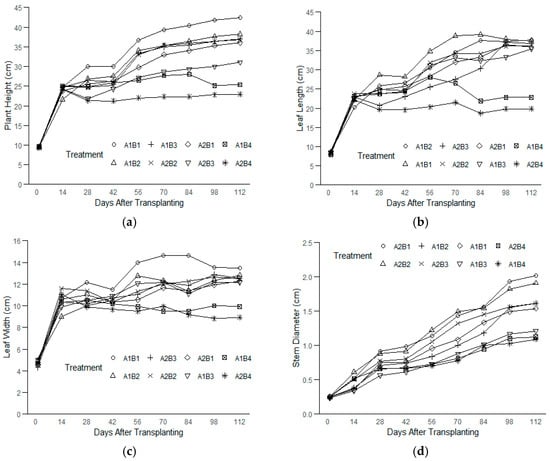
Figure 1.
The plant growth parameters of kale measured over time from 0 to 112 DAT under treatment combinations of light intensities (150 and 250 PPFDs) and salinity levels (<1.5, 5, 10, and 17 ppt, equivalent to <26, 86, 171, and 291 mM) with three replications each: (a) plant height; (b) leaf length; (c) leaf width; and (d) stem diameter.
The leaf width also rapidly developed during the first two weeks (Figure 1c). While the plants under moderate salinity levels (<1.5–10 ppt, ~<26–171 mM) across both light intensities maintained slow but steady growth in terms of their leaf widths, the plants subjected to the highest salinity (17 ppt, ~291 mM) exhibited a decline in their leaf widths from 14 DAT, ultimately showing negative growth by 112 DAT. Unlike the other growth parameters, the stem diameter steadily increased across all the treatments, with a slight slowdown between 28 and 42 DAT, but continued growth was maintained through 112 DAT (Figure 1d).
At the end of the experiment, the plants under the treatment combination of the 150 PPFD and <1.5 ppt (<26 mM) salinity levels (A1B1) were 85% taller than the smallest plant, which was grown under the 250 PPFD and 17 ppt (291 mM) treatment combination (A2B4) (Table 1). Further analysis using Tukey’s HSD revealed that the kale plants under the lowest salinity (<1.5 ppt, ~26 mM) and lower light intensity (150 PPFD) were significantly taller than those in 17 ppt (291 mM) under the lower light intensity (150 PPFD) and in 10–17 ppt (171–291 mM) under the higher light intensity (250 PPFD). These plants, however, were not statistically different from those in 5–10 ppt (86–171 mM) at the lower light intensity (150 PPFD) and those in <1.5–5 ppt (<26–86 mM) under the higher light intensity (250 PPFD). For the leaf length and width, the plants under the highest salinity (17 ppt, ~291 mM) and higher light intensity (250 PPFD) were significantly smaller; the rest are not statistically different. The plants under the 150 PPFD and <1.5 ppt (<26 mM) treatments had leaves 51% wider than those grown under the 250 PPFD and 17 ppt (291 mM) treatments. On average, the kale plants grown under the 150 PPFD and salinities between <1.5 and 5 ppt (<26–86 mM) had the longest leaves, about 86% longer than the shortest leaves of the plants grown under the 250 PPFD and 17 ppt (291 mM). The stem diameter showed more variations, with the plants under salinities between <1.5 and 5 ppt (<26–86 mM) at the higher light intensity (250 PPFD) having significantly larger stems than those in 10–17 ppt (171–291 mM) under the 150 PPFD and 17 ppt (291 mM) under the 250 PPFD. However, these plants have statistically similar stem sizes to those in <1.5–5 ppt (26–86 mM) under the 150 PPFD and 10 ppt (171 mM) under the 250 PPFD. By the end of the experiment, the stems of the plants under the 250 PPFD and <1.5 ppt (<26 mM) salinity were 85% larger than those with the smallest stems grown under the 250 PPFD and 17 ppt (291 mM).

Table 1.
Plant growth parameters during the 112-day experiments under different treatment combinations of light intensities (150 and 250 PPFDs) and salinity levels (<1.5, 5, 10, and 17 ppt, equivalent to <26, 86, 171, and 291 mM).
Table 2 highlights the significant impacts of both treatments—the light intensity and salinity—on all the plant growth parameters, including the plant height, leaf length, leaf width, and stem diameter, with the salinity having a more dominant influence. The salinity accounted for 64.54% of the total variance for the plant height, with a highly significant F-value of 26.10 (p < 0.0001). The light intensity contributed 17.87% of the variance, showing a highly significant F-value of 21.68 (p = 0.0003). The interaction between the light intensity and salinity explained only 4.4% of the variance, indicating non-significance, with an F-value of 1.78 (p = 0.1916). In the case of the leaf length, the salinity again emerged as the most influential factor, explaining 77.31% of the variance with a highly significant F-value of 34.21 (p < 0.0001), while the light intensity also had a significant impact, accounting for 8.34% of the variance (F = 11.072, p = 0.0043). The interaction effect was insignificant, contributing only 2.29% of the variance. The salinity impacted the leaf width substantially, explaining 64.65% of the variance (F = 23.46, p < 0.0001). Although the light intensity contributed only 4.95% of the variance, it is still significant, with an F-value of 5.393 (p = 0.0337). The interaction effect is highly significant, accounting for 15.70% of the variance, with an F-value of 5.69 (p = 0.0075). The salinity remained the dominant factor for the stem diameter, accounting for 59.40% of the variance (F = 18.268, p < 0.0001). The light intensity explained 17.73% of the variance, with a highly significant F-value of 16.357 (p = 0.0009). The interaction effect is insignificant, contributing only 5.53% of the variance.
Table 2.
Two-way ANOVA results for the effects of varying light intensities (150 and 250 PPFDs) and salinity levels (<1.5, 5, 10, and 17 ppt, equivalent to <26, 86, 171, and 291 mM) on plant growth parameters. The independent variables were the light intensity and salinity, and the plant growth parameters were the dependent variables. The percentage of variance that accounts for each factor was determined by partitioning the variance attributed to these factors and their interactions.
The error variance accounted for the portion of the dependent variables that the independent variables, the light intensity and salinity, could not explain. The errors associated with each parameter were moderate, with 13.19%, 12.05%, 14.70%, and 17.34% for the plant height, leaf length, leaf width, and stem diameter, respectively. Although these values accounted for the unexplained variability in the treatments, most of the variance was successfully explained and accounted for by the light intensity, salinity, and their interactions.
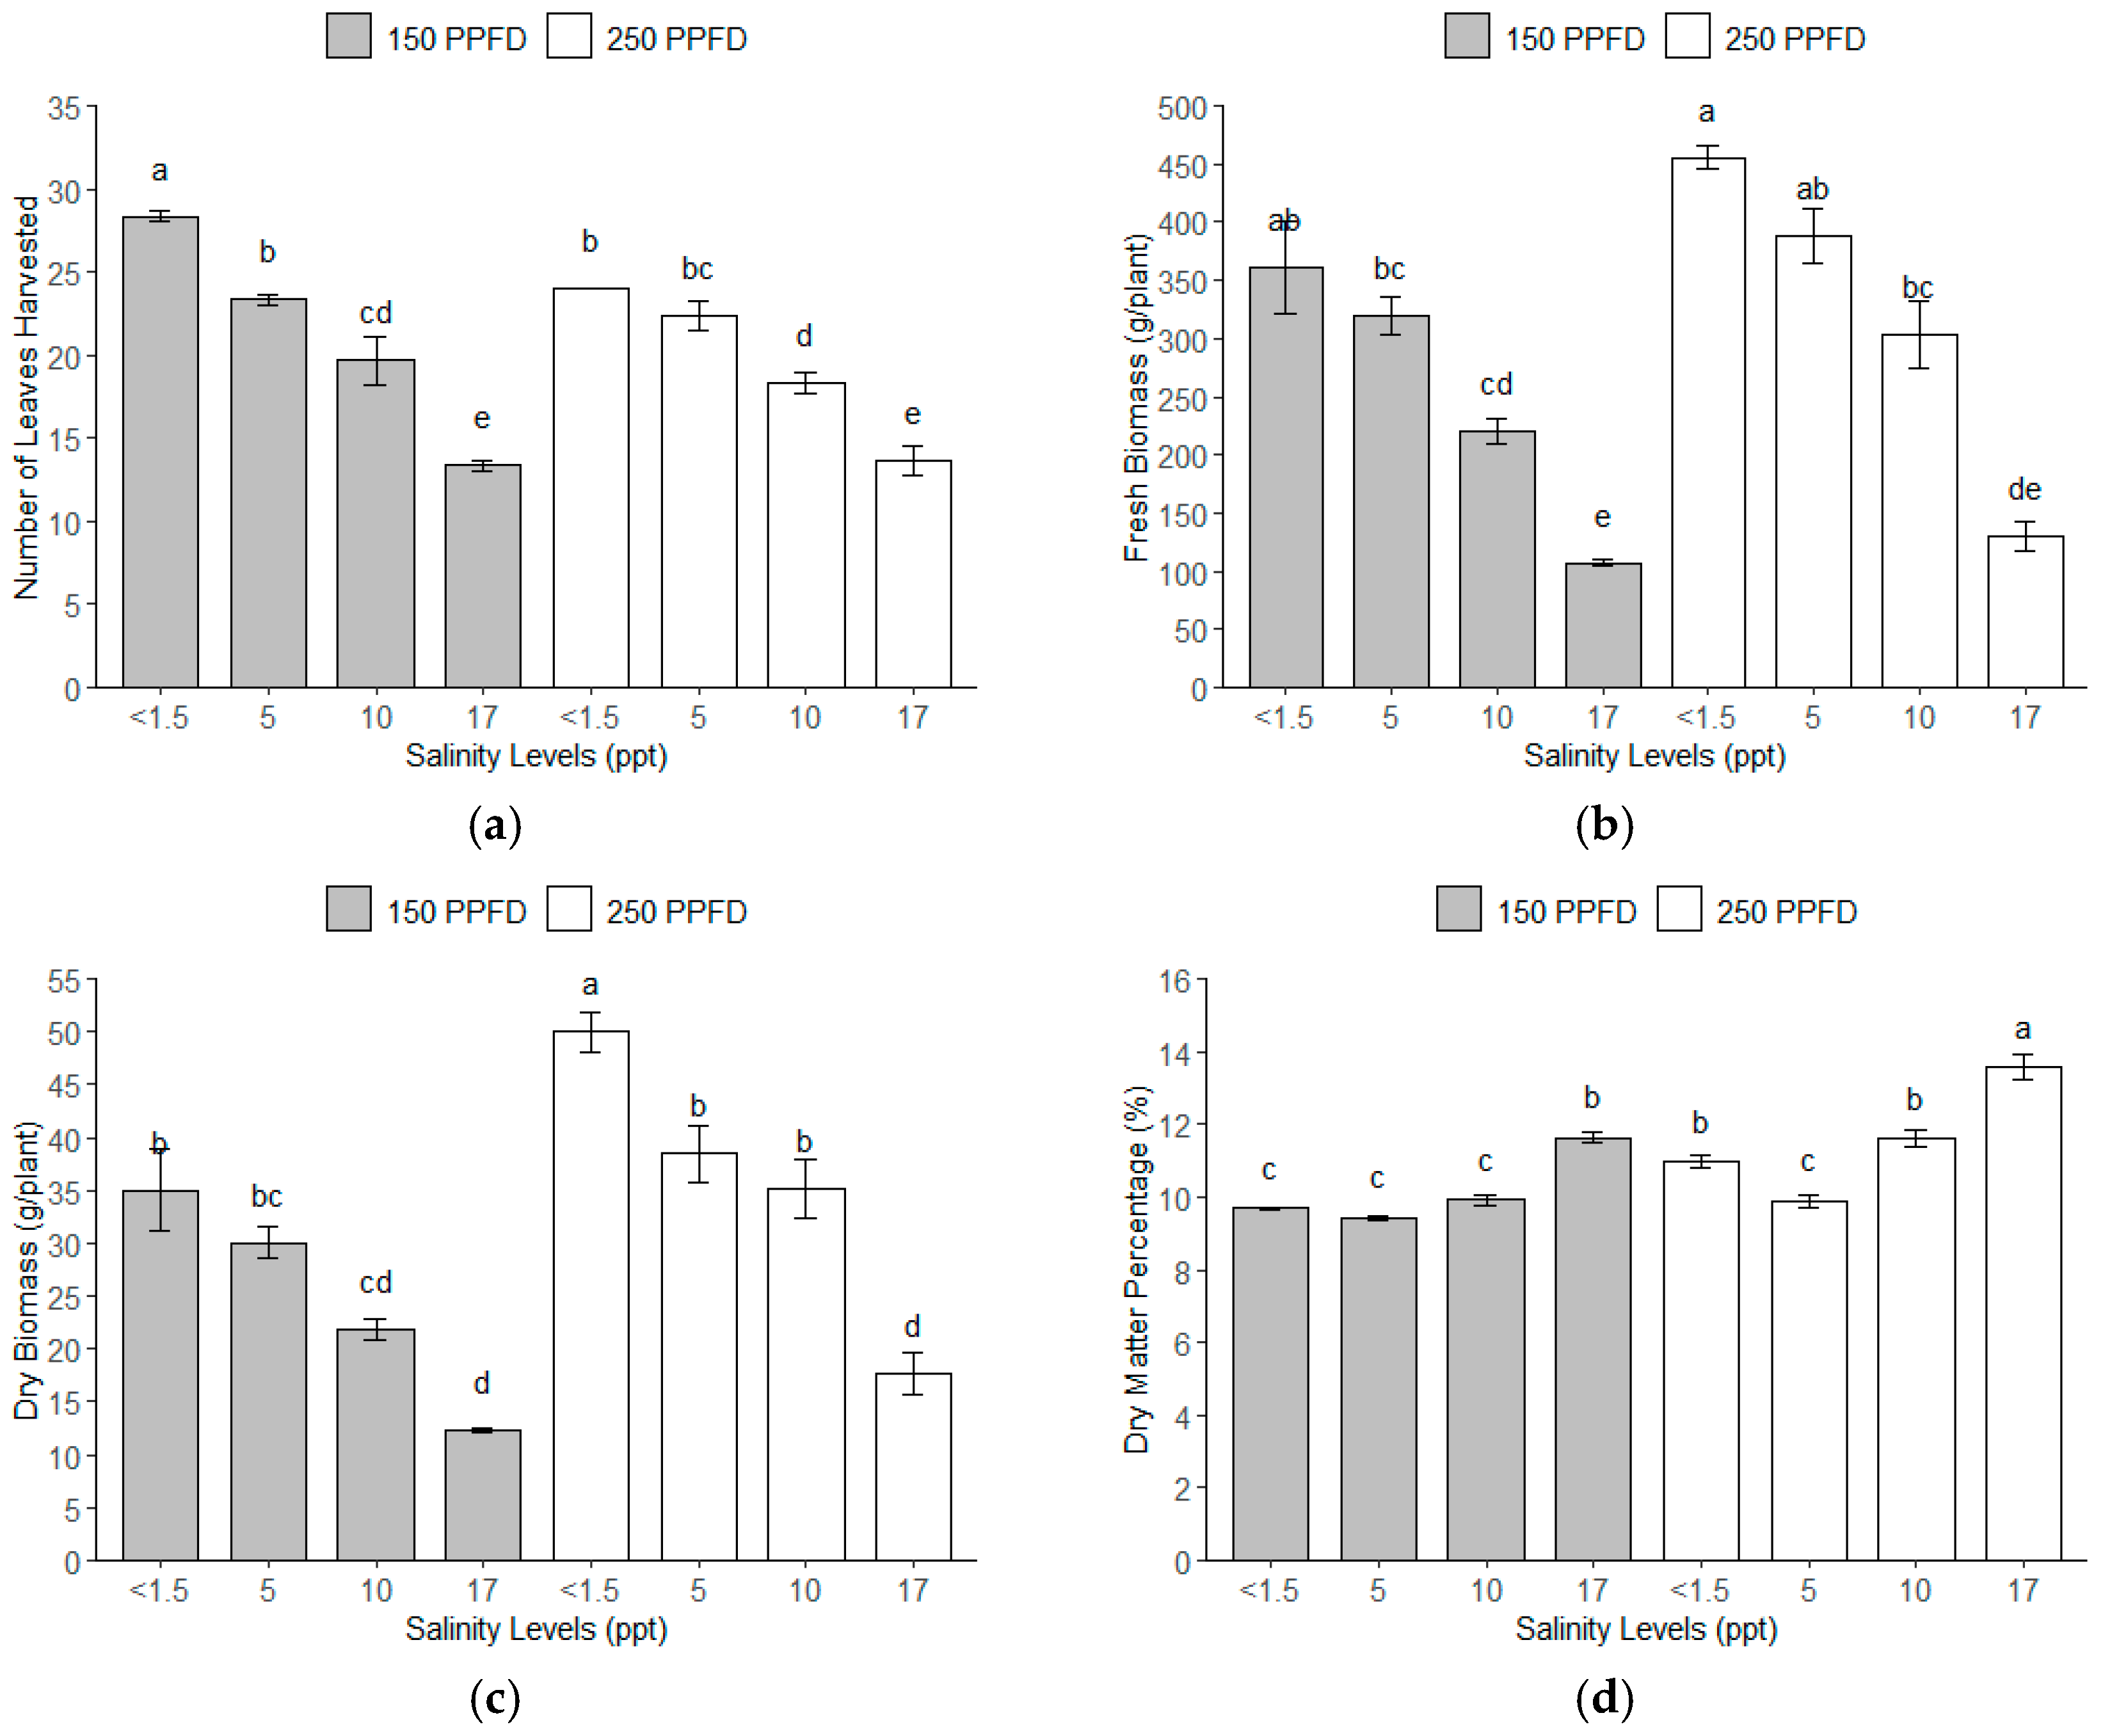
3.2. Yield Parameters (Number of Leaves, Fresh and Dry Biomass, and Dry Matter Percentage)
The total number of leaves harvested showed significant variation across the different light intensities and salinity levels (Figure 2a). Similarly, the fresh and dry biomass significantly responded to the light intensity and salinity levels (Figure 2b,c). Interestingly, the dry matter percentage increased with the salinity levels, as shown in Figure 2d. The plants grown under the treatment combinations of the lowest salinity (<1.5 ppt, ~<26 mM) and lower light intensity (150 PPFD) produced the greatest number of leaves harvested. This combination produced 115% more leaves per plant compared to plants subjected to either light intensity (150 or 250 PPFD) at the highest salinity level (17 ppt, ~291 mM), as shown in Table 3. The plants grown under the lowest salinity (<1.5 ppt, ~<26 mM) and higher light intensity (250 PPFD) produced the weightiest fresh biomass with 455.77 g/plant, 327% heavier than the yield of the plants with the lowest fresh biomass, which were grown under 17 ppt (291 mM) and the 150 PPFD. These plants were 17–50% heavier than the plants under salinity levels of 5–10 ppt (86–171 mM) at both light intensities (150 and 250 PPFDs). A similar pattern was observed for the dry biomass, where the combinations of the lowest salinity (<1.5 ppt, ~<26 mM) and higher light intensity (250 PPFD) were 303% heavier than the plants under the highest salinity (17 ppt, ~291 mM) and lower light intensity (150 PPFD). The plants grown under 17 ppt (291 mM) salinity exhibited the highest dry matter percentage, 48% more than those grown under salinities between <1.5 and 5 ppt (<26 to 86 mM) across both light intensities (150 and 250 PPFDs).
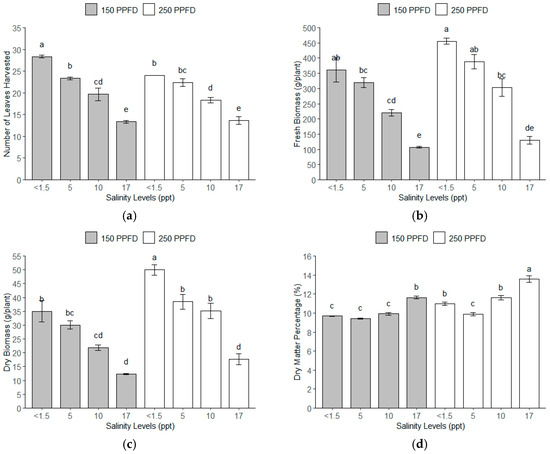
Figure 2.
The yield parameters of kale gathered throughout a 112-day experiment under treatment combinations of light intensities (150 and 250 PPFDs) and salinity levels (<1.5, 5, 10, and 17 ppt, equivalent to <26, 86, 171, and 291 mM) with three replications each: (a) number of leaves harvested; (b) fresh biomass; (c) dry biomass; and (d) dry matter percentage. Error bars represent standard errors. Means with the same superscript letters on each plot were not significantly different at p < 0.05 using Tukey’s HSD test.
Table 3.
Yield parameters (number of leaves, fresh and dry biomass per plant) gathered during the 112-day experiments under different treatment combinations of light intensities (150 and 250 PPFDs) and salinity levels (<1.5, 5, 10, and 17 ppt, equivalent to <26, 86, 171, and 291 mM).
The results of the 112-day experiment demonstrated significant effects of the light intensity and salinity on the yield parameters (Table 4). The salinity consistently accounted for the largest portion of the variance and revealed a dominant influence across all the yield parameters, especially on the number of leaves harvested and fresh biomass. The light intensity also significantly affected these parameters, but with a lesser impact. Generally, the light intensity and salinity interactions were not significant for most of the parameters, except for the dry matter percentage. The overall error variance showed moderate to high unexplained variability, particularly for the dry biomass.
Table 4.
Two-way ANOVA results for the effects of varying light intensities (150 and 250 PPFDs) and salinity levels (<1.5, 5, 10, and 17 ppt, equivalent to <26, 86, 171, and 291 mM) on the yield of kale plants. The independent variables were the light intensity and salinity, and the plant growth parameters were the dependent variables. The percentage of variance that accounts for each factor was determined by partitioning the variance attributed to these factors and their interactions.
Number of harvested leaves. The salinity accounted for 89% of the total variance, contributing a highly significant F-value of 84.053 (p < 0.0001), indicating that the salinity significantly influenced the number of leaves harvested. The light intensity explains 2.29% of the variance, with a significant F-value of 6.480 (p = 0.0216). The interaction between the light intensity and salinity was not a factor and did not contribute significantly, with only 3.02% of the variance and an F-value of 2.853 (p = 0.0701). The error variance for the number of harvested leaves was moderate at 5.65%, representing unexplained variability.
Fresh biomass. The salinity accounted for 81.35% of the total variance for this parameter, which is highly significant (F = 72.030, p < 0.0001). The light intensity contributed significantly, explaining 11.35% of the variance with an F-value of 20.490 (p = 0.0003). Similar to the previous parameter, the light intensity and salinity interactions were insignificant, contributing only 1.25% of the variance (F = 1.110, p = 0.3741). The error variance for the fresh biomass was moderate at 6.05%.
Dry biomass. The salinity remained the most impactful factor for the dry biomass, accounting for 58.79% of the total variance with a highly significant F-value of 52.168 (p < 0.0001). The light intensity also significantly contributed to the dry biomass, accounting for 21.23% of the variance (F = 43.032, p < 0.0001). The interaction effect between the light and salinity was insignificant, contributing only 2.19% of the variance (F = 1.942, p = 0.1630). The error variance for the dry biomass was relatively higher at 17.79%.
Dry matter percentage. The variance for the salinity contributed a high percentage of 66.51%, resulting in a highly significant F-value of 92.47 (p < 0.0001) for the dry matter percentage. The light intensity also revealed a strong effect with 25.30% of the variance, which was highly significant (F = 105.52, p < 0.0001). The interaction between the light intensity and salinity was substantial, contributing 4.36% of the variance (F = 6.06, p = 0.0059). The error variance for the dry matter percentage was relatively low at 3.84%.
The normality of the residuals was assessed using the Shapiro–Wilk test. The test yielded W statistics close to 1 (0.9537–0.9862) and p-values of 0.32–0.98 associated with the yield parameters exceeding 0.05, suggesting a normal distribution of the model residuals. Further analysis using Tukey’s HSD revealed that the kale plants under the lowest salinity under both light intensities (150–250 PPFDs) had a significantly higher yield, while the yield declined significantly as the salinity increased. This was true for the number of leaves harvested and fresh and dry biomass. Conversely, for the dry matter percentage, the highest salinity level had a significantly higher yield, particularly under the higher light intensity (250 PPFD).
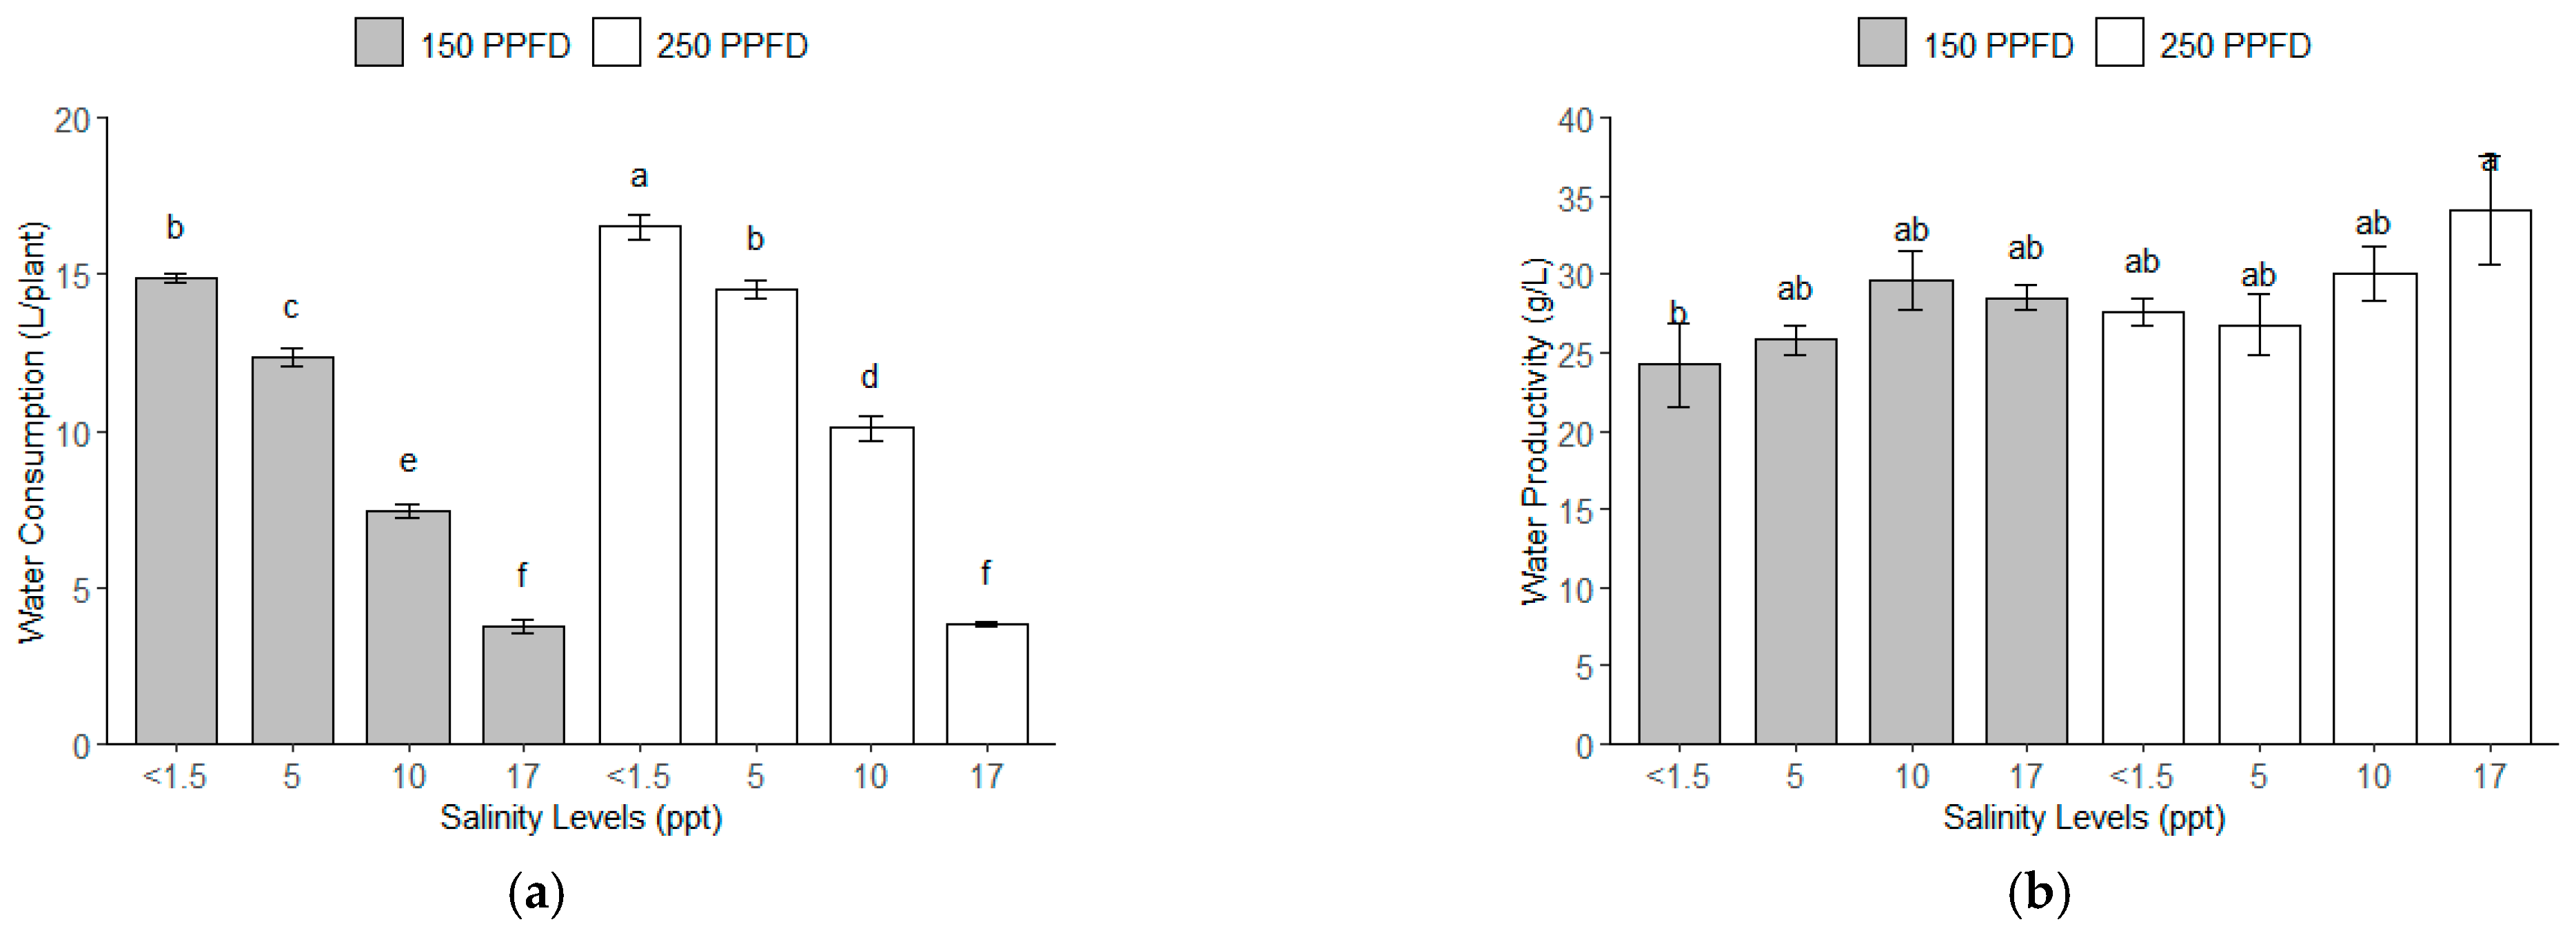
3.3. Water Consumption and Water Productivity
The total water consumption of the kale plants for 112 days under the different light intensities and salinity levels showed variations, as depicted in Figure 3a. The highest water consumption was observed in the plants grown at the lowest salinity level (<1.5 ppt, ~<26 mM) and higher light intensity (250 PPFD), with 15.7 L/plant, while the lowest water consumption was observed in the plants grown under the highest salinity (17 ppt, ~291 mM) at both light intensities, with 3.8 L/plant. The plants under the moderate salinity (5–10 ppt, ~86–171 mM) consumed an intermediate amount of water, with a noticeable decline as the salinity increased.
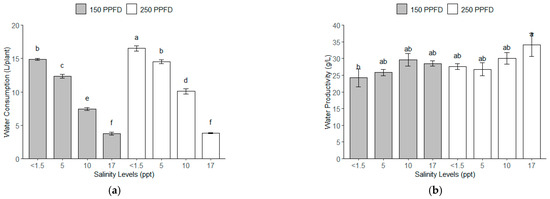
Figure 3.
The water consumption and water productivity of kale plants under different light intensities (150 and 250 PPFDs) and salinity levels (<1.5, 5, 10, and 17 ppt, equivalent to <26, 86, 171, and 291 mM): (a) total water consumption per plant after 112 DAT (L/plant); (b) water productivity (g/L). Error bars represent standard errors. Means with the same superscript letters on each plot are not significantly different at p < 0.05 using Tukey’s HSD test.
With regard to the water productivity (Figure 3b), the salinity levels significantly influenced the efficiency of the water use for fresh biomass production. The highest water productivity, with 34.14 g/L of fresh biomass, was observed under the highest salinity level (17 ppt, ~291 mM) and higher light intensity (250 PPFD). Conversely, the lowest water productivity occurred at the lowest salinity (<1.5 ppt, ~<26 mM) and low light intensity (150 PPFD), with 24.22 g/L.
The salinity contributed the largest portions of the variance for the water consumption and productivity, as shown in Table 5, accounting for 95.25% and 58.79% of the total variance, respectively. The light intensity was also significant but had less impact at 3.01% and 21.23% variance, respectively, for the water consumption and productivity. The combination of the light intensity and salinity shows a significant F-value of 1.94 (p = 0.0012) but only accounted for 1.07% of the variance, showing less influence on the water consumption of the kale plants. The variance of the interaction between the light intensity and salinity for the water productivity was 2.19%, showing a non-significant F-value of 1.94 (p = 1630). Further statistical analysis using Tukey’s HSD revealed that the kale plants under the lowest salinity consumed significantly more water than those grown with higher salinity under both light intensities (150–250 PPFDs). Conversely, the water productivity of the kale plants grown with the highest salinity, particularly under the higher light intensity, was significantly higher than those of all the rest of the treatments.
Table 5.
Two-way ANOVA results for the effects of varying light intensities (150 and 250 PPFDs) and salinity levels (<1.5, 5, 10, and 17 ppt, equivalent to <26, 86, 171, and 291 mM) on the total water consumption and productivity of kale plants. The independent variables were the light intensity and salinity, and the plant growth parameters were the dependent variables. The percentage of variance that accounts for each factor was determined by partitioning the variance attributed to these factors and their interactions.
3.4. Nutrient Content Analysis of Kale Leaves
3.4.1. Macronutrients
Total Kjeldahl Nitrogen (TKN). The TKN content revealed a significant variation for both the salinity and light intensity. A gradual decrease in the TKN is observed in Figure 4a with the increasing salinity, except for the treatment combinations of 150 PPFD and 5 ppt (86 mM), where the TKN content had the highest value (34 mg/g). Four treatment combinations (150 PPFD and <1.5 ppt; 150 PPFD and 10 ppt; 250 PPFD and 5–10 ppt) had close TKN contents slightly lower than the highest, ranging from 28 to 30 mg/g. The lowest TKN content was observed from <1.5 and 17 ppt (<26 and 291 mM), both from the 250 PPFD light intensity group with 22 mg/g.
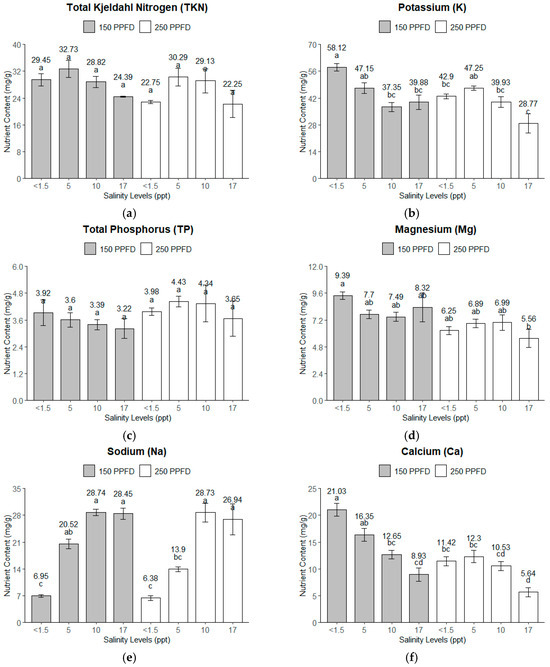
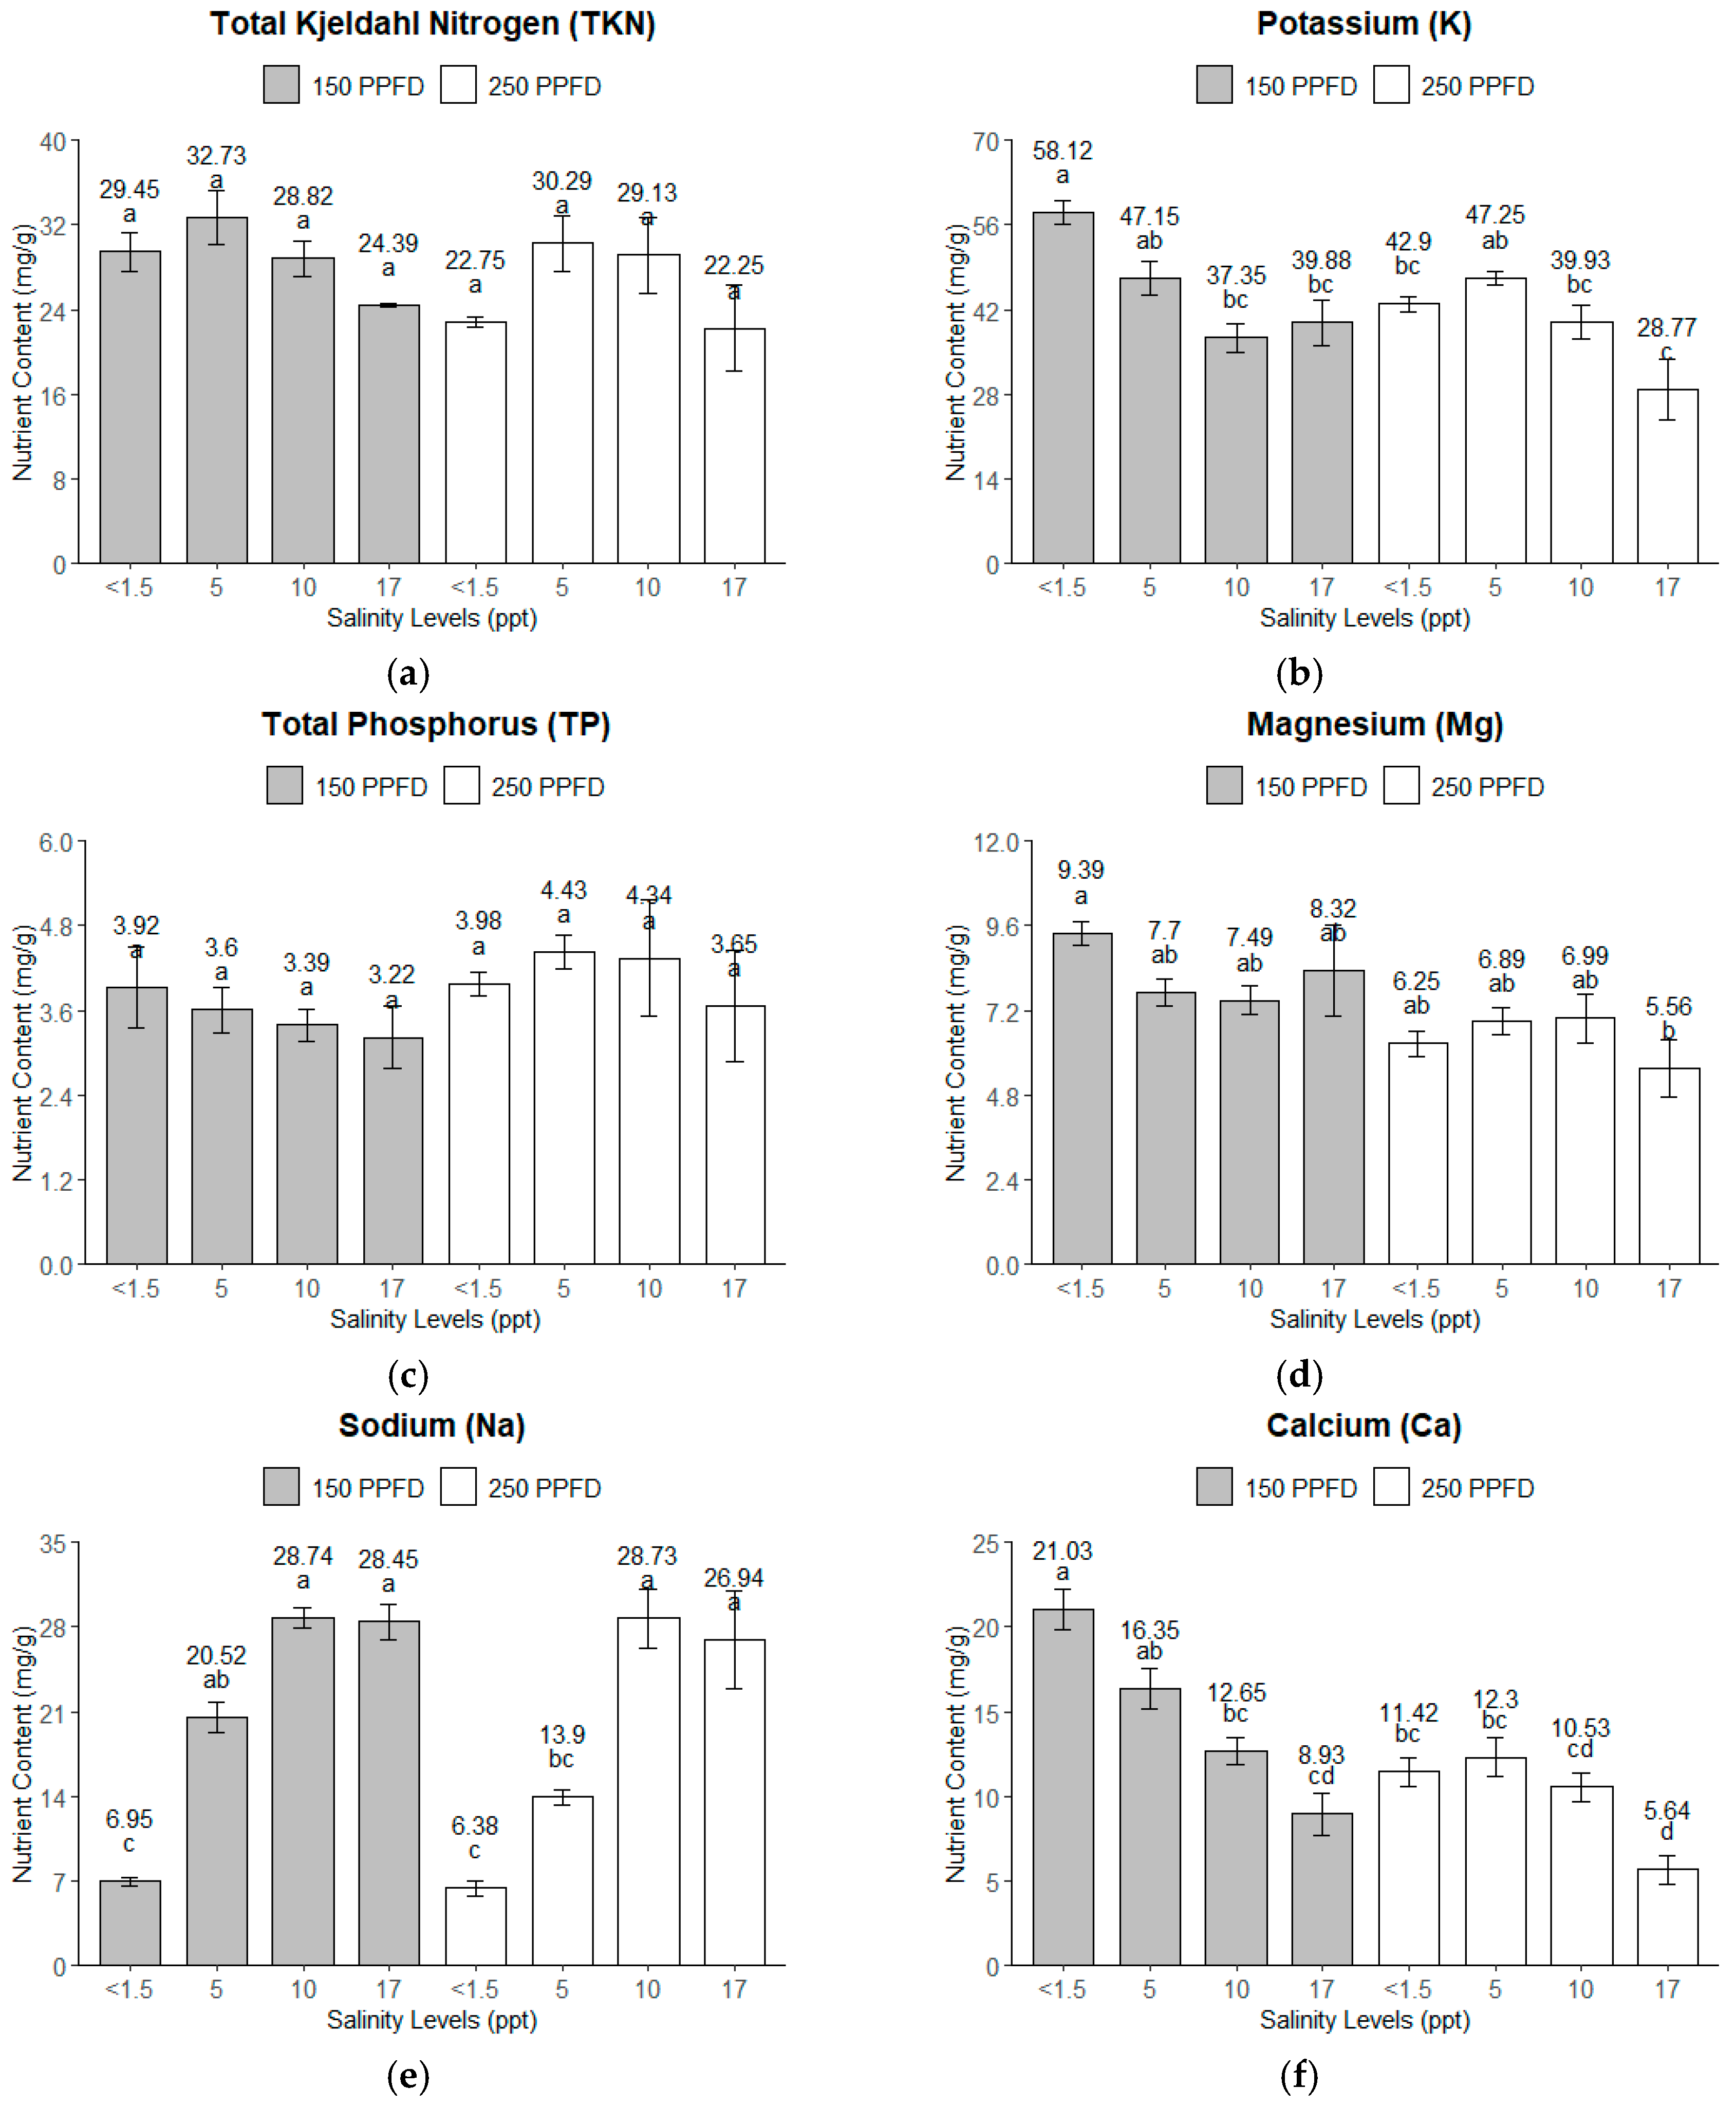
Figure 4.
The macronutrient contents of kale leaves under different light intensities (150 and 250 PPFDs) and salinity levels (<1.5, 5, 10, and 17 ppt, equivalent to <26, 86, 171, and 291 mM): (a) total Kjeldahl nitrogen (TKN); (b) potassium; (c) total phosphorus (TP); (d) magnesium (Mg); (e) sodium (Na); (f) calcium (Ca). Error bars represent standard errors. Means with the same superscript letters on each plot were not significantly different at p < 0.05 using Tukey’s HSD test.
Potassium (K). The potassium content also displayed an apparent response to both the salinity and light intensity, with the optimum K content (58.12 mg/g) recorded under low salinity (<1.5 ppt, ~<26 mM) and low light intensity (150 PPFD). The values generally declined as the salinity increased at both light intensities, with the lowest values recorded at 17 ppt (291 mM), particularly under the 250 PPFD, where they dropped to 28.77 mg/g, as shown in Figure 4b. Higher salinity levels reduce K uptake, especially under higher light intensities.
Total Phosphorus (TP). The TP content exhibited a more uniform response than the other nutrients, with relatively stable values across the salinity and light treatments (Figure 4c). However, the TP content peaked under the 250 PPFD and 5–10 ppt (86–171 mM) treatment, with values around 4.4 mg/g. This suggests that the TP content might not have been as sensitive to the salinity and light intensity variations as the other nutrients, but it still shows slight increases under moderate salinity and higher light intensity and decreases at 17 ppt (291 mM) salinity.
Magnesium (Mg). The magnesium content followed a similar pattern to that of the K. The highest concentration was observed at low salinity (<1.5 ppt, ~<26 mM), around 9.39 mg/g. Figure 4d shows that the Mg content in the higher-light-intensity group (250 PPFD) was lower than the Mg content in the lower-light-intensity (150 PPFD) group. This trend suggests that salinity negatively impacts Mg accumulation, particularly under the higher light intensities employed in this experiment.
Sodium (Na). As expected, the Na content significantly increased with the salinity (Figure 4e), with the highest values observed at 10–17 ppt (171–291 mM) at both light intensities, reaching 28.74 mg/g. This indicates the capacity of the kale plants to uptake Na with increased availability. The light intensities of 150–250 PPFDs did not affect the Na uptake of the kale plants.
Calcium (Ca). The calcium content showed a uniform gradual decrease with the increasing salinity, particularly under the lower light intensity (150 PPFD), while under the higher light intensity (250 PPFD), a uniform amount was observed from a salinity range of <1.5–10 ppt (<26–86 mM), as shown in Figure 4f. The optimum Ca content was observed at the lowest salinity (<1.5 ppt, ~<26 mM) and lower light intensity (150 PPFD), where it reached 21 mg/g. As the salinity increased to 17 ppt (291 mM), the Ca content dropped significantly, particularly at the 250 PPFD, with a minimum amount of 5 mg/g. This suggests that salinity strongly limits Ca uptake, especially under higher light intensities.
Table 6 summarizes the analysis of the effects of the light intensity and salinity on the nutrient contents of the kale leaves. It shows that the salinity was the most significant factor that influenced the nutrient contents, particularly the Na, K, and Ca, accounting for over 50% of the total variance. The salinity explained 89.21% of the variance for the Na, highlighting its strong impact on Na uptake. Similarly, the K and Ca were highly affected by the salinity, contributing 51.48% and 53.31% of the variance, respectively. The light intensity played a significant role in the Mg, K, and Ca uptake, contributing notably to the variance, especially for Mg, where it accounted for 38.00%. However, the light had a non-significant effect on the TKN and TP contents, indicating that these nutrients were less responsive to changes in the light intensity.
Table 6.
Two-way ANOVA results for the effects of varying light intensities (150 and 250 PPFDs) and salinity levels (<1.5, 5, 10, and 17 ppt, equivalent to <26, 86, 171, and 291 mM) on macronutrient compositions of kale leaves. The independent variables were the light intensity and salinity, and the plant growth parameters were the dependent variables. The percentage of variance that accounts for each factor was determined by partitioning the variance attributed to these factors and their interactions.
Interestingly, the interaction between the salinity and light intensity was significant for the K and Ca, showing that both factors together can influence the uptake of these nutrients. However, this interaction was insignificant for the TKN, TP, Mg, and Na, where either the salinity or light individually played a dominant role. The error variances for the TKN, TP, and Mg were relatively high, indicating a high level of unexplained variability, suggesting that other external factors might have influenced their contents, especially the TP. Further analysis using Tukey’s HSD revealed that the TKN and TP contents of the kale leaves were not significantly different across the light intensities and salinity levels. The combination of the lowest salinity (<1.5 ppt, ~<26 mM) and lower light intensity (150 PPFD) accumulated significantly higher K and Mg contents than the rest of the treatments. The sodium content was significantly higher for salinities between 10 and 17 ppt (171–291 mM) under both light intensities. Calcium had the highest content at <01.5 ppt (<26 mM) under the lower light intensity (150 PPFD) and significantly decreased as the salinity and light intensity increased.
3.4.2. Micronutrients
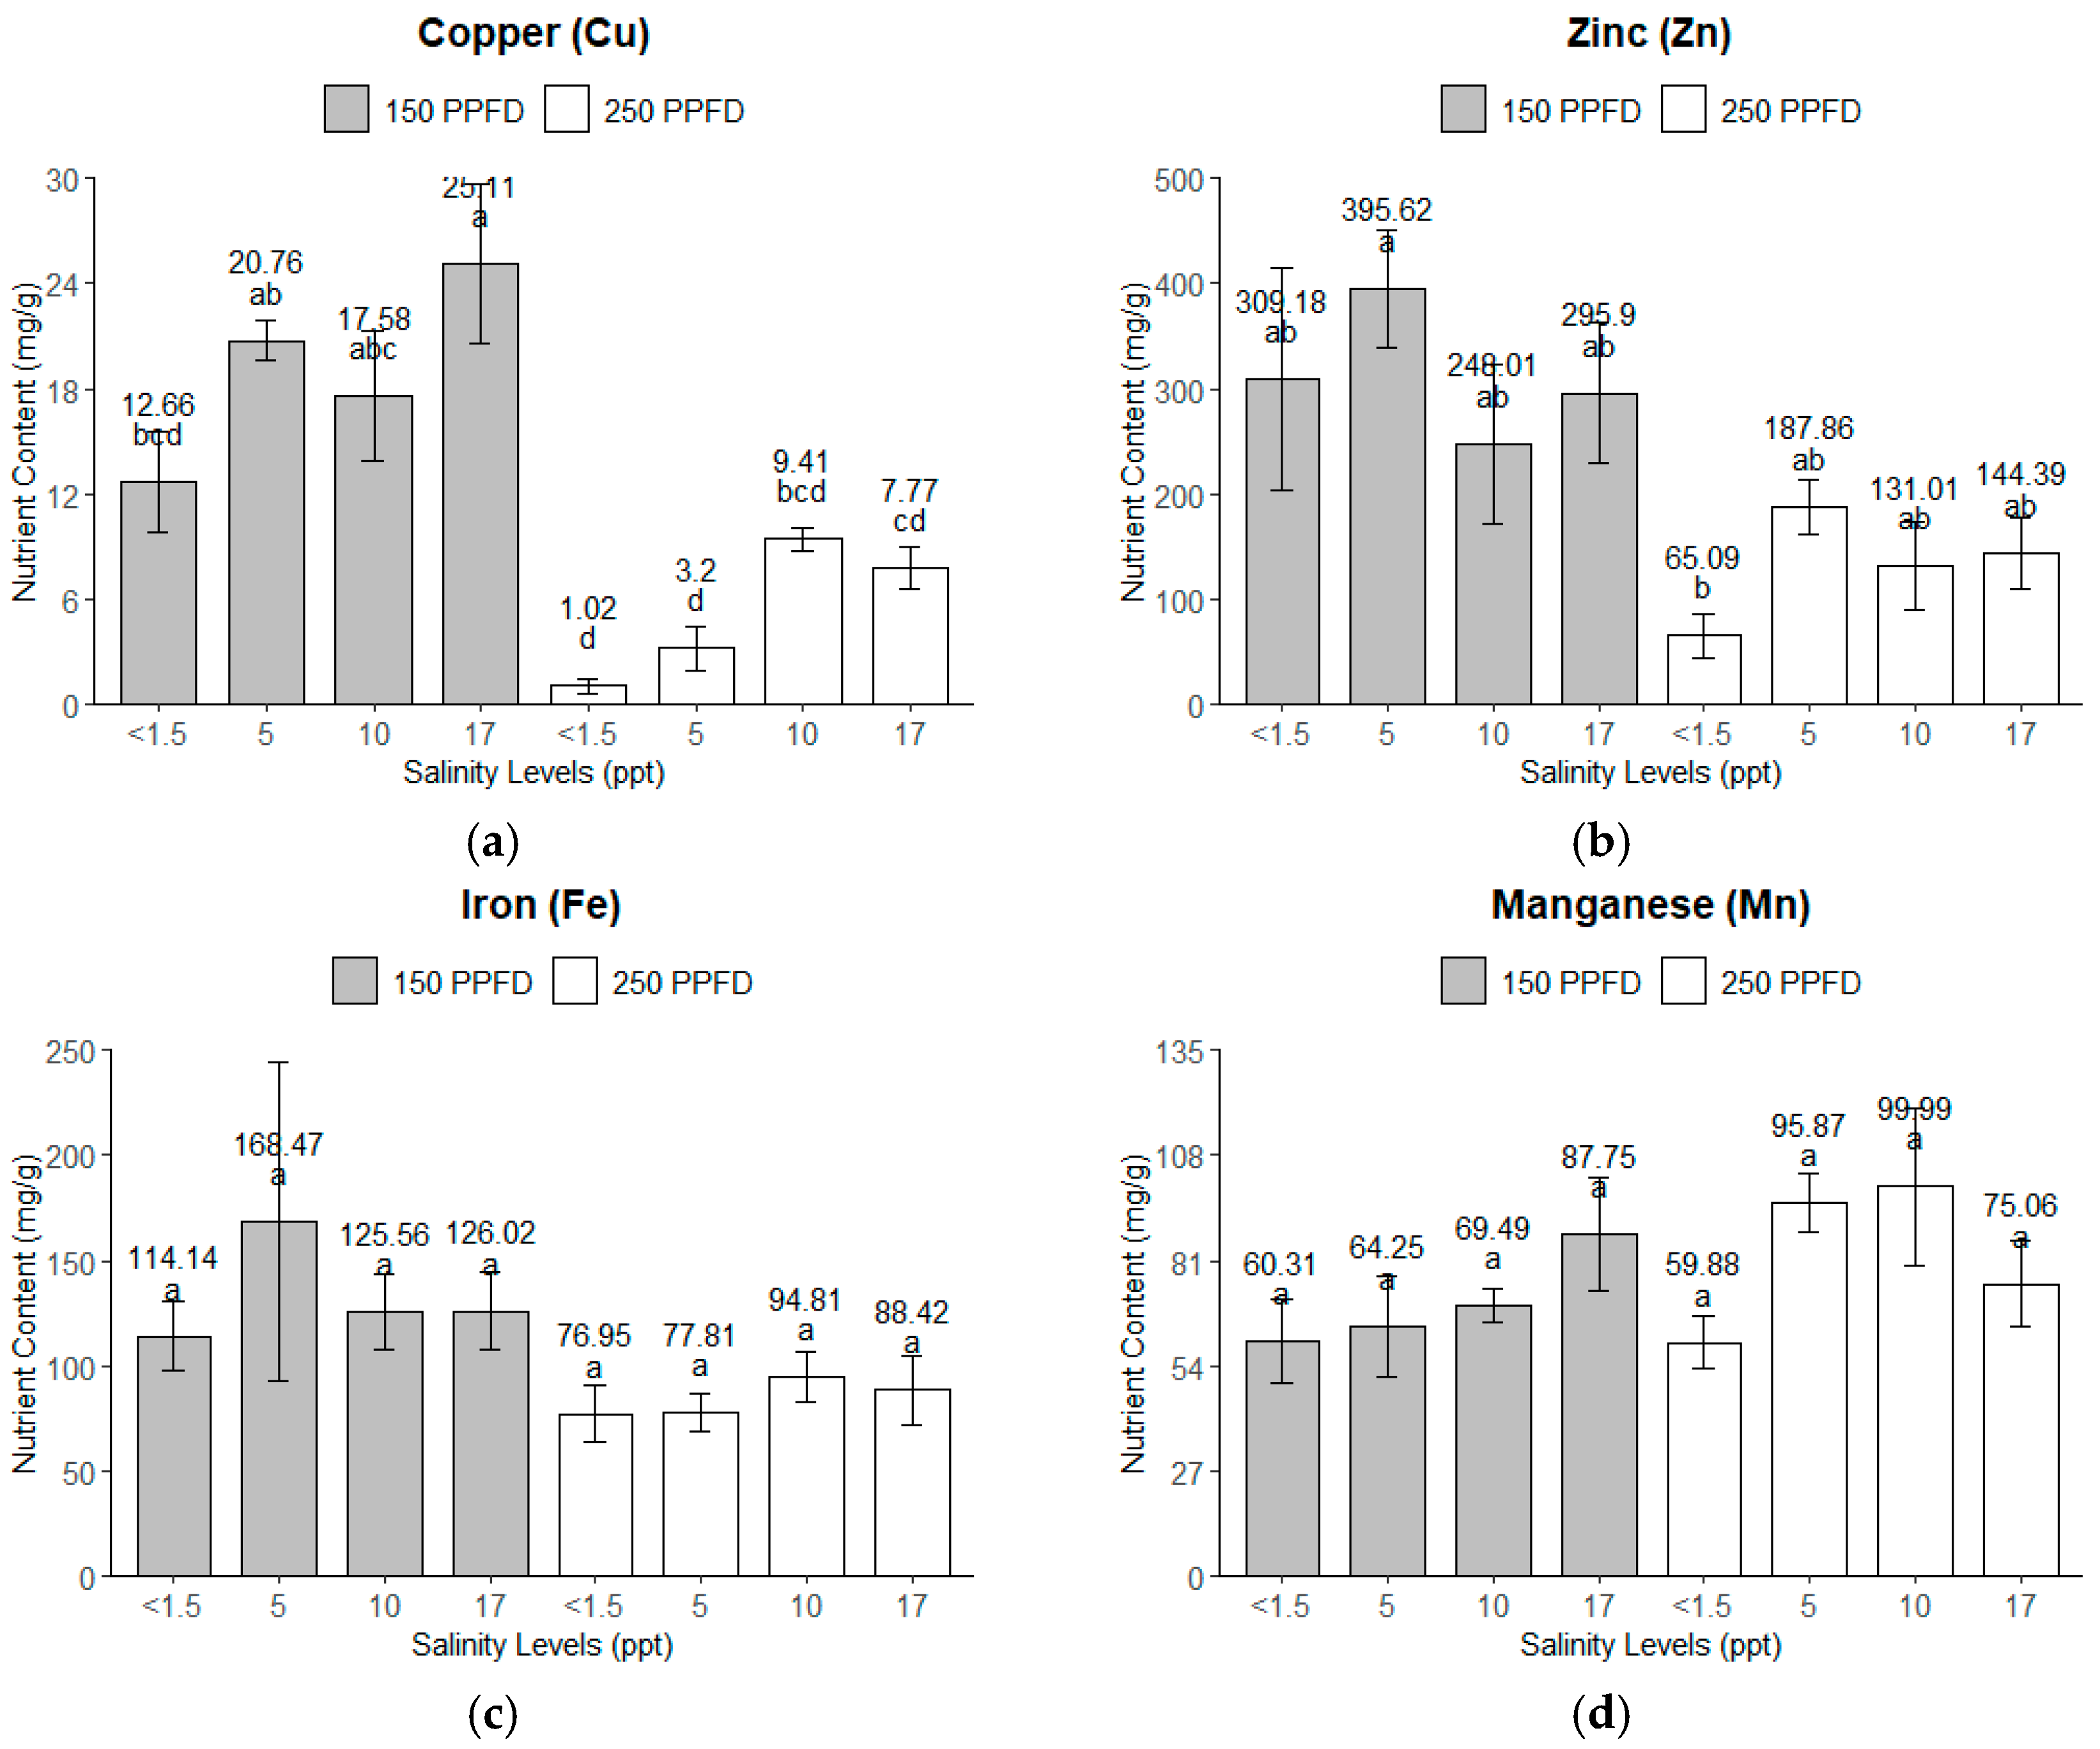
The light intensity and salinity significantly affected the micronutrient uptake of the kale plants, as shown in Figure 5. For zinc (Zn) and iron (Fe), the lower light intensity (150 PPFD) and moderate salinity (5 ppt, ~86 mM) combined for higher micronutrient accumulation, but for copper (Cu), the highest nutrient accumulation happened under the highest salinity (17 ppt, ~291 mM) and lower light intensity (150 PPFD). The micronutrient uptake consistently declined at the higher light intensity (250 PPFD), except for manganese (Mn), which accumulated more nutrients, with 5–10 ppt (86–171 mM) being the optimum salinity condition.
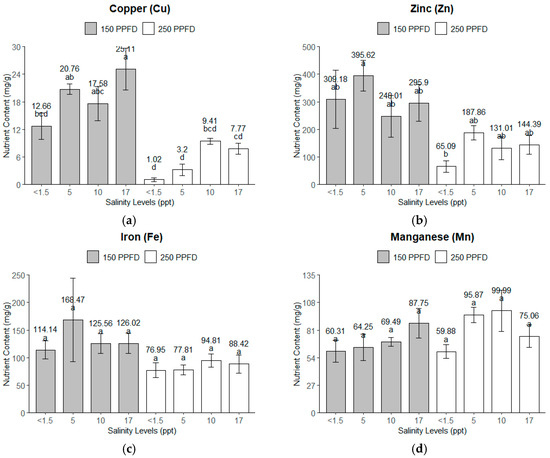
Figure 5.
The micronutrients of the kale plants’ leaves under treatment combinations of light intensities (150 and 250 PPFDs) and salinity levels (<1.5, 5, 10, and 17 ppt, equivalent to <26, 86, 171, and 291 mM): (a) copper; (b) zinc; (c) iron; (d) manganese. Error bars represent standard errors. Means with the same superscript letters on each plot were not significantly different at p < 0.05 using Tukey’s HSD test.
The two-way ANOVA results for the Cu, Zn, Fe, and Mn, as shown in Table 7, reflect the influence of the light intensity, salinity, and their interactions on the micronutrient accumulation in the kale plants.
Table 7.
Two-way ANOVA results for the effects of varying light intensities (150 and 250 PPFDs) and salinity levels (<1.5, 5, 10, and 17 ppt, equivalent to <26, 86, 171, and 291 mM) on micronutrient compositions of kale leaves. The independent variables were the light intensity and salinity, and the plant growth parameters were the dependent variables. The percentage of variance that accounts for each factor was determined by partitioning the variance attributed to these factors and their interactions.
Copper (Cu). The light intensity had the dominant effect on the nutrient accumulation of Cu in the kale plants, explaining 62.6% of the total variance with an F-value of 62.81 (p < 0.0001). The salinity accounted for 16.18%, significantly affecting the nutrient accumulation (F = 5.41, p = 0.0092).
Zinc (Zn). Similarly, the light intensity significantly influenced the Zn accumulation (p = 0.0006), accounting for 45.94% of the total variance, whereas the salinity had no significant effect (p = 0.2994), contributing only 3.42% of the variance.
Iron (Fe). The light intensity significantly influenced the Fe accumulation in the kale plants, with p = 0.0363, but further analysis using Tukey’s HSD revealed no significant differences among the treatment levels. The error variance accounted for the largest portion, at 68.60%. The salinity and its interactions with the light intensity did not show any significant effects, with p = 0.8399 and p = 0.7394, respectively.
Manganese (Mn). Interestingly, none of the parameters—the light intensity (p = 0.1658), salinity (p = 0.1972), or their interactions (p = 0.1981)—showed any significant effect on the Mn accumulation. However, the salinity and its interaction with the light intensity contributed a higher proportion (18.36% and 18.31%) to the variance than the light (7.37%).
The error variance was relatively high, particularly for Zn (40.53%) and Fe (68.60%), indicating that a substantial part of the variability in these micronutrients was due to factors not included in the model. Further analysis using Tukey’s HSD revealed that the Mn contents of the kale leaves were not significantly different across the light intensities and salinity levels. The plants grown under the highest salinity (17 ppt, ~291 mM) and lower light intensity (150 PPFD) had significantly higher Cu contents than those of the rest of the treatments. On average, the plants under the lower light intensity (150 PPFD) had significantly higher Cu and Zn contents than those grown under the higher light intensity (250 PPFD).
4. Discussion
4.1. Plant Growth Parameters
Both the light intensity and salinity significantly influenced the kale growth, yield, and nutrient compositions in an indoor hydroponic system, with the salinity showing more dominant effects within the ranges studied (<1.55–17 ppt, ~<26–291 mM). Light is considered a key element in driving photosynthesis, while salinity is an abiotic stressor [32]. In this study, the kale, a crop with moderate salinity tolerance, grew up to 17 ppt (291 mM) with an overall optimum growth performance in <1.5–5 ppt (<26–86 mM). No significant differences in the growth parameters were observed in the salinity range of <1.5–5 ppt (<26–86 mM), but a significantly larger reduction is evident at the 10–17 ppt (171–291 mM) salinity level for both light intensities (150–250 PPFDs). This confirms the results of the study by Kimera et al. (2023), who showed that kale did not show any significant growth differences up to 6000 ppm (102 mM) in the salinity levels in an aqua–sandponics Nile tilapia growing system [20]. The kale plants’ time series growth performance showed rapid growth at 14 DAT but significantly slowed down through 112 DAT, with the highest salinity (17 ppt, ~291 mM) leveling off at both light intensities.
4.2. Yield Parameters (Number of Leaves and Fresh and Dry Biomass)
The number of leaves harvested reduced gradually with the increase in the salinity and slightly decreased under the higher light intensity (250 PPFD). A similar trend was observed with the fresh and dry biomass, showing an even more pronounced decline at 17 ppt (291 mM) under both light intensities. On average, negative growth was observed for the plant height, leaf length, and leaf width of the kale plants from 14 to 112 DAT under the highest salinity (17 ppt, ~291 mM) at both light intensities (Figure 1). The potential cause of the growth and biomass decline could be attributed to osmotic stress and ion toxicity caused by the high salinity concentrations, impeding the water and nutrient intake needed by the plants [33,34,35]. Cell division and expansion, which are essential for growth and development, are strongly hindered by salinity [36]. This was confirmed in a study by Aazami et al. (2021), wherein the rate of the cell expansion in tomatoes was hindered by prolonged exposure to 6 ppt sodium chloride (NaCl), resulting in a reduction in the leaf, stem, and root growth rates [37]. Ahmed et al. (2007) also observed a decrease in the sorghum grain yield due to the prolonged irrigation of saline water [38]. This also aligns with the findings of Murkute et al. (2005) that showed that salinity negatively affected both the quantity and quality of citrus plant yields [39].
The light intensity significantly influences plant growth and development, and salinity may further exacerbate its effects. The negative impact of salinity on their growth can indirectly affect how plants respond to light. Chlorophyll, the pigment responsible for absorbing light energy during photosynthesis, plays a central role in this process. However, salinity disrupts photosynthesis by inhibiting the Rubisco activity, hindering chlorophyll biosynthesis and impairing the function of photosystems, all of which reduce the plant’s ability to efficiently convert light energy into chemical energy [40,41,42]. Interestingly, the dry matter percentage in this study increased with the incremental salinity at both light intensities. This could be attributed to plants’ physiological responses to saline environments. When a plant is under salinity stress, it often accumulates solutes like proline, sugars, and ions to make up for the osmotic pressure and maintain the water balance; this leads to a higher concentration of organic and inorganic compounds in the plant tissues, contributing to higher dry matter contents [37,43].
4.3. Water Consumption and Water Productivity
The water consumption of the kale plants was the highest at the lowest salinity (<1.5 ppt, ~<26 mM), with 15.7 L/plant, and it drastically dropped with the highest salinity (17 ppt, ~291 mM), having 3.8 L/plant for both light intensities. Reducing the water uptake under salinity stress means less water content relative to the solid materials in the tissue, which thereby increases the dry matter percentage [44,45]. Salinity stress can cause changes in the cell structure, leading to more compact cells with a higher concentration of solid materials, further contributing to an increase in dry matter [46,47]. In one study, salt-stressed Zea mays applied with foliar proline increased the plant growth and positively impacted the growth and yield [48]. Similarly, improving the proline accumulation in rice improved its growth and development [49].
4.4. Macronutrients
The salinity negatively impacted the macronutrient uptake, particularly the TKN, K, Mg, and Ca at 17 ppt (291 mM). As expected, the Na content of the harvested leaves increased with the rising salinity, with an optimum accumulation of 28 mg/g under 10–17 ppt (171–291 mM) at both light intensities. The lowest salinity treatment (<1.5 ppt, ~<26 mM) had the lowest sodium content with 7 mg/g at both light intensities and a moderate content for the 5 ppt (86 mM) treatments. The TP remained relatively stable but peaked at 5 ppt (86 mM) with about 4.43 mg/g under the higher light intensity. The TKN, K, Mg, and Ca contents generally declined at 17 ppt (291 mM). Higher Ca and Mg contents were observed with the lower light intensity. Salt ions, particularly sodium (Na+) and chloride (Cl−), compete with the uptake of essential nutrients in plants in saline environments [50,51]. Sodium and K ions are transported to the plant with similar pathways, and the higher concentration of salt can block or reduce the potassium absorption [52]. This dynamic was evident in a greenhouse experiment evaluating the effects of varying doses of potassium sulfate (K2SO4) at 0.4, 0.8, 1.2, and 1.6 g K·dm−3, combined with two levels of calcium carbonate (CaCO3) at 5 and 15 g CaCO3·dm−3. The study examined the yield, chemical composition, and biological value of feces. The results indicated that the highest fecal yield occurred at a K2SO4 dose of 1.2 g K·dm−3, whereas both lower and higher potassium doses led to reduced yields [53]. Magnesium deficiency can cause a decrease in chlorophyll contents as a result of salt stress, leading to reduced growth and plant development [54].
4.5. Micronutrients
The light intensity showed dominant effects on the micronutrient accumulation for the hydroponically grown kale, particularly for Cu and Zn, and less on the salinity. Higher accumulation was observed under the lower light intensity (150 PPFD) and across the salinity levels (<1.5–17 ppt, ~<26–291 mM) for Cu, Zn, and Fe, while Mg had it even for both the light intensities (150–250 PPFDs) and salinity levels (<26–291 mM). The reduced growth rate under the lower light intensity is a potential reason for this. The total nutrient concentration is the ratio of the nutrient to the plant mass. A slower growth rate with lower biomass could lead to relatively higher concentrations of nutrients in plant tissues [52]. A decrease in the photosynthetic demand could also be another explanation for this, resulting in slower metabolic activity. On this occasion, specific demands for macronutrients, like nitrogen for chlorophyll synthesis, are reduced, while micronutrients that are not heavily consumed during the photosynthetic activity of plants under stress are maintained [49].
5. Conclusions, Limitations, and Further Directions
This study demonstrates that the light intensity and salinity significantly impact the kale growth, yield, and nutrient composition in indoor hydroponic systems. Salinity emerges as a dominant stress factor, leading to a magnified reduction in the growth parameters, particularly at 17 ppt (291 mM), due to osmotic stress and ion toxicity. The observed increase in the dry matter percentage under higher salinity could be due to plant physiological adaptations, such as solute accumulation, compact cell structures, and reduced water uptake. Although the salinity negatively impacted the macronutrient uptake, such as the TKN, K, Mg, and Ca, interestingly, the light intensity had a more substantial effect on the micronutrient contents, with Cu, Zn, and Fe being more concentrated under the lower-light-intensity conditions, potentially due to the slower biomass production and reduced metabolic demands.
These findings underscore the critical roles of light intensity and salinity management in strategizing production protocols that optimize nutrient management and improve crop productivity under environmental stress, such as salt intrusion and the salinization of agricultural lands. The Russian kale exhibited the optimal growth and yield under a 250 PPFD light intensity and salinity levels ranging from <1.5 to 5 ppt (<26–86 mM), with the macronutrient absorption remaining consistent across the light intensities (150–250 PPFDs) and a salinity range of <1.5 to 10 ppt (<26–171 mM). Conversely, the lower 150 PPFD light intensity under a broader salinity range (<1.5–17 ppt, ~<26–291 mM) resulted in the increased accumulation of micronutrients, including copper (Cu), zinc (Zn), and iron (Fe). These results highlight the trade-offs between optimizing the growth performance and enhancing the nutrient composition under different environmental conditions. This study was limited to the determination of the growth, yield, and nutrient content of kale under varying light intensities (150–250 PPFDs) and salinity levels (<1.5–17 ppt, ~<26–291 mM) in an indoor hydroponic system. Future works should focus on identifying and cultivating a broader range of edible crops that can adapt and thrive in saline environments, emphasizing mechanisms to enhance their nutrient uptake and stress resilience. Conversely, understanding ion uptake, such as metal ion uptake, could help with considerations of phytoremediations in saline areas. Moreover, exploring the symbiosis between marine aquaculture and salt-tolerant crops could optimize nutrient utilization and resource efficiency, thereby advancing sustainable aquaculture.
Author Contributions
Conceptualization, C.P. and S.H.; methodology, C.P.; software, C.P.; validation, C.P. and S.H.; formal analysis, C.P.; investigation, C.P. and S.H.; resources, CP. and S.H; data curation, C.P. and S.H.; writing—original draft preparation, C.P.; writing—review and editing, C.P., L.X., R.H., and S.H.; visualization, C.P.; supervision, S.H.; project administration, S.H. All authors have read and agreed to the published version of the manuscript.
Funding
This research received no external funding.
Institutional Review Board Statement
Not applicable.
Informed Consent Statement
Not applicable.
Data Availability Statement
All data generated or analyzed for this study are included in this published article.
Acknowledgments
We would like to express our sincere gratitude to Kerui Cen, Zhen Chen, and Wanying Fu (graduate students from the Statistics Department, NCSU) for their invaluable statistical assistance with analyzing the data. Their expertise and support were instrumental to the completion of this work. We are also deeply thankful to John Classen for his support as a member of the committee and for his unwavering departmental and administrative support. His guidance and encouragement have been integral to our progress. Additionally, we extend our sincerest appreciation to the Engineering Research and Development for Technology (ERDT), Philippines, for providing scholarship support, and to the William White Endowment of North Carolina Agricultural Foundation, Inc. for the materials and equipment that made this research possible. All individuals have consented to be acknowledged in this paper.
Conflicts of Interest
The authors declare no conflicts of interest. The funders had no role in the design of the study; in the collection, analyses, or interpretation of the data; in the writing of the manuscript; or in the decision to publish the results.
References
- UN DESA|United Nations Department of Economic and Social Affairs. World Population Projected to Reach 9.8 Billion in 2050, and 11.2 Billion in 2100. Available online: https://www.un.org/development/desa/en/news/population/world-population-prospects-2017.html (accessed on 18 July 2024).
- Roy, S.J.; Tester, M. Increasing Salinity Tolerance of Crops. In Sustainable Food Production; Christou, P., Savin, R., Costa-Pierce, B.A., Misztal, I., Whitelaw, C.B.A., Eds.; Springer: New York, NY, USA, 2013; pp. 986–1002. ISBN 978-1-4614-5797-8. [Google Scholar]
- FAO; IFAD; UNICEF; WFP; WHO. The State of Food Security and Nutrition in the World 2024; FAO: Rome, Italy; IFAD: Rome, Italy; UNICEF: New York, NY, USA; WFP: Rome, Italy; WHO: Geneva, Switzerland, 2024; ISBN 978-92-5-138882-2. [Google Scholar]
- Šamec, D.; Urlić, B.; Salopek-Sondi, B. Kale (Brassica oleracea Var. Acephala) as a Superfood: Review of the Scientific Evidence behind the Statement. Crit. Rev. Food Sci. Nutr. 2019, 59, 2411–2422. [Google Scholar] [CrossRef] [PubMed]
- Abellán, Á.; Domínguez-Perles, R.; Moreno, D.A.; García-Viguera, C. Sorting out the Value of Cruciferous Sprouts as Sources of Bioactive Compounds for Nutrition and Health. Nutrients 2019, 11, 429. [Google Scholar] [CrossRef] [PubMed]
- Shannon, M.C.; Grieve, C.M. Tolerance of Vegetable Crops to Salinity. Sci. Hortic. 1998, 78, 5–38. [Google Scholar] [CrossRef]
- Maggioni, L.; von Bothmer, R.; Poulsen, G.; Branca, F. Origin and Domestication of Cole Crops (Brassica oleracea L.): Linguistic and Literary Considerations. Econ. Bot. 2010, 64, 109–123. [Google Scholar] [CrossRef]
- Cartea, M.E.; Velasco, P. Glucosinolates in Brassica Foods: Bioavailability in Food and Significance for Human Health. Phytochem. Rev. 2008, 7, 213–229. [Google Scholar] [CrossRef]
- Food Data Central. Available online: https://fdc.nal.usda.gov/fdc-app.html#/food-details/323505/nutrients (accessed on 12 August 2024).
- Zha, L.; Liu, W. Effects of Light Quality, Light Intensity, and Photoperiod on Growth and Yield of Cherry Radish Grown under Red plus Blue LEDs. Hortic. Environ. Biotechnol. 2018, 59, 511–518. [Google Scholar] [CrossRef]
- Kang, J.H.; KrishnaKumar, S.; Atulba, S.L.S.; Jeong, B.R.; Hwang, S.J. Light Intensity and Photoperiod Influence the Growth and Development of Hydroponically Grown Leaf Lettuce in a Closed-Type Plant Factory System. Hortic. Environ. Biotechnol. 2013, 54, 501–509. [Google Scholar] [CrossRef]
- Li, Q.; Kubota, C. Effects of Supplemental Light Quality on Growth and Phytochemicals of Baby Leaf Lettuce. Environ. Exp. Bot. 2009, 67, 59–64. [Google Scholar] [CrossRef]
- Lefsrud, M.G.; Kopsell, D.A.; Kopsell, D.E.; Curran-Celentano, J. Irradiance Levels Affect Growth Parameters and Carotenoid Pigments in Kale and Spinach Grown in a Controlled Environment. Physiol. Plant. 2006, 127, 624–631. [Google Scholar] [CrossRef]
- Hao, S.; Wang, Y.; Yan, Y.; Liu, Y.; Wang, J.; Chen, S. A Review on Plant Responses to Salt Stress and Their Mechanisms of Salt Resistance. Horticulturae 2021, 7, 132. [Google Scholar] [CrossRef]
- Shabala, S.; Munns, R. Salinity Stress: Physiological Constraints and Adaptive Mechanisms. In Plant Stress Physiology; Cabi: Wallingford, UK, 2017; pp. 24–63. [Google Scholar] [CrossRef]
- Chinnusamy, V.; Jagendorf, A.; Zhu, J.-K. Understanding and Improving Salt Tolerance in Plants. Crop Sci. 2005, 45, 437–448. [Google Scholar] [CrossRef]
- Ortega-Hernández, E.; Antunes-Ricardo, M.; Jacobo-Velázquez, D.A. Improving the Health-Benefits of Kales (Brassica oleracea L. Var. Acephala DC) through the Application of Controlled Abiotic Stresses: A Review. Plants 2021, 10, 2629. [Google Scholar] [CrossRef] [PubMed]
- Shannon, M.C.; Grieve, C.M.; Lesch, S.M.; Draper, J.H. Analysis of Salt Tolerance in Nine Leafy Vegetables Irrigated with Saline Drainage Water. J. Am. Soc. Hortic. Sci. 2000, 125, 658–664. [Google Scholar] [CrossRef]
- Pavlović, I.; Mlinarić, S.; Tarkowská, D.; Oklestkova, J.; Novák, O.; Lepeduš, H.; Bok, V.V.; Brkanac, S.R.; Strnad, M.; Salopek-Sondi, B. Early Brassica Crops Responses to Salinity Stress: A Comparative Analysis Between Chinese Cabbage, White Cabbage, and Kale. Front. Plant Sci. 2019, 10, 450. [Google Scholar] [CrossRef] [PubMed]
- Kimera, F.; Mugwanya, M.; Dawood, M.; Sewilam, H. Growth Response of Kale (Brassica oleracea) and Nile Tilapia (Oreochromis niloticus) under Saline Aqua-Sandponics-Vegeculture System. Sci. Rep. 2023, 13, 2427. [Google Scholar] [CrossRef]
- Kratky, B.A. A Suspended Net-Pot, Non-Circulating Hydroponic Method for Commercial Production of Leafy, Romaine, and Semi-Head Lettuce. Veg. Crops 2010, 1, 1–19. [Google Scholar]
- Fernandez, G.C.J. Design and Analysis of Commonly Used Comparative Horticultural Experiments. HortScience 2007, 42, 1052–1069. [Google Scholar] [CrossRef]
- Piližota, V. Chapter 12—Fruits and Vegetables (Including Herbs). In Food Safety Management, 2nd ed.; Andersen, V., Lelieveld, H., Motarjemi, Y., Eds.; Academic Press: San Diego, CA, USA, 2023; pp. 235–268. ISBN 978-0-12-820013-1. [Google Scholar]
- Resh, H.M. Hydroponic Food Production: A Definitive Guidebook for the Advanced Home Gardener and the Commercial Hydroponic Grower, 8th ed.; CRC Press: Boca Raton, FL, USA, 2022; ISBN 978-1-00-313325-4. [Google Scholar]
- Chowdhury, M.; Kiraga, S.; Islam, M.N.; Ali, M.; Reza, M.N.; Lee, W.-H.; Chung, S.-O. Effects of Temperature, Relative Humidity, and Carbon Dioxide Concentration on Growth and Glucosinolate Content of Kale Grown in a Plant Factory. Foods 2021, 10, 1524. [Google Scholar] [CrossRef]
- Catigday, C.J.A.; Sace, C.; Pascual, C.; Malamug, V. Relationships of Water Quality Parameters for Hydroponic Production of Kale (Brassica oleracea) with In-Ground Passive Cooling System. CLSU Int. J. Sci. Technol. 2023, 7, 63–73. [Google Scholar] [CrossRef]
- Harborne, J.B. Methods of Plant Analysis. In Phytochemical Methods: A Guide to Modern Techniques of Plant Analysis; Harborne, J.B., Ed.; Springer: Dordrecht, The Netherlands, 1984; pp. 1–36. ISBN 978-94-009-5570-7. [Google Scholar]
- Roshanak, S.; Rahimmalek, M.; Goli, S.A.H. Evaluation of Seven Different Drying Treatments in Respect to Total Flavonoid, Phenolic, Vitamin C Content, Chlorophyll, Antioxidant Activity and Color of Green Tea (Camellia sinensis or C. assamica) Leaves. J. Food Sci. Technol. 2016, 53, 721–729. [Google Scholar] [CrossRef]
- Fassel, V.A. Current and potential applications of inductively coupled plasma (icp)-atomic emission spectroscopy (aes) in the exploration, mining, and processing of materials. In Analytical Chemistry in the Exploration, Mining and Processing of Materials; Strasheim, A., Steele, T.W., Eds.; Elsevier: Pergamon, Turkey, 1978; pp. 1533–1545. ISBN 978-0-08-021199-2. [Google Scholar]
- Shapiro, S.S.; Wilk, M.B. An Analysis of Variance Test for Normality (Complete samples). Biometrika 1965, 52, 591–611. [Google Scholar] [CrossRef]
- R: The R Project for Statistical Computing. Available online: https://www.r-project.org/ (accessed on 7 September 2024).
- Zhang, J.-L.; Shi, H. Physiological and Molecular Mechanisms of Plant Salt Tolerance. Photosynth. Res. 2013, 115, 1–22. [Google Scholar] [CrossRef] [PubMed]
- Zhao, K.-F.; Harris, P.J.C. The Effects of Iso-Osmotic Salt and Water Stresses on the Growth of Halophytes and Non-Halophytes. J. Plant Physiol. 1992, 139, 761–763. [Google Scholar] [CrossRef]
- Yadav, S.; Irfan, M.; Ahmad, A.; Hayat, S. Causes of Salinity and Plant Manifestations to Salt Stress: A Review. J. Environ. Biol. 2011, 32, 667–685. [Google Scholar] [PubMed]
- Levitt, J. Responses of Plants to Environmental Stresses. Volume II. Water, Radiation, Salt, and Other Stresses. 1981. Available online: https://www.cabidigitallibrary.org/doi/full/10.5555/19810720211 (accessed on 4 November 2024).
- Muthusamy, M.; Lee, S.I. Abiotic Stress-Induced Secondary Metabolite Production in Brassica: Opportunities and Challenges. Front. Plant Sci. 2024, 14, 1323085. [Google Scholar] [CrossRef]
- Aazami, M.A.; Rasouli, F.; Ebrahimzadeh, A. Oxidative Damage, Antioxidant Mechanism and Gene Expression in Tomato Responding to Salinity Stress under in Vitro Conditions and Application of Iron and Zinc Oxide Nanoparticles on Callus Induction and Plant Regeneration. BMC Plant Biol. 2021, 21, 597. [Google Scholar] [CrossRef]
- Ahmed, B.A.O.; Yamamoto, T.; Rasiah, V.; Inoue, M.; Anyoji, H. The Impact of Saline Water Irrigation Management Options in a Dune Sand on Available Soil Water and Its Salinity. Agric. Water Manag. 2007, 88, 63–72. [Google Scholar] [CrossRef]
- Murkute, A.A.; Sharma, S.; Singh, S.K. Citrus in Terms of Soil and Water Salinity: A Review. J. Sci. Ind. Res. 2005, 64, 393–402. [Google Scholar]
- Parvin, K.; Hasanuzzaman, M.; Bhuyan, M.B.; Mohsin, S.M.; Fujita, M. Quercetin Mediated Salt Tolerance in Tomato through the Enhancement of Plant Antioxidant Defense and Glyoxalase Systems. Plants 2019, 8, 247. [Google Scholar] [CrossRef]
- Baum, M.; Grando, S.; Backes, G.; Jahoor, A.; Sabbagh, A.; Ceccarelli, S. QTLs for Agronomic Traits in the Mediterranean Environment Identified in Recombinant Inbred Lines of the Cross “Arta” × H. spontaneum 41-1. Theor. Appl. Genet. 2003, 107, 1215–1225. [Google Scholar] [CrossRef]
- Saleh, A.L.; Hussein, M.M.; El-Faham, S.Y.; Abo-El-Kier, M.S.; El-Kader, A. Minerals in Barley Grains as Affected by Benzyl Adenine and Salinity from Diluted Seawater. In Proceedings of the 17th World Congress of Soil Science, Bangkok, Thailand, 14–21 August 2002; pp. 14–20. [Google Scholar]
- Shahid, M.A.; Sarkhosh, A.; Khan, N.; Balal, R.M.; Ali, S.; Rossi, L.; Gómez, C.; Mattson, N.; Nasim, W.; Garcia-Sanchez, F. Insights into the Physiological and Biochemical Impacts of Salt Stress on Plant Growth and Development. Agronomy 2020, 10, 938. [Google Scholar] [CrossRef]
- Raza, M.A.; Gul, H.; Yang, F.; Ahmed, M.; Yang, W. Growth Rate, Dry Matter Accumulation, and Partitioning in Soybean (Glycine max L.) in Response to Defoliation under High-Rainfall Conditions. Plants 2021, 10, 1497. [Google Scholar] [CrossRef] [PubMed]
- Alsudays, I.M.; Alshammary, F.H.; Alabdallah, N.M.; Alatawi, A.; Alotaibi, M.M.; Alwutayd, K.M.; Alharbi, M.M.; Alghanem, S.M.S.; Alzuaibr, F.M.; Gharib, H.S.; et al. Applications of Humic and Fulvic Acid under Saline Soil Conditions to Improve Growth and Yield in Barley. BMC Plant Biol. 2024, 24, 191. [Google Scholar] [CrossRef] [PubMed]
- Balasubramaniam, T.; Shen, G.; Esmaeili, N.; Zhang, H. Plants’ Response Mechanisms to Salinity Stress. Plants 2023, 12, 2253. [Google Scholar] [CrossRef]
- Colin, L.; Ruhnow, F.; Zhu, J.-K.; Zhao, C.; Zhao, Y.; Persson, S. The Cell Biology of Primary Cell Walls during Salt Stress. Plant Cell 2023, 35, 201–217. [Google Scholar] [CrossRef]
- Alam, R.; Das, D.K.; Islam, M.R.; Murata, Y.; Hoque, M.A. Exogenous Proline Enhances Nutrient Uptake and Confers Tolerance to Salt Stress in Maize (Zea mays L.). Progress. Agric. 2016, 27, 409–417. [Google Scholar] [CrossRef]
- Ahmed, S.; Heo, T.-Y.; Roy Choudhury, A.; Walitang, D.I.; Choi, J.; Sa, T. Accumulation of Compatible Solutes in Rice (Oryza sativa L.) Cultivars by Inoculation of Endophytic Plant Growth Promoting Bacteria to Alleviate Salt Stress. Appl. Biol. Chem. 2021, 64, 68. [Google Scholar] [CrossRef]
- Larcher, W. Physiological Plant Ecology: Ecophysiology and Stress Physiology of Functional Groups, 8th ed.; Springer Science & Business Media: Berlin, Germany, 2003; ISBN 978-3-540-43516-7. [Google Scholar]
- Carillo, P.; Grazia, M.; Pontecorvo, G.; Fuggi, A.; Woodrow, P. Salinity Stress and Salt Tolerance; IntechOpen: London, UK, 2011. [Google Scholar] [CrossRef]
- Atta, K.; Mondal, S.; Gorai, S.; Singh, A.P.; Kumari, A.; Ghosh, T.; Roy, A.; Hembram, S.; Gaikwad, D.J.; Mondal, S.; et al. Impacts of Salinity Stress on Crop Plants: Improving Salt Tolerance through Genetic and Molecular Dissection. Front. Plant Sci. 2023, 14, 1241736. [Google Scholar] [CrossRef]
- Pitura, K.; Jarosz, Z. Chemical composition and biological value of kale depending on the varied mineral fertilization. Agron. Sci. 2020, 75, 97–107. [Google Scholar] [CrossRef]
- Sevengor, S.; Yasar, F.; Kusvuran, S.; Ellialtioglu, S. The Effect of Salt Stress on Growth, Chlorophyll Content, Lipid Peroxidation and Antioxidative Enzymes of Pumpkin Seedling. Afr. J. Agric. Res. 2011, 6, 4920–4924. [Google Scholar]
Disclaimer/Publisher’s Note: The statements, opinions and data contained in all publications are solely those of the individual author(s) and contributor(s) and not of MDPI and/or the editor(s). MDPI and/or the editor(s) disclaim responsibility for any injury to people or property resulting from any ideas, methods, instructions or products referred to in the content. |
© 2024 by the authors. Licensee MDPI, Basel, Switzerland. This article is an open access article distributed under the terms and conditions of the Creative Commons Attribution (CC BY) license (https://creativecommons.org/licenses/by/4.0/).