Article

Analyzing the Effectiveness of Carbon Pricing Instruments in Reducing Carbon Emissions in Major Asian Economies

1
School of Business, Macau University of Science and Technology, Macau SAR, China
2
Faculty of Innovation Engineering, Macau University of Science and Technology, Macau SAR, China
3
Faculty of Business, Hong Kong Polytechnic University (PolyU), Hong Kong SAR, China
*
Authors to whom correspondence should be addressed.
Sustainability 2024, 16(23), 10542; https://doi.org/10.3390/su162310542
Submission received: 14 July 2024 / Revised: 27 November 2024 / Accepted: 27 November 2024 / Published: 1 December 2024

Abstract

:
Carbon Pricing Instruments (CPIs), such as Carbon Taxes and Emission Trading Schemes (ETSs), have been launched in several countries, primarily in Europe and North America, as a means of limiting the emissions of greenhouse gases (GHGs) which have been known to cause climate change. The adoption of these measures in Asia has been controversial, with many arguing that they would limit economic development in the region. We review the CPIs of 18 Asian economies, 7 of which have adopted a CPI during our review period from 1990 to 2021. We perform a comparative analysis of the economies in Asia, applying the Kaya Identity to decompose the variables affecting carbon emissions and the Nearest Neighbor Matching technique to compare the effect that CPIs have on countries adopting these policies relative to other jurisdictions. We found a positive and significant effect of CPIs on reducing carbon emissions in the Asian countries compared in our study. This offers crucial insights for policymakers, stressing the effectiveness of CPIs in balancing environmental sustainability with economic development in the region.

1. Introduction

Climate change is widely accepted as a global issue, with most governments recognizing it as the most significant challenge of this generation, as evidenced by the Paris Agreement signed by 189 countries to combat climate change [1]. While the Paris Agreement does not include specific economic measures, it is widely recognized that economic measures are a necessary part of each country’s climate change actions, and these are frequently adopted as part of each country’s respective Nationally Determined Contributions (NDCs). Economic measures to reduce GHGs are still in their infancy, and a wide array of approaches, such as Carbon Pricing Instruments (CPIs), (including Carbon Taxes, Emission Trading Schemes (ETSs), and government subsidies supporting energy efficient solutions and new energy technologies, are being taken to provide economic incentives to reduce carbon emissions.
Understanding the economic rationale for CPIs requires revisiting the foundational concepts of externalities in economics. Under modern economic theory, the environmental costs of products and services should be accounted for appropriately in the cost of manufactured goods or the provision of services. Many credit Arthur Cecil Pigou for originating these concepts in his work The Economics of Welfare [2]. Pigou discussed the concept of externalities, in which costs not incurred by those delivering products or services are considered negative externalities. Conversely, benefits that are not provided are considered positive externalities. Pigou theorized that these externalities could be reflected in the economy through reallocation, by levying taxes in the case of negative externalities, and by awarding subsidies in the case of positive externalities. Although Pigou developed the theory in 1920, it was not until the 1970s [3,4,5] that in-depth research on these concepts was first conducted.
While modern economic theory on externalities provides a strong foundation for understanding the economic rationale behind carbon pricing, behavioral economic theories offer additional insight into how psychological effects impact how businesses respond to such policies. Behavioral economic theory suggests that negative incentives, such as taxes, can significantly influence business activity, albeit in complex ways. From a traditional economic standpoint, higher taxes are expected to increase business efficiencies by reducing profitability. However, behavioral economics introduces the concept of bounded rationality and other cognitive biases, such as hyperbolic discounting [6] and mental accounting [7], which might lead to less predictable responses [8]. How taxes are framed can impact the perception of decision makers, thereby influencing the corresponding reaction [9]. A business might perceive higher taxes not just as a financial burden but also as a signal of changing societal or regulatory expectations, potentially spurring innovation or shifts in business strategy to adapt to perceived future trends. Business managers can react to taxation in many ways, including innovation or geographic mobility. This human behavior goes beyond simple cost calculations, influencing the psychological and strategic dimensions of business decision-making. The cost of the Carbon Price may be a driving factor in firm responses. Where Carbon Prices are in the lower range, businesses may not take much action, preferring a course of expediency and profit sufficiency as opposed to profit maximization. However, in the case of Carbon Prices in a higher range, or where there is a dramatic shift in carbon pricing policy, this could trigger businesses to relocate activities to areas of lower regulatory costs or to adopt climate innovation policies or products in their business [10].
Although research began in the 1970s [3,4,5], it took another two decades for the first countries to even begin implementing a Carbon Pricing Instrument. CPIs have been growing quickly in the past few years, and now, more than 70 CPIs exist in practice, including many subnational and municipal schemes [11] (See Figure A1 in Appendix A below for a graphical illustration). These schemes are now common in Europe, with most countries in the European Union employing some form of Carbon Tax. In North America, Canada has implemented Carbon Taxes, and several US States have implemented CPIs. China has implemented ETS on a pilot basis and recently adopted a national ETS. But at present, only 23% of GHGs are included in some form of CPI [11].
CPIs have seen lower levels of adoption in Asia, with many arguing that their usage would slow necessary economic development. Extensive research has been conducted on the impact that CPIs have on carbon emissions in OECD [12] and European countries [13,14]. Best et al. studied the effect of CPIs globally and estimated an effect of a 2% reduction in the growth rate of CO2 emissions from fuel combustion, using various econometric models to account for how CPIs affected emissions growth rates [15]. Haites performed a thematical review of other studies, which included New Zealand, China, and Japan, and did not note significant effects of CPIs on carbon emissions [16]. Wang, H., & Wei, W [17] included China and India in their analysis of the interaction that environmental regulation and technological innovation have in regard to greenhouse gas emissions in OECD and emerging economies. While their analysis did not specifically study the effect of a CPI, they did analyze environmental regulation in general. Their findings predicted that a heavy burden of environmental regulation would create a “green paradox” that would lead to an increase in GHG emissions due to an imperfect policy and lack of technological innovation [17]. He et al. [18] found that energy taxes in OECD countries led to improved energy efficiency. Additionally, they found that CPIs appeared to accelerate the adoption of low-emission technologies. However, they did not study whether such adoptions resulted in decreased emissions overall. Thus, it is still not well understood whether implementing CPI results in reduced GHG emissions.
Furthermore, except for research in China [19], the impact of CPIs adopted in Asia, with a large percentage of emerging economies, has not been widely understood. A meta-review by Green found only a limited number of qualitative studies focused on the effectiveness of CPIs in reducing CO2 emissions, with the majority focused on Europe [20]. In a study on environmental implications in BRICS countries (i.e., Brazil, Russia, India, China, and South Africa), the authors determined that increased globalization, as opposed to climate action, was the main driver in increasing environmental policies, such as environmental taxes and sustainable development initiatives, including environmental innovation [21]. Conversely, Shi et al. [22] reviewed the relationship between the ETS in Shanghai and Shenzhen, as well as between the ETS in the European Union and China, and found a positive relationship between the Shanghai and Shenzhen exchanges, but no significant relationship between the EU and China exchanges.
CPIs are measures adopted and implemented by different economies to recoup the economic costs of environmental degradation. While there are differences between Carbon Taxes and ETS, both are considered Carbon Pricing Instruments. A Carbon Tax will create a direct cost of carbon emissions, whereas ETS will generate a cost indirectly through market allocation. In addition, both systems are considered similar in terms of their effectiveness as an incentive to reduce carbon emissions [23]. For this analysis, we are interested in understanding the impact that such pricing mechanisms have on actual GHGs in the region. As such, we include both Carbon Taxes and ETS when looking at CPIs broadly.
There remains a research gap in understanding the effectiveness that CPIs have in reducing carbon emissions. A survey of roughly 800 researchers showed that the most common knowledge gaps were among how CPIs work and understanding their long-term effects [24]. This is particularly true in Asia, given the lack of research in the region. Asia makes up a significant and growing share of GHG emissions, with 27% in 2020 and an expectation to grow an additional 16% from 2019 to 2030 [25]. In a recent assessment of meeting UN Sustainable Development Goals (SDGs) for climate action, UNESCAP assessed Asia’s progress from 2015 to 2023 as regressing mainly due to ineffective climate policies [26]. Therefore, understanding relevant tools to combat climate change in Asia is critically important. The goal of the present study is to analyze whether the adoption of CPIs in Asian countries results in a significant reduction in GHG emissions. Understanding the relationship between CPIs and carbon emissions is necessary as policy makers continue to work towards their climate change commitments. Building on the global context of climate action, the subsequent section examines how Asian economies have adopted CPIs to combat GHGs.

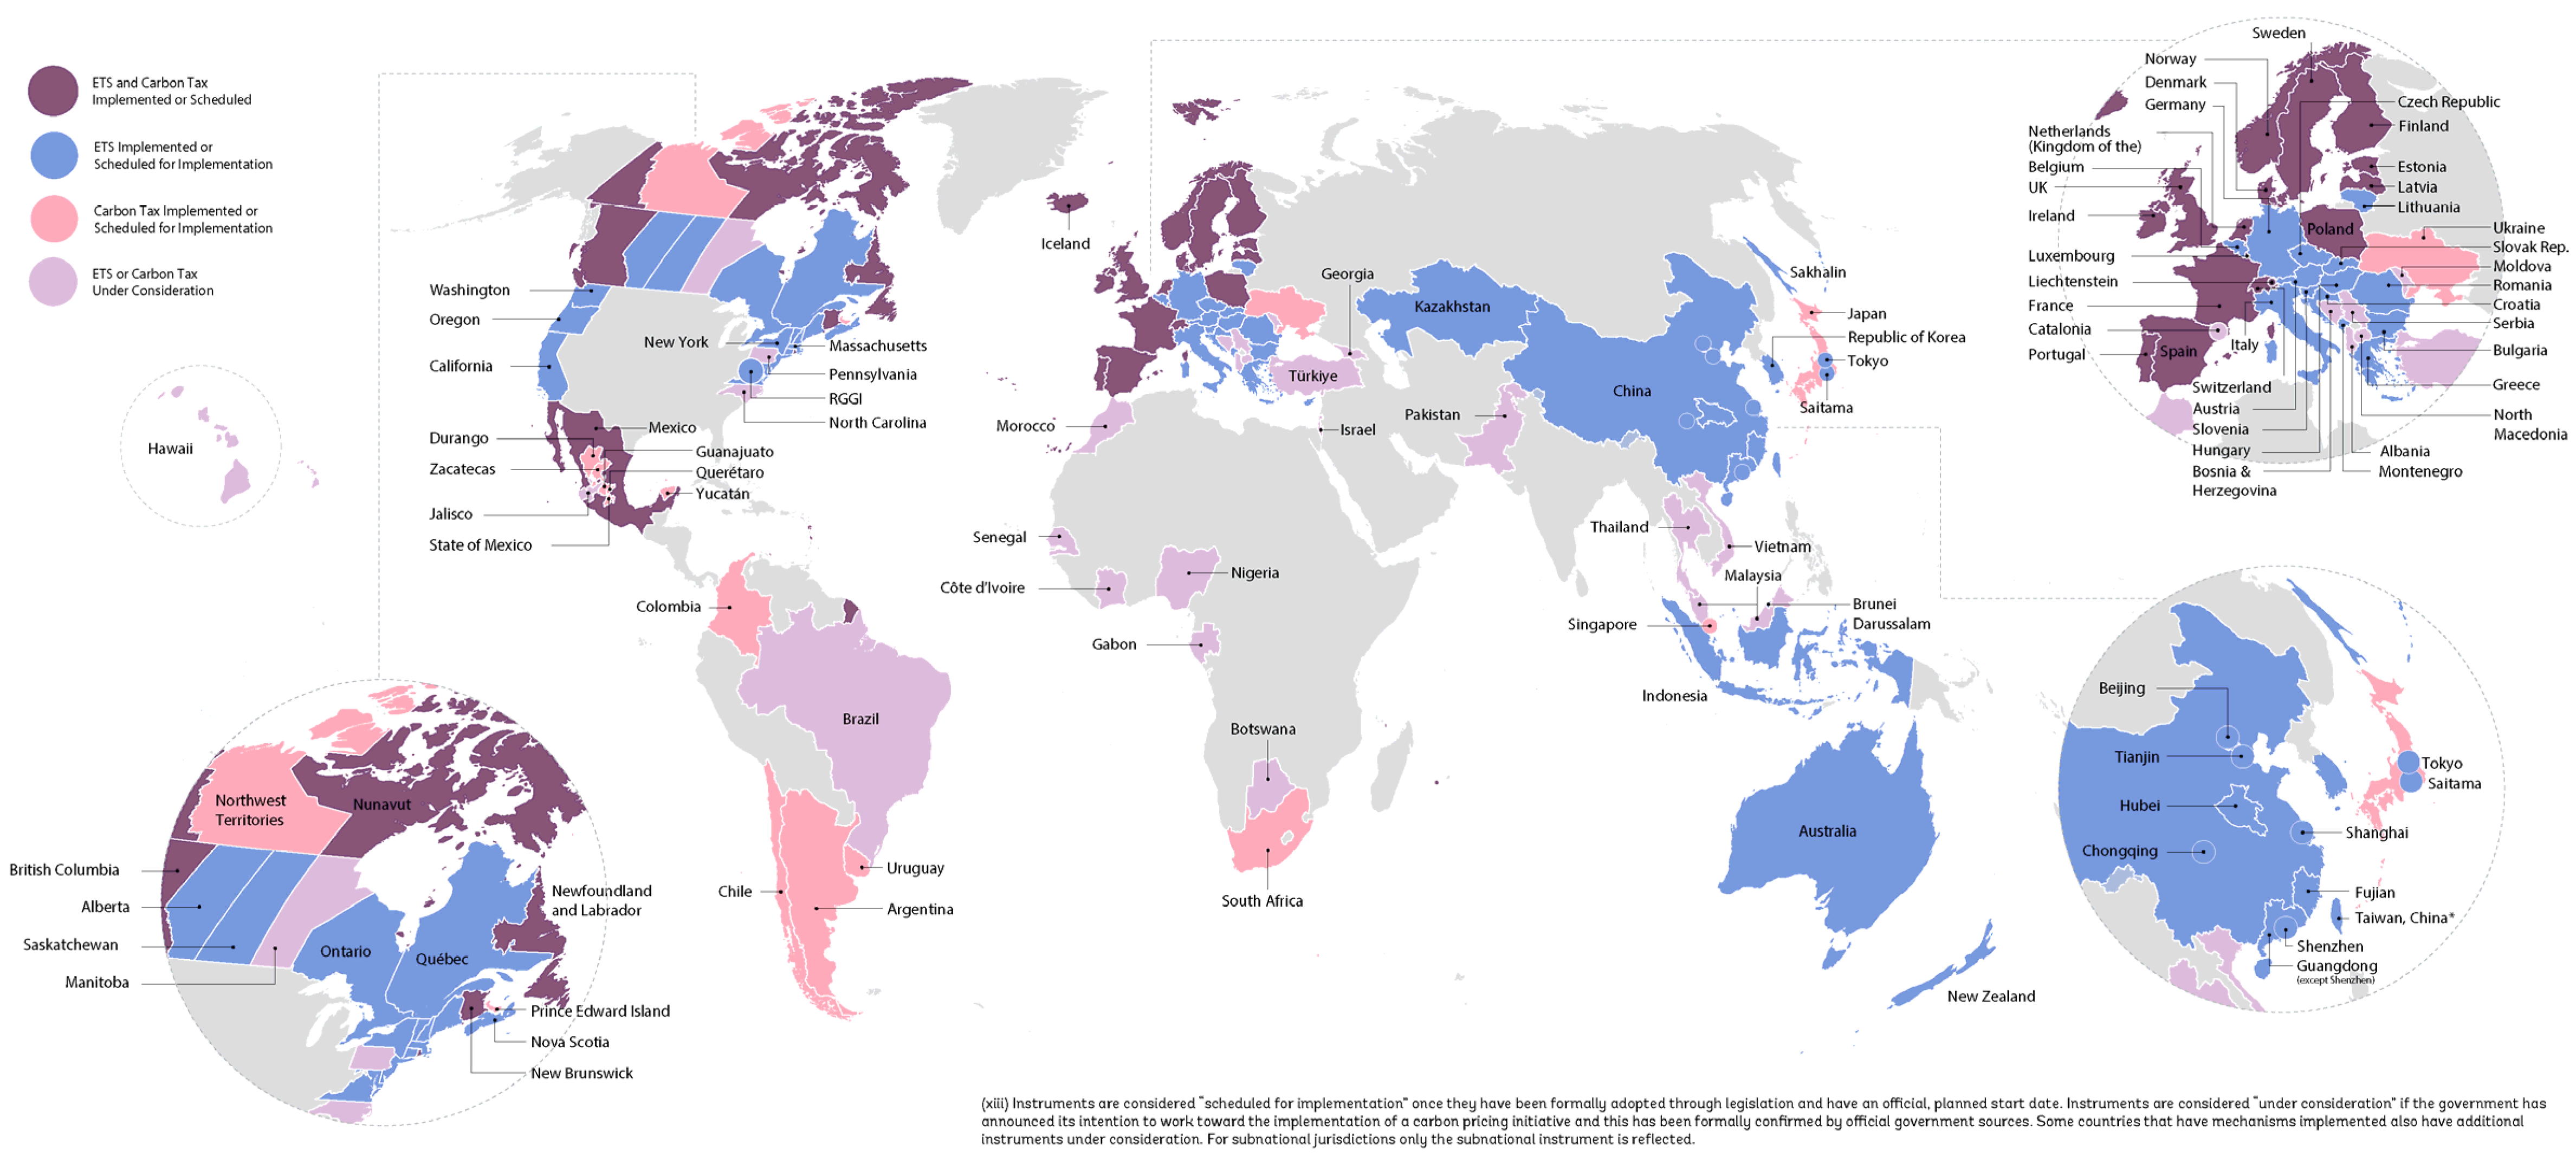
Adoption of Carbon Pricing Instruments in Asia

These approaches have been adopted by various Asian countries to curb the adverse effects of GHGs. Truong [27] suggests that CPIs can be leveraged to induce a reduction in the intensity of emissions where efficiency is evident. The Asian countries that practice CPIs include Australia, Indonesia, South Korea, Singapore, Japan, and China [11]. As Indonesia only recently adopted a Carbon Tax system in 2023, we lacked sufficient post-adoption data to include them in the testing group. Each country’s application of the different CPIs and their effectiveness varies. Asia’s share of GHGs is continuing to increase and is expected to reach 50% of global GHG emissions by 2030; thus, the study of GHG mitigation in the region is critically important [28]. Given the variation in CPI adoption across Asian economies, it is crucial to evaluate how these pricing mechanisms have translated into real reductions in GHGs. The following analysis presents a detailed examination of the outcomes and effectiveness of CPIs in different jurisdictions.
In 2012, Japan was the first Asian country to introduce a Carbon Tax as part of the Kyoto Protocol agreement [29]. The Japanese global warming tax is designed to control the consumption of fossil fuels in the country. In 2007, the Japanese government wanted to impose a Carbon Tax of USD 20/ton of carbon [30]. The tax imposes JPY 289 for every metric ton of CO2 emissions [31]. The proposed taxes vary by fuel type and were scheduled to be increased gradually to fulfill implementation by the close of 2016. However, the tax rate was frozen in 2016, with no plans for additional increases. Despite this setback, Japan still had the aim of achieving a 20% reduction in their level of emissions by 2020 [32]. According to Nikkei Asia [33], Japan has demonstrated a substantial reduction in its GHGs through the implementation of Carbon Taxes. Emphasis on the taxes’ importance in climate action is linked to the ambition of reducing its emissions by 80% by 2050 [1,32,34]. Saveyn, et al. [35] also attest to the effectiveness of Carbon Taxes in Japan by highlighting the country’s ambition to achieve carbon neutrality by 2050.
The effectiveness of the application of CPIs is exemplified by the implementation of the Tokyo Cap-and-Trade program. According to the Tokyo Metropolitan Government [36], the program was implemented in 2010 to ensure that all large-scale manufacturers commit to reducing carbon emissions. Subsequently, the city achieved a 23% reduction in its carbon emissions by 2013 [36]. Overall, Japan has spearheaded the implementation of CPIs in the Asian continent [37,38].
South Korea implemented the low-carbon-green growth policies and cap-and-trade scheme in 2012. Specifically, the carbon reduction scheme developed in 2012 entailed an ETS [39]. However, after the enactment of the laws, it took until 2015 for them to take effect [40]. According to Kawakatsu et al. [29], the introduction of tax reform and a Carbon Tax were overlooked at the national level in South Korea until 2017. Korea’s adoption of the green economic growth model significantly contributed to a reduction in emissions in the initial years until the rise of President Park Geun-hye, who emphasized rapid economic growth at the expense of sustainability. During this period, the government changed its allowances to 100%, eliminating the need for companies to reduce emissions as long as they stayed in the range of the average of the previous three years’ emissions, and the pricing in the market became too low for companies to sell [40]. In a study of Korea’s CPI effectiveness, Tan et al. found that the CPI had an insignificant effect on improving the efficiency of industry as a whole and recommended further reforms to Korea’s ETS [41]. In late 2022, the Ministry of Environment began implementing measures to improve the effectiveness of the Carbon Tax [42] and is currently undergoing extensive policy reforms. Due to the inconsistent treatment of the Carbon Tax in South Korea, we did not include it in our sample group.
Despite China’s commitment to achieving carbon reduction targets, CPIs at a national level have been frequently postponed. According to Kawakatsu et al. [29], the government aims to achieve minimal energy intensity alongside a reduced carbon footprint. However, in China, ETS were more limited in their sectoral or regional scope [43]. The argument for China and India not to impose any CPI concerns the possibility of creating serious negative economic outcomes. Many argue it could lead to increased energy costs and limit economic growth in both economies. One study estimated a drop of 0.19% to 1.44% in China’s GDP from enacting the national ETS program [44]. Nevertheless, China managed to eventually build upon the pilot and regional ETS programs to implement a national ETS in 2021. Under the China national ETS, it is estimated that 2000 power sector companies are regulated, accounting for 40% of the country’s CO2 emissions [45].
Taiwan has also failed to develop and implement any form of CPI to curb GHG emissions in the region. Despite many arguments in previous governments regarding the imposition of Carbon Taxes in the country, it has been continuously met with stiff resistance by influential industry players, rendering such efforts futile [29]. This political gridlock has led to repeated delays in the implementation of Taiwan’s Carbon Tax scheme. In 2023, Taiwan passed the Climate Change Response Act, which introduced a carbon fee system that is scheduled to be implemented in 2024 [46], although companies may not start paying fees until 2025 [47]. Taiwan CPI studies include research on detailed implementation recommendations such as simplicity, transparency, and transition support [46]. Taiwan may be on the way to implementing a CPI, but the effect of this is outside of our study period.
Hasnu and Muhammad [48] argue that implementing a Carbon Tax in Malaysia would positively impact the long-term sustainable growth of the country by increasing the tax revenue base and more effectively promoting the development of sustainable industries. Several modeling analyses also support this theory with the redistribution of government revenues leading to reductions in unemployment and long-term increases in GDP growth [49]. While a 2022 International Monetary Fund (IMF) study concludes that CPIs in Asia produce negative outcomes on household incomes, this study goes on to conclude that social welfare policies leveraging the proceeds from CPIs could effectively mitigate the harmful outcomes [25]. As the detailed implementation of the CPI can vary in terms of the industries covered, emissions covered, and pricing levels, we have prepared the below Table 1 (Characteristics of Carbon Pricing Instruments in selected jurisdictions) to help demonstrate the variations in Asia and compare them to selective CPIs in other jurisdictions.
While theoretical analysis using predictive models suggests minimal harmful effects of Carbon Pricing Instruments (CPIs), it is essential to validate their effectiveness in the reduction in greenhouse gas (GHG) emissions using empirical historical data. This study employs a comparative analysis of regional CPI measures and their impact on historical CO2 emissions, utilizing the Kaya Identity (KI) to decompose emissions into key drivers—population, wealth, energy intensity, and carbon intensity. To isolate the treatment effect of CPIs, we implement Nearest Neighbor Matching (NNM) to align treated economies with comparable control economies based on critical covariates like GDP per capita and energy intensity, minimizing confounding influences. Subsequently, we conduct regression analysis on the matched pairs to estimate the average treatment effect (ATE) of CPIs, providing a statistically robust evaluation of their impact on CO2 emissions while controlling for economic and energy-related variability.

2. Materials and Methods

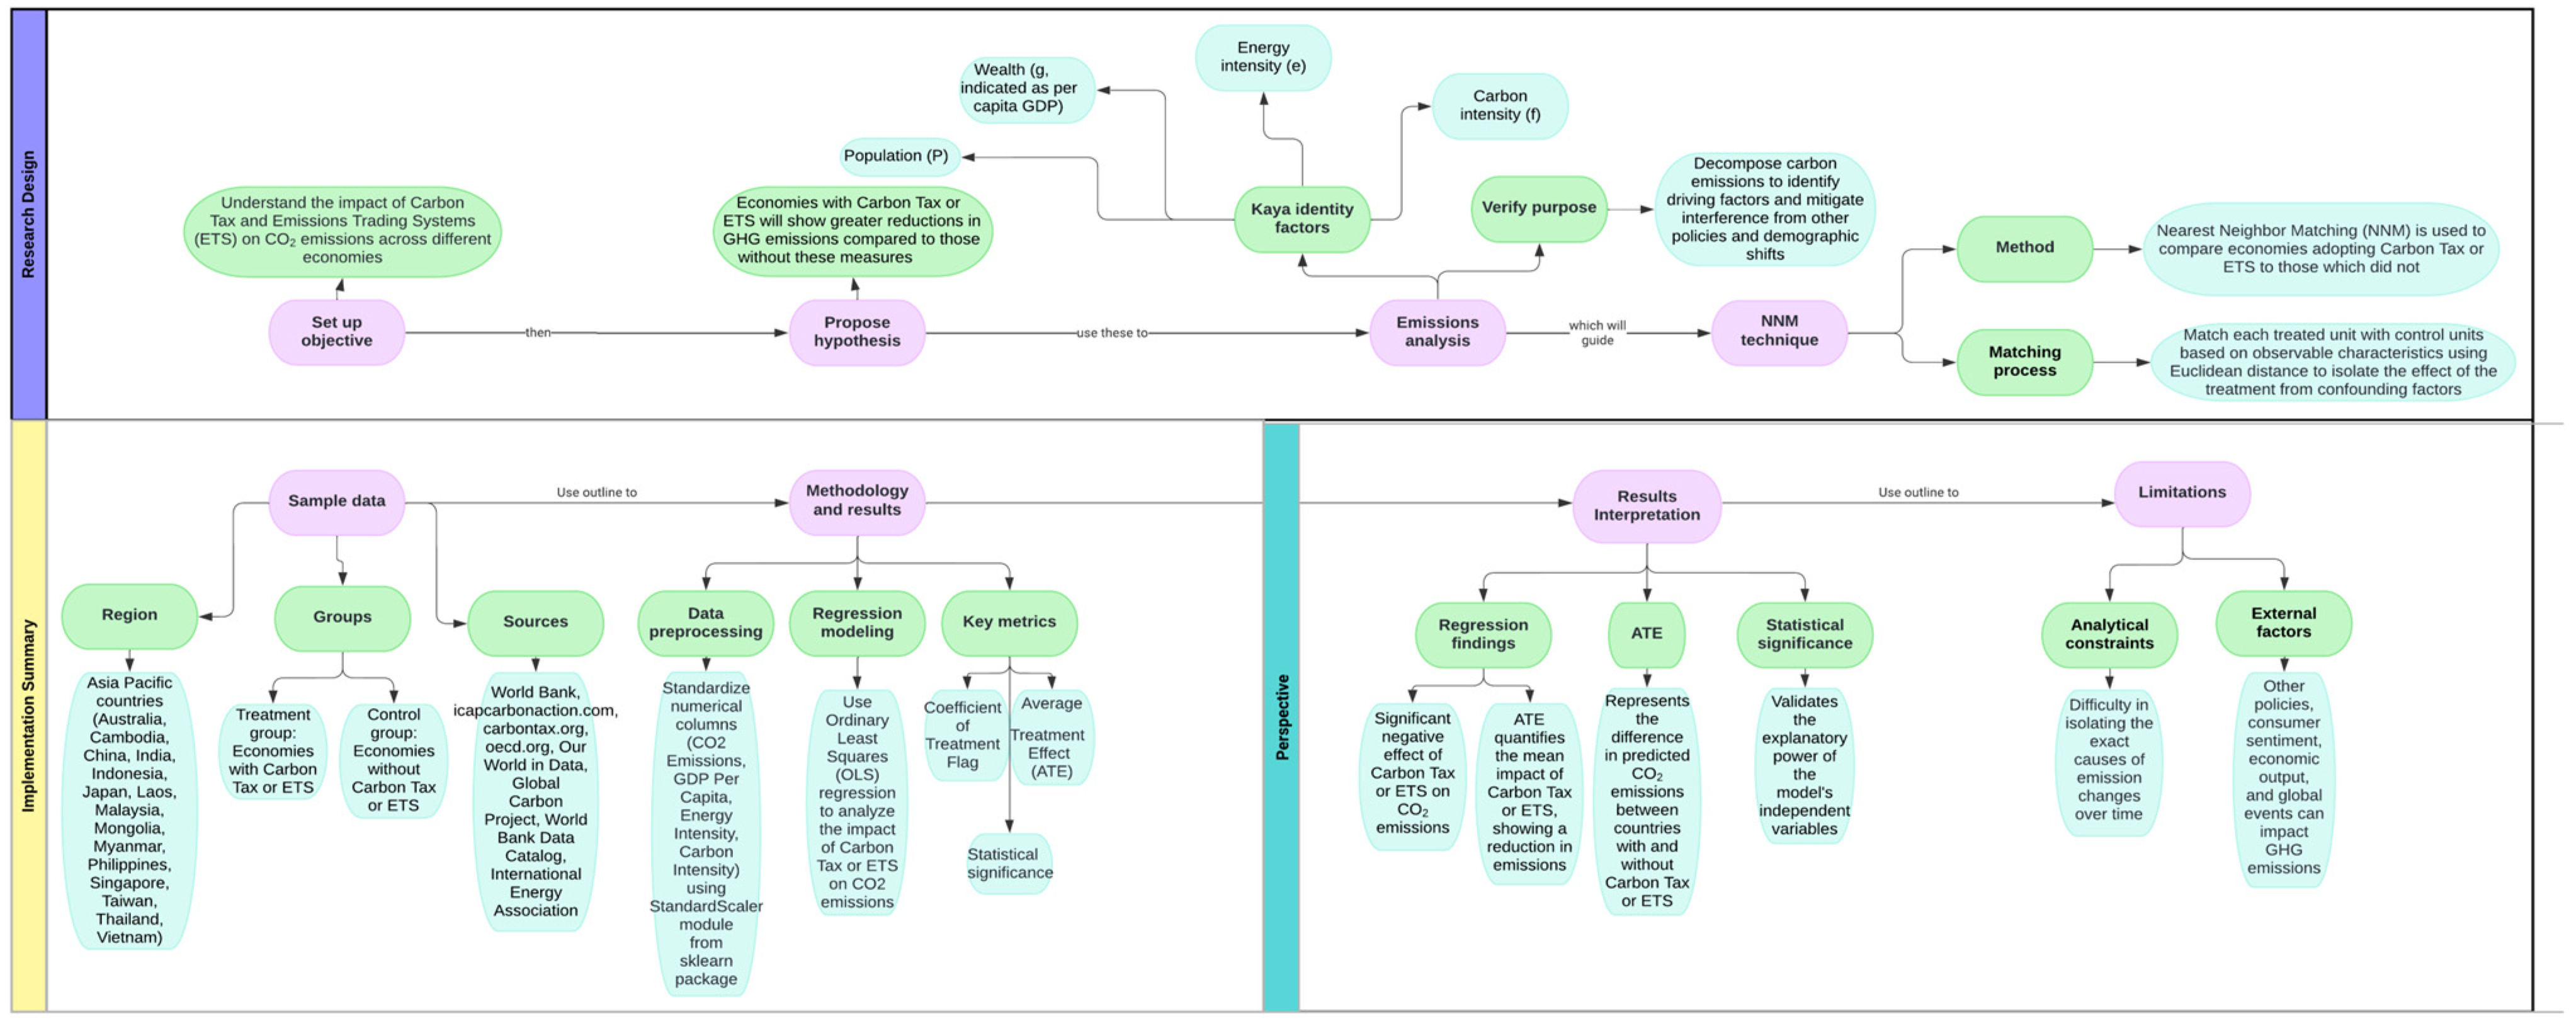
2.1. Research Design and Implementation

This comparative approach involved first understanding the varying CPIs in practice across the region and then comparing those economies in terms of the effect that such policy adoption has had on CO2 emissions. We hypothesize that economies adopting these measures will experience a greater reduction in GHG emissions compared to those that do not.
The emissions of GHGs are caused by complex links between human activity and energy composition. The driving factors behind GHG emissions can be hard to identify. The Kaya Identity (KI) was designed as a means to decompose carbon emissions (F) into four drivers: population (P), wealth (g), energy intensity (e), and carbon intensity (f). Where g is indicated as per capita GDP (GDPC = GDP/POP), e is indicated as (PE/PIE), and f is indicated as (CO2/PE), with PE representing primary energy [13,50]. Comparing KI allows us to mitigate the possible interference of other policies and demographic shifts in evaluating the outcomes of GHG mitigations in the tested economies.
To compare the economies adopting CPIs to those that do not, we implemented the Nearest Neighbor Matching (hereafter referred to as NNM), following the technique of Ghazouani et al. [13], who employed NNM in European Economies. NNM is a technique employed in economic analysis as a method used to estimate causal effects in observational studies [51]. It involves matching each treated unit (e.g., an individual or group exposed to a specific policy or intervention, in this case, the implementation of a CPI) with one or more control units that are similar in characteristics but have not received treatment (i.e., those economies which have not adopted a CPI). We chose NNM over alternatives such as Propensity Score Matching (PSM) because NNM offers greater flexibility in multidimensional matching. While PSM balances treatment and control groups using a single composite score, NNM matches units based on multiple covariates, such as GDP per capita and energy intensity, allowing us to capture more detailed economic and environmental dimensions relevant to our analysis. This similarity is typically measured based on various observable characteristics, and the closest match (or neighbors) is identified using a specific distance metric, like Euclidean distance. By comparing outcomes between these matched pairs, we aim to isolate the effect of the treatment from other confounding factors (in this case, the decomposed Kaya Identity variables), thereby approximating a randomized experimental design.

2.2. Sample

Our data set includes Asia Pacific Countries for which reliable information was accessible (Australia, Cambodia, China, India, Indonesia, Japan, Laos, Malaysia, Mongolia, Myanmar, Philippines, Singapore, Taiwan, Thailand, and Vietnam). The data set is further divided into a treatment group (for which a CPI was implemented during the period under study) and a control group (for which a CPI was not in place during the period under study). The breakdown of the treatment and control groups, along with the respective years of adoption, is shown in the table below.
In understanding the applicable policies, we referred to the World Bank’s study on Carbon Taxes, [11] which included information on the economy’s year of adoption of the measures, the type of measure implemented, and other notable information, such as limitations in terms of applicable industries or geographies included in the measures (See Table 2). Additional information on the applicable measures was obtained from icapcarbonaction.com, carbontax.org, and oecd.org.
Data on CO2 emissions for the economies included in this study were taken first from the Our World in Data website, which collates data through 2021 (See Figure A2 in Appendix A) [52]. The source of this comes from the Global Carbon Project: Carbon Dioxide Information Analysis Center [53]. The data for the Kaya Identity factors were mainly derived from the World Bank Data Catalog [54], except for energy intensity, which was derived from the International Energy Association [55]. A graphical representation of the Kaya Identity factors is shown below in Appendix B.

2.3. Methodology

This section delineates our method for investigating the effects of CPIs on CO2 emissions.

2.4. Data Preprocessing

This study employs the StandardScaler module from the sklearn package in Python [56] to standardize significant numerical columns such as CO2 emissions, GDP per capita, energy intensity, and carbon intensity. This standardization is imperative for negating scale-induced biases, thereby establishing a solid basis for an impartial and precise evaluation.

2.5. Nearest Neighbor Matching (NNM)

Employing Nearest Neighbor Matching (NNM) as a crucial analytical tool, this study aims to align treatment and control groups based on pre-treatment characteristics, thereby minimizing selection bias. The matching criterion is articulated as follows:
d X i , X j = k = 1 K X i k X j k 2
where d X i , X j signifies the distance between the treatment unit i and control unit j , with X i k and X j k denoting the values of the K t h covariate for the treatment and control units, respectively, and K represents the total number of covariates utilized for matching.
This alignment is achieved through the application of the Nearest Neighbors algorithm from the sklearn library [56], which determines matches based on the pre-treatment attributes of countries. Importantly, this methodological approach facilitates alignments within similar country cohorts, driven by the algorithm’s capability to match nations based on compatible pre-treatment characteristics—namely GDP per capita, energy intensity, and carbon intensity. We chose GDP per capita and energy intensity because they represent key economic and energy-related factors directly influencing carbon emissions. By controlling these variables, we ensured that the matching process accounted for both the economic capacity and energy efficiency of each country, which are critical when assessing the impact of CPIs on CO2 emissions. These covariates represent economic, energy, and environmental dimensions, respectively, and are instrumental in ensuring that the matches are both relevant and meaningful, reflecting the method’s precision in identifying countries with similar economic, energy, and environmental profiles.
The matching criterion utilizes the Euclidean distance between each treatment unit (country implementing a CPI) and potential control units (countries not implementing a CPI) to secure the closest match based on these covariates. Specifically, for each treatment country, the algorithm selects a control country such that the sum of squared differences across these covariates is minimized. This process ensures the pairing of countries with similar economic, energy, and environmental characteristics before the introduction of a CPI. The methodological sophistication and precision of this approach significantly contribute to the study’s robustness in aligning comparable treatment and control groups, thereby enhancing the validity of the research findings by ensuring that the matched pairs closely resemble each other in key pre-treatment characteristics. Furthermore, this methodological framework enables the matching of temporal data points for a single country, thereby accommodating a longitudinal analysis that considers variations in pre-treatment characteristics over time.

2.6. Regression Modeling

After performing Nearest Neighbor Matching (NNM), we proceeded with a regression analysis using the matched pairs data set. The Ordinary Least Squares (OLS) regression model was employed, with CO2 emissions as the dependent variable and GDP per capita, energy intensity, carbon intensity, and a binary treatment flag for CPI presence (1 for CPI, 0 for no CPI) as independent variables. The coefficient of the treatment flag estimates the Average Treatment Effect (ATE) of CPIs on CO2 emissions, representing the difference in predicted emissions between countries with and without a CPI and holding other factors constant. Diagnostic tests revealed a Durbin–Watson statistic of 0.955, indicating some positive autocorrelation and a condition number of 24.8, showing no significant multicollinearity, confirming the model’s suitability for our analysis.
The Average Treatment Effect (ATE) is defined to quantify the mean impact of the treatment (the CPI policies) on the total population, mathematically represented as follows:
A T E = E [ Y _ 1 Y _ 0 ]
where Y _ 1 and Y _ 0 correspond to the outcomes with and without the treatment, respectively. The calculation of ATE based on this principle enables the assessment of the policy’s effectiveness by measuring the expected change in emissions on a standardized scale. This approach provides a metric to gauge the relative success of environmental policies in reducing emissions, highlighting the importance of evaluating policy impacts through a standardized lens. A flow chart of our methodology and implementation process is graphically illustrated in Figure 1 below.

3. Results

Building on the methodological framework outlined in the previous section, the following results provide empirical insights into the effectiveness of CPIs in reducing GHGs across Asian economies. The regression analysis undertaken to evaluate the influence of CPIs on CO2 emissions unveiled significant findings. The Ordinary Least Squares (OLS) regression model revealed an R2 value of 0.683 (adjusted R2 = 0.654), explaining approximately 68.3% of the variability in CO2 emissions through the model’s independent variables.

3.1. Coefficient Interpretation

Although the effect of GDP per capita (0.5363) was not statistically significant (p > 0.1), indicating no clear impact on CO2 emissions, the effects of energy intensity (−2.63, p < 0.001) and carbon intensity (4.19, p < 0.001) were both significant, suggesting that these factors contribute to carbon emissions. Importantly, the treatment flag showed a significant negative effect (−0.5215, p < 0.05), indicating that implementing a CPI is associated with lower CO2 emissions.

3.2. Average Treatment Effect

The Average Treatment Effect (ATE) serves as a key indicator for evaluating the impact of a CPI on CO2 emissions. By comparing the outcomes between groups subjected to the policy and those that are not, the ATE provides a standardized measure of effect. The ATE was determined using regression analysis, indicating a reduction of 0.521 units. Stated as a percentage of each respective country’s CO2, the ATE represents a 1.91% reduction in emissions relative to the treatment group’s mean.

3.3. Statistical Significance and Diagnostics

The model’s F-statistic (23.21) and associated p-value (2.85 × 10⁻¹⁰) robustly reject the null hypothesis of there being no joint effect of the explanatory variables on CO2 emissions. The Durbin–Watson statistic (0.955) suggests some autocorrelation, which should be considered when interpreting the results. Meanwhile, the condition number (24.8) reduces concerns about multicollinearity, confirming the distinct contributions of the independent variables. Our results demonstrate a clear association between CPIs and CO2 emission reductions. However, to fully understand the effectiveness of CPIs, we must also consider how other factors interact with CPIs. The detailed regression analysis results are shown in the below Table 3.

4. Discussion

Having established the significant impact of CPIs on reducing CO2 emissions, it is now essential to explore how other factors, such as subsidies for renewable energy, fossil fuel subsidies, and consumer preferences for sustainable products and services, interact with CPIs to influence the overall effectiveness of these policies. The following discussion delves deeper into these additional influences and their implications for policy design. Based on the study of CPIs in Asia and the corresponding CO2 emissions in various economies, there is clear evidence that adopting a CPI is associated with a reduction in CO2 emissions. However, additional research could be conducted to better understand this relationship in light of other potential factors, such as climate change policies (e.g., subsidies for sustainable innovation, environmental taxes, and fossil fuel subsidies), consumer preferences for sustainable products, and investor demands for the adoption of climate change policies by invested interests.
While many enterprises voluntarily invest in more sustainable technologies for long-term economic efficiency or due to consumer and investor demands, authorities can further stimulate the adoption of sustainable innovation through financial subsidies. China enacted the Renewable Energy Law in 2005, of which renewable energy subsidies were a major component. In 2024, China committed CNY 5.4 billion in subsidies, down from a high of CNY 7.3 billion in 2023 [57]. While such subsidies are not without criticism for promoting market inefficiencies and anticompetitive opposition [58,59], China’s share of renewable energy has accelerated to more than 50% of energy generation [60]. Malaysia’s Green Technology Financing Scheme provides favorable interest rate loans and subsidies for manufacturers adopting energy-saving technologies with a 2023 budgeted value of RM 3 billion for these subsidies [61]. While the plan faces implementation challenges due to the knowledge gaps of the companies applying and a lack of enthusiasm from the financial institutions participating, the program has helped to encourage sustainable investment [62,63]. Programs such as these interact with the CPI by artificially reducing demand for fossil fuels. Authorities need to consider appropriate policies for their market dynamics and intended outcomes.
Many economies subsidize the use of fossil fuels to provide a more affordable energy supply to their populations. In response to energy shortages caused by geopolitical events, global fossil fuel subsidies have increased significantly, exceeding USD 1 trillion in 2022, according to the IEA [64]. Indonesia has had a long history of fuel subsidies and, in recent years, has engaged in a series of reforms, including significant price increases in 2022. The impact of these changes is expected to reduce Indonesia’s CO2 emissions by more than 9% by 2030 [65]. While many were concerned with the potential implications for poverty with a reallocation scheme, the authorities were actually able to reduce poverty by 0.5% [66]. Research shows that such subsidization of fossil fuels has been shown to increase CO2 emissions and lead to further environmental degradation. Erickson [67] estimated that fossil fuel subsidies in the US lead to the additional production of fossil fuels in the USA equivalent to 6 billion tons of CO2. Burniaux and Chateau [68] estimated the potential for an 8–10% drop in CO2 emissions in OECD countries with the removal of fossil fuel subsidies, while Jewel et al. [69] estimated a lower impact with the major effects only occurring in oil-exporting countries. While less research has been conducted in emerging economies, Adekunle [70] found that reducing fuel subsidies in Nigeria would negatively affect CO2 emissions. In addition, Solarin [71] found that a 10% increase in subsidies per capita would correspond to a 0.3% to 1.5% increase in environmental degradation. As such, policymakers should consider the impact of such fossil fuel subsidies in conjunction with developing and administering a CPI by modifying the relevant price/caps in accordance with the impact that such a subsidy supports [72].
In addition to Carbon Taxes, other environmental taxes may include the taxation of energy consumption, production, or distribution, taxation on resource utilization or extraction, and other taxes on polluting activities. These taxes may also have an indirect effect on mitigating CO2 emissions. Dogan [73] estimated the effects of environmental taxes on CO2 emissions in G7 countries and found that environmental taxes reduced CO2 emissions and had marginal effects on natural resource utilization, energy consumption, and renewable energy adoption, while Hao [74] found similar results by applying the CS-ARDL methodology and including unique variables such as human capital and green growth in the analysis. Scrimgeour [75] analyzed with a computable general equilibrium (CGE) model the different environmental taxes in New Zealand. In their modeling, a Carbon Tax was expected to reduce CO2 emissions by 18%, the energy tax by 16%, and the petroleum products tax by 0.9%. Japan has a series of taxes levied on automobiles, from acquisition to annual levies, and has been experimenting with credits for the purchase of more environmentally friendly vehicles such as electric vehicles and hybrids [76]. Policymakers can consider several forms of environmental taxes, including a Carbon Tax or CPI, as a portfolio of measures to reduce carbon emissions.
Driven by increased environmental awareness, a growing number of consumers are demanding more sustainable products and services. Dominant brands, eager to remain competitive, respond by increasing the production of sustainable products, as well as increasing requirements on the sustainable production methods of downstream suppliers. This, in turn, has a rippling effect of increasing environmental sustainability throughout the supply chain. Research related to China by Xie et al. showed that in the presence of a CPI, the increased consumer preference for sustainable products leads to both decreased CO2 emissions and increased corporate profits [72] and overall utility [77]. One sector that has seen increased demand is the electric vehicle. In China, electric vehicles have risen to over 1/3 of vehicle sales in 2024 [78]. The fuel consumption and GHG emission reductions associated with EV adoption vary with the share of renewable energy used. Whereas South China has a high renewable energy use, the GHG emissions and fuel consumption of EVs are estimated to be 30.98% and 43.16% lower than those of combustion vehicles, respectively [79]. Agriculture, forestry, and other land use sectors account for an estimated one-quarter of carbon emissions in Asia [80]. Driven partly by an ecological desire, there is an increasing preference for organic products, especially among the youth [81]. While Moran et al. estimated that consumer preferences for sustainable actions could reduce the EU CO2 footprint by 25%, this research also showed the downstream effect on the supply chain, with an estimated 25% of this reduction coming from reduced emissions in imported products [82]. However, increased consumer prices may negatively impact the environment, as shown by research on the China environment and economic interactions [83]. In the presence of a CPI and consumer preference for sustainable products, corporate profits may increase, and this could also maintain consumer prices, leading to improved environmental impacts.
While consumers are becoming more environmentally conscious, they continue to favor new products over remanufactured goods despite the reduced prices and lower environmental impact attributable to remanufactured products. Research by Wang & Wang proposed a reduced Carbon Tax rate for remanufactured products to stimulate consumer sentiment and optimize environmental effects [84]. As CPIs are typically limited to various sectors, authorities could also consider excluding remanufactured products from a CPI to further support the purchase of the products. Authorities will utilize a mix of policy options, which have complicated interactions, to achieve their objectives. The findings discussed highlight the nuanced impacts of CPIs on emissions reduction and provide a deeper understanding of their role in shaping climate strategies within diverse economic contexts. The following conclusion distills these insights, addressing the broader implications for carbon pricing adoption in Asia and future research pathways.

5. Conclusions

Many Asian countries have scheduled a CPI adoption, but enactment has been irregular due to economic concerns. While there are existing studies on the effect of CPI adoption on CO2 emissions, which show significant reductions, many of these studies employ data modeling and hypothetical methods. Moreover, apart from China, less research is available on Asian economies. Our study, with a focus on major Asian economies and with the use of actual historical data, fills a critical gap in understanding the real-world impact of CPIs. These empirical insights provide policymakers with more practical and real-world insight to better understand the effect that these policies will have in helping meet climate change commitments and provide greater confidence for these countries to move forward with implementing these regulations. Authorities may choose to implement CPIs in collaboration with other policies, such as fossil fuel subsidy reforms and renewable energy subsidies.
While this study suggests a role for CPIs in the reduction in GHG emissions, there are important limitations to note. GHG emissions can be impacted by multiple factors. Many of these occur in conjunction with the adoption of a CPI. Such policies may include supporting the usage of renewable energies or requiring stricter fuel efficiency on motor vehicles. In addition, consumer sentiment has driven a decline in the popularity of fossil fuels, as well as placing higher demands on companies to operate sustainably. Furthermore, economic output can drive demand for energy usage, which has a corresponding impact on GHG emissions [85]. The global economic crisis in 2008/2009 and COVID-19 in 2020 are examples of this. The multifaceted nature of climate policies means that it can be difficult to isolate the exact causes of changes in CO2 emissions over time. While the analytical design we adopted attempts to decompose these factors and isolate the treatment effects of CPIs, further research could be conducted to better understand the impact that CPIs have directly on consumer and industrial behavior. Additionally, as CPIs are a one-policy tool, additional research should be conducted to understand the impact that CPIs have in conjunction with other climate and energy policies, such as energy efficiency and consumer awareness campaigns. While this study applies Nearest Neighbor Matching (NNM) to estimate CPI impacts, future research could explore Difference-in-Differences (DiD) to analyze pre- and post-policy effects or Instrumental Variable (IV) Analysis to address potential endogeneity. These methods can provide complementary insights into the causal relationships between CPIs and emission reductions. Future studies might incorporate the Regression Discontinuity Design (RDD) to evaluate threshold-based tax policies or Computable General Equilibrium (CGE) Models to simulate the broader economic and environmental effects, offering a more holistic understanding of their long-term impacts. Given the complexity of policy interactions, Panel Data Models could explore temporal variations across economies, while machine learning methods like Gradient Boosting Machines might uncover non-linear relationships. These approaches can enrich policy design by identifying synergies and optimizing interventions.
With a mixture of policy tools available, authorities can implement the detailed practices that are most effective for their local environments and more effectively balance environmental goals and economic development. As Asian economies continue striving towards balancing economic growth and environmental protection, this study underscores the pivotal role that CPIs play in meeting sustainable development goals.

Author Contributions

Conceptualization, A.F.; methodology, A.F.; software, W.H.; validation, C.H. and A.F.; formal analysis, A.F.; investigation, A.F.; resources, C.H. and H.H.; data curation, A.F.; writing—original draft preparation, A.F. and W.H.; writing—review and editing, A.F.; visualization, A.F.; supervision, C.H.; project administration, A.F.; funding acquisition, C.H. All authors have read and agreed to the published version of the manuscript.

Funding

This work was supported by the Science and Technology Development Fund of Macau SAR (005/2022/ALC).

Institutional Review Board Statement

Not applicable.

Informed Consent Statement

Not Applicable.

Data Availability Statement

The original data presented in the study are openly available at OSF Registries: https://doi.org/10.17605/OSF.IO/XPWNS (accessed on 14 July 2024).

Conflicts of Interest

The authors declare no conflicts of interest. The funders had no role in the design of the study; in the collection, analyses, or interpretation of data; in the writing of the manuscript; or in the decision to publish the results.

Appendix A

Figure A1. Global status of carbon tax and ETS [11].
Sustainability 16 10542 g0a1
Figure A2. Annual CO2 emissions (1990–2021) [52].
Sustainability 16 10542 g0a2

Appendix B

Figure A3. Graphical representations of Kaya Identity factors of respective countries.
Sustainability 16 10542 g0a3aSustainability 16 10542 g0a3bSustainability 16 10542 g0a3cSustainability 16 10542 g0a3d

References

  1. UNFCC. Japan’s Current Progress of GHG Reduction; UNFCC: Bonn, Germany, 2019; Available online: https://unfccc.int/sites/default/files/resource/Japan_MA2019_presentation.pdf (accessed on 9 December 2023).
  2. Pigou, A.C. The Economics of Welfare; Macmillan: London, UK, 1924. [Google Scholar]
  3. Baumol, W.J. On taxation and the control of externalities. Am. Econ. Rev. 1972, 62, 307–322. [Google Scholar]
  4. Carlton, D.W.; Loury, G.C. The limitations of Pigouvian taxes as a long-run remedy for externalities. Q. J. Econ. 1980, 95, 559–566. [Google Scholar] [CrossRef]
  5. Diamond, P.A.; Mirrlees, J.A. Optimal taxation and public production II: Tax rules. Am. Econ. Rev. 1971, 61, 261–278. [Google Scholar]
  6. Laibson, D. Golden eggs and hyperbolic discounting. Q. J. Econ. 1997, 112, 443–478. [Google Scholar] [CrossRef]
  7. Thaler, R. Toward a positive theory of consumer choice. J. Econ. Behav. Organ. 1980, 1, 39–60. [Google Scholar] [CrossRef]
  8. Thaler, R.H.; Sunstein, C.R. Nudge: Improving Decisions About Health, Wealth, and Happiness; Yale University Press: New Haven, CT, USA, 2008. [Google Scholar]
  9. Congdon, W.J.; Kling, J.R.; Mullainathan, S. Behavioral economics and tax policy. Nat. Tax J. 2009, 62, 375–386. [Google Scholar] [CrossRef]
  10. Bumpus, A. Firm responses to a carbon price: Corporate decision making under British Columbia’s carbon tax. Clim. Policy 2014, 15, 937389. [Google Scholar] [CrossRef]
  11. World Bank. State and Trends of Carbon Pricing 2023; World Bank: Washington, DC, USA, 2023. [Google Scholar] [CrossRef]
  12. Sen, S.; Vollebergh, H. The effectiveness of taxing the carbon content of energy consumption. J. Environ. Econ. Manag. 2018, 92, 74–99. [Google Scholar] [CrossRef]
  13. Ghazouani, A.; Xia, W.; Ben Jebli, M.; Shahzad, U. Exploring the Role of Carbon Taxation Policies on CO2 Emissions: Contextual Evidence from Tax Implementation and Non-Implementation European Countries. Sustainability 2020, 12, 8680. [Google Scholar] [CrossRef]
  14. Timilsina, G.R. Where Is the Carbon Tax After Thirty Years of Research? World Bank Policy Research Working Paper 8493; World Bank: Washington, DC, USA, 2018; Available online: https://ssrn.com/abstract=3238331 (accessed on 14 July 2024).
  15. Best, R.; Burke, P.J.; Jotzo, F. Carbon Pricing Efficacy: Cross-Country Evidence. Environ. Resour. Econ. 2020, 77, 69–94. [Google Scholar] [CrossRef]
  16. Haites, E. Carbon taxes and greenhouse gas emissions trading systems: What have we learned? Clim. Policy 2018, 18, 955–966. [Google Scholar] [CrossRef]
  17. Wang, H.; Wei, W. Coordinating technological progress and environmental regulation in CO2 mitigation: The optimal levels for OECD countries & emerging economies. Energy Econ. 2020, 87, 104510. [Google Scholar]
  18. He, P.; Sun, Y.; Shen, H.; Jian, J.; Yu, Z. Does Environmental Tax Affect Energy Efficiency? An Empirical Study of Energy Efficiency in OECD Countries Based on DEA and Logit Model. Sustainability 2019, 11, 3792. [Google Scholar] [CrossRef]
  19. He, P.; Ning, J.; Yu, Z.; Xiong, H.; Shen, H.; Jin, H. Can Environmental Tax Policy Really Help to Reduce Pollutant Emissions? An Empirical Study of a Panel ARDL Model Based on OECD Countries and China. Sustainability 2019, 11, 4384. [Google Scholar] [CrossRef]
  20. Green, J.F. Does carbon pricing reduce emissions? A review of ex-post analyses. Environ. Res. Lett. 2021, 16, 043004. [Google Scholar] [CrossRef]
  21. Ulucak, R.; Danish; Kassouri, Y. An assessment of the environmental sustainability corridor: Investigating the non-linear effects of environmental taxation on CO2 emissions. Sustain. Dev. 2020, 28, 1010–1018. [Google Scholar] [CrossRef]
  22. Shi, Y.; Paramati, S.R.; Ren, X. The Growth of Carbon Markets in Asia: The Potential Challenges for Future Development; ADBI Working Paper Series No. 987; Asian Development Bank Institute: Tokyo, Japan, 2019. [Google Scholar]
  23. Stavins, R.N. The relative merits of carbon pricing instruments: Taxes versus trading. Rev. Environ. Econ. Policy 2022, 16, 62–82. [Google Scholar] [CrossRef]
  24. Savin, I.; Drews, S.; van den Bergh, J. Carbon pricing–perceived strengths, weaknesses and knowledge gaps according to a global expert survey. Environ. Res. Lett. 2024, 19, 024014. [Google Scholar] [CrossRef]
  25. Alonso, C.; Kilpatrick, M.J. The Distributional Impact of a Carbon Tax in Asia and the Pacific; International Monetary Fund: Washington, DC, USA, 2022. [Google Scholar]
  26. UNESCAP Statistics Division. Asia and the Pacific (ESCAP)—Snapshot. SDG Progress 2024. Available online: https://data.unescap.org/data-analysis/sdg-progress# (accessed on 10 June 2024).
  27. Truong, T.P. A Comparative Study of Selected Asian Countries on Carbon Emissions with Respect to Different Trade and Climate Changes Mitigation Policy Scenarios; ARTNeT Working Paper Series; Asia-Pacific Research and Training Network on Trade: Bangkok, Thailand, 2010. [Google Scholar]
  28. van Ruijven, B.J.; van Vuuren, D.P.; van Vliet, J.; Beltran, A.M.; Deetman, S.; den Elzen, M.G. Implications of greenhouse gas emission mitigation scenarios for the main Asian regions. Energy Econ. 2012, 34, S459–S469. [Google Scholar] [CrossRef]
  29. Kawakatsu, T.; Rudolph, S.; Lee, S. The Japanese carbon tax and the challenges to low-carbon policy cooperation in East Asia. In Tax Law and the Environment: A Multidisciplinary and Worldwide Perspective; Lexington Books: Littlefield, TX, USA, 2018; pp. 85–103. [Google Scholar]
  30. Ashina, S.; Nakata, T. Energy-efficiency strategy for CO2 emissions in a residential sector in Japan. Appl. Energy 2008, 85, 101–114. [Google Scholar] [CrossRef]
  31. JFS Japan for Sustainability. Japan Introduces New Tax on Carbon Emissions. 2013. Available online: https://www.japanfs.org/en/news/archives/news_id032490.html (accessed on 7 December 2023).
  32. Lee, S.; Pollitt, H.; Ueta, K. An assessment of Japanese carbon tax reform using the E3MG econometric model. Sci. World J. 2012, 2012, 835917. [Google Scholar] [CrossRef] [PubMed]
  33. Asia, N. Japan to Reduce Greenhouse-Gas Emissions to Net Zero by 2050. 2020. Available online: https://asia.nikkei.com/Spotlight/Environment/Japan-to-reduce-greenhouse-gas-emissions-to-net-zero-by-2050 (accessed on 9 December 2023).
  34. McCurry, J. Japan Will Become Carbon Neutral by 2050, PM Pledges; The Guardian: London, UK, 2020. [Google Scholar]
  35. Saveyn, B.; Paroussos, L.; Ciscar, J.-C. Economic analysis of a low carbon path to 2050: A case for China, India and Japan. Energy Econ. 2012, 34, S451–S458. [Google Scholar] [CrossRef]
  36. Tokyo Metropolitan Government. Tokyo Cap-and-Trade Program; Tokyo Metropolitan Government: Tokyo, Japan, 2016. Available online: https://www.metro.tokyo.lg.jp/english/topics/2016/161116_01.html#:~:text=In%20order%20to%20mitigate%20the,to%20reduce%20their%20CO2%20emissions (accessed on 9 December 2023).
  37. Kasahara, S.; Paltsev, S.; Reilly, J.; Jacoby, H.; Ellerman, A.D. Climate change taxes and energy efficiency in Japan. Environ. Resour. Econ. 2007, 37, 377–410. [Google Scholar] [CrossRef]
  38. Timperley, J. The Carbon Brief Profile: Japan. Country Profiles 25 June 2018. Available online: https://www.carbonbrief.org/carbon-brief-profile-japan. (accessed on 9 December 2023).
  39. Lin, B.; Jia, Z. The impact of Emission Trading Scheme (ETS) and the choice of coverage industry in ETS: A case study in China. Appl. Energy 2017, 205, 1512–1527. [Google Scholar] [CrossRef]
  40. Choi, Y.; Qi, C. Is South Korea’s emission trading scheme effective? An analysis based on the marginal abatement cost of coal-fueled power plants. Sustainability 2019, 11, 2504. [Google Scholar] [CrossRef]
  41. Tan, X.; Wang, R.; Choi, Y.; Lee, H. Does Korea’s carbon emissions trading scheme enhance efficiency for sustainable energy and utilities? Util. Policy 2024, 88, 101752. [Google Scholar] [CrossRef]
  42. Kim, M. Reducing Greenhouse Gases Benefits. Disclosure of Ways to Improve Emissions Trading Schemes; Climate Carbon Policy Room, Ed.; Ministry of the Environment: Sejong, Republic of Korea, 2022.
  43. Carattini, S.; Carvalho, M.; Fankhauser, S. Overcoming public resistance to carbon taxes. Wiley Interdiscip. Rev. Clim. Chang. 2018, 9, e531. [Google Scholar] [CrossRef] [PubMed]
  44. Lin, B.; Jia, Z. What will China’s carbon emission trading market affect with only electricity sector involvement? A CGE based study. Energy Econ. 2019, 78, 301–311. [Google Scholar] [CrossRef]
  45. International Carbon Action Partnership. China National ETS; International Carbon Action Partnership: Berlin, Germany, 2024; Available online: https://icapcarbonaction.com/en/ets/china-national-ets (accessed on 2 March 2024).
  46. Grantham Research Institute on Climate Change and the Environment and Adelphi. Policy Measures to Respond to Carbon Fee Impacts on Industry in Taiwan; Grantham Research Institute on Climate Change and the Environment, London School of Economics and Political Science: London, UK, 2024. [Google Scholar]
  47. Reset Carbon. Taiwan Carbon Fee Rollout in 2025: Key Insights for Companies Seeking Carbon Fee Discounts Through SBTi; Reset Carbon: Hong Kong, China, 2024; Available online: https://resetcarbon.com/en/taiwan-carbon-fee/ (accessed on 12 June 2024).
  48. Nohd Hasnu, N.N.; Muhammad, I. Environmental issues in Malaysia: Suggestion to impose carbon tax. Asian Pac. Manag. Account. J. 2022, 17, 65–95. [Google Scholar] [CrossRef]
  49. Ekins, P.; Speck, S. Competitiveness and Exemptions From Environmental Taxes in Europe. Environ. Resour. Econ. 1999, 13, 369–396. [Google Scholar] [CrossRef]
  50. González-Torres, M.; Pérez-Lombard, L.; Coronel, J.F.; Maestre, I.R. Revisiting Kaya Identity to define an Emissions Indicators Pyramid. J. Clean. Prod. 2021, 317, 128328. [Google Scholar] [CrossRef]
  51. Abadie, A.; Imbens, G.W. Large Sample Properties of Matching Estimators for Average Treatment Effects. Econometrica 2006, 74, 235–267. [Google Scholar] [CrossRef]
  52. Ritchie, H.; Rosado, P.; Roser, M. CO2 and Greenhouse Gas Emissions; OurWorldInData: Oxford, UK, 2023. [Google Scholar]
  53. Andrew, R.M.; Peters, G.P. The Global Carbon Project’s Fossil CO2 Emissions Dataset (2023v36); Global Carbon Budget: Exeter, UK, 2023. [Google Scholar] [CrossRef]
  54. The World Bank Group. The World Bank Data Catalog; The World Bank Group: Washington, DC, USA, 2023; Available online: https://databank.worldbank.org/home (accessed on 15 November 2023).
  55. International Energy Agency “IEA”. Energy End-Uses and Efficiency Indicators Data Explorer; International Energy Agency: Paris, France, 2023; Available online: https://www.iea.org/data-and-statistics/data-tools/energy-end-uses-and-efficiency-indicators-data-explorer (accessed on 15 November 2023).
  56. Pedregosa, F.; Varoquaux, G.; Gramfort, A.; Michel, V.; Thirion, B.; Grisel, O.; Blondel, M.; Prettenhofer, P.; Weiss, R.; Dubourg, V. Scikit-learn: Machine learning in Python. J. Mach. Learn. Res. 2011, 12, 2825–2830. [Google Scholar]
  57. The Business Times. China sets renewable power subsidies lower at 5.4 billion yuan for 2024. The Business Times, 21 June 2024. Available online: https://www.businesstimes.com.sg/international/china-sets-renewable-power-subsidies-lower-5-4-billion-yuan-2024 (accessed on 7 October 2024).
  58. Song, D.; Jia, B.; Jiao, H. Review of Renewable Energy Subsidy System in China. Energies 2022, 15, 7429. [Google Scholar] [CrossRef]
  59. Shen, J.; Luo, C. Overall review of renewable energy subsidy policies in China–Contradictions of intentions and effects. Renew. Sustain. Energy Rev. 2015, 41, 1478–1488. [Google Scholar] [CrossRef]
  60. Yale Environment 360. Fossil Fuels Now Account for Less Than Half of China’s Power Capacity. In Yale Environment 360; Yale School of the Environment: New Haven, CT, USA, 2023.
  61. The Edge Malaysia. Budget 2023: More Funds, Incentives for Green Tech to Meet Net-Zero Target and Sustainability Agenda; The Edge Malaysia: Petaling Jaya, Malaysia, 2022. [Google Scholar]
  62. Amran, A.; Nejati, M.; Ooi, S.K.; Darus, F. Exploring Issues and Challenges of Green Financing in Malaysia: Perspectives of Financial Institutions. In Sustainability and Social Responsibility of Accountability Reporting Systems: A Global Approach; Çalıyurt, K.T., Said, R., Eds.; Springer: Singapore, 2018; pp. 255–266. [Google Scholar] [CrossRef]
  63. Ezuma, R.E.M.R.; Matthew, N.K.; Ezuma, R.; Matthew, N. The perspectives of stakeholders on the effectiveness of green financing schemes in Malaysia. Green Financ. 2022, 4, 450–473. [Google Scholar] [CrossRef]
  64. IEA. The Global Energy Crisis Pushed Fossil Fuel Consumption Subsidies to an All-Time High; IEA: Paris, France, 2023. [Google Scholar]
  65. Asian Development Bank. Fossil Fuel Subsidies in Indonesia: Trends, Impacts, and Reforms; Asian Development Bank (ADB): Manila, Philippines, 2015. [Google Scholar]
  66. Ihsan, A.; Abriningrum, D.E.; Sjahrir, B.S.; Rahmawati, A.; Giannozzi, S. Indonesia’s Fuel Subsidies Reforms; EFI Insight-Finance, Ed.; World Bank: Washington, DC, USA, 2024. [Google Scholar]
  67. Erickson, P.; Down, A.; Lazarus, M.; Koplow, D. Effect of subsidies to fossil fuel companies on United States crude oil production. Nat. Energy 2017, 2, 891–898. [Google Scholar] [CrossRef]
  68. Burniaux, J.-M.; Chateau, J. Greenhouse gases mitigation potential and economic efficiency of phasing-out fossil fuel subsidies. Int. Econ. 2014, 140, 71–88. [Google Scholar] [CrossRef]
  69. Jewell, J.; McCollum, D.; Emmerling, J.; Bertram, C.; Gernaat, D.E.H.J.; Krey, V.; Paroussos, L.; Berger, L.; Fragkiadakis, K.; Keppo, I.; et al. Limited emission reductions from fuel subsidy removal except in energy-exporting regions. Nature 2018, 554, 229–233. [Google Scholar] [CrossRef]
  70. Adekunle, I.A.; Oseni, I.O. Fuel subsidies and carbon emission: Evidence from asymmetric modelling. Environ. Sci. Pollut. Res. 2021, 28, 22729–22741. [Google Scholar] [CrossRef] [PubMed]
  71. Solarin, S.A. An environmental impact assessment of fossil fuel subsidies in emerging and developing economies. Environ. Impact Assess. Rev. 2020, 85, 106443. [Google Scholar] [CrossRef]
  72. Xie, J.; Li, J.; Liang, L.; Fang, X.; Yang, G.; Wei, L. Contracting emissions reduction supply chain based on market low-carbon preference and carbon intensity constraint. Asia Pac. J. Oper. Res. 2020, 37, 2050003. [Google Scholar] [CrossRef]
  73. Doğan, B.; Chu, L.K.; Ghosh, S.; Truong, H.H.D.; Balsalobre-Lorente, D. How environmental taxes and carbon emissions are related in the G7 economies? Renew. Energy 2022, 187, 645–656. [Google Scholar] [CrossRef]
  74. Hao, L.-N.; Umar, M.; Khan, Z.; Ali, W. Green growth and low carbon emission in G7 countries: How critical the network of environmental taxes, renewable energy and human capital is? Sci. Total Environ. 2021, 752, 141853. [Google Scholar] [CrossRef] [PubMed]
  75. Scrimgeour, F.; Oxley, L.; Fatai, K. Reducing carbon emissions? The relative effectiveness of different types of environmental tax: The case of New Zealand. Environ. Model. Softw. 2005, 20, 1439–1448. [Google Scholar] [CrossRef]
  76. Konishi, Y.; Zhao, M. Can Green Car Taxes Restore Efficiency? Evidence from the Japanese New Car Market. J. Assoc. Environ. Resour. Econ. 2017, 4, 51–87. [Google Scholar] [CrossRef]
  77. Xia, L.; Bai, Y.; Ghose, S.; Qin, J. Differential Game Analysis of Carbon Emissions Reduction and Promotion in a Sustainable Supply Chain Considering Social Preferences. Ann. Oper. Res. 2022, 310, 257–292. [Google Scholar] [CrossRef]
  78. Strategy&. Electric Vehicle Sales Review 2024 Q2; PWC: Frankfurt, Germany, 2024; Available online: https://www.strategyand.pwc.com/de/en/industries/automotive/electric-vehicle-sales-review-2024-q2.html (accessed on 7 October 2024).
  79. Yan, X.; Sun, S. Impact of electric vehicle development on China’s energy consumption and greenhouse gas emissions. Clean Technol. Environ. Policy 2021, 23, 2909–2925. [Google Scholar] [CrossRef]
  80. Rahut, D.; Narmandakh, D.; He, X.; Yao, Y.; Tian, S. Opportunities and Challenges During Low-CarbonTransition: A Perspective from Asia’s Agriculture Sector. (ADO 2023 Thematic Report). Asian Development Bank Institute: Manila, Philippines. Available online: https://www.adb.org/sites/default/files/institutional-document/874256/adotr2023bp-low-carbon-asia-agriculture.pdf (accessed on 14 July 2024).
  81. Pham, T.H.; Nguyen, T.N.; Phan, T.T.H.; Nguyen, N.T. Evaluating the purchase behaviour of organic food by young consumers in an emerging market economy. J. Strateg. Mark. 2019, 27, 540–556. [Google Scholar] [CrossRef]
  82. Moran, D.; Wood, R.; Hertwich, E.; Mattson, K.; Rodriguez, J.F.D.; Schanes, K.; Barrett, J. Quantifying the potential for consumer-oriented policy to reduce European and foreign carbon emissions. Clim. Policy 2020, 20, S28–S38. [Google Scholar] [CrossRef]
  83. Hussain, M.; Wang, W.; Wang, Y. Natural resources, consumer prices and financial development in China: Measures to control carbon emissions and ecological footprints. Resour. Pol. 2022, 78, 102880. [Google Scholar] [CrossRef]
  84. Wang, Y.; Wang, F. Production and emissions reduction decisions considering the differentiated carbon tax regulation across new and remanufactured products and consumer preference. Urban Clim. 2021, 40, 100992. [Google Scholar] [CrossRef]
  85. Fekete, H.; Kuramochi, T.; Roelfsema, M.; den Elzen, M.; Forsell, N.; Höhne, N.; Luna, L.; Hans, F.; Sterl, S.; Olivier, J. A review of successful climate change mitigation policies in major emitting economies and the potential of global replication. Renew. Sustain. Energy Rev. 2021, 137, 110602. [Google Scholar] [CrossRef]
Figure 1. Flow Chart of Research Methodology and Implementation Process.
Sustainability 16 10542 g001
Table 1. Characteristics of Carbon Pricing Instruments in selected jurisdictions.
Year SectorsGHG or PricePrice/Cap
JurisdictionCPIEffectiveCoveredFuels
Covered
Level USD/tCO2 (a)Trajectory
AustraliaCarbon Tax2012 (b)Mining, power, manufacturing, transport, and waste sectorsCO2, CH4, N2O, SF6, HFCs, PFCs23.42
(AUD 35.43)
(c)
The cap is based on the net zero targets.
JapanCarbon Tax2010 (d)Fossil fuels (with some uses exempt)Fossil fuels (some uses exempt)2.2
(CNY 289)
NA
ChinaETS (e)2013PowerCO28.2
(CNY 55)
NA
South
Korea
ETS2015Aviation, buildings, domestic transport, industry, power, wasteCO2, N2O, PFCs, HFCs, SF618 (KRW 23,243)Not determined. Increasing steadily.
SingaporeCarbon Tax2019Manufacturing, power, sewage and waste management, and water supplyCO2, N2O, PFCs, HFCs, SF63.6
(SGD 5)
Price increasing to between SDG 50 and SDG 80 by 2030.
IndonesiaETS2023PowerCO2NA (pilot prices at around 2)NA
EU 20ETS2005Power, industry,
domestic aviation,
domestic shipping
(from 2024)
CO2, N2O, PFCs83.2
(EUR 79)
Cap with linear reduction factor: 2.2% (until 2023), progressing to 2030
UKETS2021Power, industry, domestic aviation, domestic shipping (from 2024)CO2, N2O, PFCs92.4
(GDP 75)
The cap is based on the net zero targets.
USA
California
ETS2012Buildings, domestic transport, industry, powerCO2, CH4, N2O, SF6, HFCs, PFCs, NF328.45The cap declines around 4% per year to reach 200.5 MtCO2e in 2030.
(a) Pricing is based on 2022 averages from the ICAP Allowance Price Explorer unless otherwise stated https://icapcarbonaction.com/en/ets-prices (accessed on 14 July 2024); (b) not effective in 2014–15; (c) pricing is based on the average price in Q3 2023 as reported by the Australian Government Clean Energy Regulator; (d) Japan has other municipal-level taxes covering different sectors and prices; and (e) China has other municipal and provincial-level CPI covering different sectors and prices.
Table 2. List of countries and year of Carbon Tax or ETS adoption.
Carbon Tax or ETS Jurisdictions Year No Carbon Tax or ETS
(Treatment Group)Effective (Control Group)
Australia2012(Not Effective in 2014–2015)ThailandCambodia
Japan2010 VietnamMongolia
China2013 MalaysiaMyanmar
Singapore2019 IndiaPhilippines
TaiwanLaos
Indonesia
Table 3. Regression analysis results.
VariableCoefficientStandard Errort-Statisticp-Value95% Confidence Interval
Constant4.64130.4979.348<0.001[3.640, 5.643]
GDP Per Capita0.53630.3241.6550.105[−0.117, 1.190]
Energy Intensity−2.63350.377−6.976<0.001[−3.395, −1.872]
Carbon Intensity4.18890.8065.196<0.001[2.563, 5.815]
Treatment Flag−0.52150.238−2.1860.034[−1.002, −0.040]
Disclaimer/Publisher’s Note: The statements, opinions and data contained in all publications are solely those of the individual author(s) and contributor(s) and not of MDPI and/or the editor(s). MDPI and/or the editor(s) disclaim responsibility for any injury to people or property resulting from any ideas, methods, instructions or products referred to in the content.

