Review

New Wine in Old Bottles: The Sustainable Application of Slow Sand Filters for the Removal of Emerging Contaminants, a Critical Literature Review

by
Hayley Corbett
1,*,
Brian Solan
1,
Svetlana Tretsiakova-McNally
1,
Pilar Fernandez-Ibañez
2 and
Rodney McDermott
1
1
Belfast School of Architecture and the Built Environment, Ulster University, Belfast BT15 1AP, UK
2
School of Engineering, Ulster University, Coleraine BT37 0QB, UK
*
Author to whom correspondence should be addressed.
Sustainability 2024, 16(23), 10595; https://doi.org/10.3390/su162310595
Submission received: 29 September 2024 / Revised: 16 November 2024 / Accepted: 26 November 2024 / Published: 3 December 2024
(This article belongs to the Section Waste and Recycling)

Abstract

:
The current treatment of wastewater has unintended negative environmental impacts. Conventional methods frequently involve the use of harmful chemicals, generate disinfectant by-products, consume significant amounts of energy, and produce wastes requiring additional efforts for safe disposal. Water stress exacerbated by contaminants of emerging concern (CECs) and climate change, is further straining aging treatment systems. A slow sand filter (SSF), with ligno-cellulosic layers, offers a novel, promising, and economic alternative for wastewater reclamation. This review examines the key SSF characteristics, obtained from recent studies, and explores the use of sustainable materials such as ligno-cellulose, as a treatment companion. The optimal SSF design includes a bed depth of >0.6 m, particle effective size (D10) between 0.15 mm and 0.40 mm, and a uniformity coefficient (CU grain size ratio) of ≤2.0. It is established that SSF’s characteristic biolayer of microorganisms enhances contaminant removal via biodegradation. While biofilm-based removal of micropollutants is a proven mechanism, further research is needed to address CEC challenges. For example, the inclusion of sawdust in SSF filter layers can reduce energy consumption compared to conventional methods and can be recycled through thermal conversion, aligning with circular economy principles. This approach has the potential to improve wastewater treatment in emerging economies, contributing to the achievement of the UN Sustainability Goals.

1. Introduction

Slow sand filtration (SSF) is a time-tested approach to wastewater treatment. This design solution characteristically incorporates inert granular media supporting the development of a biological layer of microorganisms (known as the schmutzdecke), thereby contributing to contaminant removal. The systems can alternatively be referred to as “biological sand filters” and “biosand reactors” [1,2]. Their efficacy in enhancing raw treated wastewater quality has been well-documented over decades of application [3]. Nevertheless, SSF (the operation of which will be discussed in Section 2) can be considered an attractive sustainable water treatment technology due to its comparatively low consumption of resources (chemical, electrical, and manpower) and reduced costs. Recently, its application in preparing water for reuse has drawn the attention of researchers, especially in the context of the escalating water crisis [4,5]. This review seeks to build on this established technology by incorporating a novel adsorption layer, which can address micropollutants that the current design approach fails to address.

1.1. Contaminants of Emerging Concern

Amid the growing challenges of water stress (See Section 1.3) and the struggle to meet sustainable development goals (SDGs), an even more pressing issue has emerged: the alarming surge of contaminants of emerging concerns (CECs) infiltrating the environment through regulated wastewater discharges [6,7]. As wastewater treatment works are focused mainly on the removal of suspended matter and pathogenic microorganisms (macro-pollutants), contaminants which are found at trace concentrations (micro-pollutants), are missed by many treatment methods and are subsequently discharged into receiving waters [8,9]. ‘Forever chemicals,’ ubiquitous, persistent, bioaccumulative, toxic substances (uPBTs, such as polybrominated diphenyl ethers [10]), and endocrine-disrupting chemicals (EDCs such as estrogens [11,12]), are terms used to describe known harmful, long-life chemicals in the environment [10,11,12,13]. In contrast, CECs remain far less clearly defined, and their long-term effects on human health and ecosystems are largely still under investigation [14,15]. Their undefined risk is such that, under the Water Framework Directive (WFD), the European Commission (EC) releases an updated watchlist every two years of priority substances and their environmental quality standards (EQS). This facilitates the monitoring of compounds that pose potential “significant risk […] to or via the aquatic environment” [16]. The current list is outlined in Table 1.
Typically, treated wastewater is discharged to natural water bodies, as governed by environmental laws such as the WFD in the European Union (EU) [19]. However, concerns are raised about the environmental impact and the availability of water of suitable quality, as the full extent of micropollutants by-passing treatment systems remains unknown [8,9,20]. Emerging pollutants are also infiltrating aquatic systems not only through improperly regulated wastewater discharges but also via leachates from solid wastes such as landfills or other municipal waste disposal sites [21]. While EU standards regulating leachate management exist [22], the percolates can still act as a conduit for CECs to enter waterways where they can accumulate, thus contributing to their persistence [23]. Leachate treatment and recycling technologies are currently standard practice [22,24], and evidence is emerging that policies governing waste classification (i.e., separation of food waste, recyclables, hazardous waste, and residual waste) have some responsibility in the reduction in trace pollutants, for example, in leachate across China [21]. However, the mobilization of CECs from such wastes is still a prevalent issue as the landscape evolves.
There is also a mounting realization of the risk to biodiversity from these pollutants being highly resistant to degradation in environmental waters [25], aggravating the global problem. With risks to aquatic life, subsequent food chains [15], and even risks to human health (e.g., EDCs [11]), the need for a sustainable solution is critical. While region-specific laws theoretically regulate the discharge of effluents into rivers, lakes, and oceans, compliance with these statutes often proves problematic [12,26,27,28].

1.2. Legislative Approaches to Water Treatment

European legislative approaches such as the Water Framework Directive [29] have expanded the assessment of the chemical and ecological status of water bodies to address CECs. However, the introduction of new priority substances into the testing suite in 2018 dramatically impacted the results. Testing stations across Europe experienced extensive failures, as newly identified substances such as uPBT compounds were detected for the first time [30,31]. One exemplar priority substance is flame retardants based on polybrominated diphenyl ethers (PBDEs) [10], which were detected in 21% of bodies of water that failed to achieve ‘good’ chemical status in 2018 [8]. The widespread occurrence of PBDEs in various water bodies raises significant concerns not only for environmental health but also for human safety [10].
The extensive mobility and accumulation of these compounds are primarily attributed to the discharge of inadequately treated wastewater into aquatic ecosystems. The priority substance watch list (Table 1) introduced by the EC aimed at achieving a ‘progressive reduction in hazardous substance emissions into water [19,32], and supporting the remediation of affected water bodies, as outlined in the Council Directive 2000/60/EC (2000) [32]. However, the directive’s full implementation is not expected until 2050, potentially allowing significant environmental damage to occur in the interim. With contaminated water being increasingly recognized as a vector for the spread of antimicrobial resistance (AMR) [33], and the potential of 40 million deaths predicted to occur by 2050 [34], the removal of micropollutants is an issue to solve now before the point of no return is reached. Therefore, effective regulation requires more than surveillance; it demands innovation in water treatment to mitigate CECs and their impact on ecosystems and human health. To meet these evolving demands, research must prioritize the development of novel approaches or the optimization of existing methods, even in resource-rich, developed economies.

1.3. Water Stress

Almost a third of Europeans experience water stress [35], a condition worsened by increased water usage, deterioration in water quality, emerging pollutant contamination, and the lower reliability of treatment processes [36,37]. The United Nations (UN) defines water stress as “freshwater withdrawal as a proportion of available freshwater resources” [36]. Industrial production, the intensification of agriculture to meet increasing food production needs, and climate change, with its drastically altering weather patterns and the hydrological cycle, are all drivers of the water demand [38,39]. These challenges are even more pronounced in emerging economies [40], where certain areas are exceptionally vulnerable to climate change and its effects, e.g., extreme weather events. In addition to geopolitical factors; however, climate change exacerbates water scarcity by altering precipitation patterns, increasing the frequency of droughts, and disrupting seasonal flows [41]. These shifts in previously familiar patterns further reduce the availability of water resources, and complicate human-led water management efforts, as conventional planning and storage methods struggle to adapt [42]. This complex interplay between resource management and the accelerating effects of climate change underscores the multifaceted challenges in securing a stable water supply for both communities and ecosystems.
To alleviate water stress, reclaimed water, which involves treating domestic, commercial, or industrial effluent to meet appropriate standards for reuse [43,44], offers a sustainable solution [45]. The scarcity of water is the primary motivator for such water reuse schemes; however, there are compelling arguments for the advancement of reclamation in water-rich contexts also. Beyond relieving shortages, reclamation can future-proof water management systems by improving resilience, reducing energy consumption, and mitigating the impact of wastewater discharge on the environment [4,7].
While the United Nations (UN) sustainable development goal (SDG) number six, “ensure availability and sustainable management of water and sanitation for all” aims to promote accessibility of clean water [36], meeting such objectives are “alarmingly off track” [46]. The implementation of targets and goals is useful for facilitating focus and interdisciplinary communication to combat the threat to the quality of water resources. However, despite these global efforts, current WaSH goals are considered inadequate to safeguard water quality [20]. Specifically, SDG 6’s target 3 (SDG 6.3) aims to “improve water quality by reducing pollution, eliminating dumping and minimizing release of hazardous chemicals and materials, halving the proportion of untreated wastewater and substantially increasing recycling and safe reuse globally” [47]. Spatial models that take into account salinity, organic pollution, and pathogen pollution have demonstrated that, even if SDG 6.3 was achieved, key water quality thresholds would still not be met in numerous regions [20].
Decades of underinvesting in wastewater infrastructure have also exacerbated water stress. Compromised water quality, degradation of ecosystems, and constrained opportunities for water reuse are all outcomes of ageing and failing infrastructure [48]. With limited water reuse options in many low-income regions, as much as 53% of wastewater is reused without treatment [7]. Best practices in the EU assert that untreated wastewater should only be released to surface waters during storm events where high flow rates will disperse any contaminants downstream [27,49]. Yet, direct discharge of wastes to surface waters such as combined sewer overflows (CSO) and intensive agricultural practices, as a result of systems exceeding their capacities [28], are now also recognized as contributory factors to increased levels of contamination [50]. These events routinely release high levels of pollutants such as EDCs into surface waters [12]. Similarly, the discharge of raw wastewater has depleted dissolved oxygen levels below acceptable standards in one instance in Brazil [26]. Legal concentrations of ammonia, nitrates, and heavy metals were also exceeded by up to 36 times the limit, which had a drastic impact on the biota of the environment investigated [26]. The development of existing water treatment and management strategies and research of their enhancement is, therefore, crucial to advance the progression of SDGs. This review explores SSF, an established tertiary treatment option, in a new perspective of alternative media to enhance functionality and sustainability.

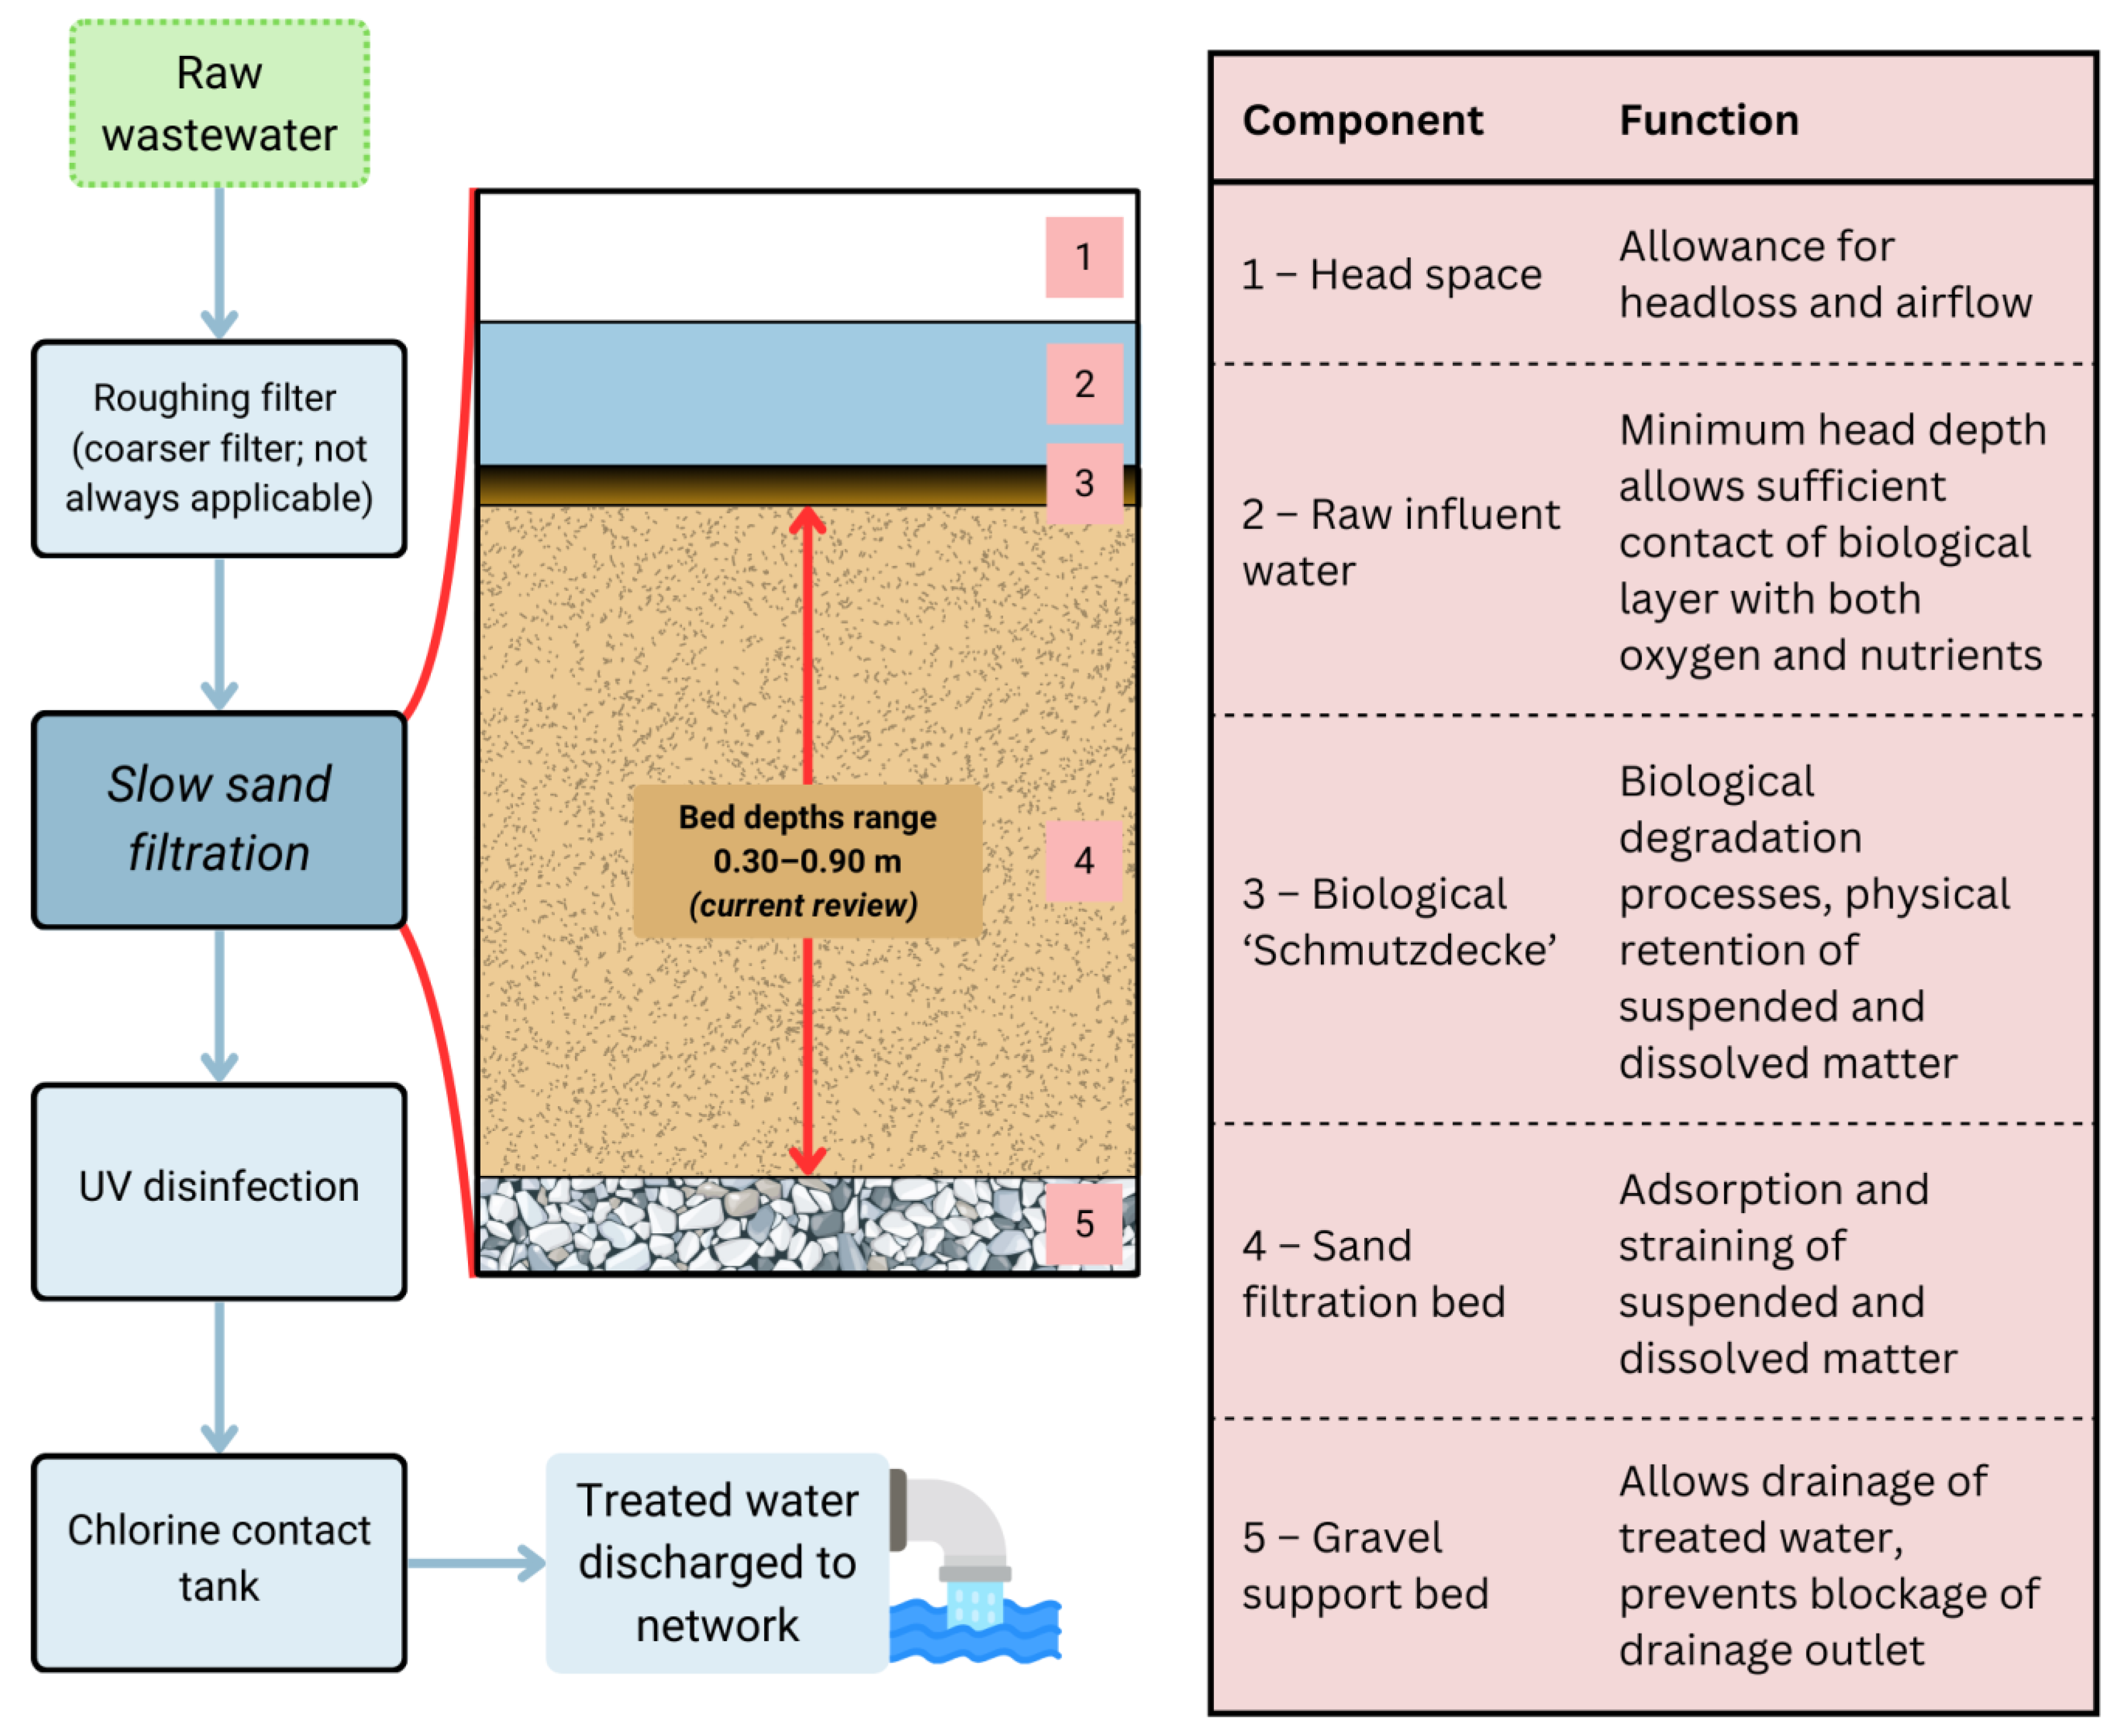
2. Slow Sand Filtration and Operation

SSF (Figure 1) boasts many mechanisms by which water quality can be enhanced. Filtration, the primary mechanism, involves the physical retention of contaminants as water passes through sand pores, but additional processes also contribute to water remediation. Biodegradation, co-metabolic degradation, and the predation and attenuation of microorganisms are processes facilitated by the biological layer (biolayer) inherent to slow sand filtration. This is sometimes referred to as the schmutzdecke (German: dirt layer), which develops in the top 1–3 cm of sand over time as the slow sand filter operates [51]. The development of the biolayer can take between hours and weeks depending on the dissolved oxygen and nutrient levels of the influent water [2,52]. Biolayer creation is akin to the biomass produced in activated sludge processes [2]; however, the SSF biolayer operates passively without the aeration used in activated sludge systems [52]. Composed of a biofilm of environmental microorganisms and exocellular polymeric substances (EPSs) extending into the sand matrix, it effectively reduces pore sizes between the sand particles, thereby trapping the contaminants not normally caught by the sand alone [53,54,55]. Furthermore, microorganisms within the biofilm pose competition and can predate pathogens and non-pathogens carried in the water being treated [1,51]. It should be noted; however, that reduction in the number of live microorganisms also occurs naturally because of sedimentation and a lack of nutrients (starvation) in a closed system. This was demonstrated in a 2019 study comparing rough and slow sand filter units which incorporated a holding tank to achieve up to 100% removal of faecal coliforms [54]. Additionally, the sub-optimal conditions of the SSF environment, typically below 30 °C, created a hostile climate for intestinal bacteria which normally thrives at 37 °C, [51]. Nonetheless, the outlined contaminant removal tools possessed by the biofilm and sand filter showed promising results for the removal of a range of contaminants, including the CECs [6]. For example, biofilm facilitated the biodegradation of UV absorber octocrylene, which showed a concentration decrease of 19.1% [56]. In another investigation, concentrations of the beta-blocker atenolol were reduced by biological action in a biofilter by 57% [57].
SSFs are already successfully used as pre-treatment that protects downstream treatment stages from fouling and premature clogging [58], as well as tertiary approaches to polish primary- and secondary-treated effluents [3,59]. The capabilities of SSF as a cost-effective wastewater treatment component pose the question of whether alternative filtration media could similarly serve as effective substrates for biofilm growth. Upcycling the longstanding SSF configuration (Figure 1) to incorporate other materials such as sawdust may further enhance its capabilities to remove an array of contaminants thanks to the adsorptive properties of the lignocellulosic material [60]. Additionally, this can contribute to a more sustainable treatment option compared to conventional treatments involving activated carbon, which requires high energy expenditure for activation, and produces large carbon footprints due to intensive production processes [61]. In contrast, alternative materials, like biochar or lignocellulosic materials, often involve lower-energy processes and can even repurpose waste products, reducing both environmental impact and costs.
This work highlights SSF as a viable technology for the compounding issues. The current literature has demonstrated the viability of SSF to effectively treat wastewater to reuse standards [2,4,62], even in the removal of persistent compounds [6,63]. However, research covering the applicability of SSF to remove CECs is lacking.
Figure 1. Flowchart of an example treatment sequence at a water treatment plant using SSF (schematic cross-section SSF with function of each component outlined). Adapted from [64].
Sustainability 16 10595 g001
Therefore, a current and comprehensive literature review has been conducted to delineate the key characteristics making up the design of an SSF reactor, to explore the role of ligno-cellulosic materials in the removal of contaminants including CECs, and the best practices for operation and maintenance.

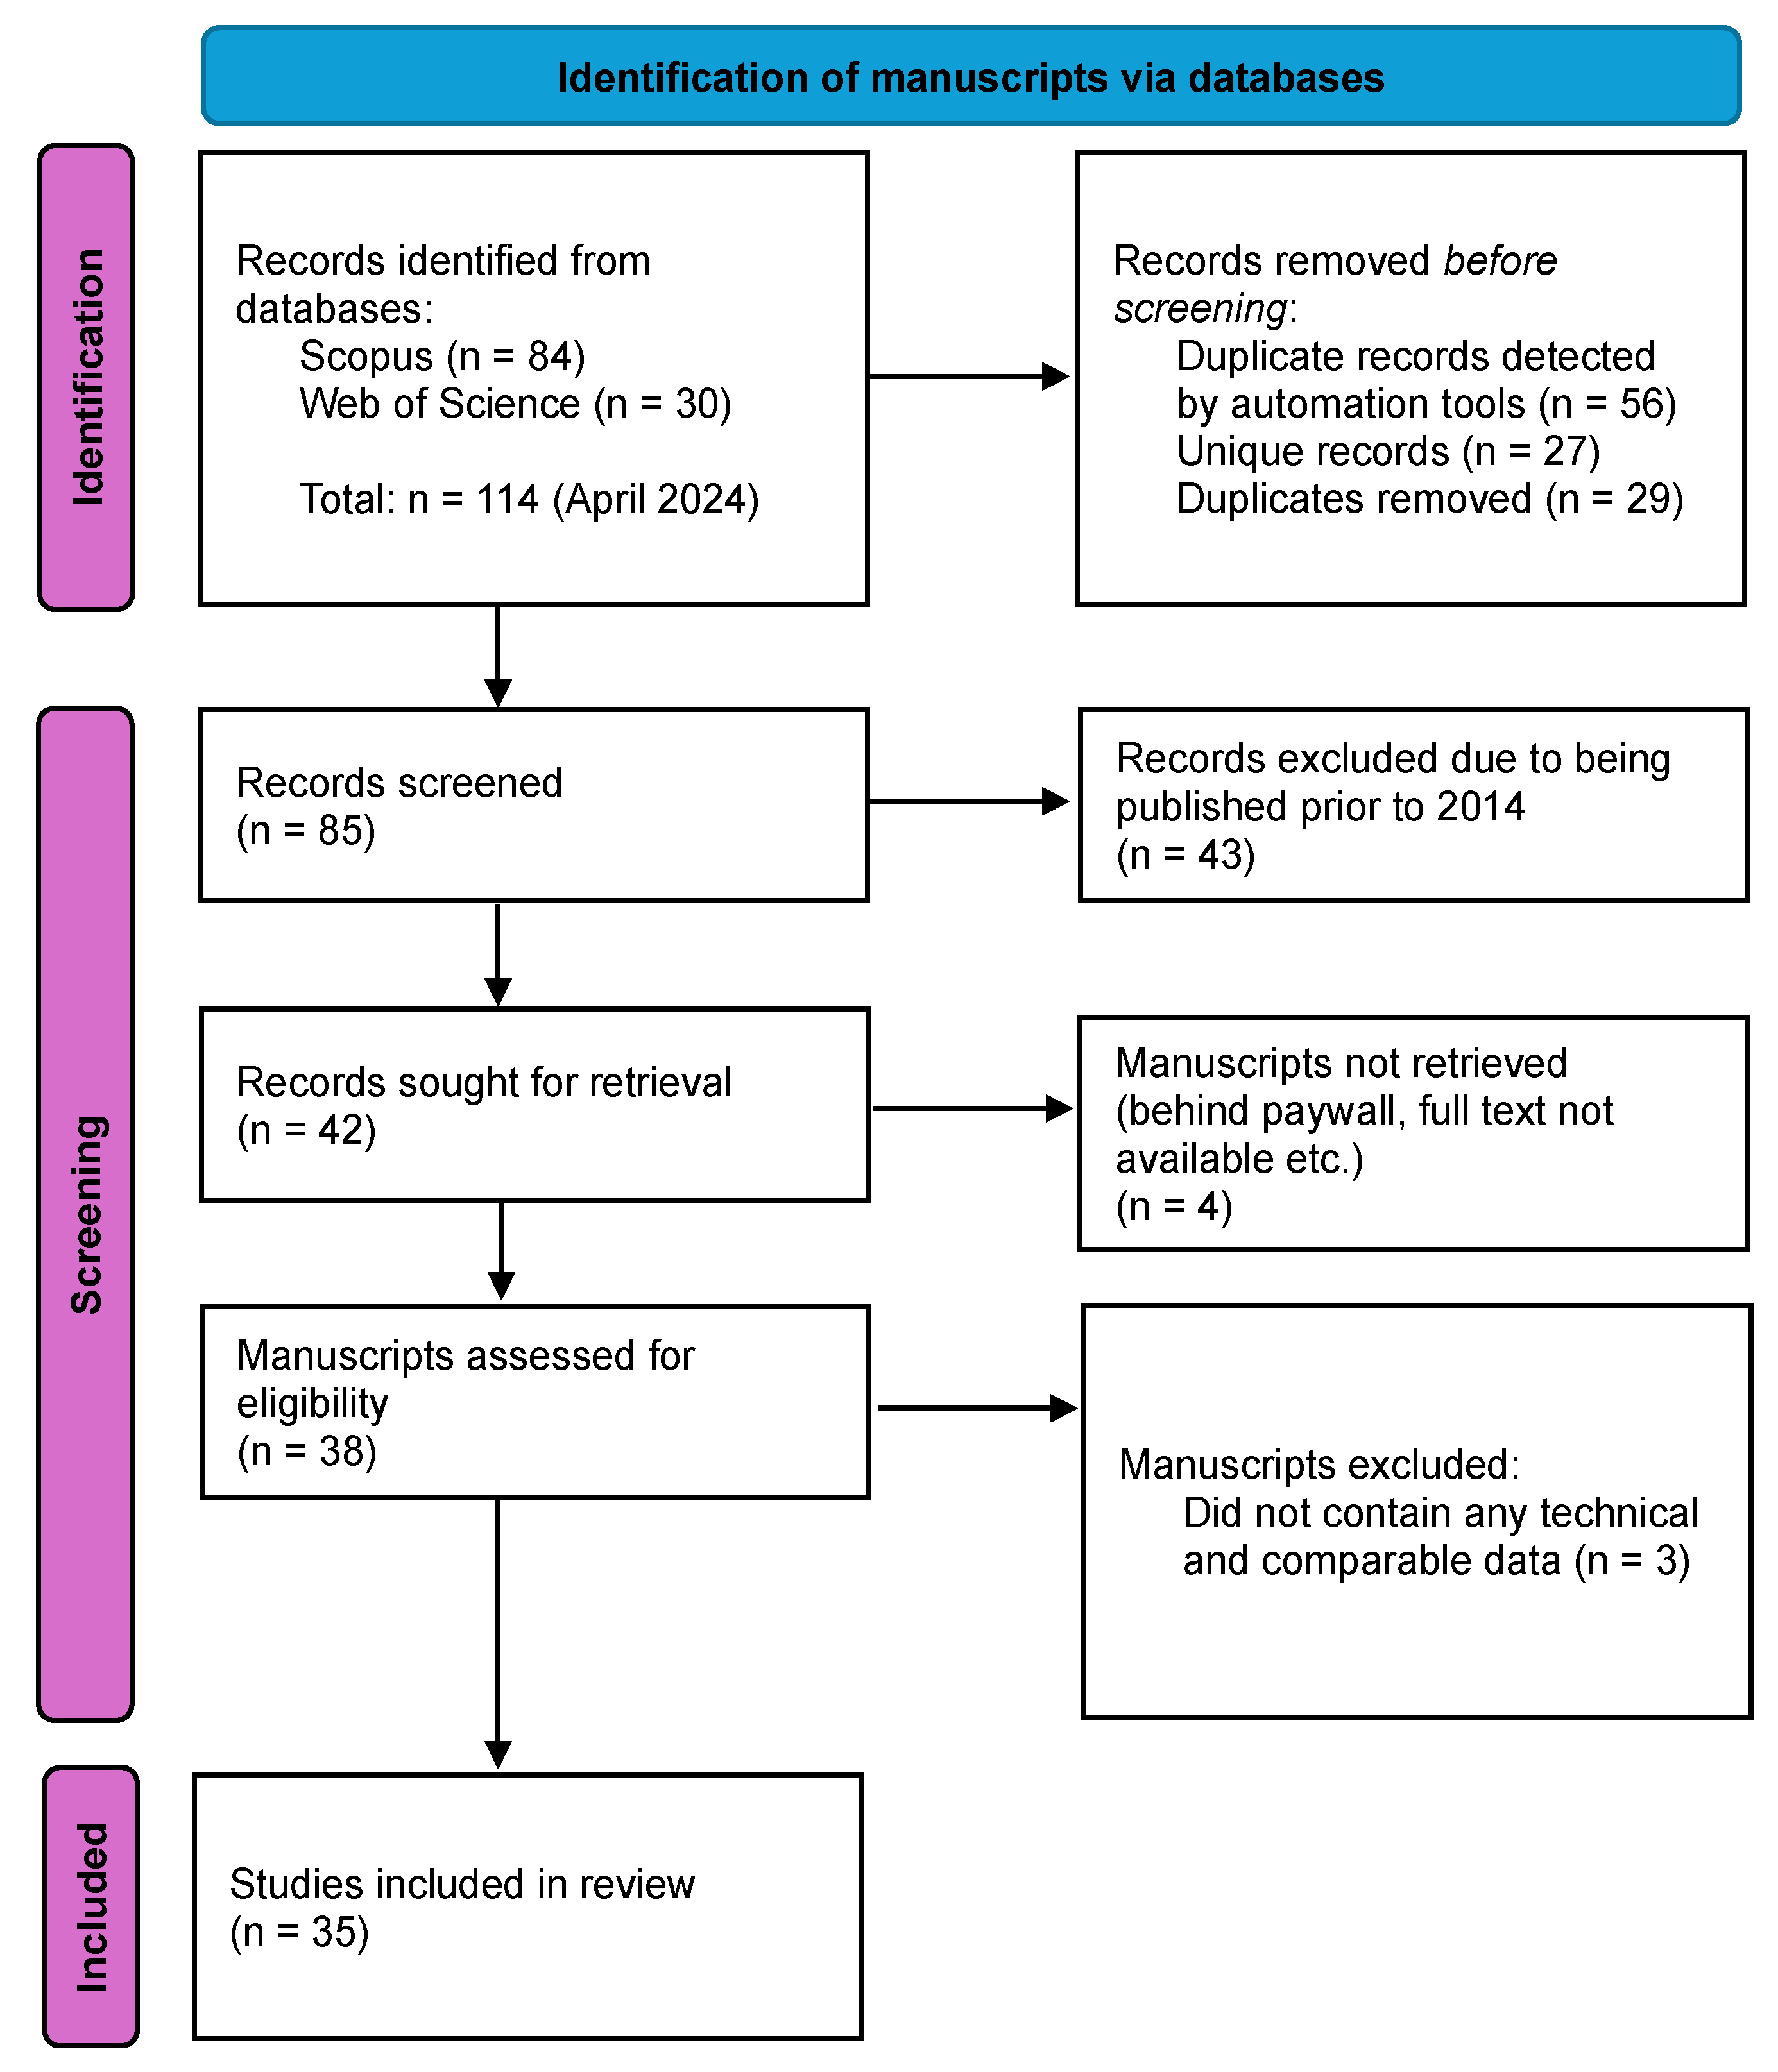
3. Methods Used for the Review of Literature

Initial explorative research and consultation of in-house experts for practical considerations garnered key texts from which key search criteria were reaped. A subsequent systematic search was performed utilizing two databases, Web of Science and Scopus, using the search criteria: “slow sand filter” AND (“water reuse” OR “recycled water” OR “reclaimed water” OR “wastewater” OR “reuse”). No exclusion criteria for search terms were applied, ensuring an extensive retrieval of relevant literature; however, the search was limited to articles published in English. The selection of relevant manuscripts included in the SSF design criteria review was carried out through the screening process as per the PRISMA guidelines (Figure 2).
The information was extracted from the selected 35 manuscripts, 29 of which are displayed in Supplementary Table S1. The remaining six papers [2,66,67,68,69,70] were not included in the tabular form due to the lack of comparable data but were not discarded as they were requisite to other sections of the paper. Several publications (n = 5) by the same group of authors that comprised different parts of the same larger study [71,72,73,74,75] were included as separate entries in Table S1 because each presented a novel aspect, such as variations in biolayer maturation periods, different influent to be treated, and microbiological analyses of the biolayer. Two manuscripts [63,76] on the same SSF bioreactor under near-identical conditions are described in Table S1. In contrast, [57] also referenced [63] as inspiration for the design of their SSF but utilized a different reactor; thus, it was treated as a separate investigation.

4. Key Design Parameters of SSFs

Almost an equal split of manuscripts was observed when categorizing into laboratory-scale (51.7%) and larger-scale investigations (48.3%). These are, respectively, displayed above and below the broken line in Supplementary Table S1. Larger-scale studies were defined as those having a filter diameter > 0.1 m, an environmental setting, or a real-world application. Segregation into these categories was influential to the discussion of the challenges associated with up-scaling systems from investigative to actual-use or prototype scale and ensuring all variables were accounted for. The studies followed a clear pattern, which revealed three key themes. Consequently, the review is organized under the following headings:
  • Characteristics of the filter bed;
  • The impact of location and climate on water demand and filter operation;
  • Multimedia filters and the use of alternative materials.

4.1. Characteristics of the Filter Bed

The inert media bed is essential to the operation of the filtration reactor as, here, the biolayer develops in the top 1–3 cm of media and other removal mechanisms take place. The depth of percolation through the filter media and the mechanical properties of the particles in the bed of media (e.g., overall size distribution/grading, effective particle size (D10), particle shape, and material mineralogy) are all variables investigated in many of the reviews. These factors are crucial not only for the development of the biolayer but also for optimizing the filtration performance where the contaminants are removed. The removal of contaminants is contingent on hydraulic residence (or retention) time (HRT) in the filtration bed which depends heavily on two critical characteristics: media particle size (Section 4.1.1) and bed depth (Section 4.1.2). The links between HRT, particle size, bed depth, and contaminant removal are well established [2,63,77,78,79,80]. Among them, the particle size distribution stands out as a key determinant of the system’s efficiency. In particular, the grading and uniformity of particles directly influence both porosity and flow rate, underscoring the importance of investigating how variations in size impact the overall filter function.

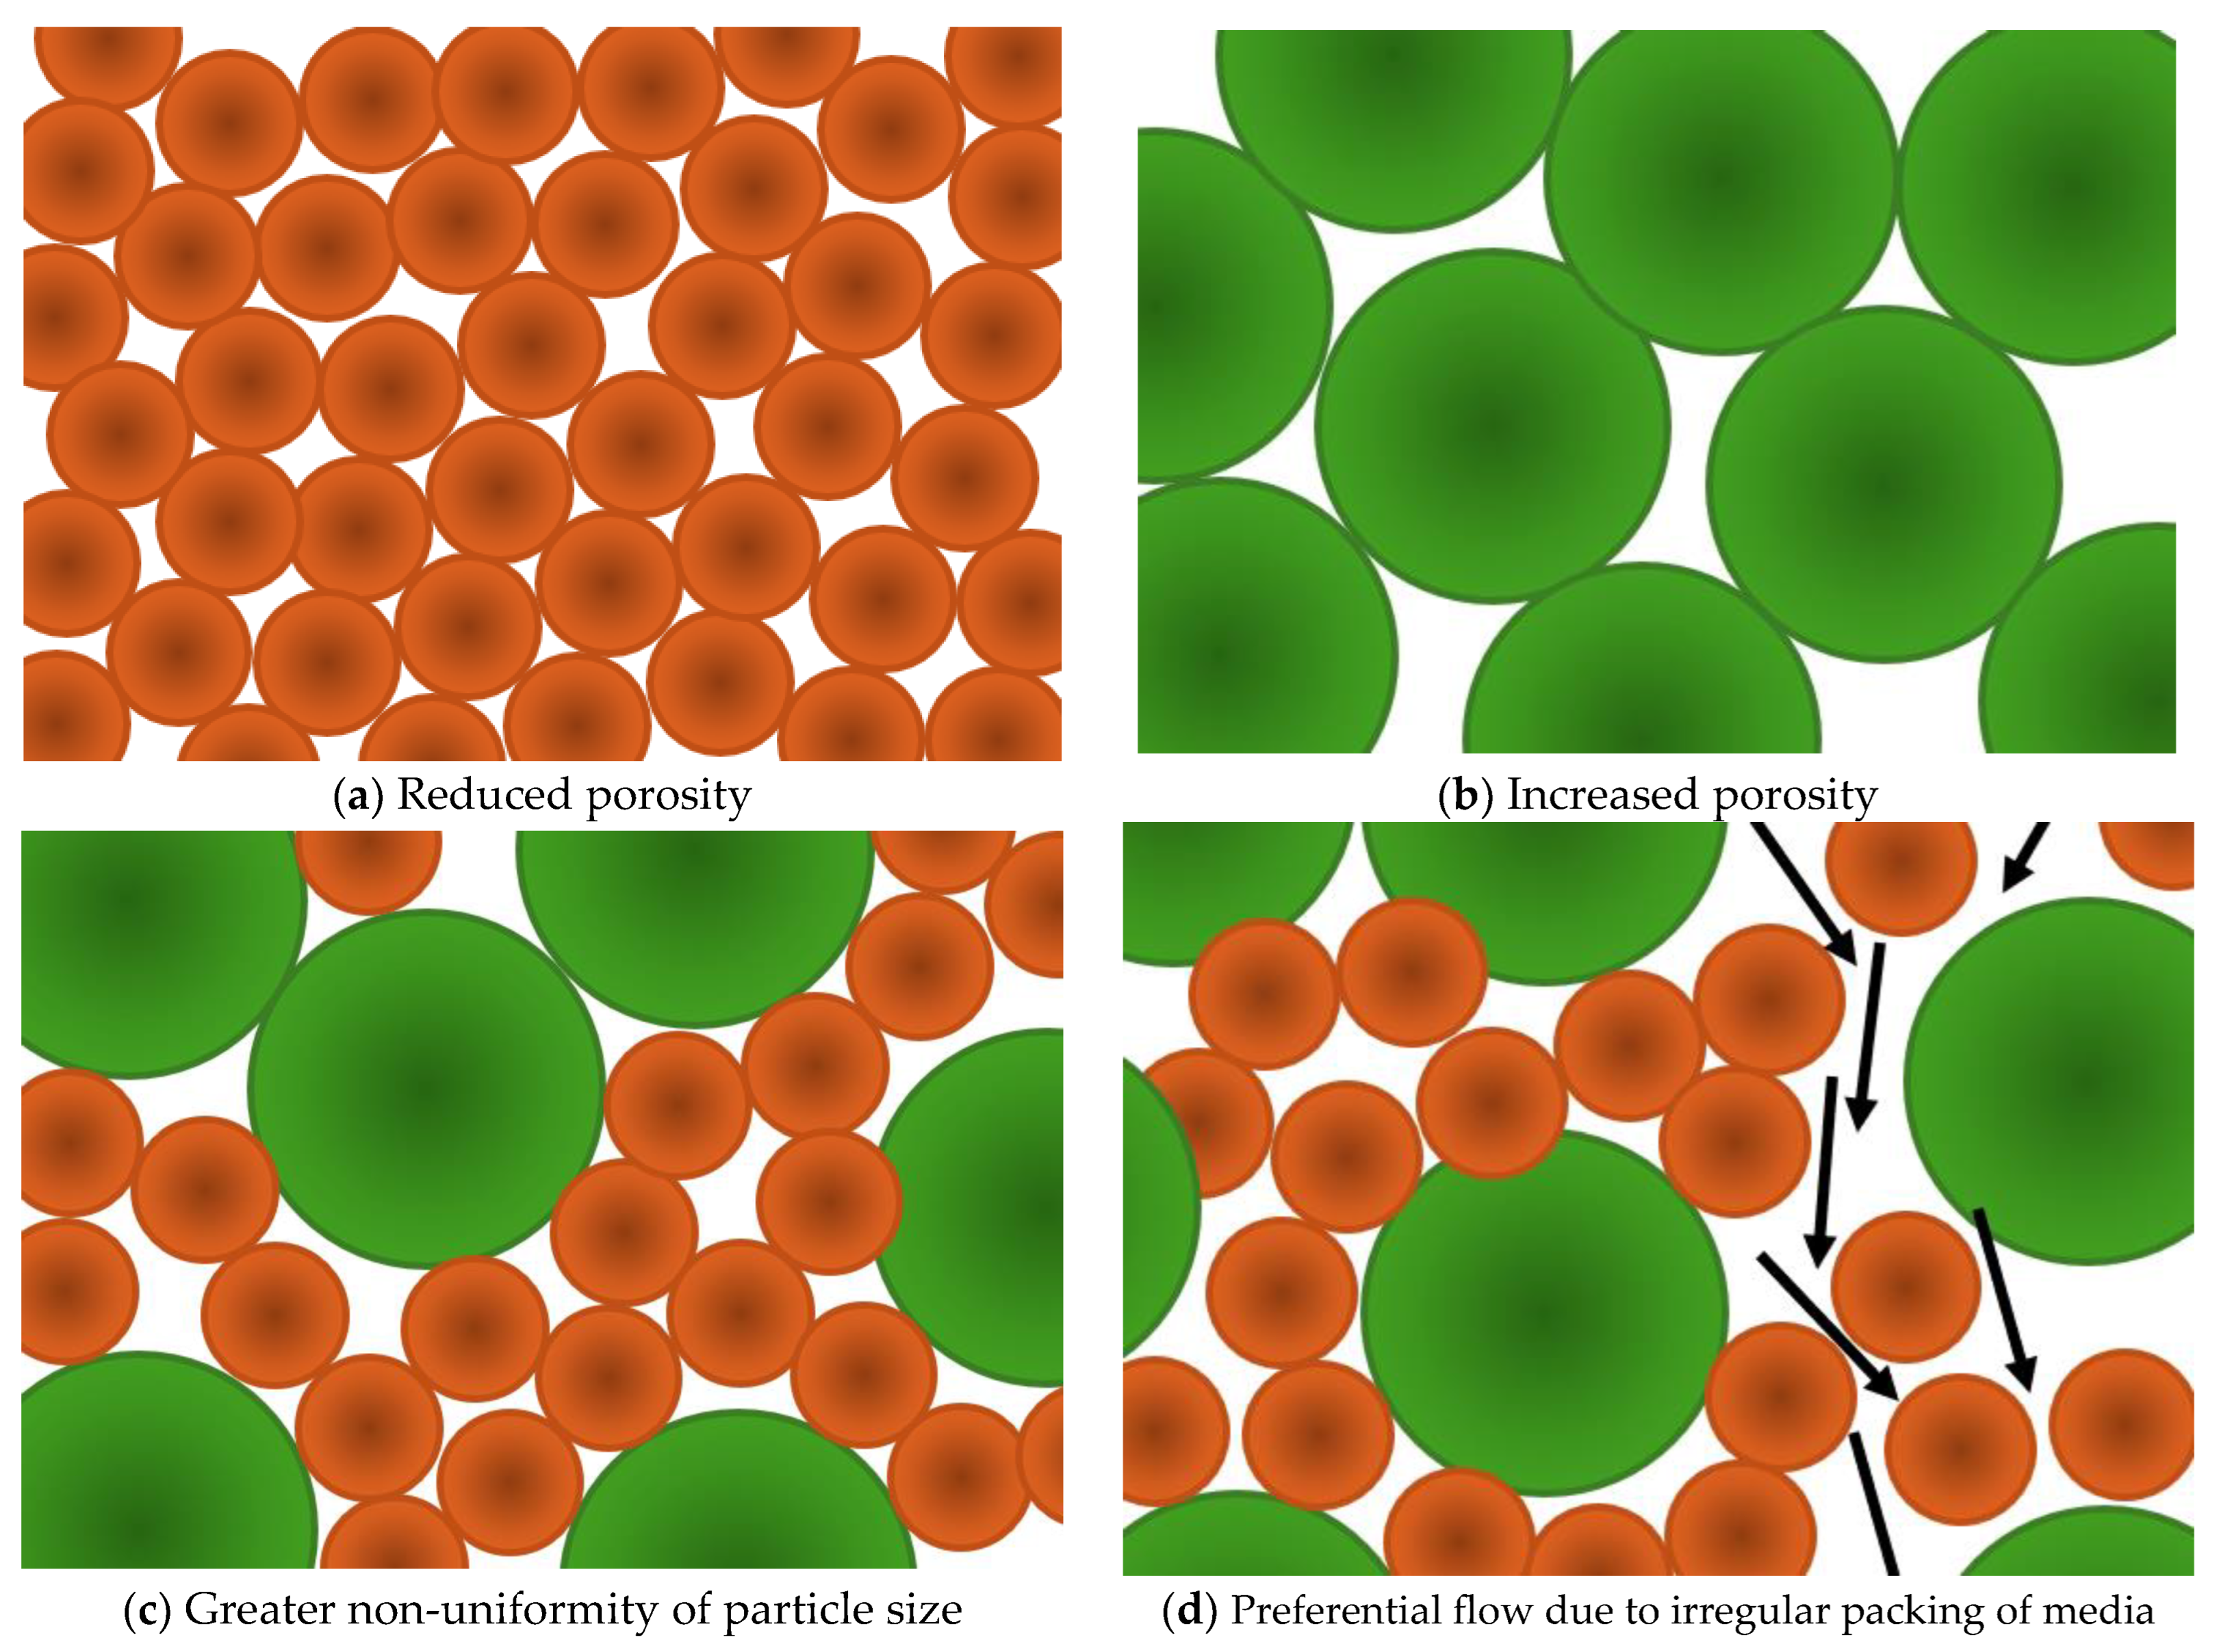
4.1.1. Particle Size Distribution

The distribution of particle sizes in a sample can be analyzed by standard sieving methods to produce a semi-logarithmic graph of particle diameter against the percentage of particles passing through a sieve of that aperture [81]. The effective size (D10) of a sample of material is defined as the particle diameter at which 10% of the sample is finer, as indicated on the sample’s particle-size distribution curve [82]. The effective size of a sample of granular media is a critical parameter that characterizes the hydraulic conductivity and soil drainage characteristics, as the smallest particles can fill pores (spaces between grains) and block paths of flow (Figure 3a). Many of the reviewed papers provided well-defined effective particle sizes, but some texts were less specific. Table S1 presents data with the particle size ranges (e.g., 0.270–0.330 mm) and effective sizes (e.g., ES 0.500 mm) reported in this format. In the reviewed papers, D10 values varied between 0.12 mm and 0.80 mm. Figure 4 displays the distribution of these values between the reviewed larger- and laboratory-scale investigations. The overall mean effective size was calculated as 0.390 mm (standard deviation, SD = 0.235 mm). Larger-scale studies (n = 11) had a lower average D10 of 0.350 mm but had a marginally greater range of values (SD = 0.243 mm). A narrower range of effective sizes was reported in the reviewed laboratory-scale studies (n = 4; SD = 0.212 mm) but had a significantly higher mean of 0.360 mm. This demonstrates that sand filtration investigated experimentally is significantly different from media used in industrial or large-scale investigative applications. However, this discrepancy may be due to reporting inconsistencies where particle size ranges are more often used to describe laboratory-scale SSFs, as well as country-specific standard analyses being utilized instead of international procedures. Industrial standards suggest D10 ranges of 0.15–0.40 mm (Irish water filtration manual [64]) and 0.15–0.30 mm (Northern Ireland Water, unpublished material [83]) (Figure 4). The D10 values from the reviewed literature generally lie within these industrial standards, albeit to the larger end of the spectrum. However, outliers are all greater than these bounds. This suggests that, while smaller particle sizes are desirable, they may not always be obtainable from the materials available due to increased costs to obtain finer material as well as limited supplies, globally and regionally [84,85]. Moreover, no studies have proven the effectiveness of current industrial standards, nor do regulations require that materials used in industrial and municipal treatment systems be verified to ensure compliance with these standards. It may also be possible that research tends towards examining larger particle sizes as these are more readily available, thus these standards should be reevaluated to follow the trend in the current research.
Large-scale work appraised in the current review [53] questioned these relationships between D10, flow rate, and treatment efficiency, where effective sizes 0.27 mm and 0.45 mm were compared in a single-media SSF. Prior to biolayer formation, sand with a smaller D10 (0.27 mm) achieved higher total coliform removal efficiencies (98.3%) compared to the larger D10 (0.45 mm, 90.1%) as well as the control which was absent of any material (71.1%). After biolayer formation, no significant differences were observed in the removal of total coliforms or heavy metals (such as copper, lead, and iron) among the different sand sizes, though the 0.27 mm D10 sand showed a slight advantage in the removal of E. coli. While the filtration rates were not specifically reported in relation to particle size, these results suggest that contaminant removal is a combined effect of mechanical filtration by the sand particles and the natural biological processes occurring within the biolayer. The former and the latter study both also demonstrate that the effectiveness of an SSF treatment approach is a function of several factors including but not limited to the effective size of the filtration media.
The assortment of relative grain sizes offers valuable insights into particle packing, which further influences porosity, hydraulic conductivity, and flow consistency (i.e., tortuosity), as seen in Figure 3 [86,87]. The grading of the sand, or uniformity, depicts the ratios of sizes relative to one another. The coefficient of uniformity (CU) is the ratio of D60 (diameter corresponding to 60% finest material) and D10 and is expressed as follows:
C U = D 60 D 10
However, particle size alone does not account for the impact of the filtration media on hydraulic conductivity—shape regularity and particle packing also influences these parameters. Inhomogeneous packing of material into the filter bed can lead to hydraulic short-circuiting or preferential flow as visually demonstrated in Figure 3d. Although this schematic presents solely smooth, round shapes of particles as opposed to rough/irregular surfaces, rougher and more irregular particle shapes demonstrate similar properties [2]. Furthermore, typical sieving techniques, whether presented in the percentage of weight or volume, assume a relatively regular, spherical particle shape [87]. Laser diffraction, dynamic light scattering, automated image analysis, and centrifugal sedimentation are alternative methods for analyzing the granular material, each measuring different aspects of a particle’s shape (e.g., flatness, irregularity of surface, and the presence of fibrous particles) [87]. While these approaches have a wide dynamic range and can generate data on the shape of the particles, most are not typically used for geotechnical applications and are specific to industries such as pharmaceutical production [81]. The few reviewed studies that defined how they had characterized the filtration media, unanimously employed sieve analysis as a standard procedure [53,54,88,89,90]. Therefore, sieve analysis, which does not require advanced analytical instruments, is an acceptable standardized method for generating comparable data across studies of SSF.
Existing literature agrees that a lower CU is preferential for enhanced contaminant removal [77], with previously published reviews observing or recommending a CU of less than two [66], or even as low as one [2]; this may not be practicable with available materials. The Irish Environmental Protection Agency (EPA) manual on SSF states a CU of “<2 is considered optimal” [64]. Interestingly, a mean value for CU was calculated from the larger-scale studies reviewed (n = 14) to be 2.50 (SD = 1.13), where the coefficient ranged from 1.00 to 4.80. This suggests that materials with lower uniformity (i.e., greater co-efficient of uniformity) are more frequently utilized in larger-scale investigations, which are likely more representative of real-world applications.
For the laboratory-scale investigations, very few reports defined the CU for the sand material used, but those few had values ranging from 1.1 (silica sand) to 5.85 (iron-coated sand). Here, the material type exerts a significant influence on the uniformity of grain size distribution. Putatively, this may be due to silica sand (typical purity > 95% silicon dioxide; SiO2) possessing a greater hardness than regular construction sand [91], and with a lower friability (easily pulverized), a more consistent grain size is observed. The higher CU seen in the study of sand treated with ferric chloride (FeCl3) signifies a greater disparity in particle size, with 60% of the material (D60) passing through a sieve with a larger aperture compared to the sieve aperture through which 10% of material passes (D10). This may be perhaps due to the agglomeration of particles to form larger ones or due to the increase in finer particles from the precipitation of iron from the ferric chloride solution [92]. Other factors which may influence the CU of a given sample of material include the shape (angular or rounded), density, and porosity of the particles [82].
The correlation between the CU and contaminant removal remains ambiguous due to the lack of standardized performance indicators across the reviewed studies. For instance, one study [93] reported an 85% reduction in total phosphorus (TP) on a material with a CU of 2.7, while another report [88] documented a significantly lower phosphorus removal of only 9.09% when CU was 3.0. Despite similar coefficients, little comparison can be drawn between the two investigations. For example, the studies had diverse experimental set-ups, like inclusion of constructed wetlands [93] or aquatic plants [88] to aid in the remediation of water. Notably, the SSF bed depths differed between these studies, with the former using a 0.54 m sand bed and the latter utilizing a sand bed of just less than 0.90 m. The authors attributed the observed low TP removal to the sub-optimal microbial composition of the biolayer, noting a purportedly low abundance of phosphorus-accumulating organisms (PAOs) in the biolayer [88]. However, surface areas for biolayer growth were significantly different (38.750 m2 [88] vs. 0.989 m2 [93]); thus, further highlighting the challenges associated with comparing experimental designs like-for-like. Furthermore, insufficient studies defined both coefficient of uniformity and common performance indicators, thus conclusions could not be drawn regarding media uniformity and the performance of the filter. However, it is known that extended hydraulic retention times (HRT) result in improved water quality, as the increased contact time between the supernatant water and the biofilm allows for more prolonged and effective treatment of organic compounds [80,94]. Therefore, indirectly, HRT may be a surrogate indicator of the performance of organic removal processes. Based on this, slower operating filters would tend to remove contaminants better. Such is demonstrated in one dual-media filter containing activated carbon and sand [95], which removed an average of 99.5% of pharmaceuticals and personal care products (PPCPs) at a slow filtration rate of 5 cm∙h−1. For comparison, the same set-up achieved a marginally lower removal of 97.3% at a greater filtration of 20 cm∙h−1. Albeit, HRT must also be realistic such that an acceptable volume of treated water is produced for the specific application of the SSF. Additionally, a significant reduction of 30.89% in total phosphorus (TP) was observed in the study [78], despite the highest recorded CU value (5.85). This suggests that other factors, such as more favorable biolayer community composition, may have a greater influence on TP removal [88].

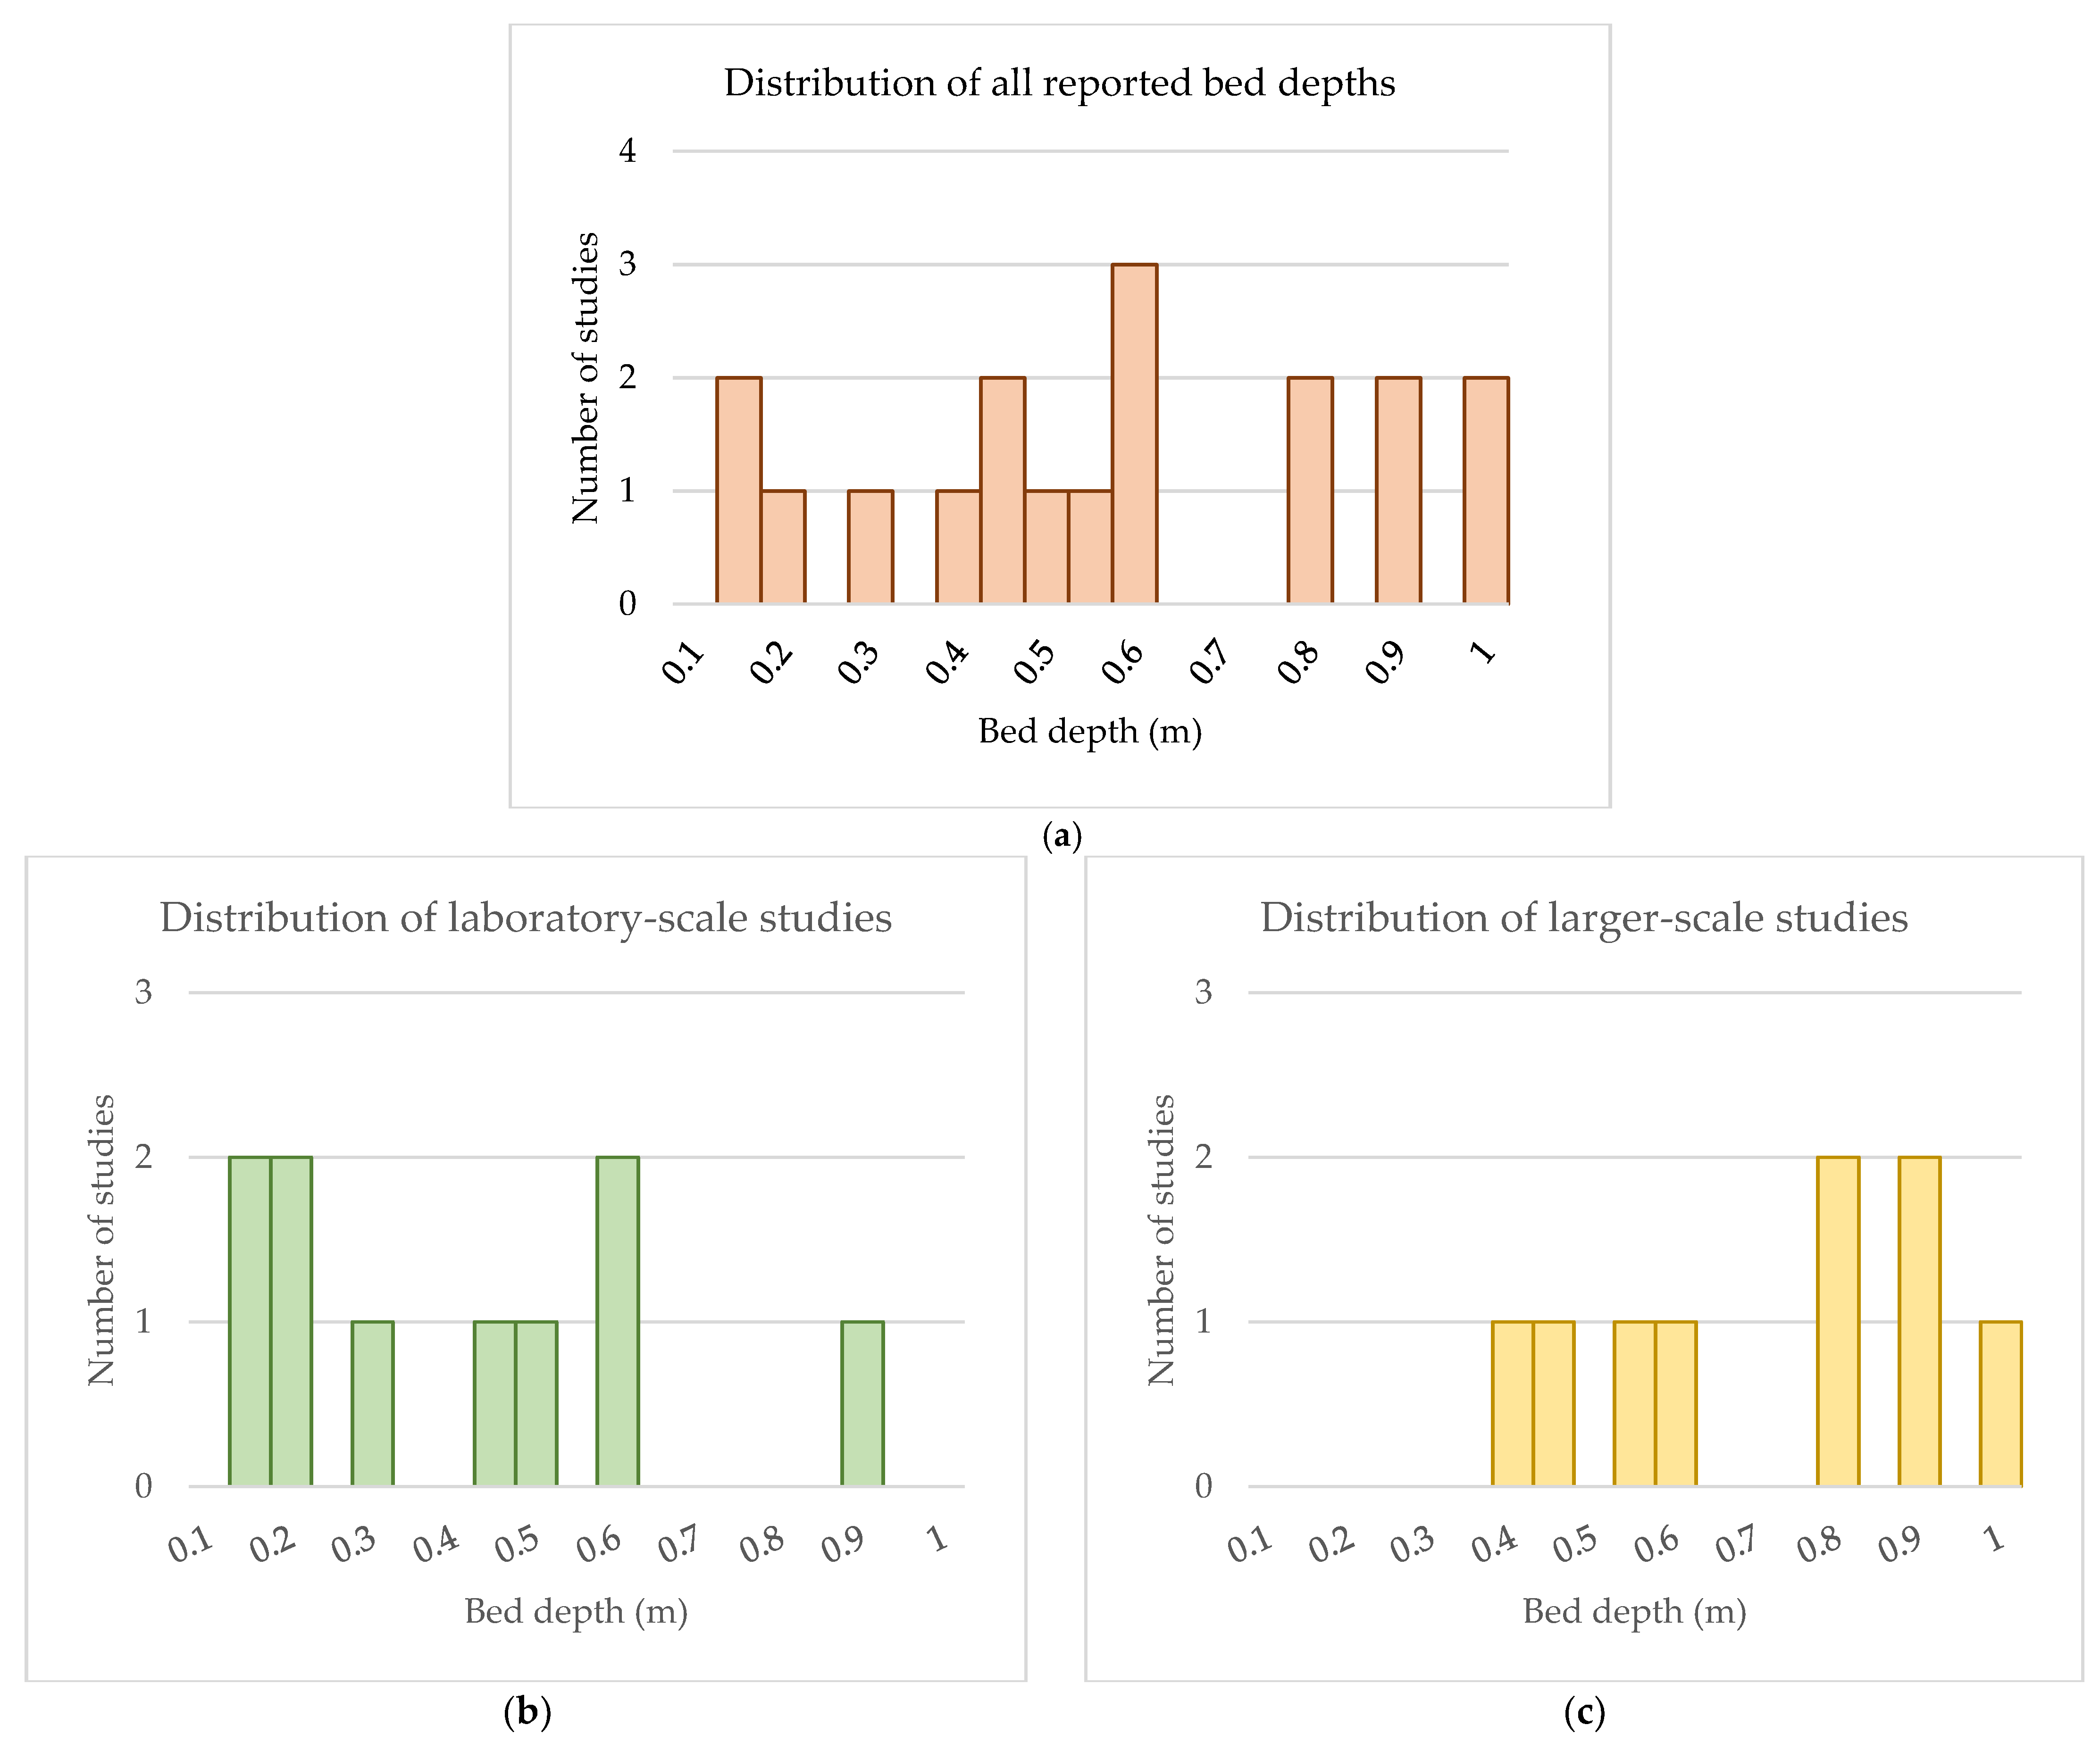
4.1.2. Depth of Media Material

The distance, or depth, of the inert granular media, which the supernatant water must percolate through, is influential on the performance of the reactor. The 2023 review by Maiyo et al. [80] states a 0.3 m minimum depth is required for turbidity removal and 0.6 m for effective removal of viruses. From the current review of the larger-scale studies, the bed depth varied from 0.30 m to 1.40 m, while for the laboratory-scale testing, it ranged from 0.10 m to 0.90 m (Figure 5). It is important to note that some investigations incorporated non-sand materials in the filtration bed of their SSF reactors, such as anthracite [96], activated carbons [14,95,97,98], and crushed clam shells [71,73,75]. Furthermore, a small number of reactors within the reviewed studies were non-downflow SSF reactors (i.e., horizontal-flow [99] or up-flow [57,63,76,89]). For this discussion, the depth of the material will include the total depth traveled by the supernatant water under gravity (i.e., down-flow reactor designs only) before reaching the drainage gravel layer.
The average depth from the reported studies on the depth of the material (n = 19) was 0.52 m. Figure 5 illustrates the distributions of these studies with respect to the depth of the filter material. For all reported bed depths (Figure 5a), the modal bed depth (0.6 ≤ d < 0.65) was skewed above the average depth, indicating a greater concentration of the studies investigated depths greater than 0.52 m, overall.
A 2021 investigation by King-Nyamador et al. on bed thicknesses for improving quality of irrigation water [53] concluded a minimum depth of 0.40 m, which demonstrated up to 100% removal of copper ions (loading concentrations were not detailed). This conflicts with recommendations set forth by the Environmental Protection Agency (EPA) of a minimum of 0.60 working sand depth [64], although EPA recommendations are directed at water service suppliers and are not specific to water recycling activities as King-Nyamador et al. investigated. Three filtration rates, equivalent to 0.215, 0.399, and 0.664 m∙h−1, were investigated; however, it was not detailed at which the optimal removal was observed. It should be noted that while King-Nyamador et al. identified an optimal bed depth (0.40 m) [53], the study evaluated only three bed depths (0.30, 0.40, and 0.50 m), without investigating additional depths beyond this scope. The ability to identify trends in the removal performance related to bed depth was thereby limited. A subsequent investigation on effective particle sizes D10 (0.27 mm and 0.45 mm) focused solely on a bed depth of 0.40 m [53]. Despite concluding that a depth of 0.40 m and an effective size of up to 0.45 mm were optimal, there remains a gap as the combined effects of the sand depth and particle size have not yet been adequately evaluated.
A similar study, [95], also focused on the depth of the material with respect to the removal efficiency. In this instance, the particle size was kept identical across the experiments (D10 = 0.6 mm, CU = 1.4) but granular activated carbon (GAC) with particle sizes ranging from 0.4 to 1.7 mm were also incorporated. Briefly, three columns were packed with a range of depths of sand and GAC, as well as one column with 100% sand and one with 100% GAC. It was observed that an optimal bed composition of 20 cm GAC sandwiched between 10 cm and 30 cm of coarse sand was able to remove on average 98.2% of the target PPCPs–diethyltoluamide (DEET), paracetamol, caffeine, and triclosan. GAC depths greater than this had no significant impact on the removal of the PPCPs, thus the non-linear trend was sufficiently explored. Three different filtration rates were also applied (0.05, 0.10, and 0.20 m∙h−1), controlled by a singular valve [100] and monitored twice a day, and appropriately adjusted [95]. The filtration rates provided valuable data for cross-examining the adsorption time relative to material depth and flow rate. When the filtration rates were compared, the range of 0.05–0.20 m∙h−1 [95] was significantly lower than that of the previously discussed values (0.215–0.664 m∙h−1 [53]). In this experiment, though the type of adsorbent used, activated carbon, was more influential for the removal efficiency than the depth of the bed. The evaluation of the optimal depths of the material is, nonetheless, important, as SSFs should be deep enough to remove contaminants without containing excess filter material. This finding is crucial for sustainable design, as it emphasizes the importance of minimizing redundant material. Future investigation should focus on a detailed analysis of sand bed depth, sand particle size, and incorporation of alternative adsorbent materials to improve longevity, regeneration, and cost-effectiveness of the working SSF.

4.2. The Impact of Location and Climate on Water Demand and Filter Operation

The geography of the larger-scale studies reviewed included the USA (x2), India (x2), Uganda, Thailand, Botswana, Germany, Ghana, Brazil (x2), Palestine, and Nigeria. Climate, water stress, and drought risk are the factors which have relevance regarding the demand on SSF during periods of drought and the demand on the system for treated water, as well as the environment to which the living biolayer is exposed. For example, the biofilm may experience starvation and die-off in extended periods of no use [101] such as drought. Furthermore, centralized water treatment systems are not typical of emerging economies [89,101]. A decentralized system design may be required depending on the location of the water demand. Climate and water demand are important to consider as these factors can affect the usage and performance of the filter, particularly the biofilm (which is inhibited at temperatures below 6 °C) as outlined below.

4.2.1. Operation Modes: Continuous Versus Intermittent

The SSFs are operated in either continuous or intermittent mode. Continuously run SSFs involve persistent usage, but not necessarily constant influent flow, and are typical of larger filters which service a greater demand [51,66,77]. Intermittent SSFs, sometimes known as pulse mode, are typical of point-of-use (POU) filters which provide water at a household level and are the subject of investigation in many publications due to their practicality [1,51,71,102,103]. In the intermittent SSFs, the pause period between batches of water treatment can extend up to 48 hrs. This interval is integral to the treatment process, facilitating adsorption, the starvation and die-off of microorganisms, pathogen predation, and the removal of impurities [1,73].
It should be observed that the supernatant water in both intermittent and continuous filters should be maintained above the biolayer (a constant head) for its survival, including during the pause period of intermittent mode SSFs to prevent evaporation and drying out of the schmutzdecke layer, which is normally near surface level. Equally, the supernatant water must also not be so deep that the biolayer is deprived of oxygen, thus killing the microorganisms—an optimum must be achieved.
A filter designed to remove pharmaceutical products implemented an overflow outlet at the desired height of the supernatant water, functioning similarly to a weir [95], allowing the design to be used for both intermittent and continuous operations. This was similar to designs presented in [51,102]. One limitation of this model is the fixed overflow point at the ridged head height. If the depth of the filter material changes (e.g., cleaning or other maintenance), the supernatant water will always overflow at this specific point, limiting flexibility in managing water levels. Suggested static hydraulic head depths include 0.05 m (5 cm) noted by household filters [51,102], laboratory-scale sandwich SSF [95], and a pilot study [54]. Other hydraulic head depths observed were in the range of 0.9–1.5 m for the full-scale treatment SSF, as reported in [53,103], similar to EPA recommendations, ≤1.2 m [64]. Therefore, the proposed head height is at the discretion of the individual design, depending on the dissolved oxygen of the influent which allows the survival of the schmutzdecke organisms.
Given the critical role of geography and climate in influencing water availability and the associated stressors on water resources, understanding the flow mode of SSFs becomes paramount for optimizing its function. The efficiency of these filtration systems, whether operated in an intermittent or continuous mode, can depend on the availability of water to be treated. This availability not only supports the survival of the essential biofilm but also optimizes the overall performance of the filter. The potential for adverse consequences resulting from water scarcity, quality degradation, or flooding (collectively described as water risk [41]) may also have an impact on the demand for treated water, where decentralized treatments may be essential to meet needs in times of drought. Conversely, being aware of the climate is influential in designing a filter with greater capacity should overloading of the system occur in times of heavy rain and flooding. One study [66,68] described a unique approach to decentralized water treatment for reuse; in brief, the application of an electric field in an SSF was examined for its performance in reducing bacterial concentration in modified wastewater. Interestingly, this work demonstrated that the application of only 2 V∙cm−1 to the filter bed without a biofilm could achieve a similar log reduction in E. coli when compared to the same filter which had developed a biofilm. This approach may address the issue of prolonged biofilm development phases by applying an electric field as needed, substituting the biolayer’s function, and circumventing the need for a maturation period. However, the findings of Haaken et al. (2022) [68] require further validation, as the influent water used was significantly altered and does not accurately represent untreated water conditions. Frequent application of the electric field may also lead to inefficient energy consumption, particularly in less developed countries where electricity supply is often intermittent and unreliable, highlighting the need for low-maintenance alternatives.
The determination of the best mode of operation, intermittent or continuous, is the prerogative of the specific intended use of the SSF. As discussed above, intermittent POU SSFs are typical of household-level volumes of water (~64 L water daily—four feeds of 16 L [51]). While continuous household SSFs can be modified to process similar low volumes of water [104], typical daily production volumes of continuous SSFs are in the range of three million liters per day [64]. These figures are from large treatment plants servicing large populations such as towns, still, this demonstrates the versatility of SSF. The filter capacity is an integral element to the filter’s design and manufacture as a greater demand for clean water will necessitate a filter of a greater capacity, and vice versa. Several studies reported no statistically significant difference in performance between operational modes [51,104,105]. However, one reviewed study found that continuous household SSFs outperformed intermittent ones in terms of coliform removal [1]. Despite this, intermittent filters remain viable options, particularly when a post-filtration disinfection step is applied such as chlorine dosing [104,106], as this can economically compensate for any performance differences. This suggests that intermittent SSFs, while potentially less effective on their own, can still achieve comparable results when paired with additional disinfection processes. Therefore, it can be concluded that the flow regime (continuous vs. intermittent) is decided by what is financially feasible, i.e., capital expenditure available.

4.2.2. Maintenance Cycles

Slow sand filter maintenance takes many forms depending on the application: investigative or real-life use. In real-world operations of slow sand filtration, maintenance is indispensable as overgrowth of the schmutzdecke can block the filtration process [70]. In the reviewed studies, SSFs were generally lab-based or pilot-scale systems for investigation, which included monitoring of the filtration, flow, and/or hydraulic loading rates (HLRs) [54,95,98]. The studies also considered the impact of cleaning filtration media when the head loss impeded the production of the filtrate (clogging), as the top layer of the filter is where the biolayer responsible for bioremediation of the water develops. Addressing maintenance of the system is also important to prevent preferential flow, or short-circuiting, from affecting filtrate quality [2].
A 2017 article investigating household bio-sand filters [107] describes three different methods of maintenance to clean trapped sediments: stirring method (SM), surface agitation (SA), and sand removal method (RM). Cleaning was carried out when the flow rate dropped below 250 mL∙min−1. This study of POU bio-sand filters measured the capability of the filter to recover to normal flow rate following maintenance, taking supernatant and effluent samples around the time of maintenance. The median recovery time was <1.2 days but following RM, recovery was up to 12.75 days. The investigators recommended using the SA method over the RM. Briefly, SA involved the rapid tapping of the sand surface no deeper than 1 cm and decanting of the supernatant water before recharging with raw water and repeating. This is not dissimilar to the ‘swirl and dump’ technique described in the manual for the construction and maintenance of bio-sand filters designed by CAWST [102]. Alternatively, RM involved the removal of 5 cm of top sand and cleaning in a basin, decanting supernatant water before repeating and then replacing in the filter. Higher removal rates (monitored through coliforms and turbidity) were noted with the SA method [107]. Additionally, the RM maintenance procedure resulted in an extended recovery period and a notable decrease in the removal efficiency immediately post-maintenance. This decline is likely attributable to the disruption and removal of the bio-layer during the cleaning process. It is noteworthy that these filters were operated intermittently over 182 days under Ugandan climatic conditions, with temperatures ranging from 22.0 to 23.4 °C. The intermittent operation allowed for pause periods, which significantly impacted the recovery and maturation of the biolayer. Specifically, a maximum recovery period of 4.2 days was observed with pause periods, compared to 23 days without such intervals.
To maintain the flow recovery in a continuous system, a procedure akin to the previously described RM maintenance may be necessary to address the build-up of sludge. The RM offers the potential for the recovery of resources, allowing the extraction of nutrients, water, and energy from the biomass produced and collected in the filtration [52]. This approach is supported by findings from [88], who implemented a geo-textile layer to facilitate sludge removal in their continuous-flow set-up. Their filter operated for 84 days at temperatures ranging from 20 to 25 °C in Brazil. Another Brazilian study [51] included a non-woven blanket for the same reason (240 days at 25 °C, Brazil). EPA recommendations include scraping and cleaning for maintenance by removal of the schmutzdecke, as well as temporarily diverting the filtrate (non-delivery to customers) until demonstrating re-maturation of the biofilter [64]. A study of an operational SSF site incorporated a second SSF run in parallel to sustain water delivery to customers during this recovery period, alternating the operation of each depending on the cleaning and biofilm maturation cycle [88]. The cleaning frequency reported in the literature tends to vary, depending on the water source (Table 2). Detailed specifications of the cleaning and maintenance in these studies were not provided.

4.3. Multimedia Filters and the Use of Alternative Materials

SSFs are not typically designed for micropollutant removal. However, treatment enhancement by retrofitting GAC layers into SSF is routine. Most SSFs constructed in Ireland consist of more than one type of medium, typically sand and anthracite, according to the EPA design manual [64]. Moreover, one reviewed study concluded that a dual media filter incorporating anthracite was more effective than sand alone, which tended to cause operational clogging earlier than the dual-layer design [96]. The replacement of a portion of the sand bed depth with alternative materials can not only improve treatment efficiencies but also decrease the amount of sand required for operation, thus boasting a sustainable design approach. While a bed of sand can last as long as ten to twenty years [66], this is still a crucial factor for resource sustainability, as spent sand must be either disposed of or subjected to cleaning and regeneration processes [64]. Furthermore, the unsustainable extraction of sand is increasingly recognized for its detrimental environmental impacts [108]. Such over-extraction has been identified as a contributing factor to the ecological demise of Lough Neagh, a Northern Irish Lake, that has experienced increased occurrences of toxic algal blooms in recent years [109].

4.3.1. Activated Carbon and Biochar

Activated Carbon (AC) has historically and consistently proven to be effective at remediating water even of recalcitrant compounds. AC is typically used in standard drinking water treatment systems [64] and comes in granulated (granulated activated carbon, GAC) or powdered (powdered activated carbon, PAC) forms. Typically, the AC is produced in two stages: pyrolysis of biomass followed by chemical or physical activation [61]. Here, carbon-rich materials, such as agricultural residues and food waste biomass, undergo pyrolysis, a thermal decomposition process conducted at temperatures up to 1200 °C, in the absence of oxygen, resulting in the production of a char precursor [110,111]. This precursor, commonly known as biochar, possesses intrinsic adsorptive properties and facilitates contaminants removal by ion exchange, reduction and oxidation reactions, immobilization, and degradation of polluting particles [111,112]. These mechanisms are also facilitated by atoms and/or functional groups contained in the structures of biochar, for example, oxygen atoms can be available for hydrogen bonding with hydroxyl groups (-OH) present in contaminants like dyes [110]. Undergoing further processing (activation) significantly enhances these adsorption capabilities [61]. Physical activation is considered by some researchers an environmentally friendly approach due to its avoidance of chemical reagents; however, it is energy-intensive, time-consuming, and typically results in a lower adsorption capacity [61]. In contrast, chemical activation operates at lower temperatures (below 900 °C) and employs activating agents to enhance the contact surface area and adsorption efficiency. However, this process generates toxic wastewater, as additional washing steps are required to remove residual chemicals [61,113]. Carbonaceous materials are still popular adsorbents used in water filtration, and current published research on SSF is abundant with studies of biochar as a carbon source for adsorption of contaminants [66,112,114,115], as considered below.
A larger-scale multi-media SSF study investigated the effectiveness of GAC in the removal of PPCPs from synthetic wastewater [95]. In this work, ratios of GAC and sand were modulated to investigate how well the activated carbon could remove a variety of PPCPs. At 100% sand composition, the average PPCP removal was only 51.9% with a maximum removal of paracetamol achieving 98.2% at a low flow rate of 5 cm/h. Introducing a 0.1 m layer of GAC between 0.1 m and 0.3 m of coarse sand (D10 = 0.60 mm) enhanced the removal rate to 100% for paracetamol across all tested filtration rates (5, 10, and 20 cm/h), while achieving over 88% removal for all other compounds. The EPA manual [64] recommends installing a GAC layer of 100 to 150 mm to effectively remove disinfectant by-products and improve the removal of total organic carbon and color. However, this method often becomes ineffective within a few weeks as the GAC medium exhausts quickly [64], which is often overlooked by researchers. For example, the previously mentioned study by Li et al. [95] solely looked at a dual-media design with GAC, without addressing media exhaustion, long-term effectiveness, or recycling/end-of-life of GAC. These are essential considerations for ensuring the sustainability of water treatment systems. Similarly, the authors of study [14] incorporated GAC into their reactor units with promising results, achieving turbidity levels below 2 NTU (nephelometric turbidity units), total phosphorus concentrations around 0.5 mg·L−1, and bacterial counts below regional reuse standards at a low HLR of 187 cm·day−1. This study did not provide details on the maintenance of their set-up over the 8-month duration but stated there were no clogging issues. Additionally, the modular design of the reactor also allowed for potential maintenance to be performed without interrupting treatment, offering the opportunity for regenerating the activated carbon for reuse.
Considering the lifespan of AC as a critical characteristic, its following use in water treatment involving the disposal of exhausted material raises concerns about secondary waste and the potential leaching of adsorbed pollutants back into the environment [114]. A recently published review of the regeneration of AC noted several approaches to recycle the material including chemical, electrochemical, microwave, and bio-regeneration [116]. The review noted the success of some of the approaches including maintaining high adsorption capacity by microwave regeneration, and even decomposition of adsorbed compounds by electrochemical regeneration. However, drawbacks of each were also noted including the generation of toxic wastes and by-products, altered adsorbent effectiveness, and significant water usage to name a few. With expensive production and challenges of regeneration [61,116], the sustainability of AC usage is questionable, and also may not prove feasible in the context of emerging economies.

4.3.2. Alternative Sustainable Treatment Materials

SSFs are primarily composed of simple, natural materials engineered to form a comprehensive water treatment system. Current research is shifting towards utilizing hybrid or multi-layer materials, focusing on the adsorption potential and the interactions between filtration media and contaminants in influent waters [74,117]. Engineered materials, such as porous organic polymers [118] are also being explored for their unique properties including diverse functional groups and high surface area, with promising potential for the tailored removal of contaminants from water [119,120].
Many of the reviewed manuscripts have used activated carbon in their filter designs [14,57,71,121,122]. As previously mentioned, organic carbonaceous materials are used in the production of biochar and activated carbon. Sawdust is frequently mentioned as a source for such manufacturing operations [111,112]. It is a common by-product from wood processing that releases significant amounts of carbon dioxide when burned, exacerbating environmental pollution. Consequently, there has been increasing scientific interest in exploring sawdust in the remediation of water from pollutants, which typically act as a precursor for biochar [112]. However, the study of non-pyrolyzed sawdust as a filtration medium in SSFs is often overlooked or very limited. The initial attempts to review the published works did not provide sufficient details. Therefore, Table 3 highlights a number of studies that specifically utilized non-pyrolyzed sawdust as a substrate for the adsorption of contaminants.
It is pertinent to note here that the investigations summarized in Table 3 did not incorporate sawdust within a sand filtration bed. Some fixed bed filtration set-ups are described in references [60,123,124]. The remaining studies were batch reactions which were typically carried out in idealistic laboratory conditions at a small, bench scale, but were nonetheless beneficial for proof-of-concept work. Although a range of contaminants were investigated in the reviewed studies, a notable gap remains. Specifically, the potential of sawdust as an adsorbent in the SSF process has not been comprehensively and systematically investigated.
Sawdust is mainly comprised cellulose, hemicellulose, and lignin [60,123,125,126]. Some researchers report that the lignin component limits the adsorption surface area of the material [112,126]. To overcome this, several recent studies explored rudimentary chemical and physical treatments of the sawdust material to enhance the porosity, and thus boost the adsorption capacity. Delmond et al. [123], for instance, used a regime of consecutive acid and base treatments of sawdust. Fourier transform infrared (FT-IR) spectroscopy was used to characterize the material after such treatments. The authors reported an increase in surface area from 0.71 m2 g−1 for unmodified to 2.05 m2.g−1 for modified sawdust [123]. Despite this, there was a marginal difference in the adsorption capacity of the antibiotic vancomycin: treated sawdust achieved a maximum capacity of 3.8 mg of vancomycin per gram of sawdust, whereas untreated sawdust could adsorb 4 mg of antibiotic per gram of adsorbent [123]. Earlier work carried out by Tretsiakova-McNally et al. [60] demonstrated comparable increases in the surface areas by treatment of sawdust with aqueous solution of sulfuric acid (0.83 m2 g−1—untreated sawdust, 2.18 m2 g−1 treated sawdust). In the case of meropenem, the removal levels of this antibiotic from distilled water achieved 95.9% [60]. However, the adsorption capacity was not measured in this work [60,120].
Similarities can be drawn between the EPS of the biolayer in an SSF and ligno-cellulosic materials. The aforementioned FT-IR analysis of sawdust revealed prominent spectral bands corresponding to hydrogen-bonded hydroxyl (-OH) groups, C-H stretching in methylene (CH2) groups, and carboxyl (-COOH) groups, indicative of complex carbohydrate structures [123]. Similarly, EPS extracted from a bioreactor seeded with wastewater sludge [127] exhibited analogous functional groups from FT-IR spectral analysis. These groups are pivotal in facilitating the binding of organic contaminants to the adsorbent [117]. Carbohydrate structures, like polysaccharides in EPS and cellulose and hemicellulose in ligno-cellulose, promote the immobilization of contaminants for biodegradation by microorganisms over time [127]. It is worth mentioning that EPS contains amide functional groups in protein structures, which are absent in ligno-cellulosic materials. This protein matrix enables an environment conducive to microbial activity, thus enhancing the interaction between a contaminant and a microbe [117,127]. The potential synergy of the EPS and lignocellulose of waste sawdust remains unclear, as a significant research gap still exists in this area.
Table 3. Outlined sawdust treatments to enhance removal efficiency of selected contaminants.
Sawdust TreatmentContaminants or Indicators MeasuredRemoval EfficiencyReference
Washed, dried, and ground.Heavy metal ions such as Pb2+, Cd2+ and Ni2+25.98–64.32%[128]
Washed and dried.Nitrogen species (NH3-N, NO3-N, and NO2-N)Max. 98% removal[129]
Washed, treated with solutions of citric acid and NaPO2H2, washed and dried.Heavy metals Cr2+, Ni2+, Zn2+, and Cu2+Cr2+ removal 76% for all contact times. Remaining ion removal increased with contact time to max. 75% at 24 h.[130]
Washed, treated with H2SO4 at 60 °C, dried, and ground. Antibiotic meropenem (C17H25N3O5S)Up to 98.6% removed by treated sawdust and up to 92.4% by untreated sawdust.[60]
Treated sequentially with solutions of: H3PO4, H2SO4, KO, H and then distilled H2O. Washed and dried.Antibiotic vancomycin (C66H75Cl2N9O24)63% removal by treated sawdust compared to 15% removal by untreated sawdust. [123]
Treated with NaOH and H2SO4, washed, and dried. Then, chemically modified with FeH6O3 and Al2O3As5+ and FRemoval efficiency was not reported[125]
Abbreviations: Pb, lead; Cd, cadmium; Ni, nickel; NH3-N, ammonia nitrogen; NO3-N, nitrate nitrogen; NO2-N, nitrite nitrogen; NaPO2H2, sodium hypophosphite; Cr, chromium; Ni, nickel; Zn, zinc; Cu, copper; H3PO4, phosphoric acid; KOH, potassium hydroxide; H2O, water; NaOH, sodium hydroxide; H2SO4, sulfuric acid; FeH6O3, ferric hydroxide; Al2O3, activated alumina; As(V), arsenate; F, fluoride.

4.4. Interactions Between PPCPs and the Biological Layer of the SSF

Some of the works appraised in this review challenged SSF reactors to tackle CEC removal. Different mechanisms of micropollutant removal, namely biodegradation and adsorption, are described in a 2015 study of a biofilm reactor [67]. The system contained quartz sand (particle size range 0.210–0.297 mm), on which the biofilm responsible for the biodegradation of the micropollutants was left to mature. The removal levels of diclofenac (a nonsteroidal anti-inflammatory drug, NSAID) and propranolol (a beta-blocker) were found to be 41% and 94%, respectively. The results demonstrated that while diclofenac was not adsorbed by the filter, its reduction could still be attributed to biodegradation. This observation aligns with the compound’s inherent hydrophobicity, as indicated by its higher partition coefficient (pKOW) of 4.51 compared to propranolol (pKOW = 3.48). A higher pKOW reflects lower water solubility, which means diclofenac is less likely to dissolve in water and more prone to partition into organic phases, like biofilms, where microbial degradation can take place. The researchers concluded that while both compounds underwent biodegradation, diclofenac was degraded to a lesser extent due to its lower hydrophobicity. While the study made optimistic claims about the capacity of the biofilm to remove micropollutants, it employed unrealistic wastewater conditions and thus, caution must be used when comparing studies on a like-for-like basis. A more recent study expanded on this research by applying the experimental method to actual wastewater conditions [76]. Pollutants examined in this instance were diclofenac, benzotriazole, carbamazepine, and sulfamethoxazole, and were spiked in simulated wastewater at 100 µg/L concentration. Here, plant root extracts (exudates) were investigated for their role in the removal of CECs by incorporating artificial exudates into sand columns with synthetic and real wastewater conditions. No significant effect was seen by the exudate additions at more realistic levels of the contaminants [76]. It was accepted that nutrients in the wastewater obstructed exudate action at the trace concentration level, known as the matrix effect. This research highlights the critical need to test alternative technologies, like novel wastewater treatments, under realistic, real-world conditions, such as using actual wastewater. This approach ensures that the results reflect the complexities and challenges of practical applications.
The effects of micropollutants on the biological layer of the slow sand filter is an often-overlooked area, as absent from the appraised literature. One publication which was previously discussed [95] investigated the removal of commonly used PPCPs (DEET, paracetamol, caffeine, and triclosan) through treatment with a GAC-sandwich filter. A follow-up of this work published by Li et al. the following year focused on the biological layer and what effects the PPCPs had on the community of microorganisms [131]. A shift in the composition of two microbiological phyla within the biolayer was observed when exposed to PPCP-containing influent. These alterations appear to result from the toxicity of micropollutants; however, they cannot be conclusively linked to the direct influence of PPCPs themselves or competitive interactions between different microbial species [131]. It is crucial to consider the impact of contaminated water on the biological components of the filter, as certain water types may necessitate pre-treatment before applying a slow sand filter. This precaution ensures the filter’s effectiveness and longevity, adapting its function to the specific contaminants present in the water. This is further supported by the toxicity of PPCPs observed in suppressed biofilm growth in the 2012 investigations by Onesios and Bouwer [132]. The biosand filter in this instance was subjected to a combination of 14 different PPCPs, and the effects of sodium acetate (CH3COONa) as a primary substrate ‘feed’ for the biofilm were examined, like the works of Zhang [57] also reviewed. Alterations in the composition of the microbial community were observed, aligning with the findings of Li et al. [131]. Their study suggests that exposure of biofilms to micropollutants—potentially toxic compounds—impedes microbial growth, highlighting the detrimental effects of these pollutants on ecosystem health. Conflicting results were reported; however, in 2017 a publication by Pompei et al. [133], a high removal of contaminants was observed, accompanied by an unexpected increase in the richness of certain microbial communities. Here, six pharmaceuticals were applied to a biofilter containing algae and cyanobacteria and this increase is hypothesized to result from the PPCPs being a source of carbon “feeding” the filter. However, a control filter, without PPCPs, also demonstrated a similar increase in biomass, raising the question of the true impact the PPCPs had on the success of the biological layer. Despite this, these results were replicated some years later following the investigation of the same reactors [134], and it was evident one species was more tolerant to the micropollutant concentration tested (2 µg∙L−1). There is still much to be said for the promotion of growth and diversity of the biofilm from the organic materials contained within the influent. This suggests that the carbon source within the filter may play a crucial role not only in contaminant degradation but also in enhancing or diminishing microbiodiversity, which could have implications for the overall effectiveness and sustainability of the filtration system.
The diversity of algal and bacterial communities within the biofilm of a filtration system may serve as biomarkers for specific pharmaceuticals and trace organic pollutants in the influent waters [135]. Building on this concept, computational models could be powerful tools for predicting the diverse and complex interactions between biofilms and PPCP. This was explored by a 2017 study [136] where a biofilm was cultivated in varying conditions of velocity flow (static to high velocity) and sediment particle sizes (0.02–0.2 mm). A model was proposed given the experimental results and simulated and the measured conditions compared were ‘reasonably’ accurate [136]. However, this study utilized a rotating shaft reactor design in a closed environment, and the experimental assessment was limited to the hydrodynamic conditions which alone cannot be used to predict the effects of PPCPs on biofilm growth. For a more complete prediction of the contaminant–biofilm interaction, chemical and biological models should be cross-analyzed with macrodispersitive models. The interactions of the diverse trace organic pollutant pharmaceuticals such as ibuprofen, carbamazepine, and trimethoprim were analyzed in a 2013 study [137] of membrane fouling (like clogging in SSF). While the study compared forward osmosis and reverse osmosis, two membrane water treatment technologies distinct from SSF, it still revealed similarities in how these compounds impact biofilm growth. For instance, biofilm-fouled membranes showed the high removal of positively and neutrally charged trace contaminants, with neutral compounds rejected more than positive ones when compared to a clean membrane. Conversely, negatively charged compounds like ibuprofen showed lower membrane rejection rates, likely due to their nonpolar nature limiting interaction with the ionizable functional groups of the membrane and biofilm’s EPS which is also negatively charged [137]. This non-linear response of EPS and contaminant is further demonstrated in another study published in 2013, which analyzed the interactions between microbes in a sand column with metal ions (Zinc; Zn2+) [138]. While [137] analyses transport mechanisms in membrane systems, [138] explores the adsorption and stability of the biofilm in a porous media bed. Briefly, low Zn2+ concentrations had limited effects, whereas the production of the EPS was stimulated with intermediate Zn2+ concentrations but inhibited at high concentrations. Given the diverse perspectives each of the three papers presented [136,137,138], a model could potentially be developed composed of sub-models exploring the adsorption, transport, and toxicity in a sand filter with a biofilm. As toxicokinetics (dynamics between contaminants and biolayer) are not uniform throughout the microbial community as suggested earlier by [95,132,133,134], further research is required to clarify these relationships and assess biofilm health under contaminant exposure.

4.5. Summary of Engineering Observations

Key considerations for the design of slow sand filters were outlined in this review. Filter bed material, depth, effective particle size (D10), and coefficient of uniformity (CU) were established as crucial parameters on which HRT, removal efficiency, and maintenance depended. The literature appraised in this review found that experimental filter studies tend towards a filter bed ~0.5 m in height, with an effective particle size between 0.20 mm and 0.55 mm and an average CU of 2.5, with a wide range of water reuse applications. The review confirmed the testing had different operation modes and treatment settings, and, subsequently, varying performances. This review recommends a filter with the following working design parameters:
  • A bed depth of >0.6 m
  • A particle effective size (D10) between 0.15 and 0.40 mm
  • A coefficient of uniformity ≤ 2
  • The sand must have a high silica content.
These values are based on studies which successfully implemented SSF to remediate water to the appropriate quality standards (e.g., <1 NTU) and are concordant with the recommendations from other works including [2,64,80,83].
Since D60 represents a higher percentile of the particle size distribution than D10, it must always be greater than or equal to D10 ( D 10     D 60 ). Given Equation (1) below, a CU of one signifies that D60 and D10 are equal (indicative of an extremely uniform sample). Therefore, effective design limits are 1 ≤ CU ≤ 2.0. D10 optimal recommendations were found to be between 0.15 and 0.40 mm. Using the inequality 1 ≤ CU ≤ 2.0 and Equation (1), the effective limits for D60 are calculated as follows:
  • Lower bound for D60
    a.
    When D10 = 0.15 mm, and CU = 1, D60 = 0.15 mm.
    b.
    When D10 = 0.40 mm, and CU = 1, D60 = 0.40 mm.
  • Upper bound for D60
    a.
    When D10 = 0.15 mm, and CU = 2.0, D60 = 0.30 mm.
    b.
    When D10 = 0.40 mm, and CU = 2.0, D60 = 0.80 mm.
Thus, it is recommended that the effective theoretical ranges for D10 are 0.15   mm   D 10     0.40   mm and D60, 0.15   mm   D 60     0.80   mm .
It is also recognized that a greater bed depth and finer particle size are widely acknowledged to significantly enhance water remediation efficiency. Recommendations given in this review are grounded in rigorously appraised published studies, encompassing both laboratory-scale and large-scale, and real-world applications. However, ultimately, a reactor should be optimized based on the intended use or destiny of the effluent as a function of cost, space, and capability to upkeep the SSF. These values are based on the assessment of studies published in the last decade, though it should be noted some of the infrastructure analyzed in the manuscripts included in this appraisal were designed prior to this time frame, such as [139,140].
Comparable reviews previously published [2,66,69,77,80,103] made related recommendations and observations. For instance, characteristics of filtration media were recommended effective sizes in the interval of 0.15–0.45 mm [103], 0.17–3.80 mm [69], and 0.15–0.40 mm [80]. This validates the findings of the current review (D10 in the range 0.20–0.40 mm). Furthermore, a CU of ≤2.0 was identified as ideal for optimal flow and contaminant removal. In other reviews, this parameter was identified to be 1.35–2.35 [69], <2 [66], <3 [80], or “ideally” 1 [2], indicating a good agreement with published works. The depth of the filter bed was additionally discussed in three of the six review articles appraised. The authors of [103] recommended a depth between 0.8 and 1.2 m, supported by a gravel layer between 0.3 and 0.6 m. The review by Abdiyev [66] observed a minimum depth of 0.2 m but recommended 0.6 m for effective virus removal. This is contrary to Irish guidelines [64], which propose a greater minimum of 0.6 m, but a 0.9 m working depth. The discrepancy may be explained by the Irish EPA design manual [64] accounting for maintenance practices, which involve removing the top layer of the filter bed when the critical operational head loss is reached. However, significant contaminant removal rates have been achieved with bed depths of less than 0.6 m. Therefore, based on the findings from the reviewed publications, a minimum recommended bed depth of 0.6 m is suggested.
Additional recommendations from the evaluated reviews include enhancing contaminant removal by incorporating adsorbents such as biochar or activated carbon [66], and avoiding the treatment of water with high mineral clay content due to the increased risk of clogging [80]. The 2024 review by Welz [2] advised against the application of biological sand filters for the removal of recalcitrant compounds through straining, as this could lead to irreversible clogging. Bioremediation offers a potential solution to this restriction, wherein microbiological processes within the biolayer actively metabolize micropollutants, thereby maintaining the permeability of the filter and allowing continued water flow [141,142]. Alternatively, replacing the top layer of the filter bed with a more sustainable material, such as lignocellulose, which has post-exhaustion properties (e.g., energy release through pyrolysis), could be considered. Going forward this will be the work that the authors plan to explore.

5. Conclusions

This review garnered valuable data on a small niche of research: slow sand filtration utilizing alternative sustainable adsorbent layers with the potential to bioremediate water of CECs. SSFs can play a crucial role in addressing the challenges of wastewater treatment by providing an effective and sustainable method for removing contaminants from water. Their ability to filter out pathogens and particulates makes them a viable option for enhancing water quality, especially in regions with inadequate infrastructure. Additionally, SSFs require minimal energy and maintenance, making them particularly suitable for emerging economies facing resource constraints. Implementing SSFs could complement existing legislative efforts to improve water safety and reduce environmental impacts. Deficiencies in the current understanding were explored, including but not limited to the combined effects of bed depth, effective particle size, and size uniformity, as well as the optimal placement of alternative adsorbent materials. Intersectional research of these parameters with alternative filter media, such as lignocellulosic materials, and exposing the test reactor to more realistic conditions (real vs. simulated wastewater, environmental temperatures) will advance the field of research and contribute to the progression of SDGs.
This work aimed to define the crucial characteristics making up the design of an SSF reactor, to explore the role of novel lignocellulosic adsorbents in the removal of contaminants including CECs, and the best practices for operation and maintenance. From the appraised literature and systematic review of critical 35 works published in the past decade, the following conclusions can be made:
  • Optimal SSF design parameters for efficient contaminants removal include:
    a.
    a filter bed depth of at least 0.6 m;
    b.
    a filtration medium with recommended particle sizes in the range of 0.15–0.40 mm;
    c.
    a highly uniform filtration medium with a coefficient of uniformity < 2 is recommended.
  • The selection of sand material (such as high silica (SiO2) content or quartz) is influential as biofilm adhesion, particle size, and friability may be impacted.
  • A harmonious approach to reporting particle sizes, filtration rates, hydraulic retention/residence times, and performance indicators (i.e., removal rates) is not currently used in experimental work on SSF. A robust standard method of particle size characterization, highlighting effective size D10, is especially needed as well as the media coefficients of uniformity.
  • The analysis of the studies using alternative filter media demonstrated the potential of lignocellulosic adsorbents for the removal of some common water contaminants as well as CECs such as antibiotics.
  • The dimensions of the SSF are at the discretion of its application. Household continuous or intermittently run filters are more compact units; thus, supernatant head height is smaller to accommodate oxygen incorporation to promote biofilm growth during pause periods. Larger filters, typical of continuously run SSFs, have greater supernatant depths as the biological layer is putatively stimulated more and is thus more active.
  • The impact of contaminants such as PPCPs on biofilm growth varied widely across studies, highlighting the need for further research under environmentally relevant conditions (i.e., realistic influent quality characteristics) to assess long-term effects and explore mitigation strategies.
  • The adsorbent materials such as AC and biochar have previously demonstrated high PPCP removal rates from water. Published works investigating novel lignocellulosic adsorbents were analyzed in this review and, considering the lower carbon footprint in the manufacture of such materials, their capacity to replace AC is promising.
A future multi-faceted investigation is planned to address the outlined knowledge gaps mentioned above. This review paves the way for this future work, as it will inform the design aspects of the study. Several aspects of the reviewed publications will be incorporated into the slow sand filtration reactor, which will test the capability of sawdust to remove ECs.

Supplementary Materials

The following supporting information can be downloaded at: https://www.mdpi.com/article/10.3390/su162310595/s1, Table S1.

Author Contributions

H.C.: collected, reviewed, and analyzed the data. B.S.: developed concept, contributed to the writing and review of the paper. S.T.-M.: developed concept, contributed to the writing and review of the paper. P.F.-I.: developed concept, contributed to the writing and review of the paper. R.M.: reviewed the paper. All authors have read and agreed to the published version of the manuscript.

Funding

This research received no external funding.

Institutional Review Board Statement

Not applicable.

Data Availability Statement

The original contributions presented in this study are included in the article and Supplementary Material. Further inquiries can be directed to the corresponding author.

Acknowledgments

The authors are grateful for technical data supplied by Northern Ireland Water Information Unit regarding material characteristics. Hayley Corbett wishes to express gratitude to the Department for the Economy scholarship enabling this research.

Conflicts of Interest

The authors declare no conflicts of interest.

Abbreviations

ACactivated carbon
AMRAntimicrobial resistance
CAWSTCenter for Affordable Water and Sanitation Technology
CECcontaminant of emerging concerns
cmcentimeters
cm∙h−1Centimeters per hour
CSOcombines sewer overflow
CUCo-efficient of uniformity (D60/D10)
D10Effective size (mm)
DEETdiethyltoluamide
ECEuropean Commission
EDCendocrine-disrupting chemicals
EPAEnvironmental Protection Agency
EPSExopolymeric substance
EQSenvironmental quality standard
GACgranular activated carbon
HLRhydraulic loading rate
HRThydraulic retention time
LLiters
m∙h−1Meters per hour
µg∙L−1Micrograms per liter
mL∙min−1Milliliters per minute
NSAIDnon-steroidal anti-inflammatory drug
NTUnephelometric turbidity units
PACpowdered activated carbon
PBDEpolybrominated diphenyl ether
pKOWpartition coefficient (measure of the hydrophobicity of a substance)
PNECpredicted no-effect concentration
POUpoint-of-use
PPCPpharmaceuticals and personal care products
RMsand removal method
SAsurface agitation method
SDstandard deviation
SDGsustainable development goal
SMstirring method
SSFslow sand filtration
TPtotal phosphorus
UNUnited Nations
uPBTubiquitous, persistent, bioaccumulative, toxic
V∙cm−1Volts per centimeter
WaSHwater supply, sanitation, and hygiene
WFDWater Framework Directive

References

  1. Nasser Fava, N.D.M.; Terin, U.C.; Freitas, B.L.S.; Sabogal-Paz, L.P.; Fernandez-Ibañez, P.; Anthony Byrne, J. Household Slow Sand Filters in Continuous and Intermittent Flows and their Efficiency in Microorganism’s removal from River Water. Environ. Technol. 2022, 43, 1583–1592. [Google Scholar] [CrossRef] [PubMed]
  2. Welz, P.J. Biosand Reactors for Municipal and Industrial Wastewater Treatment: Status Quo, Challenges and Opportunities. Processes 2024, 12, 641. [Google Scholar] [CrossRef]
  3. Ellis, K.V. Slow sand filtration as a technique for the tertiary treatment of municipal sewages. Water Res. 1987, 21, 403–410. [Google Scholar] [CrossRef]
  4. Duckett, D.; Troldborg, M.; Hendry, S.; Cousin, H. Making waves: Promoting municipal water reuse without a prevailing scarcity driver. Water Res. 2024, 249, 120965. [Google Scholar] [CrossRef]
  5. Regulation (EU) 2020/741 of the European Parliament and of the Council of 25 May 2020 on Minimum Requirements for Water Reuse (Text with EEA Relevance). 2020. Available online: http://data.europa.eu/eli/reg/2020/741/oj (accessed on 4 June 2024).
  6. González, O.; Bayarri, B.; Aceña, J.; Pérez, S.; Barceló, D. Treatment Technologies for Wastewater Reuse: Fate of Contaminants of Emerging Concern. In Advanced Treatment Technologies for Urban Wastewater Reuse; Fatta-Kassinos, D., Dionysiou, D.D., Kümmerer, K., Eds.; Springer International Publishing: Cham, Switzerland, 2016; pp. 5–37. [Google Scholar] [CrossRef]
  7. Jones, E.R.; van Vliet, M.T.H.; Qadir, M.; Bierkens, M.F.P. Country-level and gridded estimates of wastewater production, collection, treatment and reuse. Earth Syst. Sci. Data 2021, 13, 237–245. Available online: https://api.semanticscholar.org/CorpusID:233882995 (accessed on 2 July 2024). [CrossRef]
  8. European Environment Agency. European Waters—Assessment of Status and Pressures 2018; Publications Office of the European Union: Luxembourg, 2018. [Google Scholar] [CrossRef]
  9. Afful, S.; Awudza, J.A.M.; Twumasi, S.K.; Osae, S. Determination of indicator polychlorinated biphenyls (PCBs) by gas chromatography–electron capture detector. Chemosphere 2013, 93, 1556–1560. [Google Scholar] [CrossRef]
  10. Wu, Z.; He, C.; Han, W.; Song, J.; Li, H.; Zhang, Y.; Jing, X.; Wu, W. Exposure pathways, levels and toxicity of polybrominated diphenyl ethers in humans: A review. Environ. Res. 2020, 187, 109531. [Google Scholar] [CrossRef] [PubMed]
  11. Budeli, P.; Ekwanzala, M.D.; Unuofin, J.O.; Momba, M.N.B. Endocrine disruptive estrogens in wastewater: Revisiting bacterial degradation and zymoremediation. Environ. Technol. Innov. 2021, 21, 101248. [Google Scholar] [CrossRef]
  12. Elskens, M.; Van Langenhove, K.; Carbonnel, V.; Brion, N.; Eisenreich, S.J. Dynamics of estrogenic activity in an urban river receiving wastewater effluents: Effect-based measurements with CALUX. Water Emerg. Contam. Nanoplastics 2023, 2, 9. [Google Scholar] [CrossRef]
  13. Ciccarelli, D.; Samanipour, S.; Rapp-Wright, H.; Bieber, S.; Letzel, T.; O’brien, J.W.; Marczylo, T.; Gant, T.W.; Vineis, P.; Barron, L.P. Bridging knowledge gaps in human chemical exposure via drinking water with non-target screening. Crit. Rev. Environ. Sci. Technol. 2024, 1–25, ahead-of-print. [Google Scholar] [CrossRef]
  14. Yadav, R.K.; Sahoo, S.; Yadav, A.K.; Patil, S.A. Green wall system coupled with slow sand filtration for efficient greywater management at households. NPJ Clean Water 2023, 6, 73. [Google Scholar] [CrossRef]
  15. Rapp-Wright, H.; Regan, F.; White, B.; Barron, L.P. A year-long study of the occurrence and risk of over 140 contaminants of emerging concern in wastewater influent, effluent and receiving waters in the Republic of Ireland. Sci. Total Environ. 2023, 860, 160379. [Google Scholar] [CrossRef] [PubMed]
  16. European Commission. Watch List of Substances for Union-Wide Monitoring in the Field of Water Policy (EU 2020/1161). 2020, pp. 32–35. Available online: http://data.europa.eu/eli/dec_impl/2020/1161/oj (accessed on 24 September 2024).
  17. Gomez Cortes, L.; Marinov, D.; Sanseverino, I.; Navarro, C.A.; Niegowska, C.M.; Porcel, R.E.; Stefanelli, F.; Lettieri, T. Selection of Substances for the 4th Watch List Under the Water Framework Directive; Publications Office of the European Union: Luxembourg, 2020. [Google Scholar]
  18. Lettieri, T.; Napierska, D.; Loos, R.; Marinov, D.; Sanseverino, I. Review of the 1st Watch List under the Water Framework Directive and Recommendations for the 2nd Watch List; Publications Office of the European Union: Luxembourg, 2018. [Google Scholar]
  19. European Communities. Establishing a Framework for Community Action in the Field of Water Policy. 2000, pp. 1–72. Available online: http://data.europa.eu/eli/dir/2000/60/2014-11-20 (accessed on 22 October 2023).
  20. Jones, E.R.; Bierkens, M.F.P.; Wanders, N.; Sutanudjaja, E.H.; van Beek, L.P.H.; van Vliet, M.T.H. Current wastewater treatment targets are insufficient to protect surface water quality. Commun. Earth Environ. 2022, 3, 221. [Google Scholar] [CrossRef]
  21. Gong, H.; Hu, J.; Rui, X.; Wang, Y.; Zhu, N. Drivers of change behind the spatial distribution and fate of typical trace organic pollutants in fresh waste leachate across China. Water Res. 2024, 263, 122170. [Google Scholar] [CrossRef] [PubMed]
  22. Council of the European Union. Council Directive 1999/31/EC of 26 April 1999 on the Landfill of Waste. 1999, pp. 1–19. Available online: http://data.europa.eu/eli/dir/1999/31/2024-08-04 (accessed on 9 November 2024).
  23. Gao, J.; Oloibiri, V.; Chys, M.; Audenaert, W.; Decostere, B.; He, Y.; Van Langenhove, H.; Demeestere, K.; Van Hulle, S.W.H. The present status of landfill leachate treatment and its development trend from a technological point of view. Rev. Environ. Sci. Bio/Technol. 2015, 14, 93–122. [Google Scholar] [CrossRef]
  24. Jamrah, A.; AL-Zghoul, T.M.; Al-Qodah, Z. An Extensive Analysis of Combined Processes for Landfill Leachate Treatment. Water 2024, 16, 1640. [Google Scholar] [CrossRef]
  25. Yadav, D.; Rangabhashiyam, S.; Verma, P.; Singh, P.; Devi, P.; Kumar, P.; Hussain, C.M.; Gaurav, G.K.; Kumar, K.S. Environmental and health impacts of contaminants of emerging concerns: Recent treatment challenges and approaches. Chemosphere 2021, 272, 129492. [Google Scholar] [CrossRef] [PubMed]
  26. Mendonça, J.M.D.S.; Navoni, J.A.; de Medeiros, G.F.; Mina, I.M.C.A.P. Ecotoxicological assessment of estuarine surface waters receiving treated and untreated sanitary wastewater. Environ. Monit. Assess. 2022, 194, 908. [Google Scholar] [CrossRef] [PubMed]
  27. Woodward, J.; Li, J.; Rothwell, J.; Hurley, R. Acute riverine microplastic contamination due to avoidable releases of untreated wastewater. Nat. Sustain. 2021, 4, 793–802. [Google Scholar] [CrossRef]
  28. Powley, H.R.; Dürr, H.H.; Lima, A.T.; Krom, M.D.; Van Cappellen, P. Direct Discharges of Domestic Wastewater are a Major Source of Phosphorus and Nitrogen to the Mediterranean Sea. Environ. Sci. Technol. 2016, 50, 8722–8730. [Google Scholar] [CrossRef] [PubMed]
  29. Directive 2000/60/EC of the European Parliament and of the Council of 23 October 2000 Establishing a Framework for Community Action in the Field of Water Policy. Off. J. 2000, 43, 1–83. Available online: https://eur-lex.europa.eu/legal-content/EN/TXT/?uri=CELEX%3A02000L0060-20141120#tocId101 (accessed on 5 December 2023).
  30. Cooper, R.J.; Hiscock, K.M. Two decades of the EU Water Framework Directive: Evidence of success and failure from a lowland arable catchment (River Wensum, UK). Sci. Total. Environ. 2023, 869, 161837. [Google Scholar] [CrossRef]
  31. Northern Ireland Environment Agency (NIEA); Department of Agriculture, Environment and Rural Affairs (DAERA). Water Framework Directive Statistics Report 2021 February 2023. Available online: https://www.daera-ni.gov.uk/articles/water-framework-directive-statistics (accessed on 15 January 2024).
  32. European Commission. Proposal for a Directive of the European Parliament and of the Council Amending Directive 2000/60/EC Establishing a Framework for Community Action in the Field of Water Policy, Directive 2006/118/EC on the Protection of Groundwater Against Pollution and Deterioration and Directive 2008/105/EC on Environmental Quality Standards in the Field of Water Policy; European Commission: Brussels, Belgium, 26 October 2022. [Google Scholar]
  33. Kaiser, R.A.; Taing, L.; Bhatia, H. Antimicrobial Resistance and Environmental Health: A Water Stewardship Framework for Global and National Action. Antibiotics 2022, 11, 63. [Google Scholar] [CrossRef] [PubMed]
  34. Naddaf, M. 40 million deaths by 2050: Toll of drug-resistant infections to rise by 70%. Nature 2024, 633, 747–748. [Google Scholar] [CrossRef]
  35. European Environment Agency. Water Resources Across Europe—Confronting Water Stress: An Updated Assessment; Publications Office of the European Union: Luxembourg, 2021. [Google Scholar] [CrossRef]
  36. United Nations Department of Economic and Social Affairs (UN DESA). The Sustainable Development Goals Report 2016; UN DESA: New York, NY, USA, July 2016; Available online: https://desapublications.un.org/publications/sustainable-development-goals-report-2016 (accessed on 8 December 2023).
  37. Kummu, M.; Guillaume, J.H.A.; de Moel, H.; Eisner, S.; Flörke, M.; Porkka, M.; Siebert, S.; Veldkamp, T.I.E.; Ward, P.J. The world’s road to water scarcity: Shortage and stress in the 20th century and pathways towards sustainability. Sci. Rep. 2016, 6, 38495. [Google Scholar] [CrossRef]
  38. Koncagül, E.; Tran, M.; Connor, R. The United Nations World Water Development Report 2021: Valuing Water; Facts and Figures; UNESCO: Paris, France, 2021; Available online: https://unesdoc.unesco.org/ark:/48223/pf0000375751 (accessed on 9 March 2024).
  39. UNESCO World Water Assessment Programme. The United Nations World Water Development Report 2021—Valuing Water; United Nations Educational, Scientific and Cultural Organization: Paris, France, 2021. [Google Scholar]
  40. UNICEF. Why We Must Act Now to Overcome the Global Water Crisis. Available online: https://www.unicef.org/wash/water-scarcity (accessed on 19 September 2024).
  41. Kuzma, S.; Bierkens, M.F.; Lakshman, S.; Luo, T.; Saccoccia, L.; Sutanudjaja, E.H.; Van Beek, R. Aqueduct 4.0: Updated Decision-Relevant Global Water Risk Indicators; Technical note; World Resources Institute: Washington, DC, USA. [CrossRef]
  42. Elmahdi, A.; Jeong, J. From Debt to Sustainability: Advancing Wastewater Projects in Developing Countries through Innovative Financing Mechanisms—The Role of Debt-for-Climate Swaps. Climate 2024, 12, 122. [Google Scholar] [CrossRef]
  43. Otoo, M.; Drechsel, P.; Hanjra, M.A. Section IV—Wastewater for Agriculture, Forestry and Aquaculture; Drechsel, P., Hanjra, M.A., Eds.; Taylor and Francis Ltd., London, UK. 2018. Available online: https://www.iwmi.cgiar.org/Publications/Books/PDF/resource_recovery_from_waste-section-IV.pdf (accessed on 26 May 2024).
  44. World Water Assessment Programme (United Nations). Wastewater: The Untapped Resource: The United Nations World Water Development Report.; United Nations Educational, Scientific and Cultural Organization: Paris, France, 2017. [Google Scholar]
  45. Maffettone, R.; Gawlik, B.M. Technical Guidance Water Reuse Risk Management for Agricultural Irrigation Schemes in Europe; Publications Office of the European Union: Luxembourg, 2022. [Google Scholar] [CrossRef]
  46. United Nations—Water. The Sustainable Development Goal 6 Global Acceleration Framework. 2020. Available online: https://www.unwater.org/sites/default/files/app/uploads/2020/07/Global-Acceleration-Framework.pdf (accessed on 15 January 2024).
  47. Transforming Our World: The 2030 Agenda for Sustainable Development Transforming our world: The 2030 Agenda for Sustainable Development. 2015. Available online: https://digitallibrary.un.org/record/3923923?v=pdf (accessed on 18 September 2024).
  48. Brady, J.; Gray, N.F. Reform of the Irish water sector: Opportunities and challenges. Proc. Inst. Civ. Eng. Water Manag. 2017, 170, 165–174. [Google Scholar] [CrossRef]
  49. European Environment Agency (EEA). Waterbase—UWWTD: Urban Waste Water Treatment Directive—Reported Data. January 2023. Available online: https://www.eea.europa.eu/en/datahub/datahubitem-view/6244937d-1c2c-47f5-bdf1-33ca01ff1715 (accessed on 12 March 2024).
  50. Giakoumis, T.; Voulvoulis, N. Combined sewer overflows: Relating event duration monitoring data to wastewater systems’ capacity in England. Environ. Sci. Water Res. Technol. 2023, 9, 707–722. [Google Scholar] [CrossRef]
  51. Lamon, A.W.; Maciel, P.M.F.; Campos, J.R.; Corbi, J.J.; Dunlop, P.S.M.; Fernandez-Ibañez, P.; Byrne, J.A.; Sabogal-Paz, L.P. Household slow sand filter efficiency with schmutzdecke evaluation by microsensors. Environ. Technol. 2022, 43, 4042–4053. [Google Scholar] [CrossRef] [PubMed]
  52. Patel, A.; Arkatkar, A.; Singh, S.; Rabbani, A.; Medina, J.D.S.; Ong, E.S.; Habashy, M.M.; Jadhav, D.A.; Rene, E.R.; Mungray, A.K. Physico-chemical and biological treatment strategies for converting municipal wastewater and its residue to resources. Chemosphere 2021, 282, 130881. [Google Scholar] [CrossRef] [PubMed]
  53. King-Nyamador, G.; Amoatey, P.K.; Amoah, S.; Adu-Ampong, B. Optimal bed thickness and effective size for improving wastewater quality for irrigation. Int. J. Energy Environ. Eng. 2021, 12, 175–190. [Google Scholar] [CrossRef]
  54. Letshwenyo, M.W.; Lebogang, L. Assessment of roughing and slow sand filter modified with slag and clinker ash for removal of microorganisms from secondary effluent. Environ. Technol. 2020, 41, 3004–3015. [Google Scholar] [CrossRef]
  55. Oki, L.R.; Bodaghi, S.; Lee, E.; Haver, D.; Pitton, B.; Nackley, L.; Mathews, D.M. Elimination of Tobacco mosaic virus from irrigation runoff using slow sand filtration. Sci. Hortic. 2017, 217, 107–113. [Google Scholar] [CrossRef]
  56. Suleiman, M.; Schröder, C.; Kuhn, M.; Simon, A.; Stahl, A.; Frerichs, H.; Antranikian, G. Microbial biofilm formation and degradation of octocrylene, a UV absorber found in sunscreen. Commun. Biol. 2019, 2, 430. [Google Scholar] [CrossRef]
  57. Zhang, L.; Carvalho, P.N.; Bollmann, U.E.; EI-taliawy, H.; Brix, H.; Bester, K. Enhanced removal of pharmaceuticals in a biofilter: Effects of manipulating co-degradation by carbon feeding. Chemosphere 2019, 236, 124303. [Google Scholar] [CrossRef] [PubMed]
  58. Cornelissen, E.R.; Harmsen, D.J.H.; Blankert, B.; Wessels, L.P.; van der Meer, W.G.J. Effect of minimal pre-treatment on reverse osmosis using surface water as a source. Desalination 2021, 509, 115056. [Google Scholar] [CrossRef]
  59. Heinonen-Tanski, H.; Juntunen, P.; Rajala, R.; Haume, E.; Niemelä, A. Costs of tertiary treatment of municipal wastewater by rapid sand filter with coagulants and UV. Water Sci. Technol.: Water Supply 2003, 3, 145–152. [Google Scholar] [CrossRef]
  60. Tretsiakova-McNally, S.; Solan, B.; Currie, R.; Akinsanmi, O.; Arnscheidt, J.; McDermott, R.; Coleman, H.M. A ligno-cellulosic bio-adsorbent derived from sawdust waste for the removal of meropenem antibiotic dissolved in water. In Proceedings of the European Waste Water Management Conference, Birmingham, UK, 29 January 2019; Available online: http://ewwmconference.com/ (accessed on 15 January 2024).
  61. Heidarinejad, Z.; Dehghani, M.H.; Heidari, M.; Javedan, G.; Ali, I.; Sillanpää, M. Methods for preparation and activation of activated carbon: A review. Environ. Chem. Lett. 2020, 18, 393–415. [Google Scholar] [CrossRef]
  62. Adin, A. Slow granular filtration for water reuse. Water Sci. Technol. Water Supply 2003, 3, 123–130. [Google Scholar] [CrossRef]
  63. Casas, M.E.; Bester, K. Can those organic micro-pollutants that are recalcitrant in activated sludge treatment be removed from wastewater by biofilm reactors (slow sand filters)? Sci. Total Environ. 2015, 506–507, 315–322. [Google Scholar] [CrossRef] [PubMed]
  64. Higgins, K.; McBratney, D.; Ní Eidhin, C.; Page, D.; Minihan, M.; Campbell, R.; Fitzgerald, J.; Doris, B.; MacDonald, B.; Gallagher, J.; et al. Water Treatment Manual: Filtration. December 2020. Available online: www.epa.ie (accessed on 16 February 2024).
  65. Page, M.; Moher, D.; Bossuyt, P.; Boutron, I.; Hoffmann, T.; Mulrow, C.; Shamseer, L.; Tetzlaff, J.; Akl, E.; Brennan, S.E.; Chou, R. Supplementary Material to: PRISMA 2020 Explanation and Elaboration: Updated Guidance and Exemplars for Reporting Systematic Reviews. 2021. Available online: https://www.bmj.com/content/372/bmj.n160 (accessed on 26 May 2024).
  66. Abdiyev, K.; Azat, S.; Kuldeyev, E.; Ybyraiymkul, D.; Kabdrakhmanova, S.; Berndtsson, R.; Khalkhabai, B.; Kabdrakhmanova, A.; Sultakhan, S. Review of Slow Sand Filtration for Raw Water Treatment with Potential Application in Less-Developed Countries. Water 2023, 15, 2007. [Google Scholar] [CrossRef]
  67. Al-Herrawy, A.Z.; Gad, M.A. Assessment of two different drinking water treatment plants for the removal of free-living amoebae, Egypt. Iran. J. Parasitol. 2017, 12, 413–422. Available online: https://www.scopus.com/inward/record.uri?eid=2-s2.0-85029773359&partnerID=40&md5=3f6269b0b8eb8ebc3c2d442e43756e17 (accessed on 16 May 2024). [PubMed]
  68. Haaken, D.; Schmalz, V.; Dittmar, T.; Worch, E.; Stolte, S. Modification of slow sand filtration of secondary effluents by electric fields: Electrokinetics and influence factors. AQUA Water Infrastruct. Ecosyst. Soc. 2022, 71, 697–708. [Google Scholar] [CrossRef]
  69. Jaeel, A.J.; Abdulkathum, S. Sustainable pollutants removal from wastewater using sand filter: A review. In Proceedings of the International Conference on Advances in Sustainable Engineering and Applications, ICASEA 2018—Proceedings, Wasit, Iraq, 14–15 March 2018; pp. 179–183. [Google Scholar] [CrossRef]
  70. Maurya, A.; Singh, M.K.; Kumar, S. Biofiltration technique for removal of waterborne pathogens. In Waterborne Pathogens: Detection and Treatment; Butterworth-Heinemann: Hyderabad, India. 2020; pp. 123–141. [Google Scholar] [CrossRef]
  71. Fitriani, N.; Mohamed, R.M.S.R.; Affandi, M.; Nurdin, R.R.; Kurniawan, S.B. Performance of Intermittent Slow Sand Filter Processing Units in Treating Food Court Wastewater. J. Ecol. Eng. 2023, 24, 117–139. [Google Scholar] [CrossRef]
  72. Ni’matuzahroh, N.; Fitriani, N.; Nuswantara, E.N.; Affandi, M.; Prasongsuk, S.; Kurniawan, S.B. Isolation and Characterization of Schmutzdecke in Slow Sand Filter for Treating Domestic Wastewater. J. Ecol. Eng. 2022, 23, 76–88. [Google Scholar] [CrossRef]
  73. Fitriani, N.; Theresia, L.; O’Marga, T.T.N.; Kurniawan, S.B.; Supriyanto, A.; Abdullah, S.R.S.; Rietveld, L.C. Performance of a modified and intermittently operated slow sand filter with two different mediums in removing turbidity, ammonia, and phosphate with varying acclimatization periods. Heliyon 2023, 9, e22577. [Google Scholar] [CrossRef]
  74. Fitriani, N.; Ni’matuzahroh, N.; O’marga, T.T.N.; Mohamed, R.M.S.R.; Wahyudianto, F.E.; Imron, M.F.; Isnadina, D.R.M.; Soedjono, E.S. Optimization of Slow Sand Filtration for the Raw Municipal Wastewater Treatment by Using the Blood Cockle (Anadara granosa) Shell as an Alternative Filter Media through the Response Surface Methodology. J. Ecol. Eng. 2022, 23, 100–111. [Google Scholar] [CrossRef] [PubMed]
  75. Fitriani, N.; Kurniawan, S.B.; Imron, M.F.; Maulana, I.I.; Soedjono, E.S.; Mohamed, R.M.S.R.; Othman, N.B.; Ni’Matuzahroh, N.; Kusuma, M.N. System dynamic modelling to assess the influential factors affecting roughing filter and slow sand filter performance in treating culinary wastewater. J. Water Process Eng. 2023, 56, 104274. [Google Scholar] [CrossRef]
  76. Casas, M.E.; Larzabal, E.; Matamoros, V. Exploring the usage of artificial root exudates to enhance the removal of contaminants of emerging concern in slow sand filters: Synthetic vs. real wastewater conditions. Sci. Total Environ. 2022, 824, 153978. [Google Scholar] [CrossRef] [PubMed]
  77. Verma, S.; Daverey, A.; Sharma, A. Slow sand filtration for water and wastewater treatment—A review. Environ. Technol. Rev. 2017, 6, 47–58. [Google Scholar] [CrossRef]
  78. Verma, S.; Daverey, A.; Sharma, A. Wastewater treatment by slow sand filters using uncoated and iron-coated fine sand: Impact of hydraulic loading rate and media depth. Environ. Sci. Pollut. Res. 2019, 26, 34148–34156. [Google Scholar] [CrossRef]
  79. Hojo, L.Y.C.P.; de P, R.V.; Lautenschlager, S.R.; Sabogal-Paz, L.P. Household slow sand filters operating in continuous and intermittent flows: Computational fluid dynamics simulation and validation by tracer experiments. Chem. Eng. Sci. 2022, 247, 117058. [Google Scholar] [CrossRef]
  80. Maiyo, J.K.; Dasika, S.; Jafvert, C.T. Slow Sand Filters for the 21st Century: A Review. Int. J. Environ. Res. Public Health 2023, 20, 1019. [Google Scholar] [CrossRef]
  81. Malvern Instruments Limited. A Basic Guide to Particle Characterization 2. Better Understanding of Products, Ingredients and Processes. Worcestershire. 2015. Available online: https://www.cif.iastate.edu/files/inline-files/Particle%20Characterization%20Guide.pdf (accessed on 13 May 2024).
  82. Das, B.M.; Sobhan, K. Principles of Geotechnical Engineering, 8th ed.; Cengage Learning: Boston, MA, USA, 2012; Available online: https://docviewer.xdocs.net/view.php (accessed on 23 May 2024).
  83. Information Management Unit and Northern Ireland Water. Information Request NIW 2425071; Information Management Unit and Northern Ireland Water: Belfast, Ireland, 2024. [Google Scholar]
  84. Torres, A.; Simoni, M.U.; Keiding, J.K.; Müller, D.B.; zu Ermgassen, S.O.; Liu, J.; Jaeger, J.A.; Winter, M.; Lambin, E.F. Sustainability of the global sand system in the Anthropocene. One Earth 2021, 4, 639–650. [Google Scholar] [CrossRef]
  85. Krumenacher, M.J. Reality Check on a Purported Global Sand Shortage Sensationalism Extrapolated From Isolated Occurrences to Global Phenomena. Electron. Green J. 2022, 47, 1–11. [Google Scholar] [CrossRef]
  86. Bazargan, J.; Eskandari, R. Investigating the Influence of Filter Uniformity Coefficient and Effective Pore Size on Critical Hydraulic Gradient and Maximum Erosion of Dispersive and Non-Dispersive Samples.JWSR. 2013. Available online: www.SID.ir (accessed on 26 May 2024).
  87. Limited, H.I. A Guidebook to Particle Size Analysis. 2022. Available online: https://cmrf.research.uiowa.edu/sites/cmrf.research.uiowa.edu/files/HORIBA_A%20Guidebook%20to%20Particle%20Size%20Analysis%20-%202022.pdf (accessed on 30 June 2024).
  88. Papp, L.A.; Cardinali-Rezende, J.; de Souza Júdice, W.A.; Sanchez, M.B.; Araújo, W.L. Low biological phosphorus removal from effluents treated by slow sand filters. Appl. Microbiol. Biotechnol. 2022, 106, 5797–5809. [Google Scholar] [CrossRef] [PubMed]
  89. El-kamah, H.M.; Doma, H.S.; El-Shafai, S.A. Non-Conventional Municipal Wastewater Treatment System Suitable for Egyptian Villages and Small Communities. Res. J. Pharm. Biol Chem. Sci. 2017, 8, 2024–2031. [Google Scholar]
  90. Chibueze, C.V.; Nnaji, C.C.; Mama, C.N.; Nwankwo, E.J. Integrated treatment of stormwater using multistage filtration (MSF) for domestic application (reuse). Water SA 2024, 50, 154–165. [Google Scholar] [CrossRef]
  91. Platias, S.; Vatalis, K.I.; Charalampides, G. Suitability of Quartz Sands for Different Industrial Applications. Procedia Econ. Financ. 2014, 14, 491–498. [Google Scholar] [CrossRef]
  92. Cohen, B.; Shipley, D.S.; Tong, A.R.; Casaroli, S.J.G.; Petrie, J.G. Precipitation of iron from concentrated chloride solutions: Literature observations, challenges and preliminary experimental results. Miner. Eng. 2005, 18, 1344–1347. [Google Scholar] [CrossRef]
  93. Mittal, Y.; Srivastava, P.; Pandey, S.; Yadav, A.K. Development of nature-based sustainable passive technologies for treating and disinfecting municipal wastewater: Experiences from constructed wetlands and slow sand filter. Sci. Total Environ. 2023, 900, 165320. [Google Scholar] [CrossRef]
  94. Wang, C.; Li, S.Y.; He, X.J.; Chen, Q.; Zhang, H.; Liu, X.Y. Improved prediction of water retention characteristic based on soil gradation and clay fraction. Geoderma 2021, 404, 115293. [Google Scholar] [CrossRef]
  95. Li, J.; Zhou, Q.; Campos, L.C. The application of GAC sandwich slow sand filtration to remove pharmaceutical and personal care products. Sci. Total Environ. 2018, 635, 1182–1190. [Google Scholar] [CrossRef]
  96. Bun, S.; Chawaloesphonsiya, N.; Ermukdakul, T.; Pungrasmi, W.; Suwannasilp, B.B.; Painmanakul, P. Suspended solid and nitrate removal from aquaculture system wastewater by different approaches. Desalination Water Treat. 2017, 81, 87–94. [Google Scholar] [CrossRef]
  97. Maharjan, N.; Kuroda, K.; Dehama, K.; Hatamoto, M.; Yamaguchi, T. Development of slow sponge sand filter (SpSF) AS a post-treatment of UASB-DHS reactor effluent treating municipal wastewater. Water Sci. Technol. 2016, 74, 65–72. [Google Scholar] [CrossRef] [PubMed]
  98. Babaei, F.; Ehrampoush, M.H.; Eslami, H.; Ghaneian, M.T.; Fallahzadeh, H.; Talebi, P.; Fard, R.F.; Ebrahimi, A.A. Removal of linear alkylbenzene sulfonate and turbidity from greywater by a hybrid multi-layer slow sand filter microfiltration ultrafiltration system. J. Clean. Prod. 2019, 211, 922–931. [Google Scholar] [CrossRef]
  99. Karakurt-Fischer, S.; Rien, C.; Sanz-Prat, A.; Szewzyk, R.; Hübner, U.; Drewes, J.E.; Selinka, H.-C. Fate and Transport of Viruses within a High-Rate Plug-Flow Biofilter Designed for Non-Membrane-Based Indirect Potable Reuse Applications. ACS ES&T Water 2021, 1, 1229–1239. [Google Scholar] [CrossRef]
  100. Li, J. Removal of Selected Pharmaceuticals and Personal Care Products using Greater Duckweed Constructed Wetland Followed by GAC Sandwich Slow Sand Filter. Ph.D. Thesis, University College London, London, UK, 2019. [Google Scholar]
  101. Biosand Filter Construction Manual. August 2012. Available online: www.cawst.org (accessed on 27 May 2024).
  102. Vu, C.T.; Wu, T. Enhanced Slow Sand Filtration for the Removal of Micropollutants from Groundwater. Sci. Total Environ. 2022, 809, 152161. [Google Scholar] [CrossRef] [PubMed]
  103. Guchi, E. Review on Slow Sand Filtration in Removing Microbial Contamination and Particles from Drinking Water. Am. J. Food Nutr. 2015, 3, 47–55. [Google Scholar] [CrossRef]
  104. Lubarsky, H.; Fava, N.d.M.N.; Freitas, B.L.S.; Terin, U.C.; Oliveira, M.; Lamon, A.W.; Pichel, N.; Byrne, J.A.; Sabogal-Paz, L.P.; Fernandez-Ibañez, P. Biological Layer in Household Slow Sand Filters: Characterization and Evaluation of the Impact on Systems Efficiency. Water 2022, 14, 1078. [Google Scholar] [CrossRef]
  105. Terin, U.C.; Sabogal-Paz, L.P. Microcystis aeruginosa and microcystin-LR removal by household slow sand filters operating in continuous and intermittent flows. Water Res. 2019, 150, 29–39. [Google Scholar] [CrossRef] [PubMed]
  106. Rivera-Utrilla, J.; Sánchez-Polo, M.; Ferro-García, M.Á.; Prados-Joya, G.; Ocampo-Pérez, R. Pharmaceuticals as emerging contaminants and their removal from water. A review. Chemosphere 2013, 93, 1268–1287. [Google Scholar] [CrossRef] [PubMed]
  107. Singer, S.; Skinner, B.; Cantwell, R.E. Impact of surface maintenance on BioSand filter performance and flow. J. Water Health 2017, 15, 262–272. [Google Scholar] [CrossRef] [PubMed]
  108. Filho, W.L.; Hunt, J.; Lingos, A.; Platje, J.; Vieira, L.W.; Will, M.; Gavriletea, M.D. The Unsustainable Use of Sand: Reporting on a Global Problem. Sustainability 2021, 13, 3356. [Google Scholar] [CrossRef]
  109. Greene, T. Lough Neagh: Major Review into Sand Dredging Will Include Long-Awaited Survey of the Lake Bed. The Detail. Available online: https://www.thedetail.tv/articles/lough-neagh-survey (accessed on 22 July 2024).
  110. Mohan, D.; Sarswat, A.; Ok, Y.S.; Pittman, C.U. Organic and inorganic contaminants removal from water with biochar, a renewable, low cost and sustainable adsorbent—A critical review. Bioresour Technol. 2014, 160, 191–202. [Google Scholar] [CrossRef]
  111. Adeniyi, A.G.; Iwuozor, K.O.; Emenike, E.C.; Ajala, O.J.; Ogunniyi, S.; Muritala, K.B. Thermochemical co-conversion of biomass-plastic waste to biochar: A review. Green Chem. Eng. 2024, 5, 31–49. [Google Scholar] [CrossRef]
  112. Silori, R.; Zang, J.; Raval, N.P.; Giri, B.S.; Mahlknecht, J.; Mora, A.; Dueñas-Moreno, J.; Tauseef, S.M.; Kumar, M. Adsorptive removal of ciprofloxacin and sulfamethoxazole from aqueous matrices using sawdust and plastic waste-derived biochar: A sustainable fight against antibiotic resistance. Bioresour. Technol. 2023, 387, 129537. [Google Scholar] [CrossRef]
  113. Larasati, A.; Fowler, G.D.; Graham, N.J.D. Insights into chemical regeneration of activated carbon for water treatment. J. Environ. Chem. Eng. 2021, 9, 105555. [Google Scholar] [CrossRef]
  114. Emslie, D.; Siddiqua, S.; Crawford, B.; Teece, W. Biofilm Formation and Effectiveness of Biosand Filtration Systems with Typical and Innovative Filter Media. Geotech. Geol. Eng. 2022, 40, 1251–1266. [Google Scholar] [CrossRef]
  115. Bonné, P.A.C.; Hofman, J.A.M.H.; der Hoek, J.P. Long term capacity of biological activated carbon filtration for organics removal. Water Sci. Technol. Water Supply 2002, 2, 139–146. [Google Scholar] [CrossRef]
  116. Vedenyapina, M.D.; Kurmysheva, A.Y.; Kulaishin, S.A. Regeneration of Activated Carbons after Adsorption of Biologically Active Organic Compounds on Them (A Review). Solid Fuel Chem. 2024, 58, 24–39. [Google Scholar] [CrossRef]
  117. Olaniyan, P.O.; Nadim, M.M.; Subir, M. Detection and binding interactions of pharmaceutical contaminants using quartz crystal microbalance—Role of adsorbate structure and surface functional group on adsorption. Chemosphere 2023, 311, 137075. [Google Scholar] [CrossRef] [PubMed]
  118. Shi, Y.; Wang, Y.; Meng, N.; Liao, Y. Photothermal Conversion Porous Organic Polymers: Design, Synthesis, and Applications. Small Methods 2024, 8, 2301554. [Google Scholar] [CrossRef] [PubMed]
  119. Wolska, J.; Frankowski, M.; Jenczyk, J.; Wolski, L. Highly sulfonated hyper-cross-linked polymers as promising adsorbents for efficient and selective removal of ciprofloxacin from water. Sep. Purif. Technol. 2024, 343, 127147. [Google Scholar] [CrossRef]
  120. Dastyar, F.; Dinari, M. Preparation of pyridine based porous organic polymers as new adsorbents to remove Congo red dye from aqueous media. J. Polym. Res. 2024, 31, 315. [Google Scholar] [CrossRef]
  121. Olupot, P.W.; Menya, E.; Jjagwe, J.; Wakatuntu, J.; Román, F.; Hensel, O. Optimization of roughing filtration unit for a handwashing wastewater recirculation point-of-use system. Water Sci. Technol. 2022, 86, 2528–2544. [Google Scholar] [CrossRef]
  122. Sain, U.; Bishnoi, N.R. Assessment of removal efficiency of total suspended solids (TSS) from secondary treated effluent using a multigrade multimedia filtration technique. Ann. Agri Bio Res. 2018, 23, 74–77. Available online: https://www.scopus.com/inward/record.uri?eid=2-s2.0-85063578213&partnerID=40&md5=65550e59fc61f4ca9eec8b9b0fe125da (accessed on 21 February 2024).
  123. Delmond, B.; Tretsiakova-McNally, S.; Solan, B.; McDermott, R.; Audoin, A. A Sustainable Method to Reduce Vancomycin Concentrations in Water Using Timber Waste. Water Air Soil Pollut. 2023, 234, 81. [Google Scholar] [CrossRef]
  124. Dhanasekaran, P.; Sahu, O. Arsenate and fluoride removal from groundwater by sawdust impregnated ferric hydroxide and activated alumina (SFAA). Groundw. Sustain. Dev. 2021, 12, 100490. [Google Scholar] [CrossRef]
  125. Akinsanmi, O.; Kaya; Tretsiakova-McNally, S.; Arnscheidt, J.; Altayan, M.; Coleman, H. Tackling Antimicrobial Resistance: Adsorption of meropenem and ciprofloxacin on ligno-cellulosic substrate from sawdust. In Proceedings of the European Waste Water Management Conference, Birmingham, UK, 16–17 July 2019. [Google Scholar]
  126. Sanchez, J.L.; Hodge, D.B.; Davis, M.F.; Paës, G.; Zoghlami, A. Lignocellulosic Biomass: Understanding Recalcitrance and Predicting Hydrolysis. Front. Chem. 2019, 7, 874. [Google Scholar] [CrossRef]
  127. Zhu, L.; Qi, H.Y.; Le Lv, M.; Kong, Y.; Yu, Y.W.; Xu, X.Y. Component analysis of extracellular polymeric substances (EPS) during aerobic sludge granulation using FTIR and 3D-EEM technologies. Bioresour. Technol. 2012, 124, 455–459. [Google Scholar] [CrossRef] [PubMed]
  128. Yasemin, B.; Zeki, T. Removal of heavy metals from aqueous solution by sawdust adsorption. J. Environ. Sci. 2007, 19, 160–166. [Google Scholar]
  129. Harmayani, K.D.; Anwar, A.H.M.F. Adsorption kinetics and equilibrium study of nitrogen species onto radiata pine (Pinus radiata) sawdust. Water Sci. Technol. 2016, 74, 402–415. [Google Scholar] [CrossRef] [PubMed]
  130. Gogoi, H.; Leiviskä, T.; Heiderscheidt, E.; Postila, H.; Tanskanen, J. Removal of metals from industrial wastewater and urban runoff by mineral and bio-based sorbents. J. Environ. Manag. 2018, 209, 316–327. [Google Scholar] [CrossRef]
  131. Li, J.; Han, X.; Brandt, B.W.; Zhou, Q.; Ciric, L.; Campos, L.C. Physico-chemical and biological aspects of a serially connected lab-scale constructed wetland-stabilization tank-GAC slow sand filtration system during removal of selected PPCPs. Chem. Eng. J. 2019, 369, 1109–1118. [Google Scholar] [CrossRef]
  132. Onesios, K.M.; Bouwer, E.J. Biological removal of pharmaceuticals and personal care products during laboratory soil aquifer treatment simulation with different primary substrate concentrations. Water Res. 2012, 46, 2365–2375. [Google Scholar] [CrossRef]
  133. Pompei, C.M.E.; Ciric, L.; Canales, M.; Karu, K.; Vieira, E.M.; Campos, L.C. Influence of PPCPs on the performance of intermittently operated slow sand filters for household water purification. Sci. Total Environ. 2017, 581–582, 174–185. [Google Scholar] [CrossRef]
  134. Pompei, C.M.E.; Campos, L.C.; Vieira, E.M.; Tucci, A. The impact of micropollutants on native algae and cyanobacteria communities in ecological filters during drinking water treatment. Sci. Total Environ. 2022, 822, 153401. [Google Scholar] [CrossRef]
  135. Tian, L.; Wang, L.; Zhang, X.; Huang, X.; Wang, F.; Zhu, S.; Li, X.; Guan, Y. Multi-omics analysis on seasonal variations of the biofilm microbial community in a full-scale pre-denitrification biofilter. Environ. Sci. Pollut. Res. 2023, 30, 24284–24298. [Google Scholar] [CrossRef] [PubMed]
  136. Fang, H.; Chen, Y.; Huang, L.; He, G. Biofilm growth on cohesive sediment deposits: Laboratory experiment and model validation. Hydrobiologia 2017, 799, 261–274. [Google Scholar] [CrossRef]
  137. D’Haese, A.; Le-Clech, P.; Van Nevel, S.; Verbeken, K.; Cornelissen, E.R.; Khan, S.J.; Verliefde, A.R. Trace organic solutes in closed-loop forward osmosis applications: Influence of membrane fouling and modeling of solute build-up. Water Res. 2013, 47, 5232–5244. [Google Scholar] [CrossRef] [PubMed]
  138. Yang, S.; Ngwenya, B.T.; Butler, I.B.; Kurlanda, H.; Elphick, S.C. Coupled interactions between metals and bacterial biofilms in porous media: Implications for biofilm stability, fluid flow and metal transport. Chem. Geol. 2013, 337–338, 20–29. [Google Scholar] [CrossRef]
  139. Alnahhal, S.Y.; Elfari, A.A.; Afifi, S.A.; Aljubb, A.E.R. Using slow sand filter for organic matter and suspended solids removal as post-treatment unit for wastewater effluent. Environ. Sci. Water Res. Technol. 2023, 10, 490–497. [Google Scholar] [CrossRef]
  140. Livingston, P.; Slack, D. Management of the schmutzdecke layer in a slow sand filter to reuse drainage water from a greenhouse. Adv. Mater. Res. 2014, 931, 834–838. [Google Scholar] [CrossRef]
  141. Wang, J.; Wang, S. Removal of pharmaceuticals and personal care products (PPCPs) from wastewater: A review. J. Environ. Manag. 2016, 182, 620–640. [Google Scholar] [CrossRef] [PubMed]
  142. Oruganti, R.K.; Katam, K.; Show P., L.; Gadhamshetty, V.; Upadhyayula, V.K.K.; Bhattacharyya, D. A comprehensive review on the use of algal-bacterial systems for wastewater treatment with emphasis on nutrient and micropollutant removal. Bioengineered 2022, 13, 10412–10453. [Google Scholar] [CrossRef]
Figure 2. Screening flowchart for manuscript selection (PRISMA guidelines [65]).
Sustainability 16 10595 g002
Figure 3. Schematic depictions of (a) the effect of small particle size on porosity, (b) the effect of large particle size on porosity, (c) the effect of greater non-uniformity on porosity, and (d) the effect of regularity of packing on flow paths. Amended from [2].
Sustainability 16 10595 g003
Figure 4. Box plot of all reported D10 values (left; n = 15), larger-scale investigations (middle), and laboratory-scale investigations (right). Broken lines indicate range utilized or recommended by industrial and municipal SSF application.
Sustainability 16 10595 g004
Figure 5. Graphical comparison of the distribution of (a) all reported bed depths, and (b) laboratory- versus (c) larger-scale studies.
Sustainability 16 10595 g005
Table 1. The current watch list of substances, their use, and concentrations predicted or measured environmentally. Values are from [17] unless stated otherwise.
Name of Substance/Group of SubstancesTypical Application of the Substance [17] Max. Predicted Environmental Concentration (PEC) (µg/L)Predicted No-Effect Concentration (PNEC) (µg/L)
MetaflumizoneInsecticide0.300.0654
AmoxicillinAntibiotic1.28 a0.078
CiprofloxacinAntibiotic7.000.089
SulfamethoxazoleAntibiotic<1016
TrimethoprimAntibiotic<10120
Venlafaxine (and O-desmethylvenlafaxine)Antidepressant (antidepressant metabolite)0.200.038 * [18]
Azole compounds:ClotrimazoleAntifungal pharmaceuticals or food protection products0.016 *1
Fluconazole0.06 *9.46
Imazalil0.430.8
Ipconazole0.2719 0.27
Metconazole1.2 0.0582 [18]
MiconazoleNo data0. 4
Penconazole3.3 6
Prochloraz3 10
TebuconazoleNo data1
Tetraconazole3 1.9
DimoxystrobinFungicide16.420.0316
FamoxadoneFungicide1.800.14
* Not reliable value as defined by technical report (insufficient data). a Measured environmental concentration (MEC).
Table 2. Frequency of cleaning (by sand removal) of continuous mode SSF, their climates, and influent type.
StudyLocationTemperature (°C)Frequency of CleaningsInfluentReference
Coal slag SSFBotswana14–17Twice over 17 weeksReal wastewater treatment plant discharge[54]
EPA SSF recommendationsIreland>6 *Every 1–2 weeks to monthsReal wastewater[64]
SSFSão Paulo state, Brazil25Every 30 daysRiver water[51]
SSFSão Paulo state, Brazil20–25Every 1–3 weeksReal wastewater treatment plant discharge[88]
* Biological activity affected below this temperature.
Disclaimer/Publisher’s Note: The statements, opinions and data contained in all publications are solely those of the individual author(s) and contributor(s) and not of MDPI and/or the editor(s). MDPI and/or the editor(s) disclaim responsibility for any injury to people or property resulting from any ideas, methods, instructions or products referred to in the content.

