Article

Biology and Ecology of the European Eel as Revealed by an Original Sampling Technique Performed in a Deep and Large Riverine Ecosystem

1
Laboratory of Fish Demography and Hydroecology, Management of Aquatic Resources and Aquaculture Unit, Freshwater and Oceanic Science Unit of Research-FOCUS, University of Liège, 22 Quai E. Van Beneden, B-4020 Liège, Belgium
2
Profish Technology SA, 114 Chemin des Pêcheurs, B-5100 Namur, Belgium
*
Author to whom correspondence should be addressed.
Sustainability 2024, 16(23), 10607; https://doi.org/10.3390/su162310607
Submission received: 8 November 2024 / Revised: 25 November 2024 / Accepted: 1 December 2024 / Published: 3 December 2024
(This article belongs to the Section Resources and Sustainable Utilization)

Abstract

:
Few studies have documented the biology, demography, and ecology of eels in deep and large riverine ecosystems, which nevertheless contain important growing areas for this endangered species. Using an original eel sampling technique, this 6-year study, started in 2018, aims to characterise the bioecology and demography parameters of eels in a deep and wide riverine ecosystem, the Meuse in Belgium. It was performed over a 125.8 km stretch and included four sampling sites. This technique, never previously used in the Meuse, trapped the eels in fyke nets when they swam back upstream, swimming against the current, after an avoidance reaction generated by the screens of hydropower facilities. Results revealed a high performance in catching eels as well as their sympatric biodiversity. The inter-site growth of eels was good. Yellow eels were mostly caught in the spring and summer under the influence of rising water temperatures, and silver eels were caught during autumn in October–December when flow and turbidity were high. A down-to-upstream decreasing demographic gradient was observed, but this pattern was not found for entry rate, catchability, survival, and immigration and emigration nets. Survival was low, and net emigration was high at a site experiencing noise pollution and hydraulic disturbance due to the work of expanding the ship lock to facilitate the passage of large boats. Effective strategies for the local eel stock and habitat management have been provided for deep and large riverine ecosystems.

1. Introduction

Due to its panmixia, semelparity, and diadromy nature, the European eel Anguilla anguilla has fascinated scientists from different fields for several decades [1,2,3]. Interest in this species, which is unique in its very particular biology, has increased further due to its ubiquity, expressed by its ability to colonise an extremely wide range of marine, brackish, and freshwater habitats [4,5,6,7,8]). Unfortunately, it is currently experiencing a drastic drop in its stocks around the world. Since the 1980s, a decline has been observed in both local stocks and recruitment at sea [9]. This decline has been estimated globally at about 5% per year since the 1970s for eel stocks and fishing yields, now representing less than 10% of their historical levels [10,11]. The decline in eel stocks is particularly evident in inland regions located far from coastal areas [12,13,14]. Glass eel recruitment from the ocean to the continent was about 15% per year from 1980 to 2010, representing 1–10% of its previous levels, and 1.4% of the 1960–1979 average in the North Sea [15]. In the Belgian Meuse basin, more than 320 km from the North Sea, local eel stocks have declined significantly and the number of wild yellow eels migrating up the Meuse from the North Sea declined by around 3.6% per year from 1992 to 2020. In 2020, this number was 0.6% of the record level recorded in 1992 [13,14]. The species breeds in the Sargasso Sea and colonises inland waters by density-dependent migrations of juvenile eels [2,12,16]. Some of the causes of this decline are located at sea, such as global warming, which is leading to sea temperatures rising and ocean currents changing, which are detrimental to the survival of leptocephali, and another is glass eel overfishing in estuaries [17,18,19]. Others are linked to the poor quality of continental environments, such as obstruction of free movement preventing juveniles from accessing the best growing habitats and spawner adults from returning safely to reproduce at sea, pollution, and contamination by pathogens [3,20,21,22,23,24,25]. Commercial and recreational fishing and predation by piscivorous animals also weaken local stocks without the possibility of supporting them with the addition of individuals produced on farms, as artificial reproduction is not yet possible [26]. The species is critically endangered and is on the Red List of the International Union for Conservation of Nature [27]. It is listed in [28] of the Convention on International Trade in Endangered Species of Wild Fauna and Flora [28] and, at the European level, benefits from numerous protection measures described in Regulation (EC) No. 1100/2007 of the European Commission published in the Official Journal of 22 September 2007 [29].
A better understanding of the species, its diversity of habitats, and its different life phases is urgent [30,31,32] and would help in the implementation of effective eel conservation management measures. During the continental life phase, eels exploit shallow and deep aquatic ecosystems and show nocturnal activity and cryptic habits during the day, making their capture very difficult in deep rivers [5,33,34]. Fortunately, eel catch and study methods have improved, thanks to recent studies. These include the use of traps placed in fish passes, eel traps, and electrofishing [9,35,36,37,38]. These conventional capture methods, in combination with biotelemetry, have made it possible to document eel biology and ecology in terms of seasonal periodicity, migration intensity, habitat use, growth, and silvering stage [35,36,37,38]. However, if this is true for shallow aquatic environments, it is paradoxical that few studies document the biology, demography, and ecology of eels in deep and large riverine ecosystems, which contain important growing areas for the species.
In the Belgian Meuse, the collapsed local stocks are supported by restocking using imported glass eels [9,39]. However, information remains lacking in terms of their ecology, growth, stocks, and demographic parameters due to the inefficiency of conventional sampling methods and monitoring efforts [13,14]. The Meuse River is deep, wide, and fragmented by numerous dams for boat navigation and hydropower production. Some data are available, but they are incomplete and often obtained by trapping wild eels in fish passes at Lixhe when they enter Belgium and travel up the Meuse from the North Sea via the Dutch Meuse [14,35,40]. Using an original eel sampling technique with fyke nets placed at the river bottom, this 6-year study, started in 2018, aims to characterise the bioecology and demography parameters of eels in a deep and wide riverine ecosystem like the Meuse in Belgium. This technique, never previously used in the Meuse, was discussed by Behrmann-Godel and Eckmann [41] and developed by the professional fishermen of the Mosel River. It consists of trapping the eels in fyke nets when they swim back upstream and swim against the current from the screens of a hydropower facility. The specific goals were to (1) identify the sympatric biodiversity; (2) evaluate the efficiency of this sampling methodology in our experimental conditions; (3) analyse the diversity of size, silvering stage, and annual growth; (4) specify the catch phenology; and (5) assess the survival, catchability, arrival rate, population size, and net immigration and emigration using a suitable Jolly–Seber model for open populations [38,42,43,44,45].

2. Materials and Methods

2.1. Study Sites

The study area included four sites. These were in southern Belgium, in the Meuse River, and extended over 125.8 km upstream from Lixhe, site A (Table 1, Figure 1). Site A was the most downstream site, located 323 km from the estuary in The Netherlands. The sites were 42 km apart on average (range = 19–62 km), and each one had a dam equipped with a ship lock except site A, which had a dam without a lock. The international Meuse is 925 km long and supplies a catchment area of 36,000 km2, encompassing France, Luxembourg, Belgium (Wallonia and Flanders), Germany, and The Netherlands, with a concentration of 36% in Wallonia [13,40]. It flows mostly from south to north through France, Belgium (both Wallonia and Flanders), and The Netherlands before entering the North Sea. In the Walloon Region, the Meuse River receives water from two major rivers: the Sambre at Namur and the Ourthe at Liège. In our study area, a large part of the Meuse is highly artificial, with several dams (n = 15 from site A to D) for navigation and hydropower, bank rectification, and flow regulation. Eels have also been subject to effective management measures, such as restocking practices, in the last decade [9,39].
From 2018 to 2023, eels in experimental sites experienced a monthly average of daily mean water temperatures of 14.6 (±6.3 °C) and flows of 194.9 (±189.2) m3·s−1. The temperature of the Meuse increased, exceeding 10 °C from April to August (Figure 2). Its flow rate also increased, reaching values above 60 m3·s−1 from October to January–February. Site A had a greater width and flow compared to the other sites. Site B was the warmest site, while sites C and D were the coldest, with the lowest flow rates. The water temperature was measured constantly using temperature loggers (Onset® Computer Corporation, Bourne, MA, USA). The Walloon Public Service for Mobility and Infrastructure in the Hydraulic and Environment Expertise Department of the Hydrological Management Directorate (Rue Del’ Grête 22—5020 Namur (Daussoulx)) provided the flow data.

2.2. Sampling Techniques

Our capture protocol involved the use of three five-fyke net lines (Figure 1). Each line measured 25 m, and each fyke net was 3.2 m long. The first line was located 3 m away, parallel to the bank. The second and third lines were installed toward mid-river, about 3–5 m from the previous line. The fyke net was made of 15 mm diameter nylon mesh. It consisted of three funnel-shaped capture sections separated by stainless steel rings, the first of which had a 55 cm diameter. Each line had five fyke nets tied along an 8 mm diameter rope. Upstream and downstream of each line, a 5 m chain served as ballast to anchor the line by attaching to a steel weight (approximately 15 kg) on the river bottom and on the surface to a floating buoy. Each line had two chains: the first was set at the start and the second at the end of the line. The buoys helped to determine the up and downstream sides when monitoring the traps performed weekly by boat. Their entrance was set at the downstream side, and eels were trapped as they swam upstream after a U-turn in front of the powerhouse’s trash screens. This eel catch device was designed following the guidelines of professional fishermen from Mosel practising silver eel fishing [41]. The circular swimming behaviour of eels as close as possible to the water intake of the hydropower turbine is associated with the exploitation of areas located near the banks, the migration near the riverbed, and the use of principal current during their passage downstream of the dams were all factors that explain the choice of location and opening orientation of our sampling devices [46,47,48,49].
Each time the traps were monitored, the captured fish were anesthetised with clove oil (10%, 0.2 mL·L−1) and identified and counted by family, ecological group, and species to evaluate fauna diversity abundance [50]. Eels were measured for their total length (TL, ±1 mm) and weighed (W, ±1 g), and untagged individuals were tagged with a passive integrated transponder tag (HDX, 134.2 kHz, dimension 12 × 2 mm, weight 0.095 g in air). Other morphological measurements, such as vertical and horizontal eye diameter (±0.1 mm) and pectoral fin length (±0.1 mm), were taken to determine the Durif silvering stage [51,52]. After recovering from anaesthesia, the tagged eels were released, on average, 2.5 km (range = 1.3–3.3 km) upstream of the fyke nets. Tagging did not result in any mortality.

2.3. Data Processing

For each species, absolute abundance was the number of individuals counted, and relative abundance was this absolute abundance divided by the number of fish caught belonging to all species. In eels, the sampling performance, monthly pattern of capture, relationship between TL and W, silvering stage and increment in TL, and demographic parameters were analysed. Sampling performance was defined as a ratio calculated by the number of days with eel capture divided by the total number of days of trap control. The monthly pattern of capture was expressed in the relative abundance calculated as the number of eels caught in a month divided by the total number of eels caught in a year. The correlation between TL and W was determined using the formula W = a × TLb, which was then logarithmically transformed into a linear correlation as log10 (W) = log10 (a) + b × log10 (TL), with W in g, TL in cm, and a and b as coefficients; a was the body shape coefficient, and b was the growth type coefficient. The silvering-to-yellow eel ratio was the number of yellow eels (SI, FII, and FIII stages) divided by the number of silver eels (FIV, FV, and MII). TL increment (mm.day−1) was assessed in tagged eels and expressed as TL at last recapture reduced by TL at first capture divided by the number of days separating these two events. To estimate demographic parameters, we used the Jolly–Seber method carried out using the POPAN module of the MARK 8.0 programme [38,42,43,44,45]. By using weekly capture/mark/recapture data from a site, four models were fitted, of which one model was selected as the best and most parsimonious model (Table 2). The selection was based on the lowest Akaike’s Quasi-Probability Information Criterion (AICc) value, the lowest number of parameters assessed, the biology of the species, and the use of the same riverine site. This model was {p(.), ϕ(.), pent(t), N(.)}, with p(.}, ϕ{.} and N(.) as constant time parameters representing catchability, survival, and overall population, respectively, and pent{t} the time-varying arrival probability. Overall population was the total number of eels that inhabited the site during the whole study. It also allowed the evaluation of the superpopulation (N*-hat) as a time-constant parameter and the ratio between net immigration (B-hat i) and net emigration (B*-hat i), which were both time-varying parameters. Superpopulation represented the number of eels that occasionally visited the site and disappeared before the counting started. Data from all trap lines at each site were pooled, summarised, and presented as mean values ± standard errors.
We tested the relationship between TL and time and TL increment and TL in eels using Pearson’s correlation coefficients (r). Fisher’s exact (FE) test was used to compare the relative abundance of fish between species and between sites, as well as the observed relative abundance, survival, and catchability of eels between sites. We compared the number of yellow-to-silver eels, the number of trap monitoring days, and the number of eels caught between months using Pearson’s chi-square (χ2) test. The non-parametric Kruskal–Wallis (KW) test followed by Dunn’s post hoc test with Bonferroni adjustment for multiple pairwise comparisons of mean rank sums were performed to compare TLs, TL increments, immigration-to-emigration net ratios between sites, and TL increments between silvering stages. Data from these three parameters did not meet a normal distribution (Kolmogorov–Smirnov, p < 0.001). We used the Rcmdr 2. 3-2, Hmisc, and Dunn test tools in R software version 3. 3 to run these statistical tests [53,54,55]. We considered results important if they had a p-value less than 0.05.

3. Results

3.1. Fauna Diversity

There were 4827 fish caught, comprising 16 species, divided into six families and three ecological groups (Table 3). The Cyprinidae family, with eight species, was the most prevalent fish family. The rheophilic group had three species belonging to two families, the Cyprinidae and Salmonidae, and was the least represented ecological group. At sites C and A, the number of fish species was 10 and 11, respectively, and it was seven at sites B and D. The round goby of the Gobiidae family represented >60% of the total number of fish caught, and it was the most abundant species at sites A, B, and C (FE test, p < 2.2 × 10⁻¹⁶). However, at site D, catfish (>60%) was the most-caught species. Based on an abundance of >10% of the total number of fish caught, the fish community included two main species: round goby and eel. These were found at all four sites, along with perch at sites A and B and catfish at site D. Rheophilic species were not found at sites A and B, while they were represented at site C by only one chub and one trout, and at site D by six barbels. Two non-native fish species, round goby and catfish, were present at all sampling sites. The fish species targeted by this study, the eel, represented an overall relative abundance of 11.5%, with inter-site variation ranging from 10.3% (site A) to 14.9% (site B). However, the highest abundance of eels (n = 226, 40.8% of the total eels caught) was found at site A, the most downstream site (FE test, p < 1.165 × 10⁻⁹). We also caught two species of non-native crustaceans: Chinese crab Eriocheir sinensis at all four sites (n, range = 16–31) and crayfish Astacus pacifastacus at site C (n = 27).

3.2. Eel Sampling Performance, Size, and Silvering Stage

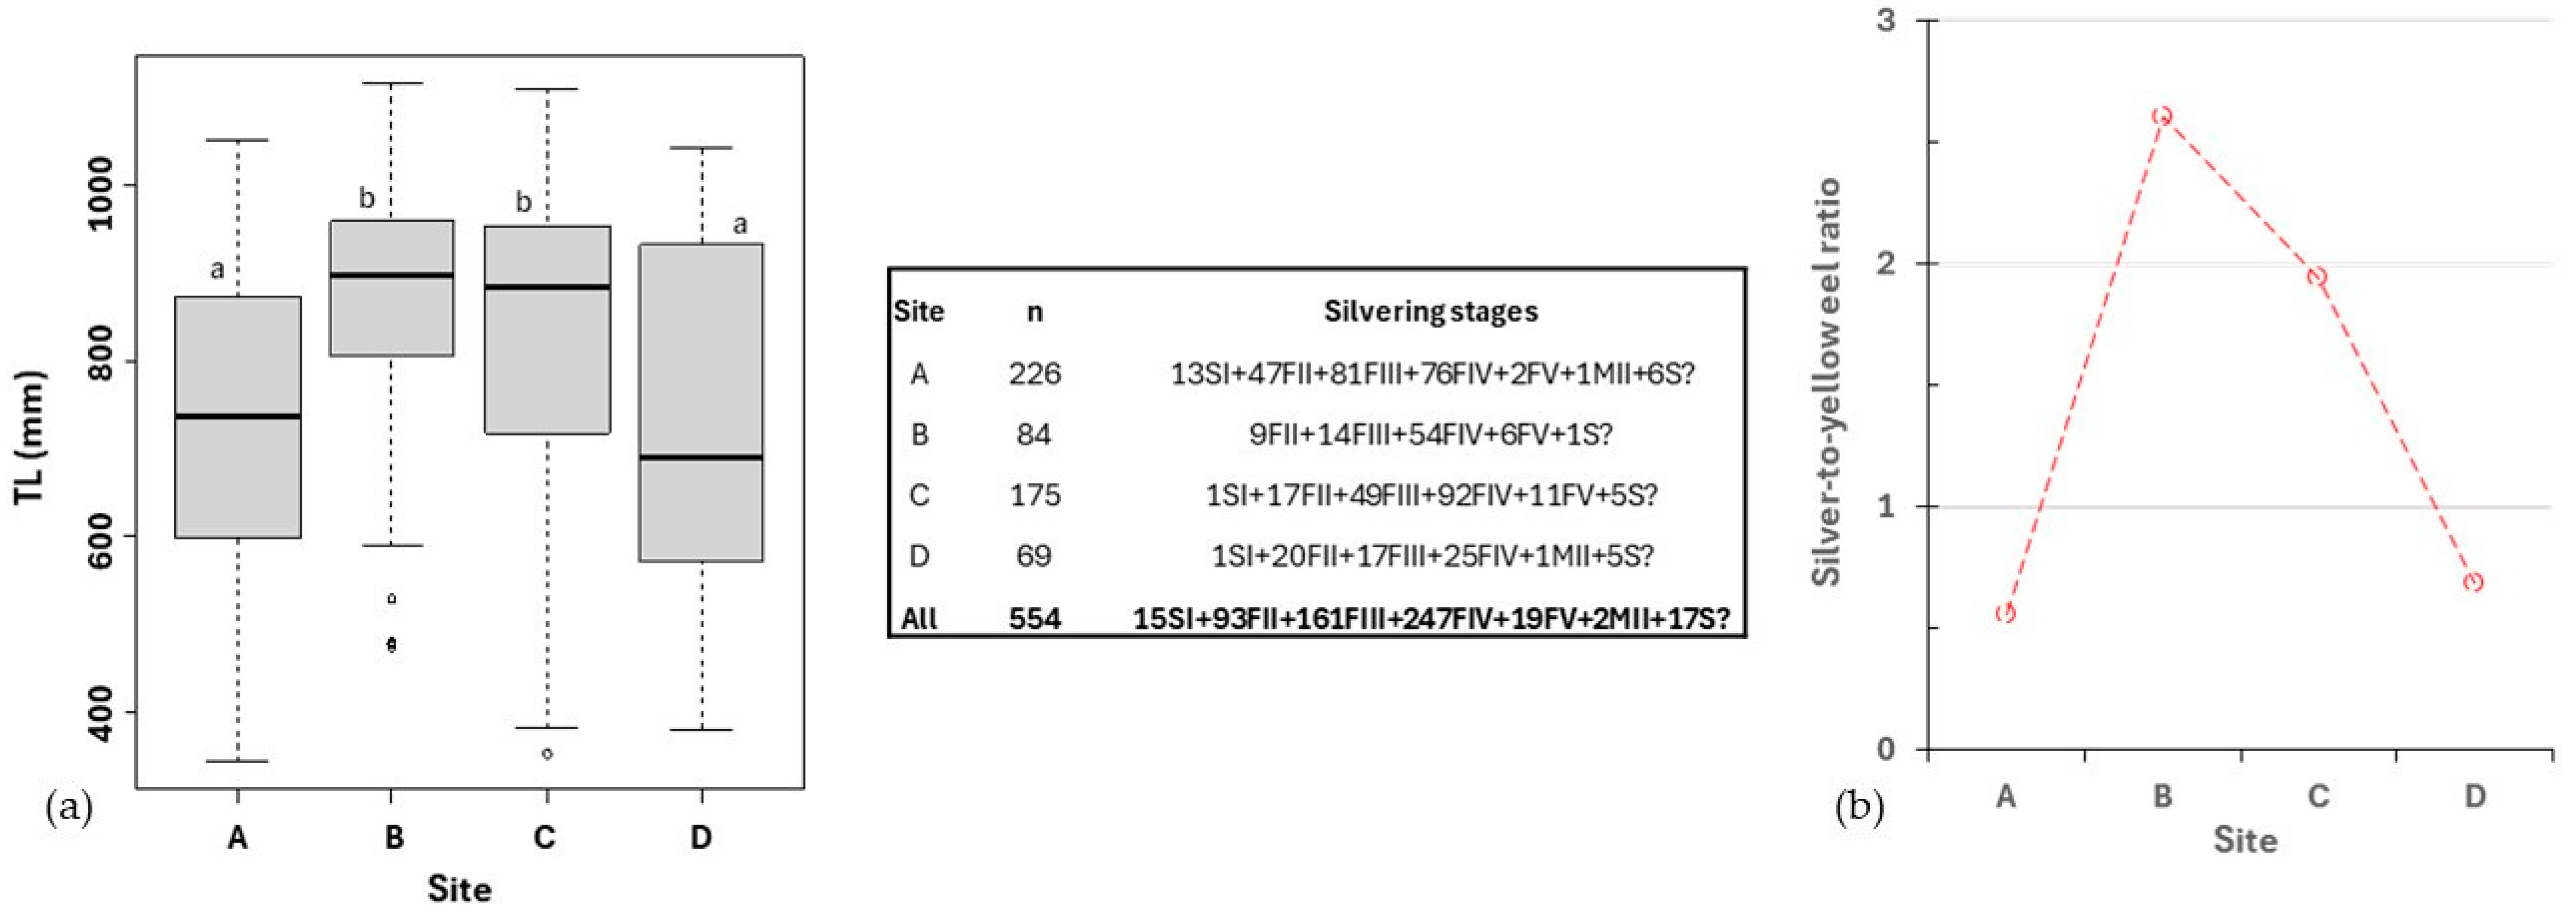
The total number of trap monitoring days was the highest at site C (120 days) and the lowest at site D (45 days; χ2 tests, p < 0.001; Table 4). Site A had 104 days, which were not significantly different from those at sites C and B (86 days; p > 0.05). Overall, 79% of the trap monitoring days had at least one eel captured. This eel trapping performance expressed in terms of the eel capture-to-trap monitoring day ratio varied across sites. It ranged in mean values from 73 (site D) to 85% (site A). The number of yellow-stage eels (n = 269) was similar to that of silver-stage eels (n = 268). At site B (mean TL = 861 mm) and site C (829 mm), eel individuals caught were predominantly silver eels (χ2 tests, p < 0.0001) and larger than those captured at site A (731 mm) and D (735 mm; KW test, range: df = 3, χ2 = 57.863, p = 1.682 × 10⁻¹², Dunn test, p < 0.05; Figure 3).
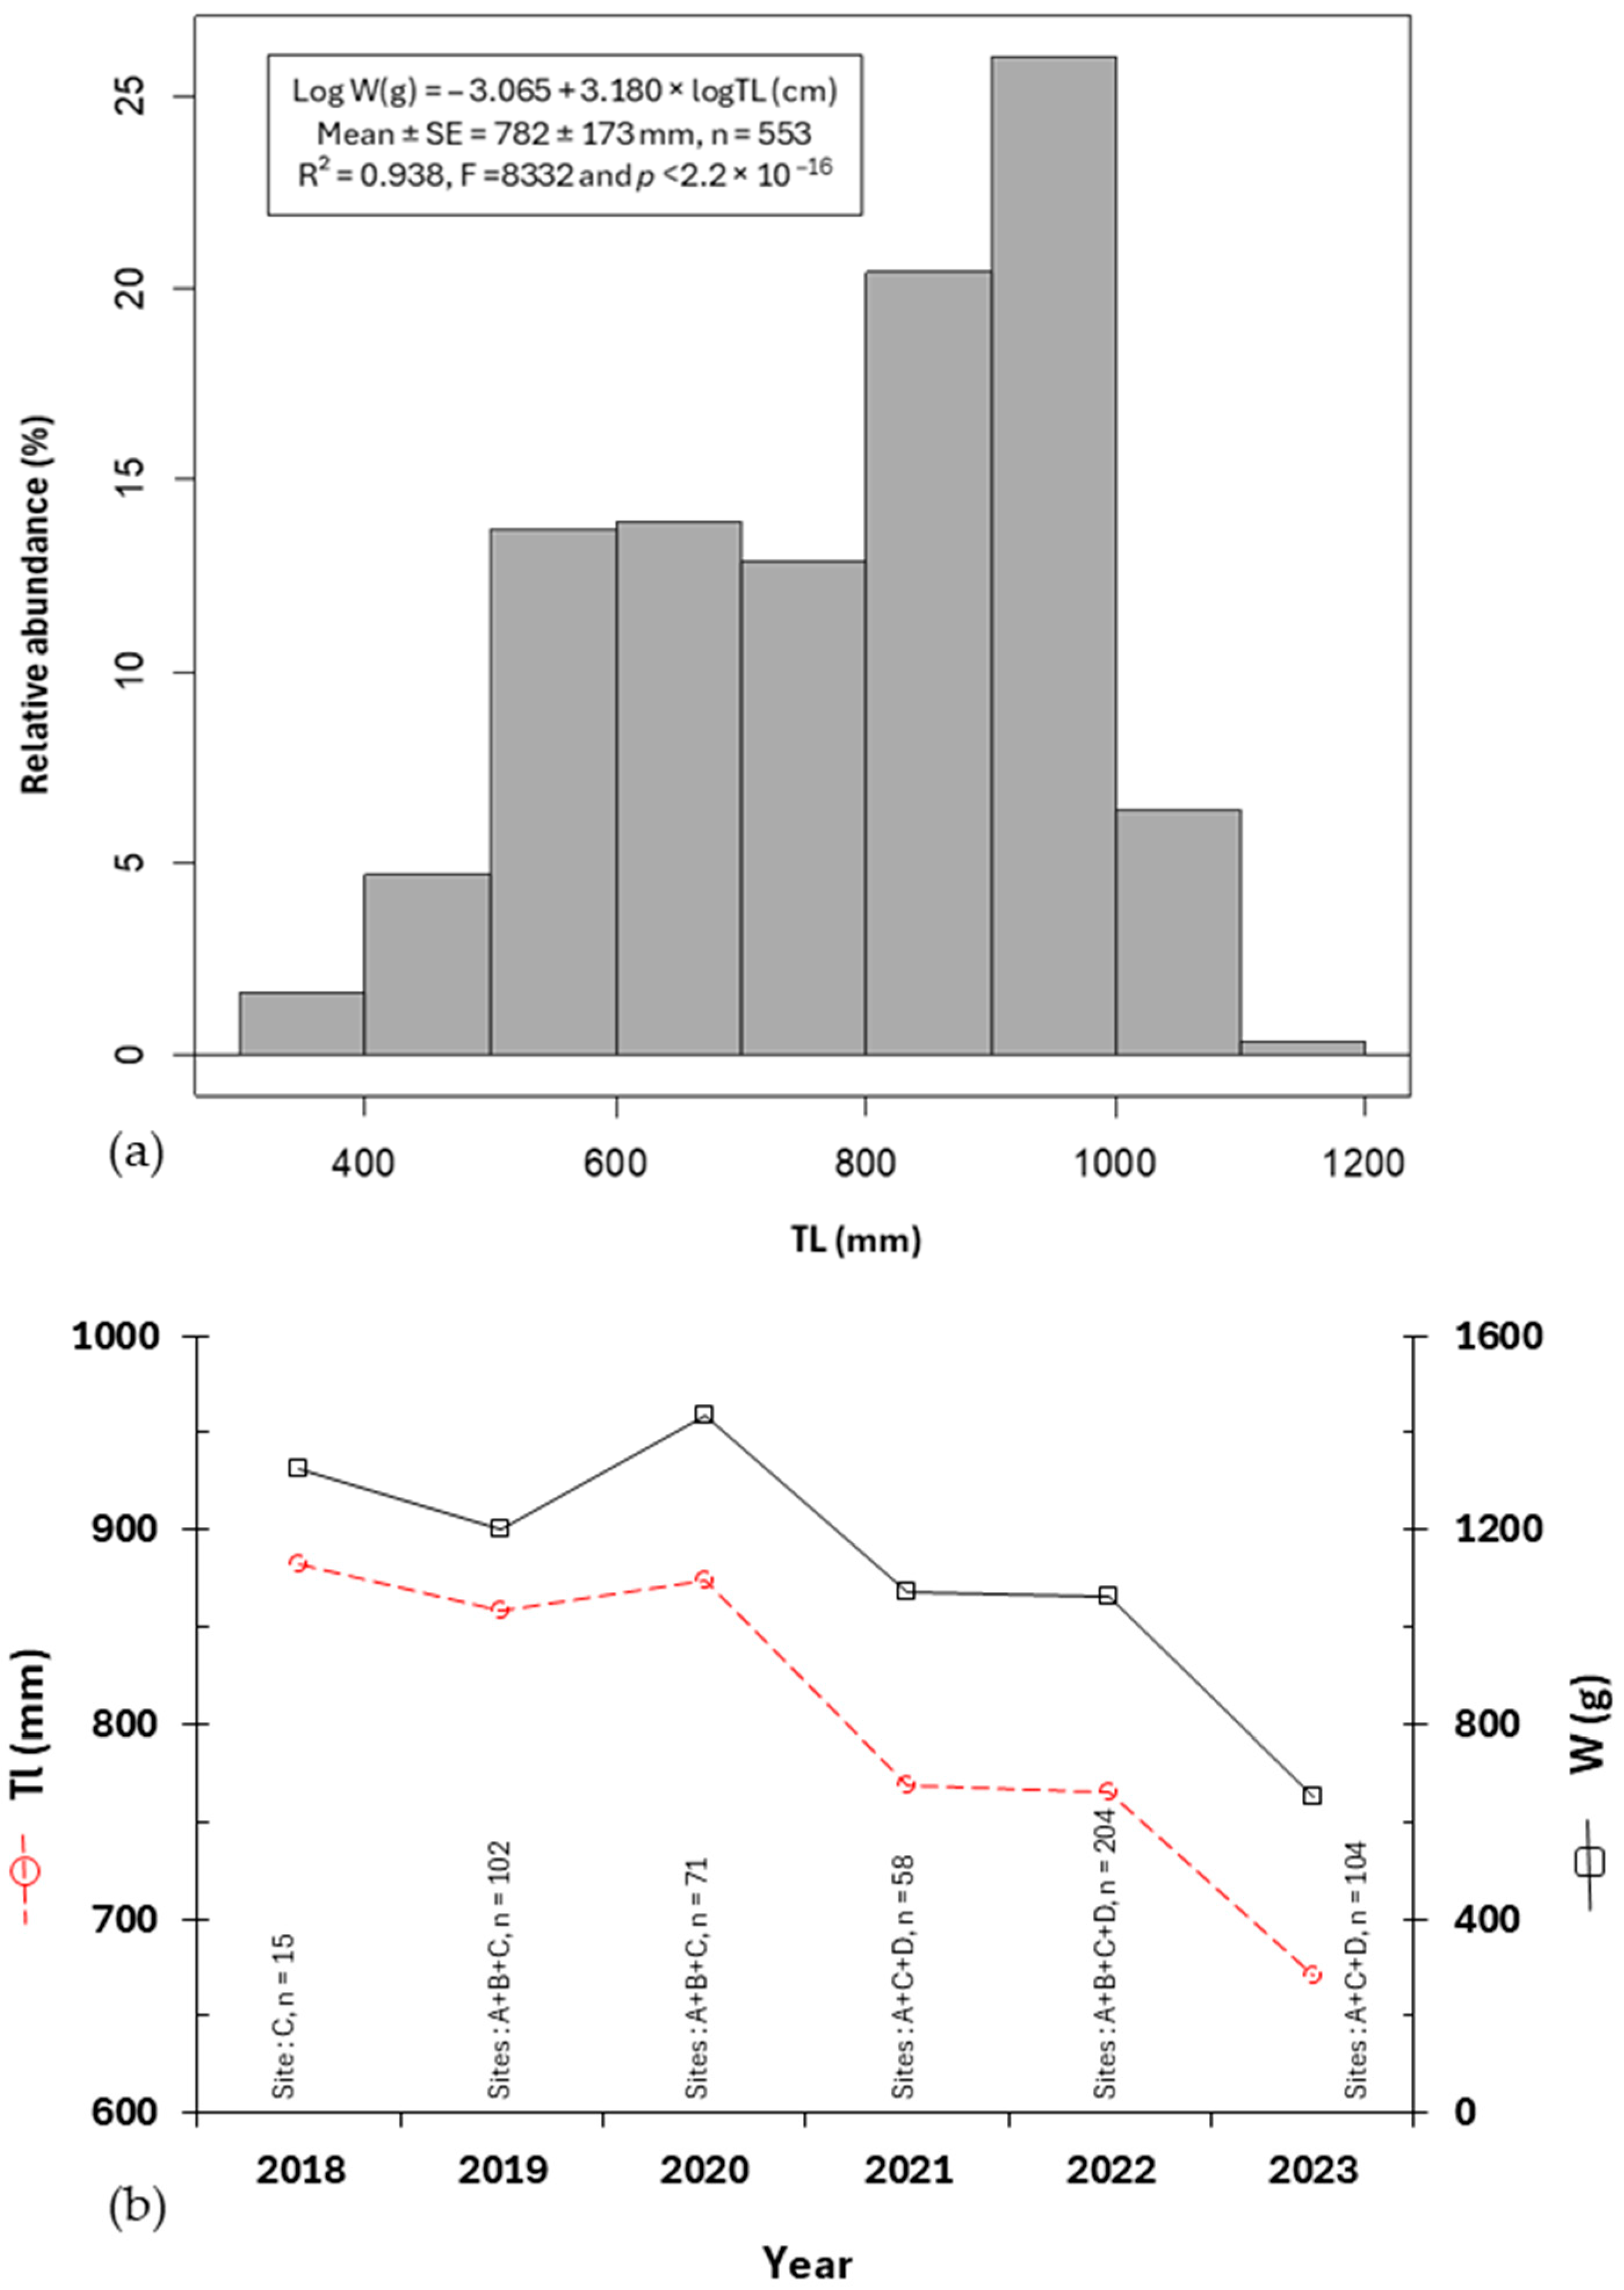
From 2018 to 2023, n = 554 eels were caught and had a mean TL of 782 mm (range: 96.4% = 455–1115 mm and 100% = 344–1115 mm), which decreased over time (r = −0.929 with 95% CI = −0.992 to −0.476 and p = 7.430 × 10⁻³; Figure 4). The relation between TL and W was defined by the equation: log W (g) = −3.065 + 3.180 log TL (cm) (R2 = 0.938; p < 2.2 × 10⁻¹⁶ and n = 553) and varied between sites. At site A, it was described by the formula: log W (g) = −3.066 + 3.187 log TL (cm) (R2 = 0.952; p < 2.2 × 10⁻¹⁶ and n = 223). At site B, the formula was: log W (g) = −3.256 + 3.217 log TL (cm) (R2 = 0.930; p < 2.2 × 10⁻¹⁶ and n = 84). For site C, the formula was: log W (g) = −3.204 + 3.245 log TL (cm) (R2 = 0.925; p < 2.2 × 10⁻¹⁶ and n = 174). Finally, at site D, this relationship was shown by the formula: log W (g) = −3.040 + 3.163 log TL (cm) (R2 = 0.909; p < 2.2 × 10⁻¹⁶ and n = 69).
MII male silver eels were extremely rare (n = 2, representing 0.04% of the eels caught) (Figure 5). They were found only at sites A and D and had a mean TL of 415 mm (range = 380–450 mm). From the SI to FIV stages, eels increased in TL at each sampling site. However, the stages of 17 eels (S?, 536 mm, 344–743 mm) were missing because they were not assessed. During the year, eels were caught each month. The TL of eels caught from September to December tended to be larger (mean TL = 828 mm, range = 776–890 mm), and individuals were predominantly silver eels (silver-to-yellow eel ratio >1). It should be noted that the data for March are missing because the traps were not set during that month.

3.3. Increment TL of Recaptured Eels

The daily increment in TL averaged 0.221 mm day−1 (n = 40) (Table 5). It varied from 0.009 (class for tagging/recapture time interval, n and silvering stage composition: 7–12 months, 2FIV) to 0.614 mm day−1 (1–6 months, 1FIII) (Table 5). This increment decreased significantly with TL (r = −0.615 with 95% CI = −0.777 to −0.375 and p = 2.437 × 10⁻⁵). Conversely, there was no increase in TL during the tagging/recapture time interval classes of <1 month (2FII + 2FIV) and 1–6 months (1FII + 1FIV). Between silvering phases, FI individuals (mean values = 0.551 mm day−1 and 505 mm in TL) grew faster in size, but they were smaller at tagging compared to FIV eels (0.096 mm day−1 and 933 mm) (KW test, range: df = 3, χ2; = 9.681–29.324, p = 0.022 to 1.914 × 10⁻⁶). In contrast, the sampling sites did not significantly affect the daily TL increment (KW test, p > 0.05). Most eels (n = 37, 92.5%) were captured and recaptured at the same site. Three FIII eels (7.5%) changed their capturing sites. Two of them (600 mm, 0.138–0.614 mm day−1) showed downstream-oriented movement from site D (the most upstream site) to A (the most downstream site). One eel (687 mm, 0.019 mm day−1) moved upstream from site C to D.

3.4. Monthly Pattern of Catching Eels

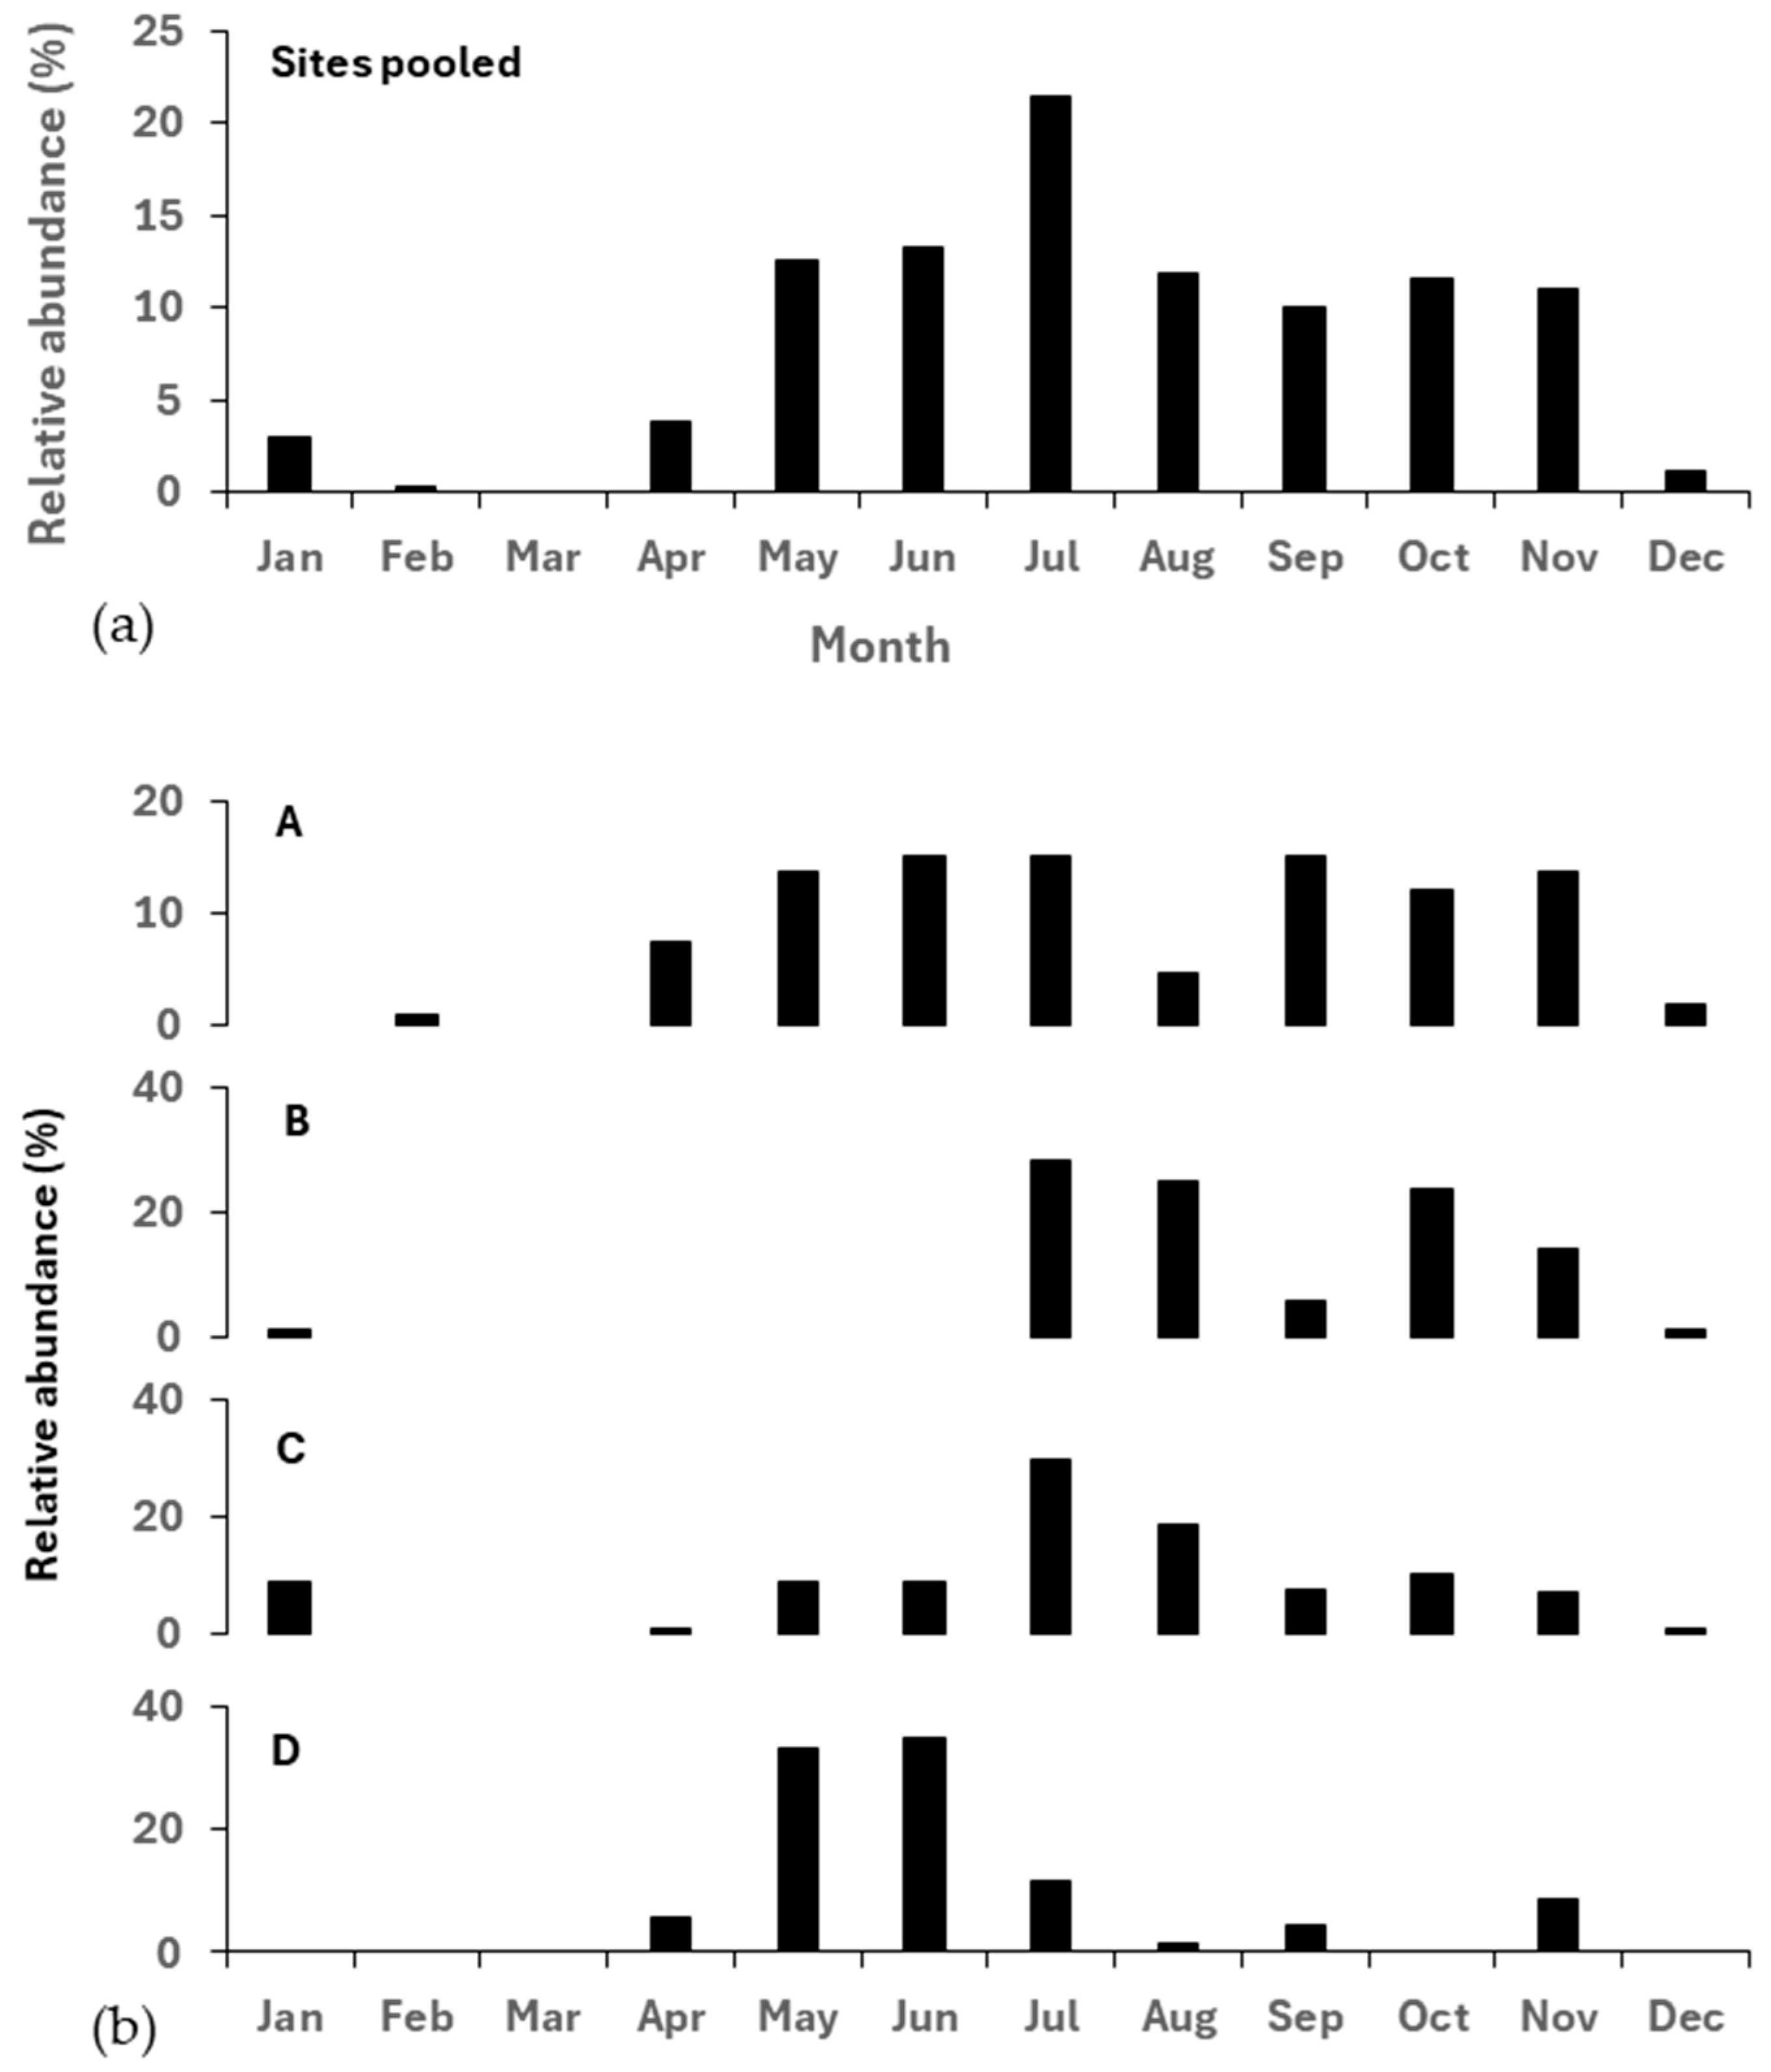
Eels were caught every month when traps were set, with a peak of 21.4% in July (Figure 6). However, most eels were caught from April to September (72.9%, χ2 tests, p < 0.00001). From October to December, the catch amount reached 23.8%. The maximum number of eels caught per trap monitoring day varied between sites. This ranged from 4 (at site B on 9 July 2020 and 28 July 2022) to 15 individuals (at site C on 1 January 2018). It was 10 at site A, and 12 at site D, observed on the same date (25 May 2022).

3.5. Demographic Parameters of Eels

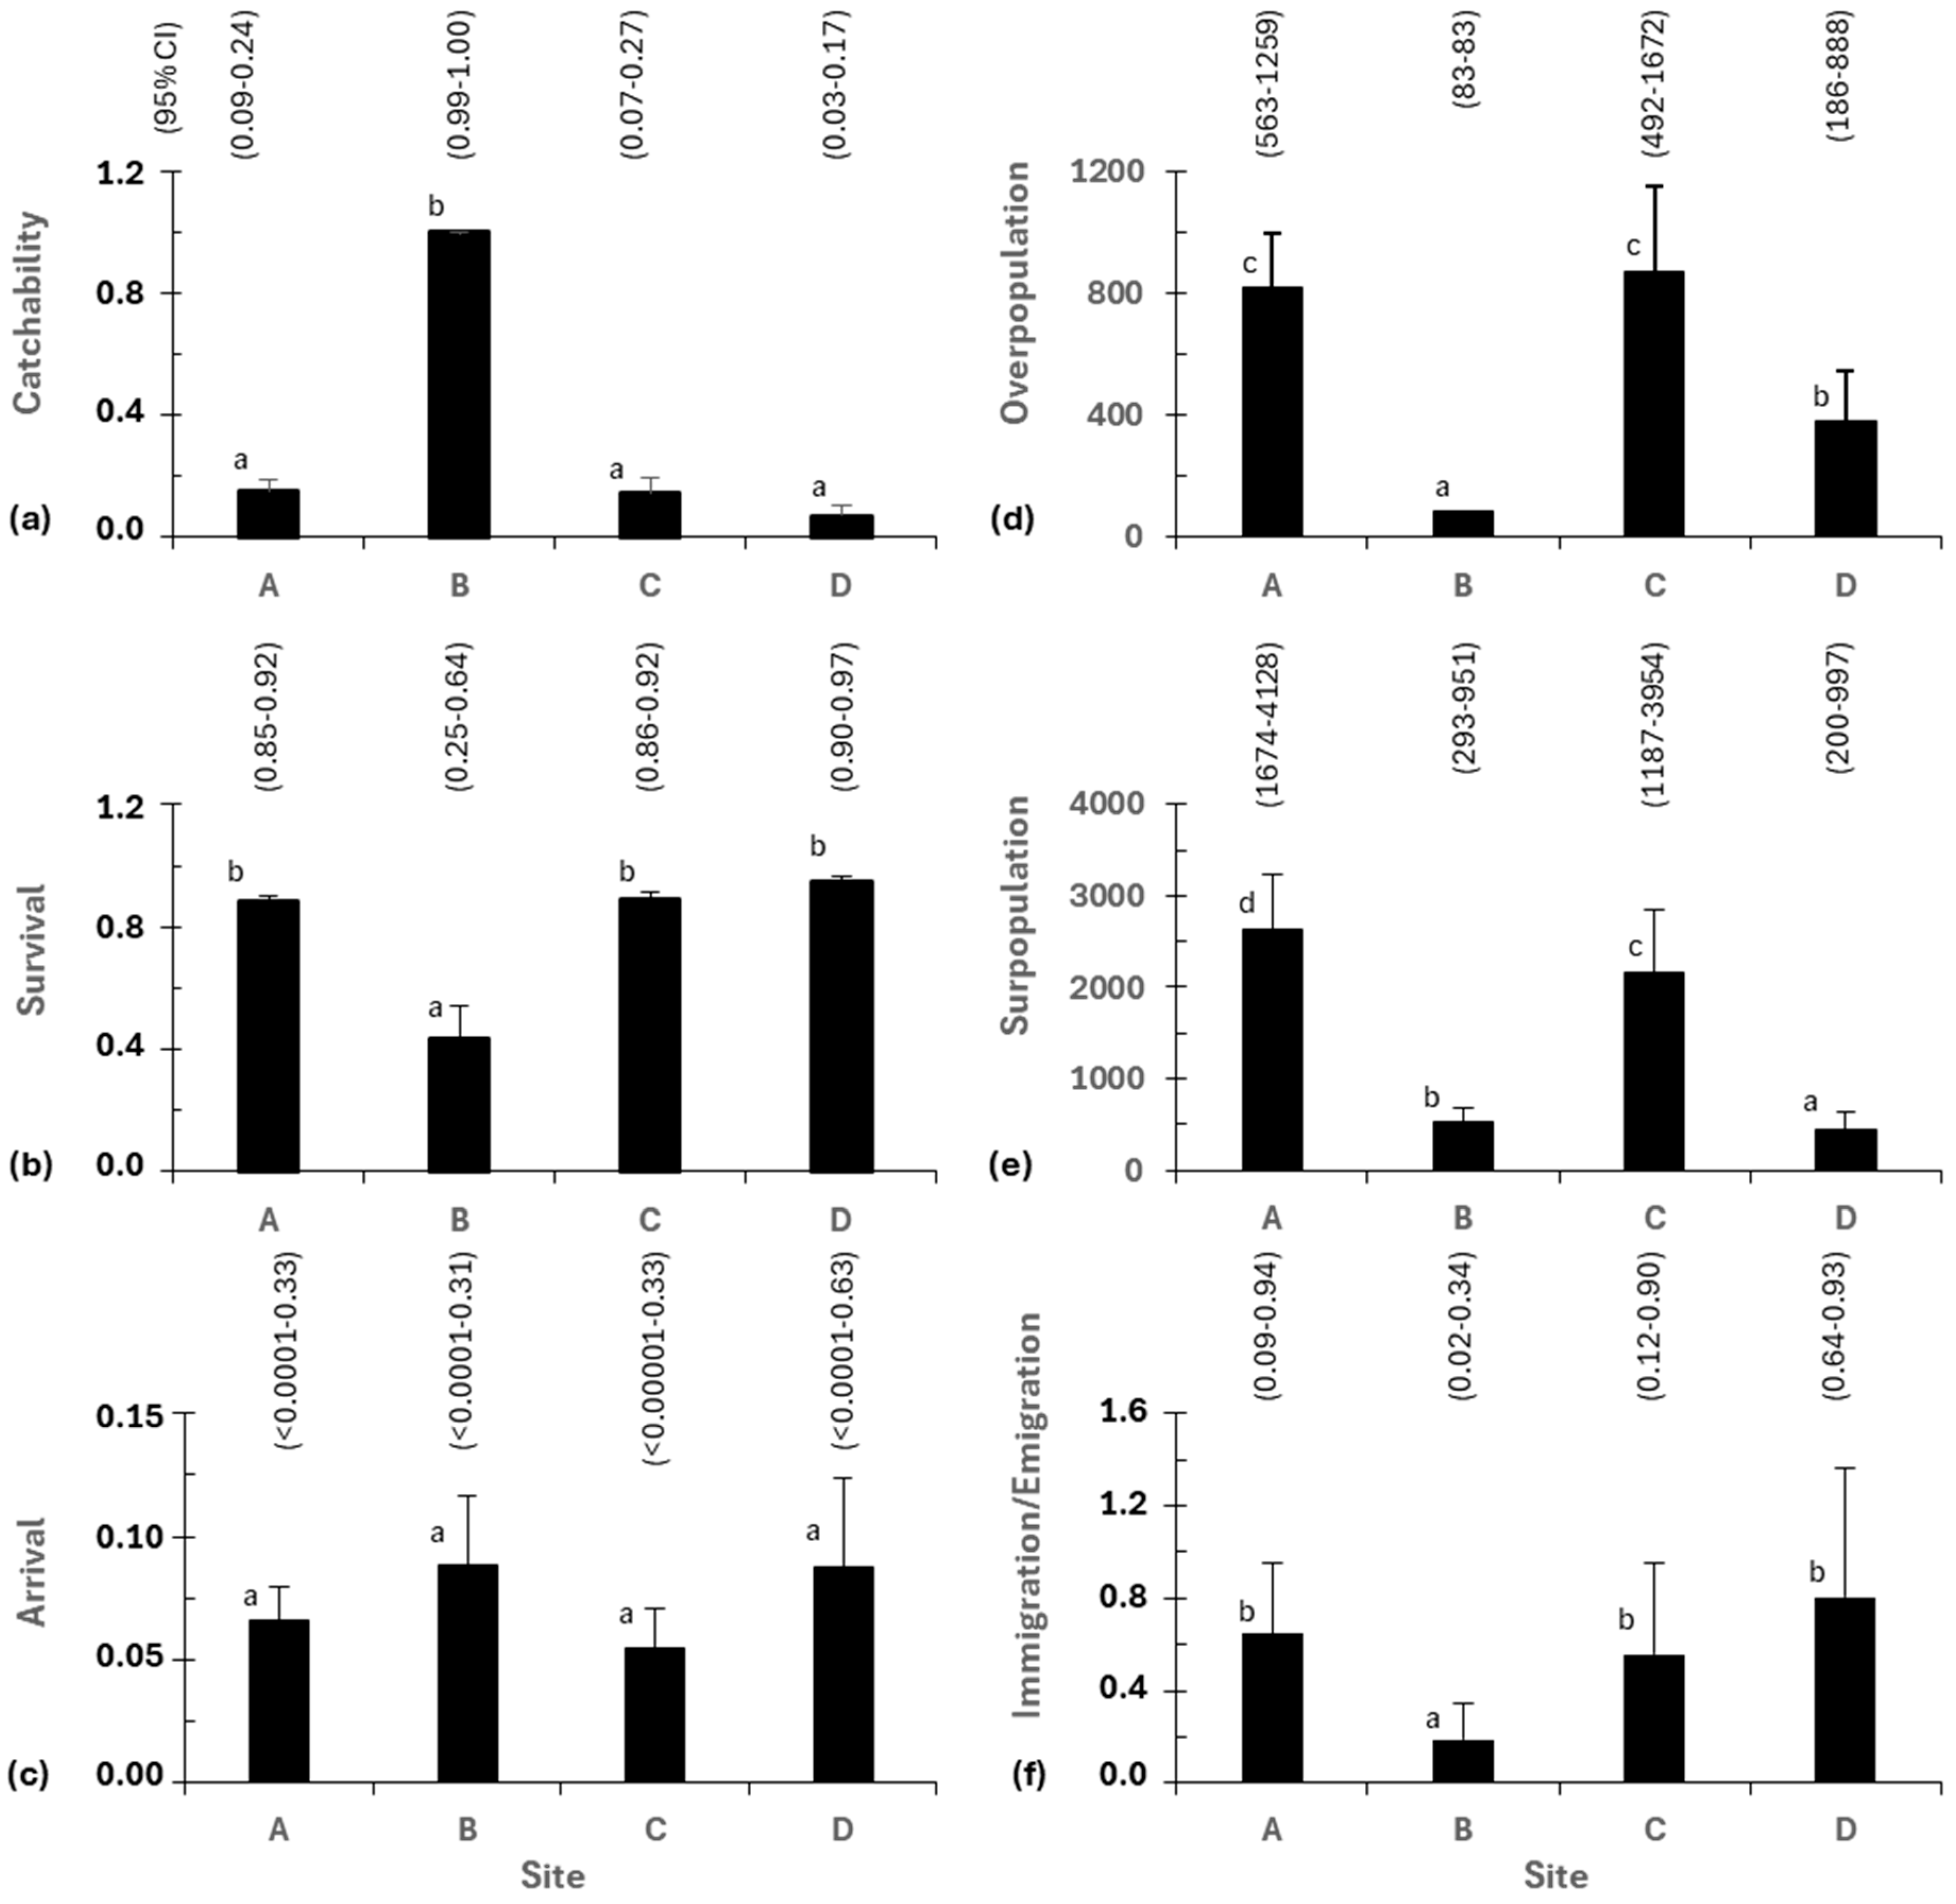
The magnitude of demographic parameters assessed showed similarities between sites for arrival probability (mean range = 0.06–0.09; Figure 7). However, this varied significantly between sites for survival, catchability, overpopulation, superpopulation, and immigration-to-emigration (I-to-E) net ratio. Site B had the lowest weekly survival rate (estimate = 0.435, FE test, p < 0.0001), the lowest I-to-E net ratio (mean = 0.188 and upper limit 95% CI = 0.34, KW test: df = 3, χ2 = 23.788, p = 3.682 × 10⁻⁵, Dunn test, p < 0.01) and the lowest overpopulation (estimate = 83) (χ2; tests, p < 2.2 × 10⁻¹⁶). The estimated superpopulation was also low at site B (estimate = 528) and D (447) (χ2 tests, p < 0.001). At sites A, C, and D, survival was greater than 0.870, and the I-to-E net ratio ranged from 0.555 to 0.805 with an upper limit of 95% CI ≥ 0.90. At these last three sites, the weekly catchability was low (estimate range = 0.070–0.152), while it peaked at site B (1.000; FE test, p < 2.2 × 10⁻¹⁶). Eel populations were more numerous at site A (overpopulation and superpopulation, estimate = 821 and 2629) and site C (869 and 2167) than at sites B and D (χ2 tests, p < 2.2 × 10⁻¹⁶).

4. Discussion

We successfully carried out fish sampling using fyke nets installed directly in deep and large river-type aquatic ecosystems. This is something that has never been done before in the Belgian Meuse. Our experimental system enabled the inventory of biodiversity in the depths of the sites studied and for the targeted species, highlighting growth, sex ratio, silvering stage, catch periodicity, and demographic parameters.
With 79% of the days of monitoring the traps exhibiting at least one captured eel, it can be concluded that our experimental setup is highly effective for catching eels. This efficiency was also shown by the catch of 16 different fish species and 2 crustacean species as well as the wide size ranges of the eels. The overall biodiversity mentioned in this study remains low compared to the biodiversity composed of 35 fish species reported at site A [50]. Certainly, the short duration, the chosen deep environment, and the fyke nets placed toward the banks upstream of the obstacles are all elements retained in this study. These would be very selective in favour of benthic species as well as eurytopic and limnophilic species. Furthermore, the fish community at the four sites was mainly characterised by the presence of a eurytopic species (the eel) and a limnophilic species (the round goby), the extreme rarity of rheophilic species, and the proliferation of two allochthonous limnophilic species: the round goby at all sites and the catfish at site D. The success of the eel catch may be related to the benthic nature of its movements, predominantly in routes close to the riverbanks in dark and often turbid conditions that reduce visual cues and result in positive thigmotactic behaviour [56,57,58].
Inter-site growth was good, as indicated by positive allometric growth (b, range = 3.187–3.245), reflecting thick-bodied eels and aquatic environments optimal for growth. These favourable growth conditions were also revealed by high TL increments (mean = 81 mm.year−1, up to 224 mm.year−1) observed in the tagged eels recaptured. These growth performances would be within the upper limits of growth values reported in European aquatic ecosystem behaviour [38,45,59,60]. Similarly, with more than 96% of eels caught having a TL >455 mm, the stocks of the sites studied could be predominantly female. High growth performance and female-predominant individuals are good indicators of good quality eel stocks in inland waters. However, their mean TL decreased over time, contrasting the time-increasing mean TL of wild eels entering site A by ascending the Meuse from the North Sea via the Dutch Meuse [13]. A 20-year movement study of these wild eels has revealed a long-term decline in abundance that is now described as being far too insufficient to colonise the Meuse upstream [13,14,35]. Within the framework of the Eel Management Plan implementation for Belgium accepted by the EU in January 2010, conservation measures to restore eel stocks through glass eel restocking were undertaken in 2011–2017 in the Meuse tributaries and in 2018–2019 in several Walloon rivers, including the Meuse, which received 104 kg of imported glass eels released in 66 sites in 2018 and 101 kg in 80 sites in 2019 [9,39]. Undoubtedly, the decreasing trend observed in the TL of eels could be attributed to the restocked-origin eels that were caught during our study.
The catch phenology showed that eels were caught throughout the year in their diversity of life stages and sizes as well as types of migratory movement behaviours (resident, ascending, and descending individuals) in the Meuse. Other species were also captured along with eels. This reflects that the Meuse, along its entire length and in the sites studied, contains good dwelling habitats and growing environments for several fish species. It also benefits migratory routes for many fish species that ascend as well as descend the Meuse, depending on the period of their life cycle, in unfragmented river conditions. These movements would be particularly spectacular in diadromous species, mainly the eel, whose juveniles, yellow eels, showed high catch in the spring and summer under the influence of rising water temperatures. In contrast, the catch of subadults, silver eels, peaked in autumn in October–December, as revealed by silver-to-yellow stage ratios ≥2, which would be most often associated with episodes of high flow and high turbidity. This migratory phenology is consistent with the results reported by other studies [14,60,61,62,63,64]. In terms of species management, the period for catching a specific life stage of eel should be guided by our findings, suggesting the organisation of capture operations for juveniles mainly from April to September and those for subadults from October to December.
Similarities in the trends of trap control results (e.g., counted numbers) and those of estimates (e.g., overpopulations and superpopulations) were observed during eel quantification. Eels were significantly more numerous at site A, the most downstream site, compared to the most upstream, site D. This could suggest the existence of a down-to-upstream decreasing demographic gradient, as already reported in other studies, which was explained by the low recruitment of wild eels and the loss of their colonisation behaviour [12,14,16]. Similarly, the lower number of trapping days at site D could favour this trend. The observed and estimated stocks are low compared to the results of historical eel stocks previously reported in our study area over the past decades, confirming, therefore, the drastic decline of local stocks and the need to apply conservation measures in favour of the species [13,35,40]. In contrast, this gradient was not seen in entry rate, catchability, survival, and I-to-E net ratio at the sites that were studied. At site B, survival was low, while catchability and net emigration were high. This observation could be related to the noise pollution and hydraulic disturbance that this site experienced due to the work expanding the ship lock to facilitate the passage of large boats. This work lasted 4 years, from the summer of 2018 to the summer of 2022. At sites A, C, and D, the weekly survival was >0.870 (up to 0.974 for 95% CI upper limit), translating to a monthly survival >0.573 (up to 0.900). This monthly survival was lower than those estimated upstream of the Belgian Meuse basin in brooks (>0.900: [45,65]) and Meuse tributaries (>0.810: [38]). This confirms the literature’s findings that eel survival is low downstream of the watersheds due to the higher risk of predation. However, the reduced survival rate is compensated by a faster growth rate, which is beneficial for future offspring recruitment [45,66]. These three sites had high habitat quality and carrying capacity, with a high availability of good cryptic shelters and a high abundance of diverse prey. However, they could harbour large populations of invasive and predatory sympatric species such as catfish, increasing predation and competition for more productive habitats. This affects the survival of eels. The pressure of these negative factors is low upstream of the Meuse catchment. The up-to-downstream resemblance observed in entry rates and I-to-E net ratios could be explained by operations to support local eel stocks through restocking using imported glass eels in Meuse tributaries as well as in the Meuse itself [9,39]. The estimated catchability (mean = 12.3%, up to 27.3% for 95% CI) was found to be superior to conventional mark/recapture approaches using fishways and trapping systems to catch ascending eels [35,40,67,68]. This would suggest the efficiency of our sampling method, which caught eels as they moved upstream after a U-turn in front of the screens of hydropower facilities [41]. Compared to shallow ecosystems investigated upstream in the Meuse basin (brooks and tributaries), the catchability in this study was inferior to those assessed using the same Jolly–Seber model with data collected by capture/mark/recapture methods through electrofishing techniques [38,45,65].

5. Conclusions

The sampling method used was easy to implement, cheap, and less risky in the turbine flow conditions of hydropower facilities. This allowed successful sampling of fish directly in deep and large freshwater ecosystems, where data are rare [13,14,35,40]. It highlighted the biodiversity of the river and the bioecology and demography of the target species, the eel. However, its main limitation was observed during very high flow conditions, which often occurred at the peak of seaward migration of silver eels, when eels moved downstream, mainly above dams. In terms of the eel local stock and habitat management, the findings of this study suggest the use of a well-implemented glass eel restocking programme in the Meuse to improve the declining local stocks [37,38,45,69,70]. For greater effectiveness, restocking actions should be performed by spreading young eels across several sites selected along the longitudinal river profile, with the organisation of annual restocking monitoring as well as the quality of restocked eels [45,71,72,73]. The restoration of habitats such as seagrass beds, riparian roots, shelters, substrates, and access to lateral connections and wetlands in the most altered river reaches (canals, derivations) should be conducted according to ecological principles [37,38]. It is also necessary to limit noise pollution and hydraulic disturbance in rivers and to choose suitable periods of the year outside the peak seasons of both up and downstream migrations to carry out essential repair and maintenance works such as dredging, cleaning, mowing, and navigation lock enlargement. The species is diadromous; therefore, particular attention should also be paid to the creation/improvement of safe routes for up and downstream migrations at dams [74,75]. Dam removal might be difficult locally, socially, and economically and might not be free of negative collateral effects, such as biological invasions, toxic sediment discharges, and sudden changes in hydromorphology [76,77,78,79]. Like other sampling techniques, our device fails to catch all eels, both migratory and resident individuals. It can, therefore, be used in conjunction with other trapping systems installed on up and downstream migration facilities, such as bypass rivers and fish passes, to refine our biological knowledge of the species [80,81]. Another technical approach would be to consider increasing the number of fyke net lines.

Author Contributions

Conceptualisation, B.N.M., M.O. and D.S.; Methodology, B.N.M., M.O., M.L., D.C. and D.S.; Software, M.O.; Validation, B.N.M., M.O., M.L., D.C. and D.S.; Formal analysis, B.N.M. and M.O.; Investigation, M.L., D.C. and D.S.; Resources, M.L., D.C. and D.S.; Data curation, M.L., D.C. and D.S.; Writing—original draft, B.N.M. and M.O.; Writing—review and editing, B.N.M., M.O. and D.S.; Supervision, M.O.; Project administration, D.S.; Funding acquisition, D.S. All authors have read and agreed to the published version of the manuscript.

Funding

The research was funded by Profish Technology and financially supported by the Life4Fish project, grant number LIFE4FISH No. LIFE16 NAT/BE/000807 and the Walloneel project, research convention N° 8504 supported by the Walloon Region, Research Department.

Institutional Review Board Statement

Not applicable.

Informed Consent Statement

Not applicable.

Data Availability Statement

The study data are available upon request to the designated author.

Acknowledgments

The authors would like to express their deepest gratitude to the Editor-in-Chief, anonymous reviewers for their insightful feedback, which greatly enhanced the overall content of this paper. The authors also thank Delphine Goffaux for her punctual support during fisheries, and Navigation Authorities of the Walloon Region for the navigation access in restricted areas. Finally, we thank the Fisheries Authority of the Walloon Region for its authorisation to catch and tag wild eels from the River Meuse.

Conflicts of Interest

Authors Marc Lerquet Dylan Colson and Damien Sonny were employed by the company Profish Technology SA. The remaining authors declare that the research was conducted in the absence of any commercial or financial relationships that could be construed as a potential conflict of interest.

References

  1. Jacoby, D.M.P.; Casselman, J.M.; Crook, V.; DeLucia, M.-B.; Ahn, H.; Kaifu, K.; Kurwie, T.; Sasal, P.; Silfvergrip, A.M.C.; Smith, K.G.; et al. Synergistic patterns of threat and the challenges facing global anguillid eel conservation. Glob. Ecol. Conserv. 2015, 4, 321–333. [Google Scholar] [CrossRef]
  2. Ragauskas, A.; Butkauskas, D. The formation of the population genetic structure of the European eel Anguilla anguilla (L.): A short review. Ekologija 2013, 59, 143–154. [Google Scholar] [CrossRef]
  3. Jellyman, D.J. An enigma: How can freshwater eels (Anguilla spp.) be such a successful genus yet be universally threatened? Rev. Fish. Biol. Fisheries 2022, 32, 701–718. [Google Scholar] [CrossRef]
  4. Moriarty, C. The Yellow Eel. In Eel Biology; Aida, K., Tsukamoto, K., Yamauchi, K., Eds.; Springer: Tokyo, Japan, 2003; pp. 89–105. [Google Scholar]
  5. Tesch, F.W.; Thorpe, J.E. The Eel, 3rd ed.; Blackwell Science: Oxford, UK, 2003. [Google Scholar]
  6. Daverat, F.; Limburg, K.; Thibault, I.; Shiao, J.; Dodson, J.; Caron, F.; Tzeng, W.; Iizuka, Y.; Wickström, H. Phenotypic plasticity of habitat use by three temperate eel species, Anguilla anguilla, A. japonica and A. rostrata. Mar. Ecol. Prog. Ser. 2006, 308, 231–241. [Google Scholar] [CrossRef]
  7. Harrod, C.; Grey, J.; McCarthy, T.K.; Morrissey, M. Stable isotope analyses provide new insights into ecological plasticity in a mixohaline population of European eel. Oecologia 2005, 144, 673–683. [Google Scholar] [CrossRef]
  8. Denis, J.; Rabhi, K.; Le Loc’h, F.; Lasram, F.B.R.; Boutin, K.; Kazour, M.; Diop, M.; Gruselle, M.-C.; Amara, R. Role of estuarine habitats for the feeding ecology of the European eel (Anguilla anguilla L.). PLoS ONE 2022, 17, e0270348. [Google Scholar] [CrossRef]
  9. ICES. Report of the Joint EIFAAC/ICES/GFCM Working Group on Eels (WGEEL) and Country Reports 2017–2018; ICES Scientific Reports; ICES Advisory Committee: Gdańsk, Poland, 2018. [Google Scholar]
  10. Dekker, W. The history of commercial fisheries for European commenced only a century ago. Fish. Manag. Ecol. 2019, 26, 6–19. [Google Scholar] [CrossRef]
  11. ICES. Joint EIFAAC/ICES/GFCM Working Group on Eels, and Country Reports 2018–2019; Walker, A., Ed.; ICES Scientific Reports; ICES: Copenhagen, Denmark, 2019. [Google Scholar]
  12. Ibbotson, A.; Smith, J.; Scarlett, P.; Aprahamian, M.W. Colonisation of freshwater habitats by the European eel Anguilla anguilla. Freshw. Biol. 2002, 47, 1696–1706. [Google Scholar] [CrossRef]
  13. Nzau Matondo, B.; Ovidio, M. Dynamics of upstream movements of the European eel Anguilla anguilla in an inland area of the river Meuse over the last 20 years. Environ. Biol. Fish 2016, 99, 223–235. [Google Scholar] [CrossRef]
  14. Nzau Matondo, B.; Ovidio, M. Decreased stock entering the Belgian Meuse is associated with the loss of colonisation behaviour in yellow-phase European eels. Aquat. Living Resour. 2018, 31, 7. [Google Scholar] [CrossRef]
  15. ICES. Joint EIFAAC/ICES/GFCM Working Group on Eels (WGEEL), and Country Reports 2019–2020; Pohlmann, J.-D., Ed.; ICES Scientific Reports; ICES: Copenhagen, Denmark, 2020. [Google Scholar]
  16. Imbert, H.; Labonne, J.; Rigaud, C.; Lambert, P. Resident and migratory tactics in freshwater European eels are size-dependent. Freshw. Biol. 2010, 55, 1483–1493. [Google Scholar] [CrossRef]
  17. Bonhommeau, S.; Chassot, E.; Rivot, E. Fluctuations in European eel (Anguilla anguilla) recruitment resulting from environmental changes in the Sargasso Sea. Fish. Oceanogr. 2008, 17, 32–44. [Google Scholar] [CrossRef]
  18. Drouineau, H.D.; Castonguay, M.; Mateo, M.; Rochard, E.; Verreault, G.; Yokouchi, K.; Lambert, P. Freshwater eels: A symbol of the effects of global change. Fish. Fish. 2018, 19, 903–930. [Google Scholar] [CrossRef]
  19. Friedland, K.D.; Miller, M.J.; Knights, B. Oceanic changes in the Sargasso Sea and declines in recruitment of the European eel. ICES J. Mar. Sci. 2007, 64, 519–530. [Google Scholar] [CrossRef]
  20. Feunteun, E. Management and restoration of European eel population (Anguilla anguilla): An impossible bargain. Ecol. Eng. 2002, 18, 575–591. [Google Scholar] [CrossRef]
  21. Robinet, T.; Feunteun, E. Sublethal effects of exposure to chemical compounds: A cause for the decline in Atlantic eels? Ecotoxicology 2002, 11, 265–277. [Google Scholar] [CrossRef]
  22. Haenen, O.L.M.; Mladineo, I.; Konecny, R.; Yoshimizu, M.; Groman, D.; Munoz, P. Diseases of eels in an international perspective: Workshop on eel diseases at the 15th international conference on the diseases of fish and shellfish, Split, Croatia, 2011. Bull.Eur. Assoc. Fish Pathol. 2012, 32, 109–115. [Google Scholar]
  23. Muñoz, P.; Barcala, E.; Peñalver, J.; Romero, D. Can inorganic elements affect herpesvirus infections in European eels? Environ. Sci. Pollut. Res. 2019, 26, 35266–35269. [Google Scholar] [CrossRef]
  24. Delrez, N.; Zhang, H.; Lieffrig, F.; Mélard, C.; Farnir, F.; Boutier, M.; Donohoe, O.; Vanderplasschen, A. European eel restocking programs based on wild-caught glass eels: Feasibility of quarantine stage compatible with implementation of prophylactic measures prior to scheduled reintroduction to the wild. J. Nat. Conserv. 2021, 59, 125933. [Google Scholar] [CrossRef]
  25. Belpaire, C.G.J.; Goemans, G.; Geeraerts, C.; Quataert, P.; Parmentier, K.; Hagel, P.; De Boer, J. Decreasing eel stocks: Survival of the fattest? Ecol. Freshw. Fish 2009, 18, 197–214. [Google Scholar] [CrossRef]
  26. Pedersen, M.I.; Rasmussen, C.H. Yield per recruit from stocking two different sizes of eel (Anguilla anguilla) in the brackish Roskilde Fjord. ICES J. Mar. Sci. 2016, 73, 158–164. [Google Scholar] [CrossRef]
  27. Pike, C.; Crook, V.; Gollock, M. Anguilla anguilla. The IUCN Red List of Threatened Species 2020: E.T60344A152845178. 2020. Available online: https://www.fishsec.org/app/uploads/2022/11/200709-Assessment-10.2305_IUCN.UK_.2020-2.RLTS_.T60344A152845178.en_.pdf (accessed on 23 October 2024).
  28. CITES. Appendix II of the Convention on International Trade in Endangered Species of Wild Fauna and Flora. Appendices I, II and III; Annual Report of the Secretariat; CITES: Geneva, Switzerland, 2024; 79p. [Google Scholar]
  29. ICES. Report of the 2012 Session of the Joint EIFAAC/ICES Working Group on Eels (WGEEL) and Country Reports 2011–2012; ICES Scientific Report; ICES: Copenhagen, Denmark, 2012. [Google Scholar]
  30. Panfili, J.; Darnaude, A.; Lin, Y.; Chevalley, M.; Iizuka, Y.; Tzeng, W.; Crivelli, A. Habitat residence during continental life of the European eel Anguilla anguilla investigated using linear discriminant analysis applied to otolith Sr:Ca ratios. Aquat. Biol. 2012, 15, 175–185. [Google Scholar] [CrossRef]
  31. Tahri, M.; Panfili, J. 13-year population survey of the critically endangered European eel in the southern Mediterranean region (Algeria). J. Fish Biol. 2023, 102, 1492–1502. [Google Scholar] [CrossRef] [PubMed]
  32. Bouchard, C.; Drouineau, H.; Lambert, P.; Boutron, O.; Nicolas, D. Spatio-temporal variations in glass eel recruitment at the entrance pathways of a Mediterranean delta. ICES J. Mar. Sci. 2022, 79, 1874–1887. [Google Scholar] [CrossRef]
  33. Baras, E.; Jeandrain, D.; Serouge, B.; Philippart, J.C. Seasonal variations in time and space utilization by radio-tagged yellow eels Anguilla anguilla (L.) in a small stream. Hydrobiologia 1998, 371/372, 187–198. [Google Scholar] [CrossRef]
  34. Glova, G.J.; Jellyman, D.J. Size-related differences in diel activity of two species of juvenile eel (Anguilla) in a laboratory stream. Ecol. Freshw. Fish 2000, 9, 210–218. [Google Scholar] [CrossRef]
  35. Nzau Matondo, B.; Benitez, J.P.; Dierckx, A.; Philippart, J.C.; Ovidio, M. Assessment of the entering stock, migration dynamics and fish pass fidelity of European eel in the Belgian Meuse River. River Res. Appl. 2017, 33, 292–301. [Google Scholar] [CrossRef]
  36. Jacoby, D.M.P.; Piper, A.T. What acoustic telemetry can and cannot tell us about fish biology. J. Fish Biol. 2023, 1–25. [Google Scholar] [CrossRef]
  37. Nzau Matondo, B.; Backory, L.; Dupuy, G.; Amoussou, G.; Oumarou, A.A.; Gelder, J.; Renardy, S.; Benitez, J.-P.; Dierckx, A.; Dumonceau, F.; et al. Space and Time Use of European Eel Restocked in Upland Continental Freshwaters, a Long-Term Telemetry Study. Fishes 2023, 8, 137. [Google Scholar] [CrossRef]
  38. Nzau Matondo, B.; Fontaine, F.; Detrait, O.; Poncelet, C.; Vandresse, S.; Orban, P.; Gelder, J.; Renardy, S.; Benitez, J.P.; Dierckx, A.; et al. Glass Eel Restocking Experiments in Typologically Different Upland Rivers: How Much Have We Learned about the Importance of Recipient Habitats? Water 2023, 15, 3133. [Google Scholar] [CrossRef]
  39. Belpaire, C.; Breine, J.; Wichelen, J.V.; Nzau Matondo, B.; Ovidio, M.; Verhelst, P.; Teunen, L.; Bervoets, L.; Dumonceau, F.; Vlietinck, K. Report on the eel stock, fishery and other impacts in Belgium, 2020–2021. In Joint EIFAAC/ICES/GFCM Working Group on Eels (WGEEL), and Country Reports 2020–2021; ICES Scientific Reports; ICES: Copenhagen, Denmark, 2021. [Google Scholar]
  40. Baras, E.; Philippart, J.C.; Salmon, B. Estimation of migrant yellow eels stock in large rivers through the survey of fish passes: A preliminary investigation in the River Meuse (Belgium). In Stock Assessment in Inland Fisheries; Cowx, I.G., Ed.; Oxford Fishing News Books (Blackwell): London, UK, 1996; pp. 314–325. [Google Scholar]
  41. Behrmann-Godel, J.; Eckmann, R. A preliminary telemetry study of the migration of silver European eel (Anguilla anguilla L.) in the RiverMosel, Germany. Ecol. Freshw. Fish 2003, 12, 196–202. [Google Scholar] [CrossRef]
  42. Schwarz, C.J.; Arnason, A.N. A general methodology for the analysis of capture-recapture experiments in open populations. Biometrics 1996, 52, 860–873. [Google Scholar] [CrossRef]
  43. White, G.C.; Burnham, K.P. Program MARK: Survival estimation from populations of marked animals. Bird Study 1999, 46, 120–139. [Google Scholar] [CrossRef]
  44. Pledger, S.; Pollock, K.H.; Norris, J.L. Open Capture–Recapture Models with Heterogeneity: II. Jolly–Seber Model. Biometrics 2010, 66, 883–890. [Google Scholar] [CrossRef]
  45. Nzau Matondo, B.; Benitez, J.P.; Dierckx, A.; Rollin, X.; Ovidio, M. An evaluation of restocking practice and demographic stock assessment methods for cryptic juvenile European eel in upland rivers. Sustainability 2020, 12, 1124. [Google Scholar] [CrossRef]
  46. Tesch, F.W. Der Aal; Paul Parey: Hamburg/Berlin, Germany, 1983; 340p. [Google Scholar]
  47. Tesch, F.W. Suivi des anguilles argentées dans les rivières Weser et Elbe. Fischö Kologie 1994, 7, 47–59. [Google Scholar]
  48. Jonsson, N. Influence du débit, de la température de l’eau et de la lumière sur la migration des poissons dans les rivières. Nord. J. Freshw. Res. 1991, 66, 20–35. [Google Scholar]
  49. Coutant, C.C.; Whitney, R.R. Comportement des poissons en relation avec le passage à travers les turbines hydroélectriques: Une revue. Trans. Am. Fish. Soc. 2000, 129, 351–380. [Google Scholar] [CrossRef]
  50. Benitez, J.-P.; Dierckx, A.; Rimbaud, G.; Nzau Matondo, B.; Renardy, S.; Rollin, X.; Gillet, A.; Dumonceau, F.; Poncin, P.; Philippart, J.-C.; et al. Assessment of Fish Abundance, Biodiversity and Movement Periodicity Changes in a Large River over a 20-Year Period. Environments 2022, 9, 22. [Google Scholar] [CrossRef]
  51. Durif, C.; Dufour, S.; Elie, P. The silvering process of Anguilla anguilla: A new classification from the yellow resident to the silver migrating stage. J. Fish Biol. 2005, 66, 1025–1043. [Google Scholar] [CrossRef]
  52. Durif, C.; Guibert, A.; Elie, P. Morphological discrimination of the silvering stages of the European eel. In Eels at the Edge Science, Status, and Conservation Concerns; American Fisheries Society: Bethesda, MD, USA, 2009; pp. 103–111. [Google Scholar]
  53. R Development Core Team. R: A Language and Environment for Statistical Computing; R Foundation for Statistical Computing: Vienna, Austria, 2016; Available online: https://www.R-project.org/ (accessed on 12 September 2024).
  54. Fox, J. Using the R Commander: A Point-and-Click Interface for R; Chapman and CRC Press: Boca Raton, FL, USA, 2017. [Google Scholar]
  55. Harrell, F.E., Jr. Hmisc: Harrell Miscellaneous, Version 4.1-1; Cran: Washington, DC, USA, 2018; Available online: http://CRAN.Rproject.org/package=Hmisc (accessed on 12 September 2024).
  56. Russon, I.J.; Kemp, P.S.; Calles, O. Response of downstream migrating adult European eels (Anguilla anguilla) to bar racks under experimental conditions. Ecol. Freshw. Fish 2010, 19, 197–205. [Google Scholar] [CrossRef]
  57. Russon, I.J.; Kemp, P.S. Advancing multi-species fish passage: Behaviour of adult European eel (Anguilla anguilla) and brown trout (Salmo trutta) in response to accelerating flow. Ecol. Eng. 2011, 37, 2018–2024. [Google Scholar] [CrossRef]
  58. Piper, A.T.; Manes, C.; Siniscalchi, F.; Marion, A.; Wright, R.M.; Kemp, P.S. Response of seaward-migrating European eel (Anguilla anguilla) to manipulated flow fields. Proc. R. Soc. B 2015, 282, 1098. [Google Scholar] [CrossRef] [PubMed]
  59. Pedersen, M.I. Long-term survival and growth of stocked eel, Anguilla anguilla (L.), in a small eutrophic lake. Dana 2000, 12, 71–76. [Google Scholar]
  60. Mazel, V.; Charrier, F.; Legault, A.; Laffaille, P. Long-term effects of passive integrated transponder tagging (PIT tags) on the growth of the yellow eel (Anguilla anguilla (Linnaeus, 1758)). J. Appl. Ichthyol. 2013, 29, 906–908. [Google Scholar] [CrossRef]
  61. Sonny, D. La dévalaison des poissons dans la Meuse moyenne belge. Cah. Ethol. 2009, 22, 267. [Google Scholar]
  62. Deelder, C.L. Factors affecting the migration of the silver eel in Dutch inland waters. J. Cons. Int. Explor. Mer. 1954, 20, 177–185. [Google Scholar] [CrossRef]
  63. Vøllestad, L.A.; Jonsson, B.; Hvidsten, N.A.; Naesje, T.F. Experimental test of environmental factors influencing the seaward migration of European silver eels. J. Fish Biol. 1994, 45, 641–651. [Google Scholar] [CrossRef]
  64. Vøllestad, L.A.; Jonsson, B.; Hvidsten, N.A.; Naesje, T.F.; Haraldstad, Ø.; Ruud-Hansen, J. Environmental factors regulating the seaward migration of European silver eels (Anguilla anguilla). Can. J. Fish. Aquat. Sci. 1986, 43, 1909–1916. [Google Scholar] [CrossRef]
  65. Nzau Matondo, B.; Delrez, N.; Bardonnet, A.; Vanderplasschen, A.; Joaquim-Justo, C.; Rives, J.; Benitez, J.P.; Dierckx, A.; Séleck, E.; Rollin, X.; et al. A complete check-up of European eel after eight years of restocking in an upland river: Trends in growth, lipid content, sex ratio and health status. Sci. Total Environ. 2022, 807, 151020. [Google Scholar] [CrossRef]
  66. Jonsson, B.; Jonsson, N. Partial migration: Niche shift versus sexual maturation in fishes. Rev. Fish Biol. Fish. 1993, 3, 348–365. [Google Scholar] [CrossRef]
  67. Naismith, I.A.; Knights, B. Migrations of elvers and juvenile European eels, Anguilla anguilla L., in the River Thames. J. Fish Biol. 1988, 33, 161–175. [Google Scholar] [CrossRef]
  68. White, E.M.; Knights, B. Environmental factors affecting migration of the European eel in the Rivers Severn and Avon, England. J. Fish Biol. 1997, 50, 1104–1116. [Google Scholar] [CrossRef]
  69. Félix, P.M.; Costa, J.L.; Monteiro, R.; Castro, N.; Quintella, B.R.; Almeida, P.R.; Domingos, I. Can a restocking event with European (glass) eels cause early changes in local biological communities and its ecological status? Glob. Ecol. Conserv. 2020, 21, e00884. [Google Scholar] [CrossRef]
  70. Félix, P.M.; Costa, J.L.; Quintella, B.R.; Almeida, P.R.; Monteiro, R.; Santos, J.; Portela, T.; Domingos, I. Early settlement and growth of stocked European glass eels in a fragmented watercourse. Fish. Manag. Ecol. 2020, 28, 91–100. [Google Scholar] [CrossRef]
  71. Bonnineau, C.; Scaion, D.; Lemaire, B.; Belpaire, C.; Thomé, J.-P.; Thonon, M.; Leermaker, M.; Gao, Y.; Debier, C.; Silvestre, F.; et al. Accumulation of neurotoxic organochlorines and trace elements in brain of female European eel (Anguilla anguilla). Environ. Toxicol. Pharmacol. 2016, 45, 346–355. [Google Scholar] [CrossRef]
  72. Belpaire, C.; Geeraerts, C.; Evans, D.; Ciccotti, E.; Poole, R. The European eel quality database: Towards a pan-European monitoring of eel quality. Environ. Monit. Assess. 2011, 183, 273–284. [Google Scholar] [CrossRef]
  73. Marohn, L.; Jakob, E.; Hanel, R. Implications of facultative catadromy in Anguilla anguilla. Does individual migratory behaviour influence eel spawner quality? J. Sea Res. 2013, 77, 100–106. [Google Scholar] [CrossRef]
  74. Verhelst, P.; Buysse, D.; Reubens, J.; Pauwels, I.; Aelterman, B.; Van Hoey, S.; Goethals, P.; Coeck, J.; Tom Moens, T.; Mouton, A. Downstream migration of European eel (Anguilla anguilla L.) in an anthropogenically regulated freshwater system: Implications for management. Fish. Res. 2018, 199, 252–262. [Google Scholar] [CrossRef]
  75. Calles, O.; Elghagen, J.; Nyqvist, D.; Harbicht, A.; Nilsson, A. Efficient and timely downstream passage solutions for European silver eels at hydropower dams. Ecol. Eng. 2021, 170, 106350. [Google Scholar] [CrossRef]
  76. Podda, C.; Palmas, F.; Pusceddu, A.; Sabatini, A. When the Eel Meets Dams: Larger Dams’ Long-Term Impacts on Anguilla anguilla (L., 1758). Front. Environ. Sci. 2022, 10, 876369. [Google Scholar] [CrossRef]
  77. Rodeles, A.A.; Galicia, D.; Miranda, R. A Simple Method to Assess the Fragmentation of Freshwater Fish Meta-Populations: Implications for River Management and Conservation. Ecol. Indic. 2021, 125, 107557. [Google Scholar] [CrossRef]
  78. Milt, A.W.; Diebel, M.W.; Doran, P.J.; Ferris, M.C.; Herbert, M.; Khoury, M.L.; Moody, A.T.; Neeson, T.M.; Ross, J.; Treska, T.; et al. Minimizing Opportunity Costs to Aquatic Connectivity Restoration while Controlling an Invasive Species. Conserv. Biol. 2018, 32, 894–904. [Google Scholar] [CrossRef]
  79. Rahel, F.J. Intentional Fragmentation as a Management Strategy in Aquatic Systems. Bioscience 2013, 63, 362–372. [Google Scholar] [CrossRef]
  80. Larinier, M.; Travade, F. Downstream migration: Problems and facilities. Bull. Fr. Pêche Piscic. 1999, 364, 181–207. [Google Scholar] [CrossRef]
  81. Schmutz, S.; Mielach, C. Review of Existing Research on Fish Passage through Large Dams and Its Applicability to Mekong Mainstream Dams; MRC Technical Paper, No. 48; Mekong River Commission: Phnom Penh, Cambodia, 2015; 155p. [Google Scholar]
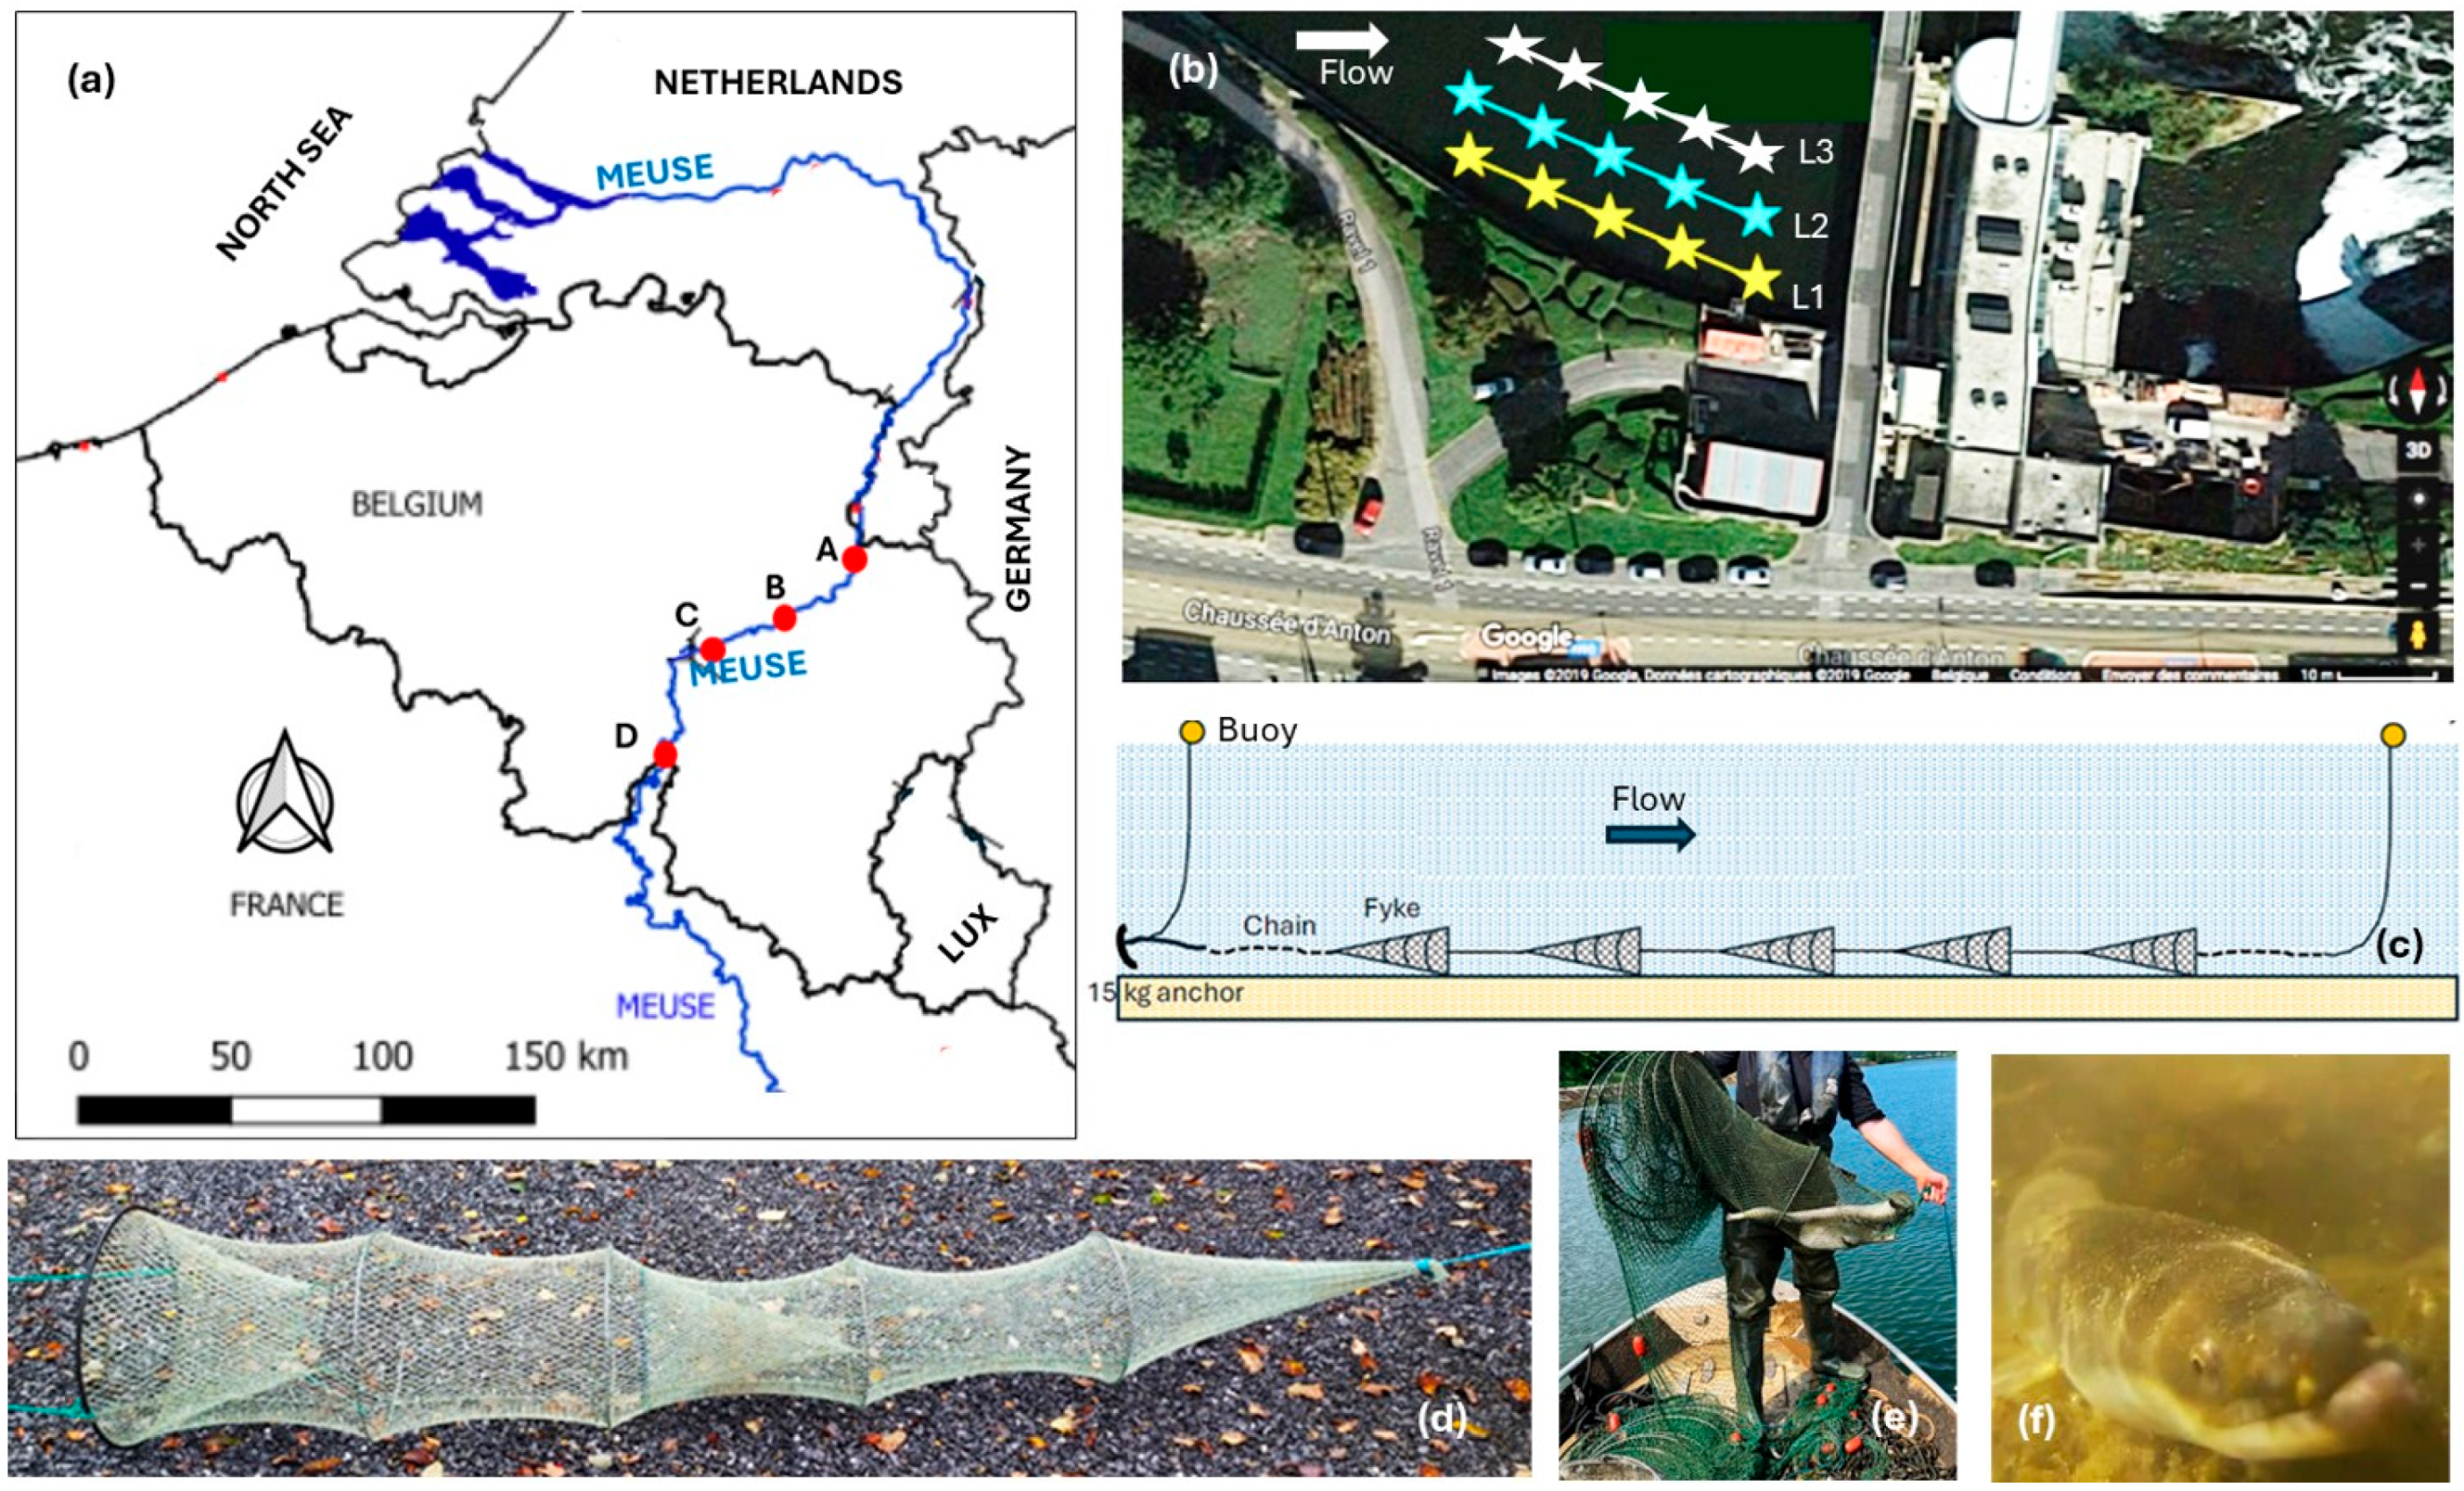
Figure 1. The studied sites (A, B, C and D) in the Meuse (a), fyke net lines (L1 and L2) before powerhouse (b), fyke net line (c), fyke net (d), line monitoring by boat with eels trapped (e), and eel caught (f). (a,cf), source: this study. (b), source: Google Maps.
Sustainability 16 10607 g001
Figure 2. The monthly average of daily mean temperature and flow experienced by eels from 2018 to 2023. All sites pooled.
Sustainability 16 10607 g002
Figure 3. TL distribution (a) and silver-to-yellow eel ratio (b) according to sampling sites. Sites with common lowercase letters in the TL boxplot did not differ statistically (KW and Dunn tests, p < 0.05).
Sustainability 16 10607 g003
Figure 4. TL–frequency distribution (a) and mean TL evolution over time (b).
Sustainability 16 10607 g004
Figure 5. TL per site and silvering index (a) and monthly mean TL and silver-to-yellow eel ratio (b). SI was the smallest, S? unassessed sex, M male and F female eels. Yellow eels are SI, FII and FIII stages, and silver eels (MII, FIV and FV stages).
Sustainability 16 10607 g005
Figure 6. Monthly repartition of eels caught: sites pooled (a) and by site (b). A–D are sampling sites.
Sustainability 16 10607 g006
Figure 7. Comparison of demographic parameters between sites using FE (ac), χ2 (d,e), and KW and Dunn (f) tests, p < 0.05). For each parameter, sites with common lowercase letters did not differ significantly.
Sustainability 16 10607 g007
Table 1. The Meuse site characteristics. “-” means data is not available. Temperature and flow rate data are expressed as mean values (±standard errors).
Distance (km) from Type of Current ConstructionDam Number from Downstream
Site
Name
CodeMouthSourceWide
(m)
Deep
(m)
Temperature
(°C)
Flow Rate
(m3·s−1)
LixheA323.0612.8230.06.0–8.014.7 (±6.2)219.3 (±221.0)Dam1
AmpsinB368.3567.5150.06.015.6 (±6.3)208.9 (±190.3)Dam and ship lock4
AndenneC386.8549.0125.06.013.4 (±6.1)-Dam and ship lock5
HastièreD448.8487.0125.04.0-156.6 (±145.0)Dam and ship lock15
Table 2. Model selection. AICc is Akaike’s Quasi-Probability Information Criterion, Delta AICc differences with the best model, number of parameters, and deviance values. * is the selected model, p catchability, ϕ survival, pent arrival probability, (.) fixed-time parameter, and (t) time-dependent parameter.
Model DescriptionAICcDelta AICcAICc WeightModel Likelihoodn ParametersDeviance−2log(L)
Site A
{p(.), ϕ(.), pent(t), N(.)} *337.490.001.001.0016−663.30302.70
{p(.), ϕ(t), pent(t), N(.)}356.3318.840.000.0024−745.29220.71
{p(t), ϕ(.), pent(t), N(.)}388.8451.350.000.0029−739.60226.40
{p(t), ϕ(t), pent(t), N(.)}399.8562.360.000.0047−761.04204.97
Site B
{p(.), ϕ(t), pent(t), N(.)}70.940.000.661.0014−335.1936.86
{p(.), ϕ(.), pent(t), N(.)} *72.311.360.340.5112−328.1342.91
{p(t), ϕ(.), pent(t), N(.)}111.4940.540.000.0024−328.9043.15
{p(t, ϕ(t), pent(t), N(.)}137.0160.070.000.0031−335.1936.86
Site C
{p(.), ϕ(t), pent(t), N(.)}171.970.000.971.0022−693.00120.90
{p(.), ϕ(.), pent(t), N(.)} *178.596.620.040.0414−666.09147.81
{p(t), ϕ(.), pent(t), N(.)}214.9442.970.000.0035−688.34125.56
{p(t, ϕ(t), pent(t), N(.)}220.3448.370.000.0039−696.32117.58
Site D
{p(.), ϕ(.), pent(t), N(.)} *114.030.001.001.009−169.6192.75
{p(.), ϕ(t), pent(t), N(.)}133.0619.030.000.0019−184.2078.17
{p(t), ϕ(.), pent(t), N(.)}140.2326.200.000.0023−195.0667.30
{p(t, ϕ(t), pent(t), N(.)}140.9826.960.000.0024−199.3862.98
Table 3. Fauna diversity at sampling sites. # indicates non-native species.
FamilySpeciesCommon NameEcological Groupn (%)
ABCD
Fish
Anguillidae
European eelAnguilla anguillaEurytopic226 (10.32)84 (14.89)175 (11.21)69 (13.50)
Cyprinidae
RoachRutilus rutilusEurytopic103 (4.70)15 (2.66)14 (0.90)-
Common breamAbramis bramaEurytopic6 (0.27)-1 (0.06)-
Common bleakAlburnus alburnusEurytopic2 (0.09)1 (0.18)2 (0.13)-
Silver breamBlicca bjoerknaEurytopic1 (0.05)---
TenchTinca tincaLimnophilic18 (0.82)---
Crucian carpCarassius carassiusLimnophilic1 (0.05)---
BarbelBarbus barbusRheophilic---6 (1.17)
ChubLeuciscus cephalusRheophilic--1 (0.06)-
Esocidae
PikeEsox luciusLimnophilic-1 (0.18)--
Gobiidae
Round gobyNeogobius melanostomus #Limnophilic1567 (71.52)364 (64.54)1264 (80.97)111 (21.72)
Percidae
PerchPerca fluviatilisLimnophilic236 (10.77)68 (12.06)84 (5.38)6 (1.17)
ZanderSander luciopercaLimnophilic9 (0.41)-6 (0.38)4 (0.78)
RuffeGymnocephalus cernuaLimnophilic---2 (0.39)
Salmonidae
TroutSalmo truttaRheophilic--1 (0.06)-
Silurae
CatfishSilurus glanis #Eurytopic22 (1.00)31 (5.50)13 (0.83)313 (61.25)
TOTAL 2191 (100.00)564 (100.00)1561 (100.00)511 (100.00)
Table 4. Sampling performance in eels.
TL (mm)W (g)Day Ratio:
Trapping PeriodSiteTotal NumberMean ± SERangeMean ± SERangen Control Dayswith Eel/Total Days
2018
5 September 2018–18 December 2018C15883 ± 123520–9861324 ± 481291–220561.00
2019
17 July 2019–15 January 2020A28841 ± 128570–10071239 ± 625270–2525220.64
10 July 2019–23 January 2020B30891 ± 111588–10351271 ± 437340–2063370.81
26 July 2019–23 January 2020C44847 ± 141575–10761127 ± 644238–2715260.62
2020
2 July 2020–17 December 2020A21861 ± 135554–10511425 ± 593337–2243300.70
2 July 2020–17 December 2020B24871 ± 137477–10421452 ± 627172–2422290.86
2 July 2020–17 December 2020C26886 ± 115623–10921432 ± 518438–2673330.79
2021
7 September 2021–23 December 2021A38731 ± 171344–963904 ± 54583–1980111.00
7 September 2021–9 November 2021C17825 ± 173352–9881341 ± 72770–289690.89
7 September 2021–8 November 2021D3935 ± 40906–9631651 ± 1981433–182060.50
2022
29 March 2022–11 October 2022A83704 ± 165358–1040792 ± 52976–2120300.83
7 July 2022–11 October 2022B30824 ± 161474–11151303 ± 698150–2962200.80
29 March 2022–11 October 2022C51823 ± 190414–11101345 ± 780105–2889350.63
29 March 2022–20 September 2022D40775 ± 184448–10301075 ± 794142–2665240.63
2023
21 February 2023–18 July 2023A56666 ± 137385–943648 ± 43380–1880111.00
21 February 2023–29 August 2023C22709 ± 170381–999686 ± 49193–1810110.82
21 February 2023–29 August 2023D26650 ± 174286–1042637 ± 598131–2076150.87
Table 5. Growth of the recaptured eels.
TL at Tagging (mm)TL Increment (mm.day−1)
Time Class Between Tagging and Recapture (Month)Silvering Index at TaggingSite (-Recapture Site Change)nMean ± SERangeMean ± SERange
<1FIIA2560 ± 2558–5610.421 ± 0.1910.286–0.556
C1720-0-
D1539-0-
FIIIA1660-0.222-
C1824-0.133-
FIVB1994-0.214-
C2932 ± 26914–9500.107 ± 0.0510.071–0.143
D11009-0-
1–6FIIA2570 ± 38543–5970.302 ± 0.4270–0.604
D1560-0.286-
FIIIA2615 ± 29594–6350.197 ± 0.0500.162–0.232
C1893-0.064-
D-A1600-0.614-
FIVA1870-0.260-
C11016-0.086
7–12FIA2505 ± 0505-5050.5510.543–0.558
FIIA1549-0.064-
FIIIA1666-0.337-
A-C1742-0.121-
C1575-0.485-
C-D1687-0.019-
FIVA1796-0.326-
D2950 ± 18937–9630.009 ± 0.0040.007–0.012
13–18FIIA3561 ± 60526–6300.419 ± 0.0170.399–0.429
D1716-0.258-
FIIID-A1600-0.138-
19–24FIIIC2717 ± 170597–8370.271 ± 0.1490.166–0.377
FIVC1912-0.030-
>24FIIC1674-0.197-
Disclaimer/Publisher’s Note: The statements, opinions and data contained in all publications are solely those of the individual author(s) and contributor(s) and not of MDPI and/or the editor(s). MDPI and/or the editor(s) disclaim responsibility for any injury to people or property resulting from any ideas, methods, instructions or products referred to in the content.