Article

Impact of Conversion of the Caatinga Forest to Different Land Uses on Soil and Root Respiration Dynamics in the Brazilian Semiarid Region

by
Denizard Oresca
1,
Eduardo Soares de Souza
1,*,
Rodolfo Marcondes Silva Souza
2,
José Raliuson Inácio Silva
1,
Débora Purcina de Moura
3,
Everardo Valadares de Sá Barreto Sampaio
4,
Claude Hammecker
5,
José Romualdo de Sousa Lima
6,
Rômulo Simões Cezar Menezes
4,
Luiz Guilherme Medeiros Pessoa
1,
Natache Gonçalves de Moura Ferrão
4 and
Antônio Celso Dantas Antonino
4
1
Graduate Program in Crop Production, Federal Rural University of Pernambuco, Serra Talhada 56909-535, PE, Brazil
2
Texas A&M Transportation Institute, 1111 RELLIS Parkway, Bryan, TX 77807, USA
3
Graduate Program in Crop Production, Federal University of Alagoas, Maceió 57100-000, AL, Brazil
4
Department of Nuclear Energy, Federal University of Pernambuco, Recife 50740-545, PE, Brazil
5
UMR LISAH (INRAe, IRD, AgroParisTech, l’Instut Agro), Université de Montpellier, 34090 Montpellier, France
6
Graduate Program in Agricultural Production, Federal University of the Agreste of Pernambuco, Garanhuns 55292-278, PE, Brazil
*
Author to whom correspondence should be addressed.
Sustainability 2024, 16(23), 10652; https://doi.org/10.3390/su162310652
Submission received: 18 October 2024 / Revised: 16 November 2024 / Accepted: 18 November 2024 / Published: 5 December 2024
(This article belongs to the Section Soil Conservation and Sustainability)

Abstract

:
The Caatinga biome has been severely devastated over the years due to the replacement of native dry forests with grassland areas in the Brazilian semiarid region. Despite this, variations in key soil quality indicators still need to be fully elucidated. We evaluated soil and root respiration dynamics in grassland (GR), agroforestry (AS), and Caatinga forest (CA) areas, during dry and rainy seasons. In situ, monthly CO 2 flux (total, root, and heterotrophic respirations), soil moisture ( θ v), and temperature ( T s o i l ) were measured. Soil samples were collected every 5 cm layer up to 20 cm depth to analyze total organic carbon (TOC) and microbial activities. The highest parameter values occurred during the rainy season. Total soil respiration was highest in AS, followed by CA and then GR, with 19.3, 13.4, and 8.4 ton C h a 1 y r 1 , respectively, and root respiration contributed 33.2 and 32.9% to total soil respiration in CA and AS, respectively. However, TOC concentrations and microbial activity were significantly higher in AS than in GR and similar to CA, more than compensating the C losses by respiration. Therefore, agroforestry systems have a high potential for semiarid lands because they preserve soil carbon and microbial activity comparable to Caatinga forests.

1. Introduction

The Caatinga biome, located in northeastern Brazil, is a dry tropical forest and considered as one of the most biodiverse ecosystems globally [1,2]. Known for its resilient flora and fauna, the Caatinga plays a crucial role in regional ecosystem stability primarily through control of soil processes [3]. However, human activities such as agricultural expansion, deforestation, and urbanization have led to significant changes in land use within the Caatinga [4]. These changes often involve converting natural Caatinga vegetation into various land uses like croplands, pastures, and urban areas, which can profoundly impact on soil properties and processes, including carbon stocks, microbial communities, and respiration [5,6].
Soil respiration is one of the terrestrial biosphere’s most significant global carbon fluxes [7], accounting for up to 80% of the total terrestrial respiration [8,9] and releasing 64 to 94 Pg C y r 1 into the atmosphere. It results from several interrelated biogeochemical processes, being affected by climate, vegetation, land use, soil type, biota, soil moisture, and temperature [10,11,12,13]. It can be divided into autotrophic (from plant roots and their associated mycorrhizae) and heterotrophic (from soil organic C decomposition and mineralization) activities [7,14,15].
Soil moisture and temperature are considered the abiotic factors that most influence soil respiration because they control the decomposition of organic matter and the production and efflux of CO 2 [16,17,18]. Soil moisture, especially in arid and semiarid environments, plays a significant role in soil respiration because it influences carbon bioavailability, microbial activity, mass transport, pore-water connectivity, and oxygen access [6,16,19]. Both high and low soil moisture contents affect the rate of CO 2 production. High contents create a barrier to gaseous diffusion at the soil–atmosphere interface, while low contents restrict pore-water connectivity and decrease carbon mass transport [20,21]. Studies by Shen et al. [22] and Yang et al. [23] suggest a quadratic link between soil respiration and soil moisture, indicating limitations in both arid and wet conditions. Research has also shown that soil respiration is sensitive to changes in soil temperature, as an increase in temperature affects the metabolic activity of microorganisms [10,24]. The Q 10 value, defined as the increase in the respiratory rate per 10 °C increase in temperature, is commonly used to describe the sensitivity of soil respiration to temperature fluctuations.
Root respiration accounts for much of total soil respiration, thought to release 40–50 Pg C y r 1 to the atmosphere, varying with climate, ecosystems, and other factors [8,25]. Quantifying the proportion of root respiration is essential. However, is a difficult task, as direct in situ measurements of root respiration are rare, especially in semiarid ecosystems and agroecosystems, particularly in the Brazilian semiarid region. Jian et al. [25] evaluated the contribution of root respiration ( R r o o t ) to total soil respiration ( R t o t a l ) and the effect of biotic and abiotic factors on this respiration ratio (RC-ratio of R r o o t : R t o t a l ). Their findings indicate that plant roots contribute to 42% of the R t o t a l .
Analyzing the spatial and temporal variability of soil and root respiration is crucial for quantifying carbon losses in global, regional, and local ecosystems and understanding how changes in land use influence these losses [26,27]. While studies often focus on measuring total soil respiration, further improvements are needed to understand the factors governing its component fluxes [6,28,29,30]. In the Brazilian semiarid region, grassland progressive replacement of Caatinga landscapes has spurred research into measuring total soil respiration in these contrasting land use types [6,29].
Integrating agroforestry systems into the Caatinga biome offers a sustainable alternative for land use in the semiarid region [30]. These systems have demonstrated viability in converting Caatinga forests, leading to increased carbon stocks and microbial communities in the soil [31]. Quantifying the proportions of total soil respiration from agroforestry root systems and comparing them with Caatinga and grassland is crucial, considering that they are a carbon reservoir with relatively rapid renewal for semiarid conditions. This study aimed to evaluate soil and root respiration dynamics and their relationship with soil moisture and temperature in grassland, agroforestry, and Caatinga forest areas in the Brazilian semiarid region. It was also aimed to calculate the contribution of root respiration to total soil respiration in these systems. Our hypotheses are that 1) agroforestry systems have higher respiration than the grasslands but this carbon loss is more than compensated for by the higher organic matter input to the soil, leading to higher soil C concentrations and stocks and 2) the higher soil C dynamics leads to higher microbial activity.

2. Materials and Methods

2.1. Study Sites

The study was conducted from November 2018 to May 2021 in areas within the neighboring municipalities of Serra Talhada and Triunfo, Pernambuco state, Brazil (Figure 1).
Three sites were chosen in Serra Talhada, located around 07°59′31″ South, 38°17′54″ West, and 430 m above sea level (MASL). The local climate is Bswh’ type, semiarid hot and dry, according to the Köppen classification adapted for Brazil [32], with 642 mm average annual rainfall, mainly occurring between December and May [33]. Average air temperatures range between 23.6 and 27.7 °C. Two sites were selected in the lower part of Triunfo municipality. The first site is located at approximately 07°52′03″ S latitude and 38°02′18.4″ W longitude, with an elevation of 466 MASL. The second site is situated at approximately 07°55′05″ S latitude and 38°02′54.9″ W longitude, with an elevation of 446 MASL. These sites have edaphoclimatic characteristics similar to those in the Serra Talhada sites.
In Serra Talhada, three sites were studied: (1) grassland (GR, 18 ha) established in 1995 with buffel grass (Cenchrus ciliaris L.) and urochloa grass (Urochloa mosambicensis Hack. Dandy); (2) an agroforestry system (AS, 0.5 ha) implemented at least 15 years ago for forage, organic food production, and preservation; and (3) 270 ha old-growth native dry forest stand representing the Caatinga biome (CA).
CA and GR are rainfed systems, while AS receives sporadic watering during the peak of the dry season. The bedrocks in the GR and CA sites are crystalline and impermeable, with shallow (40 cm) sandy loam soils, classified as an Entisol Orthent and an Aridisol Argid [34]. The soil in the AS site is an Entisol Fluvent [34]. In Triunfo, two agroforestry systems (AS, 0.5 ha) implemented 15 years ago, similar to those in Serra Talhada in agroecological principles and production destination, were studied. The soils in the two Triunfo sites are Entisols Fluvents and Entisols Orthents [34]. Table 1 provides information on the main physical and chemical attributes of the surface layer (0–10 cm) of these soils.
The grassland in GR is currently degraded due to inadequate management, with bare soil spots and invasive plant species caused by high animal grazing pressure considering the usual climatic conditions (high temperatures and prolonged drought periods). The AS areas consist of several plant species, including C4 plants (Saccharum officinarum L. and Pennisetum purpureum Schumach), C3 fruit (Mangifera indica L., Malpighia emarginata DC, Punica granatum L., and Carica papaya L.), and legume species (Gliricidia sepium (Jacq.) Kunth ex Walp and Mimosa caesalpiniifolia Benth.), as well as CAM fruits and forage species (Ananas comosus (L) Merr. and Opuntia spp.). CA mainly comprises tree species, including Parapiptadenia rigida Benth Brenan, Cammiphora leptophloeos (Mart.) J. B. Gillet, Cordia oncocalyx Allemão, Poincianella bracteosa (Benth.) L. P. Queiroz, and Mimosa tenuiflora Benth.

2.2. Experimental Procedures, Data Collection, and Analysis

Several sampling plots were systematically designed within each area, according to their sizes, to monitor soil respiration, soil moisture, and soil temperature. Four plots were established in GR, four in CA, and only one in each AS. The sampling plots were at least 300 m in CA and 150 m in GR. In AS, they were in the center of the area. In each sampling plot, four PVC collars, adjustable to an IRGA chamber, were inserted into the soil down to 3.0 cm depth to measure the total respiration ( R t o t a l ) and four collars were inserted down to 30 cm depth to measure root-free soil respiration, that is, heterotrophic respiration ( R h e t ) (Figure 2). These deep collars had lateral windows lined with 0.5 μ m nylon mesh to allow microbial migration, and gas and water diffusion into the collar. The collars were placed in a cross distribution, facing the four cardinal directions, and separated by 2 m in the linear direction. An access tube to allow soil moisture measurements was inserted in the center of the cross distribution.
The method of root exclusion [35] was used to account for the contribution of root respiration ( R r o o t ) and heterotrophic soil respiration ( R h e t ) for total soil respiration ( R t o t a l ). This method assumes that, around the circumference of the plastic collars, soil root disruption reduces R r o o t to negligible levels within three months after trenching [36]. Root respiration ( R r o o t ) was obtained as the difference between total soil respiration ( R t o t a l ) and heterotrophic respiration ( R h e t ).

2.2.1. Soil Respiration, Moisture, and Temperature Measurements

Measurements of CO 2 efflux were made using an infrared gas analyzer (IRGA LI6400-XT–LI-COR) coupled to a CO 2 retention chamber (LI-6400-09, LI-COR, Lincoln, NE, USA) with an internal volume of 991 cm 3 and exposed on PCV collars with a soil area of 71.6 cm 2 . The measurements began after the system was equilibrated, about 15 days after installing the collars, and were repeated every 30 days. In the dry season, measurements were performed between 7:00 and 11:00 a.m., and in the rainy season between 9:00 and 11:00 a.m. Once in the dry and in the rainy seasons, on a sunny day, measurements were performed every two hours, from 7:00 a.m. to 5:00 p.m., to evaluate the behavior of CO 2 efflux on an hourly scale. Before each measurement, the IRGA was calibrated using the CO 2 of the measurement site (1 cm above the soil) as a reference. We used the height data of the CO 2 retention chamber about the soil surface and the number of readings for each PVC collar during the IRGA calibration.
Access tubes installed in the center of each experimental site monitored soil moisture at a 0–10 cm layer. Readings were taken with an FDR probe (Diviner 2000; Sentek Pty Ltd., Stepney, Australia), also known as a capacitance probe, based on a pair of electrodes or conductive metal plates arranged in parallel and separated by an insulating material. Soil temperature was measured at the surface by a portable infrared thermometer, with a temperature range between −50 and 380 °C. Both soil moisture and temperature readings were taken simultaneously with the soil respiration measurements.

2.2.2. Data Analysis

The temporal variation of soil moisture and temperature data was used to evaluate the effects of land use change on CO 2 dynamics. It also made it possible to adjust both total soil and root respiration models for the three systems studied. The standard Q 10 , representing the soil respiration rate with an increase of 10 °C [37], was derived from the exponential model of the relationship between R t o t a l , R h e t , R r o o t , and soil temperature ( T s o i l ):
R X = a · e b · T s o i l
Q 10 = e 10 · b
where X is replaced by t o t a l , h e t , and r o o t to represent R t o t a l , R h e t , and R r o o t (in μ mol CO 2 m 2 s 1 ), T s o i l is the soil surface temperature (°C), and a and b are constants fitted to the exponential model.
Linear, quadratic, and exponential functions were tested to describe the relationship between soil respiration ( R t o t a l , R h e t , and R r o o t ) and θ v [38,39]:
R X = a + b · θ v
R X = a + b · θ v + c · θ v 2
R X = a · e b · θ v
where a, b, and c are fitted constants and θ v ( cm 3 cm 3 ) is the soil moisture at the 10 cm depth layer.

2.3. Soil Carbon and Microbiological Attributes

Composite samples were taken from the 0–5, 5–10, and 10–20 cm layers to refine soil C measurements and evaluate soil biological activities. These samples were placed in thermal boxes, transported to the laboratory, and kept at 4 °C until analysis.
Total organic carbon (TOC) was determined by wet oxidation with potassium dichromate, followed by titration with ammonium ferrous sulfate [40].
Soil basal respiration (SBR) was determined by quantifying the carbon dioxide ( CO 2 ) released during seven days of incubation from 20 g soil samples placed into hermetically closed 3 L flasks. A smaller flask containing 20 g M 1 NaOH captured the released CO 2 , which was then determined by titration with 0.5 M HCl, after precipitation of barium carbonate formed by adding barium chloride (BaC l 2 ) aqueous solution to the NaOH solution. Phenolphthalein diluted in 100 mL ethanol (60%, v/v) was used as an indicator [41]. The analyses were performed in triplicate.
Carbon from soil microbial biomass (MBC) was obtained using the combined method of irradiation and extraction [42,43]. Two 10 g soil samples were divided into Petri dishes, and one was irradiated with microwaves and the other left untreated. These samples were mixed with a 0.5 M potassium sulfate ( K 2 S O 4 ) extraction solution in 50 mL conical bottom tubes. After shaking for 30 min, the tubes were centrifuged at 7342 rpm for 10 min and filtered through a 45 μ m pore diameter paper filter. MBC contents were quantified using the colorimetric method described by Bartlett and Ross [44], with potassium permanganate as the oxidizing agent. All analyses were performed in triplicate.
The soil microbial (qMic) and metabolic (qC O 2 ) ratios were calculated as the MBC to TOC ratio, according to Anderson and Domsch [41], and as the ratio of basal respiration to the microbial biomass C, according to Sparling [45].

2.4. Statistical Analysis

The data underwent testing for normality and homogeneity of variances using the Shapiro–Wilk [46] and Levene [47] tests, respectively. Differences in TOC and microbiological variables among management systems (grassland, agroforestry, and Caatinga) and seasons (dry and rainy) were assessed using ANOVA, with mean comparisons conducted using the Tukey test at a 5% probability level. The analyses used R, version 3.6.3 [48].

3. Results

3.1. Soil Total, Heterotrophic, and Root Respiration Responses

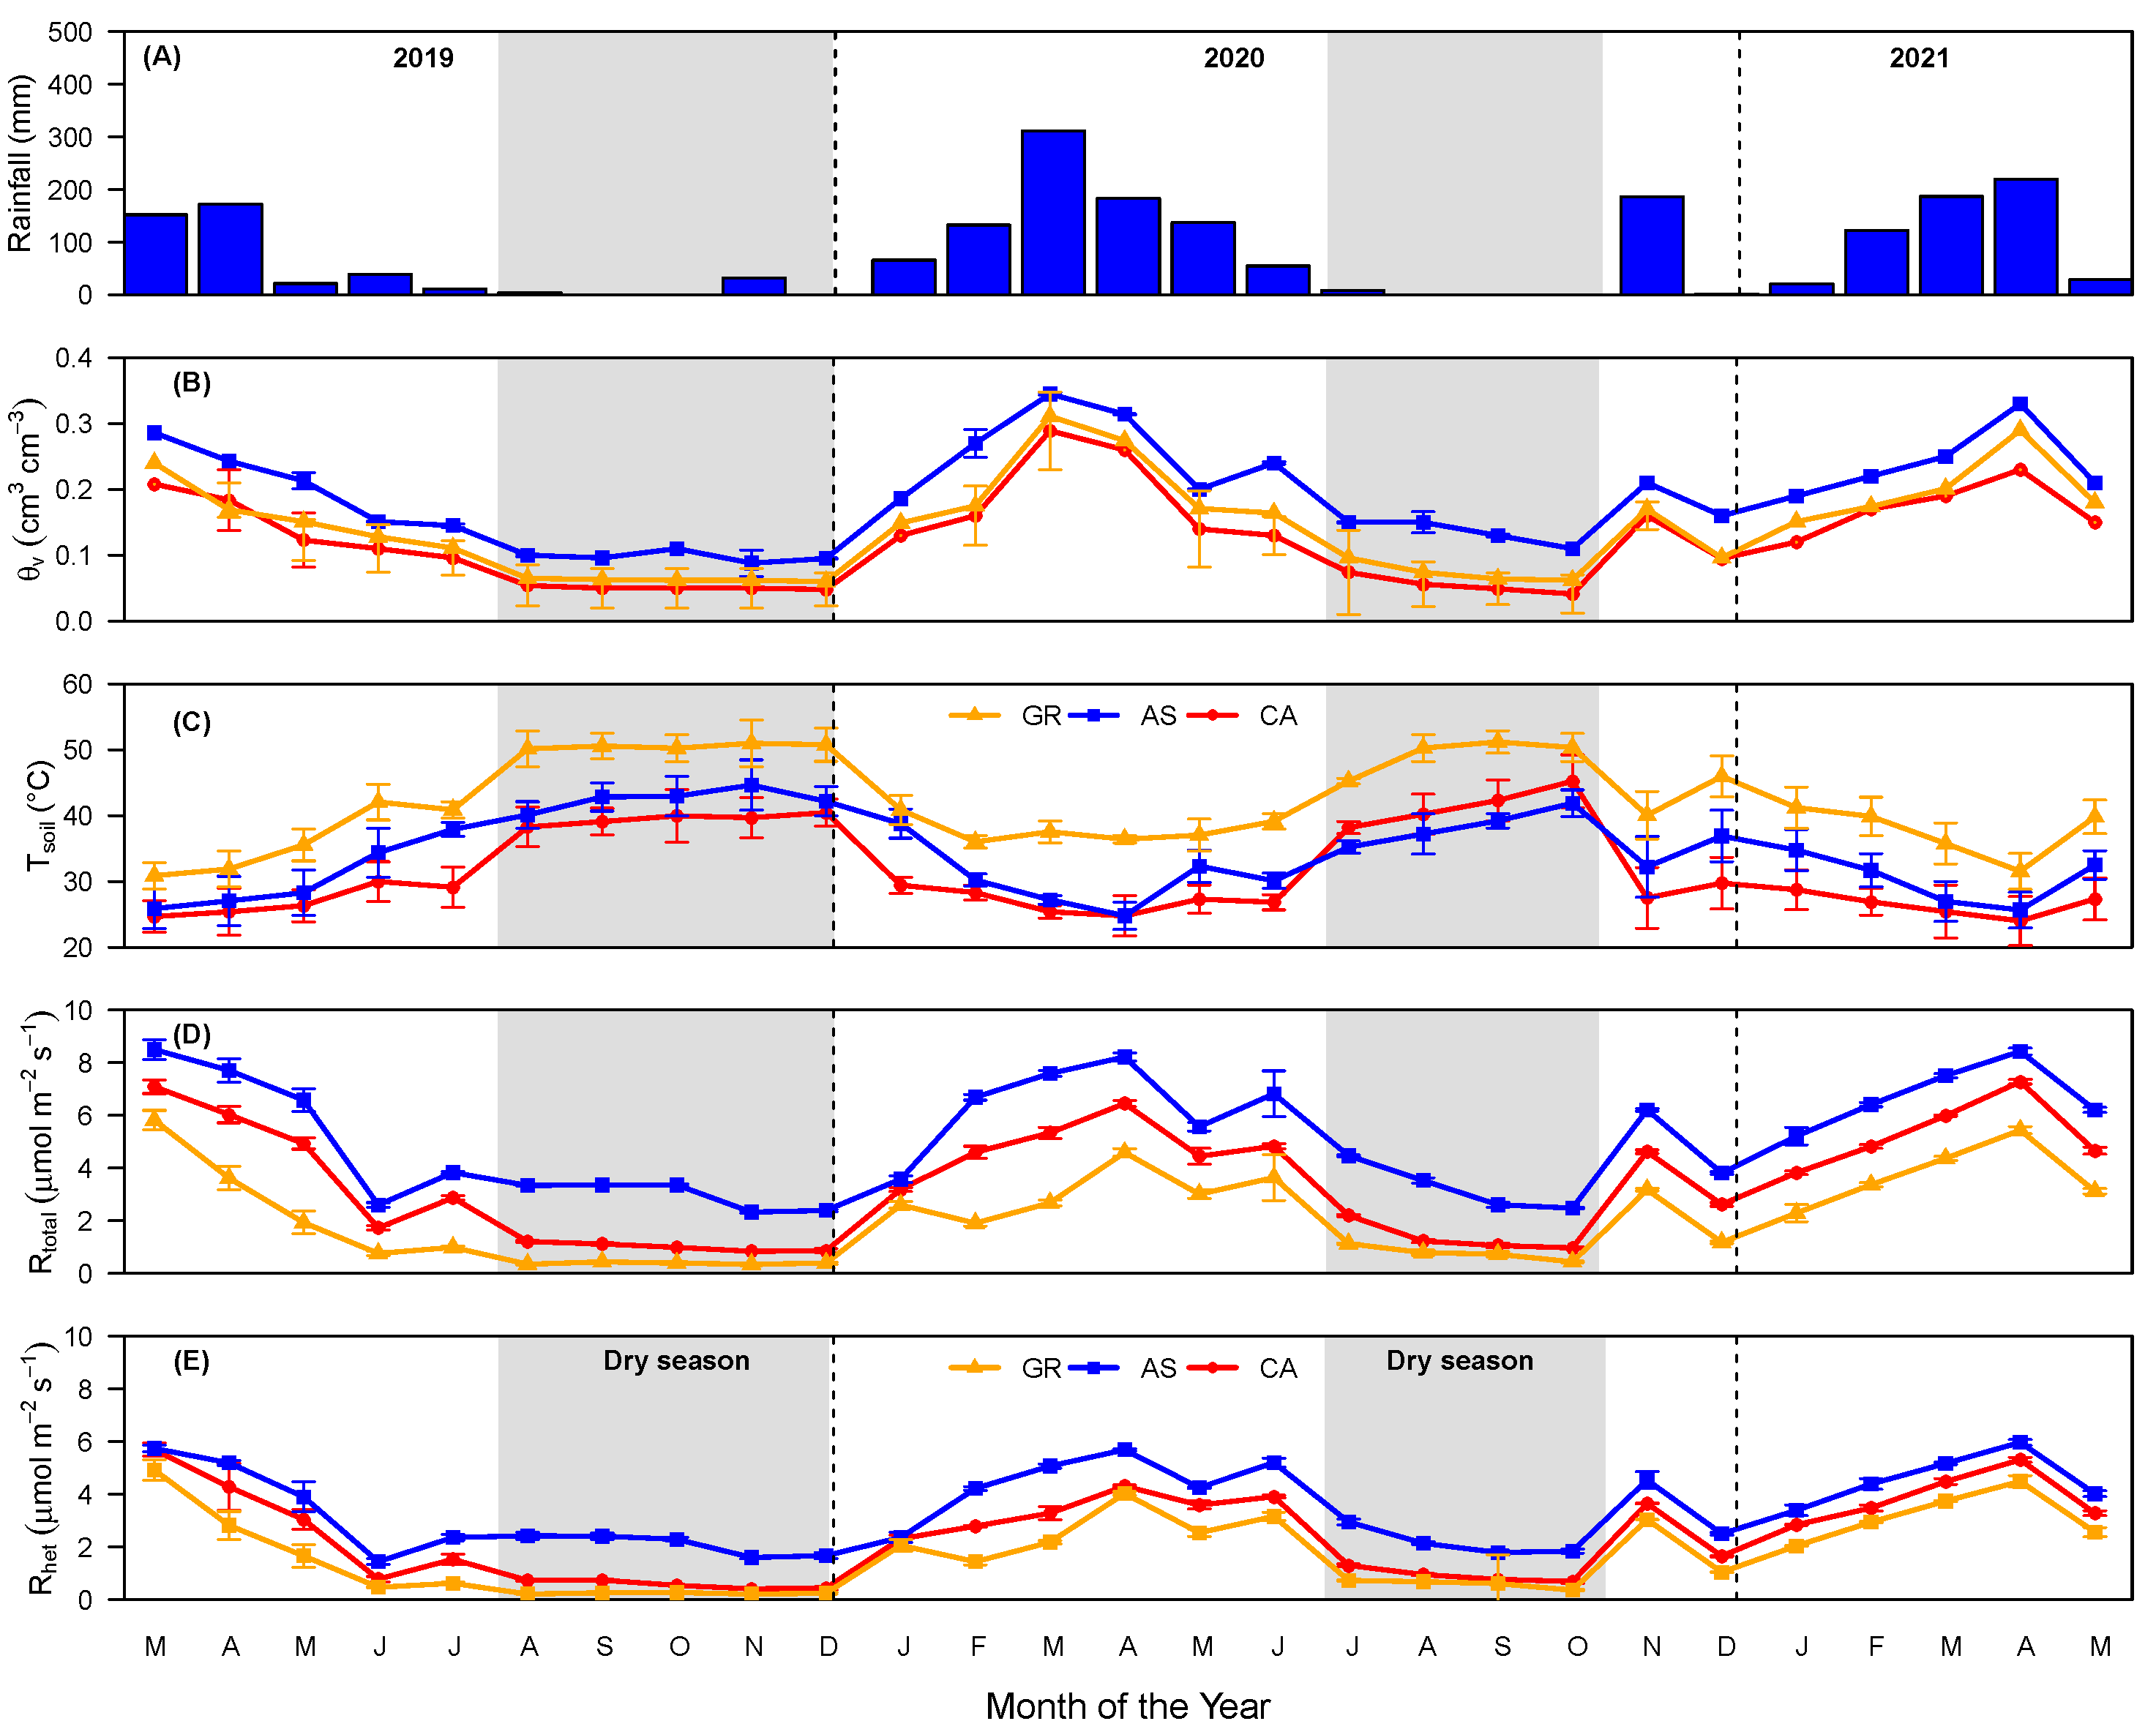
As they cover most of the rainfall, the monthly intervals from March to July 2019, January to June 2020, and November to May 2021 were considered the rainy season. While the intervals with little or no rain, from August to December 2019 and July to October 2020, were considered the dry season (Figure 3A).
Soil moisture ( θ v), expressed at a 0–10 cm layer, followed this seasonal variation (Figure 3B), with almost parallel curves for the three land uses and higher contents in AS (mean of 0.19 cm 3 cm 3 ), followed by the GR (0.15 cm 3 cm 3 ) and CA (0.13 cm 3 cm 3 ). The maximum value was 0.35 cm 3 cm 3 and the minimum 0.05 cm 3 cm 3 . Soil surface temperature ( T s o i l ) also varied along the seasons (Figure 3C), but it was higher in the dry than in the rainy season, reaching a maximum of 52 °C and a minimum of 24 °C. On average, the temperature was higher in GR (42 °C) than in AS (34 °C) and CA (32 °C).
From November 2018 to February 2019, CO2 fluxes from the deeper soil collars were consistently higher than those from the shallower collars. However, this effect was reversed in all areas based on soil respiration analyses that started in March 2019. This phenomenon could be attributed to the increase in heterotrophic respiration ( R h e t ) due to the decomposition of recently cut root tissues in the soil. The seasonal variations in total soil respiration ( R t o t a l ) followed those of the soil moisture content and were higher in the rainy than in the dry season (Figure 3D) and higher in AS (mean of 5.16 μ mol C O 2 m 2 s 1 ), followed by CA (3.55 μ mol CO 2 m 2 s 1 ) and GR (2.20 μ mol CO 2 m 2 s 1 ). The lowest and highest values in AS were 2.15 and 8.88 μ mol CO 2 m 2 s 1 , while in CA they were 0.73 to 7.44 μ mol CO 2 m 2 s 1 , and in GR 0.32 to 5.93 μ mol CO 2 m 2 s 1 . Heterotrophic, that is, root-free soil respiration ( R h e t ) matched very closely R t o t a l , with values being from 4.4 to 54.9% lower (Figure 3E). On average, R h e t was 3.48 μ mol CO 2 m 2 s 1 in AS, 2.47 μ mol CO 2 m 2 s 1 in CA, and 1.8 μ mol CO 2 m 2 s 1 ) in GR.
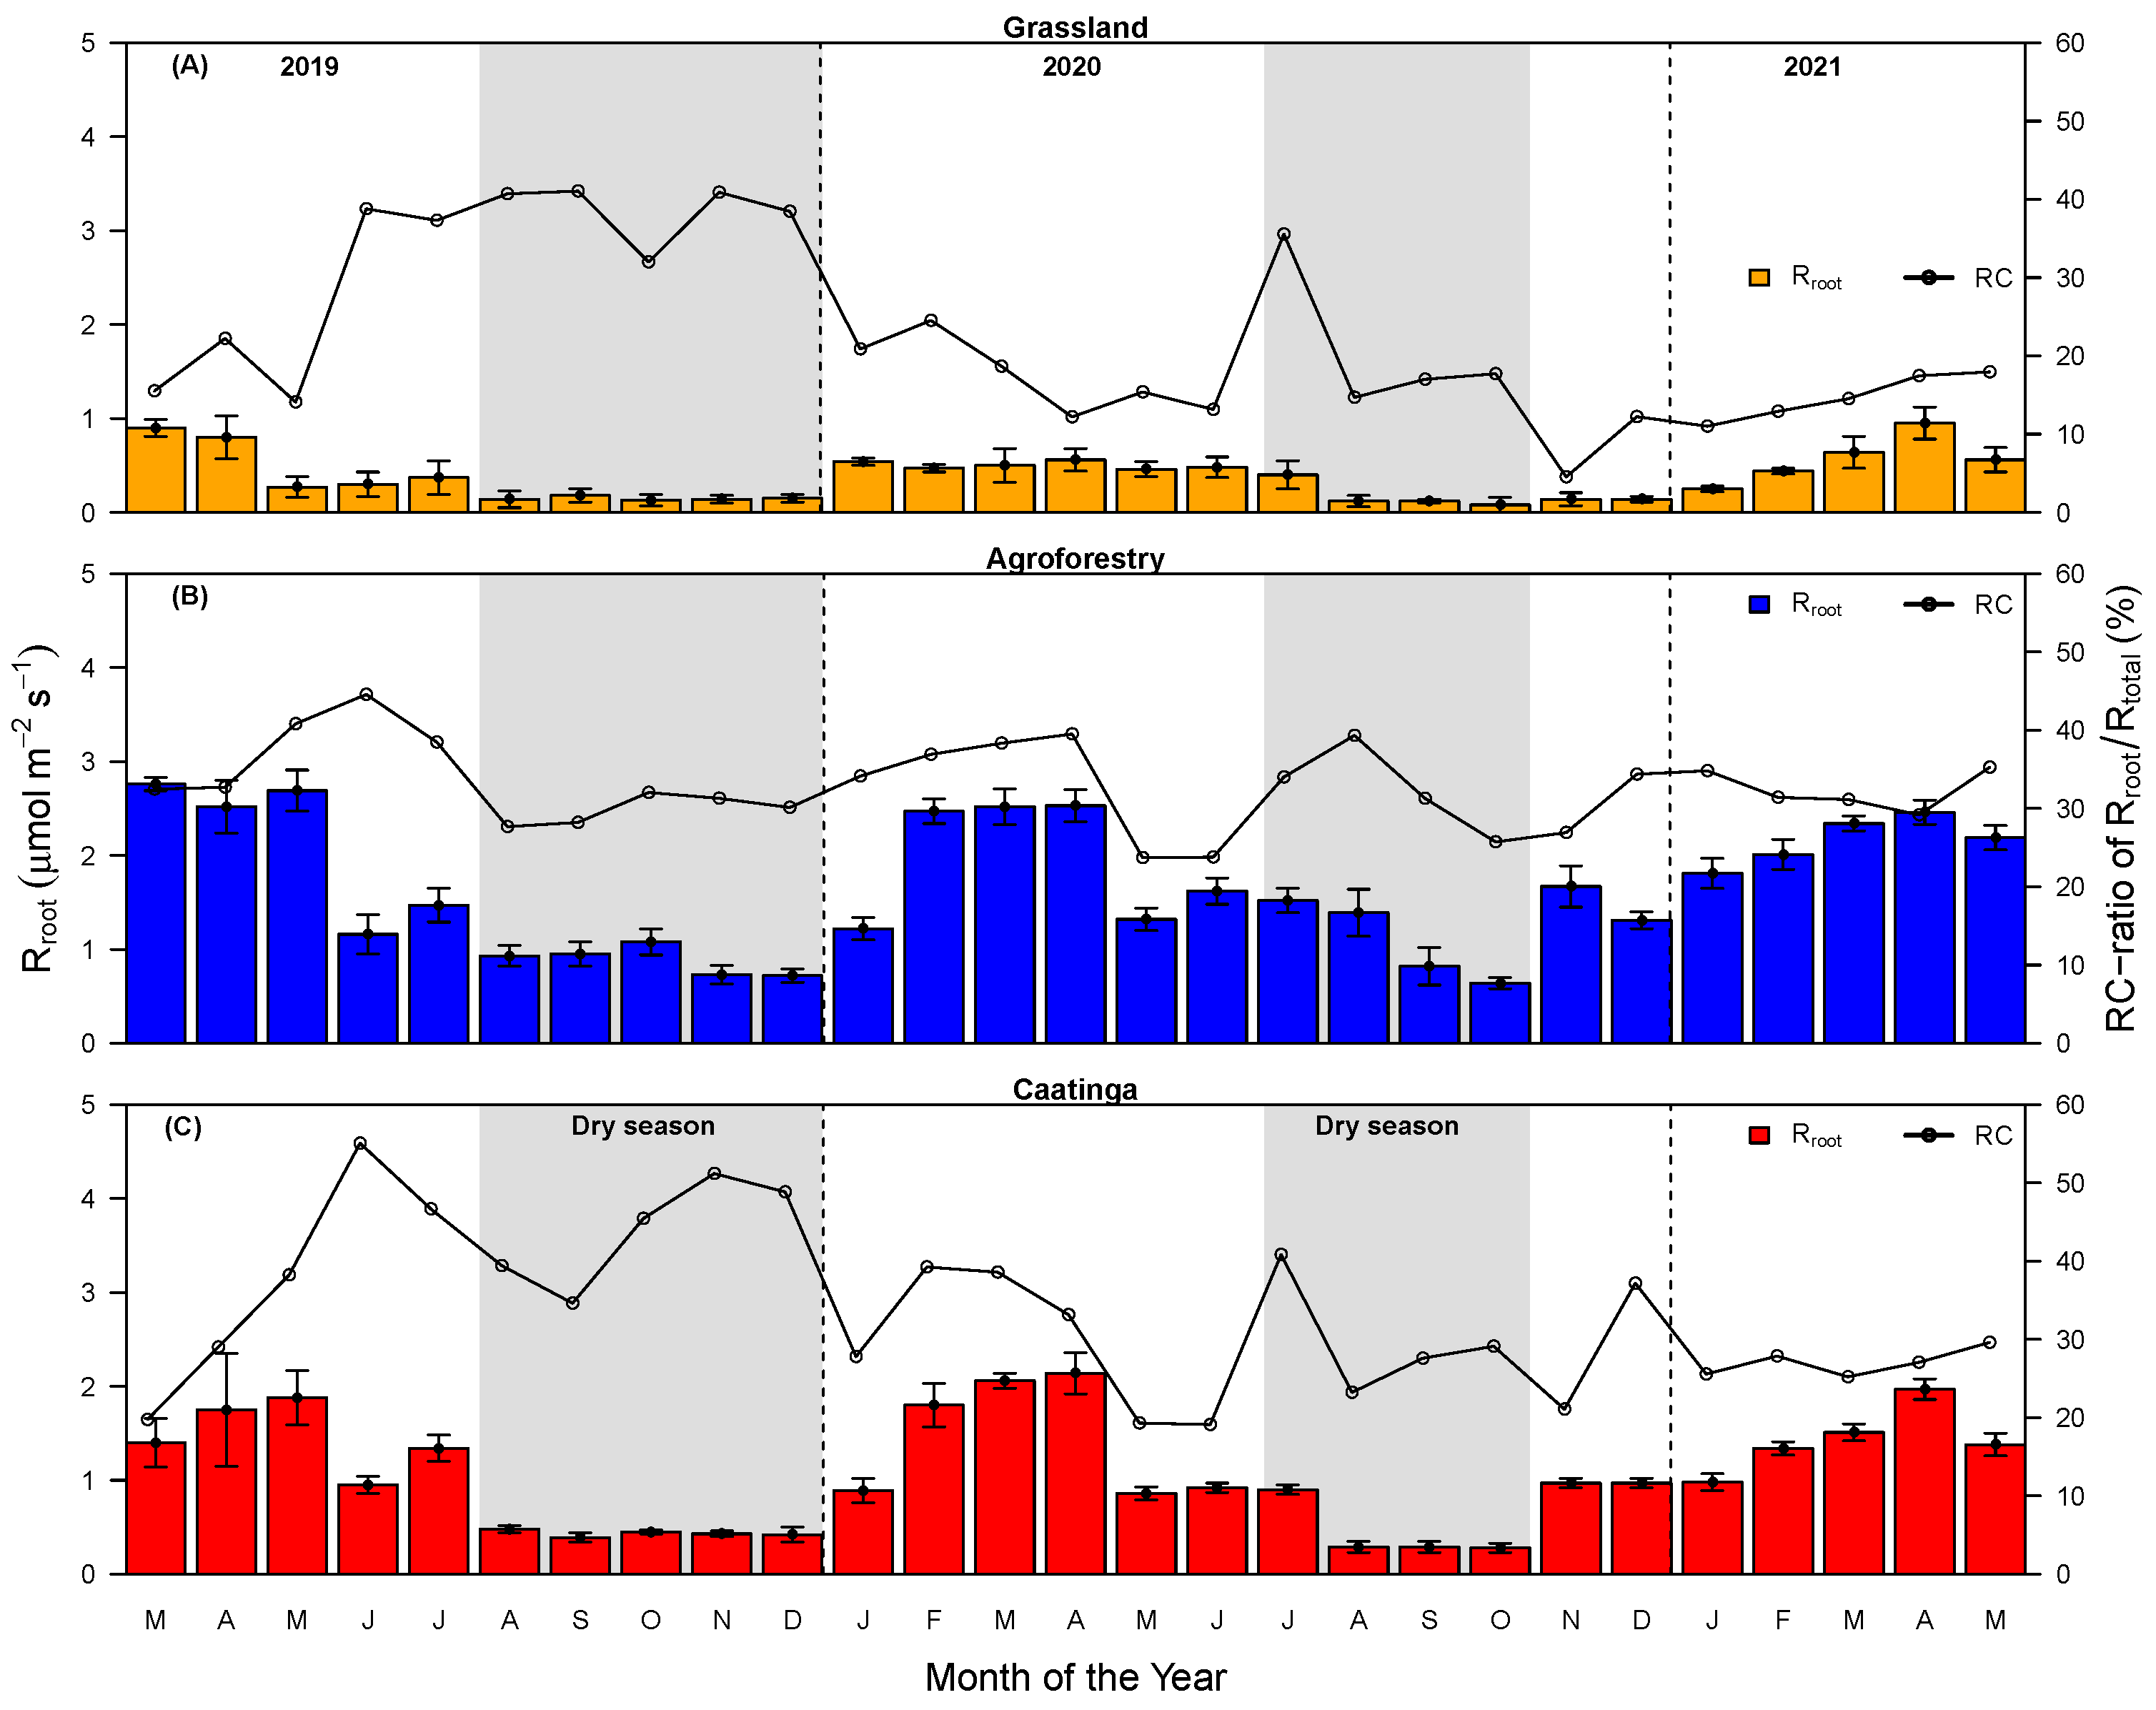
Autotrophic or root respiration ( R r o o t ), obtained by the difference between R t o t a l and R h e t , reflected their seasonal variations (Figure 4), being higher in AS (1.68 μ mol CO 2 m 2 s 1 ), followed by CA (1.10 μ mol CO 2 m 2 s 1 ) and GR (0.4 μ mol CO 2 m 2 s 1 ). However, the contributions of the roots (RC) to the total respiration had a slightly different pattern, being similar in CA and AS (global average of 33.2% and 32.9%, respectively) and both higher than in GR (22.3%).

3.2. Soil Respiration and Moisture and Temperature Relationship

Soil moisture had a strong and positive correlation (mean r > 0.80 , p < 0.05) with soil respiration in all the land uses (Table 2). The quadratic model (Equation (4)) fitted this relationship best between the total soil respiration ( R t o t a l ) and its components ( R h e t and R h o o t ), and θ v was derived from the monthly measurements in each soil use (Figure 5).
All relationships were significant (p < 0.01), with R 2 values ranging from 0.74 to 0.86 in the three areas, except for R r o o t in grassland and agroforest (p < 0.05, with R 2 equal to 0.72 and 0.72). The peaks of soil respiration rates in CA were reached when the θ v values were 0.265, 0.254, and 0.305 cm 3 cm 3 for R t o t a l , R h e t , and R r o o t , respectively, while in GR the peaks were reached with 0.323, 0.314, and 0.49 cm 3 cm 3 . In AS, the respiration rates increased to the highest soil moisture levels, not reaching maxima values (Figure 5).
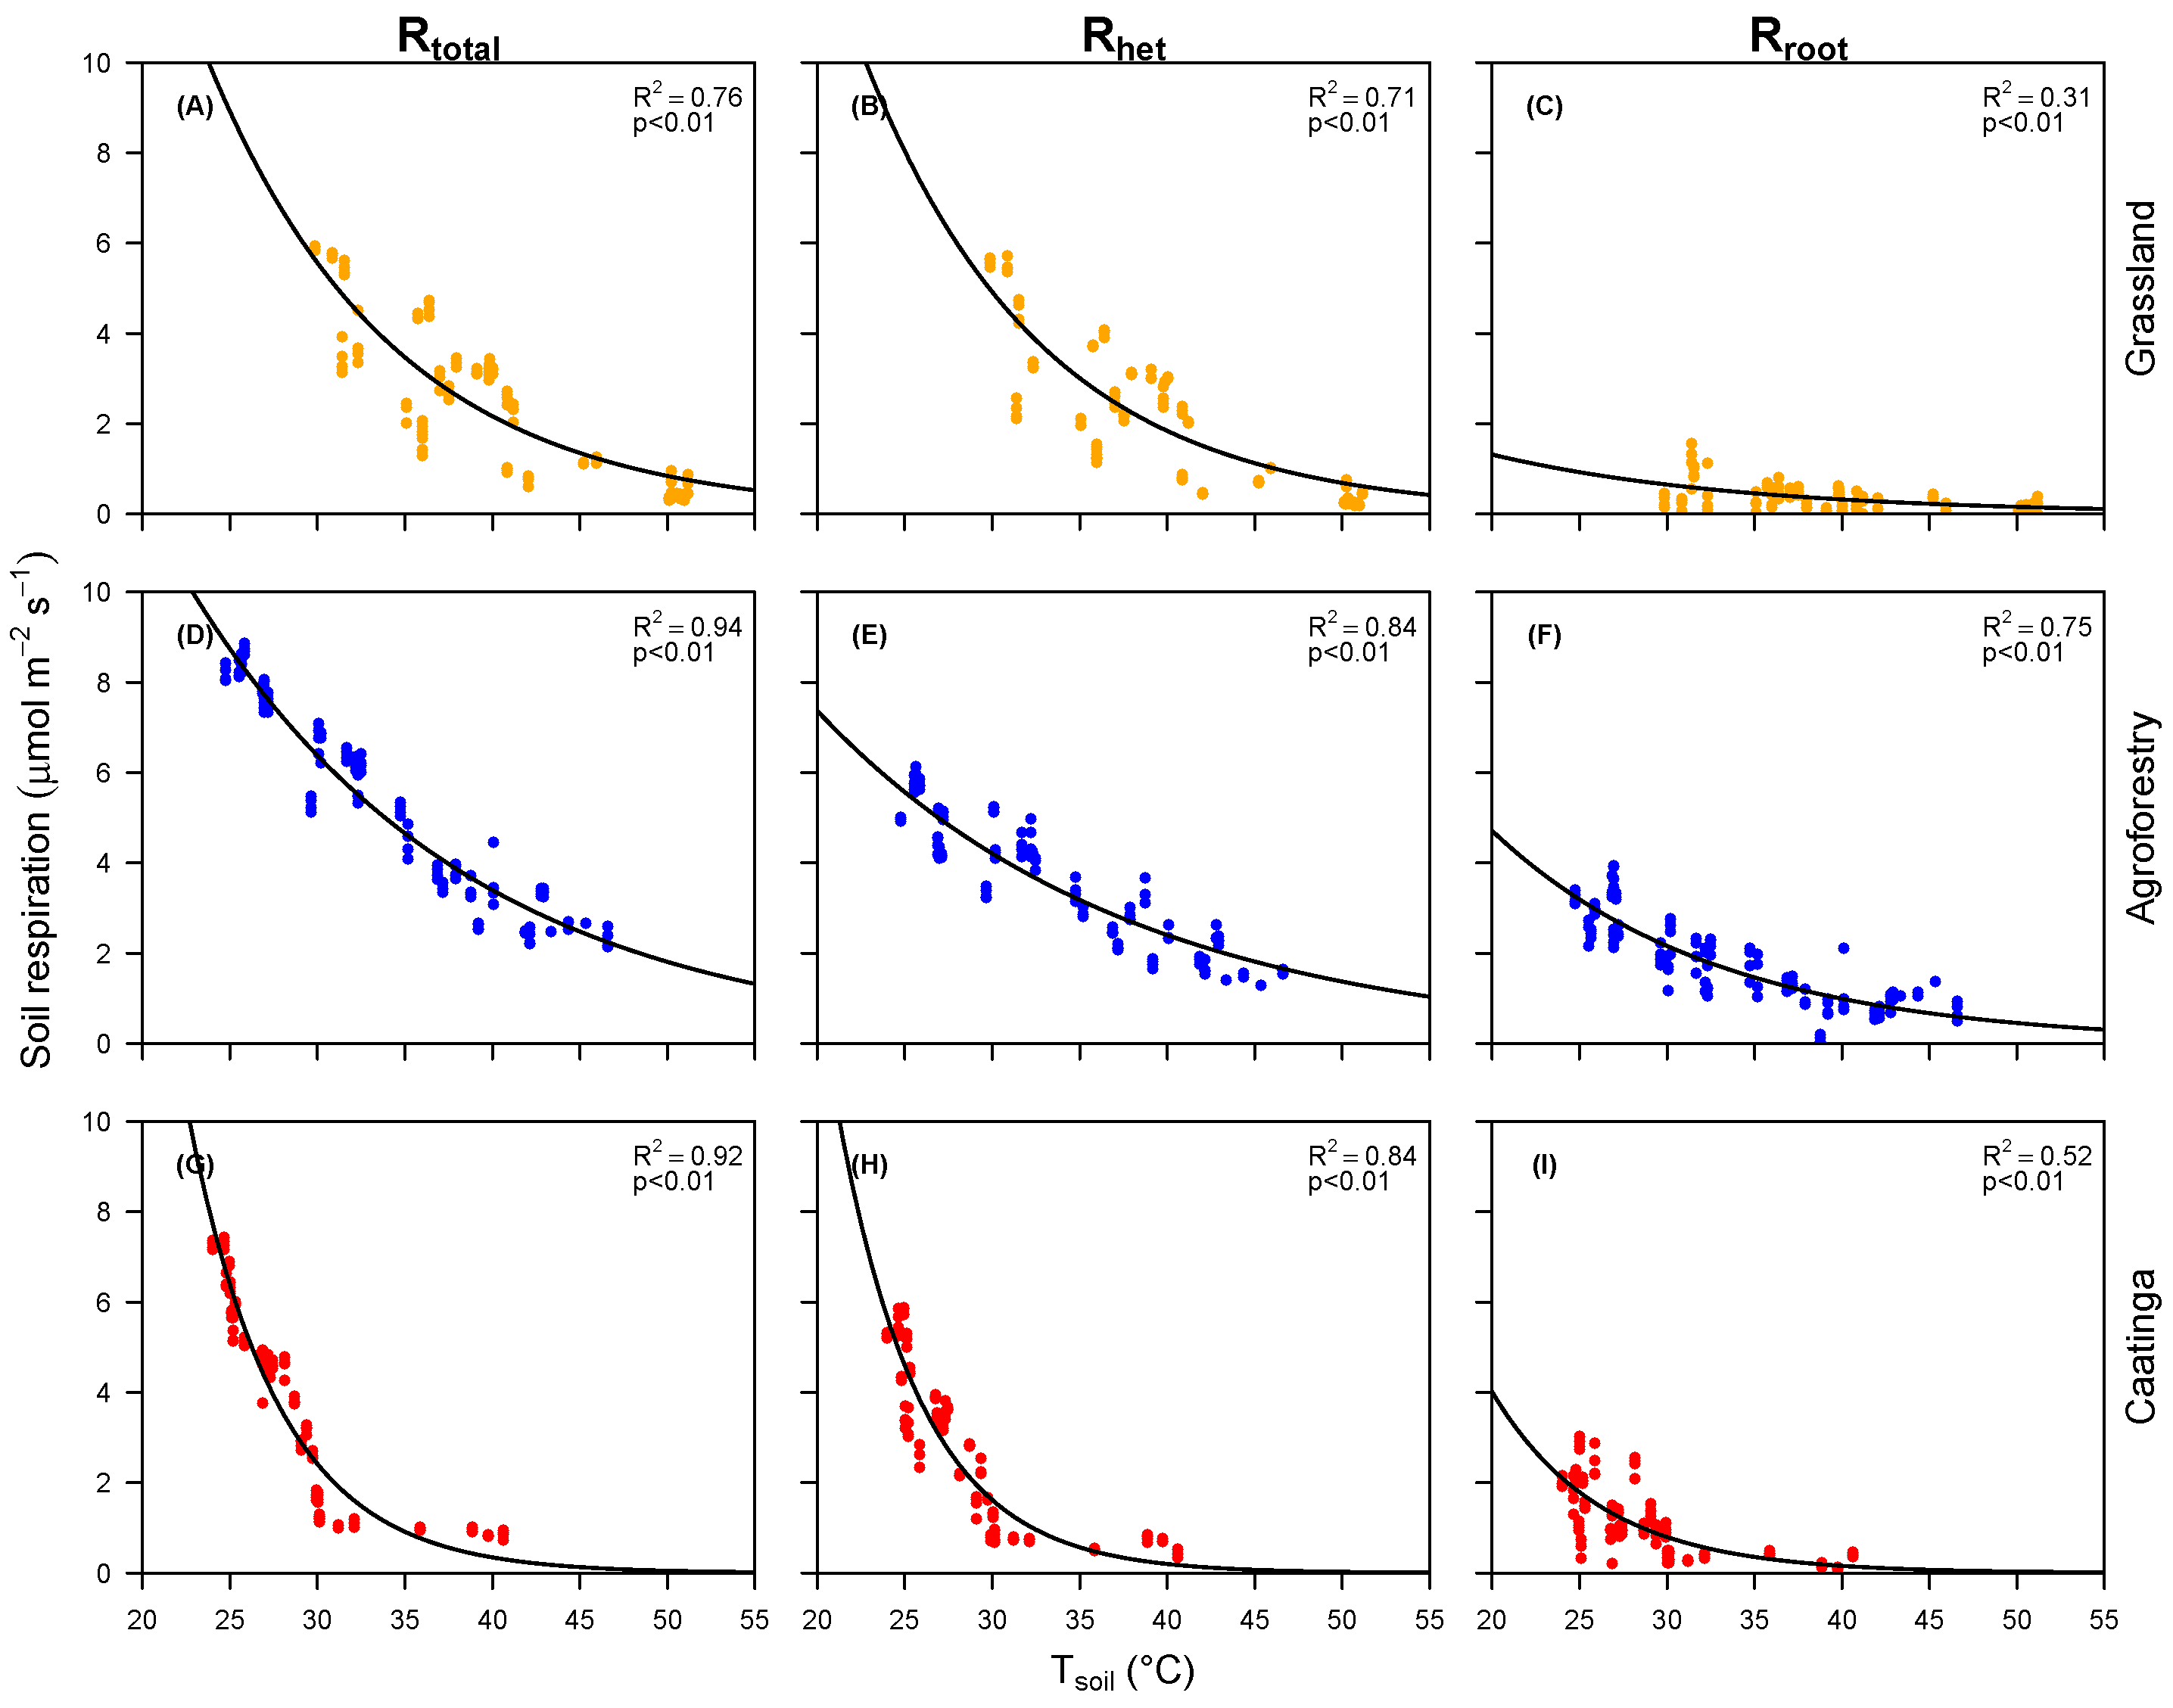
Soil temperature showed a strong negative correlation with soil respiration across all land uses (mean r = −0.89; p < 0.01), contrasting with the relationship observed for soil moisture (Figure 6; Table 2). The negative exponential model best described this relationship, particularly for the agroforestry system (AS), which had higher R t o t a l and R h e t values than the grassland (GR).
AS also had the highest Q 10 values, while the Caatinga (CA) had the lowest. In general, R r o o t was more responsive to changes in soil temperature ( T s o i l ) than R h e t , except for AS (Table 3).
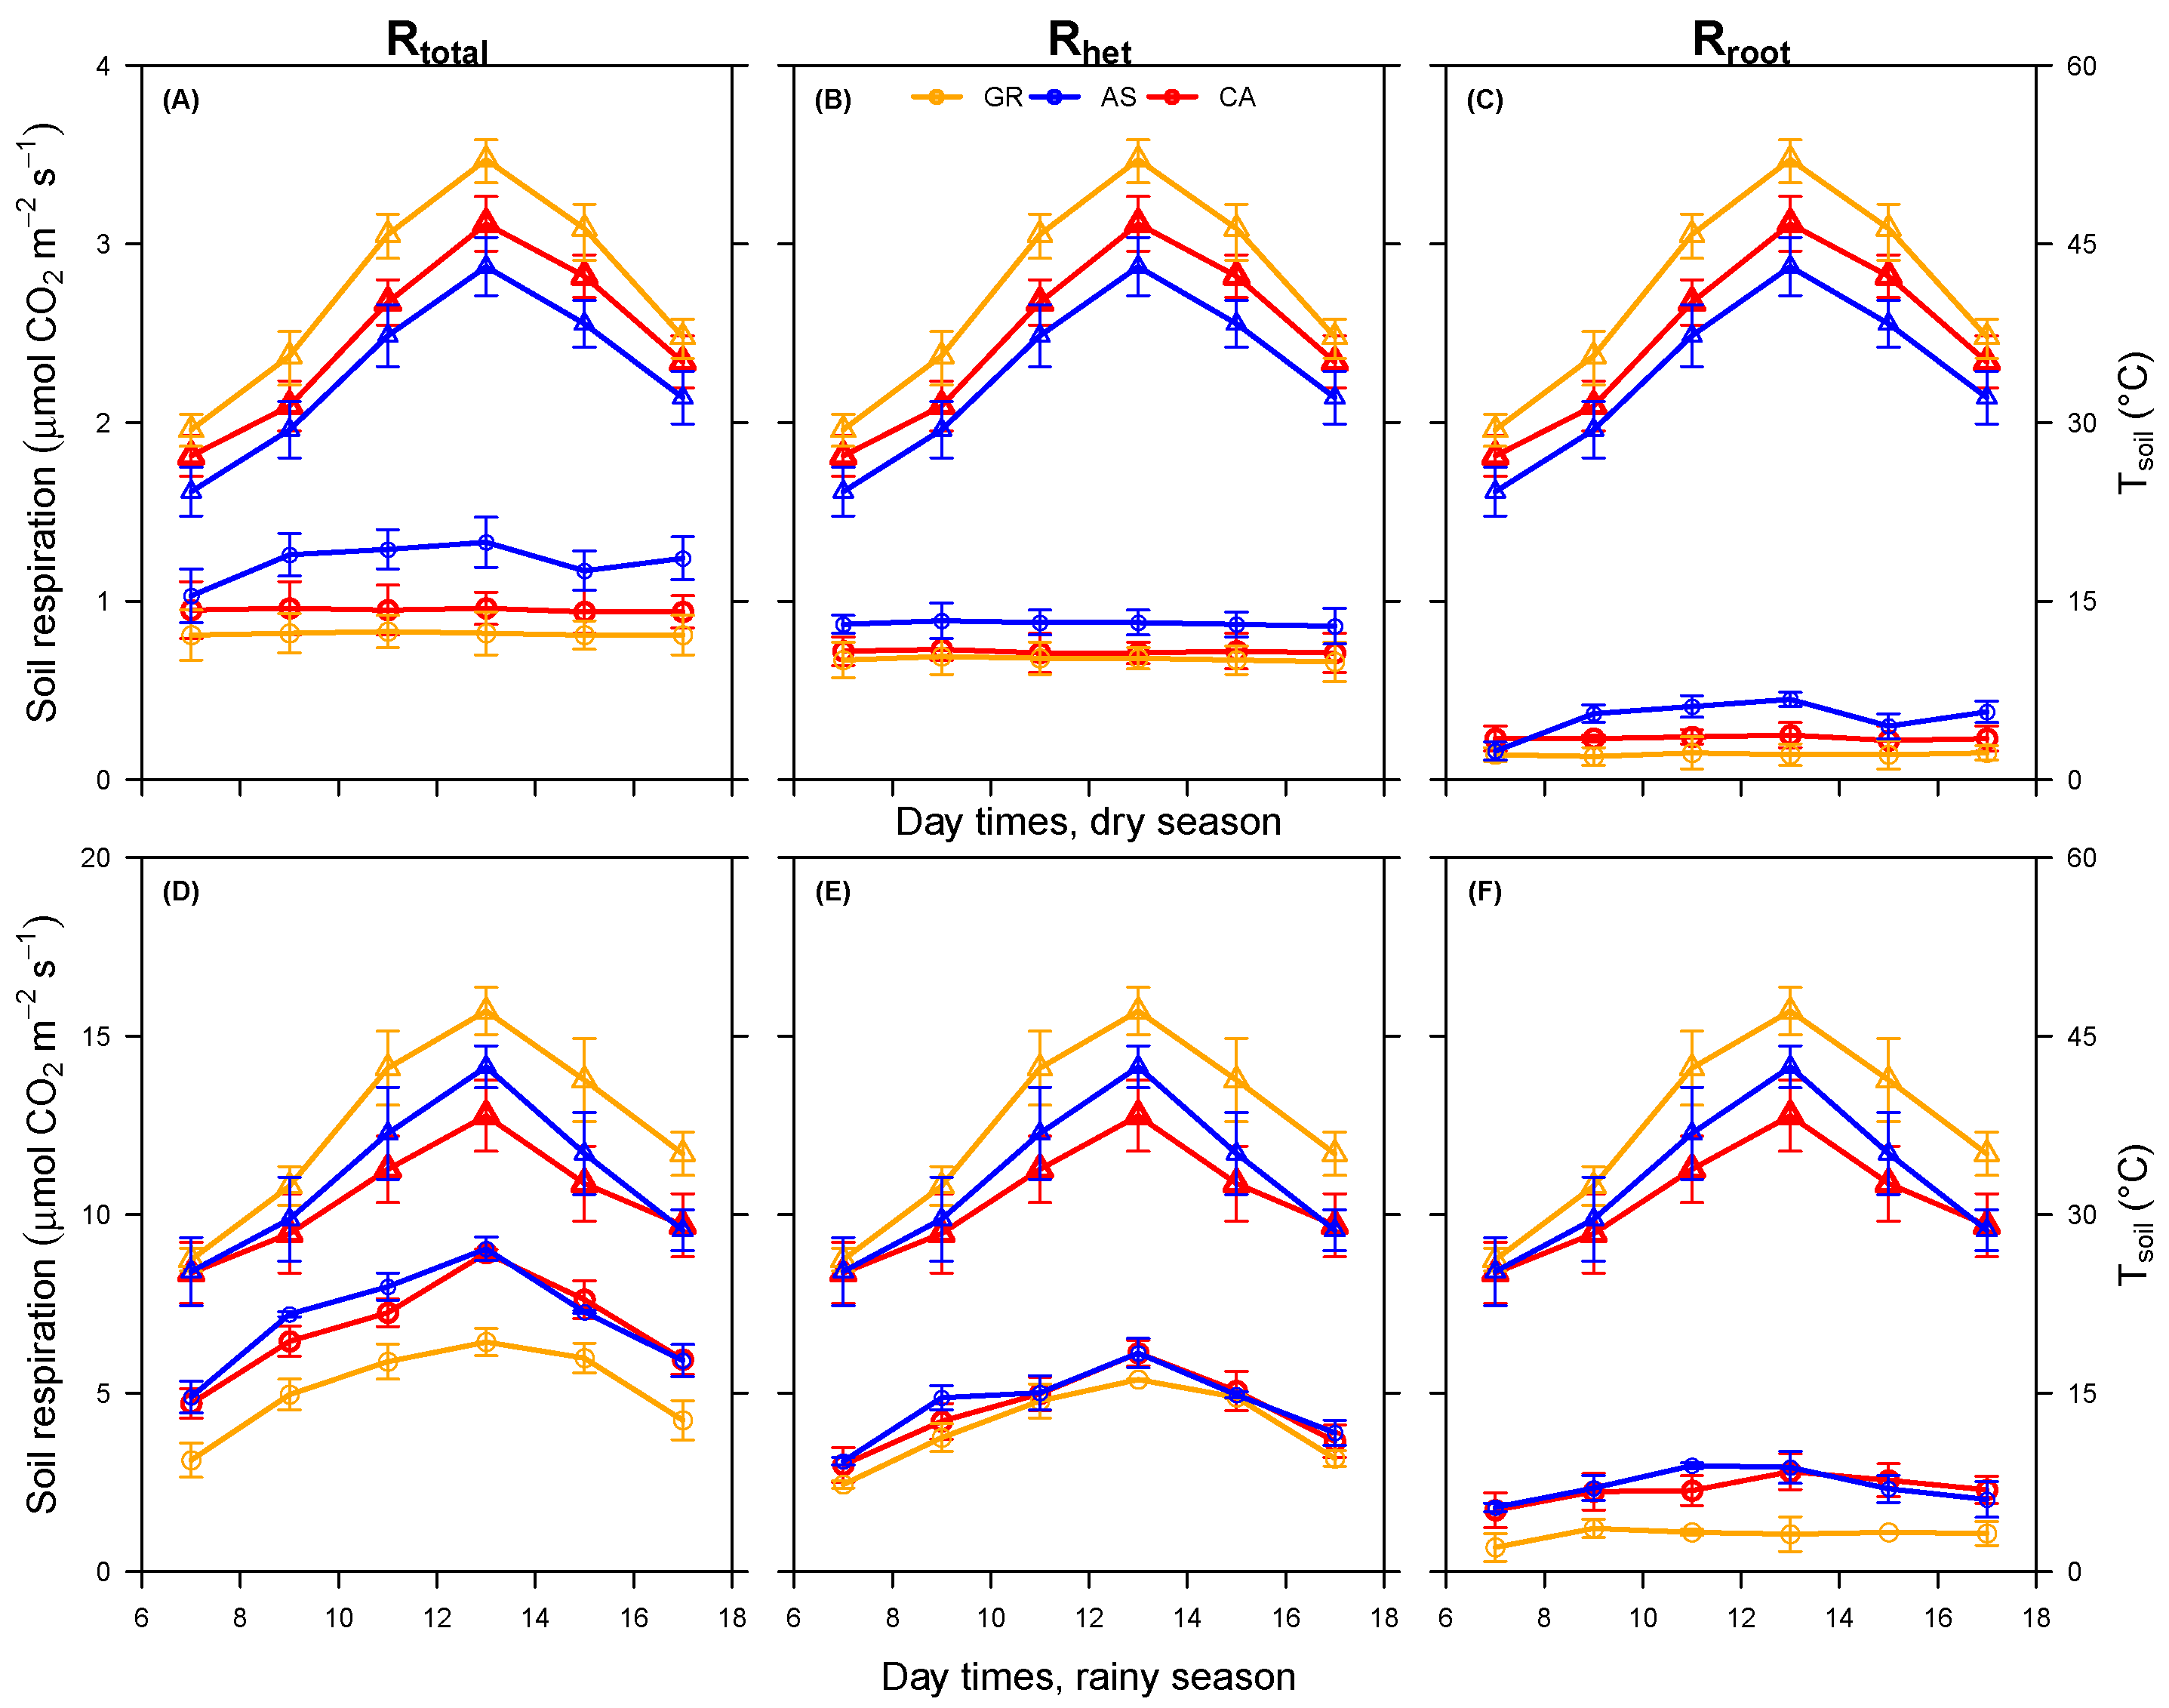
In the dry season, respiration remained low and stable throughout the day despite variations in T s o i l (Figure 7A–C).
On the other hand, during the rainy season, respiration reached higher values, following the variation of T s o i l throughout the day, reaching a peak at 1:00 p.m. (Figure 7D–F).

3.3. TOC and Microbiological Attributes

The AS had a slightly higher but not significantly different TOC than the CA, and both (the CA and AS) had higher contents than the GR in both rainy and dry seasons (Table 4). On average, the TOC in AS and CA was more than double that in GR (19.35 ± 3.03 and 19.23 ± 2.68 g kg 1 versus 7.92 ± 1.93 g kg 1 ), and was 10 to 20% higher in the rainy than in the dry season.
TOC decreased with increasing soil depth, about one-third to one-quarter lower in the 10–20 cm layer than in the 0–5 cm layer. Similar patterns occurred with soil basal respiration (SBR) and microbial biomass carbon (MBC). However, the SBR was significantly higher in the agroforestry system (AS) compared with CA, and more than double that observed in the GR, in several soil layers. Furthermore, reductions in SBR with soil depth were generally more significant relative to total organic carbon (TOC) content (Table 4). MBC was consistently higher in AS than in CA and three to four times higher than in GR, while the decreases with increasing soil depth tended to be similar to those of TOC and, thus, proportionally lower than in SBR.
The microbial quotient (qMic) was also higher in AS and CA than in GR in most soil layers and seasons, although it averaged only about 50% higher values. The comparisons of AS and CA revealed differences related to the seasons (Table 4).
In the dry season, the quotient in AS was significantly higher than in CA in all soil layers, but the differences were not consistent in the rainy season. Also, contrary to the previously presented variables, qMic increased with increasing soil depth, with values up to 20% higher in the deeper than in the superficial layer.
The metabolic quotient ( qCO 2 ) had the inverse pattern of the other variables regarding the land uses. It was higher in GR than in AS and CA, which did not significantly differ (Table 4). The quotient was also higher in the rainy than in the dry season and decreased slightly with increasing soil depth.

4. Discussion

4.1. Soil Respiration Response to Environmental Factors

Despite corresponding to winter and spring months, the dry season had higher soil surface temperature ( T s o i l ) than the rainy season (Figure 3). This was probably due to the cloudless skies, the absence of the cooling effect of water loss from the dry soils, and slight differences in solar radiation throughout the year in this intertropical area. Similar results were reported by Marques et al. [49]. Lower temperatures in AS and CA, particularly during the rainy season, could be explained by their denser canopy, which decreases direct sunlight incidence. In contrast, the overgrazed grassland with many bare spots exposes the soil to direct sun radiation. Higher soil temperatures in grasslands compared with in the native Caatinga have been observed by several authors working in the Brazilian semiarid region [6,29,50,51].
The higher soil moisture ( θ v) in AS could be attributed to the sporadic watering to keep the system functional. The higher moisture in GR compared with in CA may be related to less evapotranspiration from grassland than from Caatinga. The canopy in CA could intercept more of the rain, which could evaporate before reaching the soil, but the larger vegetation structure could absorb and transpire more water than the sparse grassland. Lima et al. [29] also reported lower soil moisture in a Caatinga area than in a grassland, but Lopes et al. [52] found higher soil moisture content in an Atlantic Forest patch in Minas Gerais state than in a degraded grassland. The different patterns in Minas Gerais could be influenced by the higher rainfall, with a more uniform distribution throughout the year.
The R r o o t , R h e t , and R r o o t were affected by changes in soil moisture ( θ v), soil surface temperature ( T s o i l ), soil organic matter (OM), and land use changes. The high soil respiration rate detected in the AS and CA areas is related to the greater substrate availability (TOC), which is essential for soil microbial activity, in addition to a better physical structure, such as greater total porosity, lower density, and mechanical resistance to penetration, than GR. Total soil respiration in the AS remained above 2 μ mol CO 2 m 2 s 1 , probably due to the influence of the sporadic watering during the longer dry spells to keep them productive. Although the soil under GR had slightly higher moisture throughout the experimental period than the CA, its respiration rate, SBR, and MBC were lower. This can be attributed to lower substrate availability than in the other systems. Das et al. [53] observed a positive relationship between soil respiration and organic carbon and microbial biomass carbon in forest ecosystems.
Notably, all evaluated areas had higher soil respiration during the rainy season. This shows how adequate soil water enhances microorganism activities, expressed by SBR and MBC. In the dry season, the lower respiration rates were conditioned by low soil moisture ( θ v), despite higher temperatures ( T s o i l ) [29]. Studies have shown that the interaction between high temperature and low soil moisture reduces soil respiration, inhibiting microbial activity, restricting pore-water connectivity, and decreasing the solubility and mass transport of organic carbon, which constitutes a source of energy for heterotrophic microorganisms [6,20,54].
Root respiration ( R r o o t ) was higher in CA and AS (Figure 4), due to the greater diversity of plant species with higher canopy volumes and different root systems. R r o o t is directly related to the photosynthetic process and root growth [55,56]. In the rainy season, the highest value of R r o o t in the CA was 2.14 μ mol CO 2 m 2 s 1 , and significantly decreased to 0.30 μ mol CO 2 m 2 s 1 in the dry season, concomitant with the reduction in plant physiological activities and leaf fall to avoid water loss [29].
The contributions of the roots (RC) to the total respiration is a crucial variable and may comprise between 28 and 40% of the annual soil respiration in a forest [57]. The RC values found throughout the evaluation period for the CA and AS fell within this range (33.2% and 32.9%, respectively), but that of GR (22.7%) was lower. This low proportion may be due to the high soil compaction, expressed by its density and resistance to penetration, which hampers root growth. However, these RC values may be underestimated because some roots could grow below the 30 cm depth of the collar plate. Considering that the soils are shallow (about 40 cm deep) and most of the roots concentrate in the superficial layers, especially in GR, the underestimations may be relatively small. Feng et al. [58] reported that heterotrophic respiration in grassland ecosystems contributed to 72.8% of the annual respiration, resulting in a proportion of root respiration close to that found for GR. Jian et al. [25] concluded that the global contribution of root to total soil respiration represented 42%.
Soil respiration responded to the variation in θ v in a quadratic manner (Figure 5), that is, R r o o t , R h e t , and R r o o t increased with soil moisture up to an average of 0.275 cm 3 cm 3 in CA and 0.375 cm 3 cm 3 in GR, and then fell with the continuous increase in θ v. This is due to low soil moisture impairing the photosynthetic process of plants and the soil microbiota activity, while high soil moisture reduces aerobic respiratory activity, which is responsible for most of the activity, and creates a physical impediment to the passage of CO 2 to the soil–atmosphere interface [20,54,59,60]. Efficient microbial activity and root respiration are maintained when soils are at their field capacity, i.e., when macropores are free of water and micropores are occupied with water [61,62]. Meena et al. [63] evaluated different land uses in a semiarid ecosystem in Delhi, India, and reported that soil moisture is the main controlling factor of soil respiration. In a semiarid environment and a grassland, Wei et al. [64] and Yang et al. [23] observed that soil respiration correlated positively with soil moisture, thus corroborating our results.
On the other hand, there was a negative correlation between T s o i l and soil respiration in all systems (Figure 6; Table 2), i.e., increasing T s o i l decreases the soil respiration rate. The increase in T s o i l , due to high solar radiation during the dry season, attenuates the physiological processes of plants and inhibits microorganism activity, reducing their consumption of the available substrate and reducing soil respiration. Many studies conducted in semiarid environments [23,29,65,66] have described the negative correlation between soil temperature and respiration.
In all systems, the Q 10 values were below one (1) (Table 3), probably due to the narrow annual temperature range in the region. Several works have shown that Q 10 values are higher in temperate environments, with Q 10 greater than 1, due to their wide temperature variations that often pass from negative to positive values [18,67]. Wang et al. [68] had already pointed out that Q 10 tends to be higher in temperate than semiarid or arid environments, and Feng et al. [58] detected a decrease in Q 10 due to an increase in soil temperature, corroborating the idea that Q 10 tends to be higher in colder regions.
Except for AS, the greater Q 10 values for R r o o t reflect the greater sensitivity of specific root respiration to soil temperature and the seasonal variation in root biomass, which is generally high with elevated temperature. Similar results, in which root respiration responded more strongly to increased temperature, have been reported by other studies [57,69].
Notably, the highest Q 10 values were observed in AS, indicating that these systems are more sensitive to changes in soil temperature, which is confirmed by the high rate of R r o o t (1.68 μ mol CO 2 m 2 s 1 ) compared with the other systems (1.10 μ mol CO 2 m 2 s 1 in CA and 0.4 μ mol CO 2 m 2 s 1 in GR). Zhou et al. [57] pointed out that ecosystems with greater root respiration should be more sensitive to warming.
In the analysis of an isolated day of the dry period, it is noted that T s o i l had little influence on R t o t a l , R h e t , and R r o o t throughout the day (Figure 7A–C) due to the reduction in microorganisms and the physiological activities of plants, some of which had entered dormancy. Researchers warn that the interaction of low humidity and high soil temperature can considerably reduce soil respiration. Several studies point to moisture as one of the main factors controlling soil respiration, especially in semiarid environments, where water is a limiting factor [29,30,65].
In the rainy season, the diurnal patterns of soil respiration were generally associated with the variation in T s o i l in all three systems (Figure 7D–F). Under ideal humidity conditions, higher temperatures favor soil microorganism activity that feeds on organic compounds (SOM), thus increasing CO 2 efflux. Tang et al. [70] suggested that soil temperature catalyzes enzymatic activities to decompose organic compounds by the soil microbial community. Likewise, temperature can also impact plant biomass production, root activities, and litter and organic matter decomposition, leading to changes in substrate C availability for plant roots and soil microbes [11,71,72].

4.2. TOC and Microbiological Attributes

The higher TOC in AS, followed by CA (Table 4), may be associated with the higher vegetation biomass in these systems than in the grassland, thus leading to higher aboveground and root litter production, accumulation, and decomposition into soil organic matter, mainly during the rainy season. Removal of the grazed vegetation in the overstocked grassland further decreases litter accumulation [73]. Part of the plant production in AS is also removed for human and animal consumption, but the biomass accumulation may be compensated for by sporadic watering, the diversity of plant species, and the intense management in the system. Implementing agroforestry systems offers ecosystem services by capturing atmospheric carbon, being that C has a positive impact on soil structure and water retention, thus contributing to soil recovery [31,74].
The higher TOC in the rainy season compared with in the dry season (Table 4), in all areas, was probably the result of increased soil microbiota activity with the increased soil water content, decomposing part of the litter accumulated in the dry season with defoliation and root senescence after the rains of the previous rainy season stopped. Higher TOC in the superficial soil layers is a well-known occurrence, since the aboveground litter is deposited on the soil surface and most of that originating from the roots is concentrated in these first layers [75,76,77].
The higher MBC and MBC/TOC ratios (qMic) in the CA and AS systems compared with in GR reflect their higher TOC and nutrient supply [31,78] and probably the increased diversity of plant residues, which may favor the establishment of different microbe communities [79,80]. MBC values higher in the native vegetation than in grassland and in other human-altered environments have been found [81,82]. The qMic values, from 1.58 to 2.68%, agree with the range reported by Jenkinson and Ladd [83] and Lepcha [84]. Absence of difference from AS and native forests is a result similar to that found by Pezarico et al. [85], evaluating different land use systems.
They stated that the stability of these systems favors the availability of organic matter in quantity and quality, benefiting the development of the soil microbial community.
The higher soil basal respiration values (SBRs) observed in the AS system and native vegetation (CA) may be related to the greater substrate availability (OM and TOC) present in these areas, as well as more significant diversities and densities of microorganisms that act in the decomposition of these substrates.
The microbial quotient (qMic) has been considered a good indicator of alterations in soil processes. High qMic values in the AS and CA areas come from metabolic energy established by the diversity of microorganisms in these systems. In other words, it means better soil quality and greater efficiency of microbial communities in using soil organic matter [86,87]. Low values of qMic in the GR are related to a reduction in the capacity of microbial biomass to convert organic C into microbial tissues when under stress [88,89].
The high value of qCO 2 in the grassland may be related to inadequate system management and indicates that the area may be under stress or disturbance. It is believed that, in the grassland, there are more significant fluctuations in temperature due to the lack of trees and soil cover, which, in the rainy season, favor a rapid decomposition of organic matter by soil microorganisms. Overgrazing can also contribute to raising the metabolic quotient in the soil, since the high hoof pressure can destroy soil aggregates and expose organic matter, causing rapid mineralization and subsequent release of CO 2 . The results found in this work indicate that the Caatinga (CA) and the agroforestry system (AS) are more stable environments for the soil microbial community than the grassland (GR).

5. Conclusions

The conversion of the Caatinga forest to various land uses significantly impacts soil and root respiration, and microbial activities in the semiarid region of Brazil. Our findings indicate that higher soil respiration rates occurred in the agroforestry system (AS) than in the grassland (GR), being similar to those of native dry forest (CA), particularly during the rainy season. Root contributions to total soil respiration were approximately one-third in AS and CA, but only one-fifth in GR. Soil respiration was positively correlated with volumetric soil moisture and negatively correlated with soil temperature. During the dry season, temperature had minimal influence on daily soil respiration patterns; however, in the rainy season, both temperature and soil moisture interacted to affect respiration rates. The Q 10 values indicated that root respiration was more responsive to temperature increases, with AS showing greater sensitivity, and qCO 2 suggesting that GR was experiencing disturbance. Soil carbon storage was lower in GR than in native CA and AS, leading to reduced microbial activity, indicated by lower soil basal respiration and microbial biomass carbon. Thus, confirming our hypotheses, AS had a higher C dynamic than GR but the higher C loss by respiration was more than compensated for by the higher input of organic matter, resulting in higher soil C stocks. Therefore, substitution of the native dry forest by agroforests systems is a more sustainable option than substitution by grasslands. Where grasslands are maintained, better management techniques must be sought in order to increase organic matter inputs to the soil and to reduce soil C stock losses.

Author Contributions

Conceptualization, D.O., E.S.d.S., A.C.D.A. and R.M.S.S.; methodology, D.O., E.S.d.S., J.R.I.S. and R.M.S.S.; formal analysis, N.G.d.M.F. and D.P.d.M.; data curation, R.M.S.S.; writing—original draft preparation, D.O., E.S.d.S., E.V.d.S.B.S. and C.H.; writing—review and editing, J.R.d.S.L., L.G.M.P. and R.S.C.M.; supervision, A.C.D.A. and E.S.d.S.; funding acquisition, A.C.D.A. and E.S.d.S. All authors have read and agreed to the published version of the manuscript.

Funding

This research was funded by National Council for Scientific and Technological Development-CNPq (grants: 465764/2014-2) and the “Fundação de Amparo à Ciência e Tecnologia do Estado de Pernambuco-FACEPE” (grants: APQ-0532-5.01/14, IBPG-0322-3.07/18). We also express our gratitude to APAC/FACEPE (grants: APQ-0423-9.25/21) and CNPq (grants: 314247/2020-3, 406202/2022.2) for their financial support.

Institutional Review Board Statement

Not applicable.

Informed Consent Statement

Not applicable.

Data Availability Statement

The data that support the findings of this study are available from the corresponding author upon reasonable request.

Acknowledgments

To the INCT: NOWCDCB National Observatory of Water and Carbon Dynamics in the Caatinga Biome network, Homem Bom de Magalhães, José Silva, Genivaldo, Antônio do Bom, and Dona Adailde for providing areas to carry out the research.

Conflicts of Interest

The authors declare that they have no known competing financial interests or personal relationships that could have appeared to influence the work reported in this paper.

References

  1. Silva, J.M.C.; Barbosa, L.C.F.; Leal, I.R.; Tabarelli, M. The Caatinga: Understanding the Challenges. In Caatinga: The Largest Tropical Dry Forest Region in South America; Silva, J.M.C., Barbosa, L.C.F., Leal, I.R., Tabarelli, M., Eds.; Springer: Cham, Switzerland, 2017; pp. 3–19. [Google Scholar]
  2. Araujo, H.F.P.; Garda, A.A.; Girão e Silva, W.A.; Nascimento, N.F.F.; Mariano, E.F.; Silva, J.M.C. The Caatinga region is a system and not an aggregate. J. Arid Environ. 2022, 203, 104778. [Google Scholar] [CrossRef]
  3. Barros, M.F.; Ribeiro, E.M.S.; Vanderlei, R.S.; de Paula, A.S.; Sila, A.B.; Wirth, R.; Cianciaruso, M.V.; Tabarelli, M. Resprouting drives successional pathways and the resilience of Caatinga dry forest in human-modified landscapes. For. Ecol. Manag. 2021, 481, 118881. [Google Scholar] [CrossRef]
  4. Araujo, H.F.P.; Canassa, N.F.; Machado, C.C.C.; Cianciaruso, M.V.; Tabarelli, M. Human disturbance is the major driver of vegetation changes in the Caatinga dry forest region. Sci. Rep. 2023, 13, 18440. [Google Scholar] [CrossRef] [PubMed]
  5. Silva, L.F.d.S.; Pessoa, L.G.M.; Silva, E.M.d.; Freire, M.B.G.d.S.; de Souza, E.S.; Oresca, D.; Silva, J.O.N.d.; Júnior, G.B.; Bezerra, A.C.; Santos, E.S.d. Changes in Soil C, N, and P Concentrations and Stocks after Caatinga Natural Regeneration of Degraded Pasture Areas in the Brazilian Semiarid Region. Sustainability 2024, 16, 8737. [Google Scholar] [CrossRef]
  6. Lima, J.R.d.S.; Souza, R.M.S.; de Sá Barreto Sampaio, E.V.; Antonino, A.C.D.; de Souza, E.S.; de Medeiros, É.V.; Duda, G.P.; Ferreira, C.R.P.C.; Menezes, R.S.C.; Hammecker, C. Moisture, temperature and respiration of two soil classes under pasture and tropical dry forest in the semiarid brazilian region. J. Arid Environ. 2023, 214, 104981. [Google Scholar] [CrossRef]
  7. Nissan, A.; Alcolombri, U.; Peleg, N.; Galili, N.; Jimenez-Martinez, J.; Molnar, P.; Holzner, M. Global warming accelerates soil heterotrophic respiration. Nat. Commun. 2023, 14, 3452. [Google Scholar] [CrossRef]
  8. Hanson, P.; Edwards, N.; Garten, C.; Andrews, J. Separating root and soil microbial contributions to soil respiration: A review of methods and observations. Biogeochemistry 2000, 48, 115–146. [Google Scholar] [CrossRef]
  9. Tiruvaimozhi, Y.V.; Sankaran, M. Soil respiration in a tropical montane grassland ecosystem is largely heterotroph-driven and increases under simulated warming. Agric. For. Meteorol. 2019, 276–277, 107619. [Google Scholar] [CrossRef]
  10. Yan, J.; Tong, M.; Liu, J.; Li, J.; Li, H. Temperature and moisture sensitivities of soil respiration vary along elevation gradients: An analysis from long-term field observations. Ecol. Evol. 2024, 912, 169150. [Google Scholar] [CrossRef]
  11. Chen, S.; Whang, J.; Zang, T.; Hou, Z. Climatic, soil, and vegetation controls of the temperature sensitivity (Q10) of soil respiration across terrestrial biomes. Glob. Ecol. Conserv. 2020, 22, e00955. [Google Scholar] [CrossRef]
  12. González-Ubierna, S.; Lai, R. Modelling the effects of climate factors on soil respiration across mediterranean ecosystems. J. Arid Environ. 2019, 165, 46–54. [Google Scholar] [CrossRef]
  13. Qin, S.; Peng, Q.; Dong, Y.; Qi, Y.; Li, Z.; Guo, Y.; Liu, X.; Xiao, S.; Liu, X.; Jia, J.; et al. Role of ambient climate in the response of soil respiration to different grassland management measures. Agric. For. Meteorol. 2023, 334, 109439. [Google Scholar] [CrossRef]
  14. Barneze, A.S.; Whitaker, J.; McNamara, N.P.; Ostle, N.J. Interactive effects of climate warming and management on grassland soil respiration partitioning. Eur. J. Soil Sci. 2024, 75, e13491. [Google Scholar] [CrossRef]
  15. Lei, J.; Guo, X.; Zeng, Y.; Zhou, J.; Gao, Q.; Yang, Y. Temporal changes in global soil respiration since 1987. Nat. Commun. 2021, 12, 403. [Google Scholar] [CrossRef] [PubMed]
  16. Chamizo, S.; Rodríguez-Caballero, E.; Sánchez-Cañete, E.P.; Domingo, F.; Cantón, Y. Temporal dynamics of dryland soil CO2 efflux using high-frequency measurements: Patterns and dominant drivers among biocrust types, vegetation and bare soil. Geoderma 2022, 405, 115404. [Google Scholar] [CrossRef]
  17. Azevedo, L.C.B.; Ferreira, A.S.; Rodovalho, N.S.; Ferreira, L.F.R.; Kumar, A. Microbial contribution to the carbon flux in the soil: A literature review. Rev. Bras. Ciênc. Solo 2024, 48, e0230065. [Google Scholar] [CrossRef]
  18. Yan, J.; Feng, Y.; Li, J.; Li, H.; Ding, G. Response of soil respiration and Q10 to temperature and moisture in naturally regenerated and bare lands based on an 11-year observation period. CATENA 2022, 208, 105711. [Google Scholar] [CrossRef]
  19. Moyano, F.E.; Vasilyeva, N.; Bouckaert, L.; Cook, F.; Craine, J.; Curiel Yuste, J.; Don, A.; Epron, D.; Formanek, P.; Franzluebbers, A.; et al. The moisture response of soil heterotrophic respiration: Interaction with soil properties. Biogeosciences 2012, 9, 1173–1182. [Google Scholar] [CrossRef]
  20. Davidson, E.A.; Samanta, S.; Caramori, S.S.; Savage, K. The dual arrhenius and michaelis–menten kinetics model for decomposition of soil organic matter at hourly to seasonal time scales. Glob. Change Biol. 2012, 18, 371–384. [Google Scholar] [CrossRef]
  21. Sun, Q.; Hu, J.; Jiang, J.; Gu, K.; Zhu, C.; Pan, C.; Yin, W. Effect of Soil Volumetric Water Content on the CO2 Diffusion Coefficient. Ecosystems 2023, 15, 12637. [Google Scholar] [CrossRef]
  22. Shen, H.; Zhang, L.; Meng, H.; Zheng, Z.; Zhao, Y.; Zhang, T. Response of Soil Respiration and Its Components to Precipitation Exclusion in Vitex negundo Var. Heterophylla Shrubland of the Middle Taihang Mountain in North China. Front. Environ. Sci. 2021, 9, 712301. [Google Scholar] [CrossRef]
  23. Yang, Z.; Wei, Y.; Fu, G.; Song, H.; Li, G.; Xiao, R. Asymmetric effect of increased and decreased precipitation in different periods on soil and heterotrophic respiration in a semiarid grassland. Agric. For. Meteorol. 2020, 291, 108039. [Google Scholar] [CrossRef]
  24. Schindlbacher, A.; Rodler, A.S.; Kuffner, M.; Kitzler, B.; Sessitsch, A.; Zechmeister-Boltenstern, S. Experimental warming effects on the microbial community of a temperate mountain forest soil. Soil Biol. Biochem. 2011, 43, 1417–1425. [Google Scholar] [CrossRef] [PubMed]
  25. Jian, J.; Frissell, M.; Hao, D.; Tang, X.; Berryman, E.; Bond-Lamberty, B. The global contribution of roots to total soil respiration. Glob. Ecol. Biogeogr. 2022, 31, 685–699. [Google Scholar] [CrossRef]
  26. Phillips, C.L.; Bond-Lamberty, B.; Desai, A.R.; Lavoie, M.; Risk, D.; Tang, J.; Todd-Brown, K.; Vargas, R. The value of soil respiration measurements for interpreting and modeling terrestrial carbon cycling. Plant Soil 2017, 413, 1–25. [Google Scholar] [CrossRef]
  27. Panchal, P.; Preece, C.; Peñuelas, J.; Giri, J. Soil carbon sequestration by root exudates. Trends Plant Sci. 2022, 27, 749–757. [Google Scholar] [CrossRef]
  28. Fan, L.C.; Yang, M.Z.; Han, W. Soil respiration under different land uses in eastern china. PLoS ONE 2015, 10, e0124198. [Google Scholar] [CrossRef]
  29. Lima, J.R.d.S.; Souza, R.; da Silva, E.; Souza, E.; Emanuella, J.; Oliveira, S.; Medeiros, E.; Pessoa, L.G.; Antonino, A.C.D.; Hammecker, C. Impacts of land-use changes on soil respiration in the semi-arid region of brazil. Rev. Bras. Ciênc. Solo 2020, 44, e0200092. [Google Scholar] [CrossRef]
  30. Simões, V.J.L.; Souza, E.; Leite, M.; Souza, R.; Silva, J.; Torres Sales, A.; Tabosa, J.; Lima, J.; Antonino, A. Physical-hydric attributes and soil CO2 efflux in pastoral systems in a brazilian semi-arid environment. Agrofor. Syst. 2023, 97, 1421–1433. [Google Scholar] [CrossRef]
  31. Tonucci, R.G.; Vogado, R.F.; Silva, R.D.; Pompeu, R.C.F.F.; Oda-Souza, M.; Souza, H.A.d. Agroforestry system improves soil carbon and nitrogen stocks in depth after land-use changes in the brazilian semi-arid region. Rev. Bras. Ciênc. Solo 2023, 47, e0220124. [Google Scholar] [CrossRef]
  32. Alvares, C.A.; Stape, J.L.; Sentelhas, P.C.; de Moraes Gonçalves, J.L.; Sparovek, G. Köppen’s climate classification map for brazil. Meteorol. Z. 2013, 22, 711–728. [Google Scholar] [CrossRef] [PubMed]
  33. Souza, R.; Feng, X.; Antonino, A.; Montenegro, S.; Souza, E.; Porporato, A. Vegetation response to rainfall seasonality and interannual variability in tropical dry forests. Hydrol. Process. 2016, 30, 3583–3595. [Google Scholar] [CrossRef]
  34. Baillie, I.C. Soil survey staff 1999, soil taxonomy. Soil Use Manag. 2001, 17, 57–60. [Google Scholar] [CrossRef]
  35. Kelting, D.L.; Burger, J.A.; Edwards, G.S. Estimating root respiration, microbial respiration in rhizosphere, and root-free soil respiration in forest soils. Soil Biol. Biochem. 1998, 30, 961–968. [Google Scholar] [CrossRef]
  36. Baah-Acheamfour, M.; Carlyle, C.; Bork, E.; Chang, S. Forest and perennial herbland cover reduce microbial respiration but increase root respiration in agroforestry systems. Agric. For. Meteorol. 2020, 280, 107790. [Google Scholar] [CrossRef]
  37. Lloyd, J.; Taylor, J. On the temperature dependence of soil respiration. Funct. Ecol. 2012, 83, 315–323. [Google Scholar] [CrossRef]
  38. Davidson, E.A.; Belk, E.L.; Boone, R.D. Soil water content and temperature as independent or confounded factors controlling soil respiration in a temperate mixed hardwood forest. Glob. Change Biol. 1998, 4, 217–227. [Google Scholar] [CrossRef]
  39. Lai, L.; Zhao, X.; Jiang, L.; Wang, Y.; Luo, L.; Zheng, Y. Soil respiration in different agricultural and natural ecosystems in an arid region. PLoS ONE 2012, 10, e48011. [Google Scholar] [CrossRef]
  40. Yeomans, J.C.; Bremner, J.M. A rapid and precise method for routine determination of organic carbon in soil. Commun. Soil Sci. Plant Anal. 1988, 19, 1467–1476. [Google Scholar] [CrossRef]
  41. Anderson, T.H.; Domsch, K. The metabolic quotient for co2 (qco2) as a specific activity parameter to assess the effects of environmental conditions, such as ph, on the microbial biomass of forest soils. Soil Biol. Biochem. 1993, 25, 393–395. [Google Scholar] [CrossRef]
  42. Brookes, P.; Powlson, D.; Jenkinson, D. Measurement of microbial biomass phosphorus in soil. Soil Biol. Biochem. 1982, 14, 319–329. [Google Scholar] [CrossRef]
  43. Islam, K.; Weil, R. Microwave irradiation of soil for routine measurement of microbial biomass carbon. Biol. Fertil. Soils 1998, 27, 408–416. [Google Scholar] [CrossRef]
  44. Bartlett, R.J.; Ross, D.S. Colorimetric determination of oxidizable carbon in acid soil solutions. Soil Sci. Soc. Am. J. 1988, 52, 1191–1192. [Google Scholar] [CrossRef]
  45. Sparling, G. Ratio of microbial biomass carbon to soil organic carbon as a sensitive indicator of changes in soil organic matter. Aust. J. Soil Res. 1992, 30, 195–207. [Google Scholar] [CrossRef]
  46. Shapiro, S.S.; Wilk, M.B. An analysis of variance test for normality (complete samples). Biometrika 1965, 52, 591–611. [Google Scholar] [CrossRef]
  47. Levene, H. Robust Tests for Equality of Variances. In Contributions to Probability and Statistics: Essays in Honor of Harold Hotelling; Olkin, I., Ghurye, S.G., Hoeffding, W., Madow, W.G., Mann, H.B., Eds.; Stanford University Press: Redwood City, CA, USA; Palo Alto: Santa Clara, CA, USA, 1960; pp. 278–292. [Google Scholar]
  48. R Core Team. R: A Language and Environment for Statistical Computing; R Foundation for Statistical Computing: Vienna, Austria, 2020; Available online: https://www.R-project.org/ (accessed on 6 November 2023).
  49. Marques, T.; Mendes, K.; Mutti, P.; Medeiros, S.; Silva, L.; Perez-Marin, A.; Campos, S.; Lucio, P.; Lima, K.; Reis, J.; et al. Environmental and biophysical controls of evapotranspiration from seasonally dry tropical forests (caatinga) in the brazilian semiarid. Agric. For. Meteorol. 2020, 287, 1–15. [Google Scholar] [CrossRef]
  50. Macedo, R.S.; Letícia, M.; Lambais, E.O.; Lambais, G.R.; Bakker, A.P. Effects of degradation on soil attributes under Caatinga in the Brazilian semiarid. Rev. Árvore 2023, 47, e4702. [Google Scholar] [CrossRef]
  51. de Oliveira, M.L.; dos Santos, C.A.C.; Perez-Marin, A.M.; Santos, C.A.G. Effects of human-induced land degradation on water and carbon fluxes in two different Brazilian dryland soil covers. Sci. Total Environ. 2021, 792, 148458. [Google Scholar] [CrossRef]
  52. Lopes, V.S.; Cardoso, I.M.; Fernandes, O.R.; Rocha, G.C.; Simas, F.N.B.; de Melo Moura, W.; Santana, F.C.; Veloso, G.V.; da Luz, J.M.R. The establishment of a secondary forest in a degraded pasture to improve hydraulic properties of the soil. Soil Tillage Res. 2020, 198, 104538. [Google Scholar] [CrossRef]
  53. Das, S.; Deb, S.; Sahoo, S.S.; Sahoo, U.K. Soil microbial biomass carbon stock and its relation with climatic and other environmental factors in forest ecosystems: A review. Sci. Rep. 2023, 43, 933–945. [Google Scholar] [CrossRef]
  54. Jiang, Z.; Bian, H.; Xu, L.; Li, M.; He, N. Pulse effect of precipitation: Spatial patterns and mechanisms of soil carbon emissions. Front. Ecol. Evol. 2021, 9, 673310. [Google Scholar] [CrossRef]
  55. Ito, A. Constraining size-dependence of vegetation respiration rates. Sci. Rep. 2020, 10, 4304. [Google Scholar] [CrossRef] [PubMed]
  56. Martínková, J.; Hájek, T.; Adamec, L.; Klimešová, J. Growth, root respiration and photosynthesis of a root-sprouting short-lived herb after severe biomass removal. Tree Physiol. 2021, 284, 151915. [Google Scholar] [CrossRef]
  57. Zhou, X.; Wan, S.; Luo, Y. Source components and interannual variability of soil CO2 efflux under experimental warming and clipping in a grassland ecosystem. Glob. Change Biol. 2007, 13, 761–775. [Google Scholar] [CrossRef]
  58. Feng, J.; Wang, J.; Song, Y.; Zhu, B. Patterns of soil respiration and its temperature sensitivity in grassland ecosystems across china. Biogeosciences 2018, 15, 5329–5341. [Google Scholar] [CrossRef]
  59. Bian, H.; Li, C.; Zhu, J.; Li, M.; Zheng, S.; He, N. Soil Moisture Affects the Rapid Response of Microbes to Labile Organic C Addition. Front. Ecol. Evol. 2022, 10, 857185. [Google Scholar] [CrossRef]
  60. Darrouzet-Nardi, A.; Reed, S.; Grote, E.; Belnap, J. Patterns of longer-term climate change effects on CO2 efflux from biocrusted soils differ from those observed in the short term. Biogeosciences 2018, 15, 4561–4573. [Google Scholar] [CrossRef]
  61. Miao, Y.; Han, H.; Du, Y.; Zhang, Q.; Jiang, L.; Hui, D.; Wan, S. Nonlinear responses of soil respiration to precipitation changes in a semiarid temperate steppe. Sci. Rep. 2017, 7, 45782. [Google Scholar] [CrossRef]
  62. Hu, Z.; Chen, C.; Chen, X.; Yao, J.; Jiang, L.; Liu, M. Home-field advantage in soil respiration and its resilience to drying and rewetting cycles. J. Geophys. Res. Biogeosci. 2021, 750, 141736. [Google Scholar] [CrossRef]
  63. Meena, A.; Hanief, M.; Dinakaran, J.; Rao, K. Soil moisture controls the spatio-temporal pattern of soil respiration under different land use systems in a semi-arid ecosystem of delhi, india. Ecol. Process. 2020, 9, 15. [Google Scholar] [CrossRef]
  64. Wei, D.; Yue, L.; Pei, H.; Jiaqi, Z.; Haichai, J.; Chen, N.; Yinghui, L. Nitrogen Addition Decreases Soil Respiration without Changing the Temperature Sensitivity in a Semiarid Grassland. Agric. For. Meteorol. 2020, 11, 129–139. [Google Scholar] [CrossRef]
  65. Ferreira, C.; Antonino, A.; Sampaio, E.V.D.S.; Correia, K.; Lima, J.; Soares, W.; Menezes, R. Soil CO2 efflux measurements by alkali absorption and infrared gas analyzer in the brazilian semiarid region. Rev. Bras. Ciênc. Solo 2018, 42, e0160563. [Google Scholar] [CrossRef]
  66. Niu, F.; Chen, J.; Xiong, P.; Wang, Z.; Zhang, H.; Xu, B. Responses of soil respiration to rainfall pulses in a natural grassland community on the semi-arid loess plateau of china. Nat. Commun. 2019, 178, 199–208. [Google Scholar] [CrossRef]
  67. Kurganova, I.; Lopes de Gerenyu, V.; Khoroshaev, D.; Myakshina, T.; Sapronov, D.; Zhmurin, V. Temperature Sensitivity of Soil Respiration in Two Temperate Forest Ecosystems: The Synthesis of a 24-Year Continuous Observation. Forest 2022, 13, 1374. [Google Scholar] [CrossRef]
  68. Wang, X.; Piao, S.; Ciais, P.; Janssens, I.A.; Reichstein, M.; Peng, S.; Wang, T. Are ecological gradients in seasonal q10 of soil respiration explained by climate or by vegetation seasonality? Soil Biol. Biochem. 2010, 42, 1728–1734. [Google Scholar] [CrossRef]
  69. Maes, S.L.; Dietrich, J.; Midolo, G.; Schwieger, S.; Kummu, M.; Vandvik, V.; Aerts, R.; Althuizen, I.H.J.; Biasi, C.; Björk, R.G.; et al. Environmental drivers of increased ecosystem respiration in a warming tundra. Nature 2024, 629, 105–113. [Google Scholar] [CrossRef]
  70. Tang, Z.; Sun, X.; Luo, Z.; He, N.; Sun, O. Effects of temperature, soil substrate, and microbial community on carbon mineralization across three climatically contrasting forest sites. Ecol. Evol. 2018, 8, 879–891. [Google Scholar] [CrossRef]
  71. Hou, T.; Wang, Y.; Guo, F.; Jia, Q.; Wu, X.; Wang, E.; Hong, J. Soil respiration characteristics and influencing factors for apple orchards in different regions on the loess plateau of shaanxi province. Sustainability 2021, 13, 4780. [Google Scholar] [CrossRef]
  72. Ji, L.; Chen, Y.; Shi, P.; She, J.; Zhou, P. Temporal-spatial variation and controls of soil respiration in different primary succession stages on glacier forehead in gongga mountain, china. PLoS ONE 2012, 7, e42354. [Google Scholar] [CrossRef]
  73. Schulz, K.; Voigt, K.; Beusch, C.; Almeida-Cortez, J.S.; Kowarik, I.; Walz, A.; Cierjacks, A. Grazing deteriorates the soil carbon stocks of caatinga forest ecosystems in Brazil. For. Ecol. Manag. 2016, 367, 62–70. [Google Scholar] [CrossRef]
  74. Visscher, A.M.; Visscher, A.M.; Meli, P.; Fonte, S.J.; Zerbe, S.; Wellstein, C. Agroforestry enhances biological activity, diversity and soil-based ecosystem functions in mountain agroecosystems of Latin America: A meta-analysis. Glob. Change Biol. 2023, 30, e17036. [Google Scholar] [CrossRef] [PubMed]
  75. Gross, C.D.; Harrison, R.B. The case for digging deeper: Soil organic carbon storage, dynamics, and controls in our changing world. Soil Syst. 2019, 28, 28. [Google Scholar] [CrossRef]
  76. Morais, D.H.O.; Silva, C.A.; Rosset, J.S.; Silva Souza, C.B.; Ozório, J.M.B.; Pierri Castilho, S.C.; Marra, L.M. Stock and indices of carbon management under different soil use systems. Braz. J. Environ. Sci. 2021, 56, 286–295. [Google Scholar] [CrossRef]
  77. Zhao, Z.; Dong, P.; Fu, B.; Wu, D.; Zhao, Z. Labile Fraction of Organic Carbon in Soils from Natural and Plantation Forests of Tropical China. Sustainability 2024, 16, 7836. [Google Scholar] [CrossRef]
  78. Costa, D.P.; Pereira, A.S.A.; Mendes, L.W.; França, R.F.; Silva, T.G.E.; Oliveira, J.B.; Duda, G.P.; Menezes, R.S.C.; Medeiros, E.V. Forest-to-pasture conversion modifies the soil bacterial community in Brazilian dry forest Caatinga. Sci. Total Environ. 2022, 810, 151943. [Google Scholar] [CrossRef]
  79. Parron, L.M.; Peixoto, R.T.d.G.; da Silva, K.; Brown, G.G. Traditional Yerba Mate Agroforestry Systems in Araucaria Forest in Southern Brazil Improve the Provisioning of Soil Ecosystem Services. Conservation 2024, 4, 115–138. [Google Scholar] [CrossRef]
  80. Nascimento, M.S.; Barreto-Garcia, A.B.; Monroe, P.H.M.; Barros, W.T.; Nunes, M.R. Carbon in soil macroaggregates under coffee agroforestry systems: Modeling the effect of edaphic fauna and residue input. Appl. Soil Ecol. 2024, 202, 105604. [Google Scholar] [CrossRef]
  81. Nunes, J.; Araujo, A.; Nunes, L.; Lima, L.; Carneiro, R.; Salviano, A.; Tsai, S. Impact of land degradation on soil microbial biomass and activity in northeast brazil. Pedosphere 2012, 22, 88–95. [Google Scholar] [CrossRef]
  82. Mganga, K.Z.; Rolando, J.; Kalu, S.; Karhu, K. Microbial soil quality indicators depending on land use and soil type in a semi-arid dryland in Kenya. Eur. J. Soil Biol. 2024, 121, 103626. [Google Scholar] [CrossRef]
  83. Jenkinson, D.S.; Ladd, J.N. Microbial biomass in soil: Measurement and turnover. in: PAUL, E. A. and LADD, J. N. (ed.). Soil Biochem. 1981, 5, 415–471. [Google Scholar] [CrossRef]
  84. Lepcha, N.T.; Devi, N.B. Effect of land use, season, and soil depth on soil microbial biomass carbon of Eastern Himalayas. Ecol. Process. 2020, 9, 65. [Google Scholar] [CrossRef]
  85. Pezarico, C.R.; Vitorino, A.C.; Mercante, F.M.; Daniel, O. Indicadores de qualidade do solo em sistemas agroflorestais. Rev. Ciênc. Agrár. 2013, 56, 40–47. [Google Scholar] [CrossRef]
  86. Huang, R.; Crowther, T.W.; Sui, Y.; Sun, B.; Liang, Y. High stability and metabolic capacity of bacterial community promote the rapid reduction of easily decomposing carbon in soil. Commun. Biol. 2021, 4, 1376. [Google Scholar] [CrossRef] [PubMed]
  87. Somenahally, A.C.; McLawrence, J.; Chaganti, V.N.; Ganjegunte, G.K.; Obayomi, O.; Brady, J.A. Response of soil microbial Communities, inorganic and organic soil carbon pools in arid saline soils to alternative land use practices. Ecol. Indic. 2023, 150, 110227. [Google Scholar] [CrossRef]
  88. Cao, R.; Yang, W.; Chang, C.; Wang, Z.; Wang, Q.; Jiang, Y.; Li, H.; Tan, B. Soil microbial biomass carbon and freeze-thaw cycles drive seasonal changes in soil microbial quotient along a steep altitudinal gradient. J. Geophys. Res. Biogeosci. 2021, 126, e2021JG006325. [Google Scholar] [CrossRef]
  89. Anderson, T.H.; Domsch, K. Ratios of microbial biomass carbon to total organic carbon in arable soils. Soil Biol. Biochem. 1989, 21, 471–479. [Google Scholar] [CrossRef]
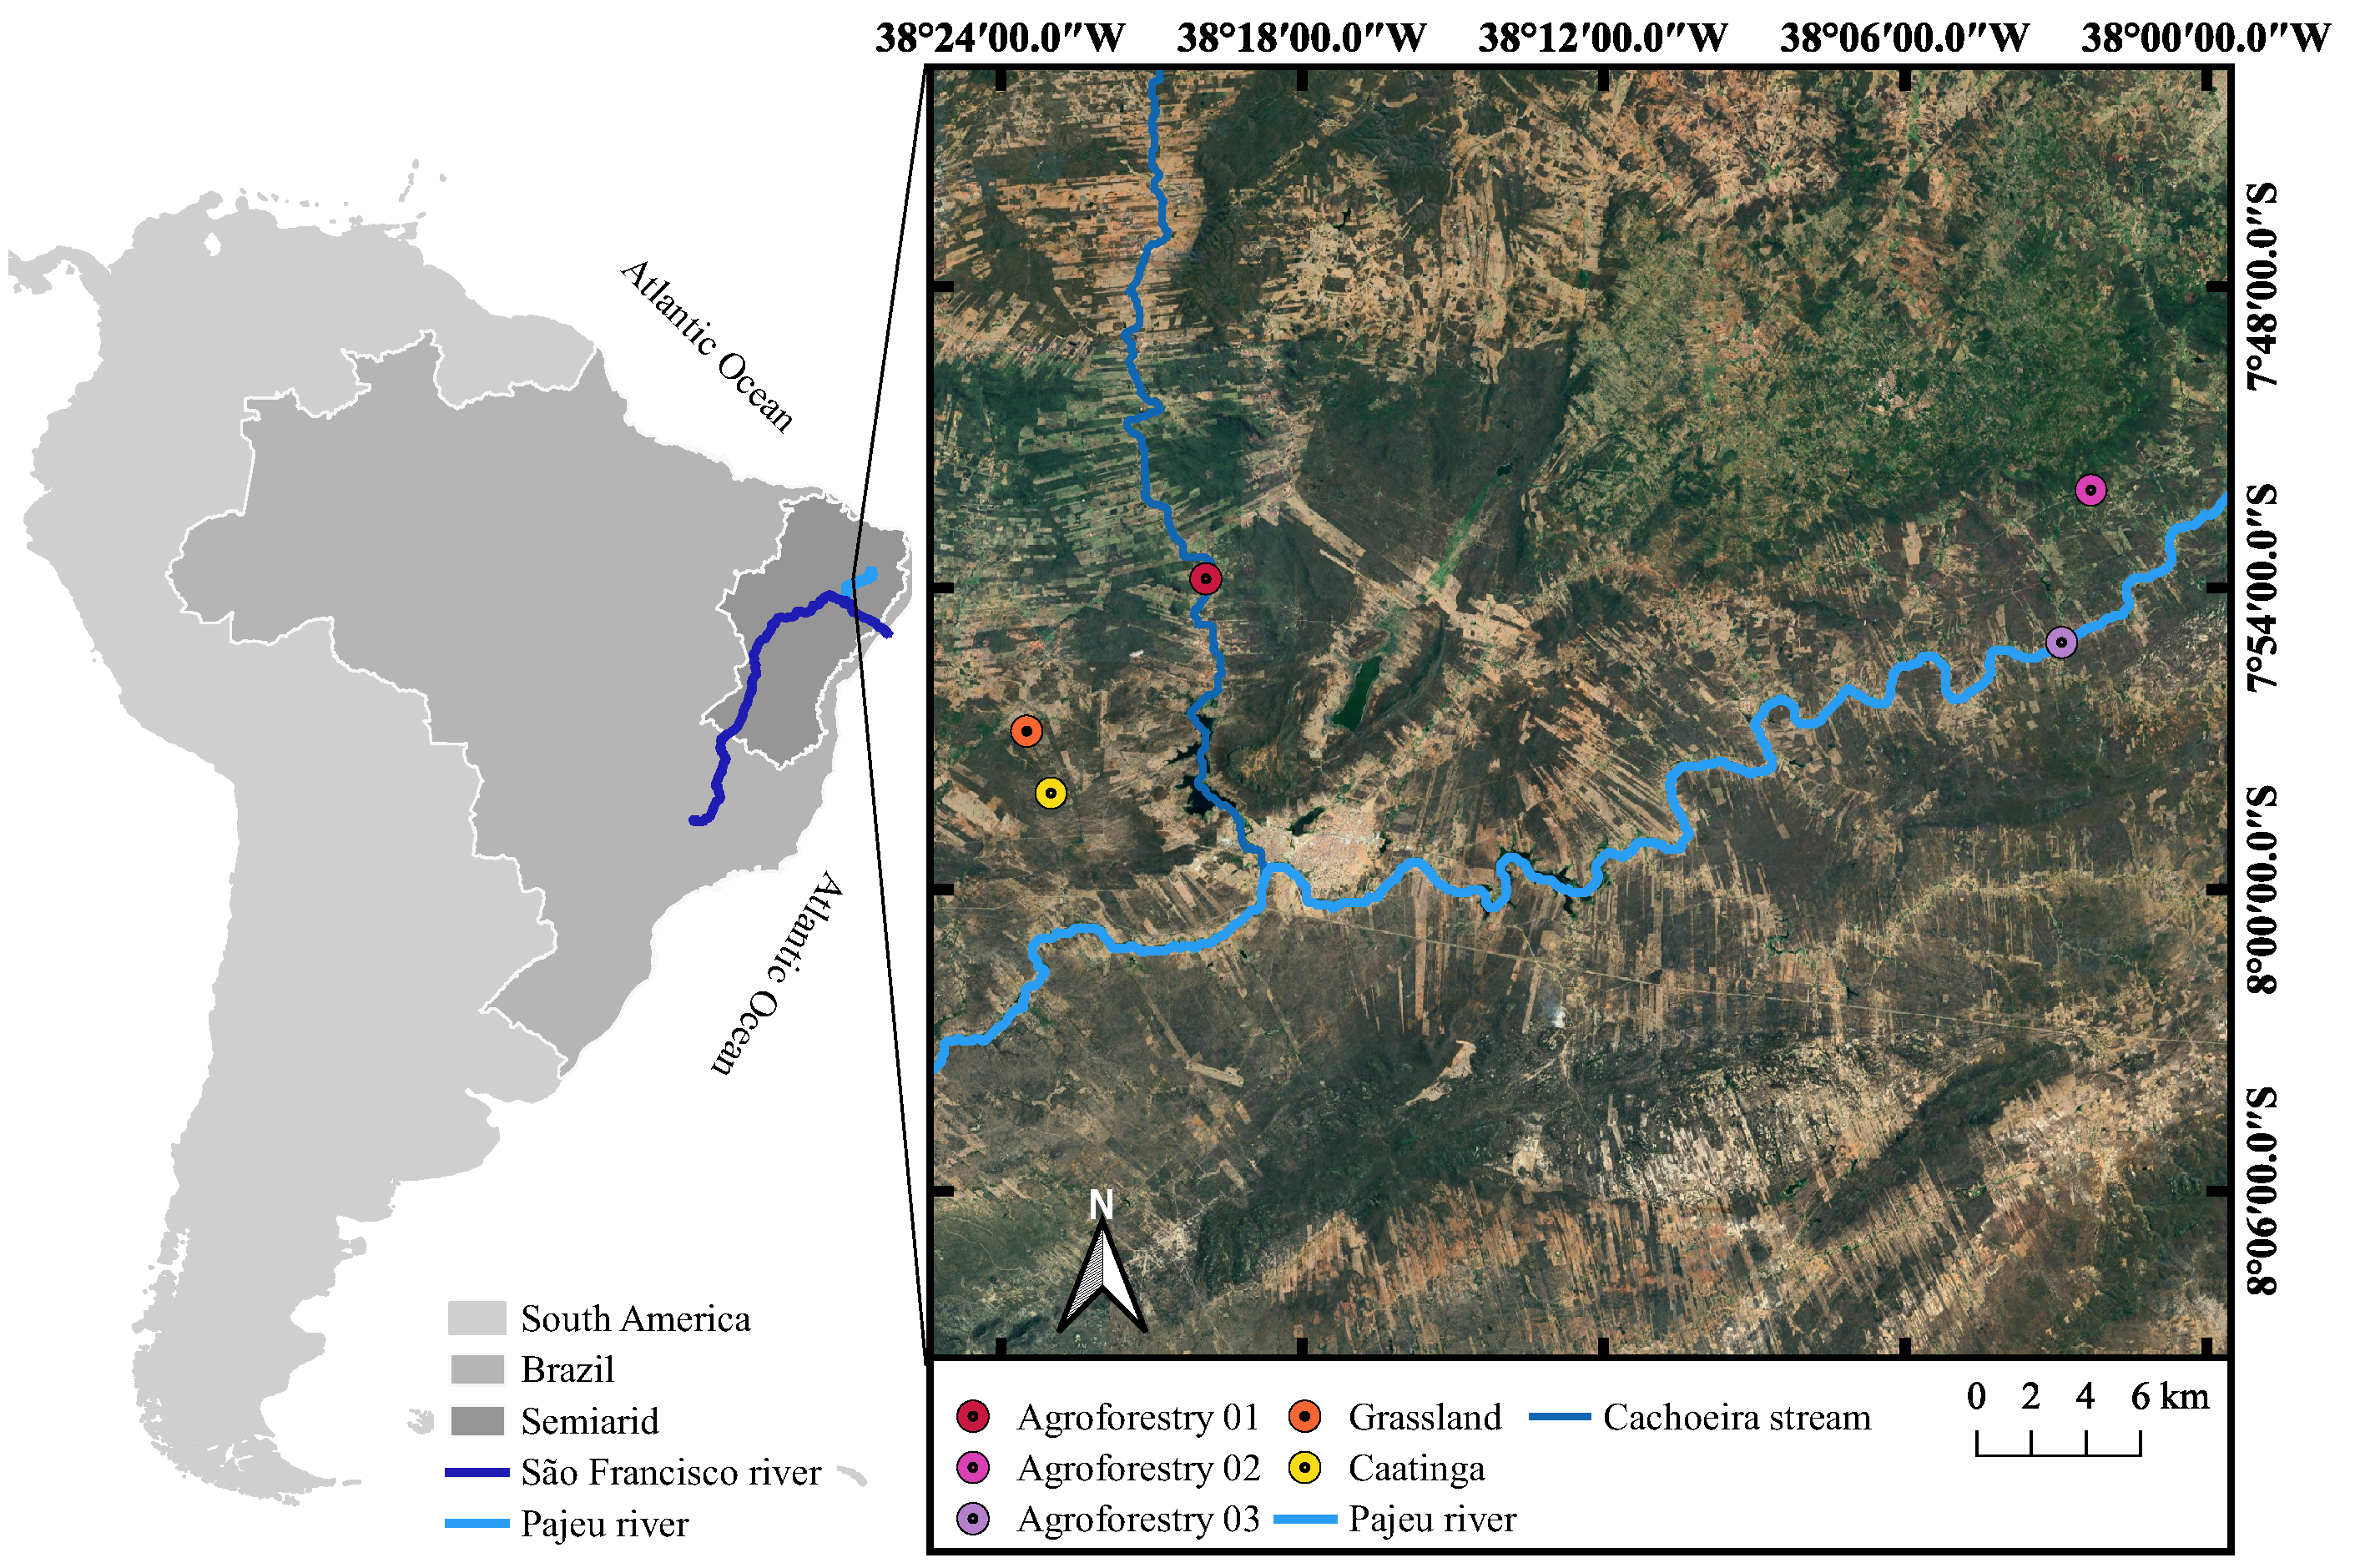
Figure 1. Overview of Brazil within South America, semiarid region, São Francisco River, Pajeu River, and experimental sites in Serra Talhada and Triunfo municipalities, Pernambuco state.
Sustainability 16 10652 g001
Figure 2. Installation scheme of PVC collars to monitor R t o t a l and R h e t (a), soil CO 2 flux system (LI-6400-09, LI-COR, Lincoln, NE, USA) (b), and collar at 30 cm depth with installation details. Components include (c), 1. collar with lateral windows lined with 0.5 μ m nylon mesh; 2. PVC slip coupling with rubber ring joint gaskets for sealing; 3. polyamide nylon billet; 4. single bevel-cutting ring with a flat outer edge for sharp ground cutting; and 5. hammer.
Sustainability 16 10652 g002
Figure 3. Dynamics of soil total ( R t o t a l ) (D) and heterotrophic ( R h e t ) (E) respirations, moisture (θv) (B), and soil temperature ( T s o i l ) (C) in grassland (GR), agroforests (AS), and native Caatinga vegetation (CA) systems in the semiarid region of Brazil. Subfigure (A) shows the average monthly rainfall in the region.
Sustainability 16 10652 g003
Figure 4. Seasonality of the root respiration rate ( R r o o t ) and its contribution to total soil respiration (RC) in grassland, agroforestry, and native Caatinga vegetation systems in the semiarid region of Brazil. Bars ± standard deviation represent R r o o t , while lines with points represent RC.
Sustainability 16 10652 g004
Figure 5. Quadratic relationships between soil respiration ( R t o t a l , R h e t , and R r o o t ) and soil moisture ( θ v) from March 2019 to May 2021 in grassland (GR), agroforestry (AS), and native Caatinga vegetation (CA) systems in the semiarid region of Brazil. Subfigures (A,D,G) illustrate the relationship between ( θ v) and ( R t o t a l , while subfigures (B,E,H), as well as (C,F,I), depict the relationships between ( θ v) and R h e t and R r o o t ), respectively.
Sustainability 16 10652 g005
Figure 6. Relationship between total, heterotrophic, and root soil respirations ( R t o t a l , R h e t , and R r o o t ) and soil surface temperature ( T s o i l ) from March 2019 to May 2021 in grassland (GR), agroforestry (AS), and native Caatinga vegetation (CA) systems in the semiarid region of Brazil. Subfigures (A,D,G) illustrate the relationship between ( T s o i l ) and ( R t o t a l , while subfigures (B,E,H), as well as (C,F,I), depict the relationships between ( T s o i l ) and R h e t and R r o o t ), respectively.
Sustainability 16 10652 g006
Figure 7. Diurnal variation in soil surface temperature and soil respiration ( R t o t a l , R h e t , and R r o o t ) from three different land uses (grassland, GR; agroforestry system, AS; and native Caatinga, CA) in the semiarid region of Brazil, during the dry (sugfigures AC) and rainy seasons (subfigures DF).
Sustainability 16 10652 g007
Table 1. Soil physical and chemical attributes (means ± standard deviation) of samples from the 0–10 cm superficial layer collected from areas with three different land uses in the Brazilian semiarid region.
GrasslandAgroforestryCaatinga
Physical attributes
Sand (g kg 1 )65.32 ± 2.5 59.04 ± 5.8 69.30 ± 6.4
Silt (g kg 1 )18.40 ± 2.8 31.60 ± 4.3 18.40 ± 3.2
Clay (g kg 1 )16.28 ± 1.1 9.36 ± 1.27 12.30 ± 5.2
Bulk Density (g cm 3 )1.61 ± 0.42 1.32 ± 0.68 1.45 ± 0.28
Particle Density (g cm 3 )2.61 ± 0.62 2.47 ± 0.88 2.57 ± 0.76
Total Porosity (%)38.3 ± 2.10 46.6 ± 2.71 43.6 ± 2.01
Textural ClassSandy LoamSandy LoamSandy Loam
Chemical attributes
pH ( H 2 O)7.30 ± 1.21 6.81 ± 1.69 7.11 ± 1.90
P (mg dm 3 )2.10 ± 1.39 3.87 ± 1.91 3.95 ± 1.88
Ca 2 + ( cmol c dm 3 )0.60 ± 0.19 1.30 ± 0.25 1.40 ± 0.31
Mg 2 + ( cmol c dm 3 )0.09 ± 0.02 0.16 ± 0.06 0.15 ± 0.06
Na + ( cmol c dm 3 )0.18 ± 0.01 0.76 ± 0.03 0.09 ± 0.02
K + ( cmol c dm 3 )0.32 ± 0.11 0.76 ± 0.16 0.78 ± 0.14
H 1 + + Al 3 + ( cmol c dm 3 )1.00 ± 0.00 1.00 ± 0.00 1.00 ± 0.00
SB ( cmol c dm 3 )1.19 ± 0.42 2.28 ± 0.80 2.42 ± 0.82
CEC ( cmol c dm 3 )2.19 ± 0.84 3.29 ± 1.19 3.42 ± 1.62
V (%)54.3 ± 1.04 69.6 ± 1.23 70.7 ± 2.03
m (%)0.0 ± 0.00 0.0 ± 0.00 0.0 ± 0.00
Organic Matter (%)1.40 ± 0.71 3.56 ± 1.09 3.47 ± 1.29
Sum of Base (SB) = Ca 2 + + Mg 2 + + K + + Na + ; Cation Exchange Capacity (CEC) = SB + ( H 1 + + Al 3 + ); Base Saturation (V) = (SB/CEC)·100; Aluminium Saturation (m) = ( Al 3 + /CEC) · 10.
Table 2. Pearson’s correlation between annual total soil respiration ( R t o t a l ), heterotrophic ( R h e t ) and root respiration ( R r o o t ), volumetric soil moisture ( θ v), and surface temperature ( T s o i l ) under three different land uses in the semiarid region of Pernambuco state, Brazil.
Respiration TypesGrasslandAgroforestryCaatinga
( μ mol m 2 s 1 ) θ v ( cm 3 cm 3 ) T soil (°C) θ v ( cm 3 cm 3 ) T soil (°C) θ v ( cm 3 cm 3 ) T soil (°C)
R t o t a l 0.87 ***−0.87 ***0.93 ***−0.95 ***0.91 ***−0.91 ***
R h e t 0.86 ***−0.85 ***0.91 ***−0.91 ***0.86 ***−0.87 ***
R r o o t 0.79 ***−0.87 ***0.89 ***−0.93 ***0.89 ***−0.86 ***
*** correlation statistically significant to p <0.001.
Table 3. Fitted parameters of exponential models for the relationship between annual soil respiration ( μ mol CO 2 m 2 s 1 ) and temperature ( T s o i l , °C) and Q 10 values for the three different land uses in the semiarid region of Brazil.
AreasExponential Models (Equation (2)) R 2 Q 10 (Equation (3))
Grassland R t o t a l = 94.2 × 10 0.094 T s o i l 0.76 ***0.39
R h e t = 93.7 × 10 0.094 T s o i l 0.71 ***0.37
R r o o t = 5.4 × 10 0.070 T s o i l 0.31 **0.49
Agroforestry R t o t a l = 42.22 × 10 0.063 T s o i l 0.94 ***0.53
R h e t = 22.6 × 10 0.056 T s o i l 0.84 ***0.57
R r o o t = 22.4 × 10 0.078 T s o i l 0.75 ***0.46
Caatinga R t o t a l = 854.9 × 10 0.195 T s o i l 0.92 ***0.14
R h e t = 851.7 × 10 0.209 T s o i l 0.86 **0.12
R r o o t = 101.86 × 10 0.162 T s o i l 0.52 **0.20
*** correlation statistically significant to p <0.001, ** correlation statistically significant to p <0.01.
Table 4. Total organic carbon (TOC), soil basal respiration (SBR), microbial biomass carbon (MBC), microbial quotient (qMic), and metabolic quotient ( qCO 2 ) in the dry and rainy seasons, in areas under three different land uses in the semiarid region of Pernambuco state, Brazil.
AttributesLayer (cm)GrasslandAgroforestryCaatinga
Dry Season
00–058.5 ± 2.11 bB21.4 ± 2.89 aB20.9 ± 2.51 aB
TOC (g C kg 1 )05–107.8 ± 1.69 bB18.6 ± 2.71 aB17.7 ± 2.21 aB
10–206.8 ± 1.21 bA14.7 ± 2.80 aB15.5 ± 2.09 aB
00–050.21 ± 0.04 cB0.52 ± 0.09 aB0.42 ± 0.04 bB
SBR (mg C- CO 2 kg 1 h 1 )05–100.18 ± 0.02 cB0.44 ± 0.11 aB0.37 ± 0.06 bB
10–200.14 ± 0.03 cA0.38 ± 0.10 aB0.32 ± 0.05 bB
00–05135 ± 3.41 cB525 ± 1.30 aB437 ± 1.50 bB
MBC (mg C kg 1 )05–10126 ± 2.51 cB498 ± 1.10 aB407 ± 1.22 bB
10–20113 ± 2.60 cA476 ± 1.41 aB388 ± 1.40 bB
00–051.58 ± 0.90 cA2.45 ± 0.78 aA2.12 ± 0.52 bB
qMic (%)05–101.61 ± 0.79 cB2.68 ± 0.41 aA2.30 ± 0.83 bB
10–201.59 ± 0.39 cB3.03 ± 0.60 aA2.51 ± 0.23 bB
00–051.55 ± 0.79 aB0.99 ± 0.52 bB0.96 ± 0.52 bB
qCO 2 (mg C- CO 2 g 1 C h 1 )05–101.35 ± 0.80 aB0.88 ± 0.47 bB0.90 ± 0.47 bB
10–201.24 ± 0.49 aB0.79 ± 0.9 bB0.82 ± 0.47 bB
Rainy Season
00–059.2 ± 2.78 bA24.1 ± 3.40 aA23.9 ± 3.19 aA
TOC (g C kg 1 )05–108.9 ± 2.20 bA20.4 ± 3.81 aA19.8 ± 3.39 aA
10–206.3 ± 1.62 bA16.9 ± 2.61 aA17.9 ± 2.70 aA
00–050.29 ± 0.03 cA0.67 ± 0.07 aA0.61 ± 0.04 bA
SBR (mg C- CO 2 kg 1 h 1 )05–100.21 ± 0.03 cA0.55 ± 0.09 aA0.48 ± 0.04 bA
10–200.16 ± 0.02 bA0.46 ± 0.08 aA0.45 ± 0.04 aA
00–05165 ± 2.33 cA598 ± 3.12 aA540 ± 2.92 bA
MBC (mg C kg 1 )05–10145 ± 2.12 cA547 ± 2.89 aA512 ± 2.59 bA
10–20115 ± 1.80 cA521 ± 2.72 aA479 ± 1.91 bA
00–051.58 ± 0.90 cA1.79 ± 1.81 bB2.48 ± 2.12 aA
qMic (%)05–101.86 ± 1.62 bA2.68 ± 2.22 aA2.58 ± 0.90 aA
10–201.83 ± 0.89 cA3.08 ± 1.92 aA2.67 ± 0.72 bA
00–051.76 ± 0.72 aA1.12 ± 0.28 bA1.13 ± 0.32 bA
qCO 2 (mg C- CO 2 g 1 C h 1 )05–101.45 ± 0.69 aA1.01 ± 0.34 bA0.94 ± 0.26 bA
10–201.40 ± 0.65 aA0.88 ± 0.25 bA0.94 ± 0.29 bA
Means (±standard deviation) followed by the same lowercase letter among areas and uppercase letter between seasons do not significantly differ using the Tukey test (p < 0.05).
Disclaimer/Publisher’s Note: The statements, opinions and data contained in all publications are solely those of the individual author(s) and contributor(s) and not of MDPI and/or the editor(s). MDPI and/or the editor(s) disclaim responsibility for any injury to people or property resulting from any ideas, methods, instructions or products referred to in the content.