Article

Assessing the Alignment of Brazilian Local Government Plans with the United Nations’ Sustainable Development Goals

by
Sylvestre A. Carvalho
1,2,*,
Lira L. B. Lazaro
1,
Andrea F. Young
1,
Rooney R. A. Coelho
1,
Fábio J. M. Ortega
1,
Carolina B. M. C. Hecksher
1,
José R. Cardoso
3,
João S. W. Ferreira
4,
Pedro R. Jacobi
1,5,
Arlindo P. Junior
1,6 and
Marcos S. Buckeridge
1,7,*
1
Institute for Advanced Study, University of Sao Paulo, Sao Paulo 05508-060, SP, Brazil
2
Department of Physics, Center of Physics, University of Coimbra, 3004-516 Coimbra, Portugal
3
Polytechnic School, University of São Paulo, Sao Paulo 05508-010, SP, Brazil
4
Faculty of Architecture and Urbanism, University of Sao Paulo, Sao Paulo 05508-080, SP, Brazil
5
Institute of Energy and the Environment, University of Sao Paulo, Sao Paulo 05508-900, SP, Brazil
6
Department of Environmental Health, School of Public Health, University of Sao Paulo, Sao Paulo 01246-904, SP, Brazil
7
Department of Botany, Institute of Biosciences, University of Sao Paulo, Sao Paulo 05508-090, SP, Brazil
*
Authors to whom correspondence should be addressed.
Sustainability 2024, 16(23), 10672; https://doi.org/10.3390/su162310672
Submission received: 10 October 2024 / Revised: 25 November 2024 / Accepted: 27 November 2024 / Published: 5 December 2024
(This article belongs to the Special Issue Nexus and Challenges in Environment and Health Toward SDGs)

Abstract

:
Government plans are crucial for strengthening democratic regimes by defining clear policies and priorities, and by serving as essential channels of communication with voters and social groups within electoral systems. The political commitment to align these plans with the United Nations Sustainable Development Goals (SDGs) of the 2030 Agenda reflects an effort to integrate global priorities into local agendas. Such alignment is critical for fostering sustainable and inclusive progress. However, despite its importance, research on the intersection between government plans and the SDGs remains limited. In this study, we used natural language processing (NLP), artificial intelligence, and statistical analysis to examine the government plans of ten candidates in the 2022 gubernatorial election in the Brazilian state of São Paulo. Our analysis identified key policy topics, explored patterns and trends, and assessed alignment with the 17 SDGs across the social (SDGs 1, 2, 3, 4, 5, 10, and 16), environmental (SDGs 6, 13, 14, and 15), and economic (SDGs 7, 8, 9, 11, and 12) dimensions. The findings emphasize the need for government plans that are more closely aligned with sustainable development goals and that demonstrate a strong political commitment to addressing critical issues, particularly the impacts of climate change. This is especially urgent for the state of São Paulo, which faces significant challenges, including natural disasters, heat waves, flooding, water scarcity, and infrastructure deficiencies.

1. Introduction

Local political actors and policymakers have increasingly embraced a “sense of great responsibility” and recognized the “immense opportunity”, as global leaders, to address challenges on a global scale, with the climate emergency arising in this context. The mantra of “global problem, local solution” advocates a localized or subnational strategy [1]. Ostrom [2] has emphasized that “national governments are too small to manage the global commons and too large to deal with smaller-scale problems”. The emphasis on locality underscores that the intersection of global challenges and the United Nations (UN)’ 2030 Agenda for Sustainable Development Goals (SDGs) cultivates a distinct political arena, producing locally tailored solutions in governance strategies and tangible outcomes.
In this context, national planning at hierarchical levels plays a critical role in elaborating strategies for electoral cycles and national priorities [3]. This planning involves the government plans of candidates and their respective parties, which are used to articulate public commitments [4] and to outline proposals, including goals, actions, prioritized agendas, guidelines, and strategies, to be implemented if elected [5,6]. These plans serve as a foundation for communication with voters during campaigns [7] and are deemed essential for fostering synergies among policies aimed at sustainable development [8]. They also play a vital role in enhancing the understanding of the political system [9], providing essential elements for control, including vertical, social, and horizontal accountability [10], and contributing to the strengthening of modern democracies [11].
For the implementation of the SDGs on a sub-national scale, local governments are encouraged to construct political agreements and to develop capacities to address challenges associated with economic, social, environmental, and institutional dimensions, directly impacting local communities [12]. However, the commitments made to voters during campaigns, particularly in government plans, can provide support for the implementation of these political agreements [12,13]. Analyzing the alignment of extensive government plans with SDGs can be challenging in countries with numerous political parties that are eligible for executive candidacies at various scales [12,14]. Therefore, it is imperative to assess the government plans and to determine their alignment with the SDGs, as well as their political impact at national and subnational levels in addressing pressing challenges [15,16].
To quantitatively and qualitatively assess a set of government plans of candidates running for the position of governor in the 2022 Brazilian general elections for São Paulo state and their alignment with the SDGs, we propose the integration of computational tools based on natural language processing (NLP), artificial intelligence, and statistical techniques. São Paulo, which has 44.04 million inhabitants, holds significant economic and political influence in Brazil. It boasts the highest gross domestic product (GDP) among Brazilian states, constituting 9.8% of the national total, more than twice that of the second-ranked state, Rio de Janeiro [17]. Globally, São Paulo ranks 14th in economic terms [18].
Through artificial intelligence tools, topic modelling and perception analysis, this research seeks to address the following sets of questions:
(1)
What are the main topics derived from ten government plans in the 2022 elections in São Paulo? What is the percentage coverage of these topics in individual plans? What are the patterns of association between documents and topics?
(2)
How are the documents aesthetically organized? How do the identified topics stand out in the documents?
(3)
What are the percentages of alignment between the agendas of the government plans and the SDGs? What is the similarity between government plan agendas and SDG targets?
The existing literature underscores the limited awareness among local decision makers regarding the SDGs, posing challenges in terms of prioritizing and effectively addressing them [12,19]. This lack of awareness, coupled with competing priorities, such as economic development, can divert attention from the SDGs [19]. Moreover, the methodologies proposed in this work can be extended for application in general executive elections, beyond the Brazilian context and irrespective of executive levels or similar political systems worldwide. This approach offers voters a rapid and deep comprehensive analysis of the planning, management, and regulation of public policies outlined in government plans.
The remainder of the work is structured as follows: Section 2 provides the context for Brazilian policy and illustrates the application of NLP to government plans related to all candidates running for the office of governor of São Paulo in the 2022 Brazilian general elections. Section 3 introduces the methods and data used in our analysis. Section 4 presents and interprets the results, Section 5 discusses the results and Section 6 concludes the study with policy implications.

2. Electoral Context, Government Plans, SDGs and NLP Analysis

2.1. Brazilian Electoral Context

Brazil is a federative and constitutional republic with a presidential system of government structured at three levels: federal, state (26 states and a federal district), and municipal [20]. The Brazilian electoral system comprises a set of rules that determine the framework of each election, subject to changes in response to societal shifts [21]. Electors express their preferences through votes, which translate into mandates, legislative seats, or executive leadership [22]. Since the 1988 Constitution, Brazil has employed two different electoral rules: the president, governors, and mayors of cities with more than 200,000 voters are elected by a two-round system; for there to be no second round, the candidate must receive more than 50% of the votes in the first round. Mayors of cities with fewer than 200,000 voters are elected by a simple majority [23].
As of October 2023, the Brazilian political landscape comprises 33 active political parties registered with the Superior Electoral Court (TSE), all of which are authorized to field candidates in Brazilian electoral processes [24]. This array of political parties contributes to a diverse political panorama, characterized by varied representations of interests and ideological leanings [25].
The Political Parties Law (Law No. 9.096/1995) establishes guidelines and norms governing the organization and operation of political parties in Brazil [26]. Among the obligations is the requirement that parties present a government plan when registering their candidacies for executive positions at all three levels: municipal, state, and federal [27]. This obligation was incorporated into electoral legislation (Law No. 9.504/1997) through Law No. 12.034 of 2009 [27].

2.2. Government Plans and SDGs

In contemporary democracies, government plans are essential for addressing citizens’ needs, upholding the rule of law, and promoting transparency and accountability. These plans play a crucial role in shaping and sustaining a democratic society [23,28,29]. However, despite their importance, they have been overlooked in political literature [16], and most lack a direct relationship with the SDGs [30]. There is a growing call for including multilevel and interdisciplinary proposals in government platforms at both national and sub-national levels [3,8,31]. These proposals should cover various issues, including poverty eradication, zero hunger, access to health, clean water, sanitation, quality education, gender equality, decent work, economic growth, innovation, inequality reduction, sustainable urban development, climate action and other SDGs [32,33].
Since the SDGs’ implementation in 2016, a critical question has been their policy impact at subnational, national, and global levels [15]. A recent UN report indicates slow progress or regression on most goals since 2015 [34]. This raises concerns about whether and how policymakers are integrating SDG themes into their planning across all policy levels. Research shows that the interrelationship between the 17 SDGs and local plans is complex, requiring empirical investigation [35,36,37]. While some studies highlight interlinkages among the goals [38,39,40], the potential influence of the SDGs on regional policy plans remains underexplored [41,42], especially regarding factors like governance, regulations, and business sector involvement [43,44].
Regional collaboration under the SDGs is essential for integrating local government actions, identifying interconnected elements, and engaging in principled actions to address urbanization intersections [12,14,45]. A study in Norway [46] has found that interdisciplinary collaboration and sectoral coordination during action plan development can facilitate SDG implementation in local and regional planning. However, there is a notable lack of integration of contextual mechanisms into decision-support tools for the implementation of SDGs [47]. Guidelines for sectoral integration play a significant role in assessing the content of plans through various methodologies [48]. Integration across policy domains remains challenging, particularly in recognizing trade-offs and interactions with the SDGs [49]. Identifying and monitoring decision makers and reviewing political documents are necessary for evaluating implementation strategies [50]. Computational tools have significant potential for optimizing this process [51].

2.3. Natural Language Processing (NLP) Applied to Government Plans

NLP models can identify and discern patterns in texts based on extensive datasets used during their training [52], enabling them to find similarities between input texts and predefined categories from these databases [53]. Specifically, topic modeling extracts topics and themes from documents, offering valuable insights and analyses on the presented content [54,55]. The use of deep learning language models (LLMs), such as OpenAI’s ChatGPT, has significantly impacted various fields of study [56], particularly in identifying converging concepts from multiple data sources, which is pertinent in scientific and academic research [52,53].
As these models become more integrated into academic research, it is crucial to adopt a careful and ethical approach [53,54]. Gilat and Cole emphasize the need to be vigilant about potential errors and biases when using OpenAI’s model [57]. To ensure ethical standards, studies using ChatGPT should undergo thorough examination and validation [53,57]. Oversight of AI-generated content is essential, with authors ensuring the accuracy and truthfulness of the information [57]. Despite these concerns, the appropriate use of LLMs can enhance research excellence, provided experts are involved in incorporating these tools responsibly [54,58].
The advancement of embeddings, high-dimensional vectors encapsulating semantic and syntactic relationships in textual data, marks a significant development in LLMs [59]. These embeddings are crucial for tasks like search algorithms, sentiment analysis, language translation, and text classification [59,60]. OpenAI’s text-ada-002 model, although not open-source, is accessible through an API and transforms texts into 1536-dimensional vectors, enhancing processing and precision in handling complex textual data [61,62]. Despite advancements in NLP applications, their usage in the political domain, particularly within Brazilian political science, remains under-explored [63,64,65]. Utilizing NLP in this context can alter perceptions of local parties, highlighting their commitment to platforms and public commitments in detecting problems [29,66,67], attributing causality, forming coalitions, and proposing policy solutions [68].

3. Material and Methods

In this study, we collected and analyzed data from the ten government plans related to all candidates running for the office of governor of São Paulo in the 2022 Brazilian general elections [69]. Each document has distinct analytical characteristics, such as the number of pages and proposed actions (refer to Supplemental Figure S7 for more details). The study also includes the 169 targets of the UN’s 2030 Agenda for SDGs [32]. To avoid confusion when discussing the government plans of each party or coalition, we refer to them using the acronym of the party that each candidate is affiliated with, as follows: Democracia Cristã (DC), NOVO, Partido Comunista Brasileiro (PCB), Partido da Causa Operária (PCO), Partido Democrático Trabalhista (PDT), Partido da Social Democracia Brasileira (PSDB), Partido Socialista dos Trabalhadores Unificado (PSTU), Partido dos Trabalhadores (PT), Republicanos (REP), and União Popular (UP).
Our study is divided into four parts. In the first two, the government plans are analyzed both as a whole and individually, considering all textual information within them. In the latter two parts, the government plans are compared against the SDGs, focusing only on the agendas that are addressed in the plans.

3.1. Topic Modelling Applied to Government Plans

We employed topic modelling to describe themes based on the probability of their characteristic words. Latent Dirichlet allocation (LDA), and a generative probabilistic model were utilized to represent documents as random mixtures over latent topics. Each topic was characterized by a distribution over words [70]. LDA was combined with Gibbs sampling to identify themes (or topics) within the document collection, assuming each document reflects a combination of these topics [70,71]. In this context, in statistically meaningful ways, a topic is defined as a list of words that co-occur, forming a distribution over a fixed vocabulary of terms.
Following the topic modelling analysis, we performed several operations to deepen our understanding of the themes. These included exploring the characteristics of each theme, analyzing the relationships between various themes, assessing the semantic coherence of each theme, testing the model, and applying the model by creating a new thematic variable with values representing the identified topics. We employed multidimensional scaling (MDS), multiple correspondence analysis (MCA), and network analysis for a comprehensive analysis. Detailed explanations of these methods and their applications to our analysis can be found in the Supporting Information.

3.2. Perception Analysis of Government Plan

Structured documents provide a logical and clear organization of the content, facilitating comprehension by readers. The plan organization allows readers to quickly grasp the key points and proposals. The use of references is essential for providing credit to the sources used in the government plans, ensuring that political agendas are well founded. This also enables readers to access the original sources for further information. Following a logical structure confers a professional presentation to the document, conveying credibility and seriousness to the candidate/political party and the content presented.
In the second stage, a working group (WG) consisting of 5 researchers reviewed the documents and applied qualitative perception methods. Metrics were developed to classify government plans and assess the emergence of thematic discourse categories. Initially, the formal characteristics, j , of government plans were evaluated, including the presence of a cover, table of contents, introduction, pagination (number of pages), statistical references (data), theoretical references (framework), journalistic references, and URL links. Using binary analysis, the frequency of each formal characteristic, n j , was computed, as follows:
n j = i = 1 l x i
Here, l represents the total number of WG members. The variable x i denotes the assessment by the ith WG member for characteristic j , which can take two values, as follows:
x i = 0 , if   the   formal   c h a r a c t e r i s t i c   i s   a b s e n t       1 ,                                                                                             o t h e r w i s e .    
If n j 0 is the number of times the value 0 (absence) appears and n j 1 is the number of times the value 1 (presence) appears, the statistical mode is determined as follows:
M o d e j = 0 ,                     i f   n j 0 > n j 1     1 ,                     o t h e r w i s e .    
In this scenario, it is impossible for n j 0 to be equal to n j 1 . We present the most frequent value among the assessments based on the statistical model in a table, shown in Section 4.2.
Next, the N = 19 topics obtained from topic modeling in the initial stage were evaluated by each WG member on a scale from 0 to 3, where 0 indicated “not informative”, 1 indicated “little information”, 2 indicated “moderate amount of information”, and 3 indicated “highly informative”. The statistical mean ( x ¯ ) of the WG members’ perceptions for each topic, T i , was calculated as follows:
x ¯ T i = 1 n j = 1 n x T i ,   j
where x T i ,   j is the rating given by the j t h WG member for topic T i . The results are depicted using radar charts, as illustrated in Section 4.2.
Finally, the percentage of topic coverage ( ε ) was calculated as the ratio between the area enclosed by the curve delimited by the polygon A p and the area of a circle with a radius equal to 3 A T in the radar chart [72]. This is expressed by Equation (5), as follows:
ε = A p A T × 100 %
Similarly, the same metrics can be numerically defined as the proportion of topics addressed by each political party in its government plan, where A p is defined as follows:
A p = i = 1 N x ¯ T i
This represents the sum of the mean values of the perceptual analysis associated with all N topics ( T i ) assessed within each government plan when topics were partially covered. The value of A T is calculated as follows:
A T = N × m a x r a t i n g = 57
Here m a x r a t i n g = 3 represents the highest informative rating given, indicating complete coverage of all topics in each government plan.

3.3. Measuring the Relationship Between SDGs and Government Plans

In the third stage of our methodology, we evaluated the alignment between agendas extracted from government plans and the UN’s SDGs outlined in Agenda 2030. Initially, we utilized Atlas.ti (Version 23.4) to identify political proposals based on specific linguistic criteria, including the presence of infinitive verbs and characteristics distinguishing proposals from informative texts. Selected segments were exported to a text file and individually assessed using OpenAI’s ChatGPT 3.5 version. We employed a predefined prompt: “List the Sustainable Development Goals contained in the following agenda”. ChatGPT categorized each proposal P i k , representing the ith agenda associated with the kth government plan, with none, one, or more SDGs, providing justifications for each classification.
To operationalize the alignment assessment, we introduced a correlation function C P i k , S q k to categorize each political proposal P i k with respect to the SDGs S q k , as follows:
C P i k , S q k = 1 ,   i f   P i k   i s   c a t e g o r i z e d   w i t h   S q k       0 ,     o t h e r w i s e
Subsequently, outputs underwent review and refinement for accuracy and expert validation. Individual agendas were then codified using codes corresponding to the number of SDGs in Atlas.ti. Using the correlation function C P i k , S q k , we constructed a correlation matrix C with dimensions j × l , where j is the number of SDGs and l is the number of governments plan, given as follows:
C P i k , S q k = C P 1 k , S 1 k C P 1 k , S l k C P j k , S 1 k C P j k , S l k
If n j , k is the number of proposals of the j-th government plan aligned to k-th SDG,
n j , k = i q C P i k , S q k
then the co-occurrence matrix M , measuring the proportion of proposals related to each SDG within a specific government plan, is defined as follows:
M i , j = n i , k N j
where N j is the total number of agendas associated to j-th government plan. Supplemental Figure S7 shows the total number of agendas proposed by each political party.
Heatmap representation based on the co-occurrence matrix M was generated to visualize the relationships and distribution of proposals concerning the SDGs, as shown in Section 4.2. This methodological approach facilitates the mass categorization of proposals, significantly reducing the overall analysis time compared with estimates if conducted solely by the WG.

3.4. Measuring the Relationship Between Targets of SDGs and Government Plans

In the final stage of our methodology, we utilized OpenAI’s text-embedding-ada-002 model [73] to compute the distance matrix D between a set of 169 SDG targets and agendas extracted from government plans. Embeddings offered a numerical representation of textual contents, facilitating efficient semantic analysis [74]. Initially, we compiled a comprehensive spreadsheet containing all public agenda proposals extracted from government plans, meticulously mapping each agenda item to ensure accuracy. The matrix D was constructed using cosine similarity c o s s i m x , y to gauge the similarity between the embeddings of SDG targets and agenda items, as follows:
D i , j = c o s s i m e m b e d d i n g S D G i , e m b e d d i n g A g e n d a j
Using matrix D , we established similarity intervals for the SDG targets and policy agendas by categorizing the distances into quartiles based on their similarity scores. Let Q 1 ,   Q 2 ,   Q 3 , and Q 4 denote the quartiles, such that
Q 1 f i r s t   q u a r t i l e   s c o r e s Q 2 s e c o n d   q u a r t i l e   s c o r e s Q 3 t h i r d   q u a r t i l e   s c o r e s Q 4
The third quartile Q 3 was identified as the benchmark similarity threshold θ = Q 3 for semantic textual similarity (STS). Subsequently, the spreadsheet was vectorized using the text-embedding-ada-002 model, allowing for a nuanced understanding of the semantic overlap between government agendas and SDG targets. Our methodology facilitated and enabled a quantitative assessment of the coverage of UN SDGs within government plans, quantifying the extent of alignment between proposed agendas and SDG objectives. This quantitative analysis provided valuable insights into the alignment between governmental initiatives and global sustainability goals.

4. Results

4.1. Topic Modeling Applied to Government Plans

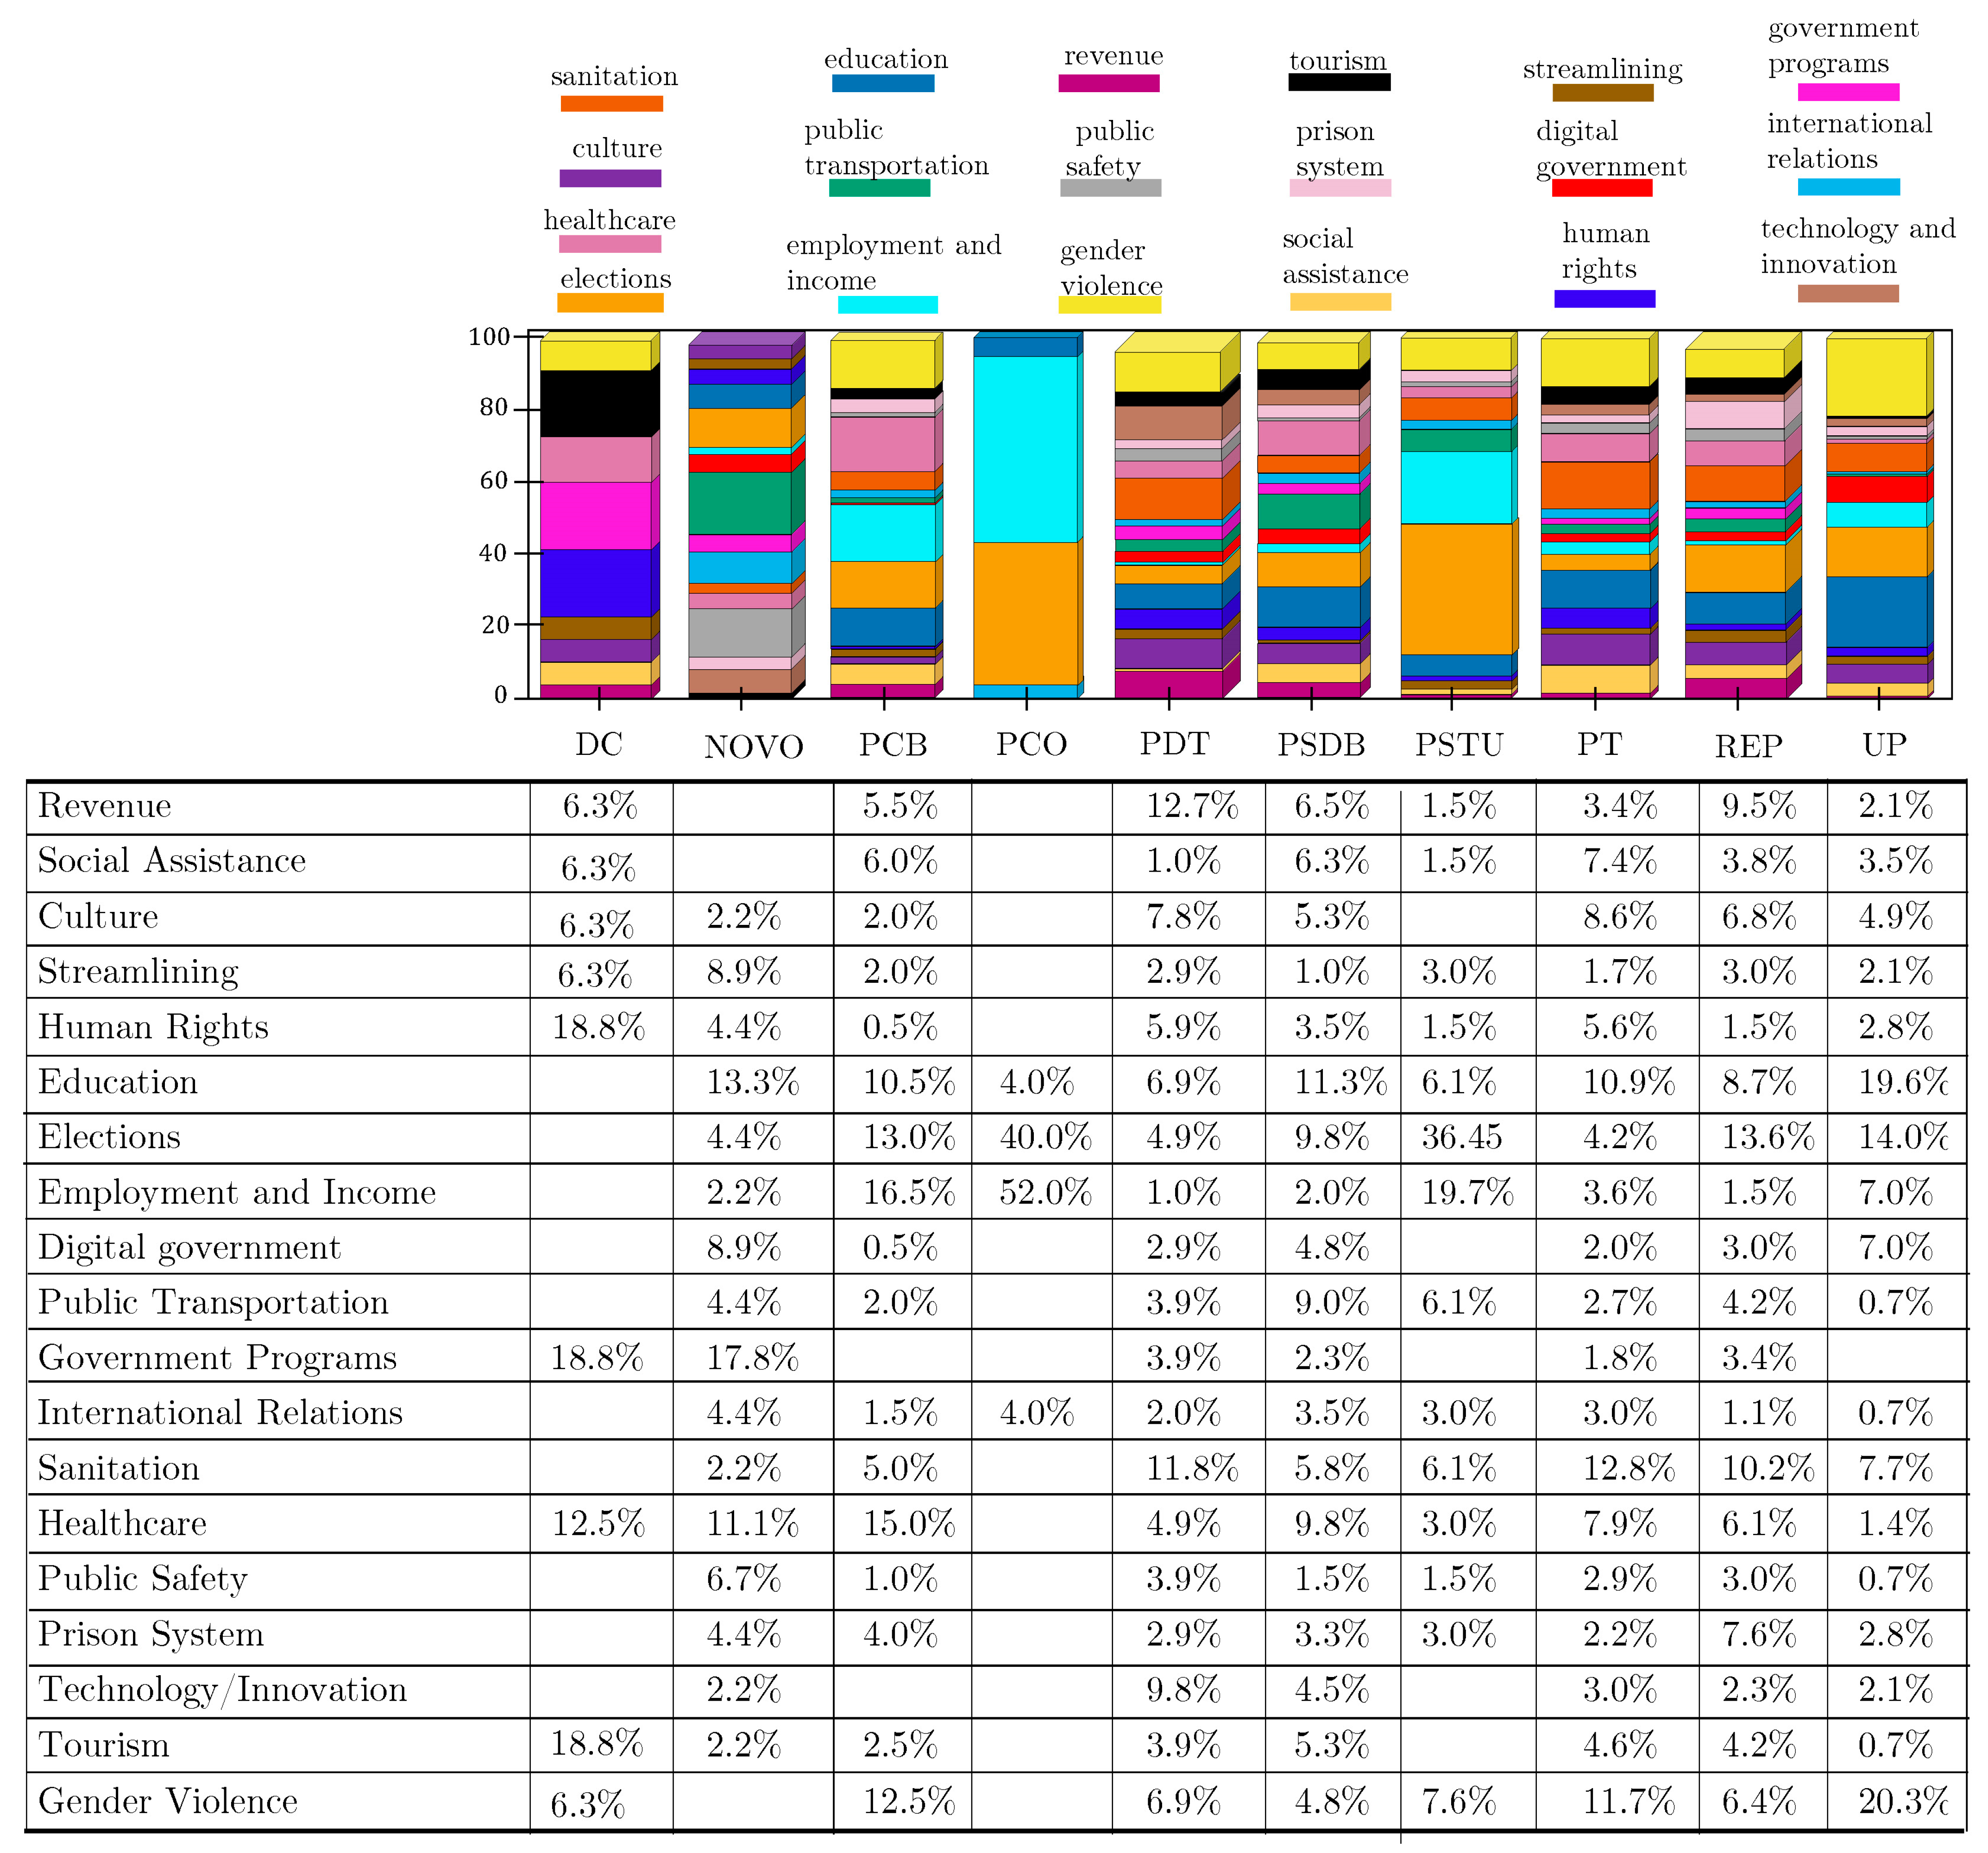
The topic modelling identified 19 topics from our dataset, which resulted from the integration of 10 government plans into a single document corpus. Figure 1 shows the occurrence of these topics, and we ranked them in descending order, as follows: education, elections (electoral system), gender violence, sanitation, healthcare, culture, employment and income, social assistance, revenue, public transportation, human rights, the prison system, tourism, digital government, technology and innovation, international relations, public safety, government programs, and streamlining. Supplementary Table S1 presents the nineteen most frequent words in each topic, while Supplementary Figure S1 illustrates the frequency of the top five words for each topic. To ensure the accuracy of topic identification, two experts specializing in deep learning and social media analytics were invited to perform the labelling. Both experts meticulously examined the prevailing word representations, inspected their c-TF-IDF scores, and achieved consensus through thorough discussion. These results offer a concise overview of the most extensively covered topics within the document set, highlighting the priorities and primary concerns of executive government candidates.
To further characterize these government plans, we conducted an individual assessment of topic coverage within each document. Figure 2 illustrates the percentage of each topic covered in documents represented by the acronyms of the respective political parties. The analysis revealed that the PCO had the least thematic coverage, addressing only the following four topics: “education”, “employment and income”, “elections”, and “international relations”, with the “employment and income” topic occupying 52% of their document. In contrast, parties such as PDT, PSDB, PT, and REP addressed all 19 topics in their respective government plans, indicating a broader diversity of themes covered. The most relevant topics for these parties were “revenue” for PDT with 12.7%, “education” for PSDB with 11.3%, “sanitation” for PT with 12.8%, and “elections” for REP with 13.6%. Additionally, Supplemental Figure S5 shows that the topic of “gender violence” had a higher occurrence only for the PT party, followed by UP, PCB, PSDB, and REP. In contrast, the NOVO and PCO parties had negligible representation, with 0% occurrence. Supplemental Figures S3–S5 provide a comparative analysis of topic occurrences among parties, illustrating how different political groups prioritize and emphasize distinct issues based on their specific agendas and priorities.
The topics “education”, “gender violence”, “sanitation”, “healthcare”, “employment and income”, “technology and innovation”, “human rights”, “public safety”, and “international relations” appear to have potential connections with certain SDGs. For example, the “education” topic could relate to SDG-4, which aims to promote quality education for all, and “sanitation” to SDG-6 (Clean Water and Sanitation). Similarly, “gender violence” may align with SDG-5, which seeks to achieve gender equality, while “healthcare” seems to correspond to SDG-3 (Good Health and Well-being). Furthermore, “employment and income” can be linked to SDG-8, which aims toward sustainable economic growth and decent work. The topic “technology and innovation” relates to SDG-9 (Industry, Innovation, and Infrastructure), and “international relations” to SDG-17 (Partnerships for the Goals). Finally, the topics “human rights” and “public safety”, may connect to SDG-16 (Peace, Justice, and Strong Institutions).
Conversely, though topics such as “elections”, “social assistance”, “culture”, “revenue”, “prison system”, “tourism”, “digital government”, “government programs”, “public transportation” and “streamlining” may not explicitly align with the SDGs, they could hold significance within secondary contexts. For example, while targets 16.6 and 16.7, associated with SDG-16, may involve the electoral process, the “elections” topic emerges in government plans due to specific incidents during the 2022 Brazilian elections. In particular, several attacks on the Brazilian electoral system and democracy, particularly concerning the electronic voting system, were made by the incumbent candidate during the national election, which occurred concurrently with state elections. Hence, this resonated in São Paulo government plans, leading to the urgency of this topic. The “social assistance” topic addresses programs like Bom Prato (a government meal program) and the Population in Street Situations (PISS) program—see Supplemental Table S1—which, although not directly linked to specific SDGs, could indirectly contribute to their advancement through effective policy associated with SDG-1 (No Poverty), SDG-2 (Zero Hunger), and SDG-16 (Peace, Justice, and Strong Institutions).
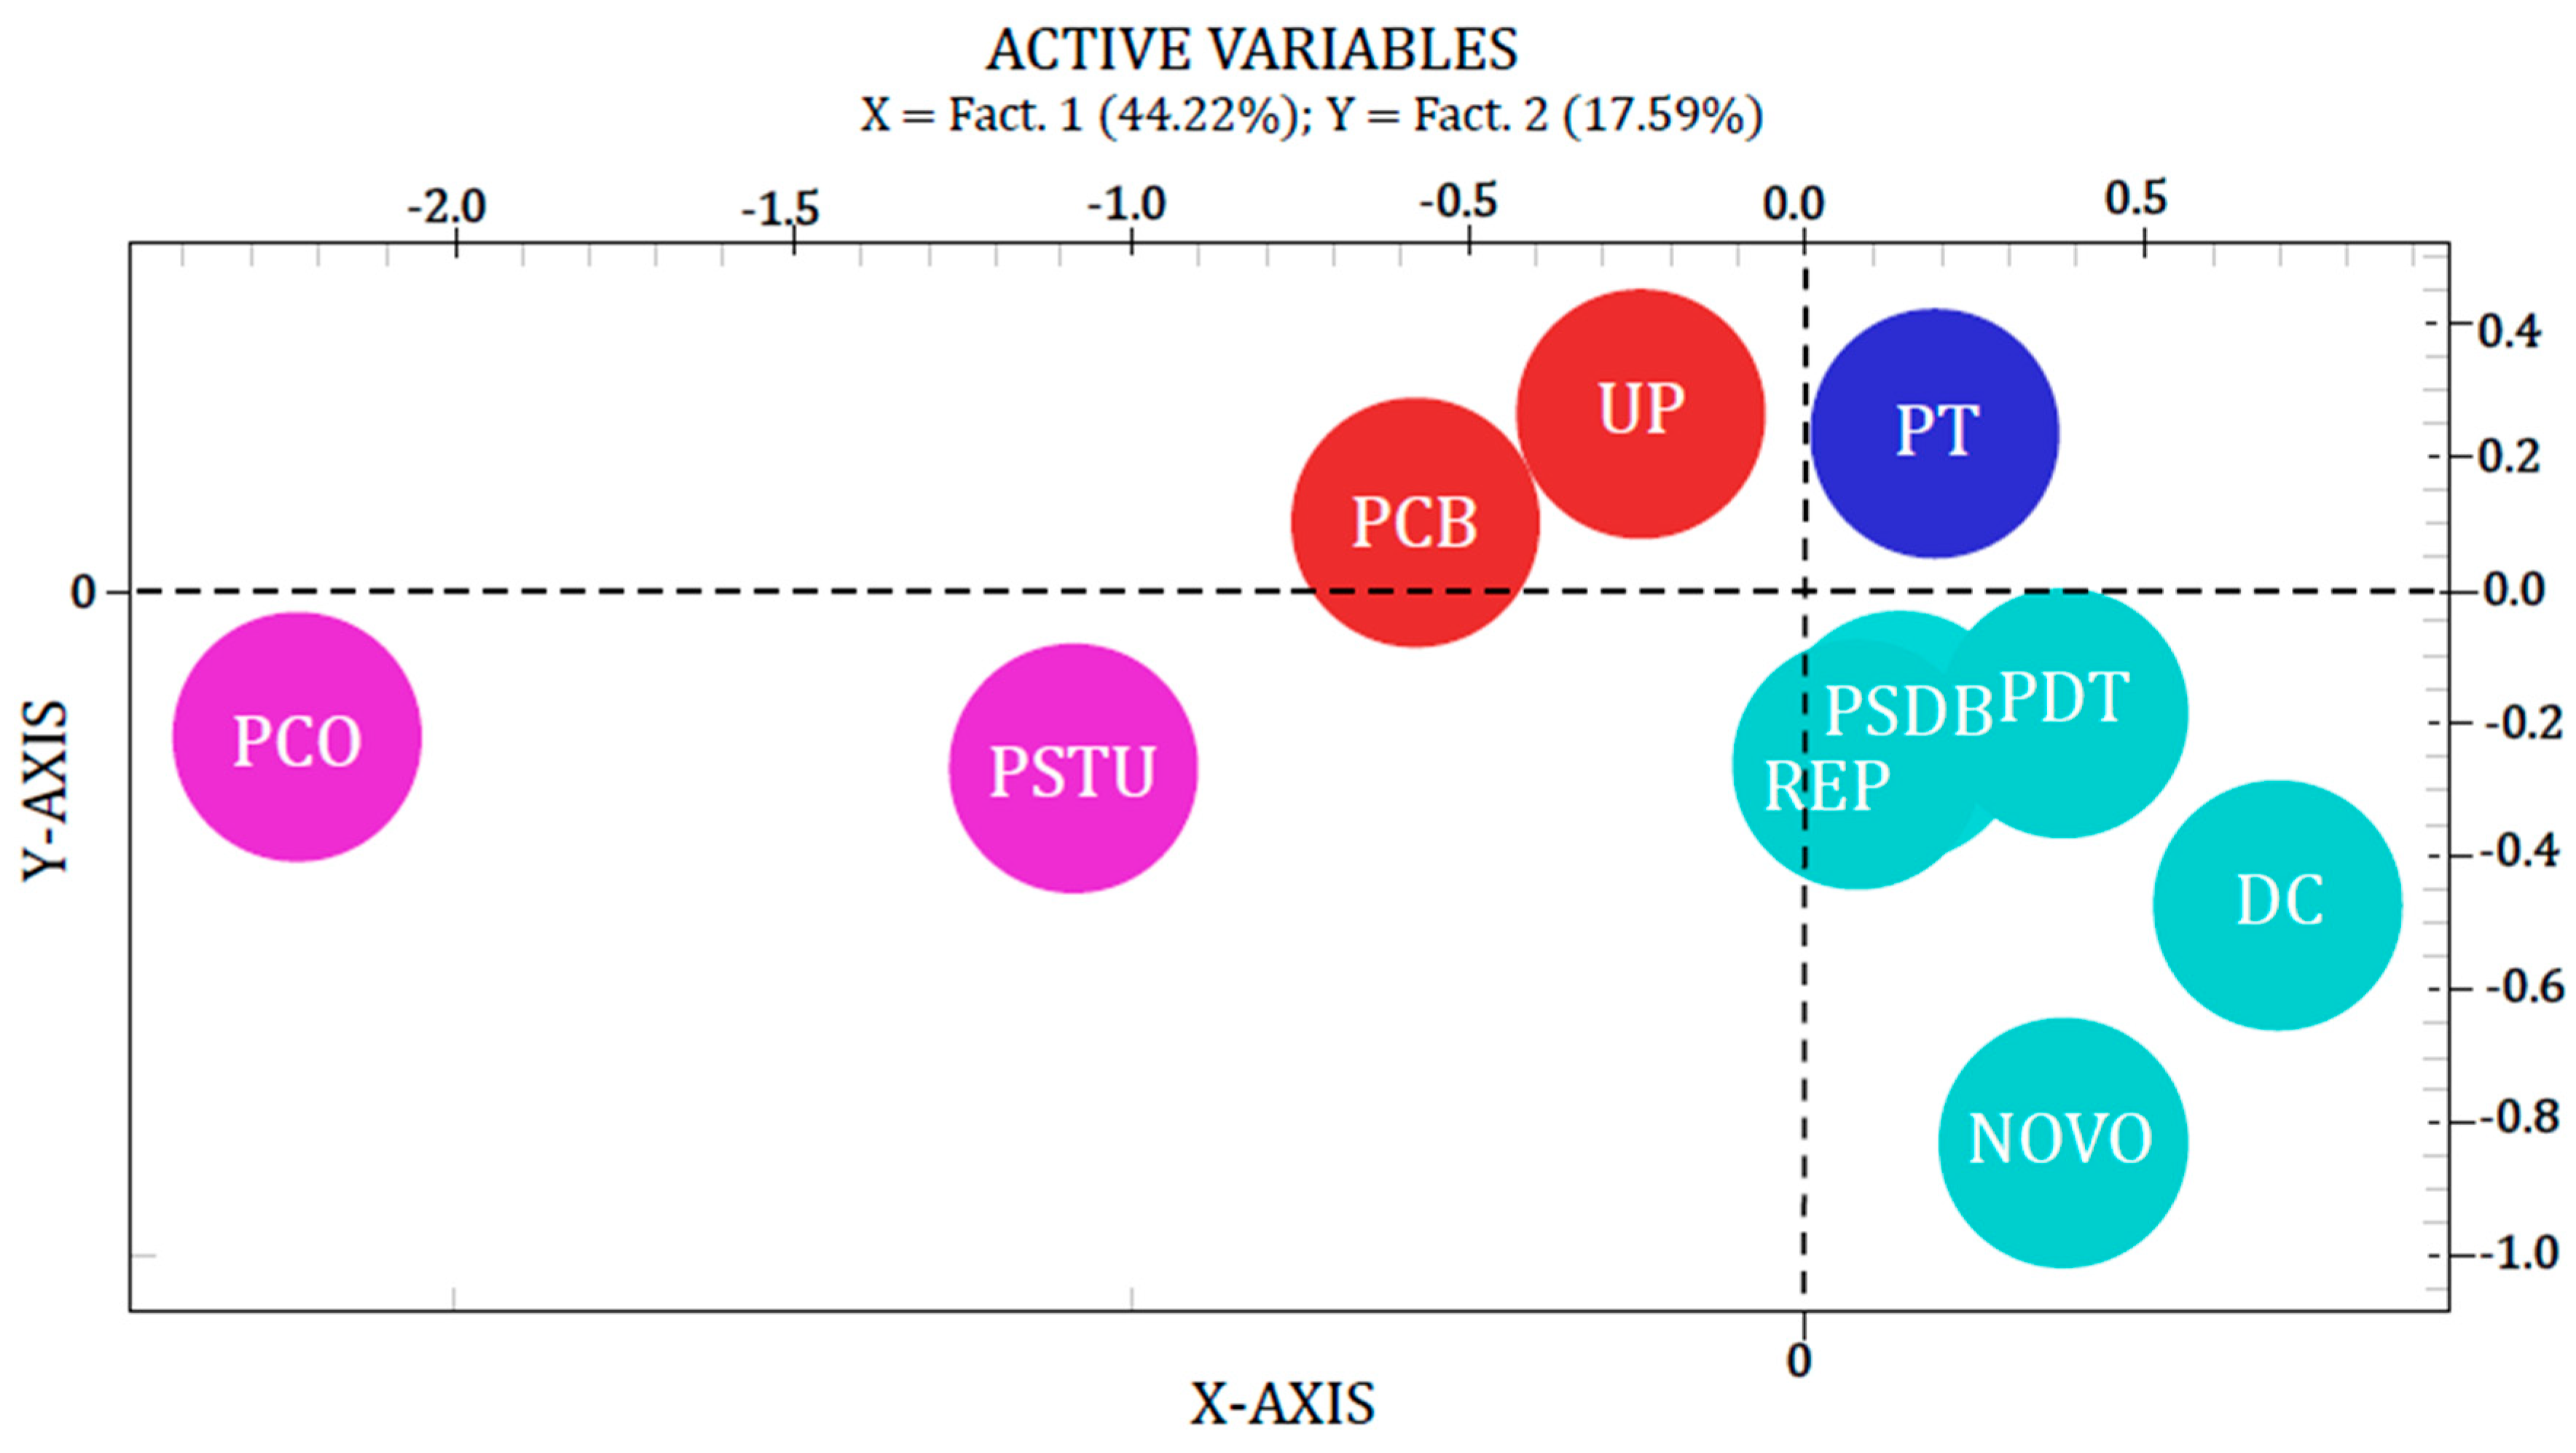
We conducted a correspondence analysis of political party documents, as depicted in Figure 3, to assess their proximities, distances, similarities, and dissimilarities in terms of proposals, ideologies, and political approaches. This analytical approach reflects associations among categorical variables and is valuable for exploring relationships and patterns within complex datasets, enabling the identification of potential relationships among parties and providing insights into their positions and affinities within the political scenario. By visually representing the associations between different documents, correspondence analysis helps uncover meaningful insights and identify potential correlations [55]. The results reveal that the political party documents are clustered into four distinct groups distributed across four quadrants. In the first quadrant (top right, marked by blue bubbles), the PT party stands alone. The second quadrant (top left, represented by red bubbles) features the PCB and UP parties. The third quadrant (bottom left, indicated by purple bubbles) contains the group consisting of the PCO and PSTU parties. The most extensive cluster, situated in the fourth quadrant (bottom right, represented by cyan bubbles), encompasses the REP, NOVO, DC, PSDB, and PDT parties. Such insights are valuable for understanding political dynamics and possible alliances that may arise during elections or in case of runoff elections.
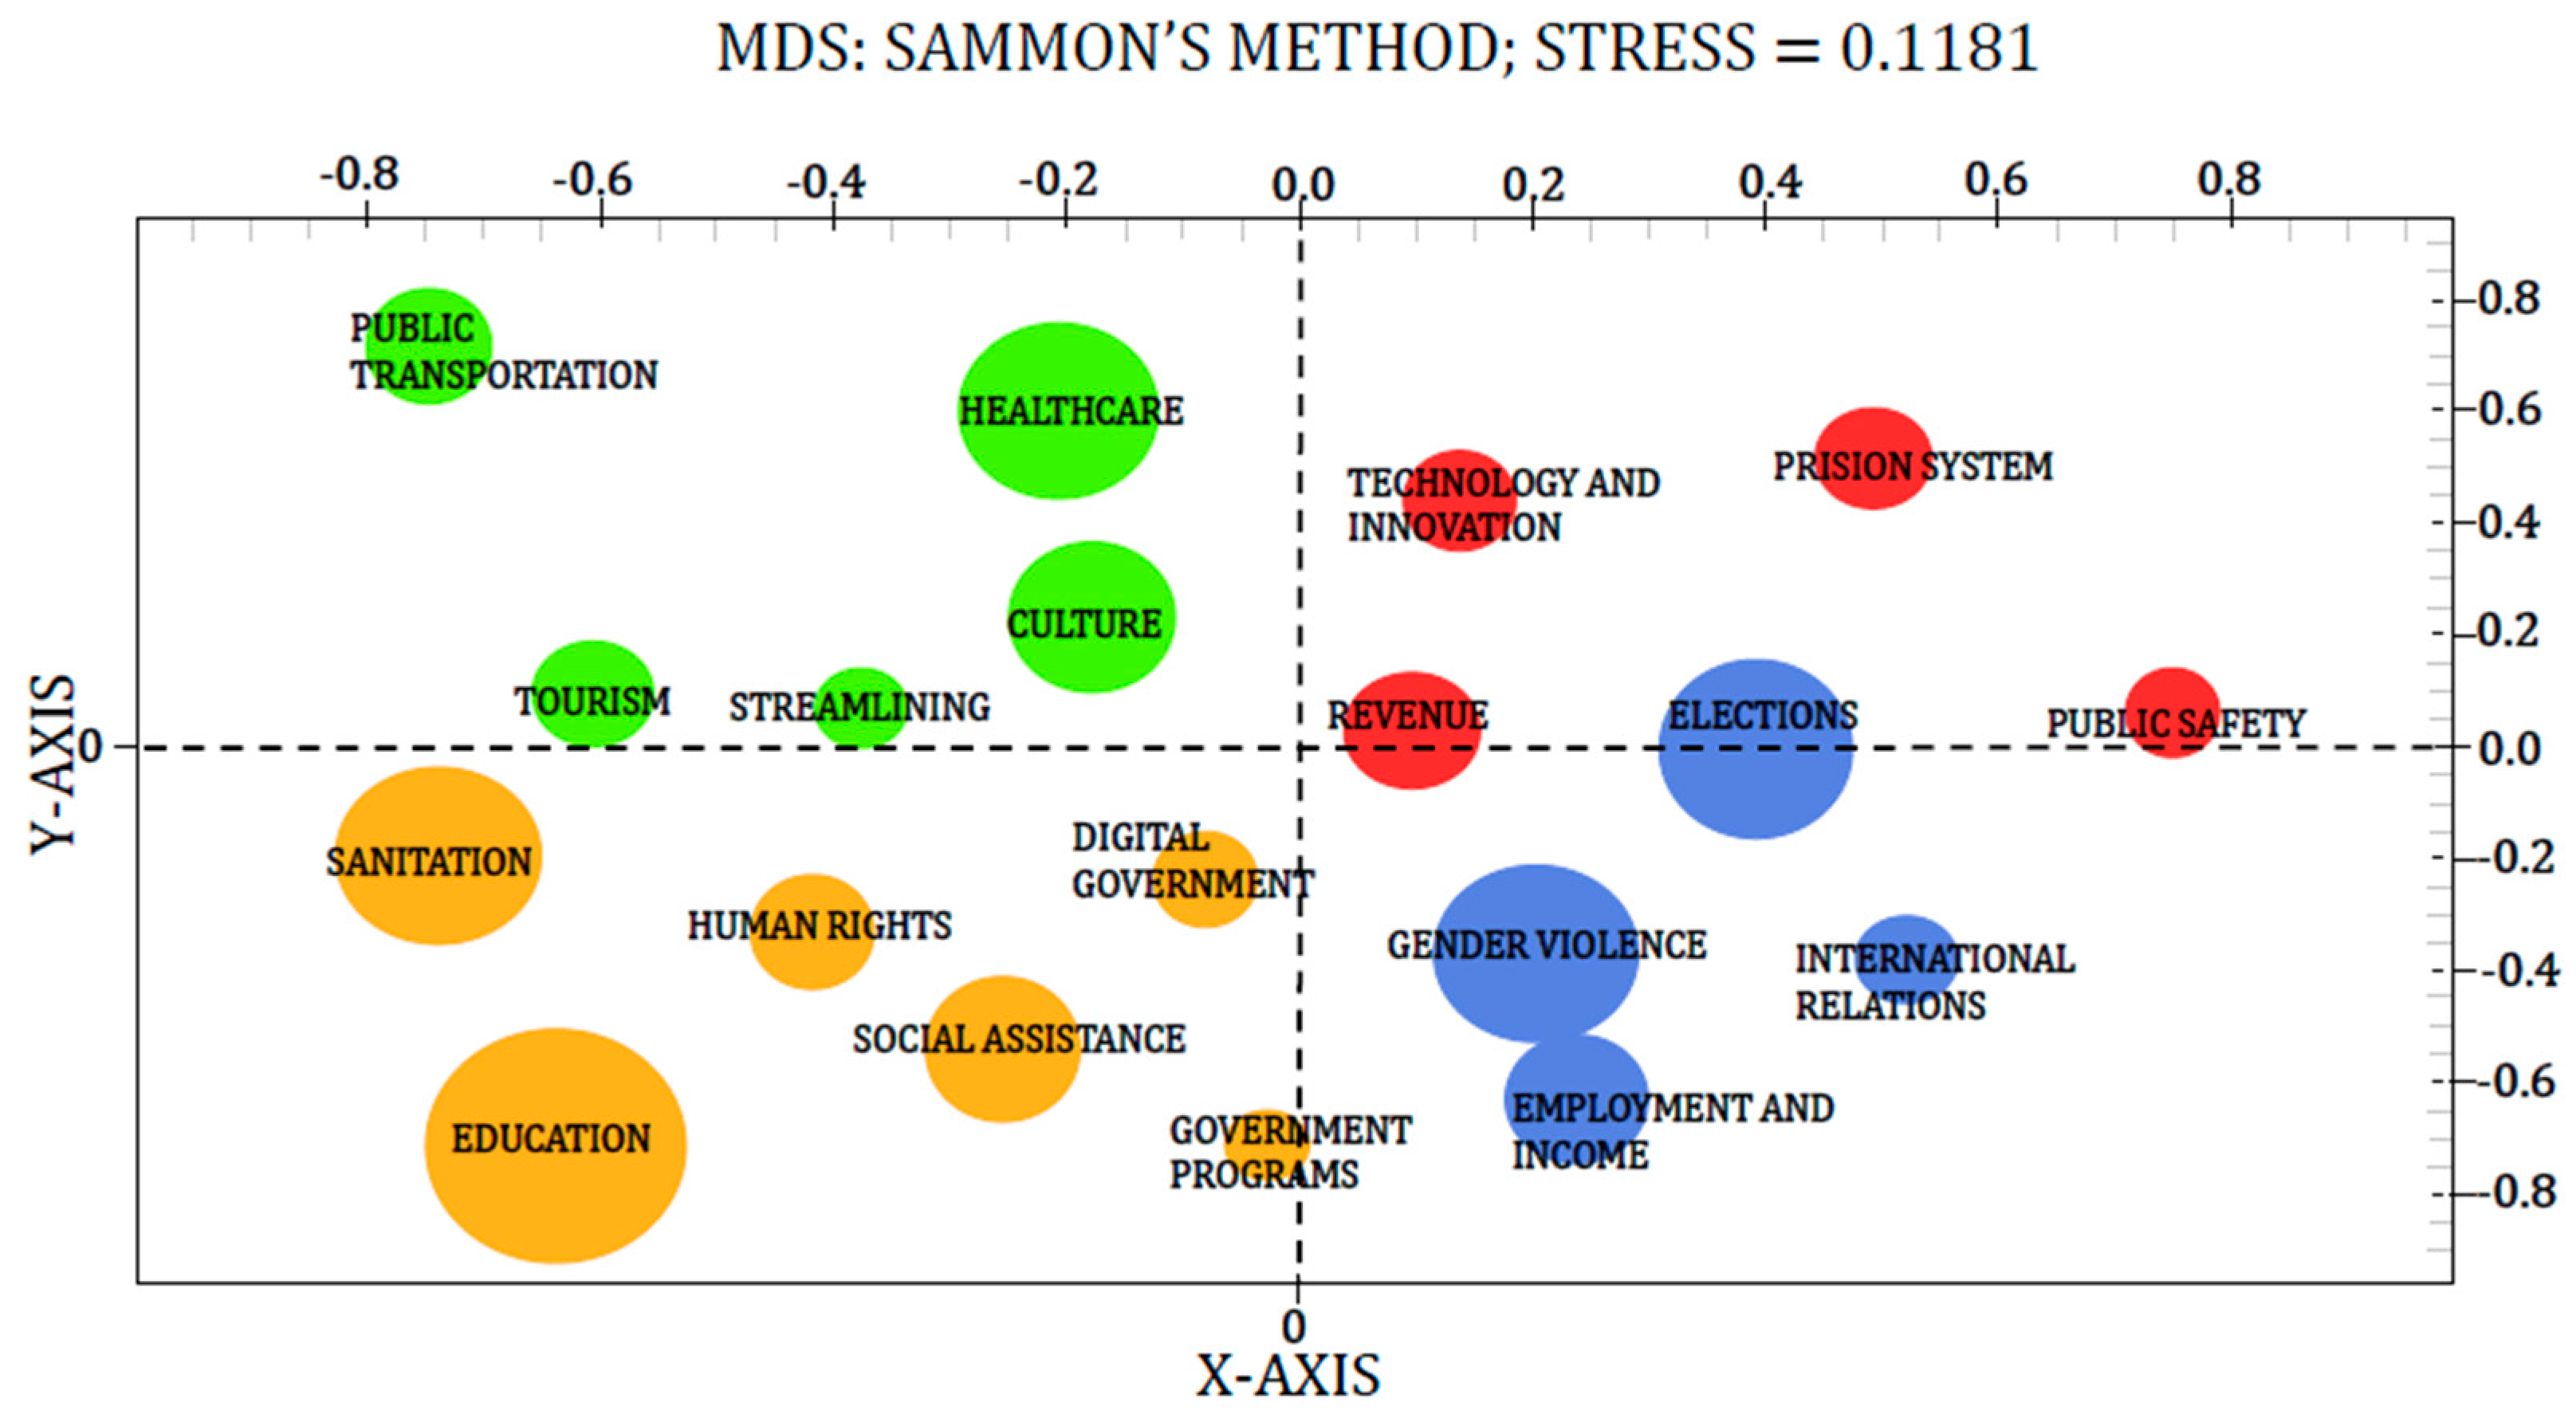
In addition, MDS analysis was employed to compare the clustering, spatial distances, and scale of topic dimensions represented in a two-dimensional space (x and y). Through a bubble representation, we assessed the relationships between the topics extracted from ten government plans and shown above, in Figure 1. The MDS map, derived from similarity indices (cosine index), presented in Figure 4, reveals four distinct topic clusters, each represented by a different color. All bubbles are completely separate from each other, except for a single intersection between the boundaries of the topics “gender violence” and “employment and income”, indicating the model’s suitability.
The first cluster, denoted by red circles, encompasses topics such as revenue, technology and innovation, prison system, and public safety, with revenue being the most prominent theme. The second cluster, represented by green circles, includes topics like healthcare, culture, public transportation, tourism, and streamlining, with healthcare as the central theme. The third cluster, indicated by orange circles, contains topics such as education, sanitation, social assistance, human rights, digital government, and government programs, with education being the most significant theme. Lastly, the blue circles represent themes related to elections, gender violence, international relations, and employment and income, with gender violence standing out.
The stress function value for this analysis is 0.1181, indicating the level of accuracy of the results. The remarkable importance of the education topic, evident in Figure 1 and Figure 4, motivated us to delve deeper by examining it as an ego network, as shown in Supplemental Figure S2. Within this network, the education topic’s substantial link to the subject of gender violence emphasizes the critical need to address violence within the framework of education. Education plays a fundamental role in raising awareness and preventing gender-based violence, as it allows the dissemination of knowledge about gender equality, which is essential for any society based on human rights. These themes are intrinsically linked and must be considered in integrated public policies through educational practices and actions to combat gender-based violence. These two topics, education and gender-based violence, can be related to SDG-4 and SDG-5, respectively.
Until this point, we have identified patterns of individual association among political parties (Figure 3) and themes (Figure 4). Additionally, the MCA analysis (Supplemental Figure S6) revealed relationships between the distance, d i j , between topics and political parties. For example, “social assistance”, “sanitation”, and “education” are closely associated with PT in the first quadrant, in the positive directions of dimensions 1 and 2, with distance respectively equal to d i j = 0.022 , d i j = 0.098 , and d i j = 0.192 . In the fourth quadrant, thematic proximity is observed between REP and “prison system”, “streamlining”, and “digital government” with respective distances d i j = 0.060 , d i j = 0.063 , and d i j = 0.100 . Additionally, PDT is closely related to “technology and innovation” with d i j = 0.086 , NOVO to “government programs” with d i j = 0.020 and PSDB to “digital government” and “revenue” with respective distances d i j = 0.050 and d i j = 0.085 . Parties such as DC, PCB, PSTU, PCO and UP are more distant from these themes. Detailed metrics regarding MCA analysis concerning variance and the coordinates used to compute the distances are provided in Supplemental Table S2.

4.2. Perception Analysis of Government Plans

Perceptual analysis of the documents was initially conducted to delineate the formal characteristics of political documents, as described in Section 3.2. The results presented in Figure 5 indicate that, overall, the government plans exhibit significant weaknesses and lack basic structure. While the presence of scientific data is one of several practical considerations to be addressed when formulating a government plan to guide public policy or justify political intentions, in this case, most plans lacked fundamental elements such as a table of contents, pagination, introduction, and division of sections according to minimal standards. Moreover, there was a lack of information provided, including census data, statistical references, official sources, and journalistic considerations. Figure 5 highlights that the PCB had the best-formatted government plan, scoring 6 out of 8 in terms of formal characteristics. It was followed by the PDT, PT, and REP, each scoring 5 out of 8. Conversely, the PSTU, DC, and PCO received the least favorable evaluations, with either no marks or only a single mark, as indicated by the statical mode illustrated in Figure 5. The remaining formal characteristics of the government plans, such as the number of pages and the number of policy agendas associated with each plan, are detailed in Supplemental Figure S7.
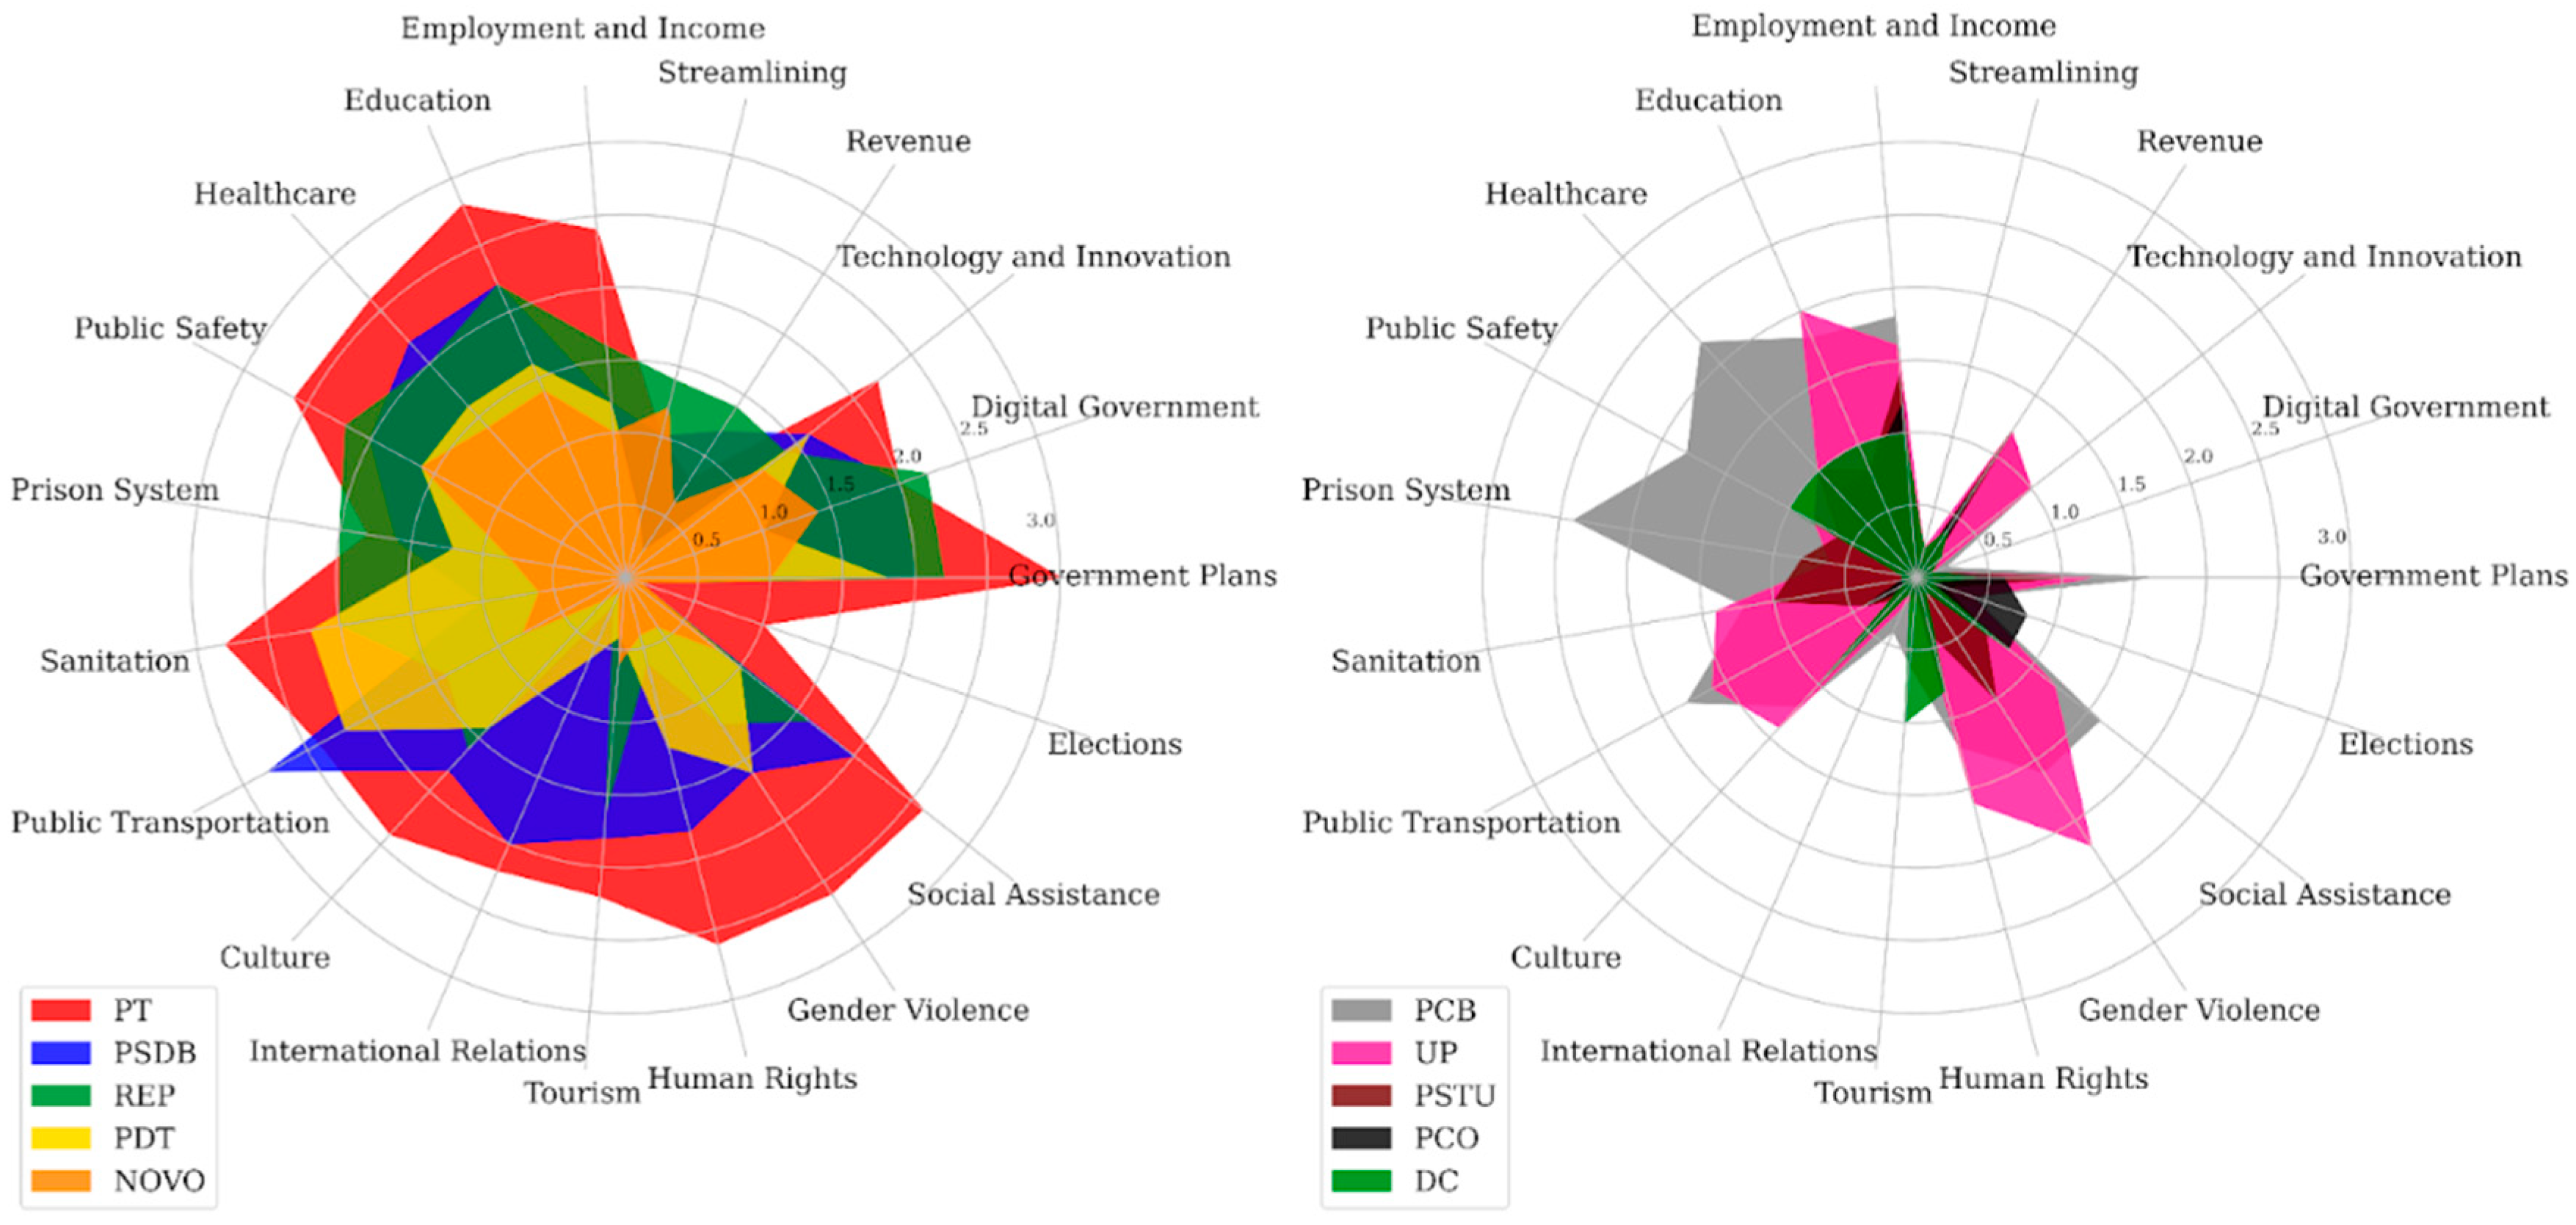
We proceeded with the steps described in Section 3.3, evaluating the coverage of the nineteen topics outlined in Section 4.1. The results of the perception analysis are presented in radar charts shown in Figure 6. The polygons associated with each government plan on the radar charts allow us to observe that some parties had a greater coverage of certain topics. The area under the polygons is proportional to the percentage of topic coverage (see Equation (5)). More detailed radar charts for individual parties, along with their percentage of coverage in each government plan, are presented in Supplemental Figures S8 and S9, as well as Supplemental Table S3. The parties with the highest and lowest coverage of topics following our perception analysis, and as shown in Figure 6, were PT and PCO, with 74% and 12%, respectively (see Supplemental Table S3). Furthermore, it is interesting to note that the REP and PSDB parties have similar structures and sizes, with 56% and 51% coverage, respectively, differing in the direction of the vector regarding “public transportation”, “sanitation”, “human rights”, and “international relations”. The topics of “revenue”, “streamlining”, and “elections” are also less discussed, with all parties receiving less than 50% coverage of these topics.
Specifically, concerning the two parties that advanced to the second round of the São Paulo state elections, Figure 6 illustrates our perception analysis, which indicates that PT covers over 50% of most of the addressed issues, with the exceptions of “streamlining” and “revenue”. In contrast, REP has seven out of nineteen topics with coverage below 50%, including “streamlining”, “revenue”, “technology and innovation”, “gender violence”, “human rights”, “international relations”, and “public transportation”.
Our perception analysis also revealed that, despite the examination of government plans revealing the presence of various socioeconomic and political topics, in general (except by one or a small number of documents) there is a prominent gap related to the “environment” theme, specifically linked to the SDGs related to “Climate Action” (SDG-13), “Life Below Water” (SDG-14), and “Life on Land” (SDG-15). There is a significant absence of specific approaches related to decarbonization, preservation of biomes, reforestation, and other crucial environmental policies for mitigating the impacts of climate change. Furthermore, another underexplored aspect linked to climate-induced disasters, like flash floods, landslides, and a lack of city resilience, is crucial. While there is mention of the topic of gender violence, broader issues of gender, economic, racial, educational, cultural, and epistemic inequality, as well as leadership opportunities and better wages for women, may not be widely addressed in government plans, leaving significant gaps in the promotion of equality and social inclusion.

4.3. Assessing UN SDG Coverage in Government Plans

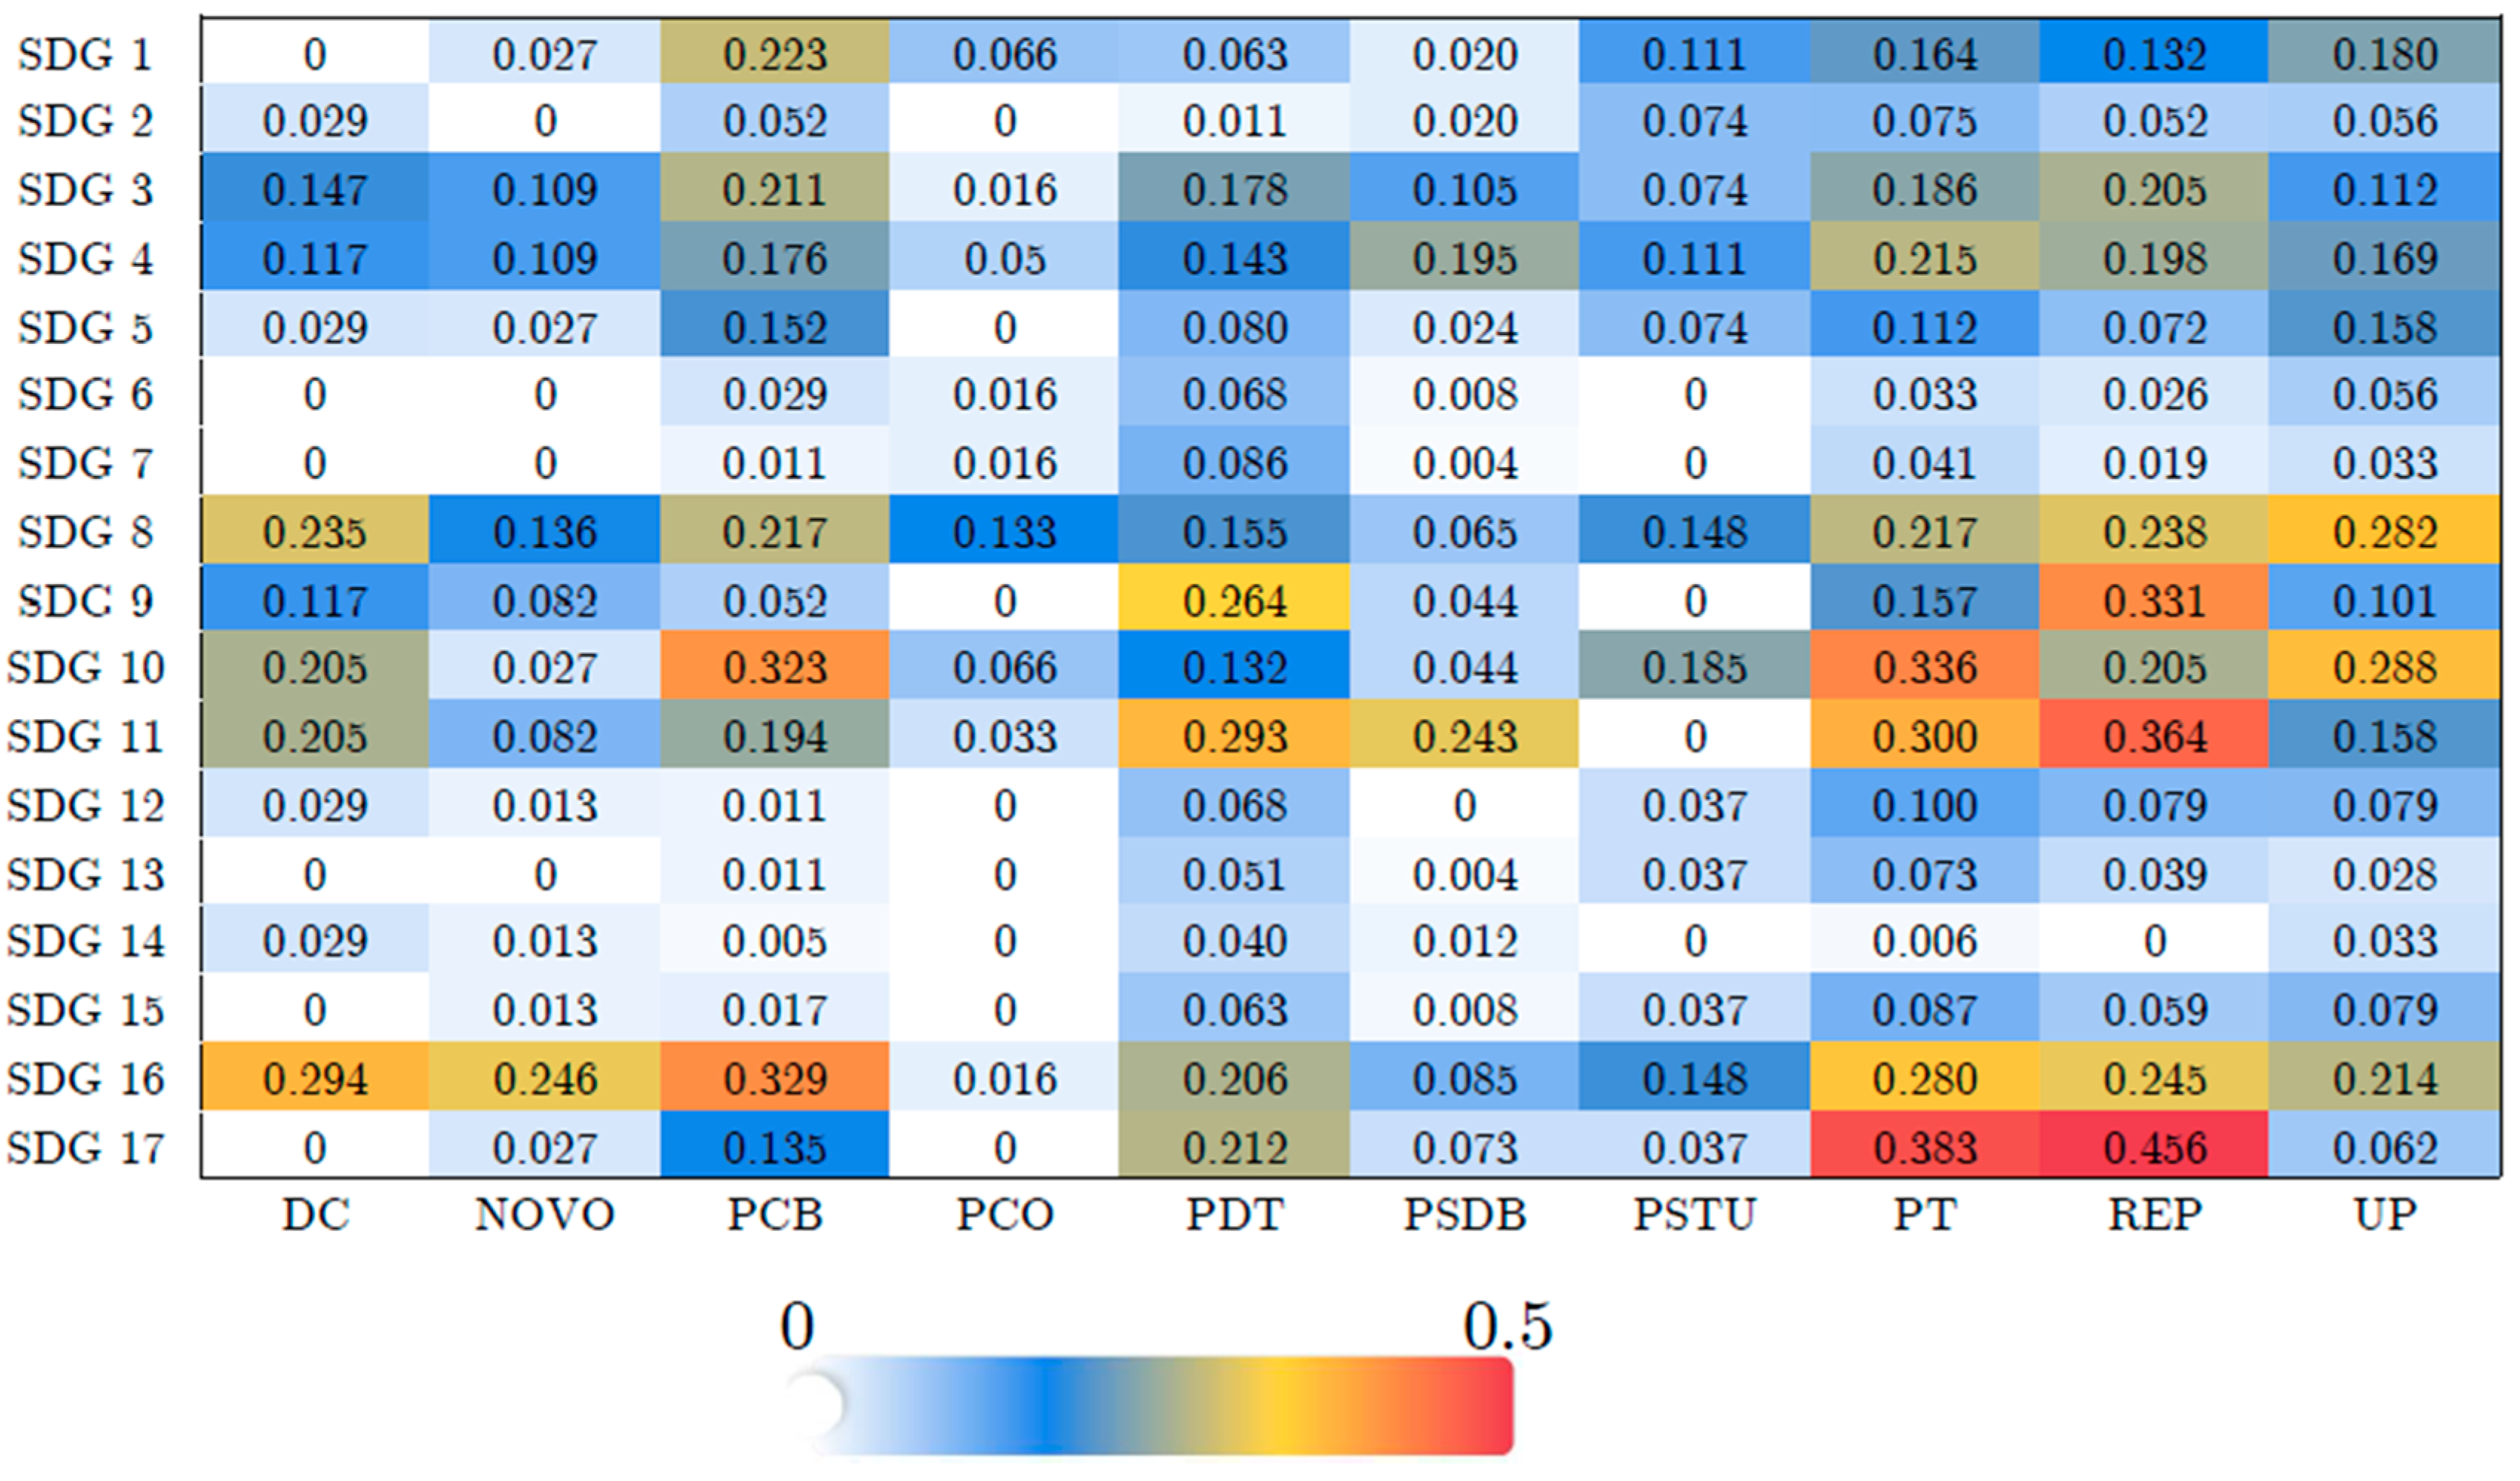
More precise results regarding the alignment between government plans and the SDGs were obtained using the methodology described in Section 3.3. The results shown in Figure 7, represented as a heatmap, depict the relationship between the SDGs, arranged in descending order along the rows, and the government plans, presented in the columns. Each cell in the heatmap displays the ratio between the total number of agendas classified about each SDG and the overall number of agendas within each political plan (see Equation (11); the total number of agendas by political party can be found in Supplemental Figure S7). The government plans with the highest SDG coverage are attributed to the PT and REP parties, which advanced to the second round of executive elections, with a notable emphasis on SDG 17. Conversely, the parties with the lowest proposed alignment with the SDGs were PCO and DC, with no proposals associated with eight and six SDGs, respectively. PCB was the single party that emphasized SDG-1, with a rate of 0.223. The results also show that none of the parties presented proposals with a relevance threshold equal to 0.2 associated with SDG-2, SDG-5, SDG-6, SDG-7, SDG-12, SDG-13, SDG-14, and SDG-15. Concerning SDG-3, PCB and REP were the only parties that presented proposals with an emphasis greater than 0.2. Regarding SDG-4, the PT was the only party with a rate above the relevance threshold, with a value equal to 0.2155. The DC and UP parties emphasized SDG-8 in their agendas compared with other parties, while the PDT and REP surpassed the threshold for SDG-9 with rates of 0.264 and 0.331, respectively. The two parties with the highest alignment rates between government plans and SDG-10 were PT and PCB, with rates of 0.336 and 0.323, respectively, while, concerning SDG-11, REP and PT had rates of 0.364 and 0.300, respectively. Finally, the highest alignments between government plans and SDG-16 were with the PCB party, with a rate of 0.329, and the DC party, with a rate of 0.294.
Finally, we applied the methodology described in Section 3.4 to compare the agendas in the government plans with the 169 targets of the UN’s 2030 Agenda for Sustainable Development. The percentage alignment is shown in Table 1. The results indicate that PT’s proposals had an over 86% alignment with the UN SDG targets. REP, which also advanced to the second round of elections and emerged victorious, had over 56% alignment with the SDG targets. In contrast, PCO and PSTU had the lowest alignment with the UN goals, with only 2.37% and 1.18% alignment, respectively.
Additional results regarding the histogram of occurrences of alignment between SDG targets closely associated with the agendas presented in political parties’ documents are provided in the Supplementary Materials (Supplementary Figures S10–S15). Generally, the distributions exhibit a similar qualitative decay behavior across parties, except for PCO and PSTU, which display a uniform distribution with few aligned targets. Here, we highlight the higher occurrences of alignment between government plans and specific SDG targets. For the DC and NOVO parties, the highest occurrence is associated with target 8.3. PCO has a single occurrence each, linked to targets 11.1, 1.3, and 9.c. Similarly, PSTU also has single occurrences aligned with targets 8.6 and 5.1. The major occurrence associated with PCB has a value of 7 and is related to target 1.b, while the major occurrence of PDT has a value of 12 and is connected to target 11.a. UP has a major occurrence of 7 aligned with targets 5.a, 11.1, and 5.4. PSDB has a higher occurrence of 18 aligned with target 11.a, REP exhibits a higher occurrence of 16 associated with targets 8.3, and PT is prominent, with an occurrence of ~110 associated with target 11.a.

5. Discussion

Advancing the SDGs requires integrating public policy agendas aligned with the goals into government plans [75]. It implies incorporating topic indicators to assist in planning and evaluating the impact on individual SDG scores [76]. In this study, we employed NLP, artificial intelligence, and perceptual analysis to investigate thematic emergence in the documents.
The results were presented by applying MDS, MCA, and network theory which allowed us to explore the patterns of association between topics and documents. Additionally, we introduced metrics to evaluate the formal characteristics of the documents, and utilized OpenAI’s ChatGPT 3.5 and embedded text model to classify individual agendas within each government plan with the SDGs. Concerning the alignment between political documents and the 169 targets of the UN Agenda 2030, we investigated how specific agendas of government plans influence the percentage coverage of the SDG targets, measured by histograms of occurrence. To further explore the intricate relationship between thematic government plans and the SDGs, we discussed our major results in light of the environmental (SDGs 6, 13–15), social (SDGs 1–5, 10, 16, and 17), and economic (SDGs 7–9, 11, and 12) dimensions associated with sustainable development [77]. SDG-specific indicators relevant to the state of São Paulo have been considered in the light of governance theory and the relevant literature on sustainability policy efforts. We, therefore, explore how candidates progress towards key SDG targets in the context of São Paulo’s specific challenges.

5.1. Environmental Dimension

The results of the topic modelling and assessment of the alignment between government plans and the SDGs reveal that the topic of the environment was little explored in the documents. Although the topic “sanitation” has emerged, topics related to SDG-13 “Climate Action”, SDG-14 “Life Below Water” and SDG-15 “Life on Land” were little addressed. These topics did not stand out among the 19 topics analyzed, nor was there significant alignment between the agendas of government plans and these specific SDGs and their targets.
The theme “sanitation” appeared to directly align with SDG 6, “Clean Water and Sanitation”. Despite legal advances in Brazil’s sanitation sector over the past decade [78,79,80], current indicators highlight persistent challenges. In 2022, São Paulo state indicated that 95.2% of its overall population had access to water supply networks, including 98.4% of the urban population [81]. However, sewage collection services reached only 56% of the population, with just 42.7% of collected sewage being effectively treated. São Paulo fared better, with 90.5% access to sewage networks and 89.2% in urban areas [81]. The universalization of water supply and sewage infrastructure remains unachieved, necessitating comprehensive government plans focused on these issues and on the conflicts over water use [82,83] to ensure sustainable development.
The study highlighted the necessity that government plans include proposals aligning with SDG 13, “Climate Action”. With temperatures 1.4 °C above the 1850/1900 average [84], Brazil experienced one of its warmest years since the 1960s, with São Paulo facing record-breaking temperatures and extreme weather events [85,86,87]. Severe precipitation caused significant natural disasters, including floods and landslides, particularly on São Paulo’s northern coast [88,89]. Projections indicate that extreme heat events will intensify [90], and, although annual rainfall may decrease, extreme precipitation will continue to cause severe impacts [91,92,93], with potential negative impacts on several crops in São Paulo, underscoring the vulnerability of this heavily agricultural-dependent region [94]. Addressing these challenges requires incorporating climate adaptation and justice into public policies [95], alongside comprehensive decarbonization strategies [13].
Despite São Paulo’s extensive 880 km coastline and over 300 beaches, our analysis revealed a lack of emphasis on SDG 14, “Life Below Water”, in government plans, underscoring the critical importance of this goal [96,97,98]. Pollution from solid waste and effluents poses severe threats to marine health [99,100]. For example, a recent study identified the Santos estuary on São Paulo’s coast as one of the most microplastic-contaminated areas globally, based on samples from 40 countries [101]. Overfishing has also severely impacted fish populations, which are essential for the local economy and food security [102]. In addition, the acidification and warming of coastal waters are altering marine ecosystem compositions, potentially adversely affecting biodiversity and ecosystem services [103,104].
Our analysis indicates a weak alignment of government plans with SDG 15, “Life on Land”, despite the critical importance of the state of São Paulo’s biomes, with 80% being Atlantic Forest and 20% Cerrado [105,106,107,108], each of which are severely threatened by deforestation [109,110,111,112,113,114]. Given the ecological importance of these biomes, government plans must prioritize stricter deforestation measures and the restoration of degraded areas. Such actions are essential not only for preserving these vital ecosystems but also for enhancing carbon sequestration efforts [115], which are crucial in combating climate change. The implementation of these measures will support the conservation of biodiversity and the sustainability of ecosystem services critical to the region’s environmental health and resilience.

5.2. Social Dimension

The social dimension presented a significant set of topics directly related to the SDGs, showing a correlation between government agendas and the SDG targets. Although no topics explicitly address SDG-1 “No Poverty” and SDG-2 “Zero Hunger”, the topic “social assistance” is implicitly associated with SDG-1, SDG-2, and SDG-16 “Peace, Justice, and Strong Institutions”. Other topics identified in the government plans have a direct association with specific SDGs: “healthcare” is connected to SDG-3 “Good Health and Well-Being”; “education” is related to SDG-4 “Quality Education”; “gender violence” is tied to SDG-5 “Gender Equality”; “human rights” and “public safety” are associated with SDG-16 “Peace, Justice, and Strong Institutions”; and “international relations” is related to SDG-17 “Partnerships for the Goals”. On the contrary, SDG-10 “Reduced Inequalities” did not align with any specific topic identified in the government plans.
Regarding statistics associated with SDG-1 “No Poverty”, the state of São Paulo ranked fourth in Brazil with the lowest poverty rate in 2022 (with 20.4%, an improvement from 24.9% in 2021). Extreme poverty in São Paulo ranked sixth in 2022 and there were no significant differences in poverty levels between men and women [116].
In terms of SDG-2 “Zero Hunger”, according to data from the Ministry of Social Development and Assistance, Family and Fight Against Hunger (MDS) of the federal government, over 2,254,736 families in São Paulo state rose above the poverty line in 2023 [117,118]. Food security in the state decreased from 88.4% in 2013 [119] to 76.5% in 2023 [117], representing a decline of 11.9 percentage points. Although the percentage of municipalities in São Paulo experiencing food insecurity increased from 11.6% in 2013 (with 8% mild food insecurity and 3.6% moderate and severe food insecurity) [119] to 23.5% in 2023 (with 16.6% mild food insecurity, 3.9% moderate food insecurity, and 3% severe food insecurity) [117] some progress has been attributed to restructured federal social income transfer programs, such as Bolsa Família [118].
Reducing Inequality (SDG 10) encompasses various dimensions, including economic, educational, gender, racial, epistemic, and cultural inequalities [120]. Economic inequality, as measured by the Gini index, highlights income concentration [121,122,123]. São Paulo, with a Gini index of 0.504, ranked 17th among Brazilian states [123]. Beyond economic inequality, gender, educational and racial disparities continue to exacerbate the situation for vulnerable groups [120] without any sight of alignment of government plans.
“Gender Equality” (SDG 5) revealed that there are persistent disparities between men and women, particularly evident in the labor market and political spheres [124]. Despite women in São Paulo earning 80.9% of men’s salaries and holding a higher percentage of higher education degrees compared with men (21.3% versus 16.8%), these figures are notably below international averages [124,125,126,127]. The gender pay gap, especially pronounced among managers and directors, remains a significant issue, reaching 25.2% [124]. São Paulo demonstrates better hiring practices and narrower pay gaps compared with other Brazilian states, yet policies supporting women victims of violence in employment are limited [125]. In politics, despite electoral laws mandating a minimum of 30% female candidacies, the impact on actual representation remains modest, with São Paulo’s legislative assembly electing 27% women in 2022 [128,129]. These statistics underscore ongoing challenges in achieving substantive gender equality in political leadership and economic empowerment [4,124]. Efforts to bridge these gaps require sustained policy interventions focusing on enhancing women’s economic opportunities, reducing gender pay disparities, and increasing their representation in political decision-making processes.
Referring to SDG-3 “Good Health and Well-Being”, the impact of the COVID-19 pandemic and vaccination coverage are a significant focus of the parties. As of May 2024, Brazil reported over 18 million COVID-19 cases and a mortality rate of more than 330 deaths per 100,000 inhabitants. São Paulo, despite having fewer confirmed cases, had a high mortality rate (399.5/100,000 inhabitants) [130]. Vaccination coverage in São Paulo was high, with 91.7% receiving two doses, 63.3% three doses, 3% four doses of monovalent vaccines, and 26.6% bivalent coverage [131]. However, there has been a decline in routine immunizations; poliomyelitis coverage dropped below the WHO target of 95%, with São Paulo showing even lower rates (76.59% for IPV and 73.60% for bOPV) [132,133,134,135,136]. Measles, mumps, and rubella (MMR) vaccine coverage also fell from 100% in 2014 to 81.30% in 2024 in São Paulo [135]. The pentavalent vaccine saw a similar decline, with São Paulo’s coverage dropping from over 95% in 2014 to 76.12% in 2024 [135]. This reduction in immunization rates extends to other vaccines for the first year of life, indicating a broader public health challenge. Additionally, São Paulo faces issues related to communicable diseases, respiratory and circulatory diseases, and maternal mortality, highlighting the need for enhanced public health strategies and renewed efforts to improve vaccination coverage and overall health outcomes [4].
The Brazilian constitution mandates education as a universal right, emphasizing its role in individual development, citizenship, and workforce preparation, and aligning with SDG 4, “Quality Education”. The Basic Education Development Index (Ideb) indicates a decline in São Paulo’s early years of elementary education, from 6.7 in 2019 to 6.3 in 2021, while the final years remained at 5.5, and high school improved from 4.6 to 4.7 [137,138], reflecting the impact of the pandemic on in-person classes. On the other hand, between 2011 and 2015, São Paulo and Brazil showed improvements in undergraduate performance, with an increase in the number of students who reached basic, adequate and advanced levels in the Prova Brasil [139].
SDG-16, “Peace, Justice, and Strong Institutions”, addresses the multifaceted challenges of criminality and the efficacy of justice systems. São Paulo stands out with the lowest rate of intentional violent deaths (IVD) in 2022, recording 8.4 per 100,000 inhabitants compared with the national average of 23.3 per 100,000 [140]. São Paulo reported the country’s lowest violent death rate at 6.7 per 100,000 inhabitants [141,142,143], though a significant proportion of perpetrators had prior criminal records [144]. The homeless population in São Paulo remains a critical issue, with 0.19% of the population affected, primarily concentrated in the capital [145]. Areas like “crackland” exacerbate social marginalization and pose substantial public security challenges. Despite progress in reducing overall violent deaths, São Paulo faces alarming rates of femicides and sexual violence, contributing significantly to national statistics [143]. Additionally, São Paulo reports the highest number of LGBTQIA+ murders in Brazil, highlighting pervasive discrimination and violence against marginalized communities [146,147]. These findings underscore the intricate and severe challenges in security and justice in São Paulo state. While improvements in violent death rates are notable, persistent issues of violence, discrimination, and social marginalization necessitate continued efforts to strengthen institutions, promote justice, and ensure inclusivity and safety for all citizens.

5.3. Economic Dimension

The economic dimension revealed a reasonable alignment between government agendas and SDG targets. Key topics such as “employment and income”, “streamlining”, and “revenue” are directly connected to SDG 8 “Decent Work and Economic Growth”, while “technology and innovation” aligns with SDG 9 “Industry, Innovation, and Infrastructure”, and “public transportation” corresponds with SDG 11 “Sustainable Cities and Communities”. However, there is a noticeable gap in alignment with SDG 7 “Affordable and Clean Energy” and SDG 12 “Responsible Consumption and Production”, as these goals are not explicitly addressed in the government plans, as demonstrated by the results presented in Section 4. This discrepancy highlights that we need more comprehensive policy frameworks to encompass broader aspects of sustainable development.
Shortcomings in government plans related to SDG-7 ignore the importance of the energy sector and therefore do not align with SDG targets. São Paulo consumes approximately 145,000 GWh of electricity annually, predominantly from hydroelectric (65%), biomass (25%), and fossil fuels (10%), with photovoltaic, nuclear, and wind energy currently underrepresented [148,149]. The industrial sector, home to the country’s largest industrial park, accounts for 36.5% of the state’s energy consumption, followed by residential (over 30%), commercial (22.2%), and other sectors (11.3%) [150]. Nearly all households in São Paulo have electricity access, with 99.9% having electric lighting, compared with 99.5% in other Brazilian municipalities [150]. Energy intensity, measured as the ratio of final energy consumption to GDP, decreased from BRL 0.074 toe/103 in 2012 to BRL 0.064 toe/103 in 2021 [151]. This analysis underscores the need for government plans to prioritize the energy transition by enhancing the representation of renewable energy sources, particularly photovoltaic energy, while maintaining stable energy intensity. Discussions on nuclear energy are also necessary.
Our results highlight the emphasis on economic topics in government plans, showing some alignment with SDG-8, which addresses economic growth and decent work. In 2023, São Paulo’s GDP reached BRL 3.218 billion, contributing about 30% to Brazil’s total GDP [152]. Economic growth was modest at 0.8%, driven by increases of 3.6% in agriculture and 1.5% in services, while the industrial sector declined slightly by 0.1% [153]. This highlights São Paulo’s key role in Brazil’s economy. São Paulo’s economic growth can be strengthened by implementing policies that promote workforce skills development and export diversification while mitigating inflation and enhancing global competitiveness [154,155,156,157,158]. Additionally, it is essential to focus on equal opportunities for all, especially migrants, and combat exploitative labor practices, including slavery-like conditions.
Although “public transportation” is a topic directly related to SDG-11, the alignment with other dimensions is sub-represented in government plans. São Paulo state, with the highest population, had the largest deficit at 1.2 million, including 4.9% in precarious housing, 262,292 in cohabitation, and 972,152 (74.1%) facing an excessive rent burden [158]. Regarding SDG-12, in São Paulo, 90.5% of the population had access to solid waste collection, with 89.2% coverage in urban areas [81]. Addressing these issues requires public policies focused on increasing affordable housing, improving conditions in precarious dwellings, and enhancing waste collection services, particularly in urban areas. Moreover, implementing incentives for sustainable building practices and developing comprehensive recycling programs would address these gaps.

6. Conclusions

Our analysis highlights significant alignments and critical gaps in integrating SDGs within São Paulo’s government plans. Using computational tools, like NLP, for text analysis, we efficiently evaluated extensive political documents, revealing core issues addressed by various parties and identifying shared or conflicting views. Nineteen priority topics emerged, with PT, PSDB, PDT, and REP being the only parties covering all topics. Thematic clustering highlighted differences and proximities in policy focus among the parties, providing valuable insights into their policy priorities and strategic emphases.
Despite some parties’ comprehensive topic coverage, the alignment between government plans and the SDGs remains weak, indicating that achieving the SDGs is still a considerable distance away. Critical areas related to environmental sustainability, such as SDG-13 (Climate Action), SDG-14 (Life Below Water), and SDG-15 (Life on Land), were notably underrepresented. Additionally, other SDGs associated with social and economic dimensions, including SDG-7 (Affordable and Clean Energy), SDG-10 (Reduced Inequalities), and SDG-12 (Responsible Consumption and Production), received limited attention. Our findings underscore the need for political parties to incorporate more data-driven and holistic agendas, ensuring a balanced approach that addresses economic, social, environmental, and institutional issues. Formal analysis revealed that many government plans lacked basic structural quality, suggesting that submissions often aim to meet judicial requirements rather than provide comprehensive policy frameworks.
Our study demonstrates the effectiveness of artificial intelligence in aligning government plans with SDG targets. PT showed the highest alignment at 86.39%, followed by REP at 56.21% and PSDB at 53.85%. Despite the high percentage of alignment, the proposals were not evenly distributed across all SDGs, indicating a concentration in specific areas. This approach also revealed significant thematic gaps and provided insights into the varied policy focuses of different parties.
Given the different levels of understanding regarding implementing sustainable practices, achieving the SDGs is still a considerable distance away. The barriers faced by local politicians in not considering the SDGs in their government plans may be related to their lack of knowledge about the SDGs’ role, the difficulties they face, and their inability to take action on the SDGs due to limited capacity and lack of technical skills and knowledge. Additionally, challenges like limited resources, lack of political will, and data gaps at the local level hinder the ability to implement effective SDG strategies and initiatives.
Future research should focus on benchmarking datasets from various political and judicial documents concerning public policies and refining semantic extraction methods to better align with specific SDGs. Additionally, investigating the impact and innovation within these plans, along with the mechanisms of policy formulation, can provide deeper insights and improvements in aligning political agendas with sustainable development objectives. This approach aims to bridge the gap between theoretical frameworks and practical applications.
In summary, it is extremely complex to conclude whether a “right” government plan can effectively reach and convince voters in São Paulo state, given the broader context of distrust toward political parties worldwide. In Latin America, in particular, a history of political instability and unfulfilled promises has deepened skepticism toward political actors, regardless of ideology. Large wealth and income disparities exacerbate this distrust, fostering resentment and making it challenging for governments to gain widespread support, especially when addressing entrenched economic and social inequalities. These divides often reflect class, ethnicity, religion, and political orientation, complicating efforts to craft policies that resonate broadly.
The lesson for other countries lies in the importance of developing government plans that are transparent, measurable, and explicitly aligned with the SDGs across social, environmental, and economic dimensions. Such alignment can play a pivotal role in fostering trust and credibility, even in politically skeptical environments. While each country’s unique political and socio-economic context must be considered, aligning government plans with global priorities, such as the SDGs, provides a framework that transcends national borders and addresses shared regional challenges like inequality, climate change, and governance gaps.
In conclusion, there is a delicate balance between the political atmosphere, policy proposals, and public perception. Building trust requires consistent effort, a strong commitment to addressing long-standing issues, and a vision that connects local needs with global goals.

Supplementary Materials

The following supporting information can be downloaded at https://www.mdpi.com/article/10.3390/su162310672/s1, supporting information [159,160,161,162,163,164,165,166,167,168,169,170,171,172,173].

Author Contributions

Conceptualization, S.A.C. and L.L.B.L.; Methodology, S.A.C., L.L.B.L., A.F.Y., R.R.A.C., F.J.M.O. and C.B.M.C.H.; Software, S.A.C., L.L.B.L. and R.R.A.C.; Validation, S.A.C., L.L.B.L. and R.R.A.C.; Formal analysis, S.A.C., L.L.B.L., A.F.Y. and R.R.A.C.; Investigation, S.A.C., L.L.B.L., A.F.Y., R.R.A.C., F.J.M.O., C.B.M.C.H. and M.S.B.; Resources, J.R.C. and A.P.J.; Data curation, S.A.C. and R.R.A.C.; Writing—original draft, S.A.C.; Writing—review & editing, S.A.C.; Visualization, S.A.C. and L.L.B.L.; Supervision, J.R.C., J.S.W.F., P.R.J., A.P.J. and M.S.B.; Project administration, A.P.J. and M.S.B.; Funding acquisition, A.P.J. and M.S.B. All authors have read and agreed to the published version of the manuscript.

Funding

Thematic Axes Program of the University of São Paulo (ProETUSP) (www.usp.br/proetusp, accessed on 26 November 2024): 972, as stated on the website.

Institutional Review Board Statement

Not applicable.

Informed Consent Statement

Not applicable.

Data Availability Statement

Data are contained within the article.

Acknowledgments

We thank the Brazilian agencies: the Coordination of Superior Level Staff Improvement—CAPES and the National Council for Scientific and Technological Development—CNPq. The authors also thank all the support provided by USP’s rectory (PRPI—Pró-Reitoria de Pesquisa e Inovação da USP) through PROETUSP. S.A.C. acknowledges the Coimbra Group Scholarship Programme for Young Professors and Researchers from Latin American Universities 2021.

Conflicts of Interest

The authors declare no conflict of interest.

References

  1. Lazaro, L.L.B.; Soares, R.S.; Bermann, C.; Collaço, F.M.A.; Giatti, L.L.; Abram, S. Energy transition in Brazil: Is there a role for multilevel governance in a centralized energy regime? Energy Res. Soc. Sci. 2022, 85, 102404. [Google Scholar] [CrossRef]
  2. Ostrom, E. A Behavioral Approach to the Rational Choice Theory of Collective Action: Presidential Address, American Political Science Association, 1997. Am. Political Sci. Rev. 1998, 92, 1–22. [Google Scholar] [CrossRef]
  3. Chimhowu, A.O.; Hulme, D.; Munro, L.T. The ‘New’ national development planning and global development goals: Processes and partnerships. World Dev. Elsevier 2019, 120, 76–89. [Google Scholar] [CrossRef]
  4. Webb, P.; Farrell, D.; Holliday, I. Political Parties in Advanced Industrial Democracies; Oxford University Press: Oxford, UK, 2002. [Google Scholar]
  5. Abid, A.; Roy, S.K.; Lees-Marshment, J.; Dey, B.L.; Muhammad, S.S.; Kumar, S. Political social media marketing: A systematic literature review and agenda for future research. Electron. Commer. Res. 2023. [Google Scholar] [CrossRef]
  6. Lees-Marshment, J. Marketing scholars and political marketing: The pragmatic and principled reasons for why marketing academics should research the use of marketing in the political Arena. Cust. Needs Solut. 2019, 6, 41–48. [Google Scholar] [CrossRef]
  7. Amoncar, N. Entrepreneurial marketing and digital political communication: A citizenled perspective on the role of social media in political discourse. J. Res. Mark. Entrep. 2020, 22, 145–159. [Google Scholar] [CrossRef]
  8. Glass, L.-M.; Jens, N. Governance for achieving the Sustainable Development Goals: How important are participation, policy coherence, reflexivity, adaptation and democratic institutions? Earth Syst. Gov. 2019, 2, 100031. [Google Scholar] [CrossRef]
  9. Breen, A.; Giannotti, E.; Flores, M.M.; Vásquez, A. From “Government to Governance”? A Systematic Literature Review of Research for Urban Green Infrastructure Management in Latin America. Front. Sustain. Cities 2020, 2, 572360. [Google Scholar] [CrossRef]
  10. Charalabidis, Y.; Sarantis, D.; Askounis, D. Knowledge-driven project management in government transformation. In Handbook of Research on ICT-Enabled Transformational Government: A Global Perspective; IGI Global: Hershey, PA, USA, 2009. [Google Scholar]
  11. Alcaide-Muñoz, L.; Rodríguez-Bolívar, M.P.; Cobo, M.J.; Herrera–Viedma, E. Analysing the scientific evolution of e-Government using a science mapping approach. Gov. Inf. Q. 2017, 34, 545–555. [Google Scholar] [CrossRef]
  12. Ansell, C.; Sørensen, E.; Torfing, J. The Key Role of Local Governance in Achieving the SDGs. In Co-Creation for Sustainability; Emerald Publishing Limited: Bingley, UK, 2022; pp. 9–22. [Google Scholar]
  13. OECD. Achieving the SDGs in Cities and Regions 2023. Available online: https://www.oecd.org/about/impact/achieving-sdgs-in-cities-and-regions.htm (accessed on 7 December 2023).
  14. Valencia, S.C.; Simon, D.; Croese, S.; Nordqvist, J.; Oloko, M.; Sharma, T.; Buck, N.T.; Versace, I. Adapting the Sustainable Development Goals and the New Urban Agenda to the city level: Initial reflections from a comparative research project. Int. J. Urban Sustain. Dev. 2019, 11, 4–23. [Google Scholar] [CrossRef]
  15. Biermann, F.; Hickmann, T.; Sénit, C.A.; Beisheim, M.; Bernstein, S.; Chasek, P.; Grob, L.; Kim, R.E.; Kotzé, L.J.; Nilsson, M.; et al. Scientific evidence on the political impact of the Sustainable Development Goals. Nat. Sustain. 2022, 5, 795–800. [Google Scholar] [CrossRef]
  16. Salles, N. Brazil Programs and Parties: Rethinking Electoral Competition Through Analysis of Brazilian ‘Grotões’. Braz. Political Sci. Rev. 2019, 13, e0004. [Google Scholar] [CrossRef]
  17. Produto Interno Bruto dos Municípios 2020. PIB dos Municípios. Contas Nacionais. Available online: https://biblioteca.ibge.gov.br/visualizacao/livros/liv101990_informativo.pdf (accessed on 12 December 2023).
  18. FAPESP: São Paulo Among the World’s Major Economic Centers. Available online: https://revistapesquisa.fapesp.br/en/sao-paulo-among-the-worlds-major-economic-centers/ (accessed on 13 December 2023).
  19. Beisheim, M. Country-Level Politics Around the SDGs—Stiftung Wissenschaft und Politik. Research Paper 2023. Available online: https://www.swp-berlin.org/10.18449/2023RP07/ (accessed on 7 December 2023).
  20. Federal Supreme Courte: Constitution of the Federative Republic of Brazil. Available online: https://www.stf.jus.br/arquivo/cms/legislacaoConstituicao/anexo/brazil_federal_constitution.pdf (accessed on 13 December 2023).
  21. Boix, C. Setting the Rules of the Game: The Choice of Electoral Systems in Advanced Democracies. Am. Political Sci. Rev. 1999, 93, 609–624. [Google Scholar] [CrossRef]
  22. Mainwaring, S. Politicians, Parties, and Electoral Systems: Brazil in Comparative Perspective. Comp. Politics 1991, 24, 21–43. [Google Scholar] [CrossRef]
  23. Nicolau, J. Sistemas Eleitorais, 5th ed.; Editora FGV: Rio de Janeiro, Brazil, 2004; p. 112. [Google Scholar]
  24. Web Portal of the Superior Electoral Court (TSE): Political Parties Registered Under the TSE. Available online: https://international.tse.jus.br/en/partidos/political-parties-registered-under-the-tse (accessed on 13 October 2023).
  25. Bruno, B.; Ednaldo, R.; Adriano, C. A New Ideological Classification of Brazilian Political Parties. DADOS 2023, 66, e20210164. [Google Scholar] [CrossRef]
  26. Web Portal of The Chamber of Deputies: Lei dos Partidos Políticos—Lei no 9.096, de 19 de Setembro de 1995. Available online: https://www.tse.jus.br/legislacao/codigo-eleitoral/lei-dos-partidos-politicos/lei-dos-partidos-politicos-lei-nb0-9.096-de-19-de-setembro-de-1995 (accessed on 13 December 2023).
  27. Web Portal of the Superior Electoral Court (TSE): Lei Nº 12.034, de 29 de Setembro de 2009. Available online: https://www.planalto.gov.br/ccivil_03/_ato2007-2010/2009/lei/l12034.htm (accessed on 13 December 2023).
  28. Mancini, P.; Swanson, D.L. Politics, Media, and Modern Democracy: An International Study of Innovations in Electoral Campaigning and Their Consequences; Bloomsbury Publishing USA: New York, NY, USA, 1996. [Google Scholar]
  29. Diniz, S.; Oliveira, L. Programas de governo e promessas de campanha. Rev. Sociol. Polit. 2020, 28, e006. [Google Scholar] [CrossRef]
  30. Trane, M.; Marelli, L.; Siragusa, A.; Pollo, R.; Lombardi, P. Progress by Research to Achieve the Sustainable Development Goals in the EU: A Systematic Literature Review. Sustainability 2023, 15, 7055. [Google Scholar] [CrossRef]
  31. Hopkins, A.L.; Gibbes, C.; Clement, V.; Díaz, A.F.I.; Can, A.R.; Jiménez-Osornio, J. Analysis of sub-national variation in global development goals to inform locally relevant sustainable development. Environ. Dev. Sustain. 2023. [Google Scholar] [CrossRef]
  32. Web Portal of the Brazilian United Nation (UN). Available online: https://brasil.un.org/pt-br/sdgs (accessed on 13 December 2023).
  33. Shyla, D.A.A.; Aldo, A.R.; Micaela, J.A.; Myreya, D.L.C.D.; Maria, D.L.M.A.S. Influence of Social, Environmental and Economic Sustainable Development Goals (SDGs) over Continuation of Entrepreneurship and Competitiveness. J. Open Innov. Technol. Mark. Complex. 2022, 8, 73. [Google Scholar]
  34. The Sustainable Development Goals Report 2022, United Nation (UN). Available online: https://unstats.un.org/sdgs/report/2022/The-Sustainable-Development-Goals-Report-2022.pdf (accessed on 13 December 2023).
  35. Meuleman, L.; Niestroy, I. Common but differentiated governance: A metagovernance approach to make the SDGs work. Sustainability 2015, 7, 12295–12321. [Google Scholar] [CrossRef]
  36. Bwen, K.J.; Cradock-Henry, N.A.; Koch, F.; Patterson, J.; Hayha, T.; Vogt, J.; Barbi, F. Implementing the “Sustainable Development Goals”: Towards addressing three key governance challenges-collective action, trade-offs, and accountability. Curr. Opin. Environ. Sustain. 2017, 26, 90–96. [Google Scholar] [CrossRef]
  37. Nilsson, M.; Chisholm, E.; Griggs, D.; Howden-Chapman, P.; McCollum, D.; Messerli, P.; Neumann, B.; Stevance, A.-S.; Visbeck, M.; Stafford-Smith, M. Mapping interactions between the sustainable development goals: Lessons learned and ways forward. Sustain. Sci. 2018, 13, 1489–1503. [Google Scholar] [CrossRef] [PubMed]
  38. Kroll, C.; Warchold, A.; Pradhan, P. Sustainable Development Goals (SDGs): Are we successful in turning trade-offs into synergies? Palgrave Commun. 2019, 5, 140. [Google Scholar] [CrossRef]
  39. Moyer, J.D.; Bohl, D.K. Alternative pathways to human development: Assessing trade-offs and synergies in achieving the Sustainable Development Goals. Futures 2019, 105, 199–210. [Google Scholar] [CrossRef]
  40. Allen, C.; Metternicht, G.; Wiedmann, T. Prioritising SDG targets: Assessing baselines, gaps and interlinkages. Sustain. Sci. 2019, 14, 421. [Google Scholar] [CrossRef]
  41. Okitasari, M.; Katramiz, T. The national development plans after the SDGs: Steering implications of the global goals towards national development planning. Earth Syst. Gov. 2022, 12, 100136. [Google Scholar] [CrossRef]
  42. Nilsson, M.; Griggs, D.; Visbeck, M. Policy: Map the interactions between Sustainable Development Goals. Nature 2016, 534, 320–322. [Google Scholar] [CrossRef]
  43. Lombardi, R.; Trequattrini, R.; Cuozzo, B.; Cano-Rubio, M. Corporate corruption prevention, sustainable governance and legislation: First exploratory evidence from the Italian scenario. J. Clean. Prod. 2019, 217, 666e675. [Google Scholar] [CrossRef]
  44. Pizzi, S.; Caputo, F.; Venturelli, A. Accounting to ensure healthy lives: Critical perspective from the Italian national healthcare system. Corp. Govern. 2020, 20, 445e460. [Google Scholar] [CrossRef]
  45. Krantz, V.; Gustafsson, S. Regional collaboration for the sustainable development goals: Experiences from developing a multi-actor platform in Sweden. Sustain. Dev. 2023, 31, 4007–4018. [Google Scholar] [CrossRef]
  46. Bardal, K.G.; Reinar, M.B.; Lundberg, A.K.; Bjørkan, M. Factors Facilitating the Implementation of the Sustainable Development Goals in Regional and Local Planning—Experiences from Norway. Sustainability 2021, 13, 4282. [Google Scholar] [CrossRef]
  47. Barquet, K.; Järnberg, L.; Alva, I.L.; Weitz, N. Exploring mechanisms for systemic thinking in decision-making through three country applications of SDG Synergies. Sustain. Sci. 2022, 17, 1557–1572. [Google Scholar] [CrossRef]
  48. Szetey, K.; Moallemi, E.A.; Ashton, E.; Butcher, M.; Sprunt, B.; Bryan, B.A. Participatory planning for local sustainability guided by the Sustainable Development Goals. Ecol. Soc. 2021, 26, 16. [Google Scholar] [CrossRef]
  49. Ortiz-Moya, F.; Reggiani, M. Contributions of the voluntary local review process to policy integration: Evidence from frontrunner cities. Npj Urban Sustain. 2023, 3, 22. [Google Scholar] [CrossRef]
  50. ElMassah, S.; Mohieldin, M. Digital transformation and localizing the Sustainable Development Goals (SDGs). Ecol. Econ. 2020, 169, 106490. [Google Scholar] [CrossRef]
  51. Grootendorst, M. BERTopic: Neural topic modeling with a class-based TF-IDF procedure. arXiv 2022, arXiv:2203.05794. [Google Scholar]
  52. Hill-Yardin, E.L.; Hutchinson, M.R.; Laycock, R.; Spencer, S.J. A Chat(GPT) about the future of scientific publishing. Brain Behav. Immun. 2023, 110, 152–154. [Google Scholar] [CrossRef]
  53. Qasem, F. ChatGPT in scientific and academic research: Future fears and reassurances. Libr. Hi Tech News 2023, 40, 30–32. [Google Scholar] [CrossRef]
  54. Dieng, A.B.; Ruiz, F.J.R.; Blei, D.M. Topic Modeling in Embedding Spaces. Trans. Assoc. Comput. Linguist. 2020, 8, 439–453. [Google Scholar] [CrossRef]
  55. Benites-Lazaro, L.L.; Giatti, L.; Giarolla, A. Topic modeling method for analyzing social actor discourses on climate change, energy and food security. Energy Res. Soc. Sci. 2018, 45, 318–330. [Google Scholar] [CrossRef]
  56. Alvero, R. ChatGPT: Rumors of human providers’ demise have been greatly exaggerated. Fertil. Steril. 2023, 119, 930–931. [Google Scholar] [CrossRef] [PubMed]
  57. Gilat, R.; Cole, B.J. How Will Artificial Intelligence Affect Scientific Writing, Reviewing and Editing? The Future is Here. Arthrosc. J. Arthrosc. Relat. Surg. 2023, 39, 1119–1120. [Google Scholar] [CrossRef]
  58. Kang, Y.; Cai, Z.; Tan, C.-W.; Huang, Q.; Liu, H. Natural language processing (NLP) in management research: A literature review. J. Manag. Anal. 2020, 7, 139–172. [Google Scholar] [CrossRef]
  59. Web Portal OpenAI. OpenAI Embeddings Guide. 2023. Available online: https://platform.openai.com/docs/guides/embeddings (accessed on 13 December 2023).
  60. Gao, A.K. Vec2Vec: A Compact Neural Network Approach for Transforming Text Embeddings with High Fidelity. arXiv 2023, arXiv:2306.12689. [Google Scholar]
  61. Web Portal OpenAI. Available online: https://openai.com/blog/new-and-improved-embedding-model (accessed on 13 December 2023).
  62. Jimmy, L.; Ronak, P.; Tommaso, T.; Jasper, X. Vector Search with OpenAI Embeddings: Lucene Is All You Need. arXiv 2023, arXiv:2308.14963. [Google Scholar] [CrossRef]
  63. Rawat, A.J.; Ghildiyal, S.; Dixit, A.K. Topic modelling of legal documents using NLP and bidirectional encoder representations from transformers. Indones. J. Electr. Eng. Comput. Sci. 2022, 28, 1749–1755. [Google Scholar] [CrossRef]
  64. Moreira, V.L.; Giacomazzi, D.S.; Guerreiro, e.S.D.; Silva, D.U.; Monteiro, M.L. RegBR: A novel Brazilian government framework to classify and analyze industry-specific regulations. PLoS ONE 2022, 17, e0275282. [Google Scholar] [CrossRef] [PubMed]
  65. Ribeiro, V.; Louize, E.J.; Paiva, G.; Praciano, B.; Martins, V.; Canedo, E.; Mendonça, F.; Júnior, R.T.d.S.; Puttini, R. Natural Language Processing Applied in the Context of Economic Defense: A Case Study in a Brazilian Federal Public Administration Agency. In Proceedings of the 25th International Conference on Enterprise Information Systems, Prague, Czech Republic, 24–26 April 2023; ICEIS. SciTePress: Setúbal, Portugal, 2023; Volume 1, pp. 630–637, ISBN 978-989-758-648-4. [Google Scholar] [CrossRef]
  66. Schmuck, D.; Hameleers, M. Closer to the people: A comparative content analysis of populist communication on social networking sites in pre- and post-Election periods. Inf. Commun. Soc. 2020, 23, 1531–1548. [Google Scholar] [CrossRef]
  67. Moisés, J.Á. Cultura política, instituições e democracia: Lições da experiência brasileira. Rev. Bras. De Ciências Sociais 2008, 23, 11–43. [Google Scholar] [CrossRef]
  68. Pattison, A.; Cipolli, W.; Marichal, J.; Cherniakov, C. Fracking Twitter: Utilizing Machine Learning and Natural Language Processing Tools For Identifying Coalition and Causal Narratives. Politics Policy 2023, 51, 755–774. [Google Scholar] [CrossRef]
  69. Web Portal of the Superior Electoral Court (TSE). Available online: https://divulgacandcontas.tse.jus.br/divulga/#/estados/2022/2040602022/SP/candidato (accessed on 9 September 2023).
  70. Chang, J.; Gerrish, S.; Wang, C.; Boyd-Graber, J.; Blei, D. Reading tea leaves: How humans interpret topic models. In Proceedings of the 22nd International Conference on Neural Information Processing Systems (NIPS’09), Vancouver, BC, Canada, 7–10 December 2009; Curran Associates Inc.: Red Hook, NY, USA, 2009; pp. 288–296. [Google Scholar]
  71. Luzes do Conhecimento: Autoras que Brilham no Setor Elétrico/Centro da Memória da Eletricidade no Brasil. Rio de Janeiro: Memória da Eletricidade. ISBN 978-65-87286-21-1. Available online: https://www.ons.org.br/AcervoDigitalDocumentosEPublicacoes/ebook_LuzesdoConhecimento.pdf (accessed on 24 May 2024).
  72. Carvalho, S.A.; da Silva, S.O.; Charret, I.C. Mathematical modeling of dengue epidemic: Control methods and vaccination strategies. Theory Biosci. 2019, 138, 223–239. [Google Scholar] [CrossRef] [PubMed]
  73. Available online: https://arxiv.org/ftp/arxiv/papers/2306/2306.12689.pdf (accessed on 26 November 2024).
  74. Brown, T.; Mann, B.; Ryder, N.; Subbiah, M.; Kaplan, J.D.; Dhariwal, P.; Arvind, N.; Pranav, S.; Girish, S.; Amanda, A.; et al. Language models are few-shot learners. Adv. Neural Inf. Process. Syst. 2020, 33, 1877–1901. [Google Scholar]
  75. Braziliam Ministry of Foreign Affairs—Sustainable Development Goals. Available online: https://www.gov.br/mre/en/subjects/sustainable-development-and-the-environment/sustainable-development/sustainable-development-goals-sdgs (accessed on 12 December 2023).
  76. Sachs, J.D.; Schmidt-Traub, G.; Mazzucato, M.; Messner, D.; Nakicenovic, N.; Rockström, J. Six transformations to achieve the sustainable development goals. Nat. Sustain. 2019, 2, 805–814. [Google Scholar] [CrossRef]
  77. Koundouri, P.; Alamanos, A.; Plataniotis, A.; Stavridis, C.; Perifanos, K.; Devves, S. Assessing the sustainability of the European Green Deal and its interlinkages with the SDGs. Npj Clim. Action 2024, 3, 23. [Google Scholar] [CrossRef]
  78. Brasil. Lei n o 9.433, de 08 de janeiro de 1997. Institui a Política Nacional de Recursos Hídricos, cria o Sistema Nacional de Gerenciamento de Recursos Hídricos. Brasília: DOU de 09/01/1997. Available online: https://www.planalto.gov.br/ccivil_03/leis/l9433.htm (accessed on 26 November 2024).
  79. Brasil. Lei no 11.445, de 5 de janeiro de 2007. Estabelece Diretrizes Nacionais Para o Saneamento Básico, Cria o Comitê Interministerial de Saneamento Básico; Brasília: DOU de08/01/2007. Available online: https://www.gov.br/casacivil/pt-br/acoes-e-programas/copy_of_sustentabilidade/pls_plano_de_logistica_sustentavel_da_presidencia_da_republica.pdf (accessed on 26 November 2024).
  80. Brasil. Lei Federal nº 14.026, de 15 de julho de 2020. Atualiza o marco legal do saneamento básico. Brasília: DOU de 16/07/2020. Available online: https://www.planalto.gov.br/ccivil_03/_ato2019-2022/2020/lei/l14026.htm (accessed on 3 December 2024).
  81. MCidades/SNIS−Ministério das Cidades/Secretaria Nacional de Saneamento Ambiental/Sistema Nacional de Informações Sobre Saneamento. Diagnóstico dos serviços de água e esgoto—2022. Brasília, 2023. Available online: https://www.gov.br/cidades/pt-br/acesso-a-informacao/acoes-e-programas/saneamento/snis/painel (accessed on 25 May 2024).
  82. Fracalanza, A.P.; Da Paz, M.G.A.; Alves, E.M. Special section-Water, Sanitation and SDGs in Brazil Water and sanitation in Brazil: Conflicts, appropriation, and climate injustice. Desenvolv. E Meio Ambiente 2023, 62, 904–918. [Google Scholar] [CrossRef]
  83. Alves, E.M. Water policy and technical systems in Brazil. In Water Conflicts and Hydrocracy in the Americas: Coalitions, Networks, Policies; Poupeau, F., Ed.; Publishing Company: São Paulo, Brazil, 2018; pp. 51–56. [Google Scholar] [CrossRef]
  84. World Meteorological Organization. Provisional State of the Global Climate 2023. ISBN (PDF): 9789213586891. Available online: https://doi.org/10.18356/9789213586891 (accessed on 24 May 2024).
  85. National Institute of Meteorology. Braziliam Ministry of Agriculture and Livestock. Available online: https://portal.inmet.gov.br/noticias/ano-de-2023-%C3%A9-o-mais-quente-da-hist%C3%B3ria-do-brasil (accessed on 24 May 2024).
  86. National Institute of Meteorology. Braziliam Ministry of Agriculture and Livestock. Available online: https://portal.inmet.gov.br/noticias/balan%C3%A7o-s%C3%A3o-paulo-sp-teve-chuva-e-temperaturas-acima-da-m%C3%A9dia-em-novembro-2023 (accessed on 24 May 2024).
  87. National Institute of Meteorology. Braziliam Ministry of Agriculture and Livestock. Available online: https://portal.inmet.gov.br/noticias/noticias?noticias=culturas (accessed on 24 May 2024).
  88. Marengo, J.A.; Cunha, A.P.; Seluchi, M.E.; Camarinha, P.I.; Dolif, G.; Sperling, V.B.; Alcântara, E.H.; Ramos, A.M.; Andrade, M.M.; Stabile, R.A.; et al. Heavy rains and hydrogeological disasters on February 18th–19th, 2023, in the city of São Sebastião, São Paulo, Brazil: From meteorological causes to early warnings. Nat. Hazards 2024, 120, 7997–8024. [Google Scholar] [CrossRef]
  89. Edson, T.V.; Murilo, d.C.R.L.; da Silva, R.C.; Gilberto, F.; dos Santos, M.J. Regional Development and the Intensification of Socionatural Disasters: The Case of São Sebastião/SP. Rev. Bras. De Gestão E Desenvolv. Reg. 2023, 19, 493–516. [Google Scholar]
  90. Valverde, M.C.; Calado, B.N.; Calado, G.G.; Kuroki, L.Y.; Brambila, R.; Sousa, A.R.d. Climate projections of precipitation and temperature in cities from ABC Paulista, in the Metropolitan Region of São Paulo—Brazil. Front. Clim. 2023, 5, 1127026. [Google Scholar] [CrossRef]
  91. Valverde, M.C.; Rosa, M.B. Heat Waves in São Paulo State (2000–2020), Brazil: Intensity, duration, spatial scope, and atmospheric characteristics. Int. J. Climatol. 2023, 43, 3782–3798. [Google Scholar] [CrossRef]
  92. Institute of Water and Sanitation. Data Collected from National System of Information and Sanitation—SNIS. Available online: https://www.aguaesaneamento.org.br/municipios-e-saneamento/sp/sao-paulo (accessed on 24 May 2024).
  93. Santos, C.V.; Oliveira, A.F.; Ferreira, F.J.B.S. Potential impacts of climate change on agriculture and the economy in different regions of Brazil. Rev. De Econ. E Sociol. Rural. 2022, 60, e220611. [Google Scholar] [CrossRef]
  94. Tanure, T.M.P.; Domingues, E.P.; Magalhães, A.S. Regional impacts of climate change on agricultural productivity: Evidence on large-scale and family farming in Brazil. Rev. De Econ. E Sociol. Rural. 2024, 62, e262515. [Google Scholar] [CrossRef]
  95. IPCC. Contribution of Working Group II to the Sixth Assessment Report of the Intergovernmental Panel on Climate Change. In Climate Change 2022: Impacts, Adaptation, and Vulnerability; Pörtner, H.-O., Roberts, D.C., Tignor, M., Poloczanska, E.S., Mintenbeck, K., Alegría, A., Craig, M., Langsdorf, S., Löschke, S., Möller, V., et al., Eds.; Cambridge University Press: Cambridge, UK; New York, NY, USA, 2022; p. 3056. [Google Scholar] [CrossRef]
  96. Roveri, V.; Guimarães, L.L.; Toma, C.A.T. Occurrence and ecological risk assessment of pharmaceuticals and cocaine in a beach area of Guarujá, São Paulo State, Brazil, under the influence of urban surface runoff. Environ. Sci Pollut. Res. 2020, 27, 45063–45075. [Google Scholar] [CrossRef]
  97. Roveri, V.; Guimarães, L.L.; Correia, A.T. Spatial and temporal evaluation of the urban runoff water flowing into recreational areas of Guarujá, São Paulo State, Brazil. Int. J. River Basin Manag. 2020, 20, 93–109. [Google Scholar] [CrossRef]
  98. Roveri, V.; Guimarães, L.L.; Toma, W.; Correia, A.T. Occurrence and ecological risk assessment of pharmaceuticals and cocaine in the urban drainage channels of Santos beaches (São Paulo, Brazil): A neglected, but sensitive issue. Environ. Sci. Pollut. Res. 2021, 28, 65595–65609. [Google Scholar] [CrossRef] [PubMed]
  99. Bhat, R.A.; Singh, D.V.; Qadri, H.; Dar, G.H.; Dervash, M.A.; Bhat, S.A.; Unal, B.T.; Ozturk, M.; Hakeem, K.R.; Yousaf, B. Vulnerability of municipal solid waste: An emerging threat to aquatic ecosystems. Chemosphere 2022, 287, 132223. [Google Scholar] [CrossRef]
  100. Cetesb—Companhia Estadual de Tecnologia e Saneamento Ambiental. Relatório de Qualidade das Praias Litorâneas no Estado de São Paulo. Série Relatórios/CETESB, ISSN 0103-4103. ISBN 978-65-5577-059-9. 2023. Available online: http://cetesb.sp.gov.br/praias/publicacoes-relatorios/ (accessed on 26 May 2024).
  101. Ribeiro, V.V.; Nobre, C.R.; Moreno, B.B.; Semensatto, D.; Sanz-Lazaro, C.; Moreira, L.B.; Castro, Í.B. Oysters and mussels as equivalent sentinels of microplastics and natural particles in coastal environments. Sci. Total Environ. 2023, 874, 162468. [Google Scholar] [CrossRef]
  102. Begossi, A.; Salivonchyk, S.; Hallwass, G.; Hanazaki, N.; Lopes, P.F.M.; Silvano, R.A.M. Threatened fish and fishers along the Brazilian Atlantic Forest Coast. AMBIO 2017, 46, 907–914. [Google Scholar] [CrossRef] [PubMed] [PubMed Central]
  103. Joly, C.A.; Scarano, F.R.; Bustamante, M.; Gadda, T.M.C.; Metzger, J.P.W.; Seixas, C.S.; Ometto, J.P.H.; Pires, A.P.F.; Boesing, A.L.; Sousa, F.D.R.; et al. Brazilian assessment on biodiversity and ecosystem services: Summary for policy makers. Biota Neotrop. 2019, 19, e20190865. [Google Scholar] [CrossRef]
  104. Magris, R.A.; Costa, M.D.P.; Ferreira, C.E.L.; Vilar, C.C.; Joyeux, J.; Creed, J.C.; Copertino, M.S.; Horta, P.A.; Sumida, P.Y.G.; Francini-Filho, R.B.; et al. A blueprint for securing Brazil’s marine biodiversity and supporting the achievement of global conservation goals. Divers. Distrib. 2021, 27, 198–215. [Google Scholar] [CrossRef]
  105. Tavares, P.A.; Brites, A.D.; Sparovek, G.; Guidotti, V.; Cerignoni, F.; Aguiar, D.; Metzger, J.P.W.; Rodrigues, R.; Pinto, L.F.G.; Mello, K.; et al. Unfolding additional massive cutback effects of the Native Vegetation Protection Law on Legal Reserves, Brazil. Biota Neotrop. 2019, 19, e20180658. [Google Scholar] [CrossRef]
  106. Rezende, C.L.; Scarano, F.R.; Assad, E.D.; Joly, C.A.; Metzger, J.P.; Strassburg, B.B.N.; Tabarelli, M.; Fonseca, G.A.; Mittermeier, R.A. From hotspot to hopespot: An opportunity for the Brazilian Atlantic Forest. Perspect. Ecol. Conserv. 2018, 16, 208–214. [Google Scholar] [CrossRef]
  107. de Mello, K.; Taniwaki, R.H.; de Paula, F.R.; Valente, R.A.; Randhir, T.O.; Macedo, D.R.; Leal, C.G.; Rodrigues, C.B.; Hughes, R.M. Multiscale land use impacts on water quality: Assessment, planning, and future perspectives in Brazil. J. Environ. Manag. 2020, 270, 110879. [Google Scholar] [CrossRef] [PubMed]
  108. Tasso, A.; Julia, S.; Marcos, R.; Artur, L.; Carolina, D.L.M.; Jean-François, T. Technical Note Potential Impacts of Due Diligence Criteria on the Protection of Threatened South American Non-Forest Natural Ecosystems. Version 2—July 2022. Available online: https://brasil.mapbiomas.org/wp-content/uploads/sites/4/2023/08/Nota_Tecnica_UE_07.07.2022.pdf (accessed on 25 May 2024).
  109. Report: Fundação SOS Mata Atlântica, Arcplan, and MapBiomas. Available online: https://lookerstudio.google.com/u/0/reporting/cbc36cb0-03c4-4019-b236-b67b98fd5fc8/page/p_ogni1kr75c (accessed on 25 May 2024).
  110. Rosa, M.R.; Brancalion, P.H.; Crouzeilles, R.; Tambosi, L.R.; Piffer, P.R.; Lenti, F.E.; Hirota, M.; Santiami, E.; Metzger, J.P. Hidden destruction of older forests threatens Brazil’s Atlantic Forest and challenges restoration programs. Sci. Adv. 2021, 7, eabc4547. [Google Scholar] [CrossRef] [PubMed]
  111. Klein, A.L. Eugen Warming e o Cerrado Brasileiro: Um Século Depois; Editora UNESP: São Paulo, Brazil, 2000. [Google Scholar]
  112. National Institute for Space Research (INPE). General Coordination of Earth Observation. TerraBrasilis. Available online: http://terrabrasilis.dpi.inpe.br/ (accessed on 25 May 2024).
  113. National Institute for Space Research (INPE). General Coordination of Earth Observation. DETER—Alertas de desmatamento no Cerrado Brasileiro. Available online: http://www.obt.inpe.br/cerrado (accessed on 25 May 2024).
  114. Leite-Filho, A.T.; Soares-Filho, B.S.; de Oliveira, U. Climate risks to soy-maize double-cropping due to Amazon deforestation. Int. J. Climatol. 2024, 44, 1245–1261. [Google Scholar] [CrossRef]
  115. Pinto, L.F.G.; Potenza, R.; Piatto, M.; Azevedo, T. Contribuição da Mata Atlântica Para a NDC Brasileira: Análise Histórica das Emissões de GEE e Potencial de Mitigação Até 2050. São Paulo: Fundação SOS Mata Atlântica. 2021, p. 49. Available online: https://cms.sosma.org.br/wp-content/uploads/2021/11/Emiss%C3%B5es-da-Mata-Atl%C3%A2ntica.pdf (accessed on 15 October 2022).
  116. Technical Note from Jones dos Santos Neves Institute: Pobreza e Miséria nos Estados Brasileiros 2022. Available online: https://ijsn.es.gov.br/Media/IJSN/PublicacoesAnexos/sumarios/IJSN_Especial_Pobreza_Estados_Brasileiros_2022.pdf (accessed on 28 May 2024).
  117. Instituto Brasileiro de Geografia e Estatística (IBGE). Report on Continuous National Household Sample Survey—Continuous, 2023. Pesquisa Nacional por Amostra de Domicílios Contínua (PNADC). Available online: https://agenciadenoticias.ibge.gov.br/en/agencia-news/2184-news-agency/news/39857-food-security-in-brazilian-households-increases-in-2023 (accessed on 28 May 2024).
  118. Available online: https://www.gov.br/mds/pt-br/noticias-e-conteudos/desenvolvimento-social/noticias-desenvolvimento-social/bolsa-familia-retira-18-5-milhoes-de-familias-da-linha-da-pobreza (accessed on 28 May 2024).
  119. FAPESP Report: ODS no PPA 2016-2019. 1º Relatório de Acompanhamento dos Objetivos de Desenvolvimento Sustentável do Estado de São Paulo. Available online: https://fapesp.br/publicacoes/odssp.pdf (accessed on 28 May 2024).
  120. Reis, D.S. Crossroads knowledge: (de)coloniality, epistemic racism and philosophy teaching. Educ. Em Rev. 2020, 36, e75102. [Google Scholar] [CrossRef]
  121. OECD; Economic Commission for Latin America and the Caribbean; CAF Development Bank of Latin America; European Commission. Latin American Economic Outlook 2023: Investing in Sustainable Development; OECD Publishing: Paris, France, 2023; Available online: https://www.oecd-ilibrary.org/sites/c9ecb24c-en/index.html?itemId=/content/component/c9ecb24c-en (accessed on 31 May 2024). [CrossRef]
  122. Ministry of Development and Social Assistance, Family and Fight Against Hunger. Bolsa Família Reduz Desigualdades no Brasil, Aponta PNAD Contínua do IBGE. Available online: https://www.gov.br/mds/pt-br/noticias-e-conteudos/desenvolvimento-social/noticias-desenvolvimento-social/bolsa-familia-reduz-desigualdades-no-brasil-aponta-pnad-continua-do-ibge (accessed on 31 May 2024).
  123. Gender Statistics—Social Indicators of Women in Brazil. Available online: https://www.ibge.gov.br/en/statistics/multi-domain/gender/20325-gender-statistics-social-indicators-of-women-in-brazil.html (accessed on 30 May 2024).
  124. Salary Transparency and Remuneration Criteria Report Prepared by the Ministry of Labor and Employment and the Ministry of Women. Available online: https://www.gov.br/trabalho-e-emprego/pt-br/assuntos/estatisticas-trabalho/relatorio-igualdade (accessed on 30 May 2024).
  125. Black and Brown Women Spend More Time in Household Tasks, Participate Less in the Labor Market and Are More Affected by Poverty. Available online: https://agenciadenoticias.ibge.gov.br/en/agencia-news/2184-news-agency/news/39359-black-and-brown-women-spend-more-time-in-household-tasks-participate-less-in-the-labor-market-and-are-more-affected-by-poverty (accessed on 30 May 2024).
  126. OECD. Education at a Glance 2023: OECD Indicators; OECD Publishing: Paris, France, 2023. [Google Scholar] [CrossRef]
  127. Emenda Constitucional Nº 117, de 5 de Abril de 2022. Available online: https://www.planalto.gov.br/ccivil_03/constituicao/emendas/emc/emc117.htm (accessed on 30 May 2024).
  128. Representatividade Feminina Para a Próxima Legislatura na Alesp Cresce 31,57%. Available online: https://www.al.sp.gov.br/noticia/?id=441704 (accessed on 30 May 2024).
  129. Summary of Social Indicators. Brazilian Institute of Geography and Statistics. Available online: https://cidades.ibge.gov.br/brasil/pesquisa/45/62585 (accessed on 31 May 2024).
  130. Ministry of Health of Brazil. Painel de Casos de Doença Pelo Coronavírus 2019 (COVID-19). Available online: https://covid.saude.gov.br/ (accessed on 29 May 2024).
  131. Ministry of Health of Brazil. Cobertura Vacinal COVID-19 Rede Nacional de Dados em Saúde (RNDS). Available online: https://infoms.saude.gov.br/extensions/SEIDIGI_DEMAS_COBERTURA_COVID_RESIDENCIA/SEIDIGI_DEMAS_COBERTURA_COVID_RESIDENCIA.html (accessed on 29 May 2024).
  132. Domingues, C.M.A.S.; Maranhão, A.G.K.; Teixeira, A.M.; Fantinato, F.F.S.; Domingues, R.A.S. The Brazilian National Immunization Program: 46 years of achievements and challenges. Cad. Saúde Pública 2020, 36, e00222919. [Google Scholar] [CrossRef]
  133. Maciel, N.S.; Braga, H.M.F.G.; Moura, F.J.N.; Luzia, F.J.M.; Sousa, I.E.S.; Rouberte, E.S.C. Temporal and spatial distribution of polio vaccine coverage in Brazil between 1997 and 2021. Rev. Bras. Epidemiol. 2023, 26, e230037, Erratum in: Rev. Bras. Epidemiol. 2023, 26, e20230037. [Google Scholar] [CrossRef] [PubMed] [PubMed Central]
  134. Ministry of Health of Brazil, Technical Report: National Vaccination Campaign Against Poliomyelitis, 2024. Available online: https://www.gov.br/saude/pt-br/vacinacao/informes-tecnicos/campanha-nacional-de-vacinacao-contra-a-poliomielite-2024.pdf (accessed on 29 May 2024).
  135. Ministry of Health of Brazil. Cobertura Vacinal—Residência. Available online: https://infoms.saude.gov.br/extensions/SEIDIGI_DEMAS_VACINACAO_CALENDARIO_NACIONAL_COBERTURA_RESIDENCIA/SEIDIGI_DEMAS_VACINACAO_CALENDARIO_NACIONAL_COBERTURA_RESIDENCIA.html (accessed on 29 May 2024).
  136. da Silva, T.M.R.; Sá, A.C.M.G.N.; Prates, E.J.S.; Freitas, S.R.; da Silva, T.P.R.; Silva, T.A.M.D.; Beinner, M.A.; de Oliveira, S.R.; de Sá, A.T.N.; Matozinhos, F.P.; et al. Temporal and spatial distribution trends of polio vaccine coverage in less than one-year old children in Brazil, 2011–2021. BMC Public Health 2023, 23, 1359. [Google Scholar] [CrossRef] [PubMed] [PubMed Central]
  137. Kantar IBOPE Media: Beyond Age. Available online: https://www.kantaribopemedia.com/wp-content/uploads/2022/11/Beyond-Age-2022_Brasil_Kantar-IBOPE-Media.pdf (accessed on 2 June 2024).
  138. Available online: https://www.gov.br/inep/pt-br/areas-de-atuacao/pesquisas-estatisticas-e-indicadores/ideb (accessed on 2 June 2024).
  139. Blei, D.M.; Ng, A.Y.; Jordan, M.I. Latent dirichlet allocation. J. Mach. Learn. Res. 2003, 3, 993–1022. [Google Scholar]
  140. Wanzinack, C.; Signorelli, M.C.; Reis, C. Violence and social determinants of health in Brazil: Association between homicides, urbanization, population, inequality, and development. Rep. Public Health 2022, 38, e00282621. [Google Scholar] [CrossRef]
  141. United Nations Office on Drugs and Crime. Global Study on Homicide 2023. Available online: https://www.unodc.org/documents/data-and-analysis/gsh/2023/Global_study_on_homicide_2023_web.pdf (accessed on 1 June 2024).
  142. Sistema Nacional de Informações de Segurança Pública (SINESP). Mapa da Segurança Pública. Available online: https://www.gov.br/mj/pt-br/assuntos/sua-seguranca/seguranca-publica/estatistica/download/dnsp-base-de-dados/mapa-da-seguranca-publica-primeiro-semestre-de-2023.pdf (accessed on 1 June 2024).
  143. Anuário Brasileiro De Segurança Pública 2023. São Paulo: Fórum Brasileiro de Segurança Pública, ano 17, 2023. ISSN 1983-7364. Available online: https://publicacoes.forumseguranca.org.br/handle/123456789/22922/05/2024 (accessed on 25 May 2024).
  144. Technical report on population in street situation—Diagnóstico com Base nos Dados e Informações Disponíveis em Registros Administrativos e Sistemas do Governo Federal. Available online: https://www.gov.br/mdh/pt-br/navegue-por-temas/populacao-em-situacao-de-rua/publicacoes/relat_pop_rua_digital.pdf (accessed on 2 June 2024).
  145. Wallace Góes Mendes, Cosme Marcelo Furtado. Homicide of Lesbians, Gays, Bisexuals, Travestis, Transexuals, and Transgender people (LGBT) in Brazil: A Spatial Analysis. Ciência Saúde Coletiva Ciência Saúde Coletiva 2020, 25, 1709–1722. [Google Scholar]
  146. Dossiê 2023: Mortes Violentas Contra LGBTIA+ no Brasil. Available online: https://observatoriomorteseviolenciaslgbtibrasil.org/wp-content/uploads/2024/05/Dossie-de-Mortes-e-Violencias-Contra-LGBTI-no-Brasil-2023-ACONTECE-ANTRA-ABGLT.pdf (accessed on 1 June 2024).
  147. OECD. “Brazil”, in Education at a Glance 2023: OECD Indicators; OECD Publishing: Paris, France, 2023. [Google Scholar] [CrossRef]
  148. Dados e Produção de Energia Elétrica. Available online: https://dadosenergeticos.energia.sp.gov.br//portalcev2/intranet/BiblioVirtual/eletrica/Resumo_Executivo_EE.pdf (accessed on 24 May 2024).
  149. Boletim Energético: Informativo Mensal de Dados Sobre a Geração e Consumo dos Principais Energéticos do Estado de São Paulo. Available online: https://dadosenergeticos.energia.sp.gov.br/portalcev2/intranet/BiblioVirtual/diversos/boletim_energetico.pdf (accessed on 24 May 2024).
  150. Boletim Energético do Estado de São Paulo 2022: Ano Base 2021. Available online: https://dadosenergeticos.energia.sp.gov.br/portalcev2/intranet/BiblioVirtual/diversos/BalancoEnergetico.pdf (accessed on 24 May 2024).
  151. Painel de Indicadores Econômicos: Produto Interno Bruto. FAESP: Ano Base 2024. Available online: https://faespsenar.com.br/painel-de-indicadores-economicos/ (accessed on 4 June 2024).
  152. Acompanhamento Econômico. FAESP: Ano Base 2024. Available online: https://faespsenar.com.br/informes/comercio-exterior/ (accessed on 4 June 2024).
  153. Radar Macroenconômico. FAESP: Ano Base 2024. Available online: https://faespsenar.com.br/informes/radar-macroeconomico/ (accessed on 4 June 2024).
  154. Comércio Exterior. FAESP: Ano Base 2024. Available online: https://faespsenar.com.br/informes/comercio-exterior/ (accessed on 4 June 2024).
  155. NOVO CAGED. Estatísticas Mensais do Emprego Formal: Ano Base 2024. Available online: https://www.gov.br/trabalho-e-emprego/pt-br/assuntos/estatisticas-trabalho/novo-caged/novo-caged-2024/maio (accessed on 4 June 2024).
  156. Painel de Indicadores Econômicos: Inflação. FAESP: Ano Base 2024. Available online: https://faespsenar.com.br/painel-de-indicadores-economicos/ (accessed on 4 June 2024).
  157. Painel de Indicadores Econômicos: Indicadores de Commodities. FAESP: Ano Base 2024. Available online: https://faespsenar.com.br/painel-de-indicadores-economicos/ (accessed on 4 June 2024).
  158. Painel de Indicadores Econômicos: Taxa de Exportação Nominal. FAESP: Ano Base 2024. Available online: https://faespsenar.com.br/painel-de-indicadores-economicos/ (accessed on 4 June 2024).
  159. Sammon, J. A nonlinear mapping for data structure analysis. IEEE Trans. Comput. 1969, 100, 401–409. [Google Scholar] [CrossRef]
  160. Saul, L.K.; Roweis, S.T. Think globally, fit locally: Unsupervised learning of low dimensional manifolds. J. Mach. Learn. Res. 2003, 4, 119–155. [Google Scholar]
  161. Sun, J.; Crowe, M.; Fyfe, C. Extending metric multidimensional scaling with Bregman divergences. Pattern Recognit. 2011, 44, 1137–1154. [Google Scholar] [CrossRef]
  162. Greenacre, M. Correspondence analysis. In Encyclopedia of Social Science Research Methods; Lewis-Beck, M.S., Bryman, A., Liao, T.F., Eds.; Sage: Thousand Oaks, CA, USA, 2004; Volume 3. [Google Scholar]
  163. Kaciak, E.; Louviere, J. Multiple correspondence analysis of multiple choice experiment data. J. Mark. Res. 1990, 27, 455–465. [Google Scholar] [CrossRef]
  164. Soares, C.P.; Correia, S.N.; Cunha, P.; Cotter, J.; Sousa, N. The use of multiple correspondence analysis to explore associations between categories of qualitative variables in healthy ageing. J. Aging Res. 2013, 12, 302163. [Google Scholar]
  165. Beh, E.J. Simple correspondence analysis: A bibliographic review. Int. Stat. Rev. 2004, 72, 257–284. [Google Scholar] [CrossRef]
  166. Barabási, A.L. Network Science; Cambridge University Press: Cambridge, UK, 2016; pp. 1–475. [Google Scholar]
  167. Huang, H.; Tang, J.; Liu, L.; Luo, J.; Fu, X. Triadic closure pattern analysis an prediction in social networks. IEEE Trans. Knowl. DataEngineering 2015, 27, 3374–3389. [Google Scholar] [CrossRef]
  168. Easley, D.; Kleinberg, J. Networks, Crowds, and Markets: Reasoning About Ahighly Connected World; Cambridge University Press: Cambridge, UK, 2010. [Google Scholar]
  169. Newman, M.E. The structure and function of complex networks. SIAM Rev. 2003, 45, 167–256. [Google Scholar] [CrossRef]
  170. Leskovec, J.; Mcauley, J.J. Learning to discover social circles in ego networks. Adv. Neural Inf. Process. Syst. 2012, 25, 539–547. [Google Scholar]
  171. Wen, J.; Yuan, Q. Social circles discovery based on structural and attributesimilarities. In 2016 IEEE Trustcom/BigDataSE/ISPA; IEEE: Piscataway Township, NJ, USA, 2016; pp. 1652–1659. [Google Scholar]
  172. Van Holt, T.; Johnson, J.C.; Brinkley, J.D.; Carley, K.M.; Caspersen, J. Structure of ethnic violence in sudan: A semi-automated network. analysis of online news (2003–2010). Comput. Math. Organ. Theory 2012, 18, 340–355. [Google Scholar] [CrossRef]
  173. Muhammad, S.A.; Van Laerhoven, K. DUKE: A Solution for Discovering Neighborhood Patterns in Ego Networks. Proc. Int. AAAI Conf. Web Soc. Media 2015, 9, 268–277. [Google Scholar] [CrossRef]
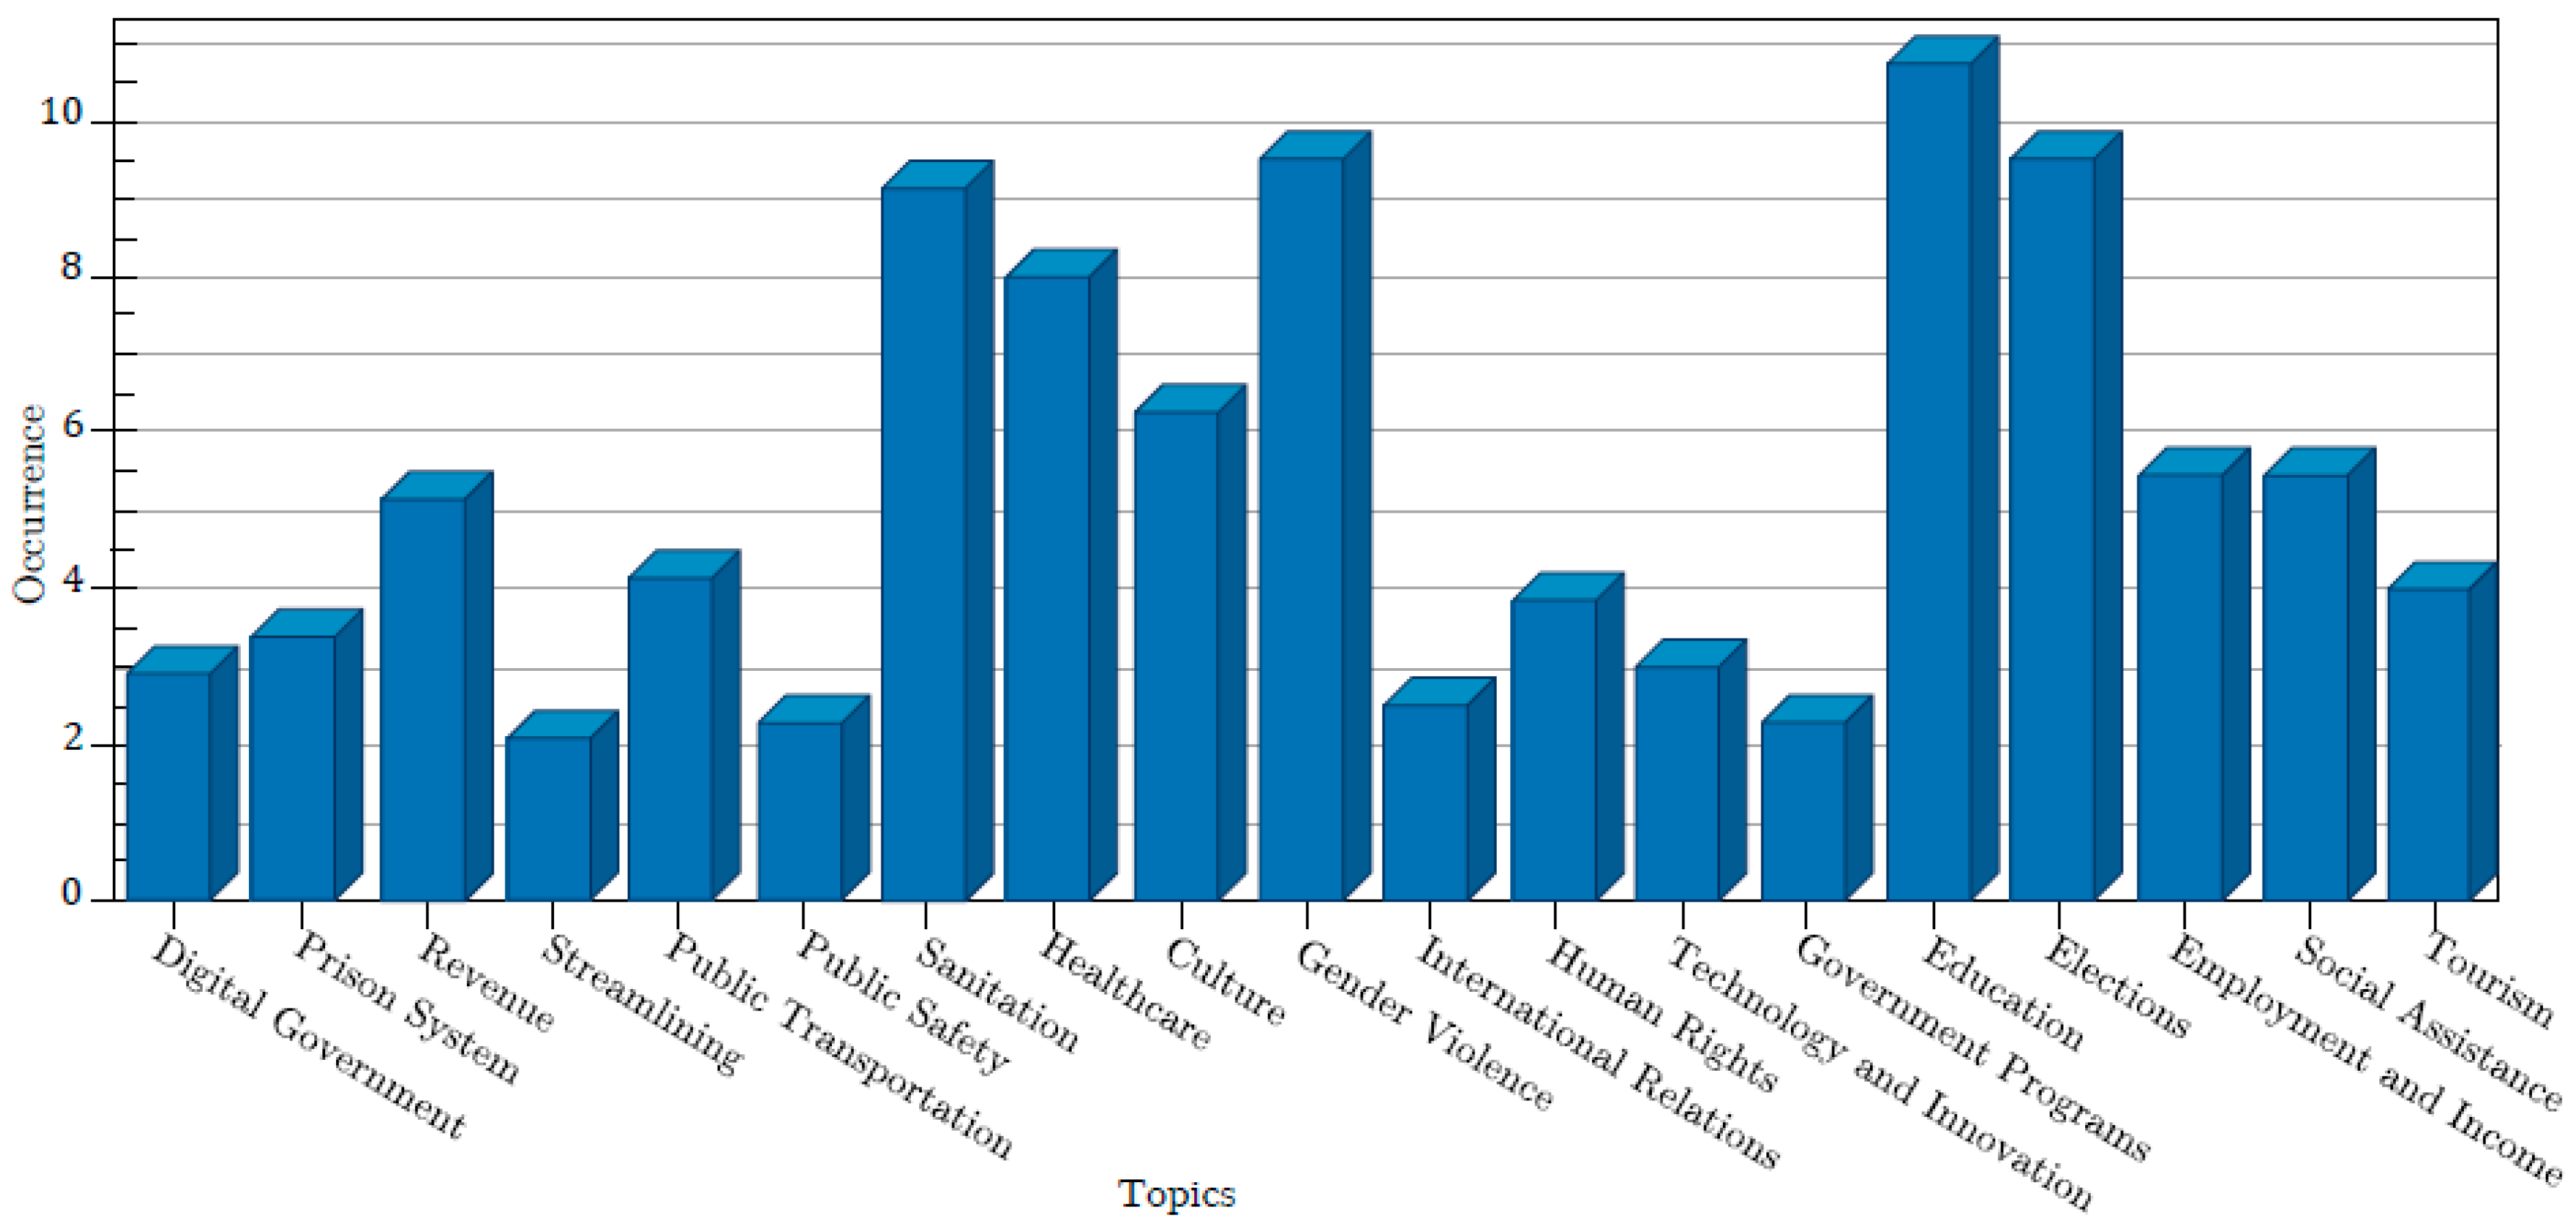
Figure 1. Distribution of the occurrence of 19 topics identified across the 10 government plans.
Sustainability 16 10672 g001
Figure 2. Percentage of coverage of each of the 19 topics presented in the documents of the political parties.
Sustainability 16 10672 g002
Figure 3. Bubble chart of 2-dimensional thematic correspondence analysis revealing the presence of four clusters of political parties’ documents and their respective proximities. Each document is represented by a bubble labelled with political party acronyms. The clusters are indicated by the colors blue (PT), red (PCB and UP), purple (PCO and PSTU), and cyan (DC, NOVO, PDT, PSDB, and REP).
Sustainability 16 10672 g003
Figure 4. MDS map of a 19-topic model trained on the entire corpus. Each bubble represents a topic, with the size proportional to its prominence. The distance between bubbles indicates the proximity between topics, and the four colors illustrate the formation of four clusters among the 19 topics extracted from 10 government plans.
Sustainability 16 10672 g004
Figure 5. Representation of the statistical mode resulting from the binary perception analysis of the formal characteristics of government plans. Highlighted cells indicate the presence of formal characteristics in the respective government plans (Equation (3)).
Sustainability 16 10672 g005
Figure 6. Radar chart displaying the outcomes of the perception analysis based on the evaluation of the nineteen topics presented in Figure 1. The topics are positioned along a radial line and distributed around the outer circle. The circles have radii ranging from 0 to 3, with intervals of 0.5. (a) Polygons associated with PT, PSDB, REP, PDT, and NOVO parties. (b) Polygons associated with PCB, UP, PSTU, PCO, and DC parties. Individual polygons are depicted in Supplemental Figures S8 and S9, with the percentage of coverage associated with each polygon shown in Supplemental Table S3.
Sustainability 16 10672 g006
Figure 7. Heatmap illustrating the alignment between SDGs and government plans. Cooler colors signify a lower alignment rate between SDGs and government plans, whereas warmer colors indicate a higher alignment rate between SDGs and government plans.
Sustainability 16 10672 g007
Table 1. Percentage of alignment between the 169 targets of the SDGs and exclusive agendas presented in government plans by the political parties.
Government PlanCoverage of the SDGs Targets (%)
DC21.30
NOVO20.12
PCB31.95
PCO2.37
PDT40.83
PSDB53.85
PSTU1.18
PT86.39
REP56.21
UP47.93
Disclaimer/Publisher’s Note: The statements, opinions and data contained in all publications are solely those of the individual author(s) and contributor(s) and not of MDPI and/or the editor(s). MDPI and/or the editor(s) disclaim responsibility for any injury to people or property resulting from any ideas, methods, instructions or products referred to in the content.