
Optimizing Bus Bridging Service Considering Passenger Transfer and Reneging Behavior


Abstract
1. Introduction
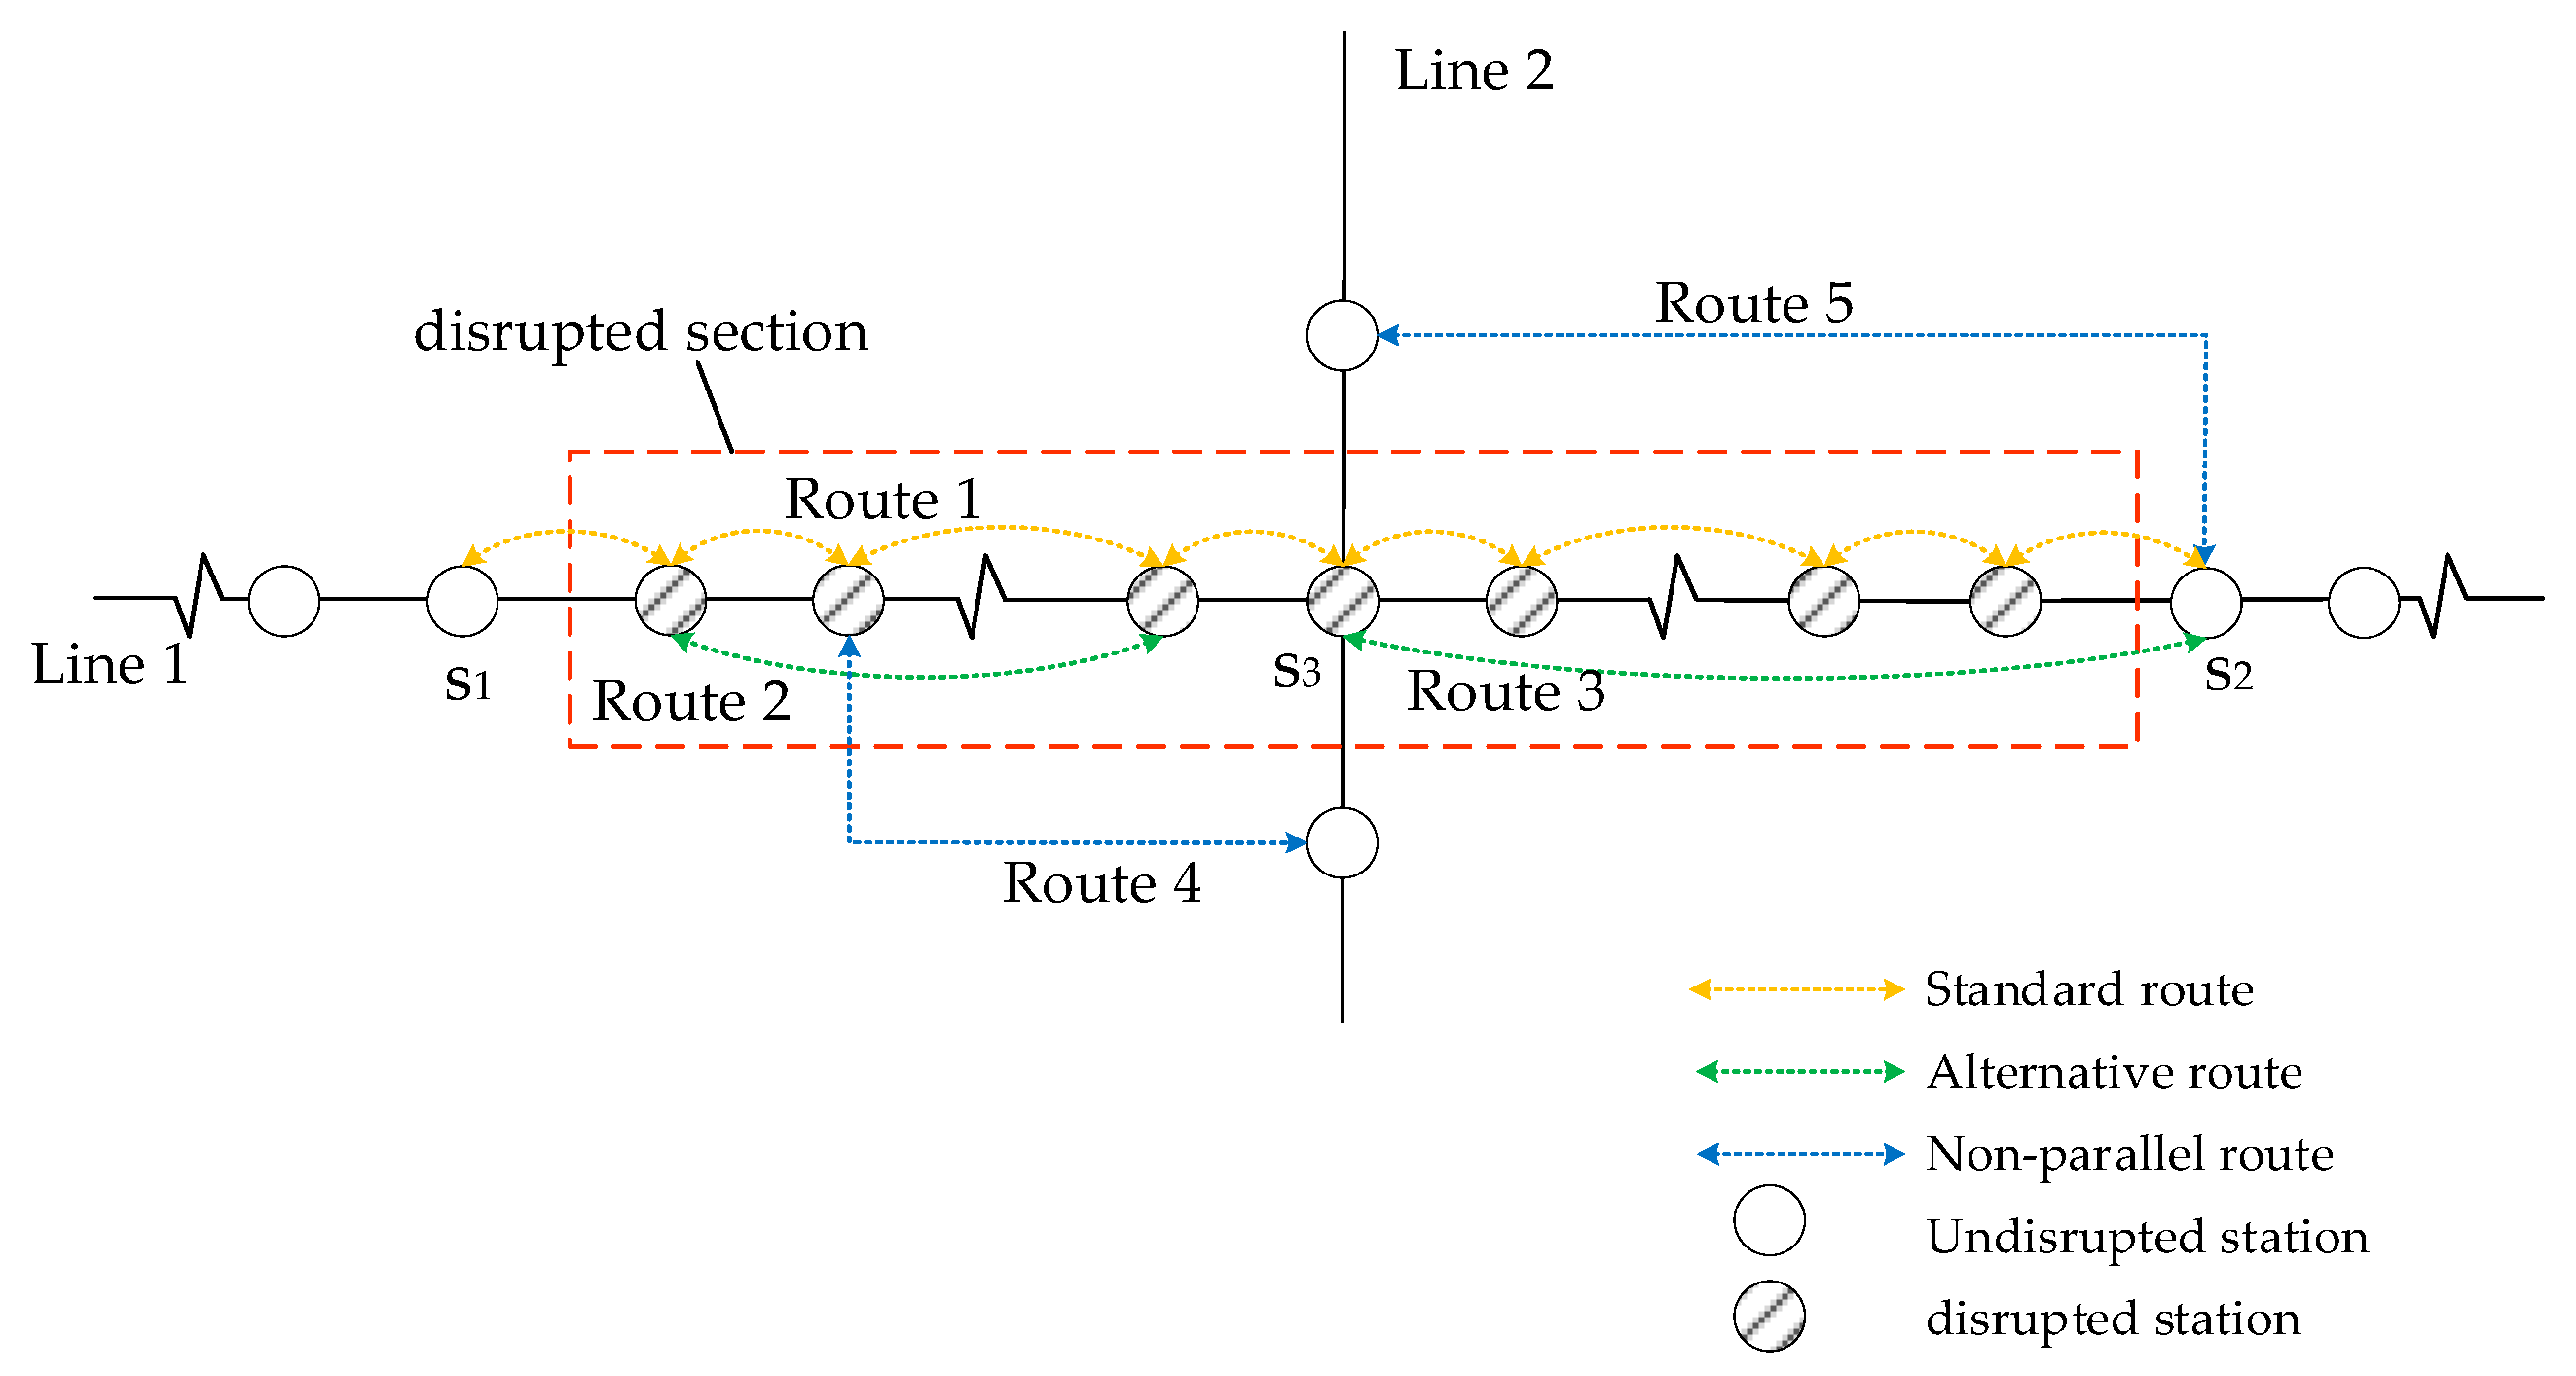
2. Problem Statement
3. Methodology
3.1. Generation of Candidate Bus Bridging Routes
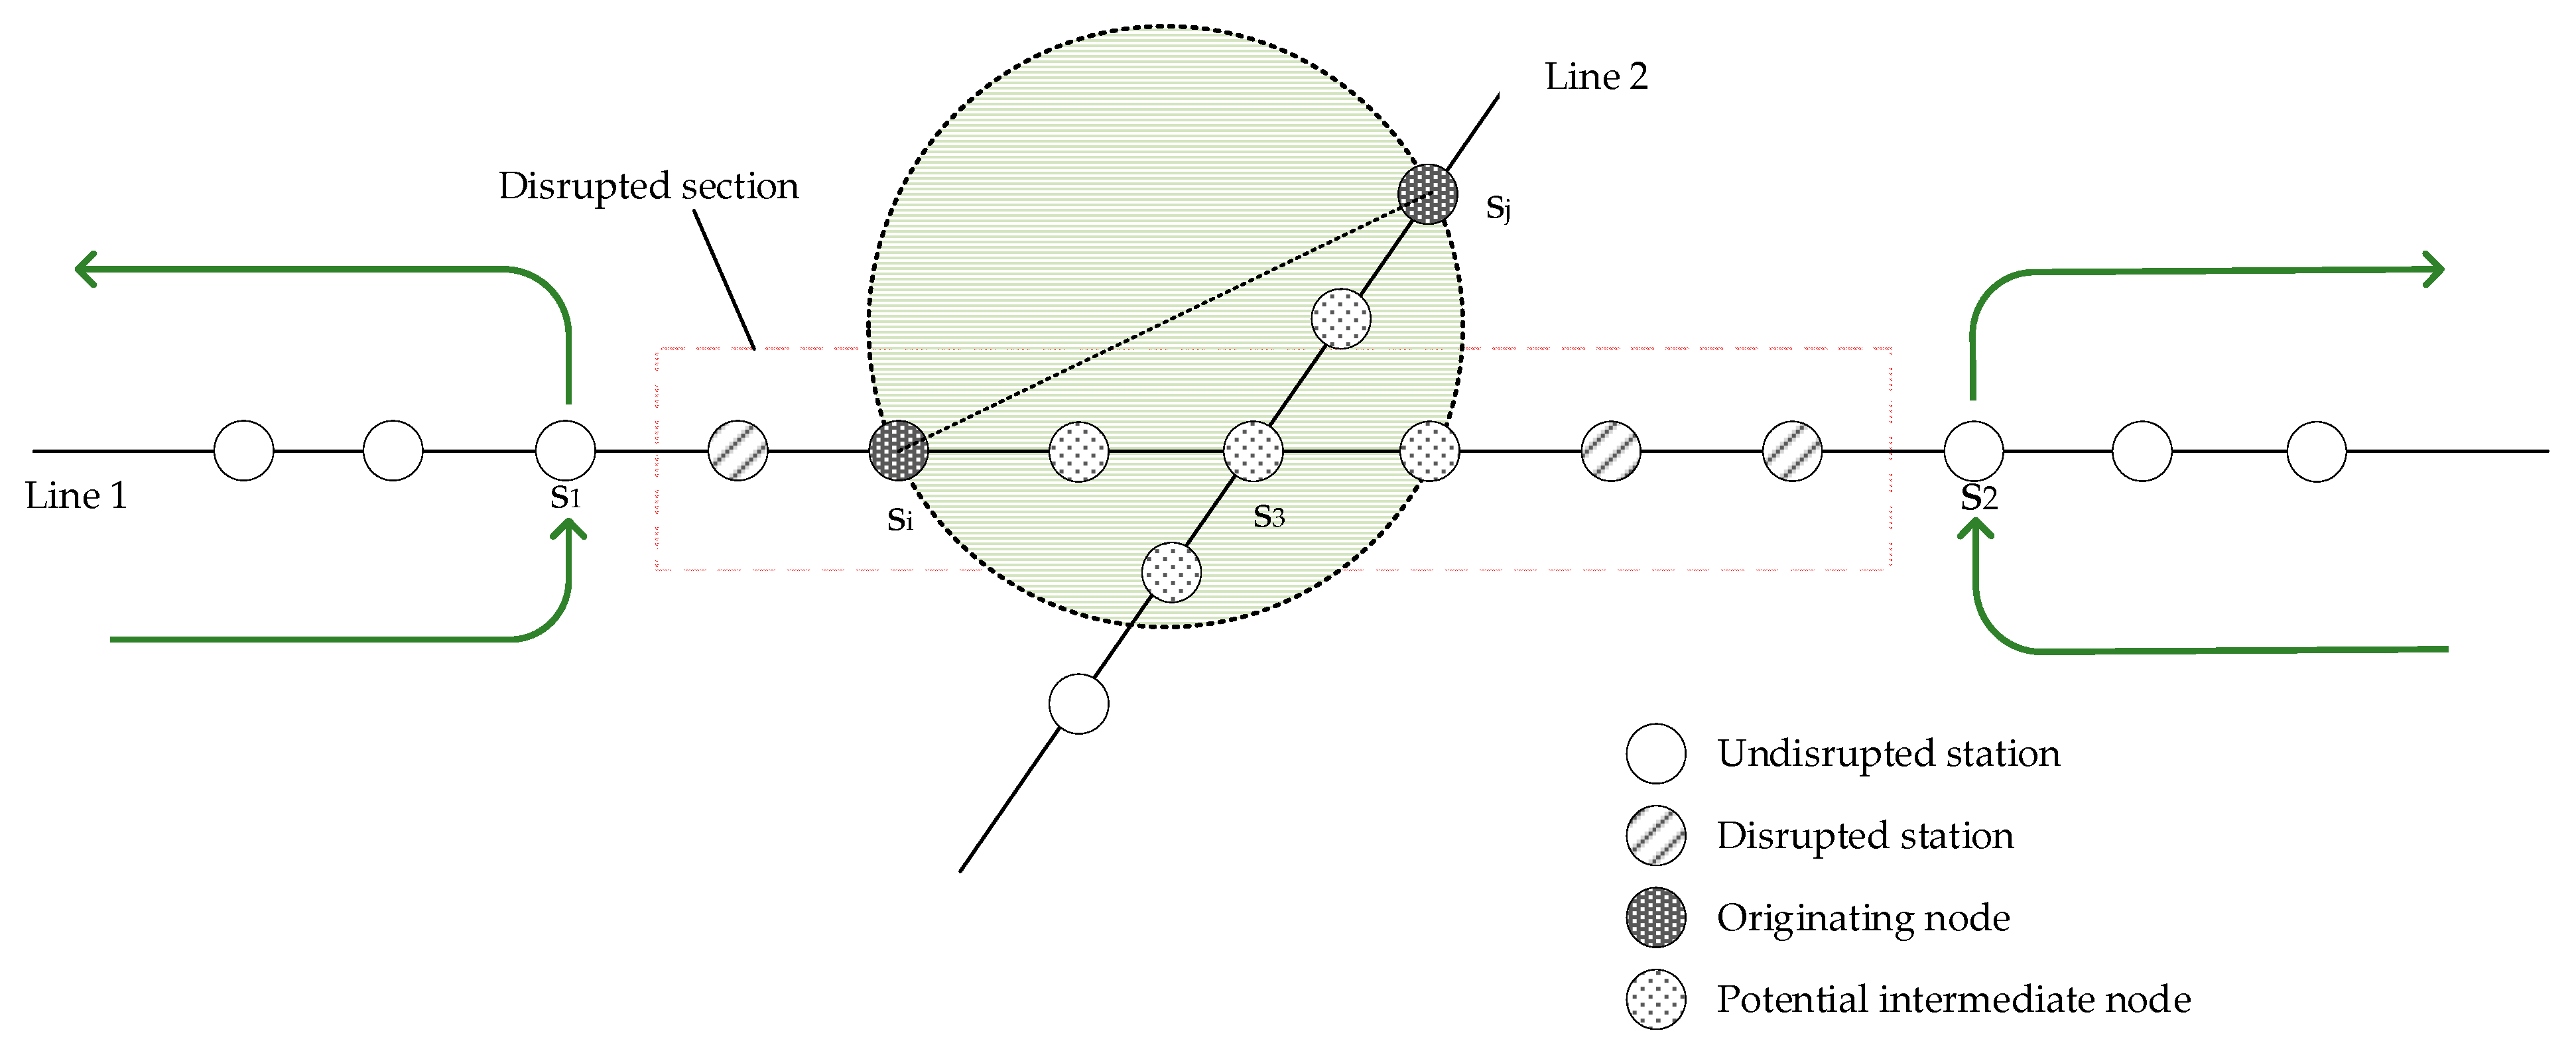
3.1.1. Determining Candidate Originating Nodes
- (1)
- Distance to the depot or bus terminal: The bridging buses should be dispatched from the depots or bus terminals to the originating nodes as quickly as possible.
- (2)
- Requirements for turning back: The originating nodes must meet the requirements for turning back, so only URT stations with nearby road conditions suitable for turning around can be selected as originating nodes.
- (3)
- Distance to the disrupted section: To minimize response time, URT stations far away from the disrupted section should not be selected as originating nodes.
- (4)
- Stranded passenger volume: Based on the three aforementioned location-related factors, the stranded passenger volume at a station can serve as an auxiliary factor to consider. URT stations with higher number of stranded passengers should be given priority when selecting originating nodes.
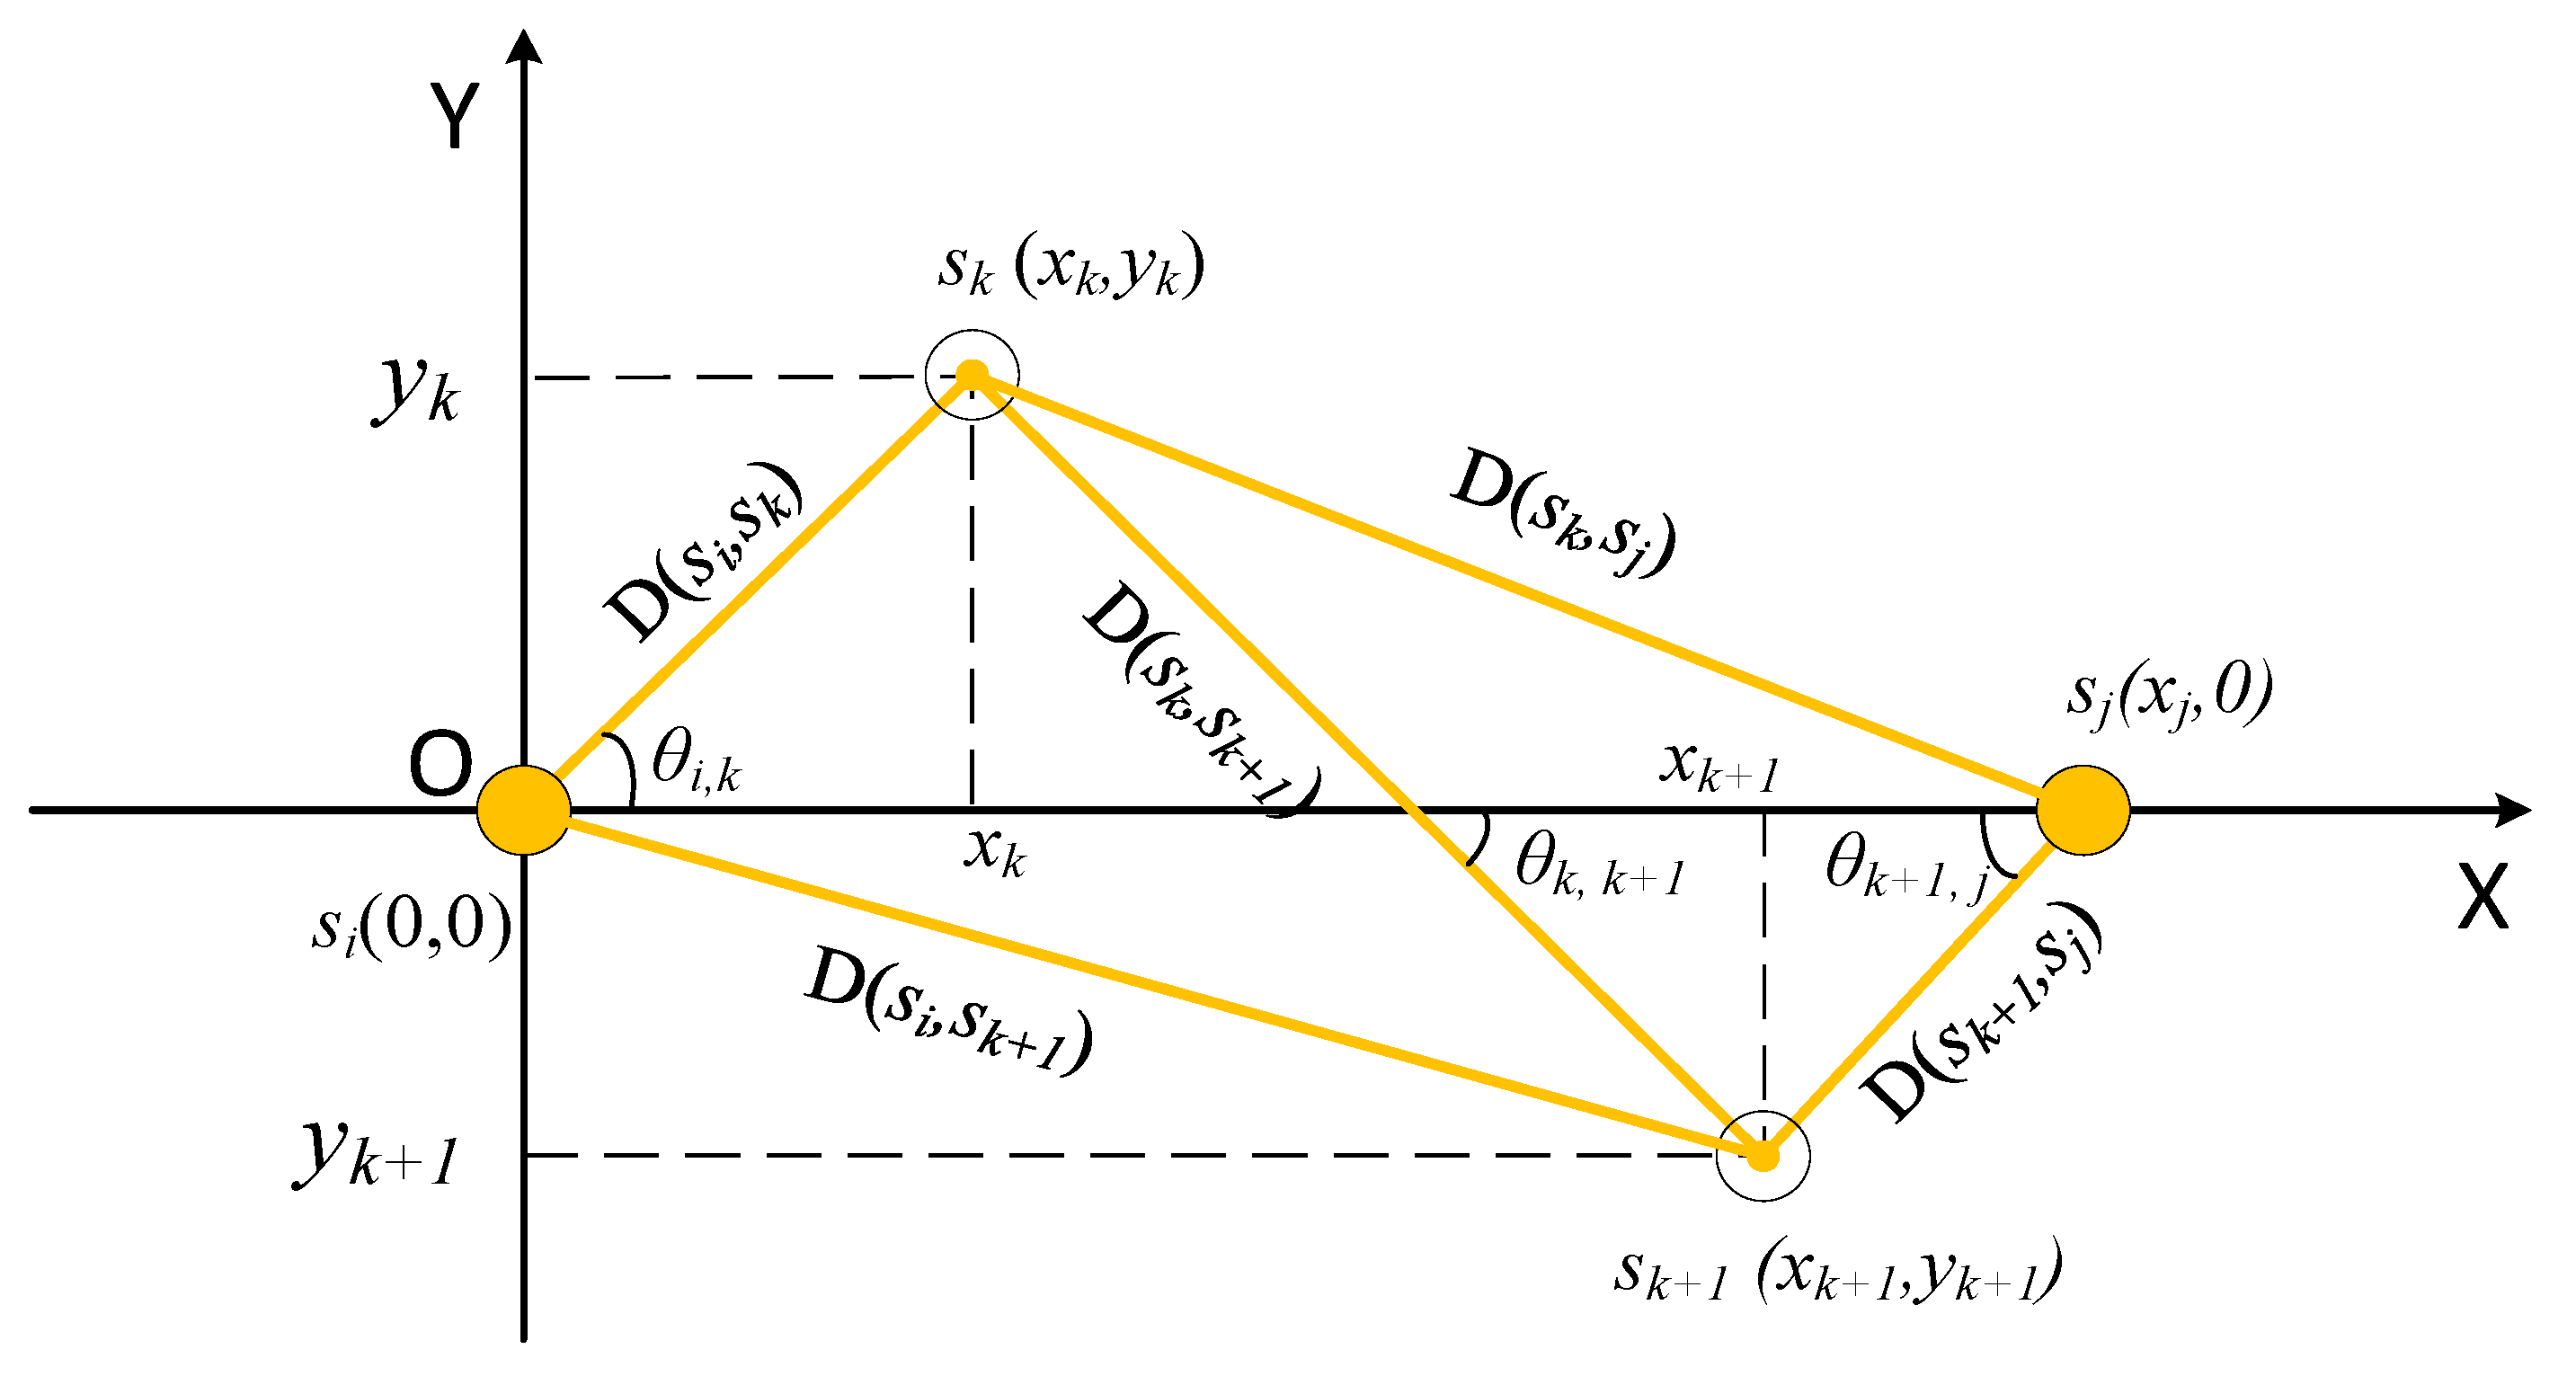
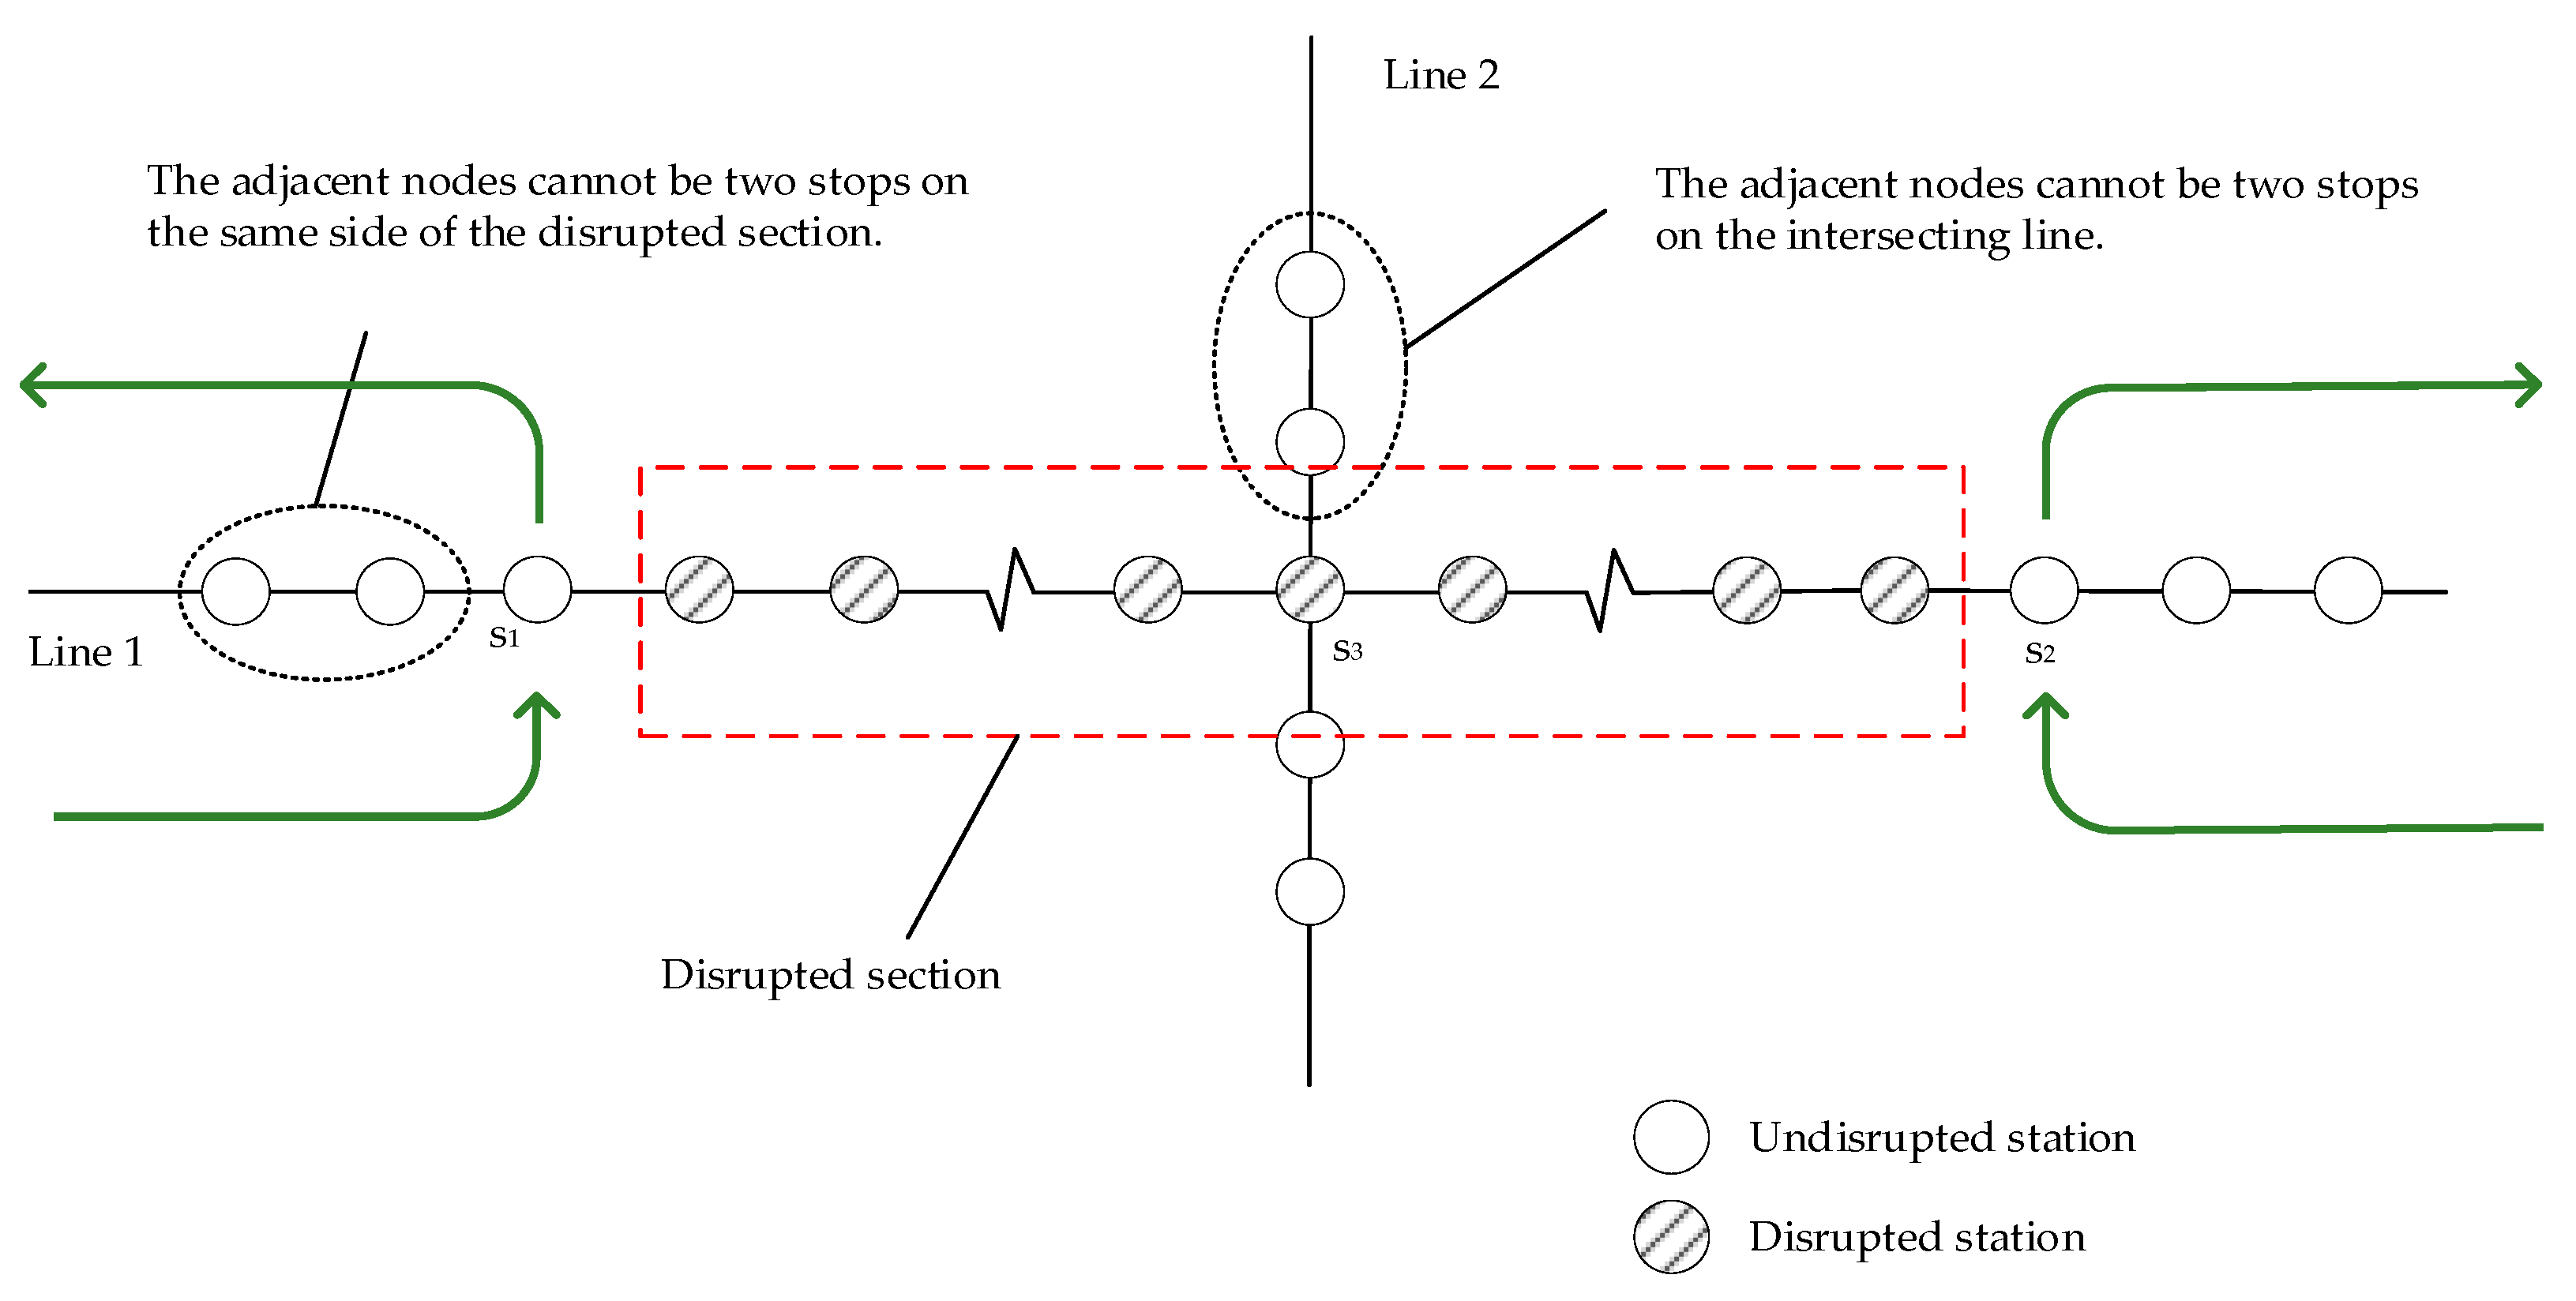
3.1.2. Generating Candidate Routes Based on Heuristic Rules
- The rule for searching direction
- 2.
- The rule of adjacent nodes
3.2. Route Selection and Bus Deployment Model
3.2.1. Assumptions
3.2.2. Notations
3.2.3. Model Formulations
3.3. Solution Algorithm
3.3.1. A Two-Stage Genetic Algorithm
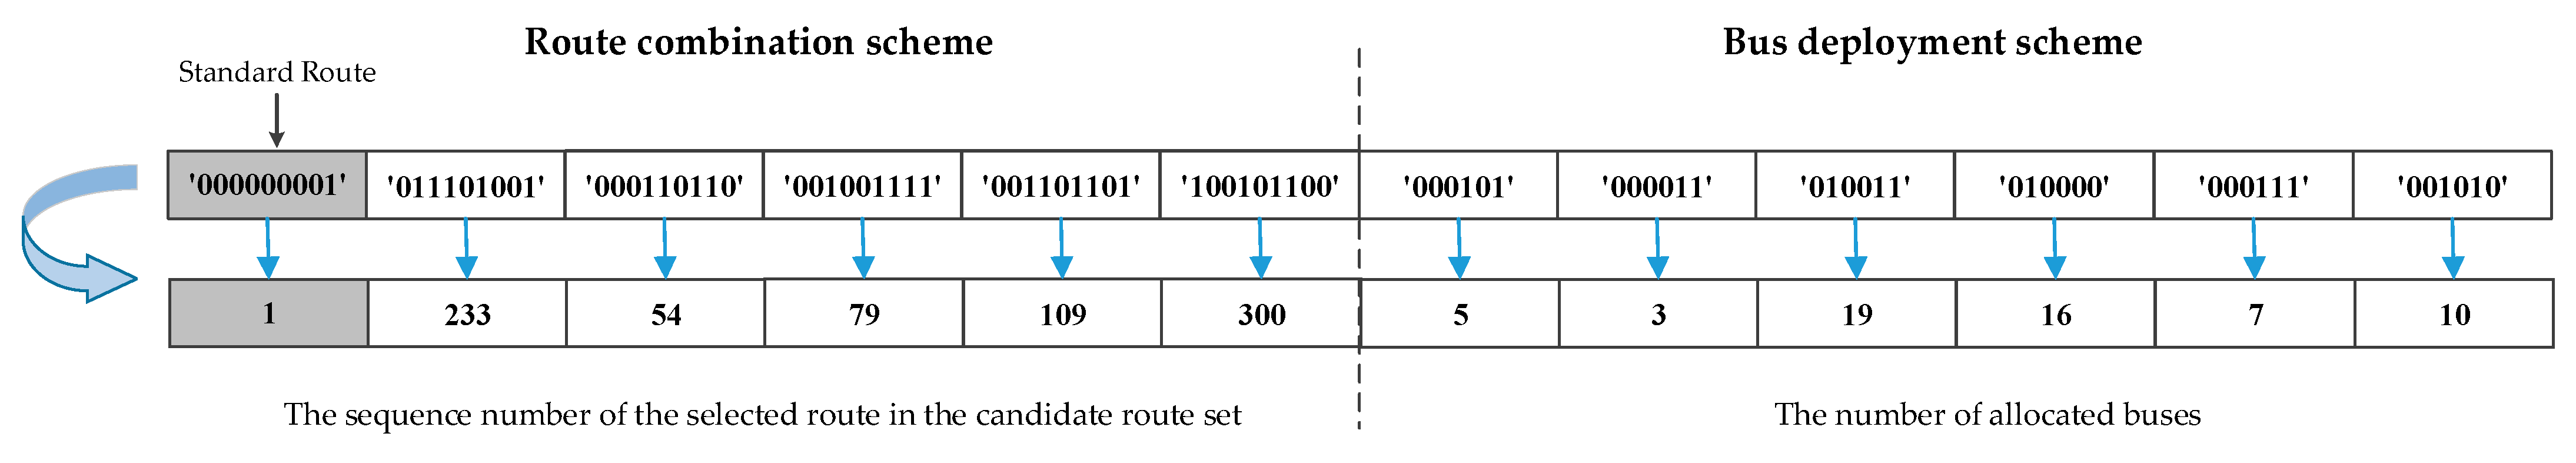
- Genetic Representation
- 2.
- Fitness function
- 3.
- Selection
- 4.
- Crossover
- 5.
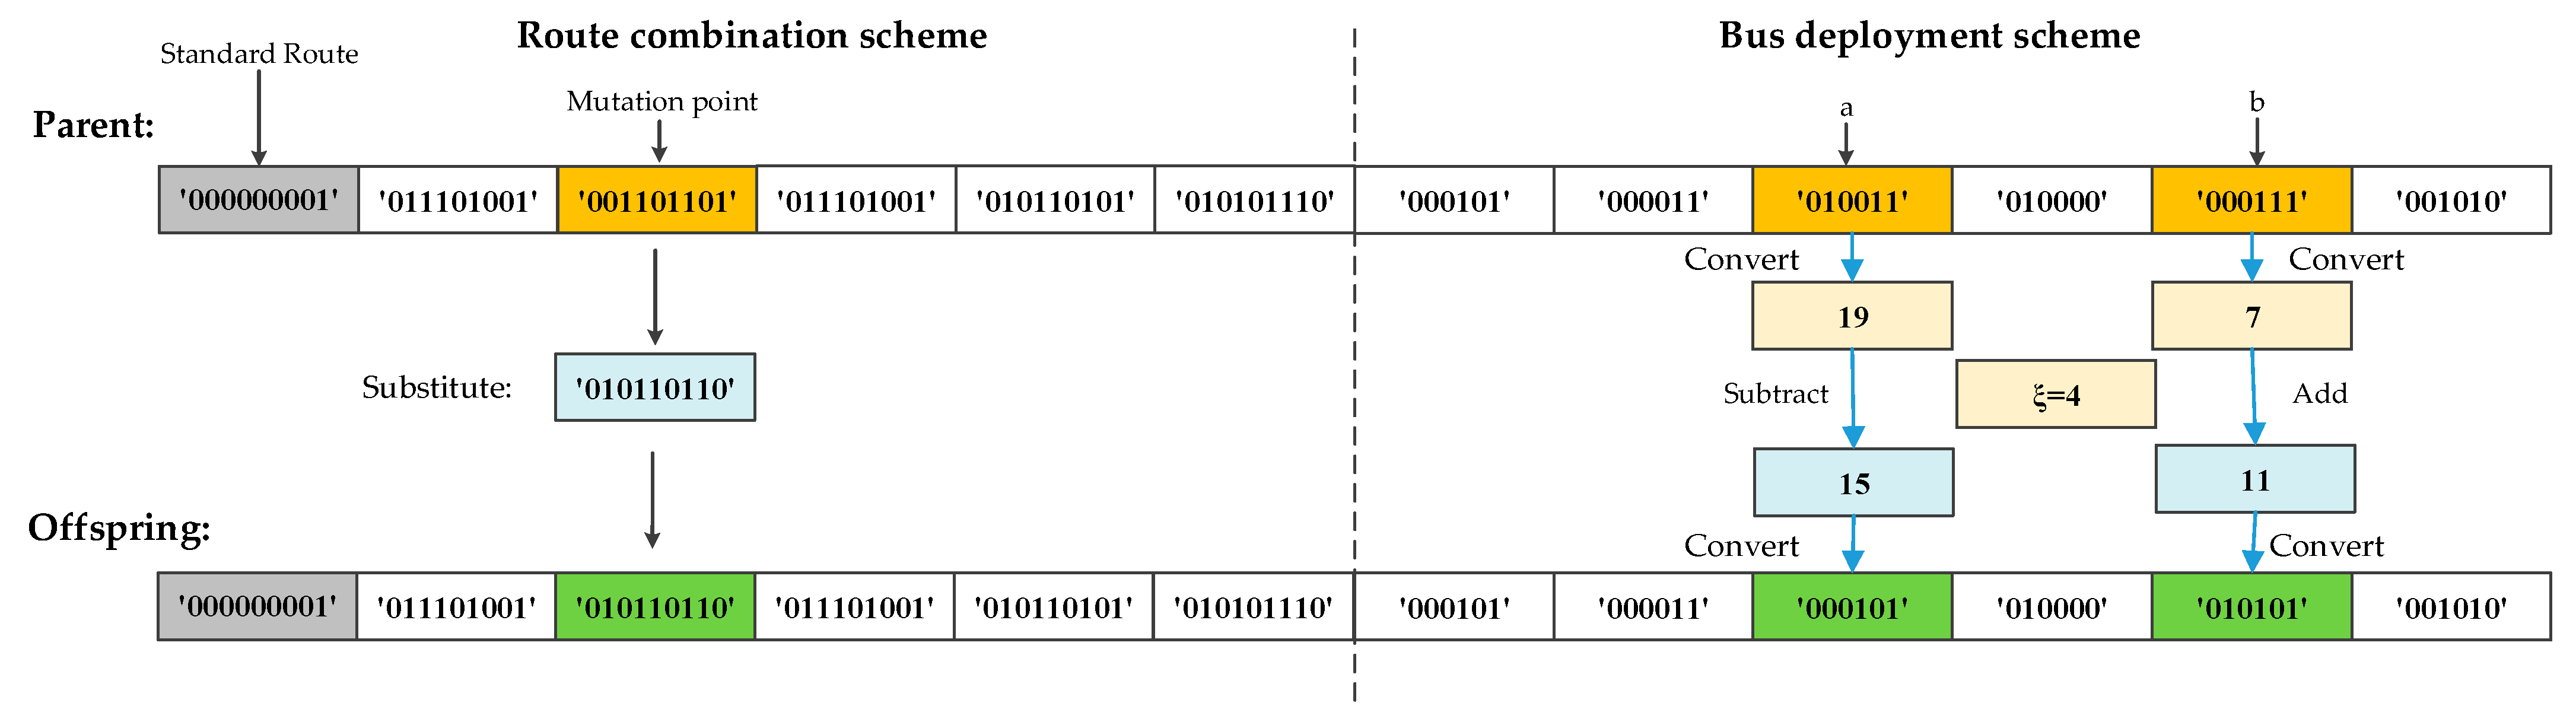
- Mutation
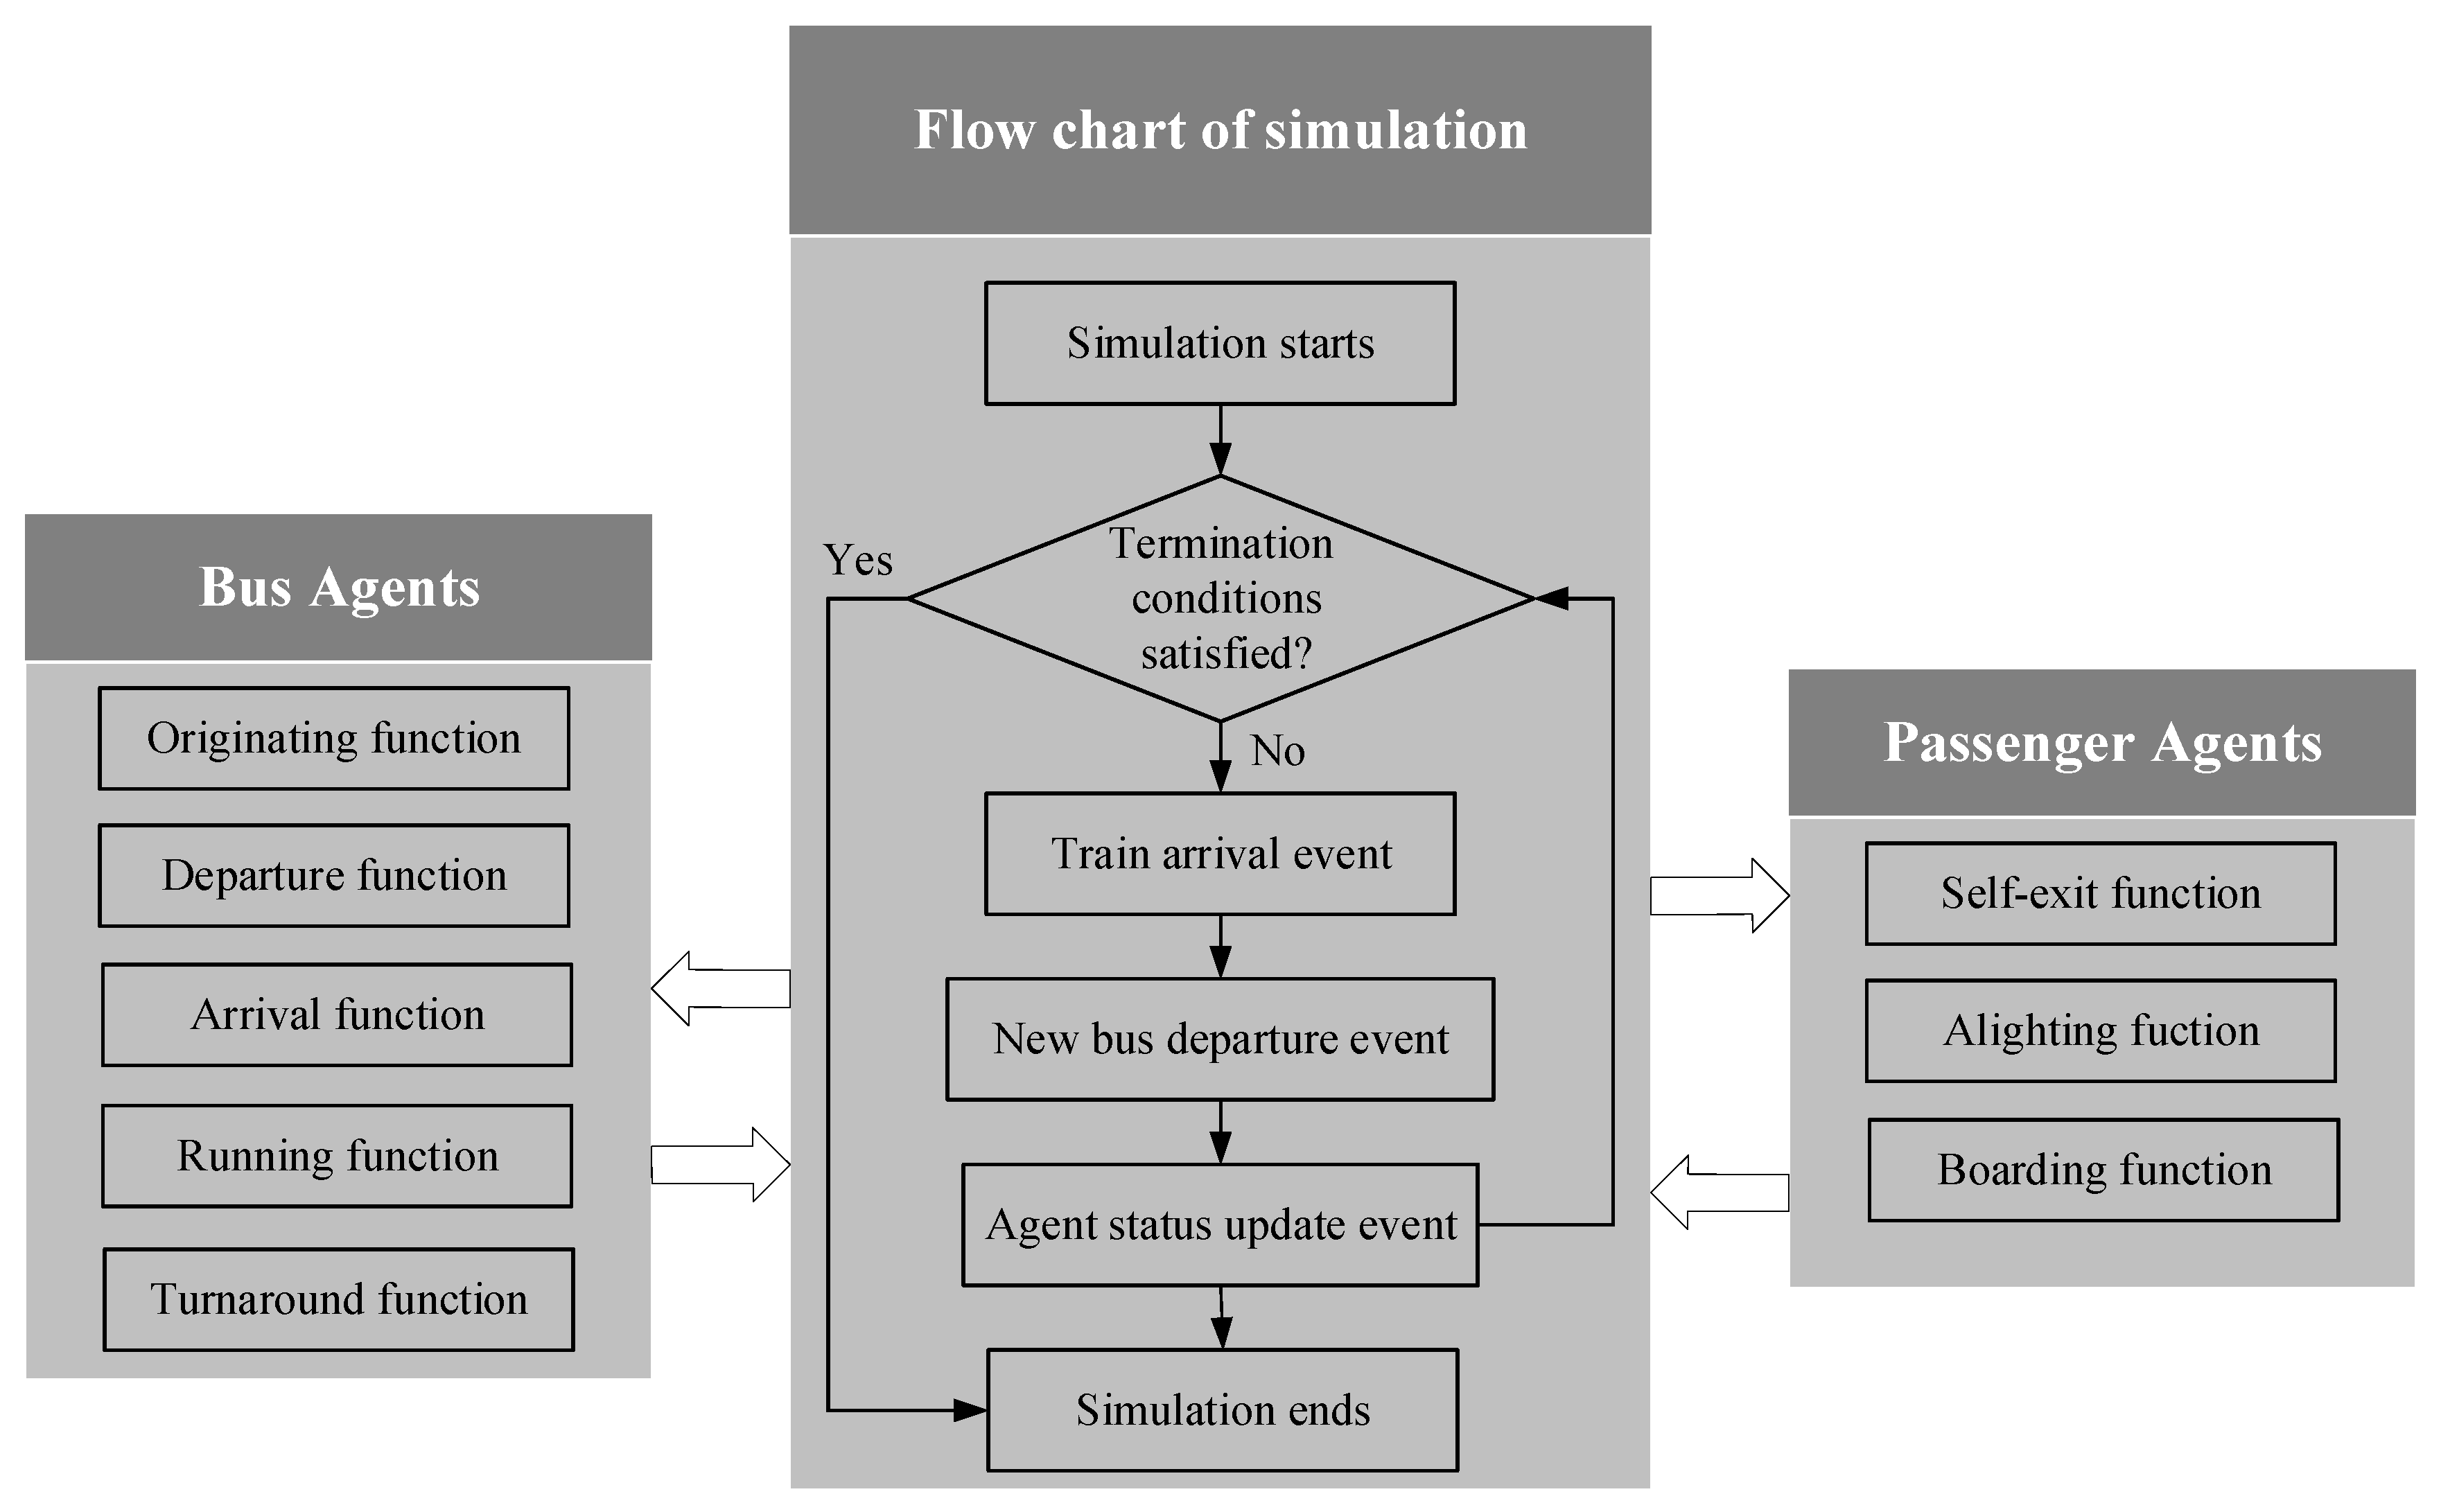
3.3.2. A Multi-Agent Simulation Method for Fitness Measurement
- Bus agent
- 2.
- Passenger agent
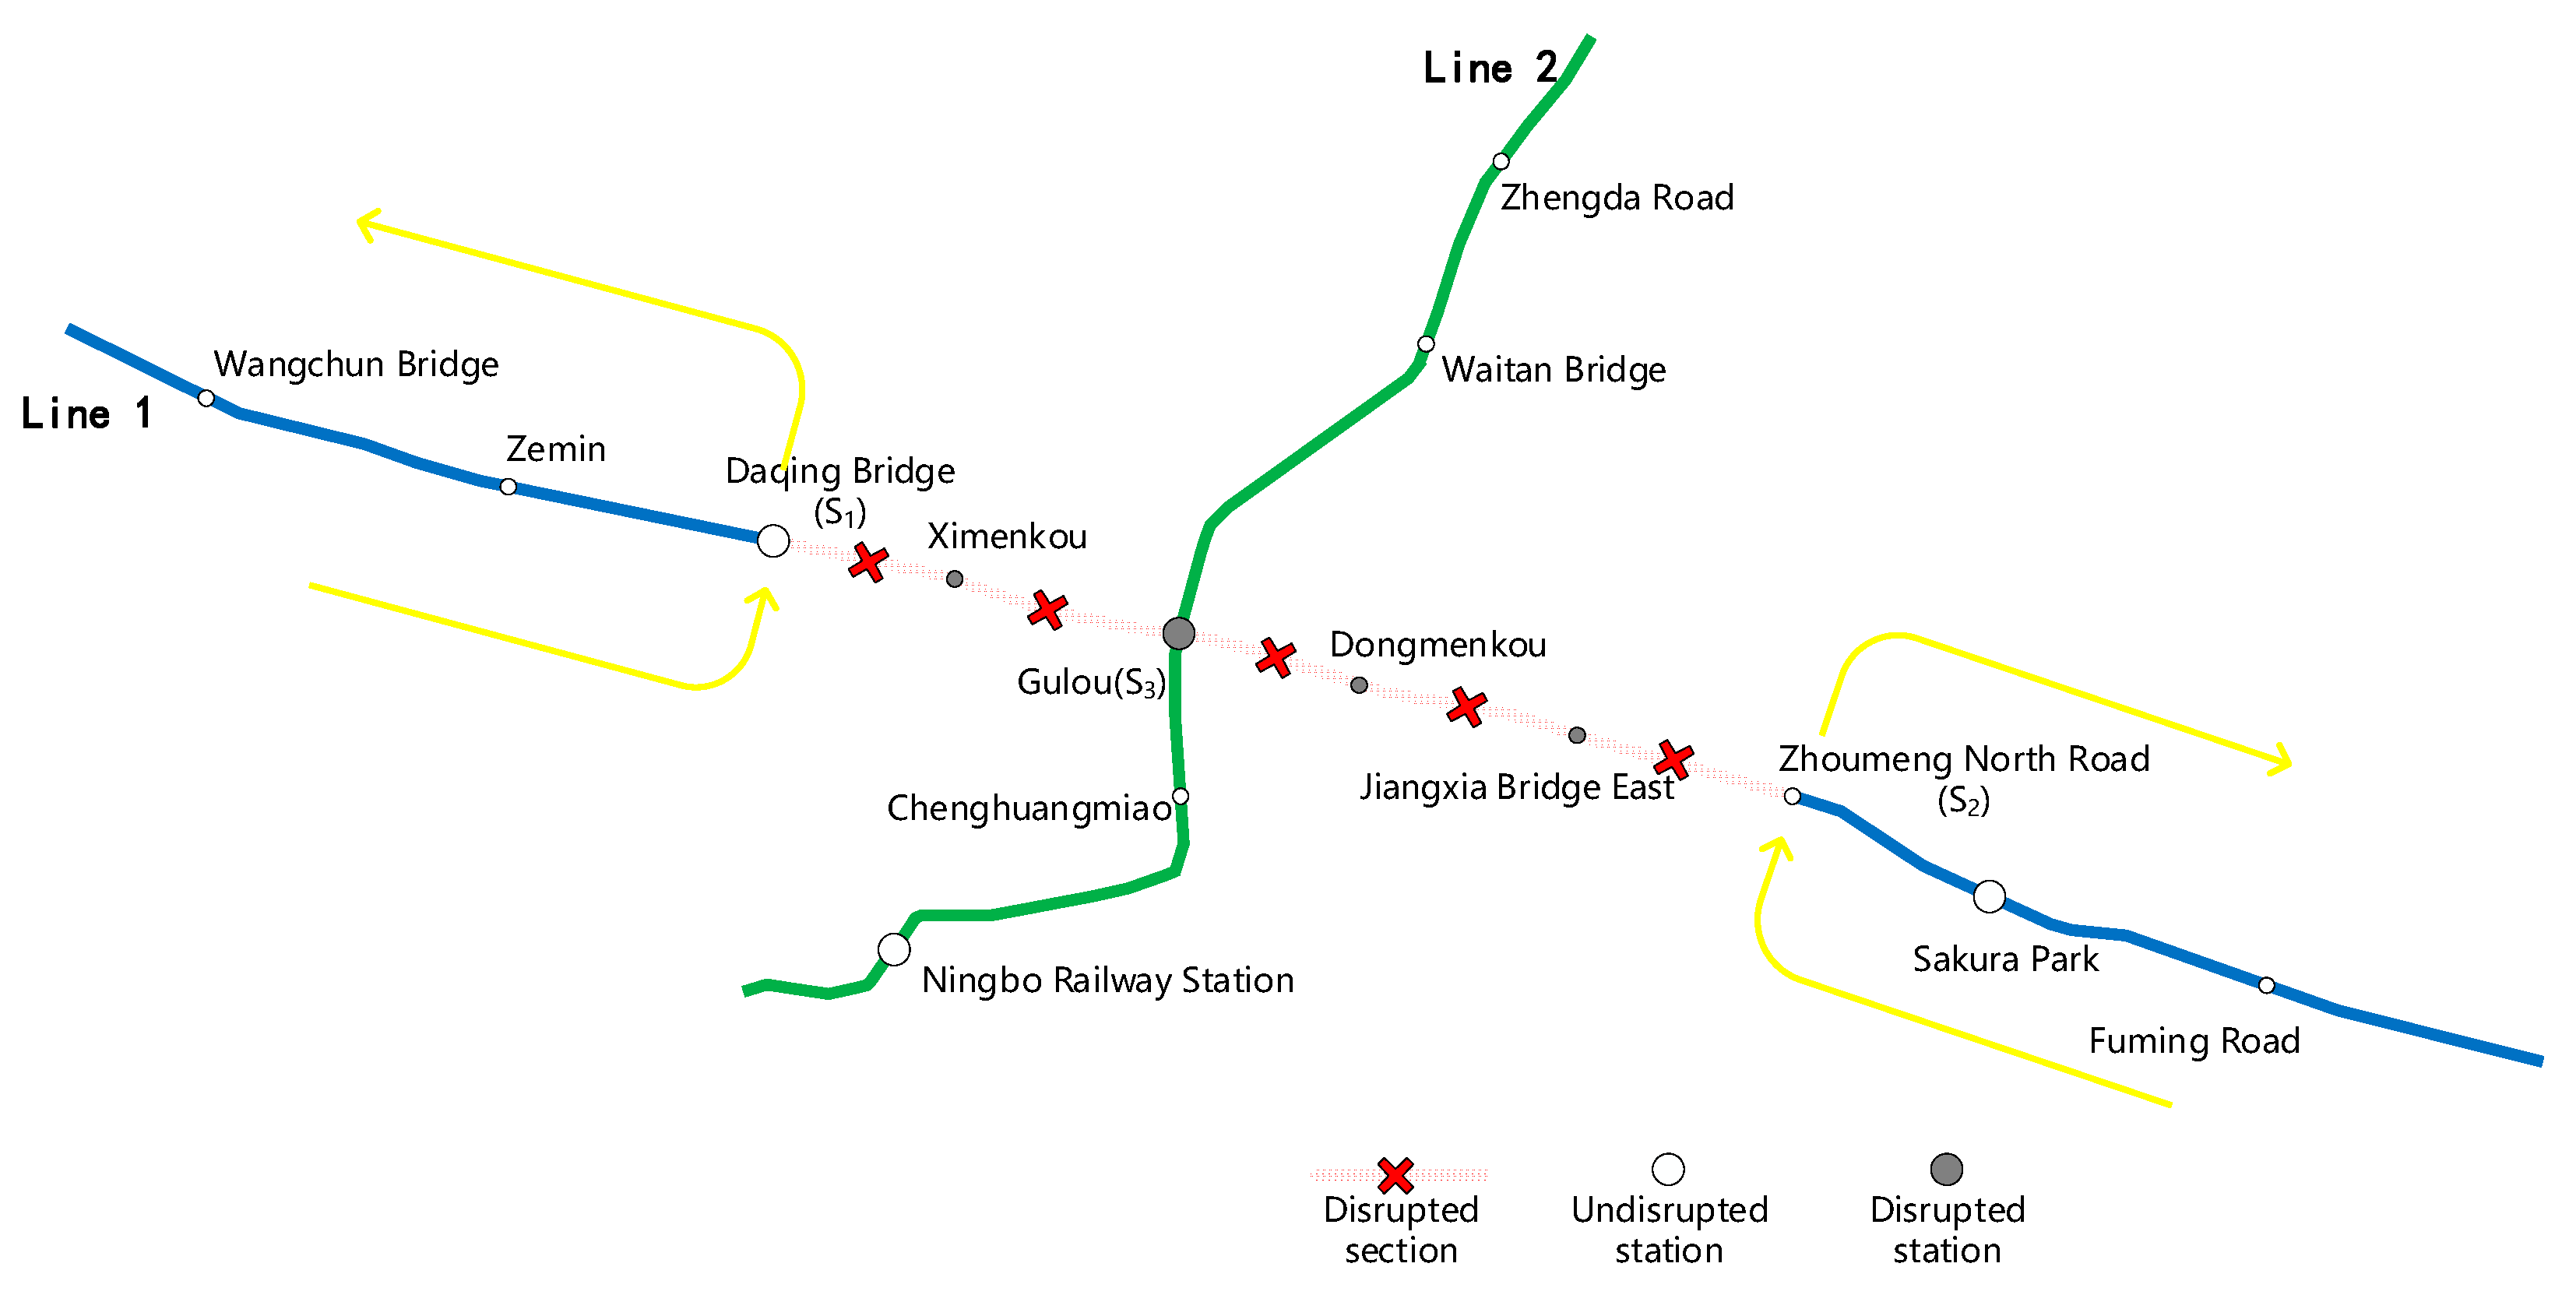
4. Case Study
4.1. Case Setup
4.2. Results Analysis
4.3. GA Perfomance
4.4. Sensitivity Analysis
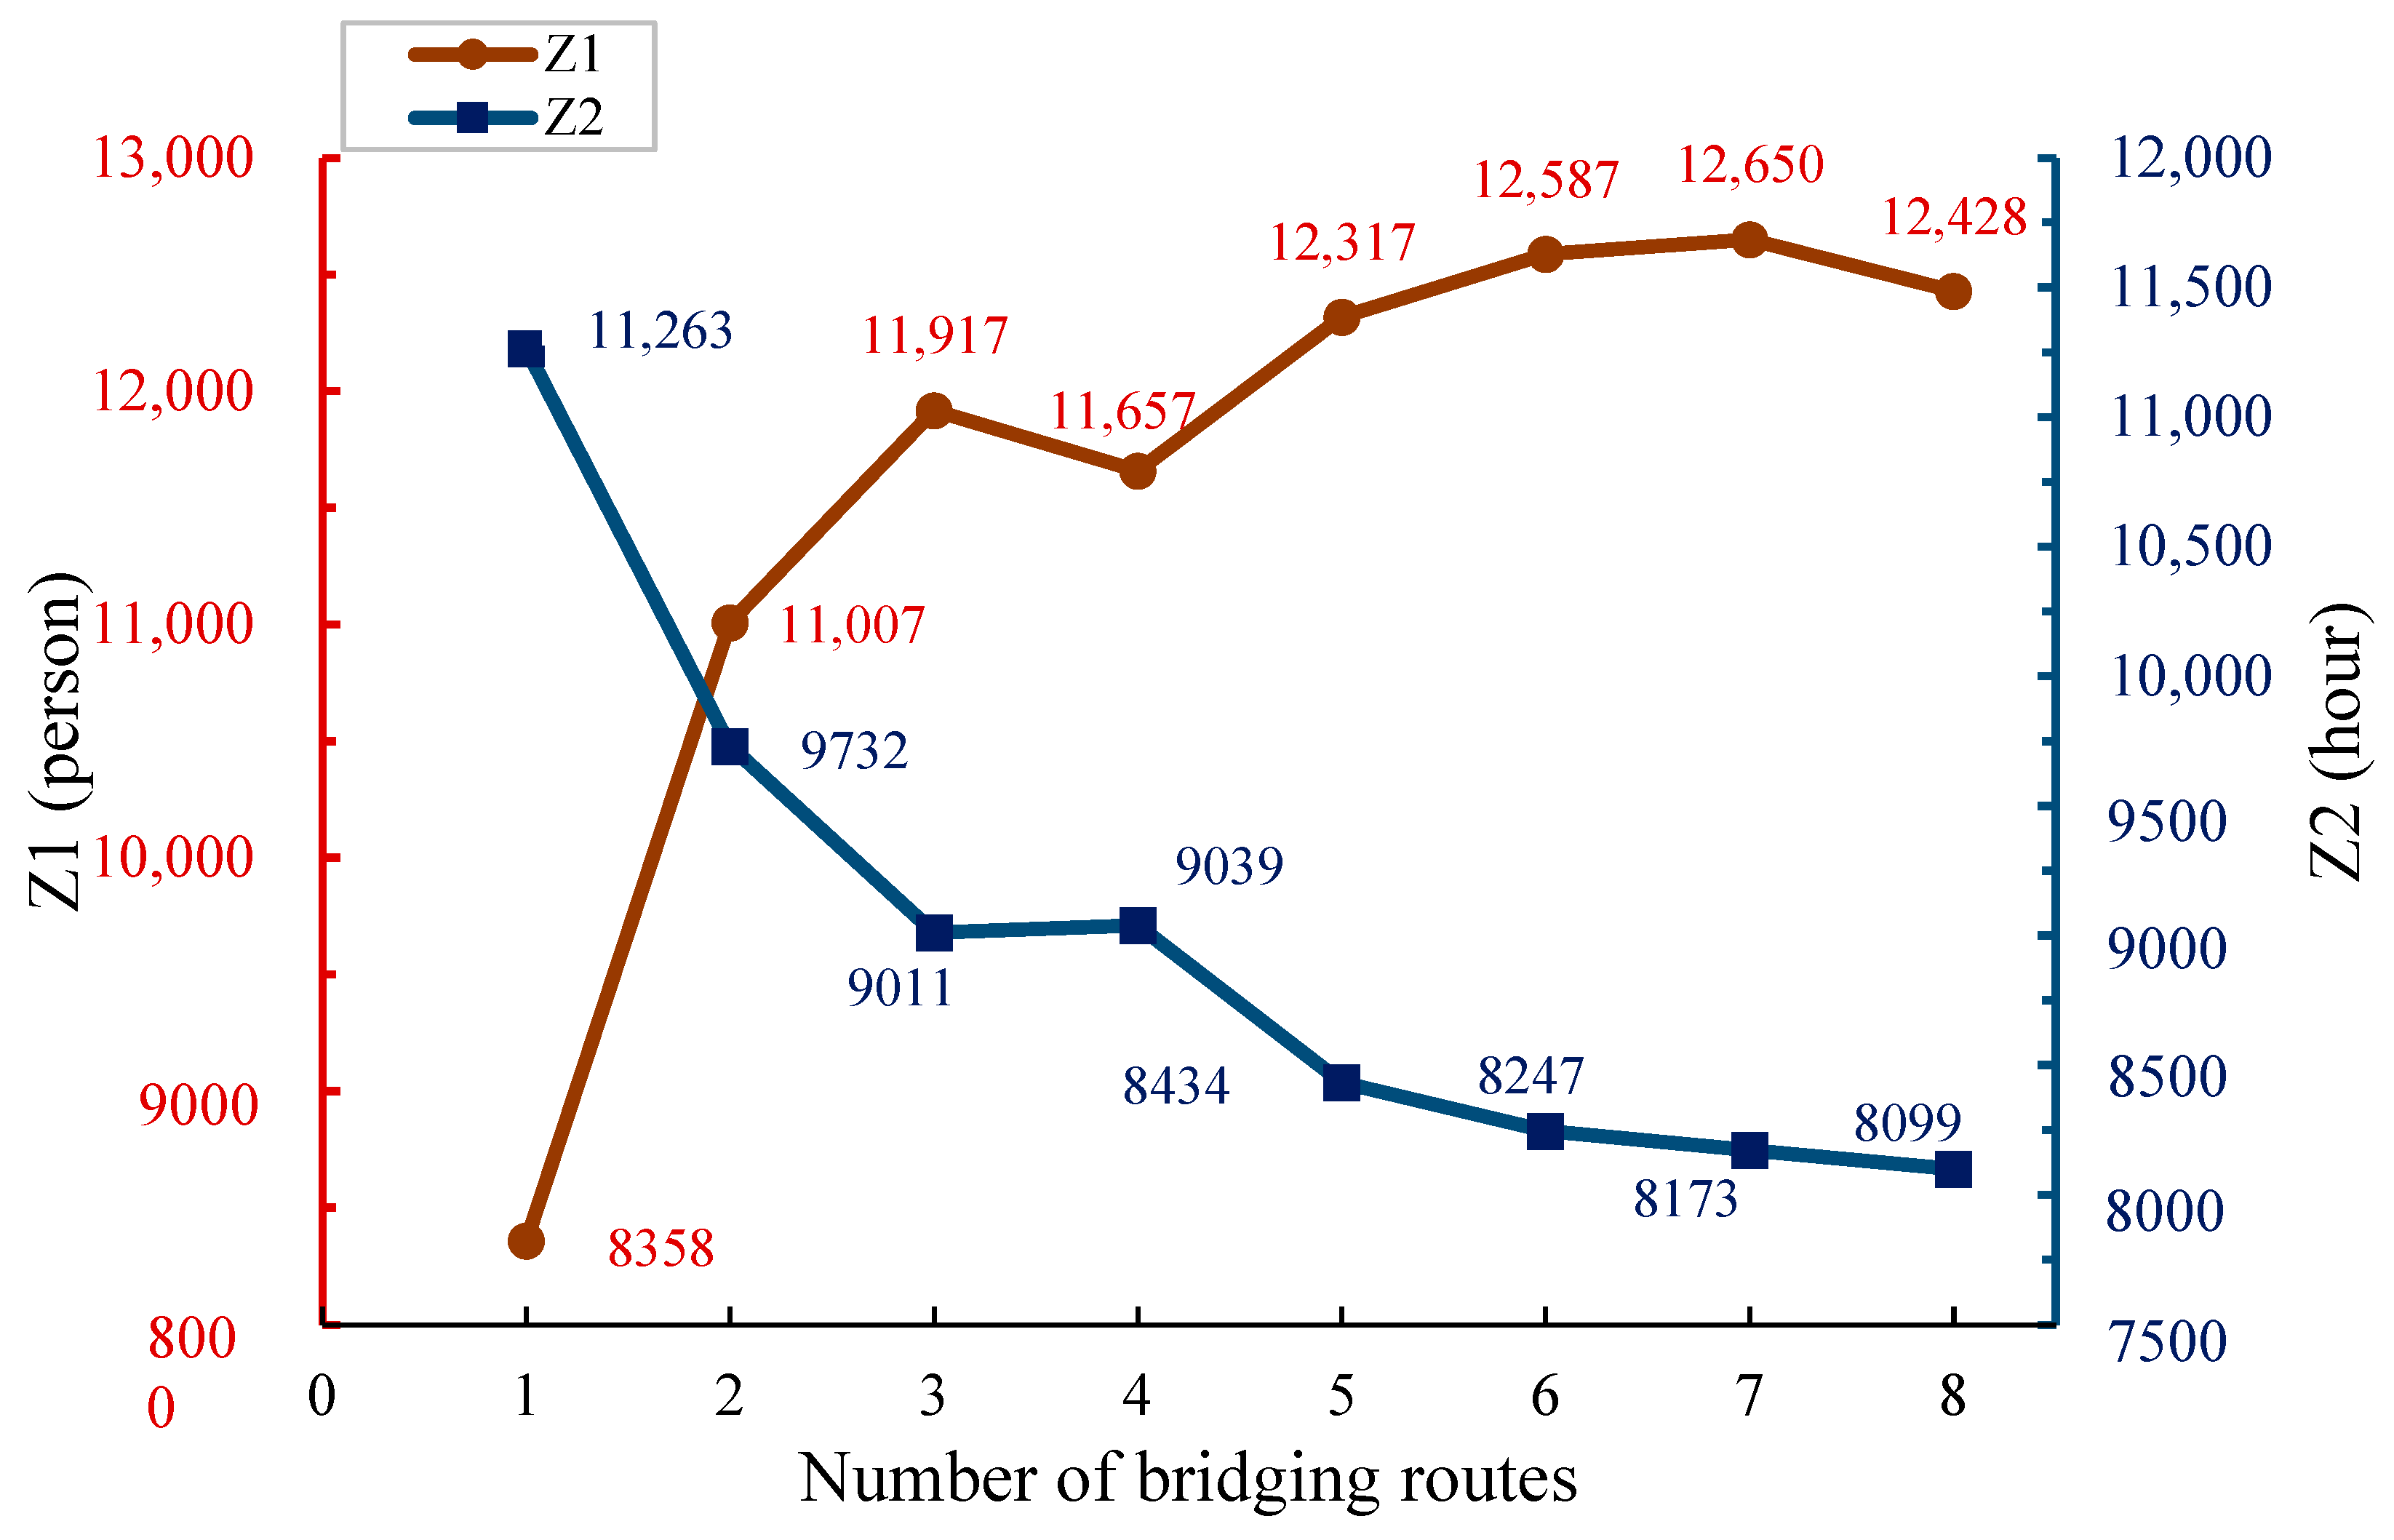
4.4.1. Number of Bridging Routes
4.4.2. Bus Fleet Size
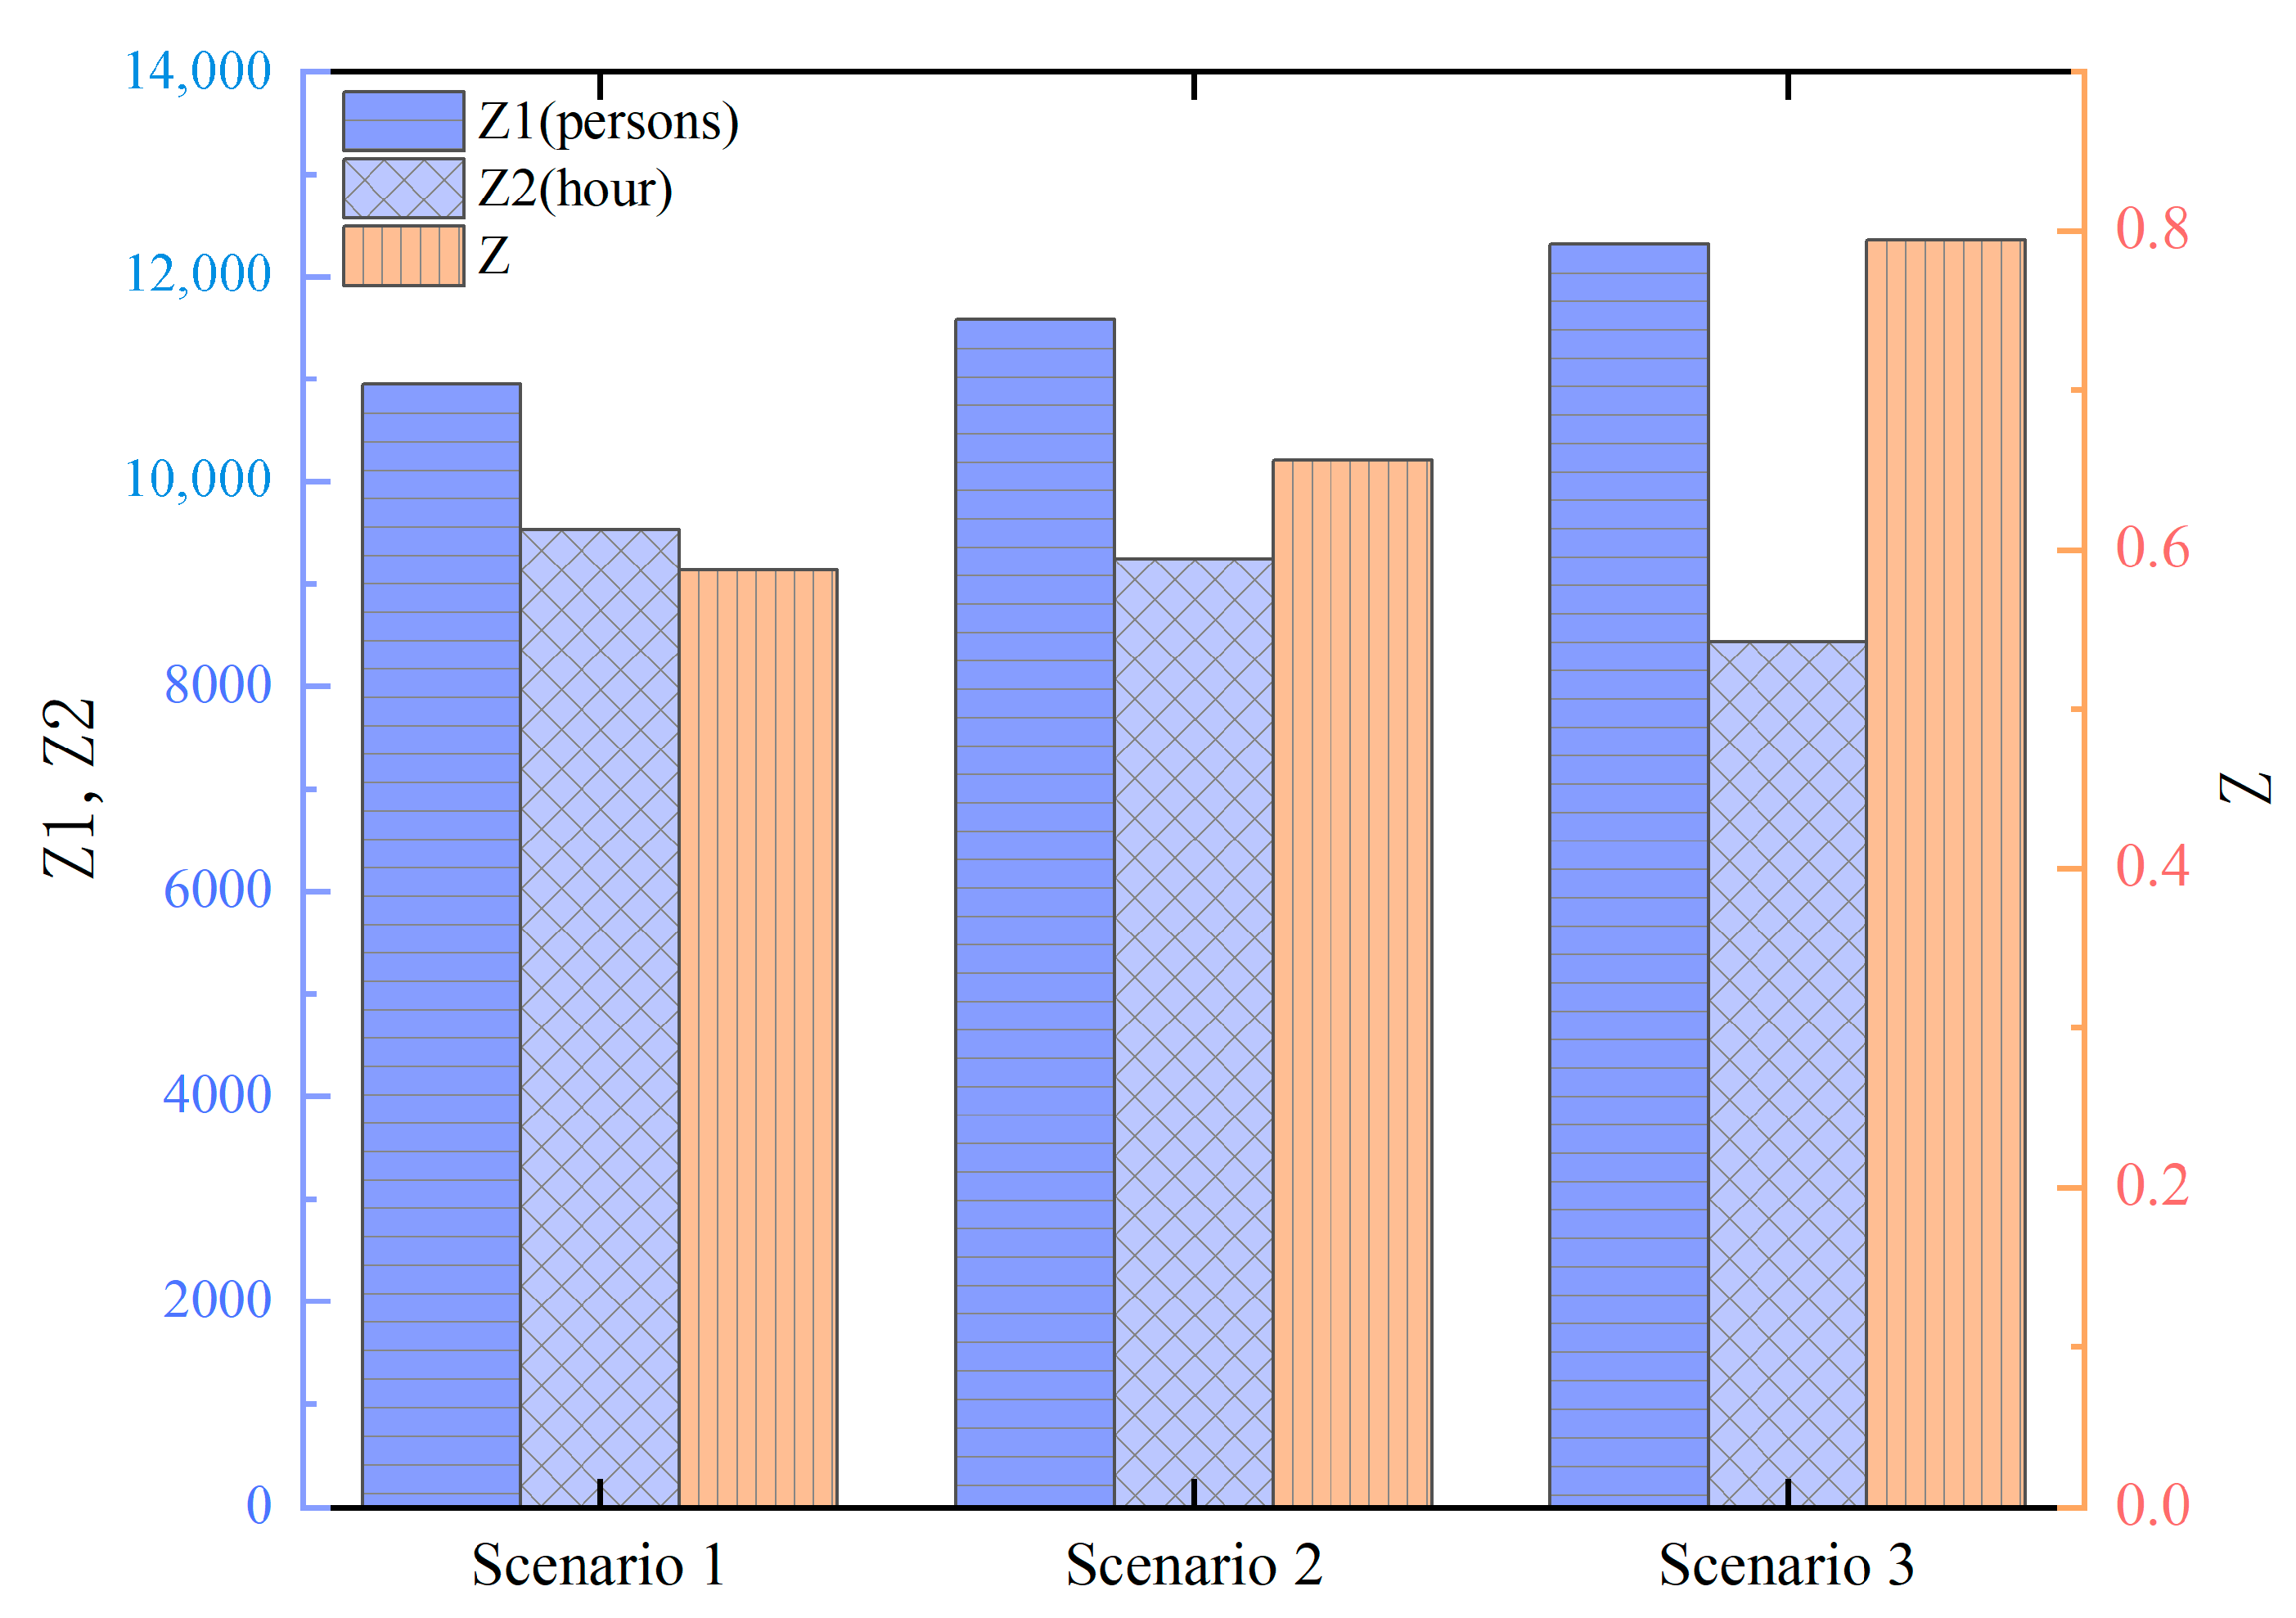
4.4.3. Weight Coefficients
5. Conclusions
Author Contributions
Funding
Institutional Review Board Statement
Informed Consent Statement
Data Availability Statement
Conflicts of Interest
References
- Cadarso, L.; Marín, Á.; Maróti, G. Recovery of Disruptions in Rapid Transit Networks. Transp. Res. Part E Logist. Transp. Rev. 2013, 53, 15–33. [Google Scholar] [CrossRef]
- Wang, Y.; Yan, X.; Zhou, Y. A Straightforward Method for Shuttle-Bus Line Design under Urban Rail Transit Emergencies. J. Transp. Saf. Secur. 2021, 13, 1093–1113. [Google Scholar] [CrossRef]
- Duan, Z.; Lei, Z.; Zhang, M.; Li, W.; Fang, J.; Li, J. Understanding Evacuation and Impact of a Metro Collision on Ridership Using Large-scale Mobile Phone Data. IET Intell. Transp. Syst. 2017, 11, 511–520. [Google Scholar] [CrossRef]
- Gu, W.; Yu, J.; Ji, Y.; Zheng, Y.; Zhang, H.M. Plan-Based Flexible Bus Bridging Operation Strategy. Transp. Res. Part C Emerg. Technol. 2018, 91, 209–229. [Google Scholar] [CrossRef]
- Liang, J.; Wu, J.; Qu, Y.; Yin, H.; Qu, X.; Gao, Z. Robust Bus Bridging Service Design under Rail Transit System Disruptions. Transp. Res. Part E Logist. Transp. Rev. 2019, 132, 97–116. [Google Scholar] [CrossRef]
- Pender, B.; Currie, G.; Delbosc, A.; Shiwakoti, N. Disruption Recovery in Passenger Railways. Transp. Res. Rec. J. Transp. Res. Board 2013, 2353, 22–32. [Google Scholar] [CrossRef]
- Kepaptsoglou, K.; Karlaftis, M.G. The Bus Bridging Problem in Metro Operations: Conceptual Framework, Models and Algorithms. Public Transp. 2009, 1, 275–297. [Google Scholar] [CrossRef]
- Jin, J.G.; Teo, K.M.; Odoni, A.R. Optimizing Bus Bridging Services in Response to Disruptions of Urban Transit Rail Networks. Transp. Sci. 2016, 50, 790–804. [Google Scholar] [CrossRef]
- Deng, Y.; Ru, X.; Dou, Z.; Liang, G. Design of Bus Bridging Routes in Response to Disruption of Urban Rail Transit. Sustainability 2018, 10, 4427. [Google Scholar] [CrossRef]
- Luo, C.; Xu, L. Railway Disruption Management: Designing Bus Bridging Services under Uncertainty. Comput. Oper. Res. 2021, 131, 105284. [Google Scholar] [CrossRef]
- Feng, Y.; Ceder, A.; Zhang, S.; Cao, Z. Bus Routing Fine-Tuning for Integrated Network-Based Demand and Bus Bridging for a Disrupted Railway System. Expert Syst. Appl. 2024, 242, 122825. [Google Scholar] [CrossRef]
- Dou, X.; Wang, H.; Meng, Q. Parallel Shuttle Bus Service Design for Planned Mass Rapid Transit Shutdown: The Singapore Experience. Transp. Res. Part C Emerg. Technol. 2019, 108, 340–356. [Google Scholar] [CrossRef]
- Hu, H.; Gao, Y.; Yu, J.; Liu, Z.; Li, X. Planning Bus Bridging Evacuation during Rail Transit Operation Disruption. J. Urban Plan. Dev. 2016, 142, 04016015. [Google Scholar] [CrossRef]
- Li, X.; Liao, J.; Wang, T.; Lu, L. Integrated Optimization of Bus Bridging Route Design and Bus Resource Allocation in Response to Metro Service Disruptions. J. Transp. Eng. Part A Syst. 2022, 148, 04022050. [Google Scholar] [CrossRef]
- Zhen, L.; Du, X.; Li, H.; Wu, Z. A Stochastic Programming Model for Designing Bus Bridging Services under Metro Disruptions. Transp. Lett. 2024, 1–16. [Google Scholar] [CrossRef]
- van der Hurk, E.; Koutsopoulos, H.N.; Wilson, N.; Kroon, L.G.; Maróti, G. Shuttle Planning for Link Closures in Urban Public Transport Networks. Transp. Sci. 2016, 50, 947–965. [Google Scholar] [CrossRef]
- Chen, J.; Du, B.; Hu, H.; Yin, Y.; Peng, Q. Urban Rail Transit Disruption Management Based on Passenger Guidance and Extended Bus Bridging Service Considering Uncertain Bus Running Time. Expert Syst. Appl. 2024, 249, 123659. [Google Scholar] [CrossRef]
- Yin, H.; Wu, J.; Sun, H.; Qu, Y.; Yang, X.; Wang, B. Optimal Bus-Bridging Service under a Metro Station Disruption. J. Adv. Transp. 2018, 2018, 2758652. [Google Scholar] [CrossRef]
- Jin, J.G.; Tang, L.C.; Sun, L.; Lee, D.-H. Enhancing Metro Network Resilience via Localized Integration with Bus Services. Transp. Res. Part E Logist. Transp. Rev. 2014, 63, 17–30. [Google Scholar] [CrossRef]
- Pender, B.; Currie, G.; Delbosc, A.; Shiwakoti, N. Improving Bus Bridging Responses via Satellite Bus Reserve Locations. J. Transp. Geogr. 2014, 34, 202–210. [Google Scholar] [CrossRef]
- Wang, Y.; Guo, J.; Currie, G.; Ceder, A.; Dong, W.; Pender, B. Bus Bridging Disruption in Rail Services With Frustrated and Impatient Passengers. IEEE Trans. Intell. Transp. Syst. 2014, 15, 2014–2023. [Google Scholar] [CrossRef]
- Zhang, S.; Lo, H.K. Metro Disruption Management: Optimal Initiation Time of Substitute Bus Services under Uncertain System Recovery Time. Transp. Res. Part C Emerg. Technol. 2018, 97, 409–427. [Google Scholar] [CrossRef]
- Zhang, S.; Lo, H.K. Metro Disruption Management: Contracting Substitute Bus Service under Uncertain System Recovery Time. Transp. Res. Part C Emerg. Technol. 2020, 110, 98–122. [Google Scholar] [CrossRef]
- Zhu, Y.; Jin, J.G.; Wang, H. Path-Choice-Constrained Bus Bridging Design under Urban Rail Transit Disruptions. Transp. Res. Part E Logist. Transp. Rev. 2024, 188, 103637. [Google Scholar] [CrossRef]
- Wang, Y.; Zhou, Y.; Yang, H.; Yan, X. Integrated Optimization of Bus Bridging Service Design and Passenger Assignment in Response to Urban Rail Transit Disruptions. Transp. Res. Part C Emerg. Technol. 2023, 150, 104098. [Google Scholar] [CrossRef]
- Zheng, S.; Liu, Y.; Lin, Y.; Wang, Q.; Yang, H.; Chen, B. Bridging Strategy for the Disruption of Metro Considering the Reliability of Transportation System: Metro and Conventional Bus Network. Reliab. Eng. Syst. Saf. 2022, 225, 108585. [Google Scholar] [CrossRef]


| Publications | Decision Variables | Consider Passenger Reneging Behavior | Consider Transfer Demand | Objective(s) | Solution Algorithms |
|---|---|---|---|---|---|
| Kepaptsoglou and Karlaftis [7] | Route design and vehicle deployment | No | No | Maximize passenger welfare | Genetic algorithm |
| Jin et al. [8] | Route selection and vehicle deployment | No | Yes | Minimize the total increase in travel time and the number of unsatisfied passengers | Column generation procedure |
| Luo and Xu [10] | Route selection and vehicle deployment | No | No | Minimize the expected unsatisfied demand | Sample average approximation |
| Dou et al. [12] | Route design and vehicle deployment | No | No | Minimize passenger inconvenience | A decomposition method |
| Hu et al. [13] | Route design and vehicle deployment | No | No | Minimize the evacuation time | A customized genetic algorithm |
| Zhen et al. [15] | Route design and vehicle deployment | No | No | Minimize the unsatisfied passenger demand | Tabu search |
| Chen et al. [17] | Route design and vehicle deployment | No | Yes | Minimize passenger travel cost and bus running cost | A dynamic decision framework |
| Zhu et al. [24] | Route selection and vehicle deployment | No | Yes | Minimize the passenger travel time and unsatisfied demand | A variable neighborhood search algorithm |
| This paper | Route design and vehicle deployment | Yes | Yes | Maximize the total number of served passengers and minimize waiting times | A two-stage genetic algorithm with multi-agent simulation |
| Indices | Definition |
|---|---|
| Sets | |
| R | Set of candidate bus bridging routes, |
| Set of parallel bus bridging routes, and | |
| Set of non-parallel bus bridging routes, and | |
| Set of bridging stops, | |
| Set of bridging stops in route r, and | |
| Set of candidate schemes for route selection and bus resource allocation, | |
| Parameters and variables | |
| The duration of the disruption | |
| The maximum waiting time passengers can afford | |
| The standard route, | |
| The travel time from depot to the originating node for the bridging buses on route r | |
| , | The travel time between station and station s of the upstream/downstream of route r |
| , | The dwell time at station s of the jth roundtrip of the ith bus on the upward/downward of route r in bridging scheme x |
| The time required for the ith bus to make the jth roundtrip on route r in scheme x | |
| The bus capacity | |
| The bus load factor | |
| The bus headway | |
| The total number of bridging bus resources | |
| The capacity of station s | |
| The total number of roundtrips made by the ith bus on route r in scheme x | |
| The maximum number of routes included in a bridging scheme | |
| The time required for turning around | |
| The number of passengers served by the jth roundtrip of the ith bridging bus on route r in scheme x | |
| The number of passengers in the ith bridging bus for the jth roundtrip at station s on route r in scheme x | |
| The number of buses arriving simultaneously at a bridging stop s in scheme x | |
| Decision variables | |
| A binary variable indicating whether route is included in scheme , if so , otherwise | |
| The number of bus resources allocated to route in scheme |
| Station Name | Serial Number | Station Name | Serial Number |
|---|---|---|---|
| Wangchun Bridge | 1 | Zhoumeng North Road | 8 |
| Zemin | 2 | Sakura Park | 9 |
| Daqing Bridge | 3 | Fuming Road | 10 |
| Ximenkou | 4 | Ningbo Railway Station | 11 |
| Gulou | 5 | Chenghuangmiao | 12 |
| Dongmenkou | 6 | Waitan Bridge | 13 |
| Jiangxia Bridge East | 7 | Zhengda Road | 14 |
| Parameters | Assigned Values | Parameters | Assigned Values |
|---|---|---|---|
| 100 | 1 h | ||
| 90% | 0.5 | ||
| 1 min | 0.5 | ||
| 3 | 2 | ||
| 60 | 60° |
| The Dwelling Stops of the Bus Bridging Routes | Number of Allocated Buses | |
|---|---|---|
| 2 | [3;4;5;6;7;8] | 31 |
| [3;12;8] | 29 | |
| 3 | [3;4;5;6;7;8] | 12 |
| [1;4;12;8] | 36 | |
| [3;5;9] | 12 | |
| 4 | [3;4;5;6;7;8] | 9 |
| [3;4;13;8] | 8 | |
| [2;7;8] | 24 | |
| [1;4;5] | 19 | |
| 5 | [3;4;5;6;7;8] | 4 |
| [3;4;5] | 17 | |
| [3;5;8] | 9 | |
| [5;6;7;10] | 26 | |
| [2;11;8] | 4 |
| Objectives | Standard Route | 2 Route | 3 Route | 4 Route | 5 Route |
|---|---|---|---|---|---|
| 8358 | 11,007 | 11,917 | 11,657 | 12,317 | |
| (h) | 11,262.92 | 9731.55 | 9010.65 | 9038.93 | 8433.77 |
| 0.2350 | 0.5659 | 0.7030 | 0.6851 | 0.7944 |
| Standard Route | 2 Route | 3 Route | 4 Route | 5 Route | |
|---|---|---|---|---|---|
| Number of passengers with | 2912 | 2254 | 2076 | 1847 | 1397 |
| Ratio | 18.55% | 14.36% | 13.23% | 11.77% | 8.90% |
Disclaimer/Publisher’s Note: The statements, opinions and data contained in all publications are solely those of the individual author(s) and contributor(s) and not of MDPI and/or the editor(s). MDPI and/or the editor(s) disclaim responsibility for any injury to people or property resulting from any ideas, methods, instructions or products referred to in the content. |
© 2024 by the authors. Licensee MDPI, Basel, Switzerland. This article is an open access article distributed under the terms and conditions of the Creative Commons Attribution (CC BY) license (https://creativecommons.org/licenses/by/4.0/).
Share and Cite
Zhang, Z.; Li, X.; Zhang, J.; Shi, Y. Optimizing Bus Bridging Service Considering Passenger Transfer and Reneging Behavior. Sustainability 2024, 16, 10710. https://doi.org/10.3390/su162310710
Zhang Z, Li X, Zhang J, Shi Y. Optimizing Bus Bridging Service Considering Passenger Transfer and Reneging Behavior. Sustainability. 2024; 16(23):10710. https://doi.org/10.3390/su162310710
Chicago/Turabian StyleZhang, Ziqi, Xuan Li, Jikang Zhang, and Yang Shi. 2024. "Optimizing Bus Bridging Service Considering Passenger Transfer and Reneging Behavior" Sustainability 16, no. 23: 10710. https://doi.org/10.3390/su162310710
APA StyleZhang, Z., Li, X., Zhang, J., & Shi, Y. (2024). Optimizing Bus Bridging Service Considering Passenger Transfer and Reneging Behavior. Sustainability, 16(23), 10710. https://doi.org/10.3390/su162310710