Abstract
The world’s 300 largest pension funds manage assets for more than USD 21 trillion. A strict orientation to environmental, social, and good governance (ESG) in the investment portfolio of pension funds can play a key role in triggering the economy toward a sustainable transition. Can responsible pension plans be an attractive investment opportunity for young people? Since the performance of pension funds depends on the demographic characteristics of investors, other than the financial results of investment portfolios, this study aimed to test the convenience of ESG-oriented pension plans for young contributors aged 20–29 with different risk propensities and attitudes towards sustainability. The analysis was started using accurate data provided by an Italian pension fund, observed from 2012 to 2022. The methods applied were a Monte Carlo simulation of the individual actuarial balances, the expected utility, and the willingness to pay. The results show that ESG-oriented pension funds are convenient for young people who invest in riskier lines. Still, it is sufficient for a light green preference to persuade young contributors to invest in ESG-oriented funds and balanced lines. The results of the study can support pension fund managers in defining and offering appropriate ESG lines suitable for younger investors.
1. Introduction
“One-third of investors below 41 years of age claim to be willing to lose between 6 and 10 per cent of their retirement savings to support environmental, social and governance (ESG) causes. (…) Older investors do not want to lose anything” [1].
Starting from this statement, our study aims to verify whether young investors have to lose money in the case of their participation in an ESG-oriented pension plan or whether these products represent a potential win–win solution in which a positive social and environmental impact is combined with satisfactory financial performance for investors.
Younger investors often face unique challenges when engaging with ESG investments. These include limited financial resources, concerns about potential trade-offs between ethical investments and economic returns [2,3,4,5], and a lack of tailored ESG investment products that align with their long-term goals and risk profiles. Additionally, generational shifts in priorities—such as an increased focus on sustainability—contrast with the often traditional frameworks of financial products, creating a gap between demand and supply for ESG-oriented solutions.
This study is grounded in the principles of ESG investing [6], which aims to combine financial returns with positive societal and environmental outcomes. By examining pension funds through these lenses, this research explores whether ESG-oriented strategies can align with the financial and sustainability goals of young investors while also considering intergenerational dynamics as a potential area for future exploration [7,8,9].
The role of institutional investors, including pension funds, in supporting ecological and social transition is fundamental, as is confirmed by the proliferation, especially in Europe, of legislation regulating and boosting sustainable finance. (See, for example, the Corporate Sustainability Reporting Directive, the Sustainable Finance Disclosure Regulation, the EU Taxonomy Regulation, as well as some sustainability-related amendments to the MIFID II framework. Respectively, these include Directive 2022/2464/EU, Regulation EU 2019/2088 and Regulation EU 2020/852 of the European Parliament and of the Council, Commission Delegated Regulation 2021/1253, and Commission Delegated Directive 2021/1269) [10,11]. The role of private finance is crucial since sustainable transition requires enormous investments in sustainable development-oriented projects that cannot be fully covered by public funding. Therefore, it becomes decisive to stimulate ESG investments by institutional investors, who move and allocate large amounts of capital (UNPRI, 2021) [12].
Among institutional investors, pension funds’ characteristics make them particularly suitable for sustainable and responsible investments (SRIs), in all their forms [13,14]. In the assessment of securities, SRI integrates financial analysis with ESG analysis to create value for the investor and the society as a whole over the medium- to long-term [15]. In this sense, supplementary pension schemes are characterized by a fiduciary mandatory to reach an efficient risk–return combination over a long-time horizon.
Can a more sustainable investment strategy for pension plans benefit both the environment and the community while also providing advantages for individual subscribers? What are the potential financial outcomes of ESG-oriented pension plans for younger investors compared to non-ESG portfolios? Is the financial appeal of ESG-oriented pension plans influenced by the risk tolerance of younger contributors and their attitude toward sustainability?
This paper aims to answer these research questions by (i) estimating if a pension fund, with the different investment lines in which it is split, can maintain an actuarial balance when securities are selected by applying ESG criteria, starting from a conventional, non-ESG-oriented portfolio; (ii) computing the expected utility of each investment line at the retirement age for different degrees of investors’ risk aversion; and (iii) computing the green sensibility of investors necessary to switch towards more ESG-oriented lines and also when it is not convenient from a strictly financial point of view. With a focus on younger investors (aged 20–29) and on defined contribution (DC) pension funds, this analysis highlights (i) the probability that a more ESG-oriented investment provides a higher retirement benefit, (ii) the extent to which a more ESG-oriented investment provides utility for different investors’ risk propensity profiles, and (iii) the extent to which green sensibility is relevant to allow a switch towards higher-ranked ESG lines.
The main added value of the paper is (i) a long-term comparison of the individual actuarial value of an investment in conventional and ESG-oriented pension funds, (ii) the analysis of the actuarial convenience for young people to invest in ESG-oriented pension funds, (iii) the analysis of the role of risk aversion in moderating the individual preference towards ESG-oriented pension funds, and (iv) the study of the green preference necessary to persuade people to prefer ESG-oriented pension funds.
The key findings of this study suggest that, for younger people, (i) pension funds with a stronger ESG orientation are more likely to have a higher risk-adjusted return than conventional pension funds when the asset allocation is more focused on equities, (ii) a slight green preference is sufficient to persuade younger people toward ESG-oriented plans, which is also the case for investment lines with a balanced asset allocation, and (iii) gender differences are neglectable.
The introduction of new regulatory requirements on sustainable finance, as well as a growing attention to sustainability by savers [16,17,18], push pension funds to incorporate an ESG approach in their investment processes. However, the uptake of pension funds that specialize in green and sustainable investments is still limited in practice. Overall, this study confirms the possibility for different lines of an open-ended pension fund to achieve individual actuarial balance by performing portfolio selection and management based on ESG factors. Remember that open-ended pension funds are pension funds that banks, insurance companies, asset management companies and investment companies promote. They support both occupational and personal pension plans. They are not a legal personality; nonetheless, their assets must be separated from those of the financial company managing them. These funds typically feature multiple investment lines, allowing contributors to select the investment strategy that best suits their risk preferences and financial goals (definition by the Italian Supervisory Authority on pension plans (COVIP).
This work aims to support the investment choices of young savers towards ESG pension schemes while also providing confirmation to policymakers on the opportunity of incentivizing such products, which can generate benefits for both individual savers and for the environment and society as a whole. Lastly, this study is useful for pension fund asset managers to identify the investment lines most consistent with the demographic characteristics, risk appetite, and propensity to the sustainable investments of young savers.
This paper contributes to the international literature focused on the differences in terms of performance and risk between responsible investments and conventional ones [19,20,21,22,23,24,25,26,27,28]. This literature is mainly focused on mutual funds [26,27,29], while our study is included in the under-developed literature which compares conventional and ESG-oriented pension funds [30,31,32]. Concerning the literature based on mutual funds, this study deepens the analysis of a financial product in which it is necessary to find both a financial balance and an actuarial balance by considering the demographic characteristics of the contributors. As a consequence, the analysis developed in this study combines, differently from the literature on mutual funds, both the financial and the demographic projections about financial markets and investors, by verifying under which conditions the individual actuarial balance of a pension fund’s investment lines can be reached. In addition, this study contributes to the literature on the performance of SRI by investigating a financial product regulated by partially different legislation compared to mutual funds.
The paper structure includes a Literature Review, a Methodological section counting the projection estimation technique and the indicators used in the analysis, a Results section with a debate about the main findings, and a Conclusion section with final considerations and implications.
2. Literature Review
2.1. Pension Funds and Sustainability
According to Eurosif, SRI integrates ESG factors in the research, selection, and management processes of securities within the investment portfolio. It combines financial analysis with an evaluation of the issuers’ ESG factors and uses engagement activities to better capture long-term returns for investors and benefit society by orienting business behaviour toward sustainability [15].
SRI fits well with the characteristics and mission of pension funds. First, projects oriented to sustainability are naturally related to long-term investments, and accordingly, an important perspective comes from the analysis of long-term institutional investors such as pension funds [33]. Pension funds have long-term liabilities, so they need to take a long-term view, also considering the fiduciary mandate or duty to secure long-term financial returns to their beneficiaries. To meet their mandate, managers need to compound risks and returns on a long-term horizon, which cannot avoid an analysis of ESG issues. Indeed, there is a high consensus in the international literature that ESG factors positively influence (or at least do not produce a negative impact on) investment financial risk-adjusted returns through their effects on corporate financial performance and through the mitigation of ESG risks [34,35,36]. Moreover, the application of ESG principles makes companies less sensitive to reputational risk and operational risk, acting as a shock-absorbing factor that reduces the negative impact of crisis and market contractions [37,38]. The lack of consideration of ESG variables makes performance more vulnerable, especially during times of economic downturn, increasing volatility [39]. In brief, over the long term, ESG issues have a real and quantifiable financial impact [40].
Consequently, pension funds should focus on the benefits of ESG investing for financial returns and risk management [41]. Not considering ESG factors can be a breach of fiduciary duty [42].
The same regulations governing pension funds require them to pay greater attention to ESG criteria in selecting and managing securities and higher disclosure regarding sustainability. In this field, the EU’s IORP Directive (DIRECTIVE (EU) 2016/2341 OF THE EUROPEAN PARLIAMENT AND OF THE COUNCIL of 14 December 2016 on the activities and supervision of institutions for occupational retirement provision - IORPs)) has the merit of explicitly referencing ESG indicators within the discussion of prudential standards. The Directive recognizes that, taking into account ESG risks in investment decisions, IORPs may consider the potential long-term effect of the investments on ESG performance to favour sustainability.
Lastly, savers increasingly demand sustainable and responsible investing products [43,44,45,46,47]. Contributors may prefer high-ranked ESG pension funds for their long-term positive externality or protection from adverse social and environmental effects [13,48].
In summary, ESG investing can be an effective solution for pension funds due to strategic, commercial, risk management, and compliance reasons.
In 2021, the size of pension funds in the twenty-two major retirement countries (these are: Australia, Brazil, Canada, Chile, China, Finland, France, Germany, Hong Kong, India, Ireland, Italy, Japan, Malaysia, Mexico, Netherlands, South Africa, South Korea, Spain, Switzerland, UK, USA) reached 76% of their GDP on average and the world’s 300 largest pension funds managed assets for more than USD 21 trillion (Watson, 2022) [49]. This relevant size entails both a responsibility and an opportunity for these institutional investors, given the potential impact of their investments on our economies, societies, and, consequently, our path toward a sustainable transition [50,51].
By analyzing the market data, we can see that pension funds increasingly incorporate an ESG approach as an integral part of their investment process and provide a strong impetus for the development of ESG investing [12]. In this study, we test, for our sample, the effects of this progressive switch from conventional to ESG-oriented plans.
2.2. Young Savers and Sustainability
The international literature verified that investors generally show a positive willingness to pay for SRI by studying the investment flows and savers’ demand for financial products [52,53,54,55,56].
Nevertheless, several authors found differences in the attitudes and preferences for ESG investments according to the savers’ age [57,58]. Since concern about climate change grows widely among younger investors, also the willingness for ESG financial products is significantly higher for younger savers compared to older ones [59]. About one-third of millennials make investments that include ESG issues frequently or, solely, compared to around 2% of baby boomers [60]. In addition, research by TD Ameritrade shows that almost half of millennials would switch their savings to a different investment firm to obtain broader access to SRI compared to a quarter of baby boomers. Also, brand love and loyalty were found to be more strongly affected by ESG among young people than among older age groups [61].
Comparing generations, some authors also found different motivations driving young people toward sustainable investments than older savers. The former usually shows ethical reasons as the primary motivation for SRI [57]. For older people, these investments become substantial only when they expect positive excess returns.
In general, there is no lack of mixed results about the views of ESG by different generations [62,63]. Differently from other authors, Shauki (2011) demonstrated that sustainability concerns are higher among older people than among younger ones [64].
With specific reference to supplementary retirement savings, the “2022 Survey of Investors, Retirement Savings, and ESG” published by the Corporate Governance Research Initiative at Stanford University shows that investors’ attitudes vary widely across age groups. Young investors ask fund managers to advocate for environmental and social causes, while older investors want them to stick with generating financial returns. Young people appear to be potentially the investors most interested in a sustainable investment approach: a young age typically combines with financial portfolios characterized by a greater weight of equity assets (according to the Financial Life-Cycle Theory (Modigliani and Brumberg, 1954 [1]) and a marked orientation toward sustainable investments. According to the authors, young investors, comprising millennial and Gen Z investors, express deep concern for social issues such as diversity, income inequality, and labour conditions, as well as environmental considerations, including carbon emissions reduction, renewables, and product sustainability. Nevertheless, young people’s choices are not homogeneous, and they are affected by the amount of their financial assets. The research shows that the wealthiest younger investors expressed the most support for ESG, while this preference waned among those with less savings [65]. This may be motivated by the possibility that investors consider ESG investments to be characterized by ethical sacrifice. Less affluent investors may be less interested in ESG investments and are convinced that the increased focus on selecting and managing securities based on ESG criteria may result in a partial churn in risk-adjusted returns.
This study aims to contribute to this debate by verifying whether a higher orientation to ESG in selecting securities could, for younger members, also generate superior benefits in the long run compared to more traditional investments or, on the other hand, if it involves an ethical sacrifice.
According to the literature, a pension fund’s portfolio asset allocation appears to be correlated with the age of its participants [66]. We aim to verify whether the relevance given to ESG issues in the portfolio selection is another variable that has to be adjusted to the contributors’ age.
2.3. Logical Structure and Research Approach
The study wants to analyze if a more sustainable investment orientation for pension plans could be a win–win solution for the environment, the community, the subscribers, and particularly younger investors.
To achieve this goal, first, we estimated whether the pension fund, with different investment lines (guaranteed, balanced, and capitalized), can maintain an actuarial balance by considering ESG-oriented or non-ESG-oriented portfolios (Section 3.2).
To develop this analysis, we reconstruct the pension fund’s ESG lines, in which the equity components refer to benchmarks that contain only companies characterized by a high ESG score and estimate their probability distribution (Section 3.3).
We used the Anderson–Darling and Shapiro–Wilk tests to test their historical distribution. These tests are two powerful statistical tools for checking whether a family of distributions and, therefore, its parameters match or do not match with the Gaussian distribution. Since the results would present a shape-shifted aspect compared to the normal one, the skew-normal distribution was used to fit the observed data with the “normal-like” shape of the empirical distribution but with a lack of symmetry.
We ran a Monte Carlo simulation for each portfolio generated using these probability distributions for each investment line by considering different demographic scenarios according to the potential age and gender of the contributors (Section 3.4). According to the actuarial equivalent, when persons retire and start receiving their pension, the amount they receive each month is calculated to last for the rest of their lives. This is calculated by considering how long the contributors are expected to live and how much money they have saved. So, the actuarial equivalent is the amount of pension benefits paid out over the expected remaining lifetime of the person receiving it.
Since there is a consistent part of the literature regarding risk-taking and the relationship with demographic and, in general, socioeconomic components that show a positive attitude towards risky investment for young contributors, this paper develops an analysis of the financial convenience of ESG-oriented pension funds correlated with the risk propensity of young contributors and their attitude towards sustainability.
We computed the expected utility of each investment line at the retirement age for different degrees of investors’ risk aversion, and by modifying the utility function to consider this attitude, we computed the green sensibility of investors necessary to switch towards more ESG-oriented lines (Section 3.5 and Section 3.6). The Results follow in Section 4.
3. Methodology
3.1. Overview
This section introduces the data, indicators, and methods used in this study. The following sub-sections describe (i) the data of the investment lines analyzed, (ii) the estimation of the return rates’ probability distribution, (iii) the retirement benefits according to the rates of return estimated, (iv) the expected utility index, and (v) the green preference indifference index.
3.2. Data and Assumptions
We assumed a pension fund with three different investment lines: the guaranteed, the balanced, and the capitalized lines, with a different asset allocation and, consequently, a different level of financial risk. The guaranteed line prioritizes capital preservation and typically invests in low-risk assets such as government bonds, offering lower returns but ensuring minimal exposure to market volatility. The balanced line seeks a middle ground, combining equities and fixed-income securities to achieve moderate risk and returns. The capitalized line emphasizes higher growth potential by allocating a larger proportion of assets to equities, targeting higher returns but with increased risk exposure. We refer to a real open-ended pension fund offered in Italy to define the starting portfolio and the benchmarks.
The original benchmarks include the following indices:
The MSCI EMU Index (Morgan Stanley Capital International European Economic and Monetary Union Index) captures large and mid-cap companies across the EMU. The index covers approximately 85% of the free float-adjusted market capitalization of the EMU.
The MSCI Europe Index represents large and mid-cap companies across 15 Developed Markets countries in Europe. The index covers approximately 85% of the free float-adjusted market capitalization across the European Developed Markets equity universe.
The JP Morgan EMU GBI Index (Government Bond Index) includes government bonds and other fixed-income obligations issued by European countries that adhere to the EMU.
We assumed that the pension fund adopts a passive strategy and changes its investment portfolio based on the composition of benchmarks.
To test the effects of an increased ESG orientation for the portfolio, the benchmarks for the equity components of each line were changed from the original indices to the corresponding indices calculated by Morgan Stanley by considering only the so-called ESG leaders’ stocks. Thus, we built the ESG lines of the pension fund, in which the equity components referred to benchmarks that contained only companies characterized by a high ESG score. Specifically, the index MSCI EMU was replaced with the index MSCI EMU ESG leaders, keeping the same original weight within the benchmarks. In addition, the MSCI Europe Index was replaced in the ESG lines with the corresponding MSCI Europe Index ESG leaders. No substitutions were made for the index related to government securities. Replacing the two original indices with their corresponding ESG leader indices allowed us to build portfolios selected according to a sustainability criterion without adding assumptions about how individual securities are chosen.
Overall, our analysis refers to six lines: for each of the three main lines distinguished according to their asset allocation (guaranted line—Line 1, balanced line—Line 2, and capitalized line—Line 3), we considered two options, either with or without the application of the ESG selection to equities included in the investment portfolios. When the benchmarks included indices that referred just to ESG leaders, the original Lines 1, 2, and 3 were called Lines 1E, 2E, and 3E, respectively.
Table 1 shows the weight of the indices in the benchmarks for each line. The data were collected from the Bloomberg database from 1 January 2012 to 31 March 2022.

Table 1.
Investment lines’ benchmark description.
3.3. Rates of Return Estimation and Tests
To make projections about the individual actuarial balance of the pension funds’ participants, we first needed to estimate the shape of the rates of return regarding their frequency distribution for the different investment lines.
We estimated the distribution of the return rates using a historical data approach. The variables affecting the supply-side and demand-side approach, such as inflation and real GDP growth, were assumed to affect the portfolios equally [67,68,69,70].
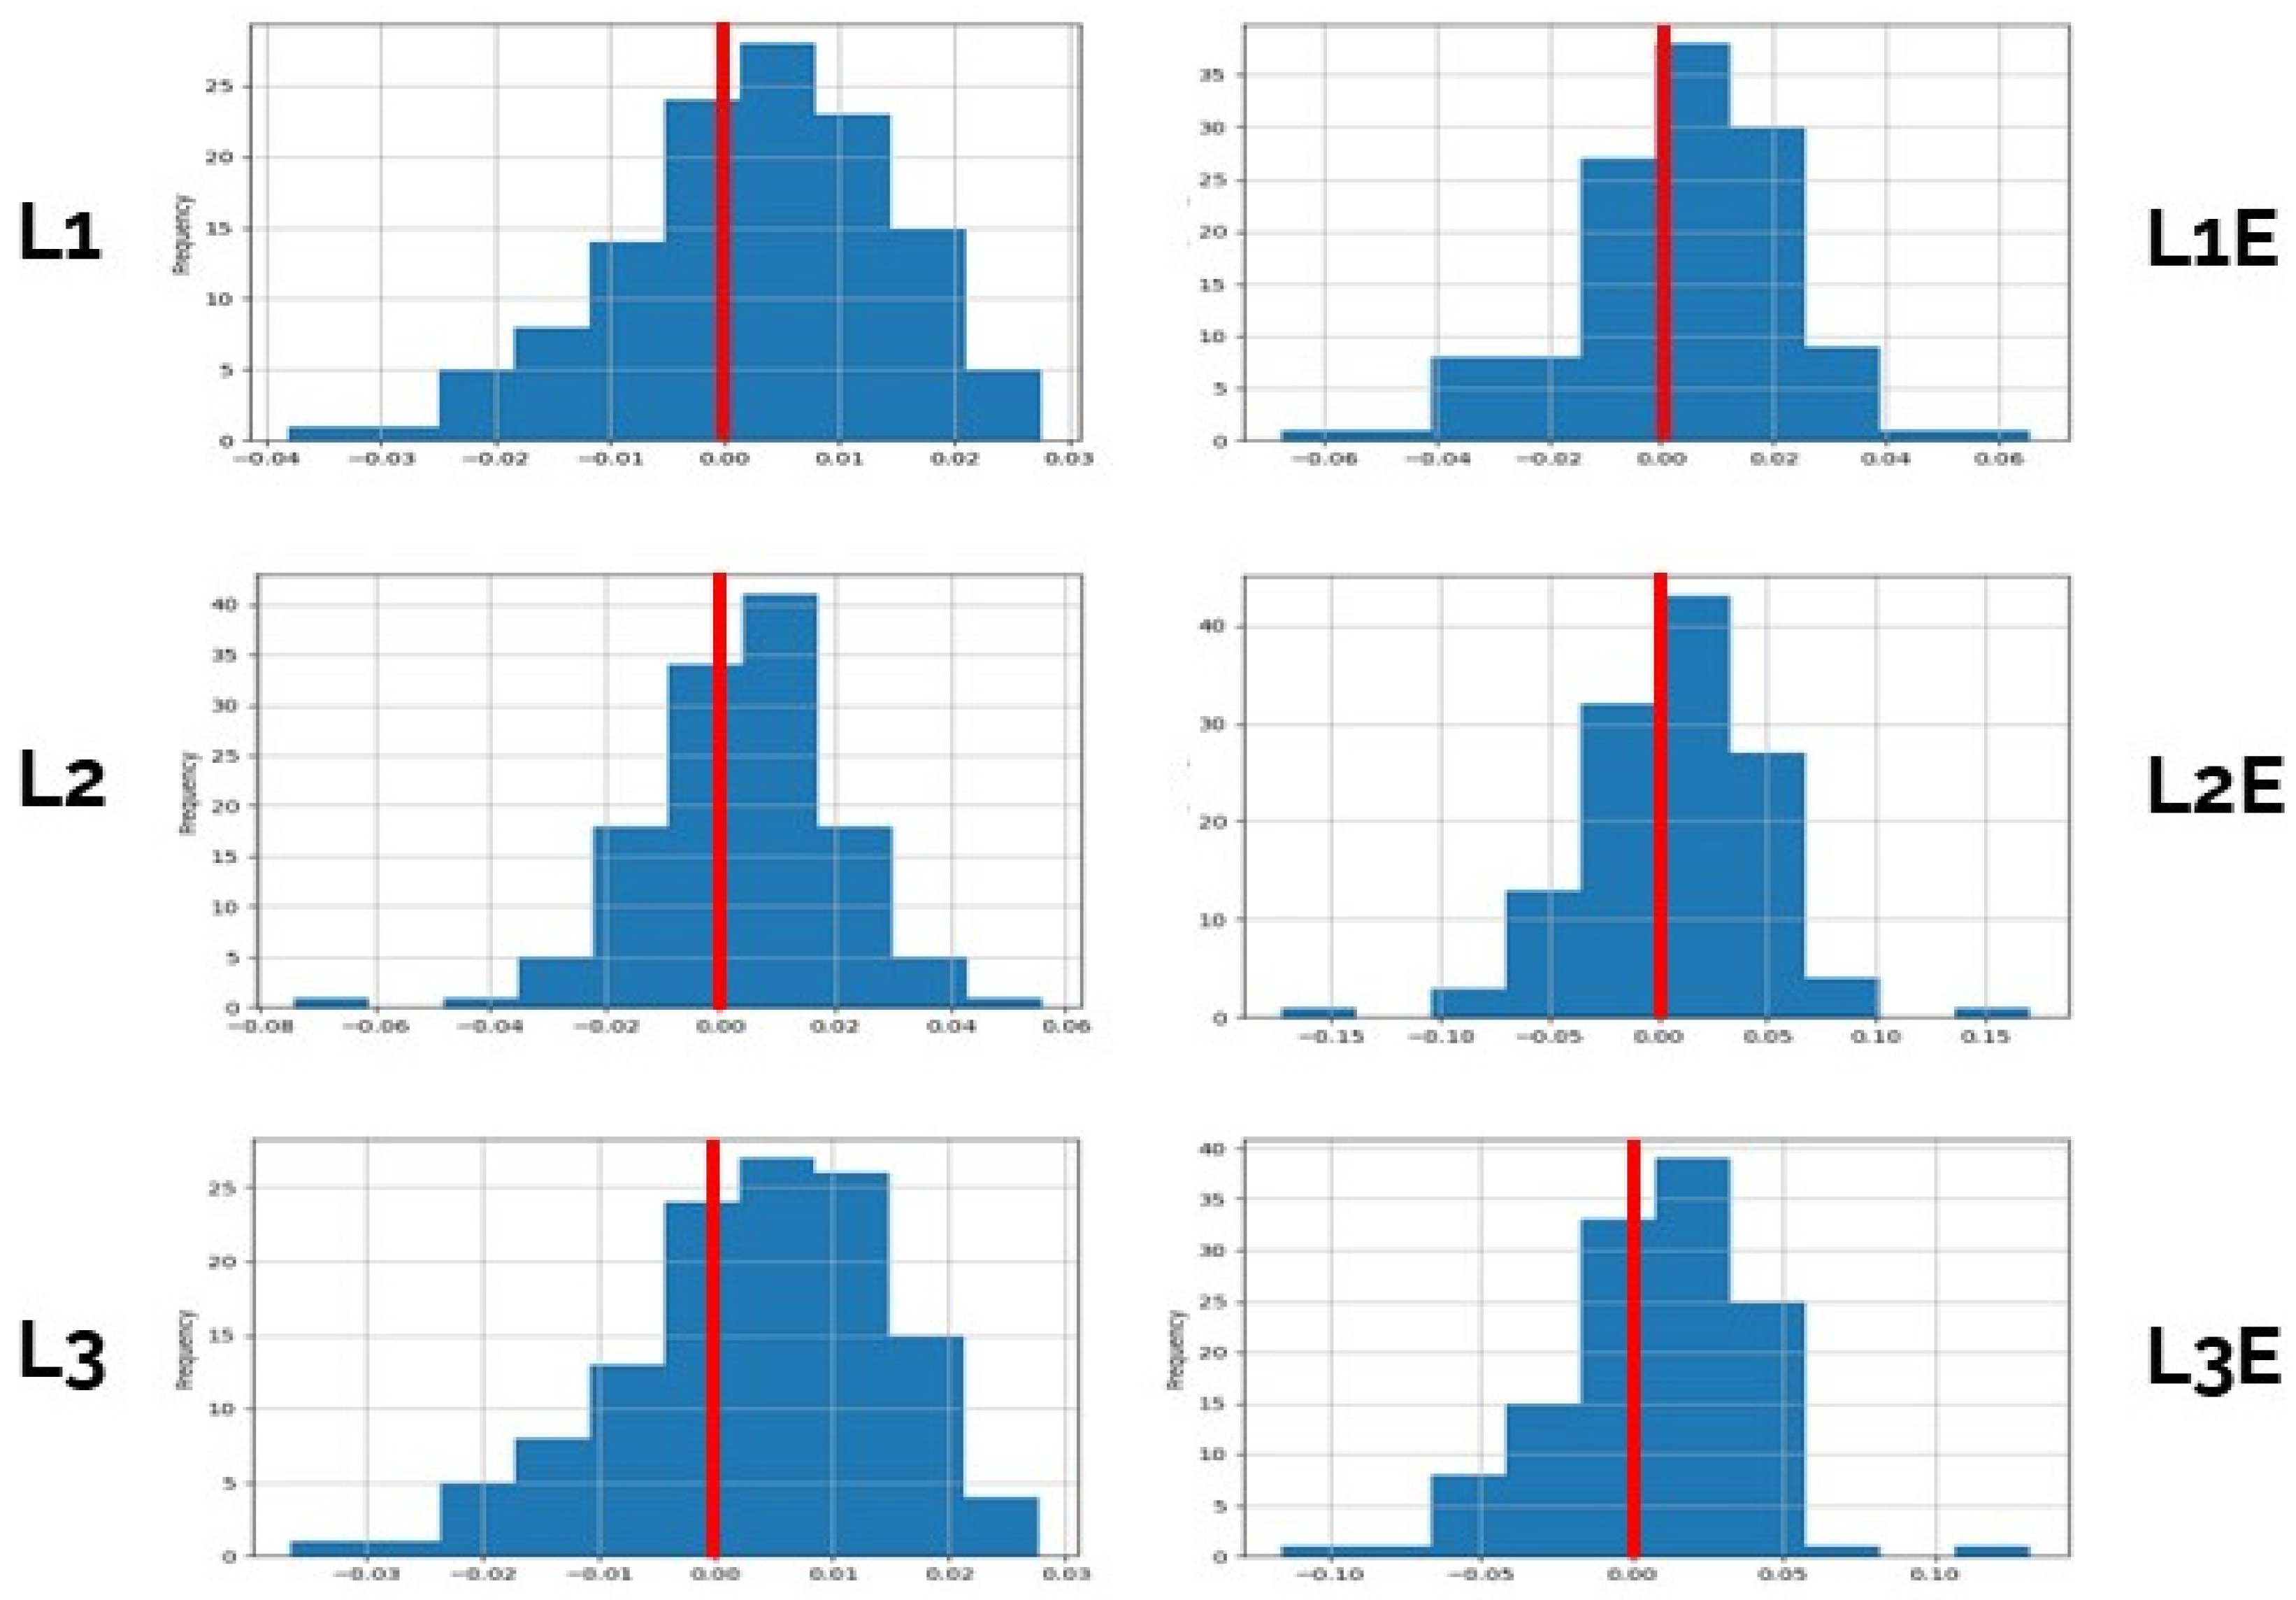
To use historical data series, we first needed to estimate the probabilistic distribution of the rates of return and then use them to simulate projection [67,71,72,73,74]. Then, we tested whenever the historical data series followed a normal distribution to define the best simulating model. Figure 1 represents the rates of return frequency for each line.
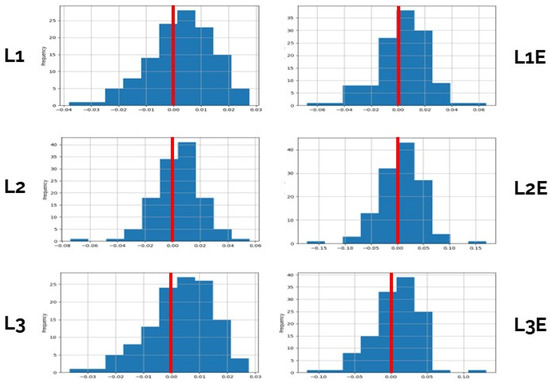
Figure 1.
Distribution of the investment lines’ rate of return.
We performed Anderson–Darling [75] and Shapiro–Wilk [76,77] tests on the historical distribution. The guaranteed line prioritizes capital preservation and typically invests in low-risk assets such as government bonds, offering lower returns but ensuring minimal exposure to market volatility. The balanced line seeks a middle ground, combining equities and fixed-income securities to achieve moderate risk and returns. The capitalized line emphasizes higher growth potential by allocating a larger proportion of assets to equities, targeting higher returns but with increased risk exposure. The first led to the rejection of the hypothesis that they were normally distributed (at a significance level of 5%), while the latter tested if they significantly deviated from a normal distribution. Table 2 shows the main results of the different tests applied.
Table 2.
Results of the selected normality tests.
The results reject the normality hypothesis for all distributions but for Lines 1 and 2E. In this regard, it can be useful to use a skew-normal distribution estimated to generalize a normal one and estimate its parameters [78]. A random variable y is said to have a skew-normal distribution with location , scale s, and skewness a if its probability density function is given by the following:
where γ is the probability density function and ϕ is the cumulative distribution function of a normal distribution N (0, 1).
A methodology to estimate the parameters was adopted by Azzalini & Capitanio (1999) [79] and updated for robustness. The results of the estimated skew distribution parameters are shown in Table 3. The guaranteed line prioritizes capital preservation and typically invests in low-risk assets such as government bonds, offering lower returns but ensuring minimal exposure to market volatility. The balanced line seeks a middle ground, combining equities and fixed-income securities to achieve moderate risk and returns. The capitalized line emphasizes higher growth potential by allocating a larger proportion of assets to equities, targeting higher returns but with increased risk exposure.
Table 3.
Estimated skew distribution parameters.
Except for line 1 and line 2E, the applied tests highlighted that the investment lines were neither normal nor symmetric, and these facts impeded the adoption of methods based on the Markovitz model or normality assumption. We then proceeded with the building of the model by applying Monte Carlo simulations.
3.4. Monte Carlo Simulations
We ran a Monte Carlo of 10,000 projections for each portfolio generated using the discussed probability distribution for each investment line by considering different potential ages of entrance in the pension fund and the contributors’ gender, with the main variables used for estimating demographic scenarios.
For each potential contributor, we simulated the retirement benefit (R) by employing the individual actuarial balance described by the following formula.
where is the yearly contribution of the participant, paid between the entrance in the investment plan in and the retirement year in ; is the interest rate applied at time t; is the survival probability at time t according to the demographic characteristics g; and is the yearly benefit received by the participant from retirement in until their death in . The interest rate is a random variable obtained by the probability distribution estimated in the previous section.
Assuming C and R did not change over time, we obtained the following result by rearranging the formulas, allowing us to compute the constant yearly benefit:
Once we simulated return projections for each portfolio, we computed each projection’s actuarial value and benefit. To perform this, we employed the life table Istat 2021, and we assumed (i) a retirement age fixed at 67 years, (ii) no investment line change during the contributor’s lifetime, and (iii) a constant contribution C equal to 1 for each year. The differences in mortality rates between men and women are expected to bring different results in the performance projections.
3.5. Expected Utility and Risk Aversion
In order to consider the variance of the results given by the Monte Carlo projections and the role of risk aversion, we adopted the expected utility as an indicator. This allowed us to employ a standard economic approach to compare alternatives by including risk evaluation [80]. Among the appropriate utility functions [81], we decided to adopt a non-traditional utility function of the type , where m is a constant representing a numeraire (for example a unit of money); if the individual is risk-averse; if the individual is risk-neutral; and if , the individual is a risk-lover.
This utility function is similar to the traditional CRRA utility function but does not consider the region representing strong risk-averse contributors. This paper focuses in fact on the propension of young pension contributors to invest. There is a consistent part in the literature regarding risk-taking and the relationship between demographics and, in general, socioeconomic components [82,83,84] that shows a positive attitude towards risky investment for young contributors. To focus on these peculiar categories of investors, using the non-traditional one-utility function above, we consider risk aversion excluding the deep risk-averse component. Moreover, the utility function chosen in accordance with and within the limits shown by O’Donoghue and Somerville (2018) is useful for two main reasons [81,85]. First, it provides a straightforward and computationally efficient approach, which is essential given the large volume of data we processed and compared. Second, and most importantly, this form allows for the seamless integration of an additional utility component representing green preferences in the next section, maintaining a consistent form despite the heterogeneous arguments
This choice allowed us to expand the utility function in the next section.
Since the function is not independent of the scale, we considered a yearly contribution of EUR 5165.00, with the latter being the maximum deductible contribution amount according to the Italian regulation, and it is believed to be the most realistic scenario for young workers.
We adopted the expected utility results, which is the average of the utility obtained by the result of each simulation, and computed it over different degrees of risk aversion . In the next section, we show the expected utility ratios between the two options, with and without ESG selection, to avoid the cardinal value of the utility, which is affected by alpha, and may create unjustified confusion. The ratio has as a numerator the expected utility of an investment line and as a denominator its ESG-oriented correspondent line.
3.6. Green Preference Indifference Index
We further expand on the utility function to provide an index assessing the green preference’s role. We employ standard assumptions, namely (1) the higher the expected retirement benefit, the higher the utility; (2) the higher the ESG rank, the higher the utility; (3) the higher the contribution paid, the larger the ESG impact on utility since the investment effect is greater; and (4) the utility coming from the yearly benefit and the utility in terms of ESG investments are additive (i.e., independent). The first component is the utility function as we intended thus far, to which we added the product between the contribution paid (C) and the ESG rank (G) elevated to a beta (which replicates the first component dynamics). G will be equal to 0 if the contribution is invested in a non-ESG line and will be equal to 1 in the opposite case of an ESG line. Formally, the extended utility function is as follows:
where is the ‘sensibility for sustainability’, such that the higher it is, the larger the individual’s utility sensibility to the ESG ranking. Assuming that contributors have non-negative and increasing utility as green investments grow (they do not obtain utility from environmental degradation) but with decreasing marginal returns, we assume
Let us intend as indifference sensibility’s equivalent to such that, given two investment lines, i and j, the investor is indifferent among them. Formally,
The higher sensibility to the ESG ranking could compensate for the different remuneration of the investment lines. According to Monte Carlo simulations, the results highlight the possibility for considering the investor’s propensity to obtain evidence on environmental behaviour.
4. Main Results
This section introduces the main results of the analyses conducted by considering young contributors to the pension fund (with age between 20 and 29 years), and, in particular, (i) the projections obtained by the Monte Carlo simulations and the related statistics, (ii) the expected utility and risk aversion indexes, and (iii) the green preference index.
4.1. Monte Carlo Simulation
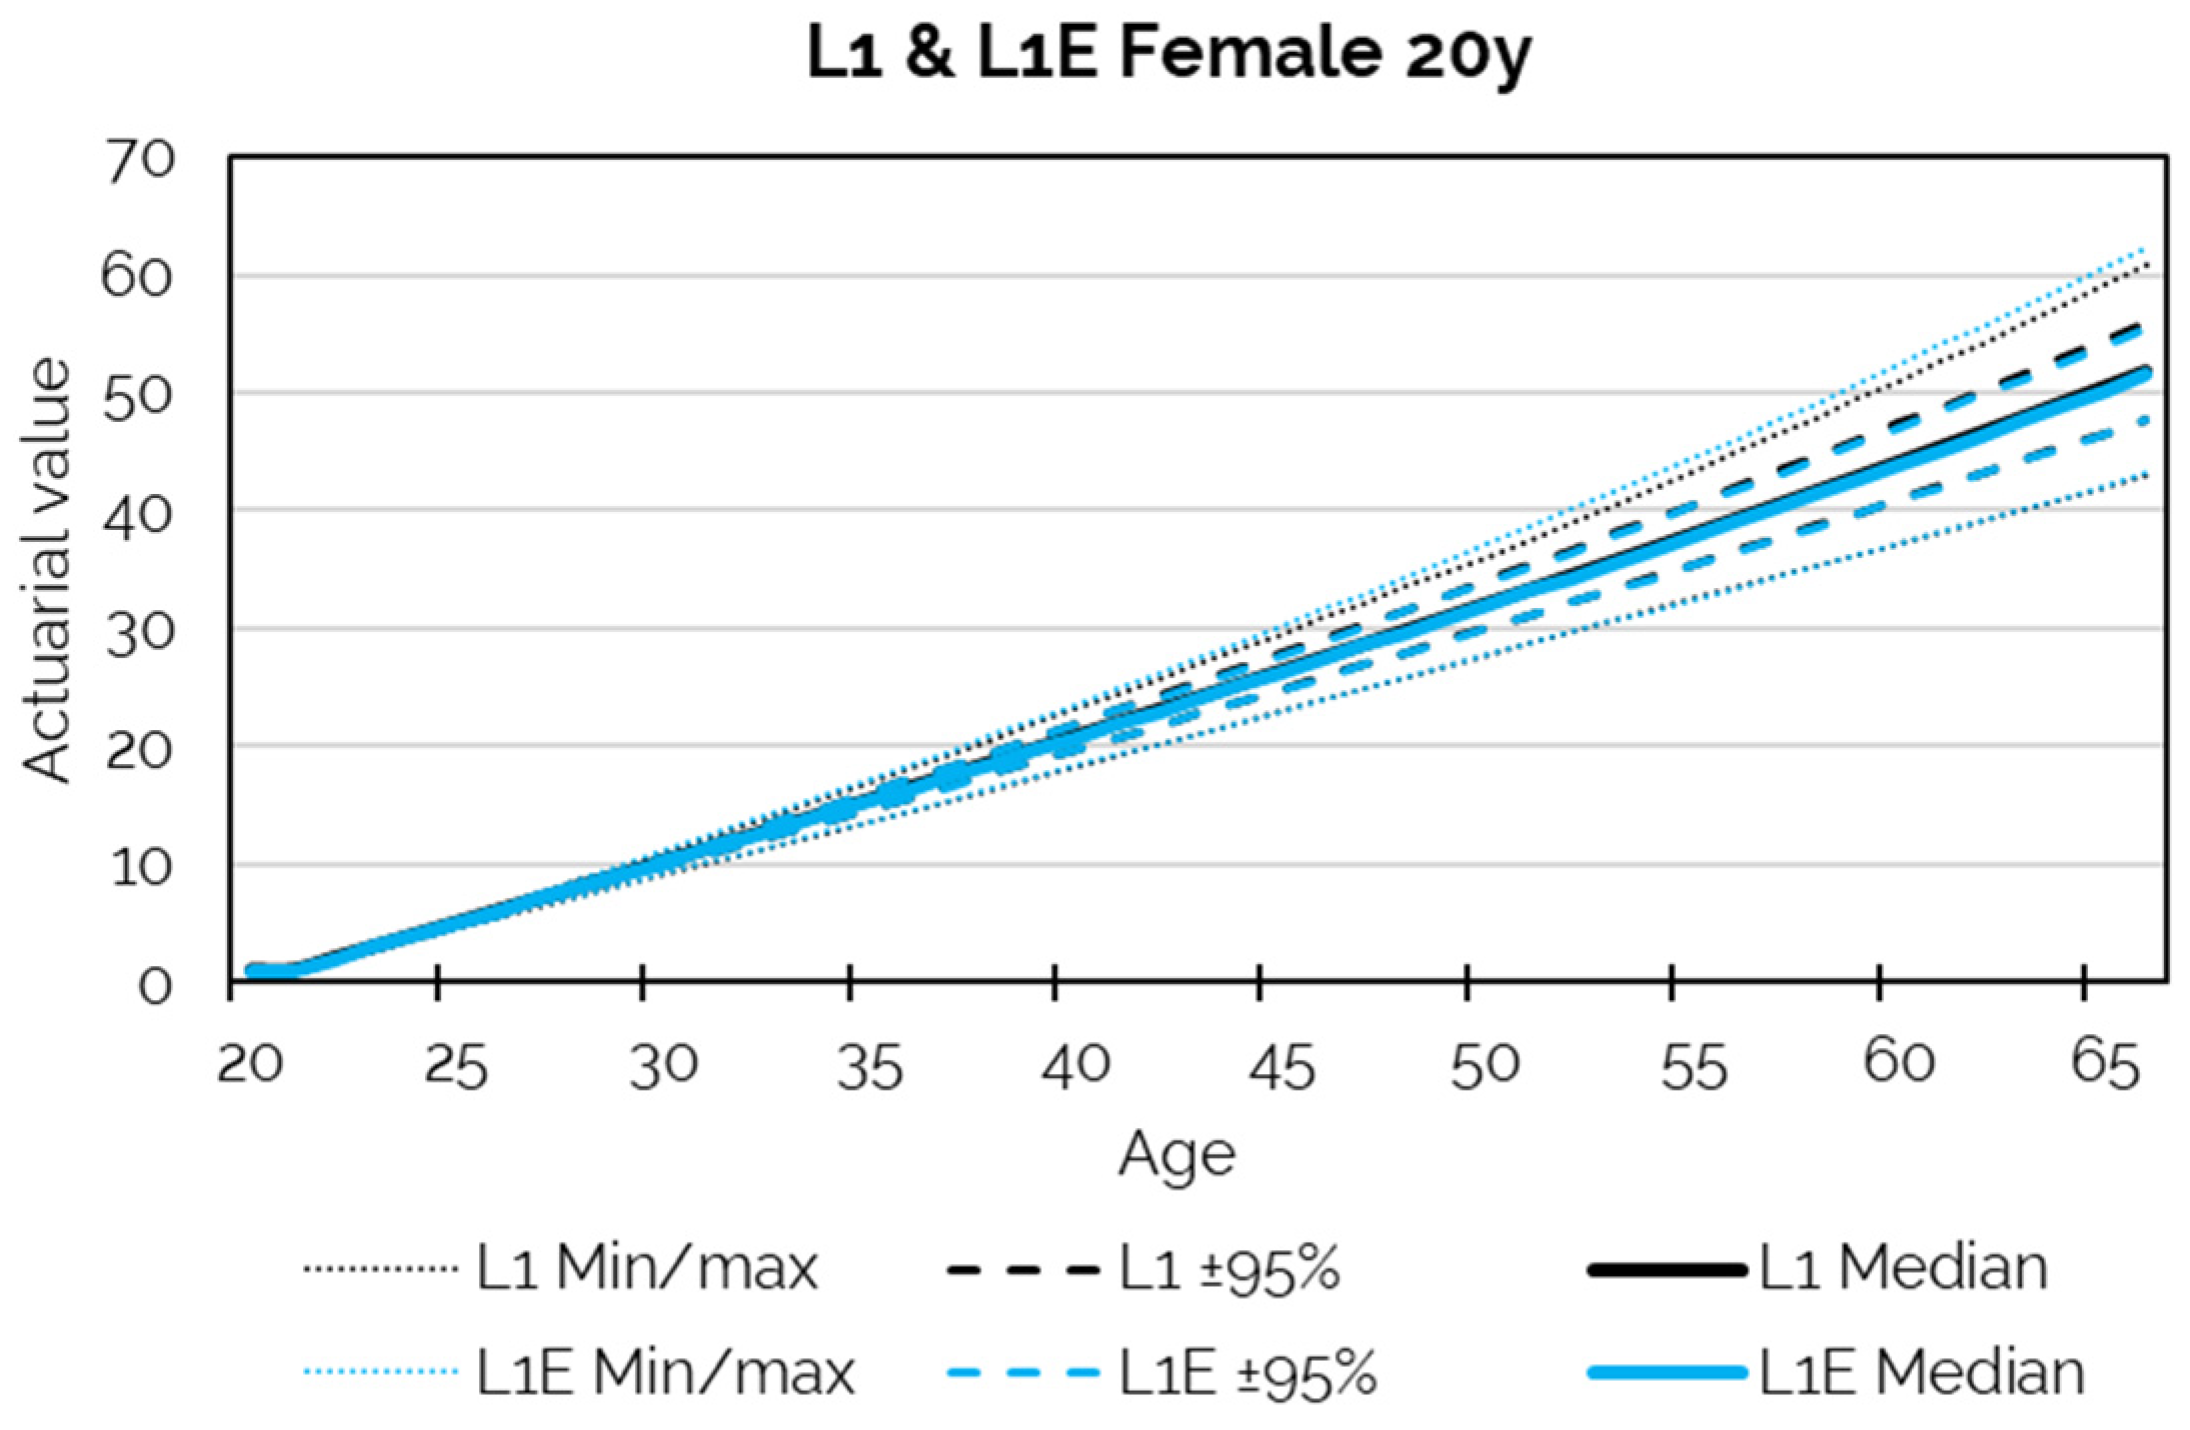
Each Monte Carlo simulation computes the individual actuarial value from the subscription age to the retirement age of 67, assuming a constant yearly contribution equal to 5165. We ran it for each line (Figure 2, Figure 3 and Figure 4) and gender. We provide only the plots for females entering at the age of 20 since the male case has no graphical distinguishability. Considering all the actuarial values simulated, these plots show lines corresponding to (1) the minimum and the maximum actuarial value, (2) the interval of projections which are not the last 2.5% and not the top 2.5%, labelled 95%, and (3) the median.

Figure 2.
Projections of Line 1 and Line 1E.
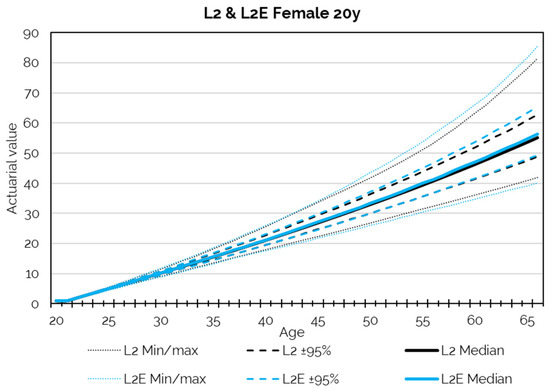
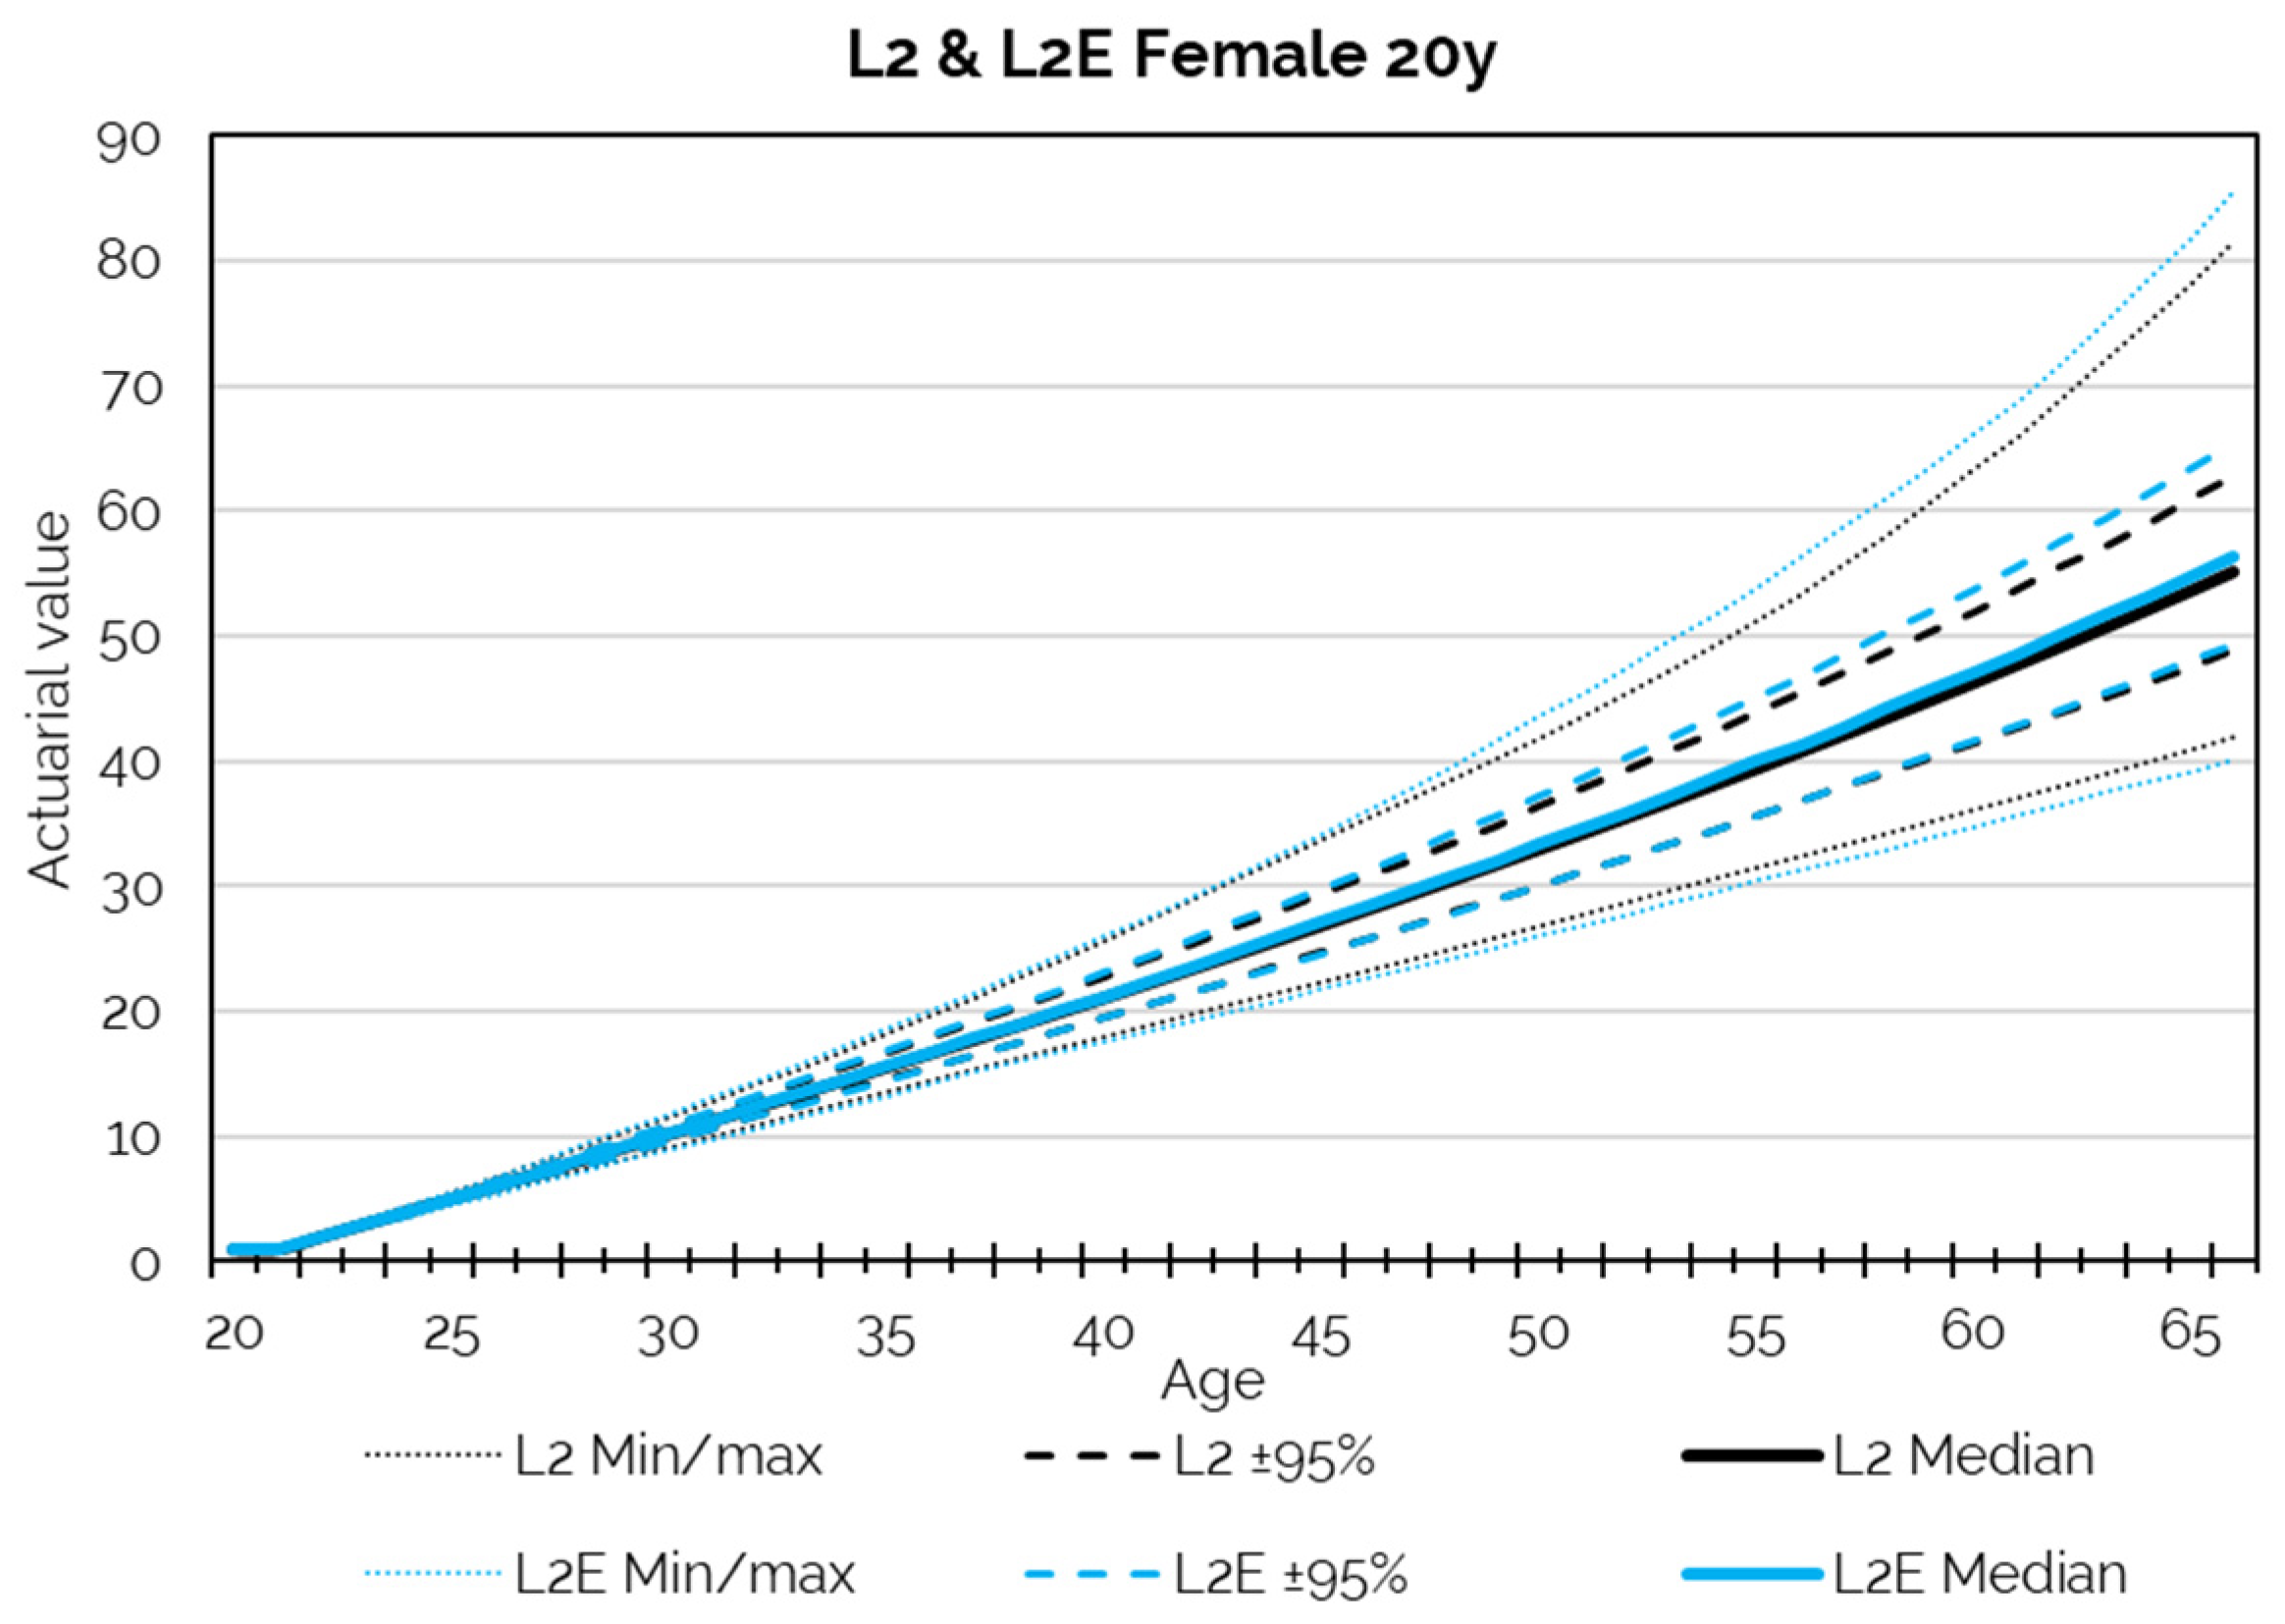
Figure 3.
Projections for Line 2 and Line 2E.

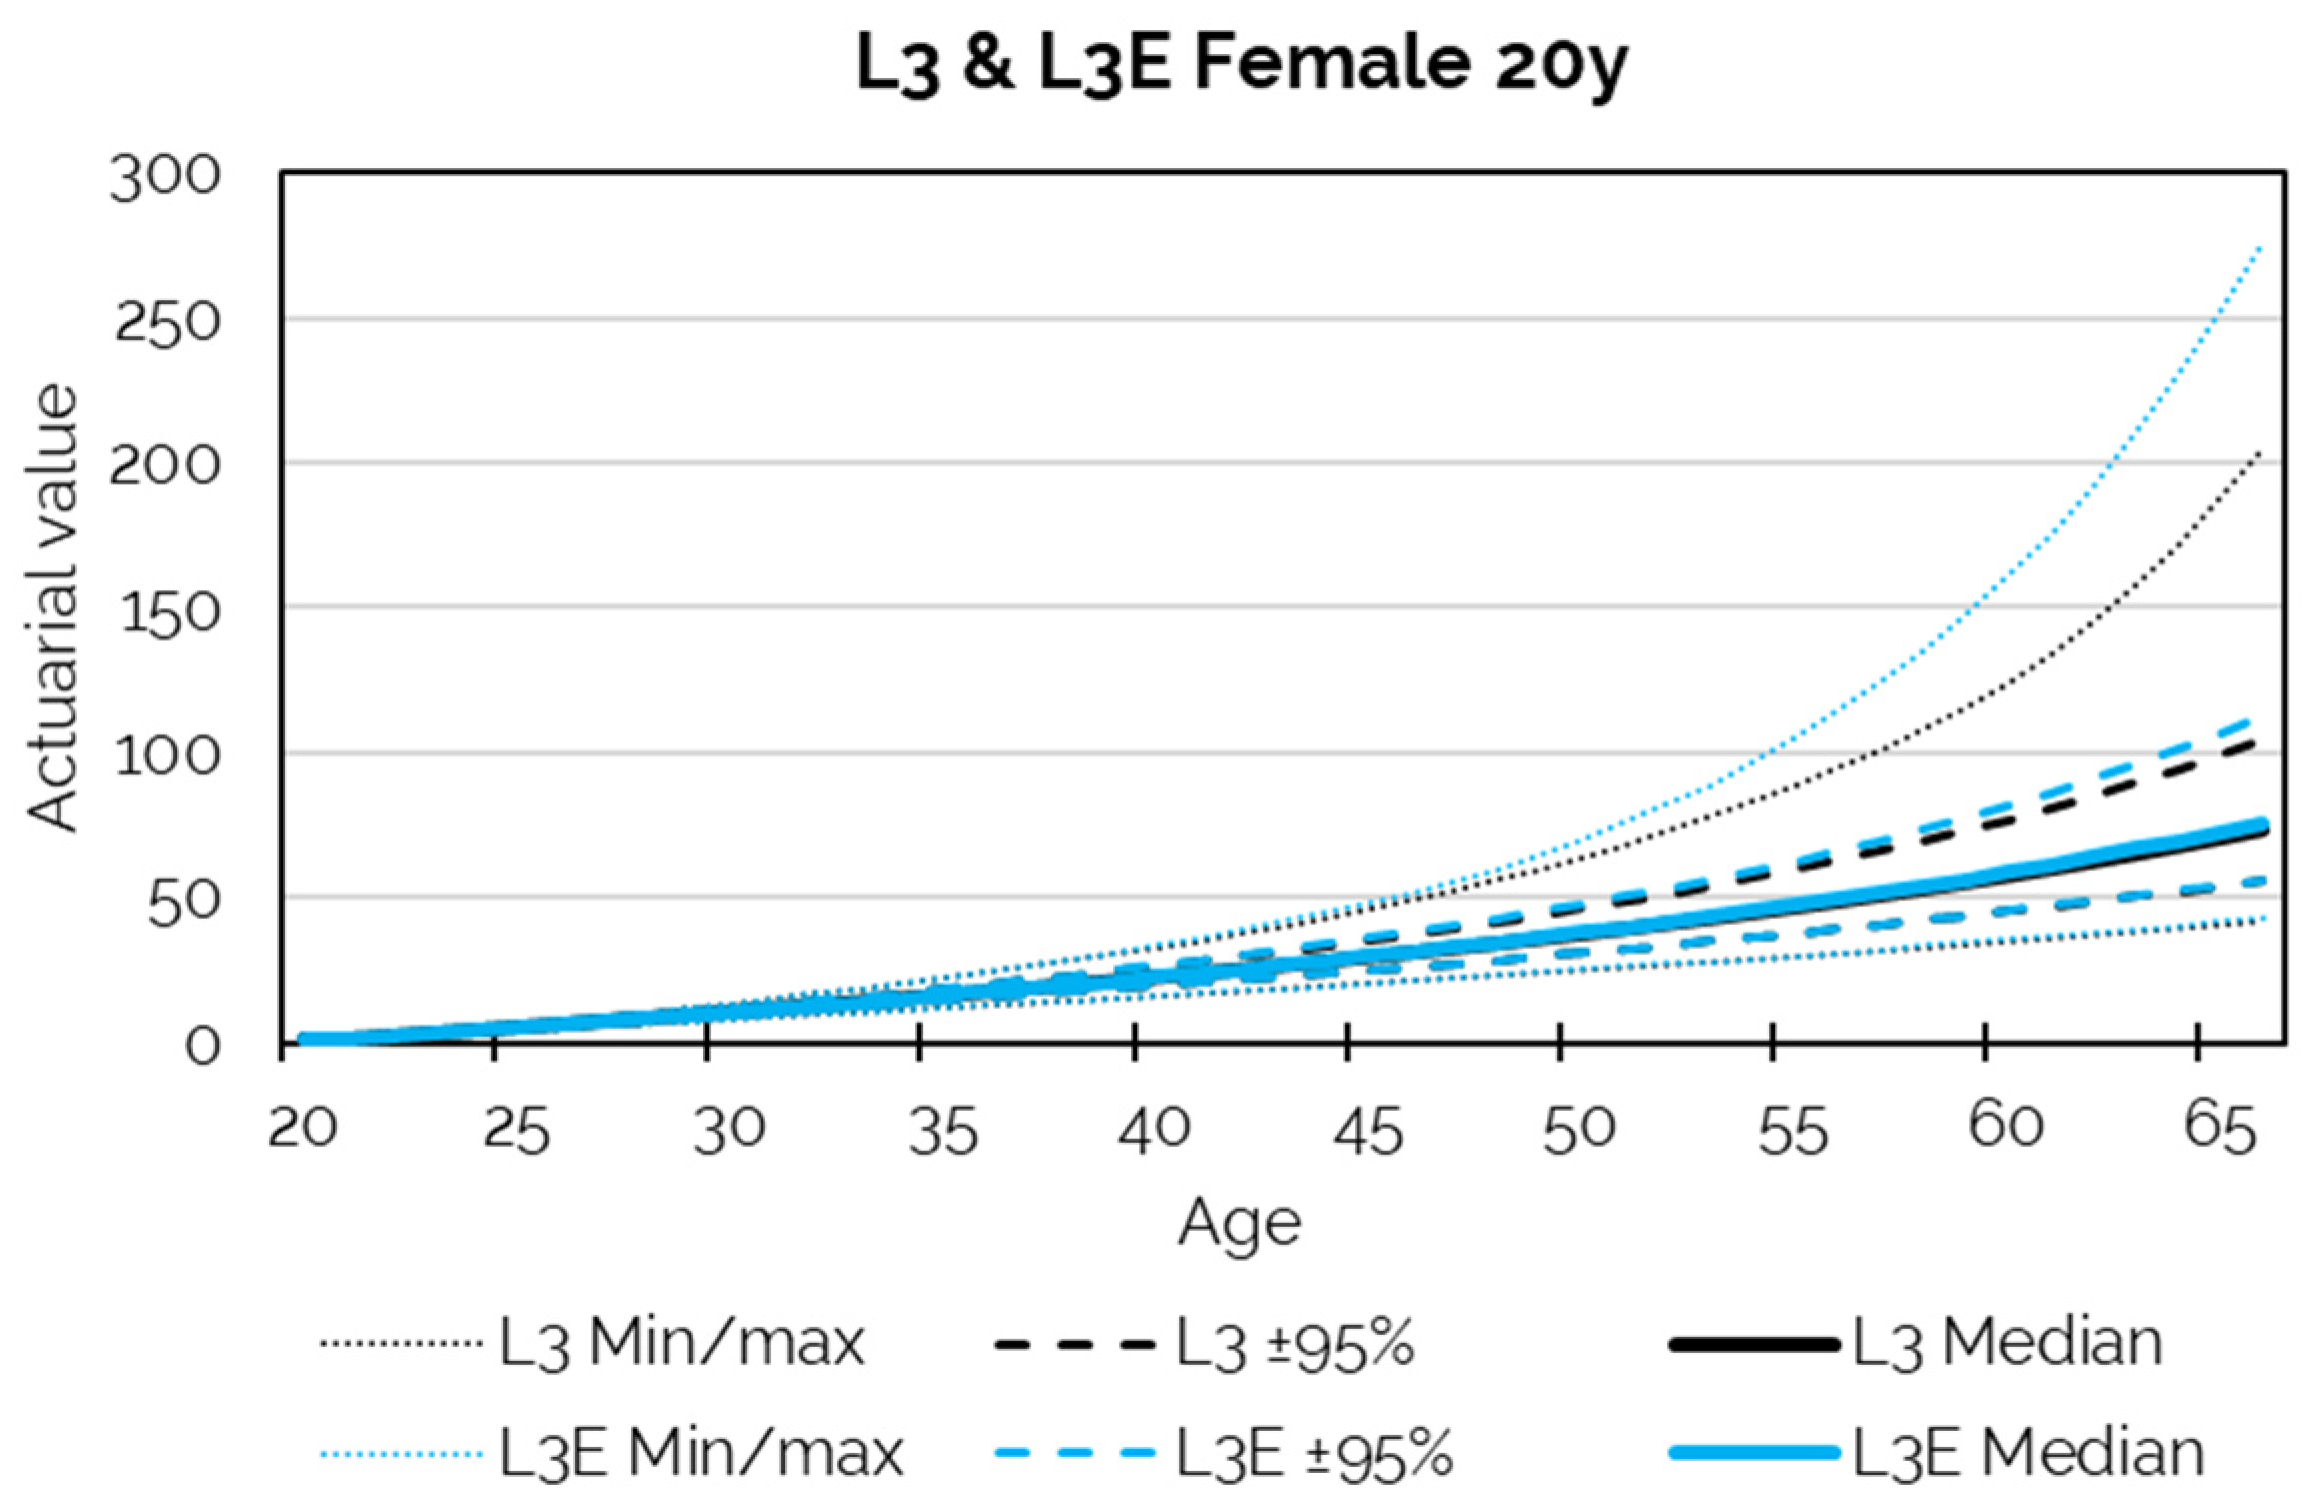
Figure 4.
Projections of Line 3 and Line 3E.
In the following plots, we show the actuarial value of each unit of invested capital to provide the performance of the funds regardless of the specific Italian case, which we will return to later.
These plots highlight that no line dominates its greener correspondent or vice versa, and dominance is intended as one always has higher values than all the values of the other. It also shows that their variability is asymmetric, which entails limits in using standard mean-variance tools. Moreover, there is no line with both a higher max, at 95%, median, and minimum than this correspondent, leading us to conclude that we could have a stochastic dominance. Hence, we needed to employ specific indicators to know when and to which extent a line performs better than its corresponding line with a different ESG estimation.
A useful indicator to assess which portfolio performs better could be the probability that a given line provides an individual actuarial value higher than its ESG-oriented correspondent. It is a piece of synthetic information that is validated independently from the distribution shape. Table 4 shows the probability rates for 20-year-old subscribers of both genders.
Table 4.
Probabilities that a line has a higher actuarial value than the corresponding ESG-oriented line.
Table 4 highlights how youngers have an advantage in adopting an ESG approach for balanced and capitalized lines (lines 2E and 3E). It also shows no significant difference between males and females. Such a statistic is partial because it does not consider the distribution variability and neglects investor risk aversion.
To include the distribution variability and the role of risk, we can move forward by proposing a graphical representation of the classic mean-variance approach. We substitute this mean with the expected actuarial value, given by the average of the values simulated at the retirement age. Figure 5 shows the results comparing the lines decomposed for mean and variance where, once again, we used female statistics due to the indistinguishability of the results. These two components highlight the need to include the risk profile of the investors in order to assess the optimal investment line. Indeed, Line 1E has both a lower mean and variance than Line 1, while Lines 2E and 3E have both higher means and higher variances than their correspondents. Only whenever a line has both a higher mean and lower variance may we conclude directly that it dominates the other (Yoon & Kim, 2020, p. 305), which is not the case here [86]. However, Figure 4 seems to suggest that the degree of risk aversion can affect the choice between a conventional investment and an ESG-oriented one.
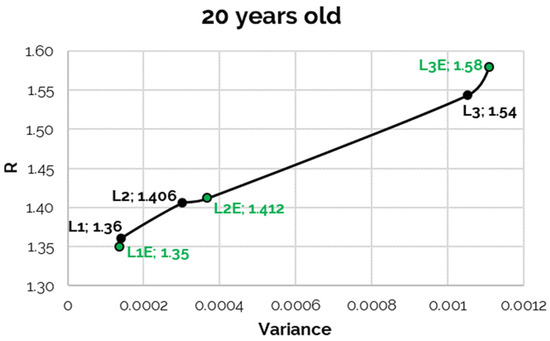
Figure 5.
Expected actuarial value and rates of return variances for young people.
4.2. Expected Utility and Risk Aversion
To verify the best portfolio for each risk aversion profile, we applied the expected utility function (introduced in Section 3.5). It is a useful indicator because it has a clear economic meaning, includes the role of variance and risk, and can show the effect of different degrees of risk aversion.
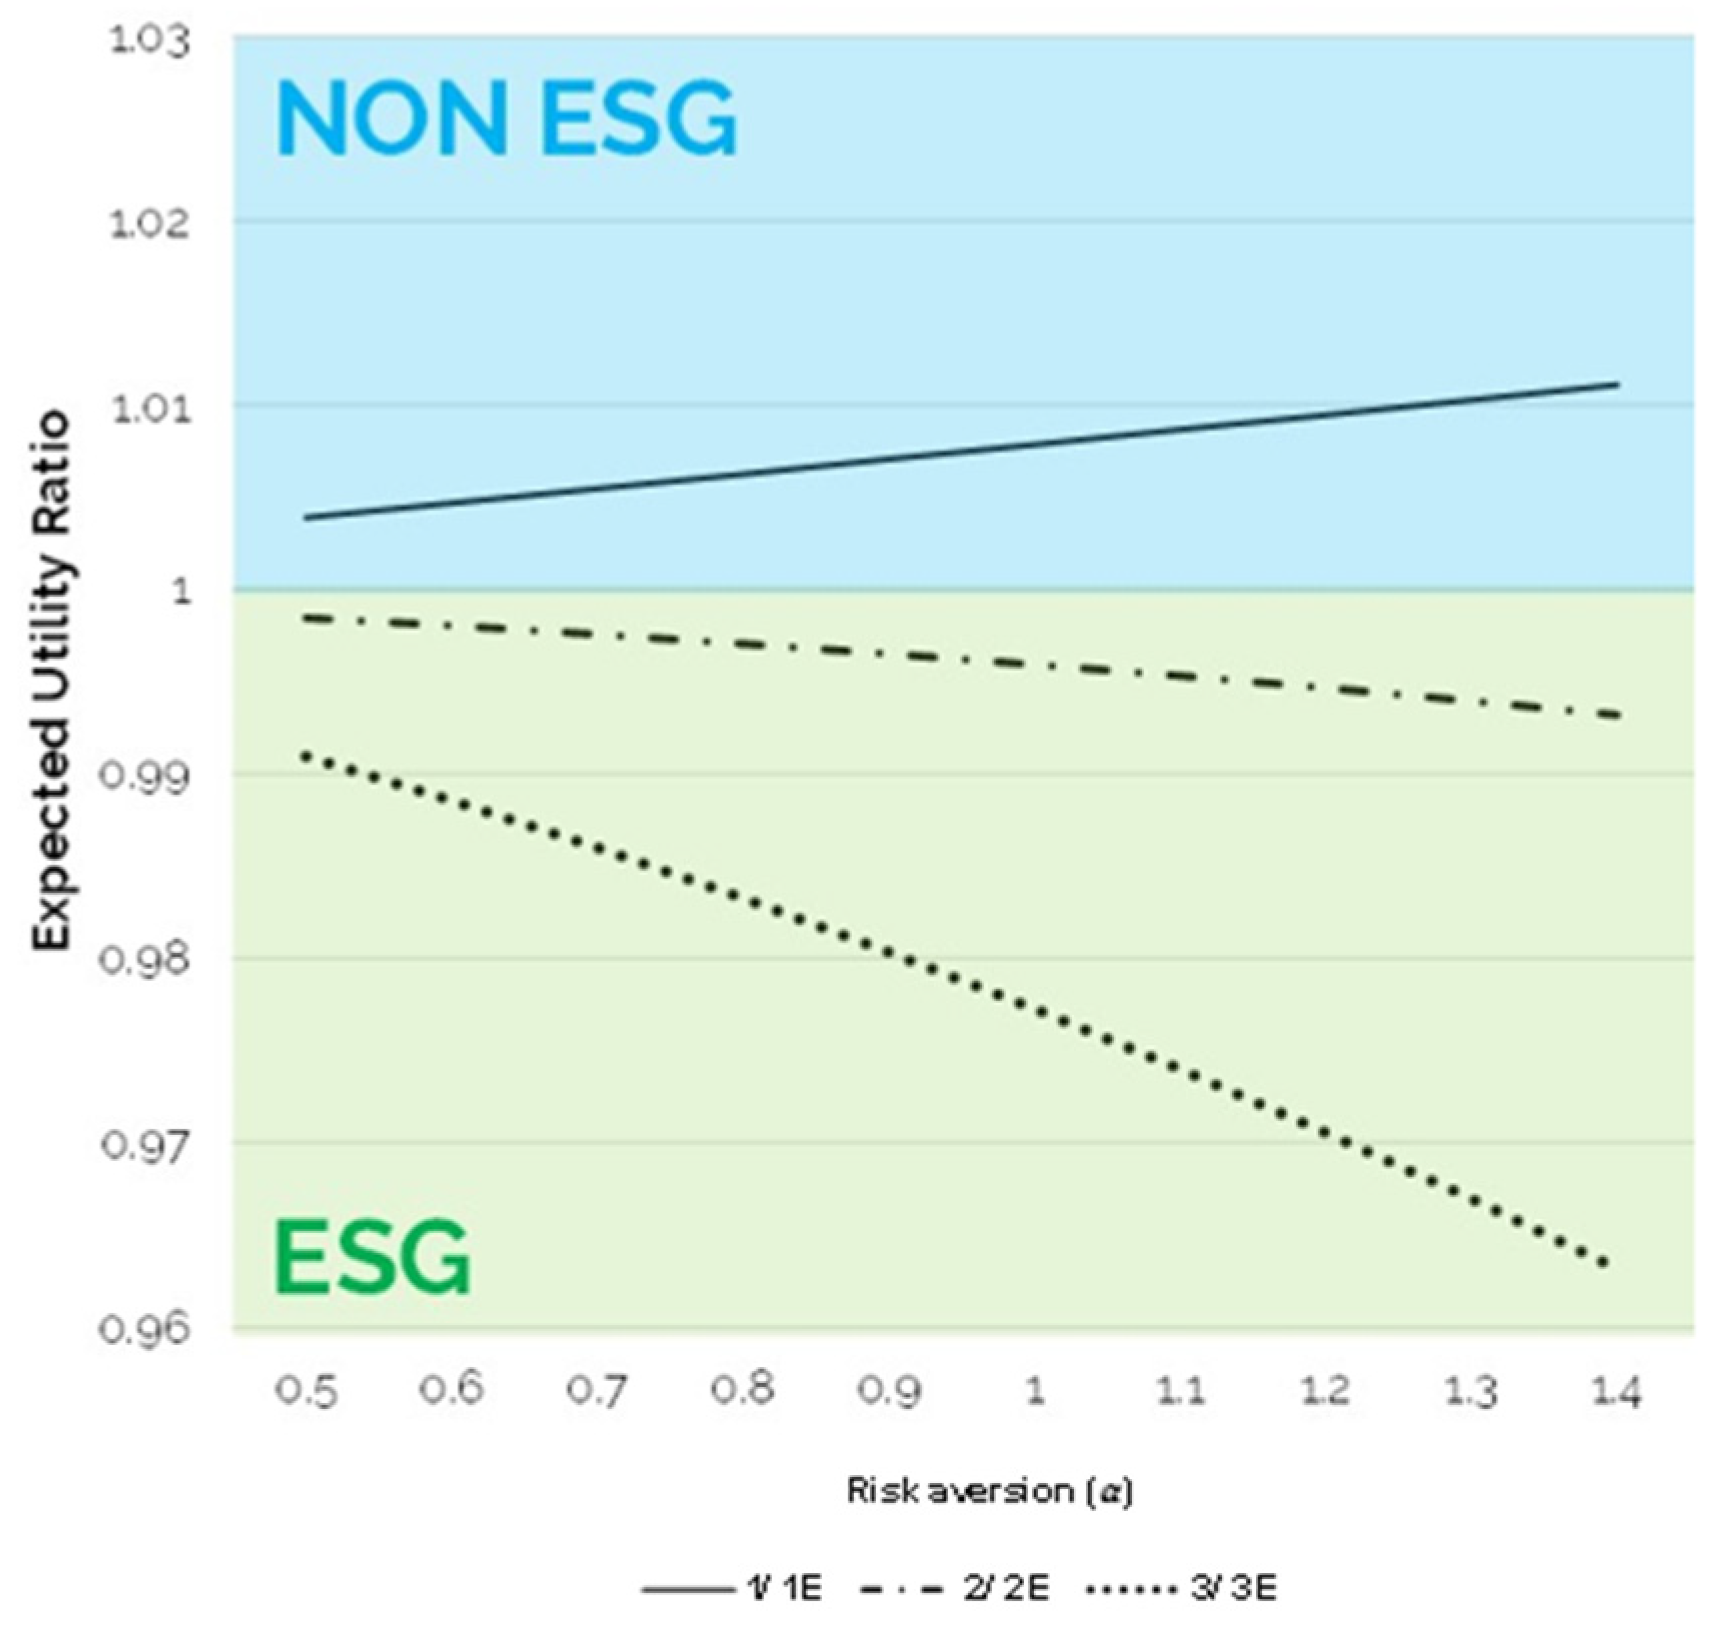
Figure 6 and Figure 7 present two areas with different colours showing when the utility of investing in the ESG-oriented line overpasses that of the non-ESG line (in green) and vice versa (in light blue) according to different risk propensities (for risk-averse, > 1 risk lover). By construction, the ratio will take on values close to one when the utility of investing in ESG-oriented lines is equivalent to non-ESG ones, while it will take on values lower than one if the preference is for ESG lines or vice versa.

Figure 6.
Risk aversion and expected utility ratios per EUR.
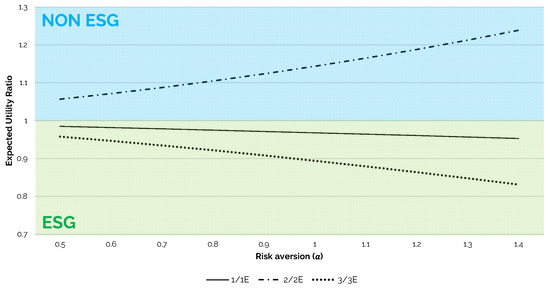
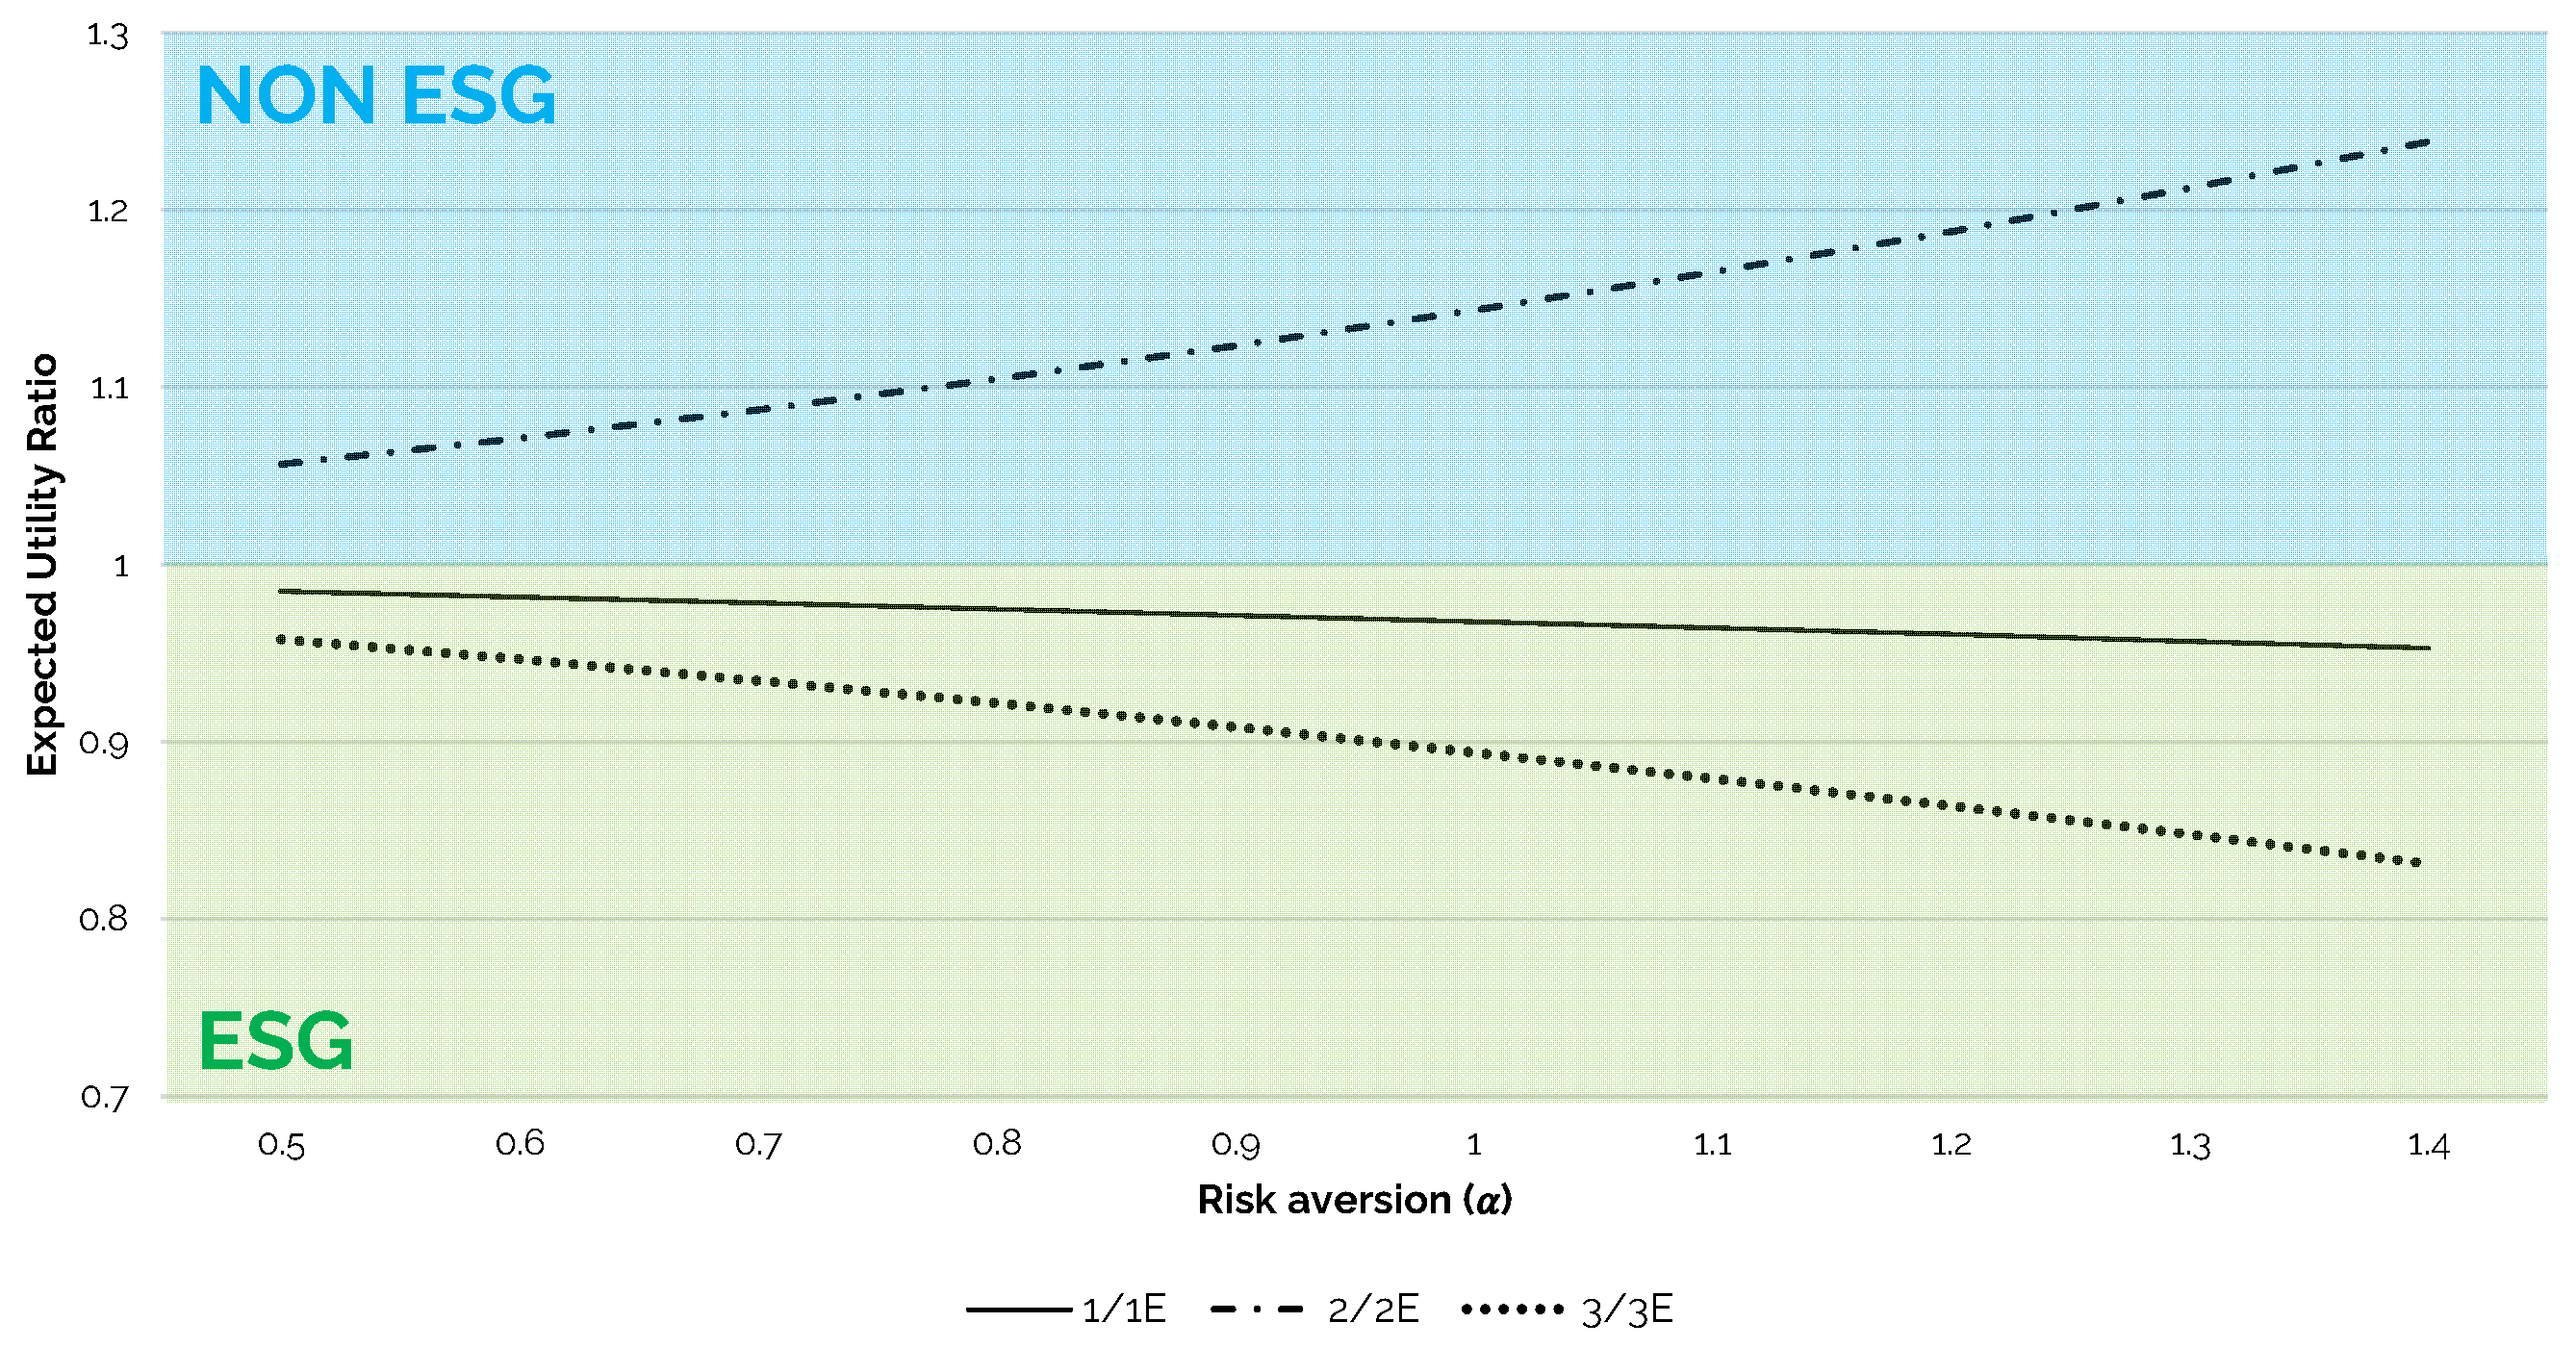
Figure 7.
Risk aversion and expected utility ratios in the case of EUR 5165.00.
According to the discussion above, we considered a yearly contribution per person equal to EUR 5165, considering this value as the most realistic scenario for young workers, given its fiscal deductibility.
It is important to note that differences in attitudes towards risk correspond to different curvatures of the utility function. The greater the risk aversion in an economic situation, the greater the curvature of this function. For the case of economic subjects who think in terms of prudence, risk aversion depends, in addition to psychological factors, on an individual’s assets, which is generally lower when the assets are greater.
Our numerical results show that, according to the particular dataset on disposal, in the case of contribution per EUR (Figure 6), the utility ratio presents a preponderance for ESG-oriented investment for Lines 2E and 3E, while Line 1 is situated in the light-blue area. Different results are obtained if a higher contribution is considered. A larger contribution (Figure 7) makes the ratio for Line 2 not compliant with green investment.
Data show that young investors have a higher expected utility for the third ESG-oriented line in particular. Remarkably, these results are valid for any degree of risk aversion and a different number of contributions. Moreover, the lower the risk aversion, the more exasperated the ratio. When we applied the mean/variance approach, we verified that no line was able to dominate the corresponding one: no line was characterized by a high return with a lower risk. Nevertheless, by applying the criterion of the expected volatility, it was possible to verify that for the capitalized line, in particular, with a high portion of equity, the ESG-oriented portfolio was able to give a higher utility to the investors.
4.3. Green Preference
From the results shown in Table 4, we can observe that the probability of obtaining a better performance is higher for the traditional portfolio than for the ESG-oriented portfolio in the case of the most conservative line (L1). These results were evaluated for their contribution per EUR. Moving to the introduction of the utility function to consider the behaviour of risk-averse or risk-loving investors, we studied the impact of different aversion and contribution dimensions too. To give a remark on the role of green preference, let us now consider the green indifferent index, beta, which is defined in paragraph 3.6.
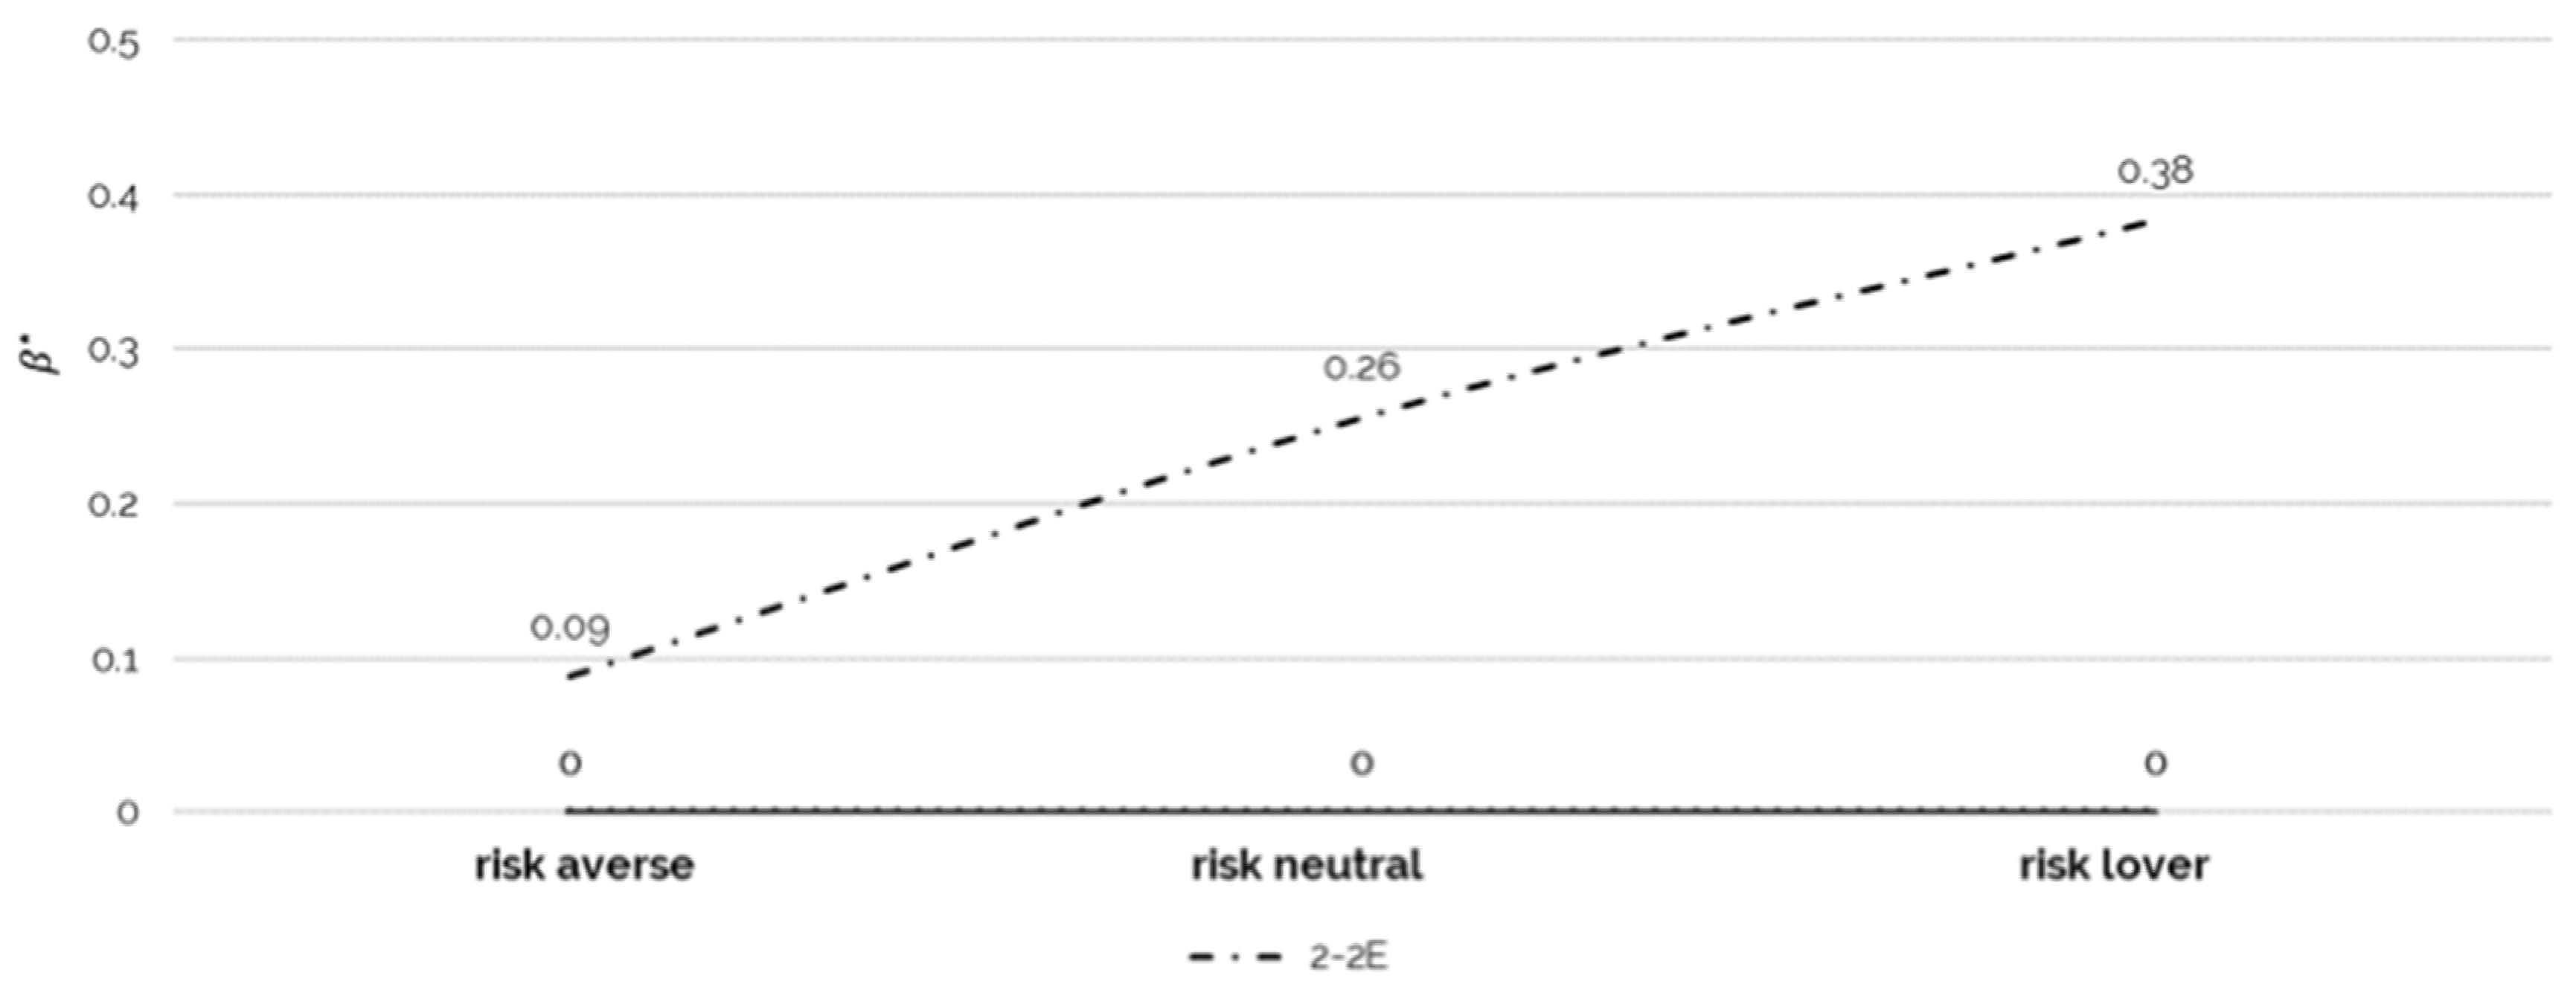
In the case of EUR 5165.00 of contributions, Line 2 presents in our dataset a utility ratio where the preference for a non-ESG-oriented Line of investment is preponderant. Focusing on Line 2, we evaluate numerically the betas that return the same utility value in the case of the ESG-oriented line and not the ESG-oriented one (Figure 8).

Figure 8.
Indifference Beta values to switch toward a ESG-oriented line.
By considering the balanced line, a little sensibilization toward ESG factors may have a huge impact on promoting the adoption of ESG-oriented investments (as shown in Figure 7).
4.4. Final Remarks, Limits and Future Research
This study has a number of limitations that could offer future research insights into the sustainable finance area as applied to pension plans.
The indicators provided in the analysis aim to answer the questions ‘Are ESG-oriented pension funds convenient for young investors? For which risk profile? For which degree of green preference?’. These questions are answered under certain assumptions, which future research can address. First, we selected a specific set of lines based on the experience of an open-ended pension fund that confidentially shared data with the authors. A more extended analysis is welcome. Second, we considered the ESG-oriented line by employing the MSCI ESG indexes; however, ESG evaluation scores vary significantly across different information providers [87,88] due to different country-specific factors [89], industry characteristics [90], criteria, and changes over time [91]. Since there is a low level of correlation among ESG evaluations, future research could verify the different results obtained by the application of other ESG approaches and rankings. Third, other utility functions and scales can be adopted to enquire about risk aversion [81]. Fourth, this study assumes static investment choices, while real-world investors may adjust their portfolios dynamically over time. Incorporating dynamic, life-cycle-based investment strategies into the model could provide additional insights.
In general, one of the main limitations of this study lies in its broad and generalized definition of “young investor”, which is based solely on age (20–29 years) without incorporating additional demographic or socioeconomic characteristics. Factors such as occupation, sector of employment, living arrangements (e.g., living independently or with parents), financial independence, and parental influence are not accounted for in the current analysis. These variables could significantly impact young investors’ financial behaviour, their attitudes toward ESG investments, and their overall investment decisions.
In particular, the interaction between younger and older generations in shared financial decision-making (e.g., parents funding adult children or influencing their financial priorities) could affect both the adoption of ESG investment strategies and pension fund preferences. This phenomenon, prevalent in some European countries, remains unexplored in this study and could alter the dynamics of ESG investment preferences across different age groups. Future research should aim to integrate a more nuanced profile of young investors by collecting detailed data on their social and financial characteristics.
5. Conclusions
This study addresses whether ESG pension funds are an attractive investment opportunity for young savers or if they have to face an “ethical” sacrifice for investing in an ESG-oriented pension scheme.
Pension fund managers must comply with their mandate to guarantee an adequate long-term risk-adjusted return on the investments, ensuring a proper retirement benefit for their clients. Hence, it is necessary to verify the actuarial value each investment portfolio can provide by comparing conventional and ESG-oriented pension funds.
The key findings of this study suggest that, for younger people, pension funds with a stronger ESG orientation are more likely to have a higher return than conventional pension funds for balanced and capitalized portfolios. These results are valid for any degree of risk aversion. In addition, the results show how a slight green preference is sufficient to persuade younger people toward ESG-oriented investment, which is also the case for the guaranteed line (with the most prudent asset allocation). Finally, gender differences are neglectable.
Our results support the idea that substituting investment lines with high-ranked ESG correspondents provides a higher actuarial value for both genders in highly capitalized or balanced lines. We found this result to be true both in probabilistic terms and for any degree of risk aversion. Hence, pension funds oriented to ESG could substitute conventional lines, and if a little nudge is applied, it can happen spontaneously for new subscribers.
This paper has some important policy implications. Based on this study’s findings, fund managers and policymakers can take specific action to attract younger investors to ESG funds. On the one hand, the study provides pension fund managers with a way to attract young people to pension investments. Indeed, it is well known that the pension industry faces a challenge when trying to engage young savers in their retirement savings. Integrating ESG factors into the investment policy of pension funds could be an attractive factor for young people. For fund managers, developing tailored ESG investment products that align with the risk tolerance and long-term goals of younger investors is essential. Young savers would probably become more engaged with their pensions and increase their contributions if responsible investment issues were integrated into their pension investments. Moreover, incorporating educational campaigns on the financial and societal benefits of ESG investing could address potential misconceptions about ethical sacrifice. Policymakers, on the other hand, could incentivize ESG participation through tax benefits or matching contributions, particularly targeting younger demographics who are just beginning their retirement savings journey.
The integration of green investments into pension portfolios could satisfy the need expressed by the next generation for a more sustainability-oriented approach without an ethical sacrifice in terms of return.
This paper highlights one of the most interesting aspects of SRI, namely that when well managed, it can become a win–win opportunity for both the pension fund and its members, rather than just for the environment and benefits society as a whole.
Author Contributions
Methodology, D.M.B. and I.C.; investigation, I.C.; data curation, E.B.; writing—original draft, E.B. and D.M.B.; writing—review & editing, I.C. and F.I.; supervision, F.I. All authors have read and agreed to the published version of the manuscript.
Funding
This research received no external funding.
Institutional Review Board Statement
Not applicable.
Informed Consent Statement
Not applicable.
Data Availability Statement
The data used in the study are reserved. The data is unavailable due to privacy.
Conflicts of Interest
The authors declare no conflict of interest.
References
- Haber, S.; Kepler, J.D.; Larcker, D.F.; Seru, A.; Tayan, B. 2022 Survey of Investors, Retirement Savings, and ESG. CGRI Survey Series Corporate Governance Research Initiative, Stanford Rock Center for Corporate Governance. Available online: https://www.gsb.stanford.edu/sites/default/files/publication/pdfs/survey-investors-retirement-savings-esg.pdf (accessed on 30 September 2024).
- Endrikat, J.; Guenther, E.; Hoppe, E. Making Sense of Conflicting Empirical Findings: A Meta-analytic Review of the Relationship between Corporate Environmental and Financial Performance. Eur. Manag. J. 2014, 32, 735–751. [Google Scholar] [CrossRef]
- Horvathova, E. Does Environmental Performance affect Financial Performance? A Meta-analysis. Ecol. Econ. 2010, 70, 52–59. [Google Scholar] [CrossRef]
- Pedersen, L.H.; Fitzgibbons, S.; Pomorski, L. Responsible investing: The ESG efficient frontier. J. Financ. Econ. 2021, 142, 572–597. [Google Scholar] [CrossRef]
- Renneboog, L.; Ter Horst, J.; Zhang, C. The price of ethics and stakeholder governance: The performance of socially responsible mutual funds. J. Corp. Financ. 2008, 14, 302–322. [Google Scholar] [CrossRef]
- Hartzmark, S.M.; Sussman, A.B. Do Investors Value Sustainability? A Natural Experiment Examining Ranking and Fund Flows. J. Financ. 2019, 74, 2789–2837. [Google Scholar] [CrossRef]
- Bova, D.M. Intergenerational equity and inequality of transition: Techniques and empirics. Eur. J. Sustain. Dev. 2020, 20, 129–149. [Google Scholar] [CrossRef]
- Bova, D.M. On the world CO2 emissions equitable transition design and its implementation: Theory and empirical data. Eur. J. Sustain. Dev. 2021, 10, 323–328. [Google Scholar] [CrossRef]
- Bova, D.M. Building consensus for sustainable develpment: Evaluation theory insights. Eur. J. Sustain. Dev. 2022, 11, 104–116. [Google Scholar] [CrossRef]
- Bengo, I.; Boni, L.; Sancino, A. EU financial regulations and social impact measurement practices: A comprehensive framework on finance for sustainable development. Corp. Soc. Responsib. Environ. Manag. 2022, 29, 809–819. [Google Scholar] [CrossRef]
- Dyck, A.; Lins, K.V.; Roth, L.; Wagner, H.F. Do institutional investors drive corporate social responsibility? International evidence. J. Financ. Econ. 2019, 131, 693–714. [Google Scholar] [CrossRef]
- UNPRI. PRI Update Q1 2021; United Nations Global Compact: London, UK, 2021. [Google Scholar]
- Bolton, P.; Kacperczyk, M. Global Pricing of Carbon-Transition Risk. J. Financ. 2023, 78, 3677–3754. [Google Scholar] [CrossRef]
- Chatzitheodorou, K.; Skouloudis, A.; Evangelinos, K.; Nikolaou, I. Exploring socially responsible investment perspectives: A literature mapping and an investor classification. Sustain. Prod. Consum. 2019, 19, 117–129. [Google Scholar] [CrossRef]
- Eurosif (2018), European SRI Study 2018, Brussels. Available online: https://finanzasostenibile.it/wp-content/uploads/2019/01/European-SRI-2018-Study.pdf (accessed on 30 September 2024).
- Sachs, J.; Kroll, C.; Lafortune, G.; Fuller, G.; Woelm, F. Sustainable Development Report 2021; Cambridge University Press: Cambridge, UK, 2021. [Google Scholar]
- United Nations. Transforming Our World: The 2030 Agenda for Sustainable Development; United Nations: New York, NY, USA, 2015.
- United Nations. Sustainable Development Goals Report 2021; United Nations: New York, NY, USA, 2021.
- Atif, M.; Ali, S. Environmental, social and governance disclosure and default risk. Bus. Strategy Environ. 2021, 30, 3937–3959. [Google Scholar] [CrossRef]
- Atz, U.; Van Holt, T.; Liu, Z.Z.; Bruno, C.C. Does sustainability generate better financial performance? Review, meta-analysis, and propositions. J. Sustain. Financ. Invest. 2023, 13, 802–825. [Google Scholar] [CrossRef]
- Barber, B.M.; Morse, A.; Yasuda, A. Impact investing. J. Financ. Econ. 2021, 139, 162–185. [Google Scholar] [CrossRef]
- Bauer, R.; Derwall, J.; Otten, O. The ethical mutual fund performance debate: New evidence from Canada. J. Bus. Ethics 2007, 70, 111–124. [Google Scholar] [CrossRef]
- Bofinger, Y.; Heyden, K.J.; Rock, B. Corporate social responsibility and market efficiency: Evidence from ESG and misvaluation measures. J. Bank. Financ. 2022, 134, 106322. [Google Scholar] [CrossRef]
- Capelle-Blancard, G.; Monjon, S. The performance of socially responible funds: Does the screening process matter? Eur. Financ. Manag. 2014, 20, 494–520. [Google Scholar] [CrossRef]
- High, M.; Hazelton, J. Financial markets: A tool for social responsibility? J. Bus. Ethic 2004, 52, 59–71. [Google Scholar] [CrossRef]
- Martí-Ballester, C.P. Analysing the financial performance of sustainable development goals-themed mutual funds in China. Sustain. Prod. Consum. 2021, 27, 858–872. [Google Scholar] [CrossRef]
- Matallín-Sáez, J.C.; Soler-Domínguez, A.; Tortosa-Ausina, E.; de Mingo-López, D.V. Ethical strategy focus and mutual fund management: Performance and persistence. J. Clean. Prod. 2019, 213, 618–633. [Google Scholar] [CrossRef]
- Plumlee, M.; Brown, D.; Hayes, R.M.; Marshall, R.S. Voluntary disclosure quality and firm value: Further evidence. J. Account. Public Policy 2015, 34, 336–361. [Google Scholar] [CrossRef]
- El Ghoul, S.; Karoui, A.; Patel, S.; Ramani, S. The green and Brown performances of mutual fund portfolios. J. Clean. Prod. 2023, 384, 135267. [Google Scholar] [CrossRef]
- Alda, M. The environmental, social, and governance (ESG) dimension of firms in which social responsible investment (SRI) and conventional pension funds invest: The mainstream SRI and the ESG inclusion. J. Clean. Prod. 2021, 298, 126812. [Google Scholar] [CrossRef]
- Martí-Ballester, C.P. Can socially responsible investment for cleaner production improve the financial performance of Spanish pension plans? J. Clean. Prod. 2015, 106, 466–477. [Google Scholar] [CrossRef]
- Woods, C.; Urwin, R. Putting Sustainable Investing into Practice: A Governance Framework for Pension Funds. J. Bus. Ethics 2010, 92, 1–19. [Google Scholar] [CrossRef]
- Della Croce, R.; Kaminker, C.; Stewart, F. The Role of Pension Funds in Financing Green Growth Initiatives. OECD Work. Pap. Financ. Insur. Priv. Pensions 2011. [Google Scholar]
- Broadstock, D.C.; Chan, K.; Cheng, L.T.; Wang, X. The role of ESG performance during times of financial: Evidence from COVID-19 in China. Financ. Res. Lett. 2021, 38, 101716. [Google Scholar] [CrossRef]
- Eccles, R.G.; Serafeim, G. The performance frontier, Innovating for a sustainable strategy. Harv. Bus. Rev. 2013, 91, 50. [Google Scholar]
- Friede, G.; Busch, T.; Bassen, A. ESG and financial performance: Aggregated evidence for more than 2000. J. Sustain. Financ. Invest. 2015, 5, 210–233. [Google Scholar] [CrossRef]
- Becchetti, L.; Ciciretti, R.; Dalò, A.; Herzel, S. Socially responsible and conventional investment funds: Performance comparison and the global financial crisis. Appl. Econ. 2015, 47, 2541–2562. [Google Scholar] [CrossRef]
- Renneboog, L.; Ter Horst, J.; Zhang, C. Socially responsible investments: Institutional aspects, performance, and investor behavior. J. Bank. Finance. 2008, 32, 1723–1742. [Google Scholar] [CrossRef]
- Galema, R.; Plantinga, A.; Scholtens, B. The stocks at stake: Return and risk in socially responsible investment. J. Bank. Finance 2008, 32, 2646–2654. [Google Scholar] [CrossRef]
- PRI (2016). PRI Practical Guide to ESG Integration for Equity Investing. Available online: https://unglobalcompact.org/library/4621 (accessed on 30 September 2024).
- Boffo, R.; Patalano, R. ESG Investing: Practices, Progress and Challenges; OECD: Paris, France, 2020. [Google Scholar]
- OECD. Investment Governance and the Integration of Environmental, Social and Governance Factors; OECD Publishing: Paris, France, 2017. [Google Scholar]
- Friedlingstein, P.; O’Sullivan, M.; Jones, M.W.; Andrew, R.M.; Gregor, L.; Hauck, J.; Le Quéré, C.; Luijkx, I.T.; Olsen, A.; Peters, G.P.; et al. Global Carbon Budget 2022. Earth Syst. Sci. Data. 2022, 14, 4811–4900. [Google Scholar] [CrossRef]
- Eccles, R.G.; Klimenko, S. The Investor Revolution. Harv. Bus. Rev. 2019, 97, 106–116. [Google Scholar]
- Trinks, P.J.; Scholtens, B. The Opportunity Cost of Negative Screening in Socially Responsible Investing. J. Bus. Ethic 2017, 140, 193–208. [Google Scholar] [CrossRef]
- World Meteorological Organization. State of the Global Climate Report 2021; World Meteorological Organization: Geneva, Switzerland, 2022. [Google Scholar]
- WWF. Living Planet Report—2018; Higher, A., Grooten, M., Almond, R.E.A., Eds.; WWF: Gland, Switzerland, 2018. [Google Scholar]
- Riedl, A.; Smeets, P. Why Do Investors Hold Socially Responsible Mutual Funds? J. Financ. 2017, 72, 2505–2550. [Google Scholar] [CrossRef]
- Watson, W.T. Global Pension Assets Study 2022. Thinking Ahead Institute. 2022. Available online: https://www.thinkingaheadinstitute.org/research-papers/global-pension-assets-study-2022/ (accessed on 30 September 2024).
- Lachance, S.; Stroehle, J. The Origins of ESG in Pensions: Strategies and Outcomes. Wharton Pension Research Council Working Paper No. 2021-13. 2021. Available online: https://ssrn.com/abstract=3900120 (accessed on 30 September 2024).
- Urwin, R. Pension Funds as Universal Owners: Opportunity Beckons and Leadership Calls. Rotman Int. J. Pension Manag. 2011, 4, 26–34. [Google Scholar]
- Bauer, R.; Ruof, T.; Smeets, P. Get Real! Individuals prefer more sustainable investments. Rev. Financ. Stud. 2021, 34, 3976–4043. [Google Scholar] [CrossRef]
- Döttling, R.; Kim, S. Sustainability Preferences Under Stress: Evidence from COVID-19. J. Financ. Quant. Anal. 2022, 59, 435–473. [Google Scholar] [CrossRef]
- Heeb, F.; Kölbel, J.F.; Paetzold, F.; Zeisberger, S. Do Investors Care about Impact? Rev. Financ. Stud. 2023, 36, 1737–1787. [Google Scholar] [CrossRef]
- Humphrey, J.; Kogan, S.; Sagi, J.; Starks, L. The Asymmetry in Responsible Investing Preferences; Working Paper 29288; National Bureau of Economic Research: Cambridge, MA, USA, 2021. [Google Scholar]
- Renneboog, L.; Ter Horst, J.; Zhang, C. Is ethical money financially smart? Nonfinancial attributes and money flows of socially responsible investment funds. J. Financ. Intermediation 2011, 20, 562–588. [Google Scholar] [CrossRef]
- Giglio, S.; Maggiori, M.; Stroebel, J.; Tan, Z.; Utkus, S.; Xu, X. Four Facts About ESG Beliefs and Investor Portfolios. National Bureau of Economic Research, Working Paper 31114. 2023. Available online: https://www.nber.org/papers/w31114 (accessed on 30 September 2024).
- Tucker, J.J.; Scott, J. Environmental, Social, and Governance Investing: Investor Demand, the Great Wealth Transfer, and Strategies for ESG Investing. J. Financ. Serv. Prof. 2022, 74, 56–75. [Google Scholar]
- Gramitto Ricci, S.A.; Sautter, C.M. “How Retail Investors Yolo for Environmental and Social Causes”, Social Science Research Network. 2022. Available online: https://ssrn.com/abstract=4171224 (accessed on 30 September 2024).
- Puriwat, W.; Tripopsakul, S. From ESG to DESG: The Impact of DESG (Digital Environmental, Social, and Governance) on Customer Attitudes and Brand Equity. Sustainability 2022, 14, 10480. [Google Scholar] [CrossRef]
- Puriwat, W.; Tripopsakul, S. Sustainability Matters: Unravelling the Power of ESG in Fostering Brand Love and Loyalty across Generations and Product Involvements. Sustainability 2023, 15, 11578. [Google Scholar] [CrossRef]
- Haski-Leventhal, D.; Pournader, M.; McKinnon, A. The Role of Gender and Age in Business Students’ Values, CSR Attitudes, and Responsible Management Education: Learnings from the PRME International Survey. J. Bus. Ethics 2015, 146, 219–239. [Google Scholar] [CrossRef]
- Wisse, B.; van Eijbergen, R.; Rietzschel, E.F.; Scheibe, S. Catering to the Needs of an Aging Workforce: The Role of Employee Age in the Relationship Between Corporate Social Responsibility and Employee Satisfaction. J. Bus. Ethics 2018, 147, 875–888. [Google Scholar] [CrossRef]
- Shauki, E. Perceptions on corporate social responsibility: A study in capturing public confidence. Corp. Soc. Responsib. Environ. Manag. 2011, 18, 200–208. [Google Scholar] [CrossRef]
- Haber, S.H.; Kepler, J.; Larcker, D.F.; Seru, A.; Tayan, B. ESG Investing: What Shareholders Do Fund Managers Represent? Rock Center for Corporate Governance at Stanford University Working Paper Forthcoming, Stanford University Graduate School of Business Research Paper No. 4267270. 2022. Available online: https://ssrn.com/abstract=4267270 (accessed on 30 September 2024).
- Bikker, J.A.; Broeders, D.W.G.A.; Hollanders, D.A.; Ponds, E.H.M. Pension Funds’Asset allocation and Participant Age: A test of the Life-Cycle Model. J. Risk Insur. 2012, 79, 595–618. [Google Scholar] [CrossRef]
- Damodaran, A. Equity Risk Premiums: Determinants, Estimation and Implications—The 2020 Edition; NYU Stern School of Busines: New York, NY, USA, 2020. [Google Scholar]
- Henriksson, R.; Livnat, J.; Patrick, P.; Stumpp, M. Integrating ESG in Portfolio Construction. J. Portf. Manag. 2019, 45, 67–81. [Google Scholar] [CrossRef]
- Ibbotson, R.G.; Chen, P. Long-run Stock Returns: Partecipating in the real economy. Financ. Anal. J. 2003, 59, 88–90. [Google Scholar] [CrossRef]
- Petreska, B.R.; Kolemisevska-Gugulovska, T.D. A Fuzzy Rate-of-Return Based Model for Portfolio Selection and Risk Estimation. In Proceedings of the 2010 IEEE International Conference on Systems, Man and Cybernetics, Istanbul, Turkey, 10–13 October 2010; pp. 1871–1877. [Google Scholar]
- Ang, V. Financial interaction analysis using best-fitted probability distribution. In Indicators to Support Monetary and Financial Stability Analysis: Data Sources and Statistical Methodologies; Settlements, B.F., Ed.; Bank for International Settlements: Besel, Switzerland, 2015; Volume 39, pp. 39–54. [Google Scholar]
- Efron, B. Bootstrap Methods: Another Look at the Jacknife. Ann. Stat. 1979, 7, 1–26. [Google Scholar] [CrossRef]
- Efron, B.; Tibshirani, R.J. An Introduction to the Bootstrap; CRC Press LLC: Boca Raton, FL, USA, 1998. [Google Scholar]
- Lancaster, T. A Note on Bootstraps and Robustness. Centre for Microdata Methods and Practice (cemmap) Working Paper, No. CWP04/06. 2006. Available online: https://www.econstor.eu/handle/10419/79328 (accessed on 30 September 2024).
- Anderson, T.; Darling, D. A test of goodness of Fit. J. Am. Stat. Assoc. 1954, 49, 730–737. [Google Scholar] [CrossRef]
- Razali, N.; Wah, Y. Power comparisons of Shapiro-Wilk, Kolomogorow-Smirnov, Lillierfors and Anderson-Darling tests. J. Stat. Model. Anal. 2011, 52, 21–33. [Google Scholar]
- Shapiro, S.; Wilk, M. An analysis of variance test for normality. Biometrika 1965, 52, 591–611. [Google Scholar] [CrossRef]
- Debarshi, D. Estimation of the Parameters of Skew Normal Distribution by Approximating the Ratio of the Normal Density and Distribution Functions; University of California: Riverside, CA, USA, 2010. [Google Scholar]
- Azzalini, A.; Capitanio, A. Statistical applications of the multivariate skew-normal distribution. J. R. Stat. Soc. 1999, 61, 579–602. [Google Scholar] [CrossRef]
- Kalayci, C.B.; Ertenlice, O.; Anil Akbay, M. A comprehensive review of deterministic models and applications for mean-variance portfolio optimization. Expert Syst. Appl. 2019, 125, 345–368. [Google Scholar] [CrossRef]
- O’Donoghue, T.; Somerville, J. Modelling Risk Aversion in Economics. J. Econ. Perspect. 2018, 32, 91–114. [Google Scholar] [CrossRef]
- Antwi, J.; Naanwaab, C.B. Generational Differences, Risk Tolerance, and Ownership of Financial Securities: Evidence from the United States. Int. J. Financ. Stud. 2022, 10, 35. [Google Scholar] [CrossRef]
- Clark, G.L.; Strauss, K. Individual pension-related risk propensities: The effects of socio- demographic characteristics and a spousal pension entitlement on risk attitudes. Ageing Soc. 2008, 28, 847–874. [Google Scholar] [CrossRef]
- Yao, R.; Sharpe, D.L.; Wang, F. Decomposing the age effect on risk tolerance. J. Soc.-Econ. 2011, 40, 879–887. [Google Scholar] [CrossRef]
- Jaideep Oberoi, S.; Aniketh, P.; Pradip, T. A graphical model approach to simulating economic variables over long horizons. Ann. Actuar. Sci. 2020, 4, 20–41. [Google Scholar] [CrossRef]
- Yoon, K.P.; Kim, G. Portfolio Selection by the Axiom of Choice: Post Mean-Variance Analysis. Int. J. Oper. Quant. Manag. 2020, 26, 303–318. [Google Scholar] [CrossRef]
- Amir, A.-Z.; Serafeim, G. Why and how investors use ESG information: Evidence from a global survey. Financ. Anal. J. 2018, 74, 87–103. [Google Scholar] [CrossRef]
- OECD. OECD Business and Finance Outlook 2020: Sustainable and Resilient Finance; OECD Publishing: Paris, France, 2020. [Google Scholar]
- Park, S.R.; Jae Young, J. The Impact of ESG Management on Investment Decision: Institutional Investors’ Perceptions of Country-Specific ESG Criteria. Int. J. Finacial Stud. 2021, 9, 48. [Google Scholar] [CrossRef]
- Bender, J.; Bender, B.; Todd, A.; He, C.; Lester, A.; Sun, X. A Blueprint for Integrating ESG into Equity Portfolios. J. Investig. Manag. 2018, 16, 87–103. [Google Scholar]
- Zoltan, N.; Lee, L.-E.; Giese, G. ESG Ratings: How the Weighing Scheme Affected Performance. Available online: https://www.msci.com/www/blog-posts/esg-ratings-how-the-weighting/01944696204 (accessed on 29 June 2020).

Disclaimer/Publisher’s Note: The statements, opinions and data contained in all publications are solely those of the individual author(s) and contributor(s) and not of MDPI and/or the editor(s). MDPI and/or the editor(s) disclaim responsibility for any injury to people or property resulting from any ideas, methods, instructions or products referred to in the content. |
© 2024 by the authors. Licensee MDPI, Basel, Switzerland. This article is an open access article distributed under the terms and conditions of the Creative Commons Attribution (CC BY) license (https://creativecommons.org/licenses/by/4.0/).