Article

Grill and Chill: A Comprehensive Analysis of the Environmental Impacts of Private Household Barbecuing in Germany

by
Shaoran Geng
1,
Kevin Christopher Dorling
1,*,
Tobias Manuel Prenzel
2 and
Stefan Albrecht
2
1
Institute for Acoustics and Building Physics, University of Stuttgart, 70569 Stuttgart, Germany
2
Fraunhofer Institute for Building Physics, 70569 Stuttgart, Germany
*
Author to whom correspondence should be addressed.
Sustainability 2024, 16(3), 1041; https://doi.org/10.3390/su16031041
Submission received: 8 September 2023 / Revised: 20 January 2024 / Accepted: 23 January 2024 / Published: 25 January 2024

Abstract

:
Rising environmental consciousness has prompted increased scrutiny of the environmental impact of everyday activities, such as barbecuing—a popular summertime activity in Germany. This study aimed to explore the environmental impacts of three grilling techniques, charcoal (including reusable types such as swivel, round, and kettle grills, as well as disposable charcoal grills), gas, and electric grills, utilizing a life cycle assessment (LCA) approach including the manufacturing of grills, consumption of energy sources and grilling ingredients, as well as the end-of-life of the grills. Five impact categories were considered: global warming potential (GWP), acidification potential (AP), eutrophication potential (EP), abiotic depletion potential fossil (ADP), and land use (LU) according to the CML2016 and ReCiPe 2016 methodology. This study found that a barbeque event for four people results in GWP, AP, EP, ADP, and LU values ranging from 18 to 20 kg CO2-eq., 174 to 179 g SO2-eq., 166 to 167 g PO4-eq., 102 to 138 MJ, and 36 to 38 m2 annual crop-eq., respectively, across different types of grills. Furthermore, the ingredients proved to be the most significant contributor, surpassing 70% in all impact categories. Among the three types of grills, the electric grill emerged as the most environmentally friendly, while the disposable grill had the greatest environmental impact across the majority of categories. Lastly, the environmental impacts of varying consumer behaviors were evaluated to potentially assist consumers in adopting more sustainable grilling practices.

1. Introduction

Barbecuing is a cherished activity in Germany, with annual grill sales steadily increasing [1]. However, as public environmental consciousness grows, concerns regarding the potential negative environmental impacts of barbecuing have surfaced, spurring a trend toward more environmentally friendly barbecuing alternatives. Despite this, existing research has not yet investigated this issue in detail.
Numerous studies have been conducted on the LCA of household appliances within the European Union (EU). The European Commission’s Joint Research Centre (JRC) has scrutinized the environmental impacts of EU citizens’ consumption behaviors related to household appliances, such as televisions, washing machines, dishwashers, refrigerators, and laptops. They found that these appliances have a significant influence on the consumption footprint of EU citizens [2]. There are also studies focused on the LCA of individual types of appliances, including stovetops [3], ovens [4], televisions [5], air conditioners [6], and refrigerators [7]. Nonetheless, there is a noticeable lack of research focused on the LCA of grilling devices. Furthermore, grill sales in Germany in 2020 nearly equaled those of televisions, indicating that grilling devices are a prevalent household item worthy of investigation [1,8]. While some researchers have compared the greenhouse gas emissions of various energy carriers used for barbecuing, such as charcoal, liquefied gas, and electricity [9,10], other impact categories have not been considered.
In 2011, TÜV Rheinland compared the environmental impacts of various grilling techniques, finding that an average barbecue of two families, with eight people in total, releases between 17.5 and 18 kg of CO2-eq. greenhouse gases, with the grilled food itself being the main cause of these emissions [11]. However, this study did not provide a detailed description of the methodology used for the LCA of grilling, nor did it propose any specific strategies or measures to mitigate the environmental impacts.
These gaps in existing research underscore the importance of a comprehensive understanding of the environmental impacts associated with barbecuing, emphasizing clearer and more expansive boundary conditions and assumptions. The current body of research lacks comprehensive LCA on the environmental impacts of grilling devices. Additionally, while there are studies on the environmental impacts of the fuels used in barbecuing, they mainly concentrate on global warming potential, with less attention given to other impact categories. Our study aims to fill these research gaps by investigating not only grilling devices but also including a detailed examination of the entire grilling process. This includes evaluating the environmental impacts of grill devices, energy sources, and grilling ingredients, which we refer to as “grill sectors”. By analyzing these sectors, we aim to provide a more comprehensive perspective of barbecuing’s environmental footprint. Furthermore, our study delves into the influence of varied consumer behaviors on these outcomes and describes a detailed methodological approach for the LCA of grilling, covering aspects such as the assumptions of the evaluation process, the sources of the data used, and the descriptions of the system boundaries.
Therefore, this paper aims to explore the environmental impacts of various grilling devices, energy sources, and ingredients through a robust LCA approach. This can help consumers make environmentally conscious barbecue decisions and guide policymakers and industry stakeholders in implementing sustainable practices. Furthermore, this study seeks to encourage the development of eco-friendly products within the barbecuing industry.

2. Materials and Methods

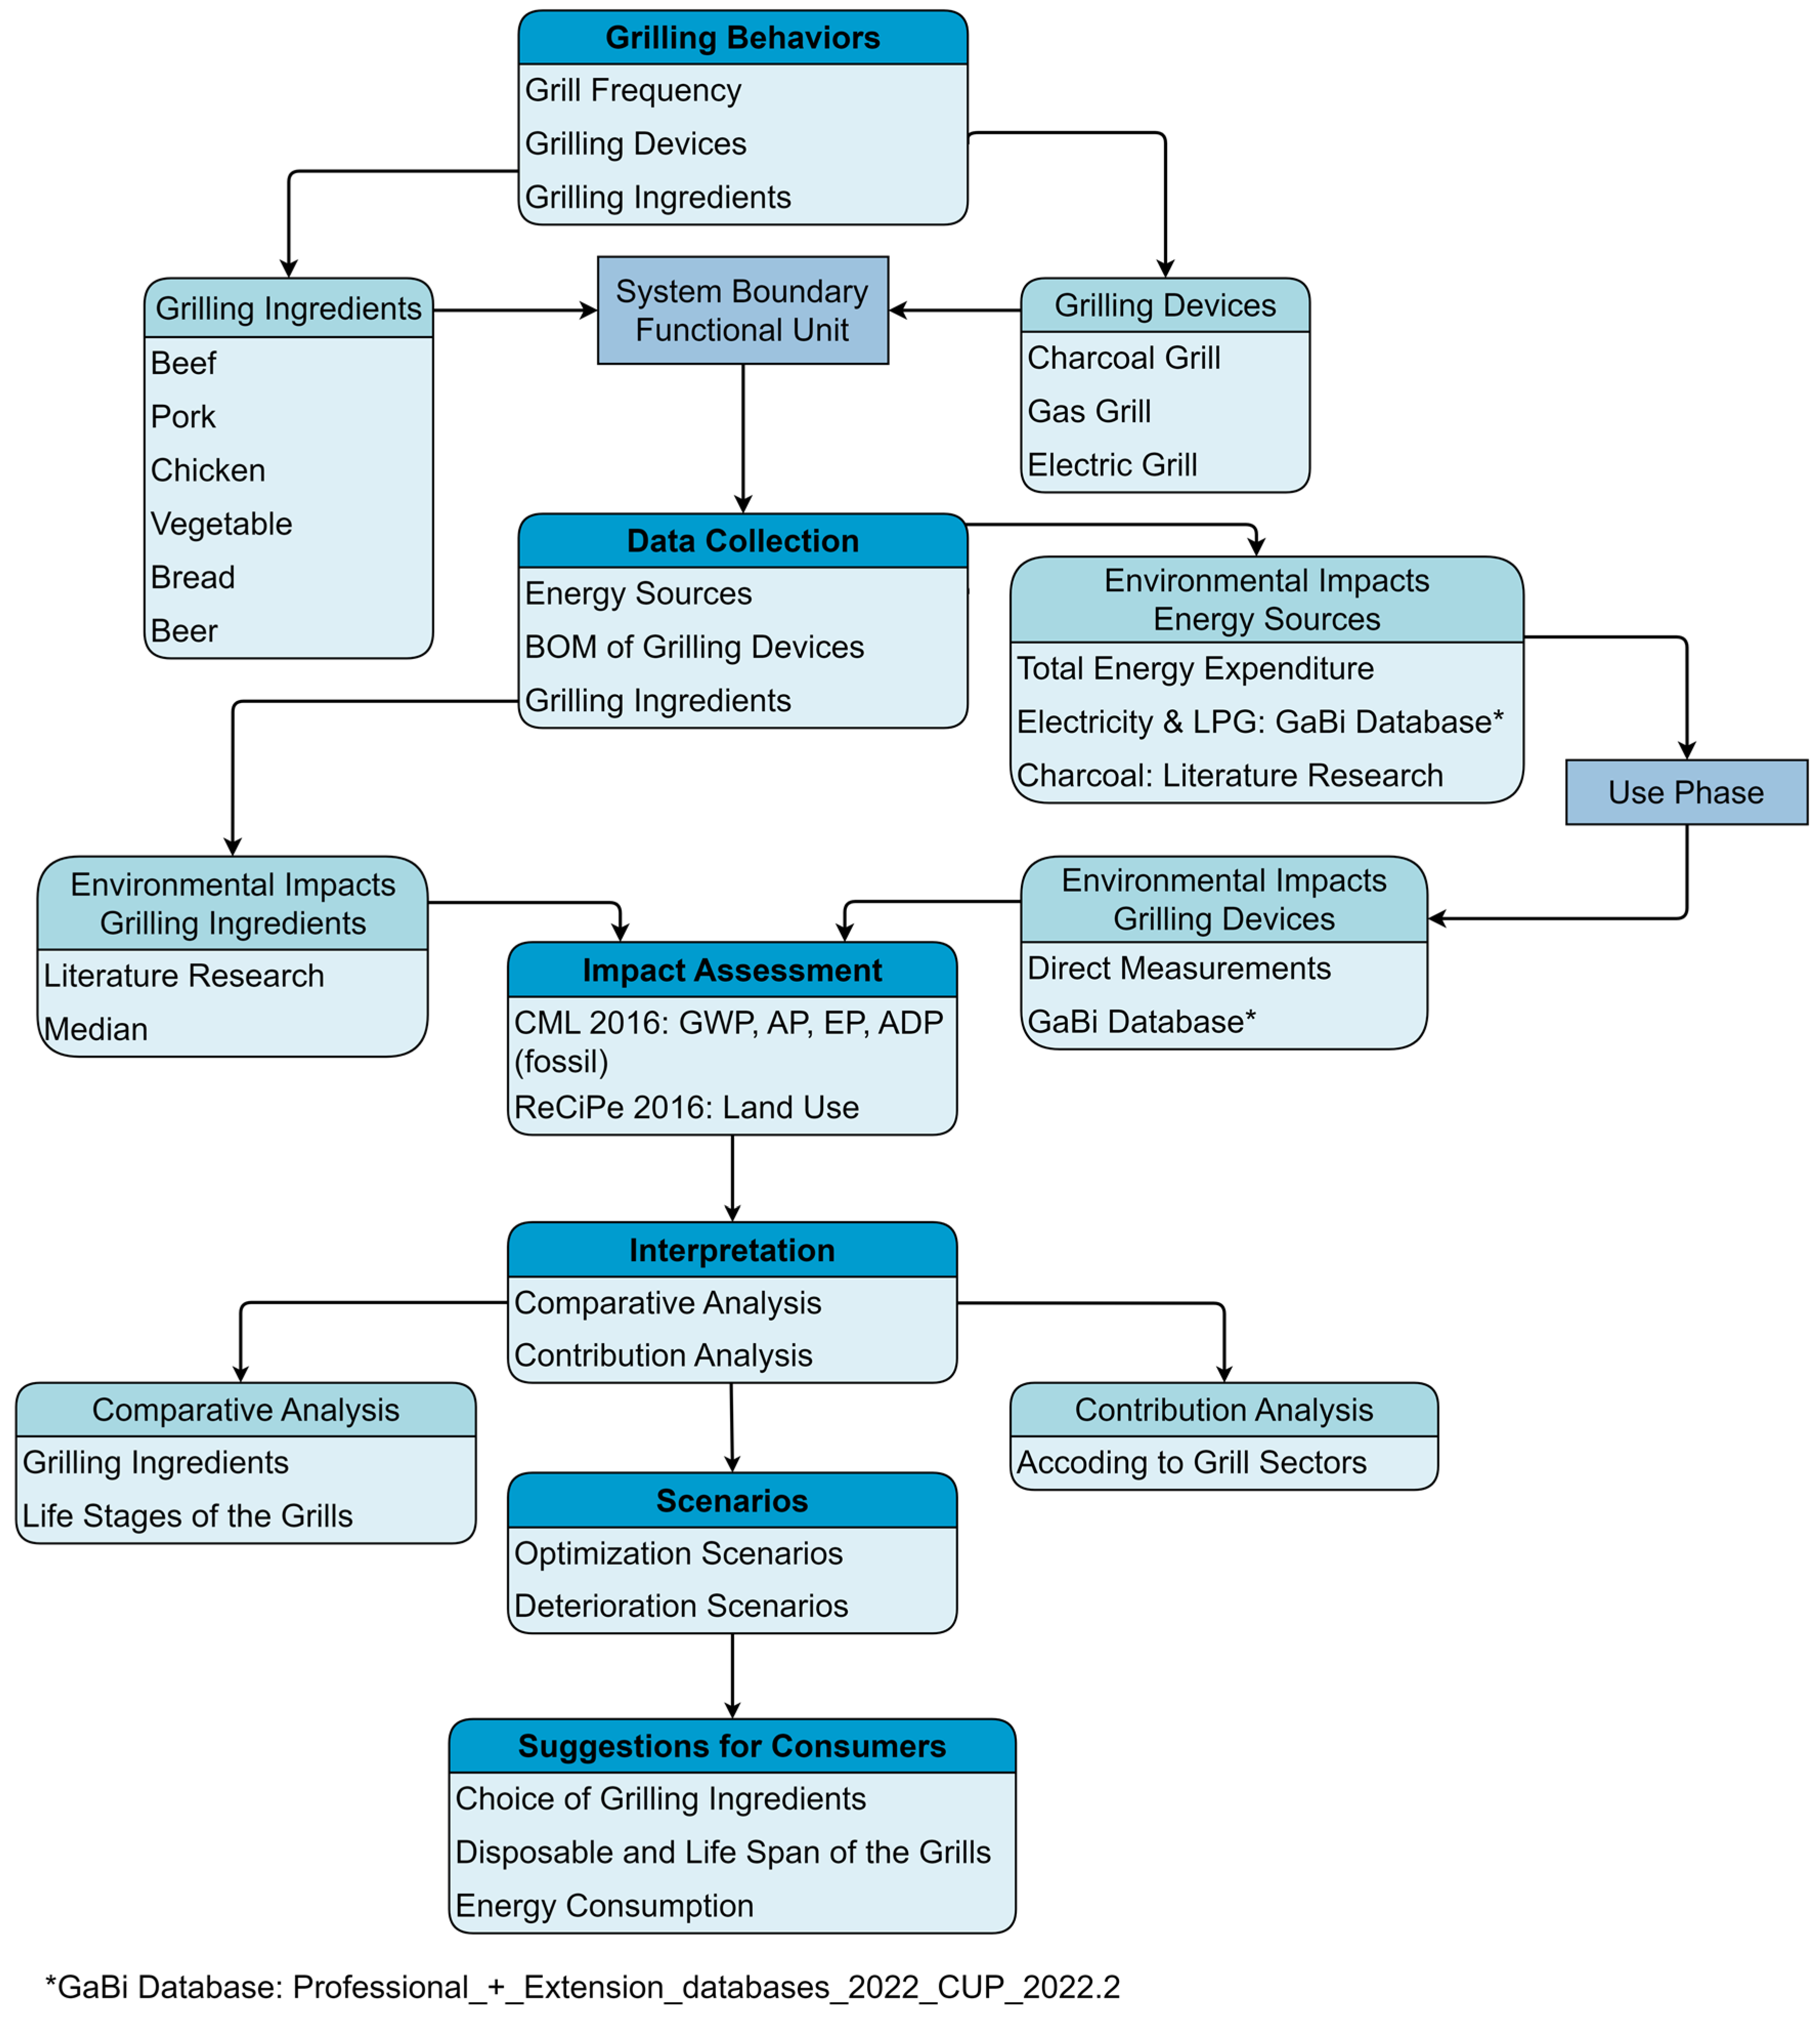
2.1. Research Framework

At the outset of this study, German barbecuing behaviors were analyzed, including the average number of barbeque events per year, the most popular grilling devices, and the most popular grilling ingredients. Subsequently, three grilling devices (charcoal grills, electric grills, and gas grills), along with their respective consumed energy sources (charcoal, electricity, liquefied petroleum gas (LPG)) and five grilling ingredients (beef, pork, chicken, vegetables, and bread), as well as beer as the most popular drink for barbecuing [12], were chosen for the analysis. The functional unit was therefore established based on the lifespan of grilling devices, grilling frequency, quantities of ingredients used, and energy consumption per event.
After that, the relevant data were collected. Initially, disassembled grilling devices were subjected to direct measurements to collect material data for the grilling devices. The bill of materials (BOM) data were then entered into LCA software to calculate the environmental impacts of the grilling devices [13,14]. As the applied background database only contains information on electricity and LPG, a systematic literature review was carried out to identify the environmental impacts of charcoal. The environmental impacts of each energy source were then considered in the use phase of the grilling devices. Likewise, literature sources were utilized to collect data on the environmental impacts of the chosen grilling ingredients, which were then summarized in an Excel file. The environmental impacts of each grilling ingredient were then determined using the median of these data.
Following data collection, a two-phase analysis was conducted. Initially, a comparative analysis was conducted on the environmental impacts of individual components. This allowed for an independent assessment of the environmental impacts associated with various types of ingredients or grilling devices at different stages of their life. In the second phase, a contribution analysis was undertaken to assess the respective roles of different grill sectors in the overall environmental impacts. This involved considering the contributions of grilling devices, energy consumption, and grilling ingredients to the environmental impacts of a single barbeque event.
Building upon these analyses, multiple scenarios were devised, incorporating a range of both less consuming and more consuming scenarios. The effects of these scenarios on the environmental impact was then assessed, elucidating the relationship between consumer behavior and the environmental footprint of barbecuing practices. Ultimately, this study provides recommendations for environmentally friendly barbecuing behaviors. The research process of the article described above is shown in Figure 1.

2.2. LCA

The concept of a life cycle assessment was conceived in the 1960s in response to escalating environmental concerns [15]. Over time, tools like GaBi and SimaPro evolved to aid in LCA analyses [16,17]. To ensure consistency and comparability in LCA studies, ISO 14040 was introduced as the initial standard in 1997 [18]. After updates and amendments, the currently valid version is ISO 14040:2006/Amd 1:2020 [19]. Indicators such as carbon, water, and material footprints have also been standardized [20,21,22]. When evaluating data and models, both top-down and bottom-up approaches are utilized [23,24]. Consequently, LCA has developed into an array of methods and indicators, contributing to informed decision-making in sustainable development strategies.
As detailed in ISO 14040 [19], an LCA is divided into four main phases: goal and scope definition, inventory analysis, impact assessment, and interpretation. Each of these phases will be discussed further in the following sections.

2.2.1. Goal and Scope

This study aimed to investigate the environmental impacts of household barbecuing in Germany. By analyzing and comparing the environmental impacts of three grilling devices (charcoal grill, electric grill, gas grill), three energy sources (charcoal, electricity, LPG) and six ingredients (beef, pork, chicken, bread, vegetables, and beer), hotspots were identified. Indeed, while alternative grilling methods like wood-burning, pellet, or solar grills exist, the three selected types remain the most popular in Germany, with charcoal grills alone accounting for a significant 54% of the market volume [25]. For vegetables, not all varieties were investigated for their environmental impacts in the scope of this study. Instead, based on ref. [26] and due to the fact that the environmental impact of lettuce is the most widely researched among all vegetable categories, lettuce was selected as a representative example. It is important to note that this study does not account for the potential credit effect of not eating at home when barbecuing.
This study also provides suggestions on how to reduce the environmental impacts of barbecuing activities based on a vast set of investigated scenarios. Before conducting an LCA related to barbecuing activities, it was necessary to determine the functional unit and the scope of investigation for this study in the first place.

Functional Unit

The functional unit of this research was determined by analyzing studies on German barbecuing and collecting relevant statistical data. It represents a typical barbeque event for four individuals, considering the grilling device, grilling ingredients, and energy sources. Therefore, a “barbecuing model” was developed to assist in defining the functional unit. In creating this “barbecuing model”, the frequency of barbecuing, energy consumption during barbecuing, and the most popular grilling devices and ingredients should be considered.
It is evident that not all environmental impacts associated with the production of a grill device should be included in the functional unit of this study, which is a single barbeque event involving four individuals. Therefore, it was hypothesized that the environmental impacts would be distributed based on the number of uses. To this end, three aspects were examined: the most popular type of grill [25], the frequency of barbecuing [27], and the lifespan of a grill [28]. This study selected the charcoal grill, electric grill, and gas grill for investigation. The environmental impacts during production are distributed over 75 usage cases, assuming a use of 15 times per year over 5 years based on the lifetime reported in the literature. This seems to be a conservative assumption, as many devices are used significantly longer in the authors’ experience.
The energy consumption for barbecuing is influenced by various factors, including the grilling time, the efficiency of the appliances, the barbecuing habits, and the quality of the fuel [9]. The energy requirement for a barbecue with four people in the scope of this study is defined based on a literature screening as either 750 g of charcoal, 3.3 kWh of electricity, or 525 g of LPG, depending on the type of grill device [9]. For gas barbecues, the use of gas bottles was also considered. The specific assumptions and parameters, such as barbecue duration, are described in detail in Section 2.3.
The types and quantities of grilling ingredients hold significant importance in the definition of a functional unit. Assumptions regarding the consumption of grilling ingredients, as reported in refs. [29,30,31,32,33], are detailed in Table 1. It is evident that these data reflect a national average and do not immediately demonstrate the strong variation resulting from different eating habits, such as halal, vegetarian, or vegan. In summary, the functional unit of this study consisted of 1/75 of a grilling device, depending on the type of device, consuming 750 g of charcoal, 3.3 kWh of electricity, or 525 g of LPG, as well as 1.880 g of grilling ingredients and 4 L of beer. For easier readability, beer will be listed with the “grilling ingredients” hereinafter.

System Boundaries

The definition of system boundaries plays a pivotal role in a LCA. It determines the scope of the evaluation by clarifying which environmental impacts and life cycle stages are included in the analysis and which are excluded. The system boundary for grilling devices is quite expansive, encompassing the entire life cycle process from raw material extraction to waste treatment. However, certain processes have been excluded to ensure a consistent evaluation process and reduce the complexity of data collection. The neglected processes especially included the transportation of raw materials within the countries of production for the grilling devices. This decision was made partly due to the unavailability of specific transportation data. Additionally, we assessed the environmental impact of 1000 km of land transportation and found its contribution to the overall environmental impact of barbecuing activities to be less than 0.1%. Therefore, this exclusion aligns with the cut-off criteria requirements for our study. During the use phase, neither the gaseous emissions resulting from meat grilling (emissions from fuel combustion are considered) nor the maintenance of the devices were incorporated into the evaluation process.
While no measurement of the specific composition of the gaseous emissions was included in this study, literature screening was conducted on the potential environmental impacts. According to the literature, the environmental impacts associated with these gaseous components, specifically particulate matter (PM) and polycyclic aromatic hydrocarbons (PAH), are either minimal or lack sufficient data for a comprehensive analysis [34]. Based on the emissions from grills under different boundary conditions reported by Aleysa et al. [35], screening was conducted for the environmental impacts. While for ADP and LU, the definition of the impact categories excludes impacts for gaseous emissions, the reported chemicals were reviewed regarding their GWP, AP, and EP in the selected database. Since none of the emitted chemicals has a respective characterization factor, they can be deemed negligible for the scope of this study.
In the end-of-life (EoL) phase, specific EoL models were not available for all the materials in the GaBi Database. For plastics and paper packaging, German EoL models were accessible. However, for metals, only the environmental benefits of recycling, as opposed to producing from primary sources, were considered. The investigation framework for the grilling devices can be seen in Figure 2.
Data regarding the environmental impacts of the grilling ingredients were extracted from the existing literature. Typically, these studies considered processes from the agricultural stage through processing and packaging, essentially adopting a cradle-to-gate approach. A few studies also incorporated aspects of transport, distribution, and retail into their considerations. However, it was determined that the environmental impacts from these stages were relatively minor compared to other life stages [36,37].

2.2.2. Life Cycle Inventory

This study measured the bill of material (BOM) of an electric grill, a gas grill, and four charcoal grills (a swivel grill, a round grill, a kettle grill, and a disposable charcoal grill). The grills were disassembled and weighed to an accuracy of 1 g using a kitchen scale based on the item numbers in the assembly instructions. Relevant data were recorded in individual tables, including the item number, name and quantity of components, weight, and material. However, the manufacturers of the grills were not involved, and they did not review the assumed life cycle inventory for this study. The results for all the grilling devices examined can be found in Appendix A. The grilling devices investigated are shown in Figure 3. While the different sizes of the grates are considered negligible for all the reusable grills, it is assumed that two disposable grills are required to achieve the functional unit of one barbecue event for four people. This is because the chosen disposable grills had dimensions of only 30 cm × 23 cm. In contrast to other types of grills, the grilling surface area of these disposable grills is relatively small and suitable for only two people. Therefore, the environmental impacts associated with using disposable grills account for the use of two grill units.
Due to the lack of data on the environmental impacts of charcoal production in the background database, a literature review was conducted. Data on the environmental impacts of charcoal were obtained from an Italian study examining the effects of major household cooking systems on the environment [38]. The results of the environmental impacts of charcoal, as sourced from the study by Ci-mini et al. and adjusted for the functional unit translation, can be found in Table 2. The environmental impacts of charcoal were considered during the use phase of the grilling device. The quantity of charcoal consumed for a single grilling activity intended for four people is detailed in Section 2.2.1.
The information on the environmental impacts of the grilling ingredients was taken from the literature and is listed in detail together with the data sources in Appendix B.

2.2.3. Impact Assessment

In this study, the environmental impacts of the grilling devices were analyzed using the LCA for Experts software [13,14]. Two methodological approaches were employed to assess five distinct impact categories:
  • CML2001-Aug. 2016 [39]: Global warming potential in 100 years (GWP in kg CO2-eq.), acidification potential (AP in kg SO2-eq.), eutrophication potential (EP in kg PO4-eq.), abiotic depletion potential fossil (ADP fossil in MJ).
  • ReCiPe 2016 v1.1 Midpoint (H) [40]: Land use (LU in m2 annual crop-eq.).
The reason for choosing these five impact categories was that they were the most extensively examined in studies on the environmental impact of foods. Other categories, such as human toxicity and water scarcity, were not as widely covered. Equally, the selection of two different calculation methods is based on the literature used for the assessment of grilling ingredients by other authors.

2.3. Scenarios

The creation, analysis, and comparison of different scenarios were important steps in this study. First, a reference scenario was created, which included information about the grilling devices, energy consumption, composition of grilling ingredients, and waste management. Based on these parameters, new scenarios were conceived to examine the environmental consequences of changes in consumer behavior. These alterations included variations in the weight and lifespan of the grilling devices, waste management practices, energy consumption, and preferences for grilling ingredients. By comparing the new scenarios to the reference scenario, the environmental impacts of various consumer behaviors could be evaluated. This analytical approach aimed to furnish suggestions and guidelines for minimizing the environmental footprint of barbecuing activities, allowing for decisions to be made that promote sensible and responsible behaviors.

2.3.1. Reference Scenario

In the reference scenario, the grilling device has a service life of five years, as described before. The electricity consumption for the barbecuing process, where applicable, is based on the German grid mix. According to previous studies, 97.4% of the materials are assumed to be recycled after use [28], and the use of recycled metals in production is estimated to reduce environmental impacts by 45% compared to primary production, as indicated in refs. [41,42,43]. The consumption during the barbecuing process varies depending on the type of grill, amounting to 750 g of charcoal, 3.3 kWh of electricity, or 560 g of LPG [9]. In addition, each individual consumes an average of 105 g of beef, 120 g of pork, 75 g of poultry, 100 g of vegetables, 70 g of bread, and 1 L of beer during a barbeque event. Moreover, food wastage constitutes 20% of the total [44,45].

2.3.2. Future Scenarios

Nine scenarios were formulated in this study, including three environmentally unfavorable scenarios (S2–S4) and four favorable scenarios (S5–S8). These were further consolidated into a worst-case scenario and a best-case scenario, representing the complete range of possible outcomes. An overview of all the scenarios is shown in Table 3.
Consumer behaviors were considered in three distinct aspects. In terms of grilling devices, the environmental impacts of different consumer behaviors during barbecuing were compared by varying the grill’s lifespan and weight (S2, S5). Additionally, energy consumption varied with consumer habits (S3, S6). In terms of grilling ingredients, consumers might produce more food waste (S4) or avoid food waste (S8). The environmental impacts were also evaluated for changes in dietary preferences, such as reducing beef consumption (S7). The other parameters of the designed future scenarios were kept the same as in the reference scenario, as already mentioned in Section 2.3.1, and thus are not described again in Table 3.
In relation to the future scenarios that were established, it was anticipated that Scenarios 2 and 5, which focused on grilling devices, would exhibit inverse yet similarly quantifiable environmental impacts. Scenario 2, characterized by heavy grills with shorter lifespans, was expected to increase environmental impacts. Conversely, Scenario 5, featuring lightweight grills with longer lifespans, was likely to result in a commensurate reduction of impacts. Moreover, it was hypothesized that among the three grilling sectors—grilling devices, energy sources, and grilling ingredients—the grilling ingredients sector would exert the most significant influence on the overall environmental impacts of barbecuing activities.

3. Results

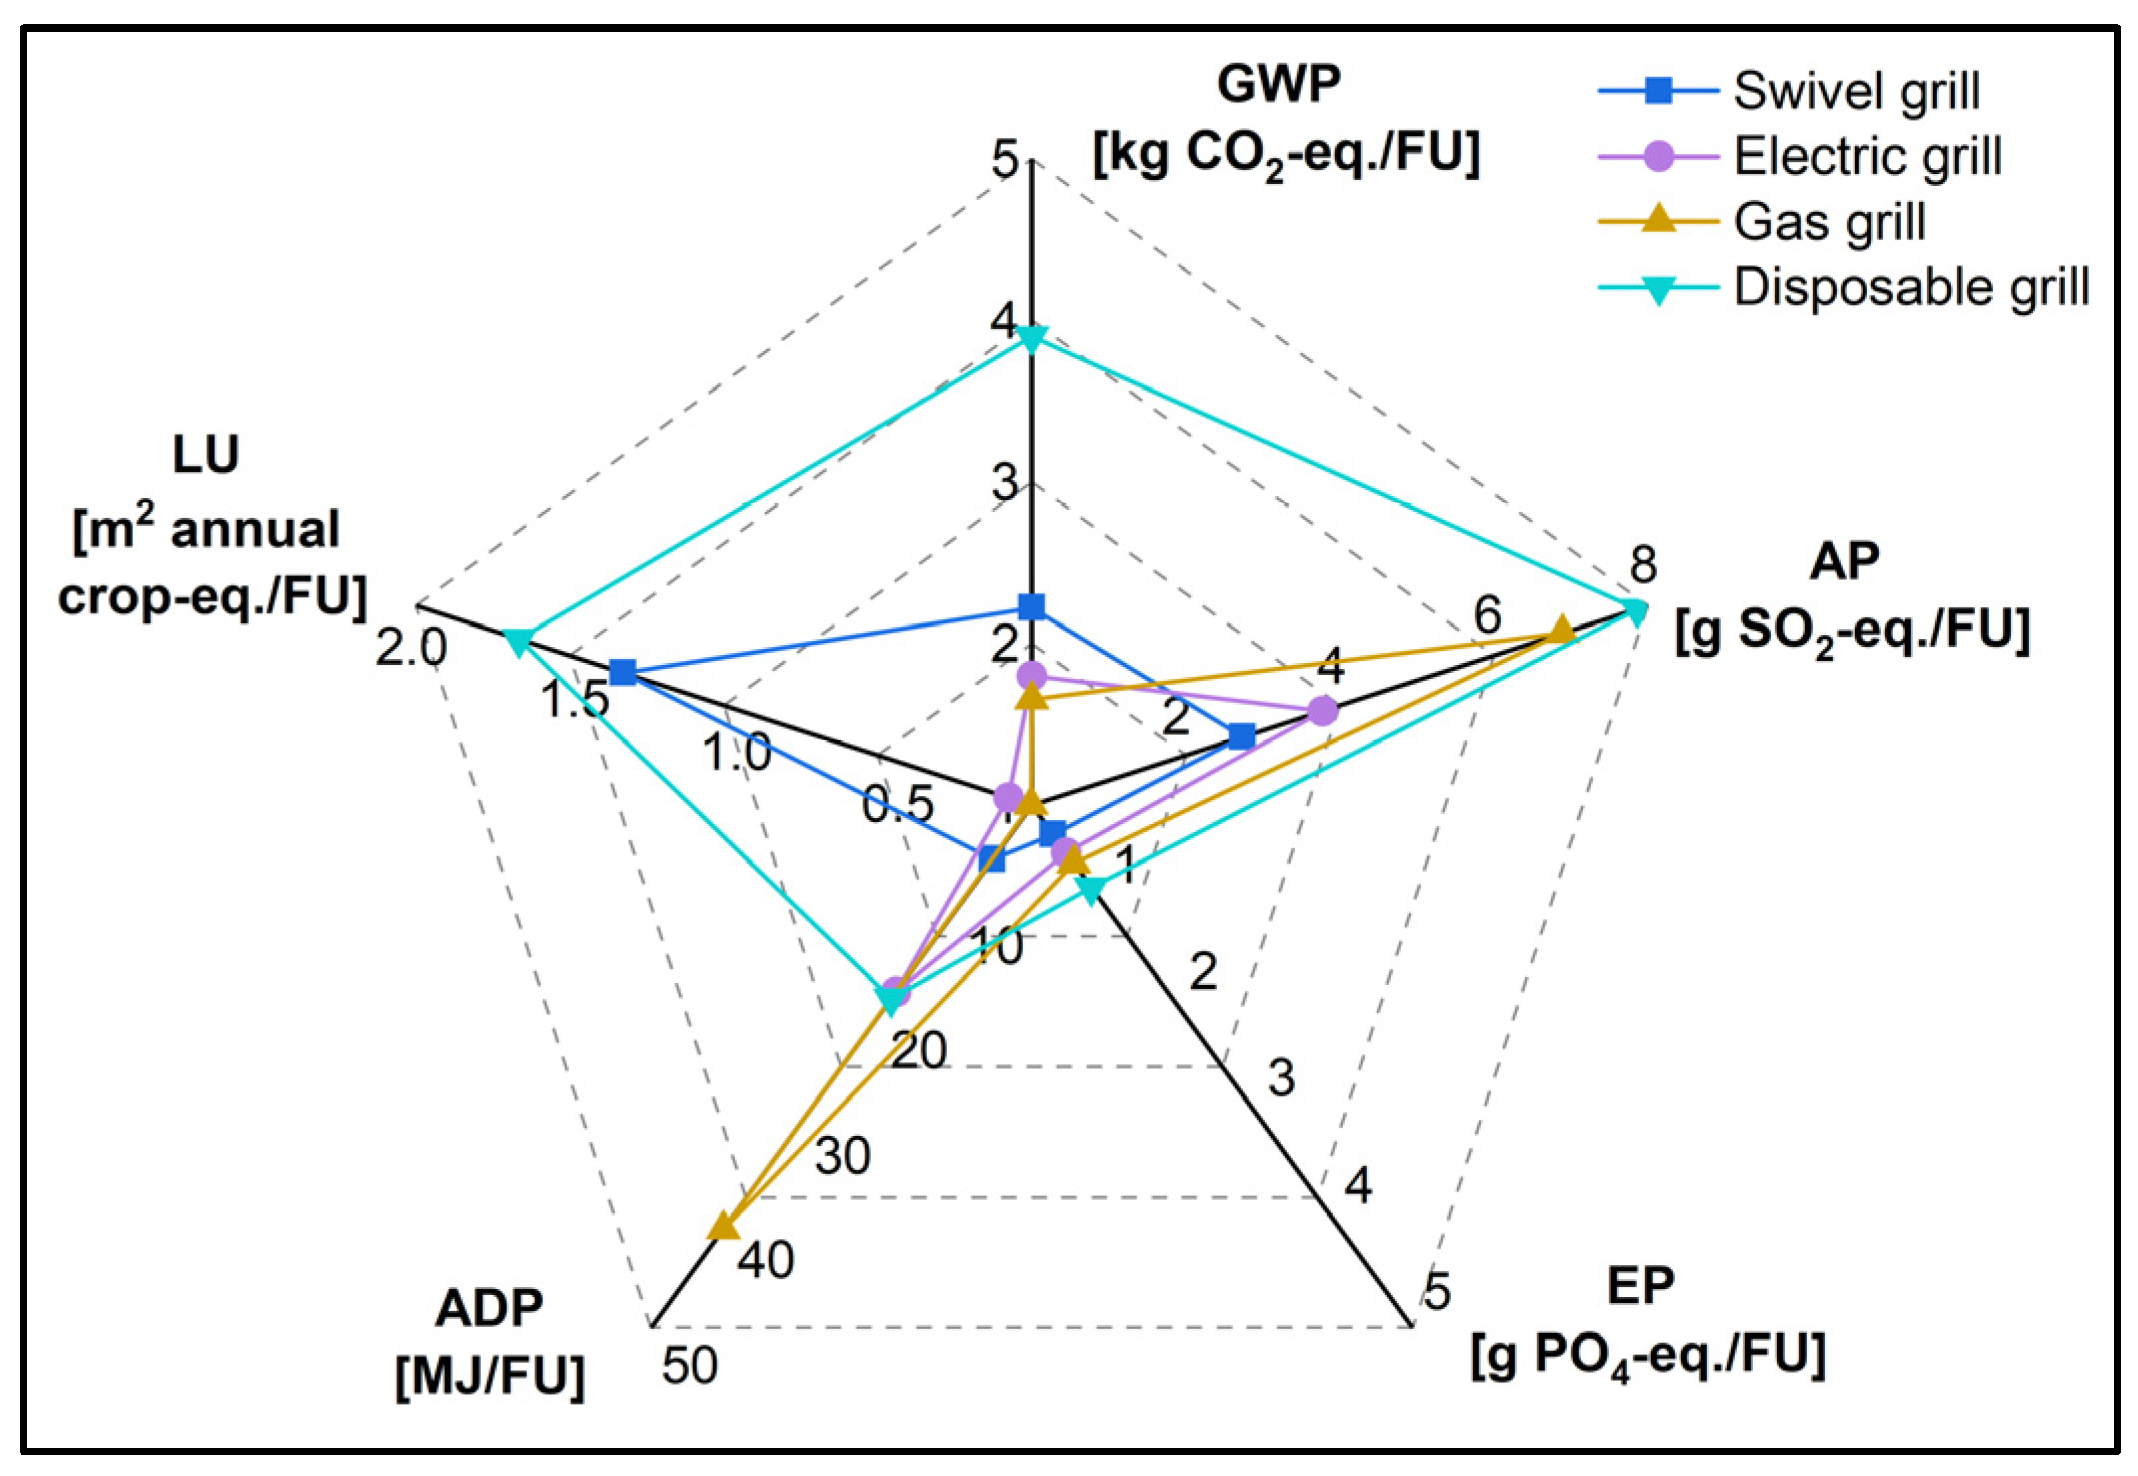
3.1. Emviromental Impacts of Grilling Devices

This study used the BOM for four charcoal grills (round grill, kettle grill, swivel grill, and disposable charcoal grill), as well as an electric grill and a gas grill, to assess their environmental impacts. These impacts are summarized and compared in Table 4.
Among the charcoal grills, the disposable charcoal grill exhibited the largest environmental impacts, with its values being at least 20% higher in all the categories compared to the other charcoal grills. Notably, its ADP was 3.5 times higher than that of the other grills. In contrast, the round grill demonstrated the smallest environmental impacts, attributed to its lower weight and reduced material consumption. For the three larger and reusable charcoal grills (swivel, round, and kettle), the differences in environmental impacts across the various categories were within a 30% range, despite their notable differences in weight and material composition. This is why, in Section 4.2, the swivel grill was selected to represent reusable charcoal grills. The most significant disparities were seen in AP and ADP, suggesting a substantial contribution from the material production process to these categories. Furthermore, only minor differences were observed in GWP and LU among these grills, indicating a significant impact from the use phase, particularly charcoal combustion.
The electric and gas grills displayed comparatively smaller GWP and LU impacts than the charcoal grills. Specifically, their GWP was 18–25% lower, and their LU was 88–93% lower than that of the swivel grill, which represents reusable charcoal grills. Notably, the gas grill exhibited the highest ADP among all grill types. For a more detailed discussion and comprehensive analysis of these differences, please refer to Section 4.2.
The GWP, AP, EP, ADP, and LU values for a single barbeque event with an electric grill and a gas grill are, respectively, 1.80 and 1.60 kg CO2-eq./FU, 3.83 and 6.91 g SO2-eq./FU, 0.54 and 0.64 g PO4-eq./FU, 17.88 and 40.52 MJ/FU, and 0.17 and 0.1 m2 annual crop-eq./FU. A comparison and analysis of the different grilling devices is provided in Section 4.2.

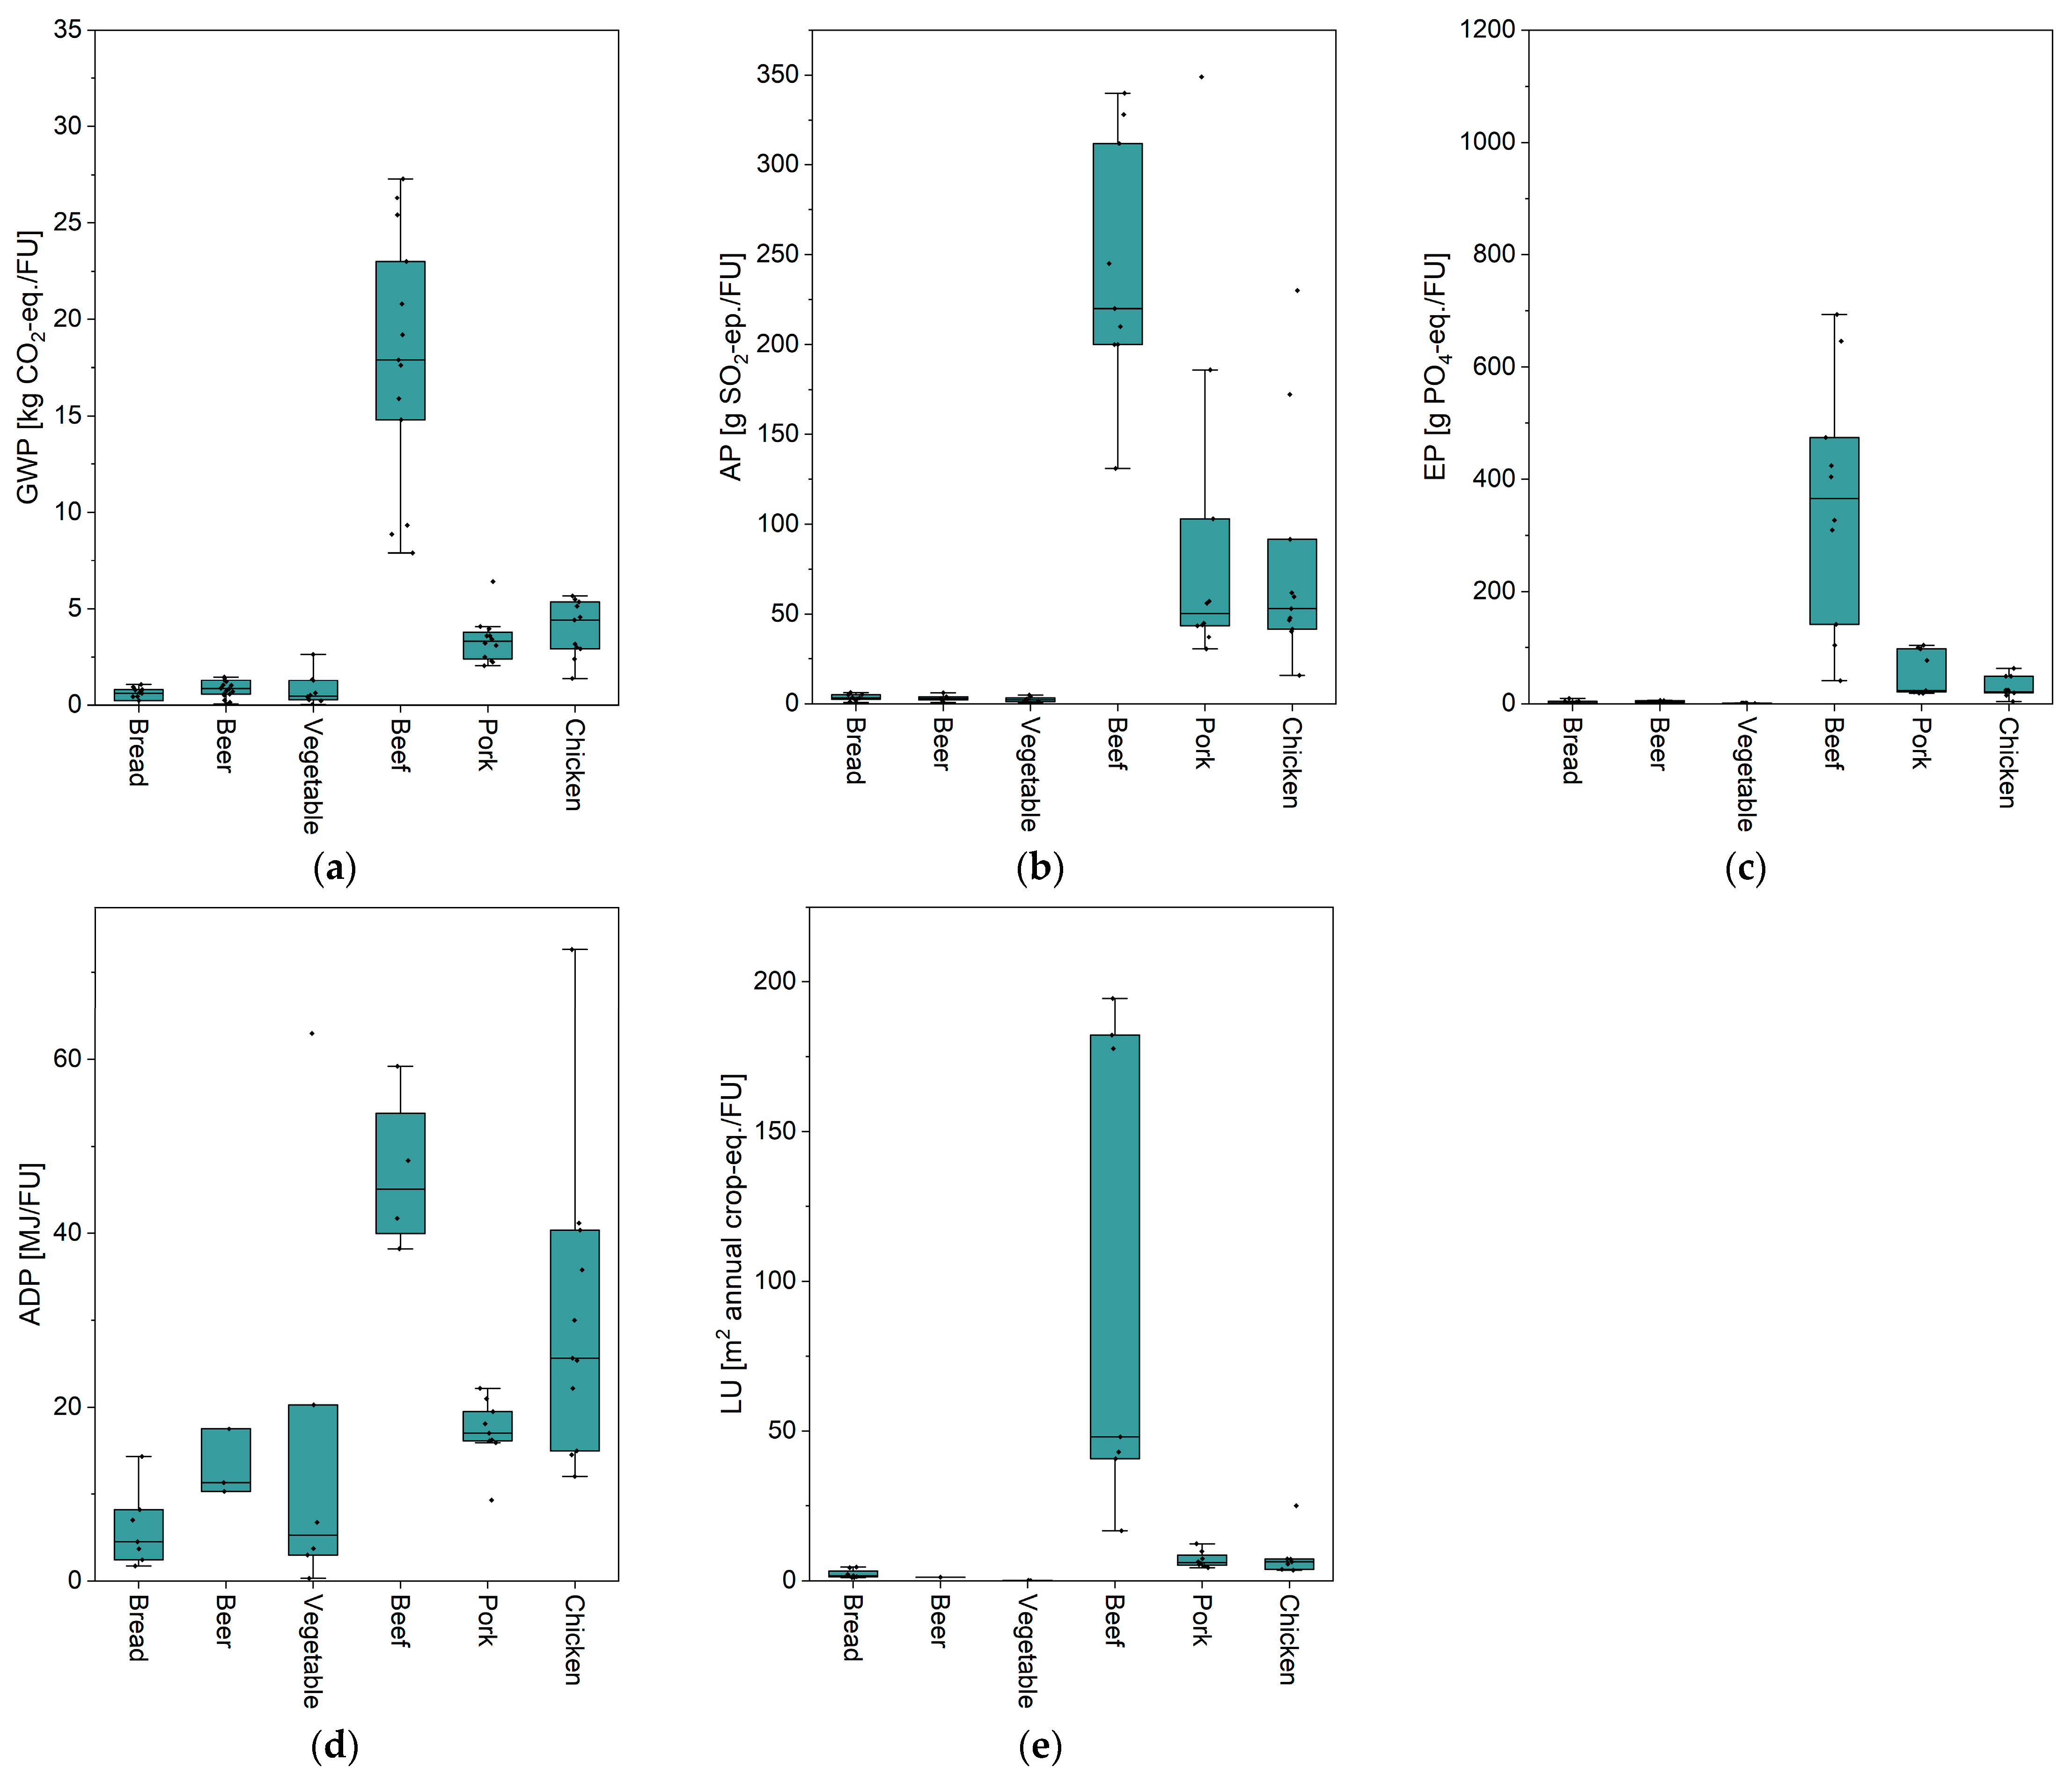
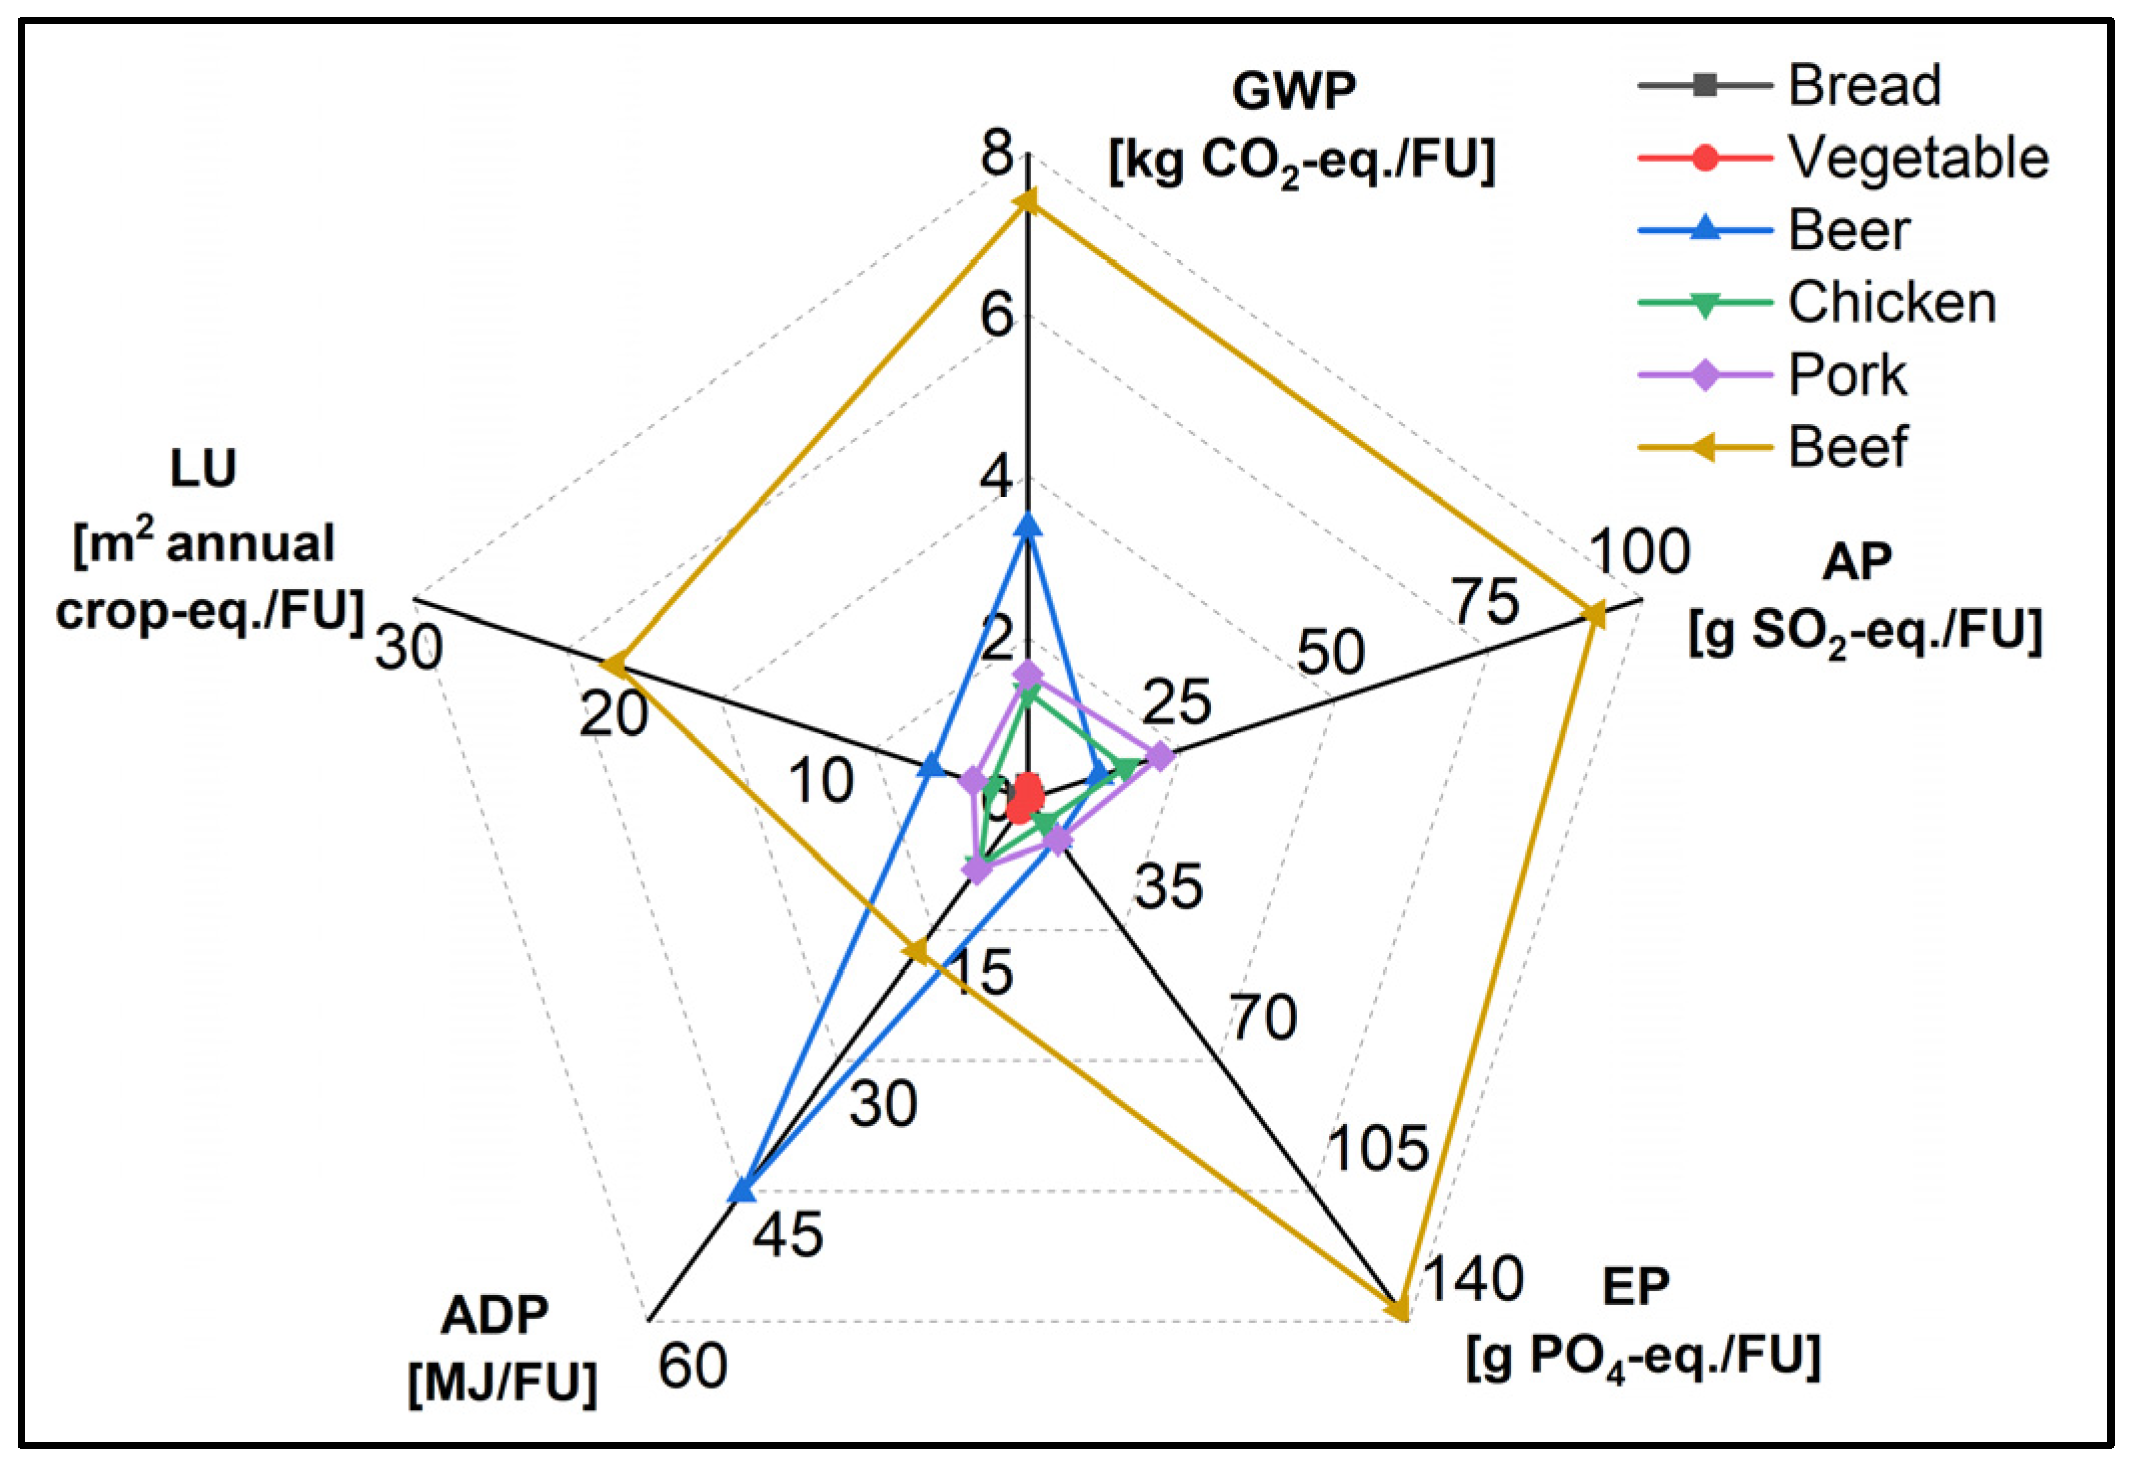
3.2. Emviromental Impacts of Grilling Ingredients

The environmental impacts of the grilling ingredients form a significant part of the overall environmental impacts of a barbeque event. As part of this study, the six most-popular grilling ingredients—beef, pork, chicken, bread, vegetables, and beer—were selected to enable an assessment of their environmental impacts. The environmental impacts of the various grilling ingredients are summarized in Appendix B. These tables provide a detailed overview of the impact data for various grilling ingredients, including data sources, different product systems, and specific impact data. For all further evaluations in this study, the environmental impacts of each type of ingredient are represented by the median of the obtained environmental impacts for different grilling ingredients, depicted in Figure 4. Each point in these figures represents data from literature, with the median represented by a horizontal line.

4. Discussion

4.1. Comparison of the Environmental Impacts of Grilling Ingredients

The environmental impacts of these six grilling ingredients in relation to the reference flow (RF = 1 kg or 1 L of ingredient) are shown in Figure 4. Considering the consumption of grilling ingredients for a barbecue event for four people (according to Table 1), the environmental impacts of each grilling ingredient are presented in Figure 5. It becomes clear that beef, with the exception of ADP, has the strongest environmental impacts in all the categories per FU; even more than the sum of all other grilling ingredients combined. The higher global warming potential (GWP) of beef is primarily due to methane emissions from enteric fermentation in ruminants. These emissions are significantly higher than those from monogastric animals and account for more than 50% of the total emissions [46]. In terms of EP, beef also demonstrates a significantly higher value compared to pork and chicken. This is primarily attributed to ammonia emissions, which stem from manure in housing and storage facilities during grazing, and from the application of fertilizers on fields [47]. According to ref. [48], nitrate leaching from agricultural soils is the most significant contributor to EP. Additionally, the feed requirement per kilogram of meat are greater for ruminants than for monogastric animals. This higher feed requirement is a key factor contributing to the notably higher EP associated with 1 kg of beef compared to pork and chicken. Studies by Geß et al. [49,50,51] show that lamb meat has even higher impacts for GWP than the values compiled for beef in the scope of this study. Additionally, they present values for EP and AP, showing significantly higher impacts than for pork or chicken meat, but mostly lower than that of beef. The consumption of beer during barbecuing contributes significantly to the ADP, reaching a value of 45.2 MJ/FU, which is twice as high as the value for beef. This is due to the bottle production associated with beer consumption [52]. Apart from AP and ADP, beer is the second-largest source of environmental impacts per FU in all categories after beef. The contribution of pork to AP is greater than that of all other grilling ingredients except beef, but it only accounts for 23% of the total AP of beef.
Additionally, Figure 5 indicates that the contribution of vegetables and bread to the environmental impacts during barbecuing are almost negligible. Even though lettuce was mostly used as a representative for vegetables’ environmental impact here, based on Rasines et al. [53], the GWP of 1 kg of mixed vegetables is only approximately 290 g CO2-eq. higher than that of 1 kg of lettuce. Even with this difference, the GWP of 1 kg of mixed vegetables still accounts for only approximately 4% of the GWP of 1 kg beef. This still indicates that the environmental impact of vegetables can be considered negligible compared to any type of meat.
Furthermore, it is important to note that when conducting a LCA across different sectors, the time horizon underlying the life cycle impact assessment method should be consistent to avoid distortion of the results. In this study, the ReCiPe (H) approach was used to assess the LU of barbecue grills. However, in the reference literature regarding the environmental impacts of grilling ingredients, the time dimension for evaluating LU is not mentioned. Therefore, the results of this study concerning LU are valid only under the assumption that the ReCiPe method in all referenced studies adheres to the Hierarchist perspective with a time frame of 100 years for impact mechanisms.

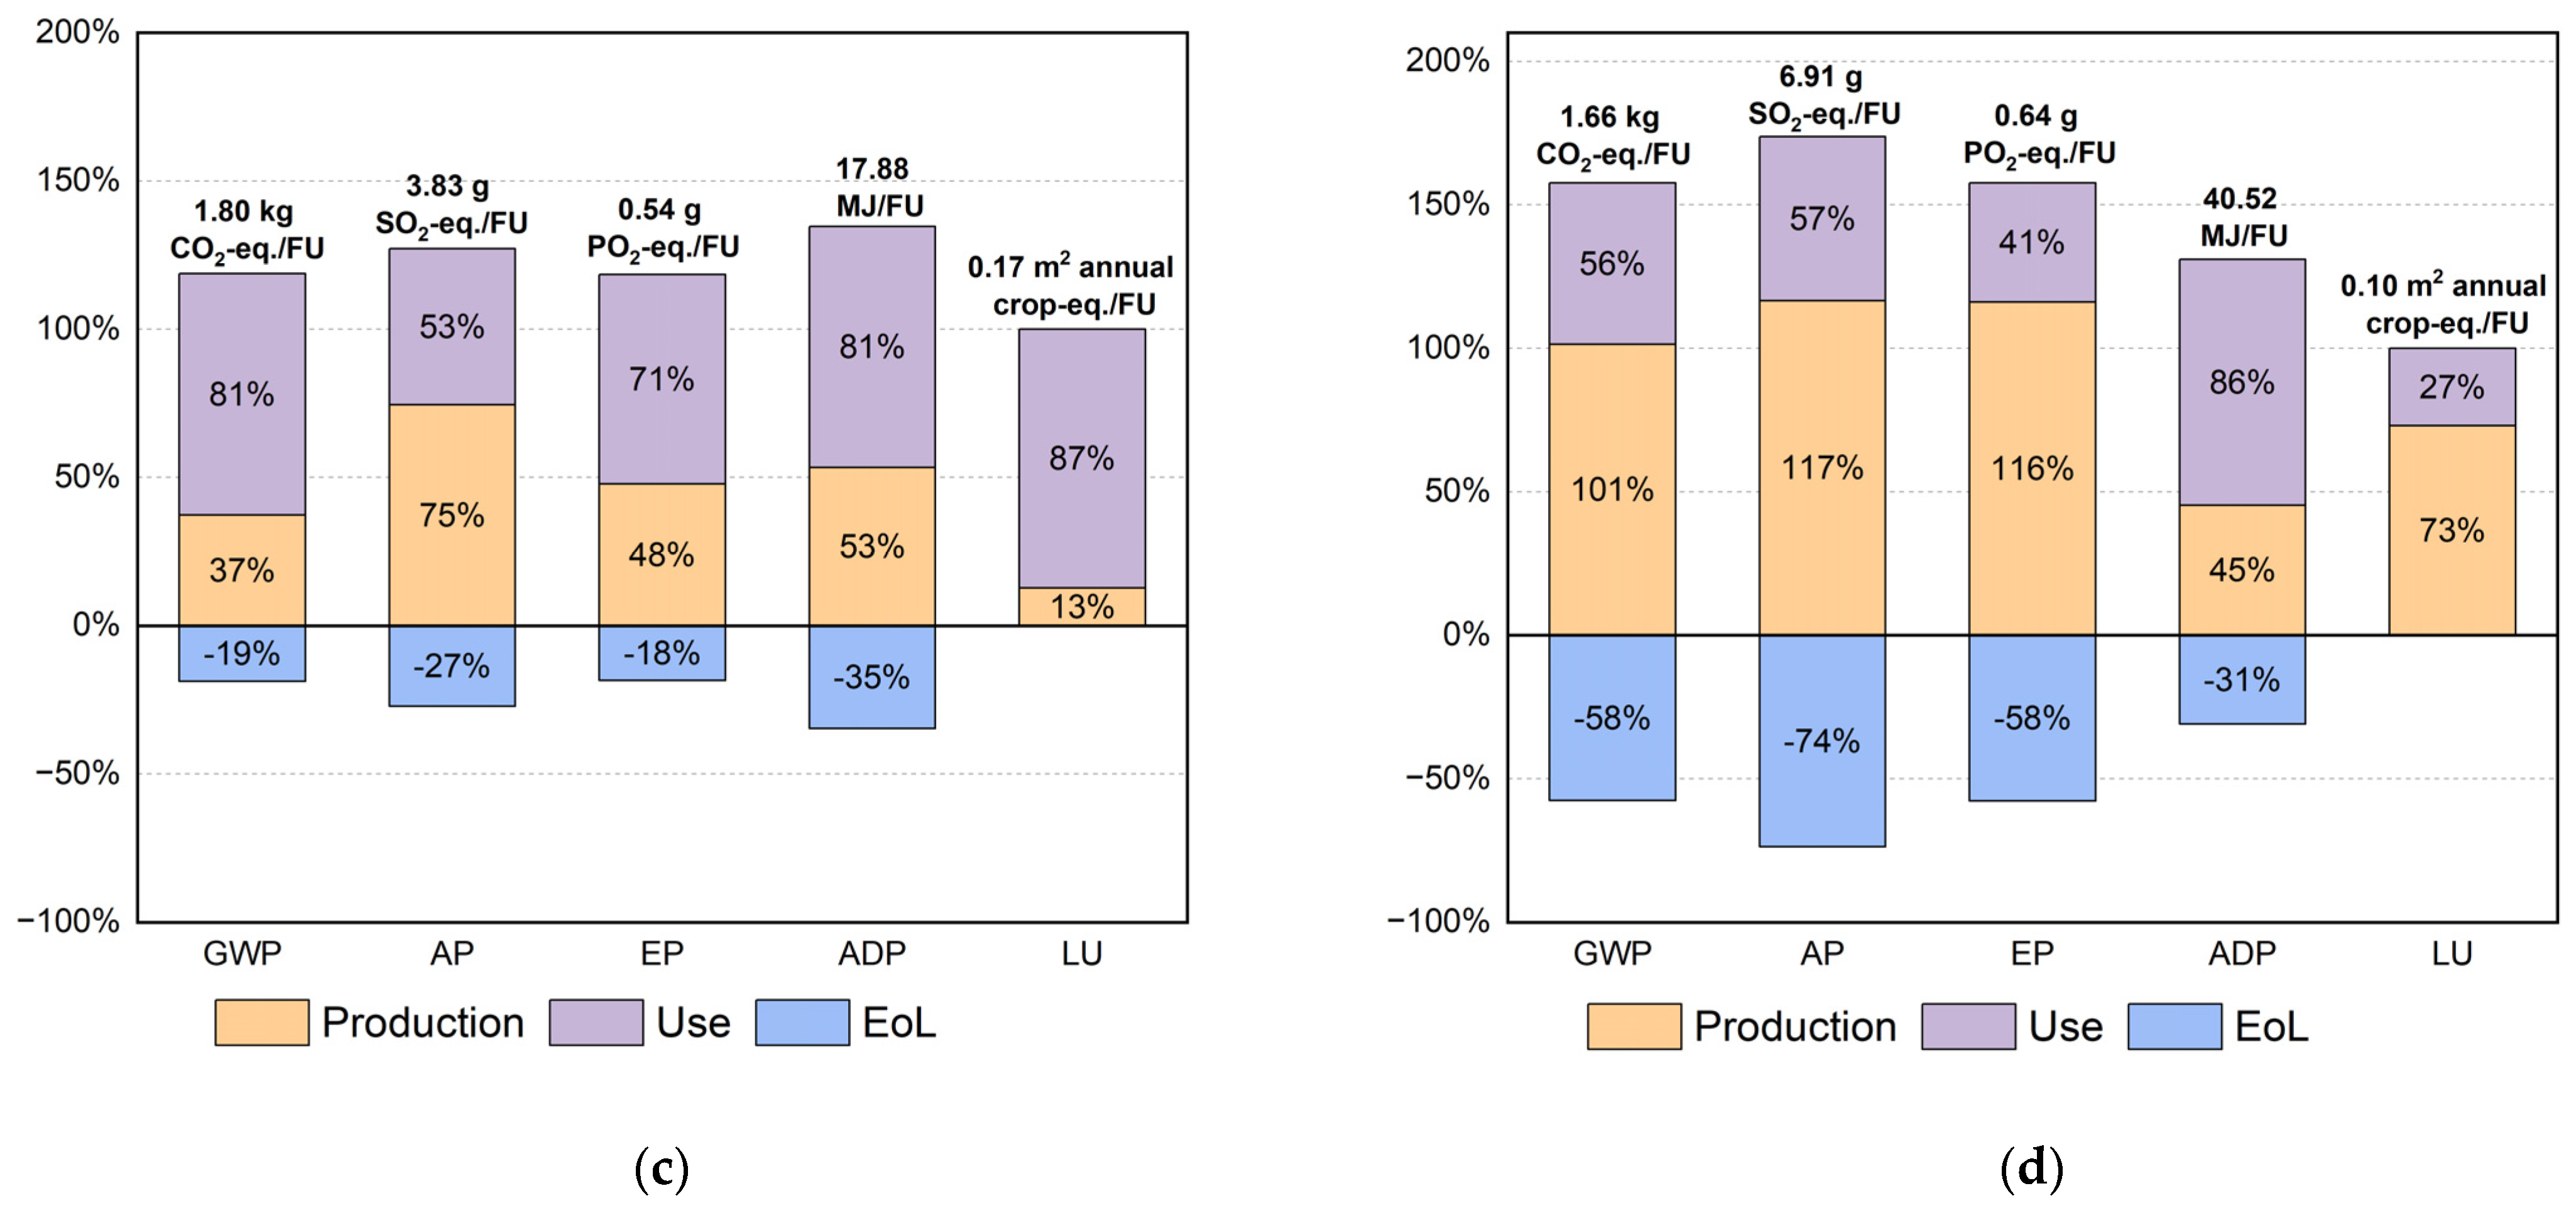
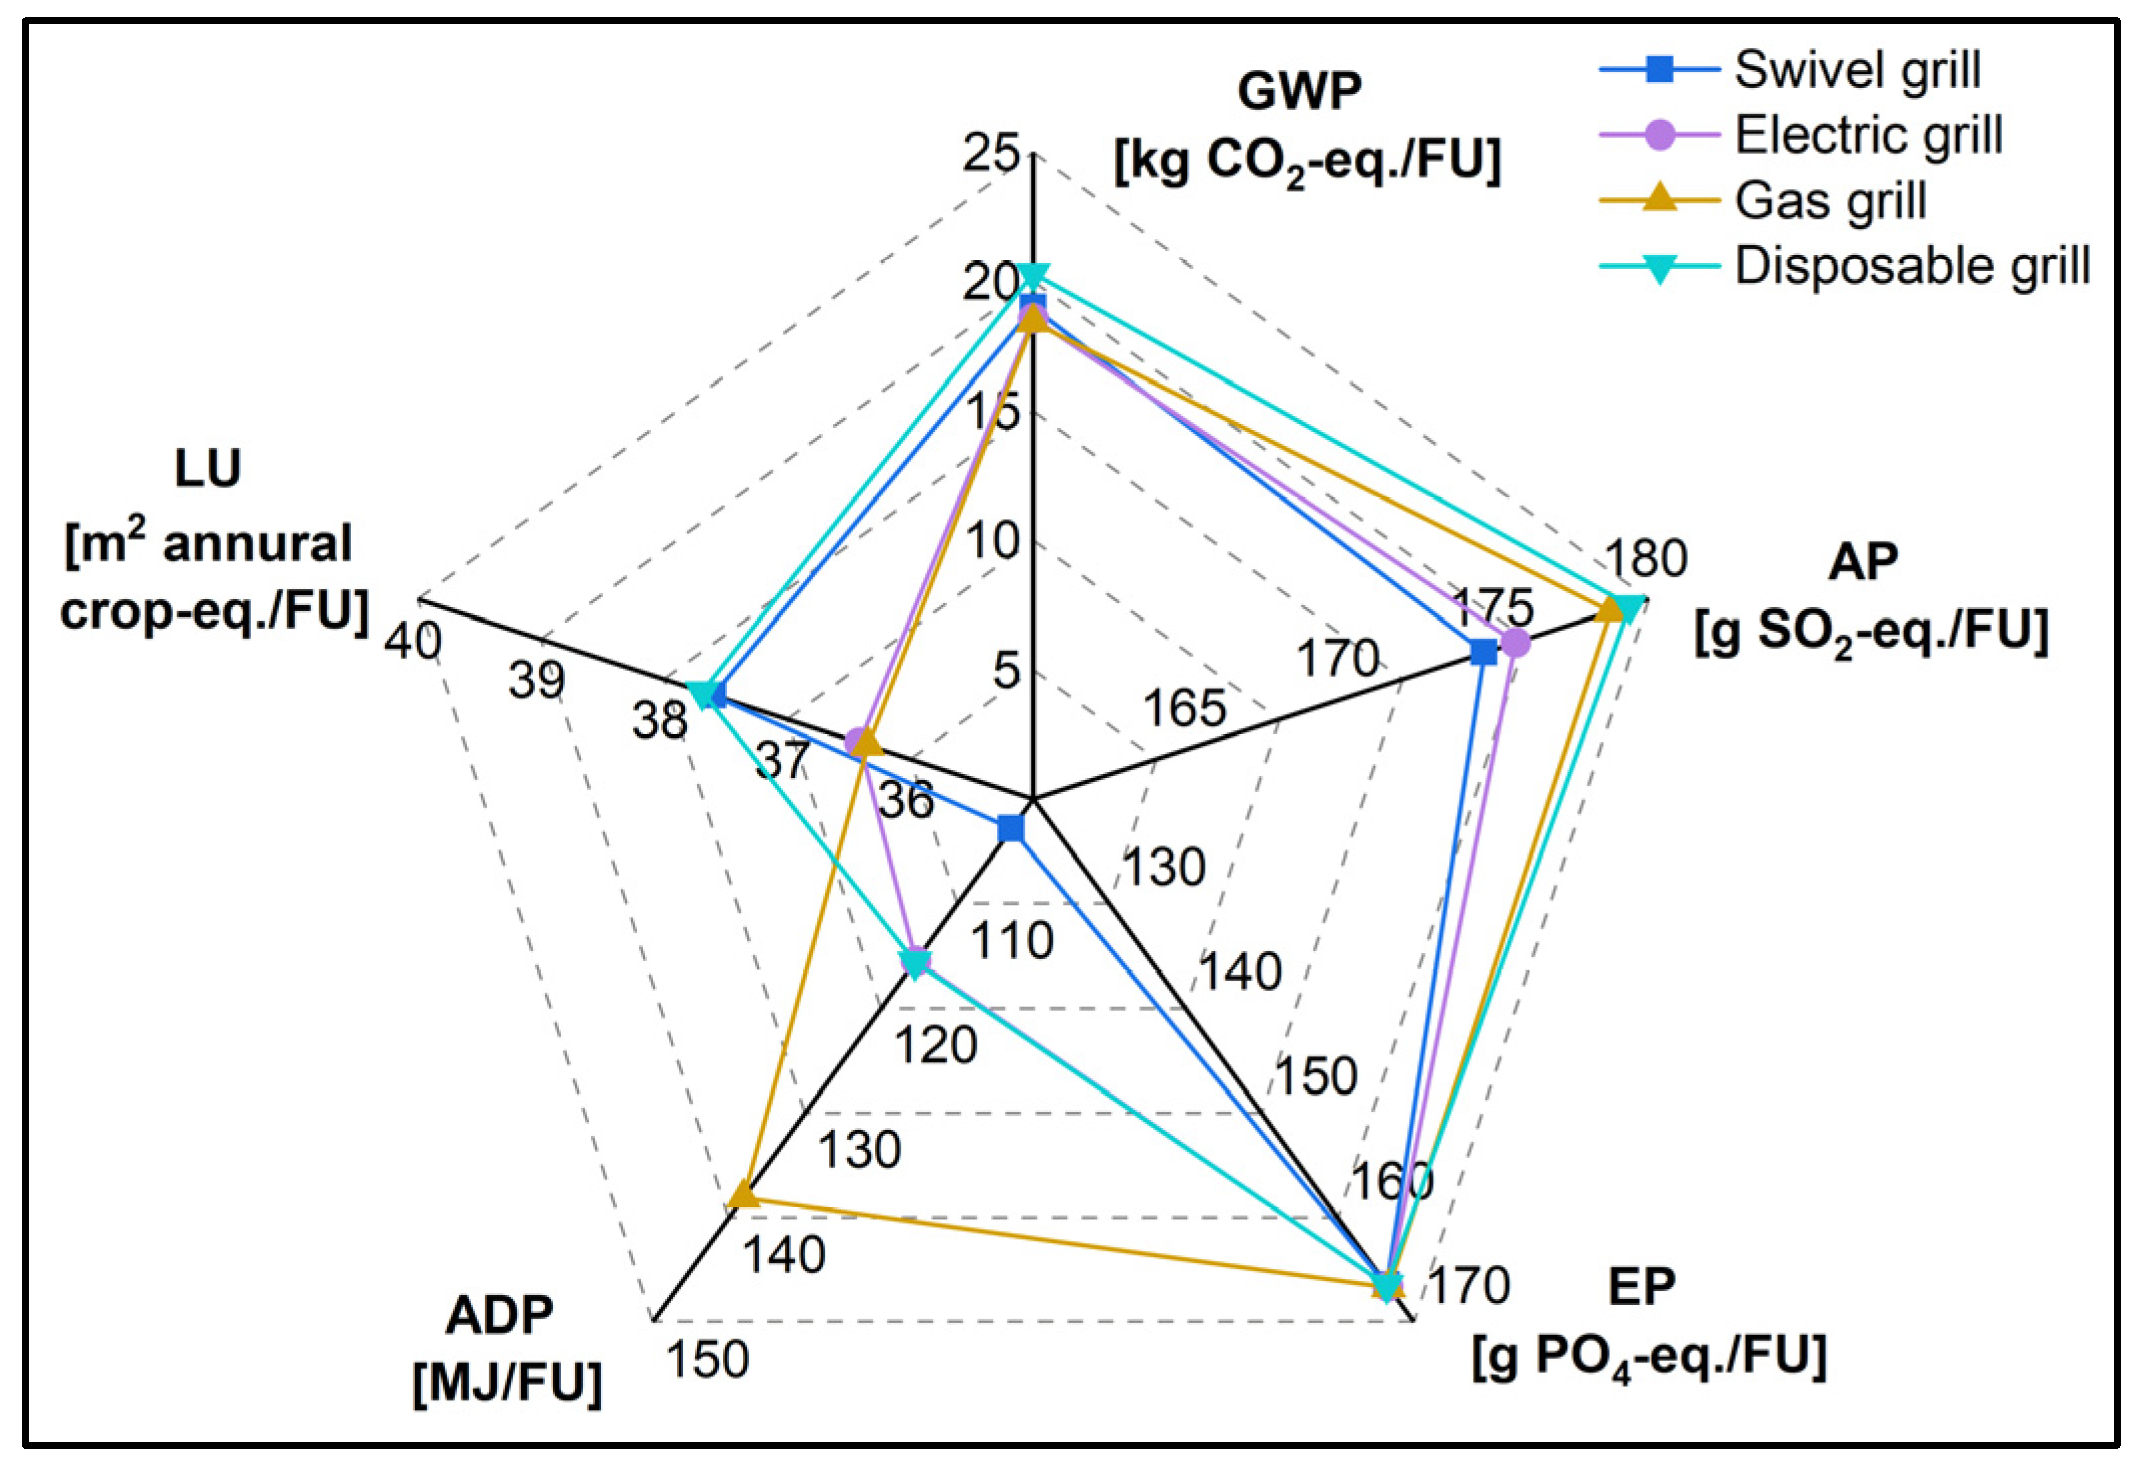
4.2. Comparison of the Environmental Impacts of Grilling Devices

Since the environmental impacts of the three large charcoal grills (round grill, kettle grill, and swivel grill) were compared in Section 3.2. and the results did not differ significantly, the swivel grill was chosen to represent the large charcoal grills for comparison with the other grill types. The results of the environmental impacts of these four grilling devices are compared in Figure 6. It is apparent from this figure that the disposable grill, with the exception of ADP, has the largest environmental impacts. Compared to the other grill types, its GWP is 1.7 to 2.3 times higher. Furthermore, the two charcoal grills—the disposable grill and the swivel grill—exhibit a significantly higher GWP and LU compared to the other types of grilling devices. This is attributable to the consumption of charcoal during the use phase. In contrast, the gas grill has a significant contribution ADP, which is 2.3 times higher than in the case of the electric grill and 7.7 times higher than in the case of the swivel grill. This is due to the consumption of LPG during the use phase. The data show that although the gas grill has the heaviest weight—about 30 times that of the swivel grill—and thus consumes more materials during its production, its environmental impacts are not excessively high (the material composition of these two grills is not significantly different, as shown in Appendix A). This indicates that the environmental impacts of the manufacturing phase are minimal in comparison to those of the use phase, and that waste management also plays a crucial role in mitigating environmental impacts.
The contribution of each life stage to the environmental impacts of the grilling devices are summarized in Figure 7. For the disposable grill shown in Figure 7b and the gas grill shown in Figure 7d, the production phase contributes more to environmental impacts than it does for the swivel grill shown in Figure 7a and the electric grill shown in Figure 7c. Meanwhile, the credit in the EoL phase is also larger. For example, the production phase of the gas grill contributes approximately 1.68 kg CO2-eq. per barbeque event. However, by recycling materials in the EoL phase, the GWP can be reduced by 0.96 kg CO2-eq. per barbeque event, demonstrating the importance of correct EoL management. The proportion of environmental impact reduction through EoL processes varies for different types of grilling devices. This variation is attributable to the distinct material compositions (such as varying proportions of metals, plastics, etc.), differences in weight, and divergent energy consumption patterns during use across different types of grills.
By comparing the four types of grilling devices, this study concluded that reusable grills exhibit a lower environmental impact compared to disposable ones (four out of five categories), underscoring the significance of long-term use and proper disposal in mitigating environmental burdens. The key reason for this lies in the usage frequency. Since disposable grills are designed for single use, while reusable grills can be used up to 75 times, the environmental impact of the manufacturing process is distributed across more uses for reusable grills. It is also worth highlighting that the electric grill has the least impact in almost all the examined environmental categories. The advantage of this type of grill lies in its ability to use electricity from renewable sources. However, it must be recognized that the electric grill’s energy consumption is strongly influenced by the provided energy mix [54]. In regions with a high proportion of electricity from coal power plants, the environmental impact could be substantially higher.

4.3. Comparison of the Environmental Impacts of Different Barbecuing Types and Sectors

Based on the data from Section 3.1 and Section 3.2, the results were aggregated to determine the total environmental impacts of using various grilling devices during a four-person barbeque event. This includes the environmental impacts of the grilling devices as well as the consumed energy sources and grilling ingredients, as shown in Figure 8. From the data in this figure, it is apparent that the GWP, AP, EP, and LU values for a four-person barbeque event with different types of grilling devices are hardly different. This suggests that the difference in environmental impact from using different types of grilling devices is not significant. However, the gas grill has a significantly higher ADP compared to the other types of grilling devices. Based on the software simulation results, this is due to the significant contribution of the consumption of LPG.
The reason that there is only a small difference in the environmental impacts from using different types of grilling devices is that the contribution from the consumption of grilling ingredients, regardless of the type of grill, is considerably higher in all environmental impact categories than the contribution caused by the grilling devices and the energy sources used, as shown in Figure 9. While the selection of grilling devices in the scope of this study was somewhat arbitrary due to accessibility for the authors without need to purchase new devices, the results suggest only a minor influence of the devices on the overall environmental impacts. This led to the decision to not investigate further models or brands in the scope of this study.

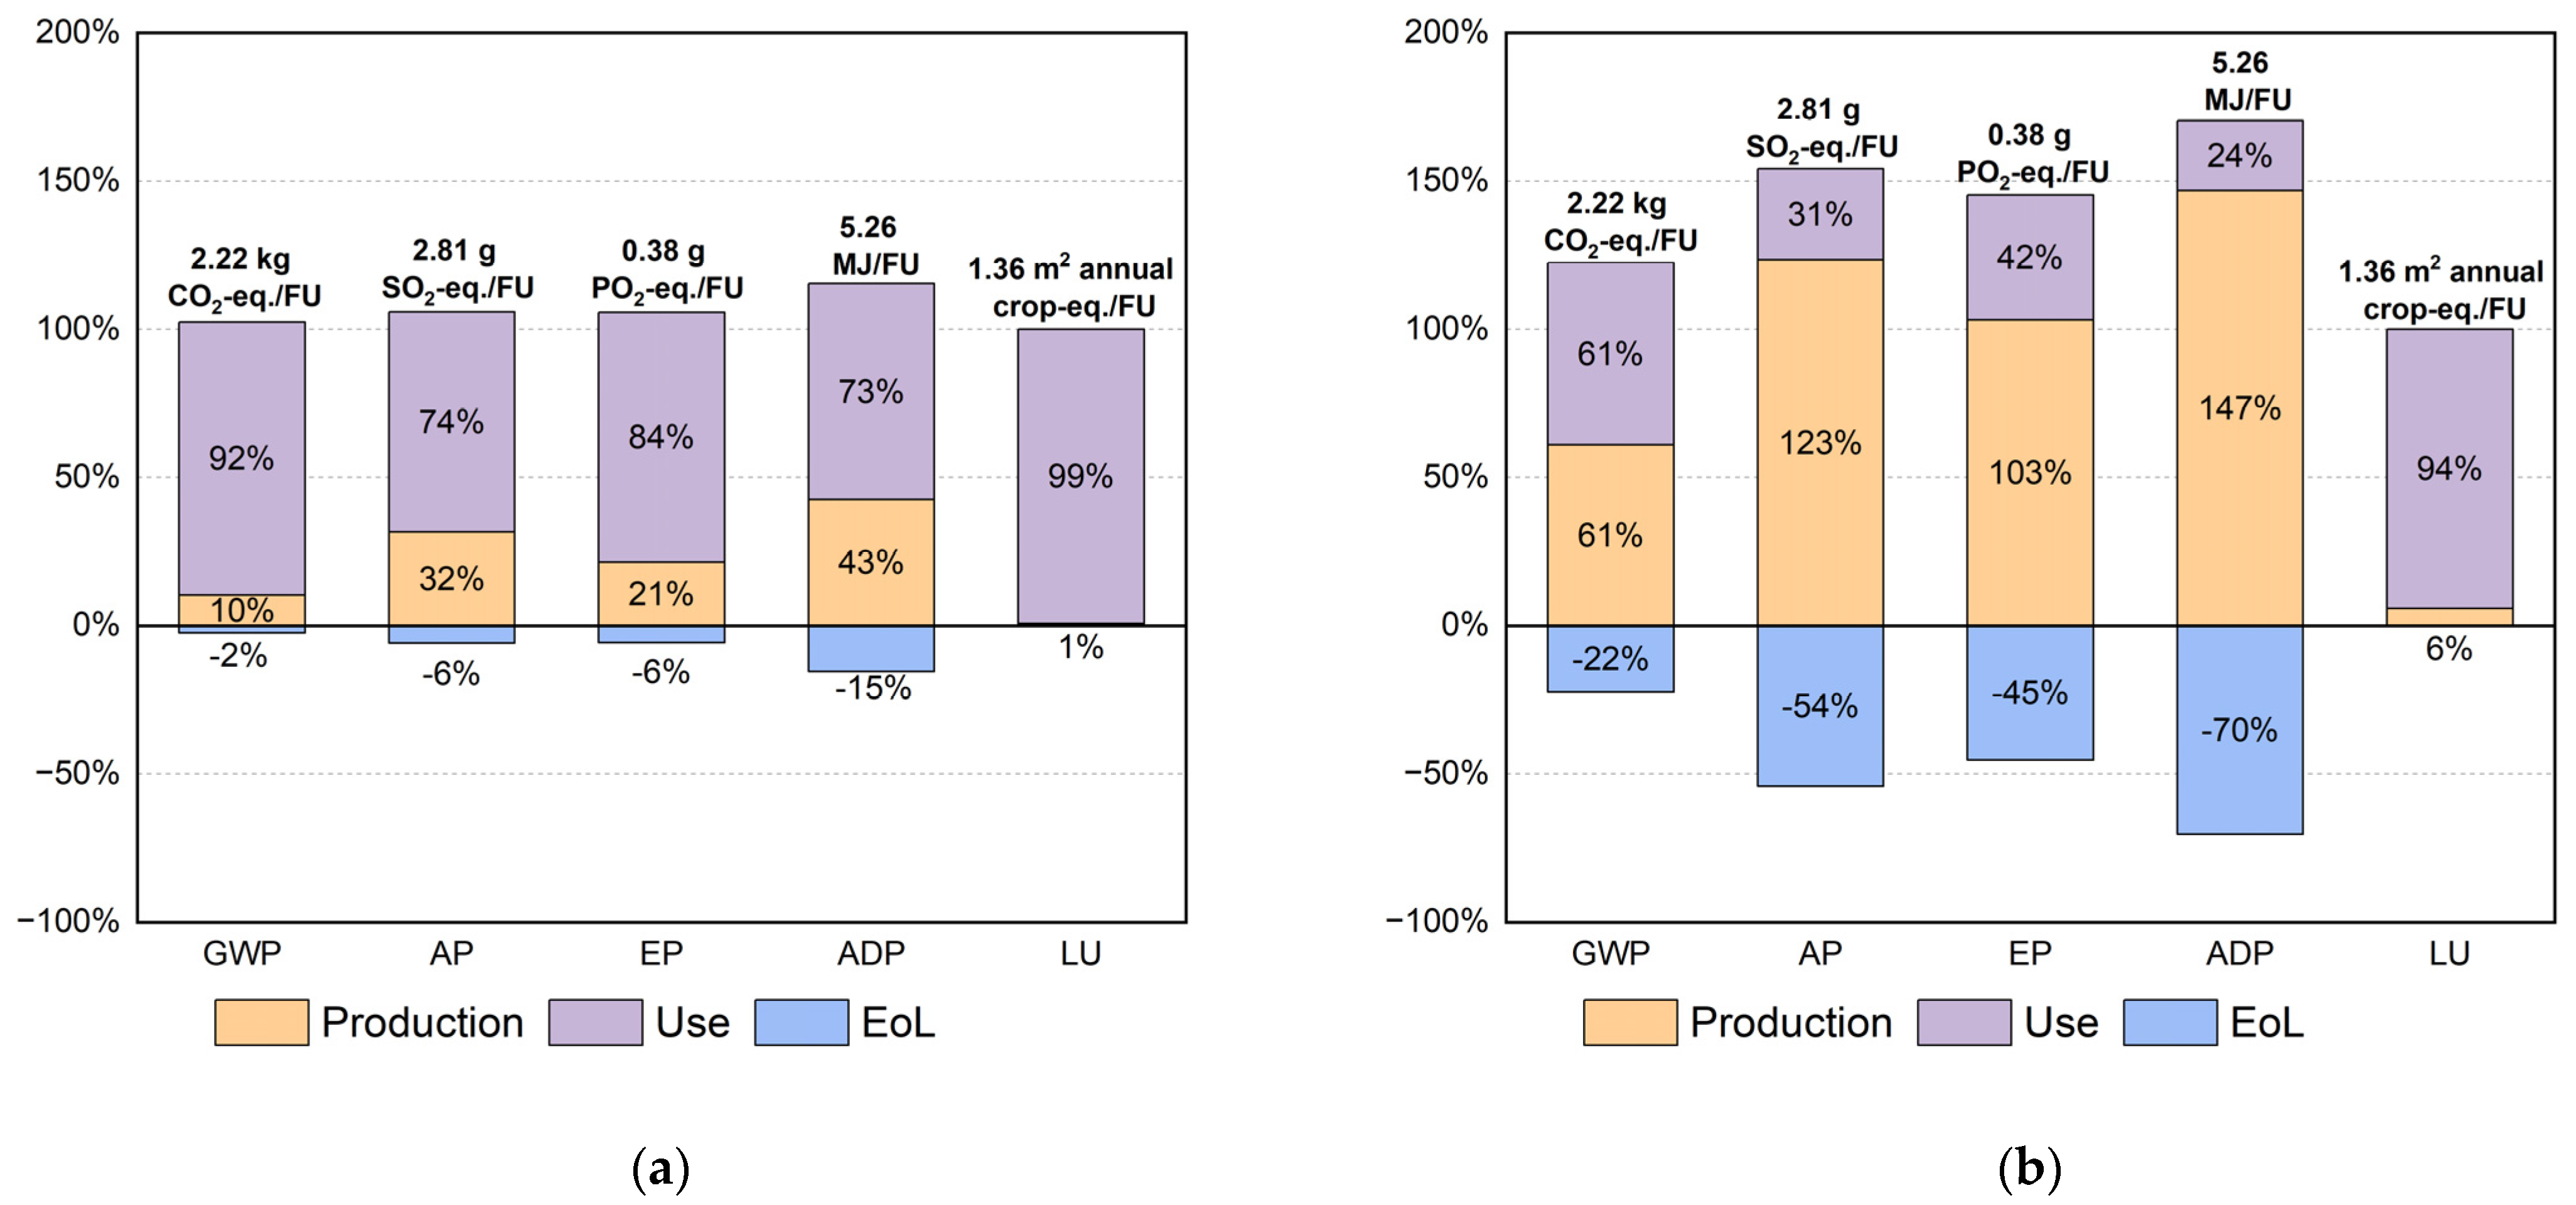
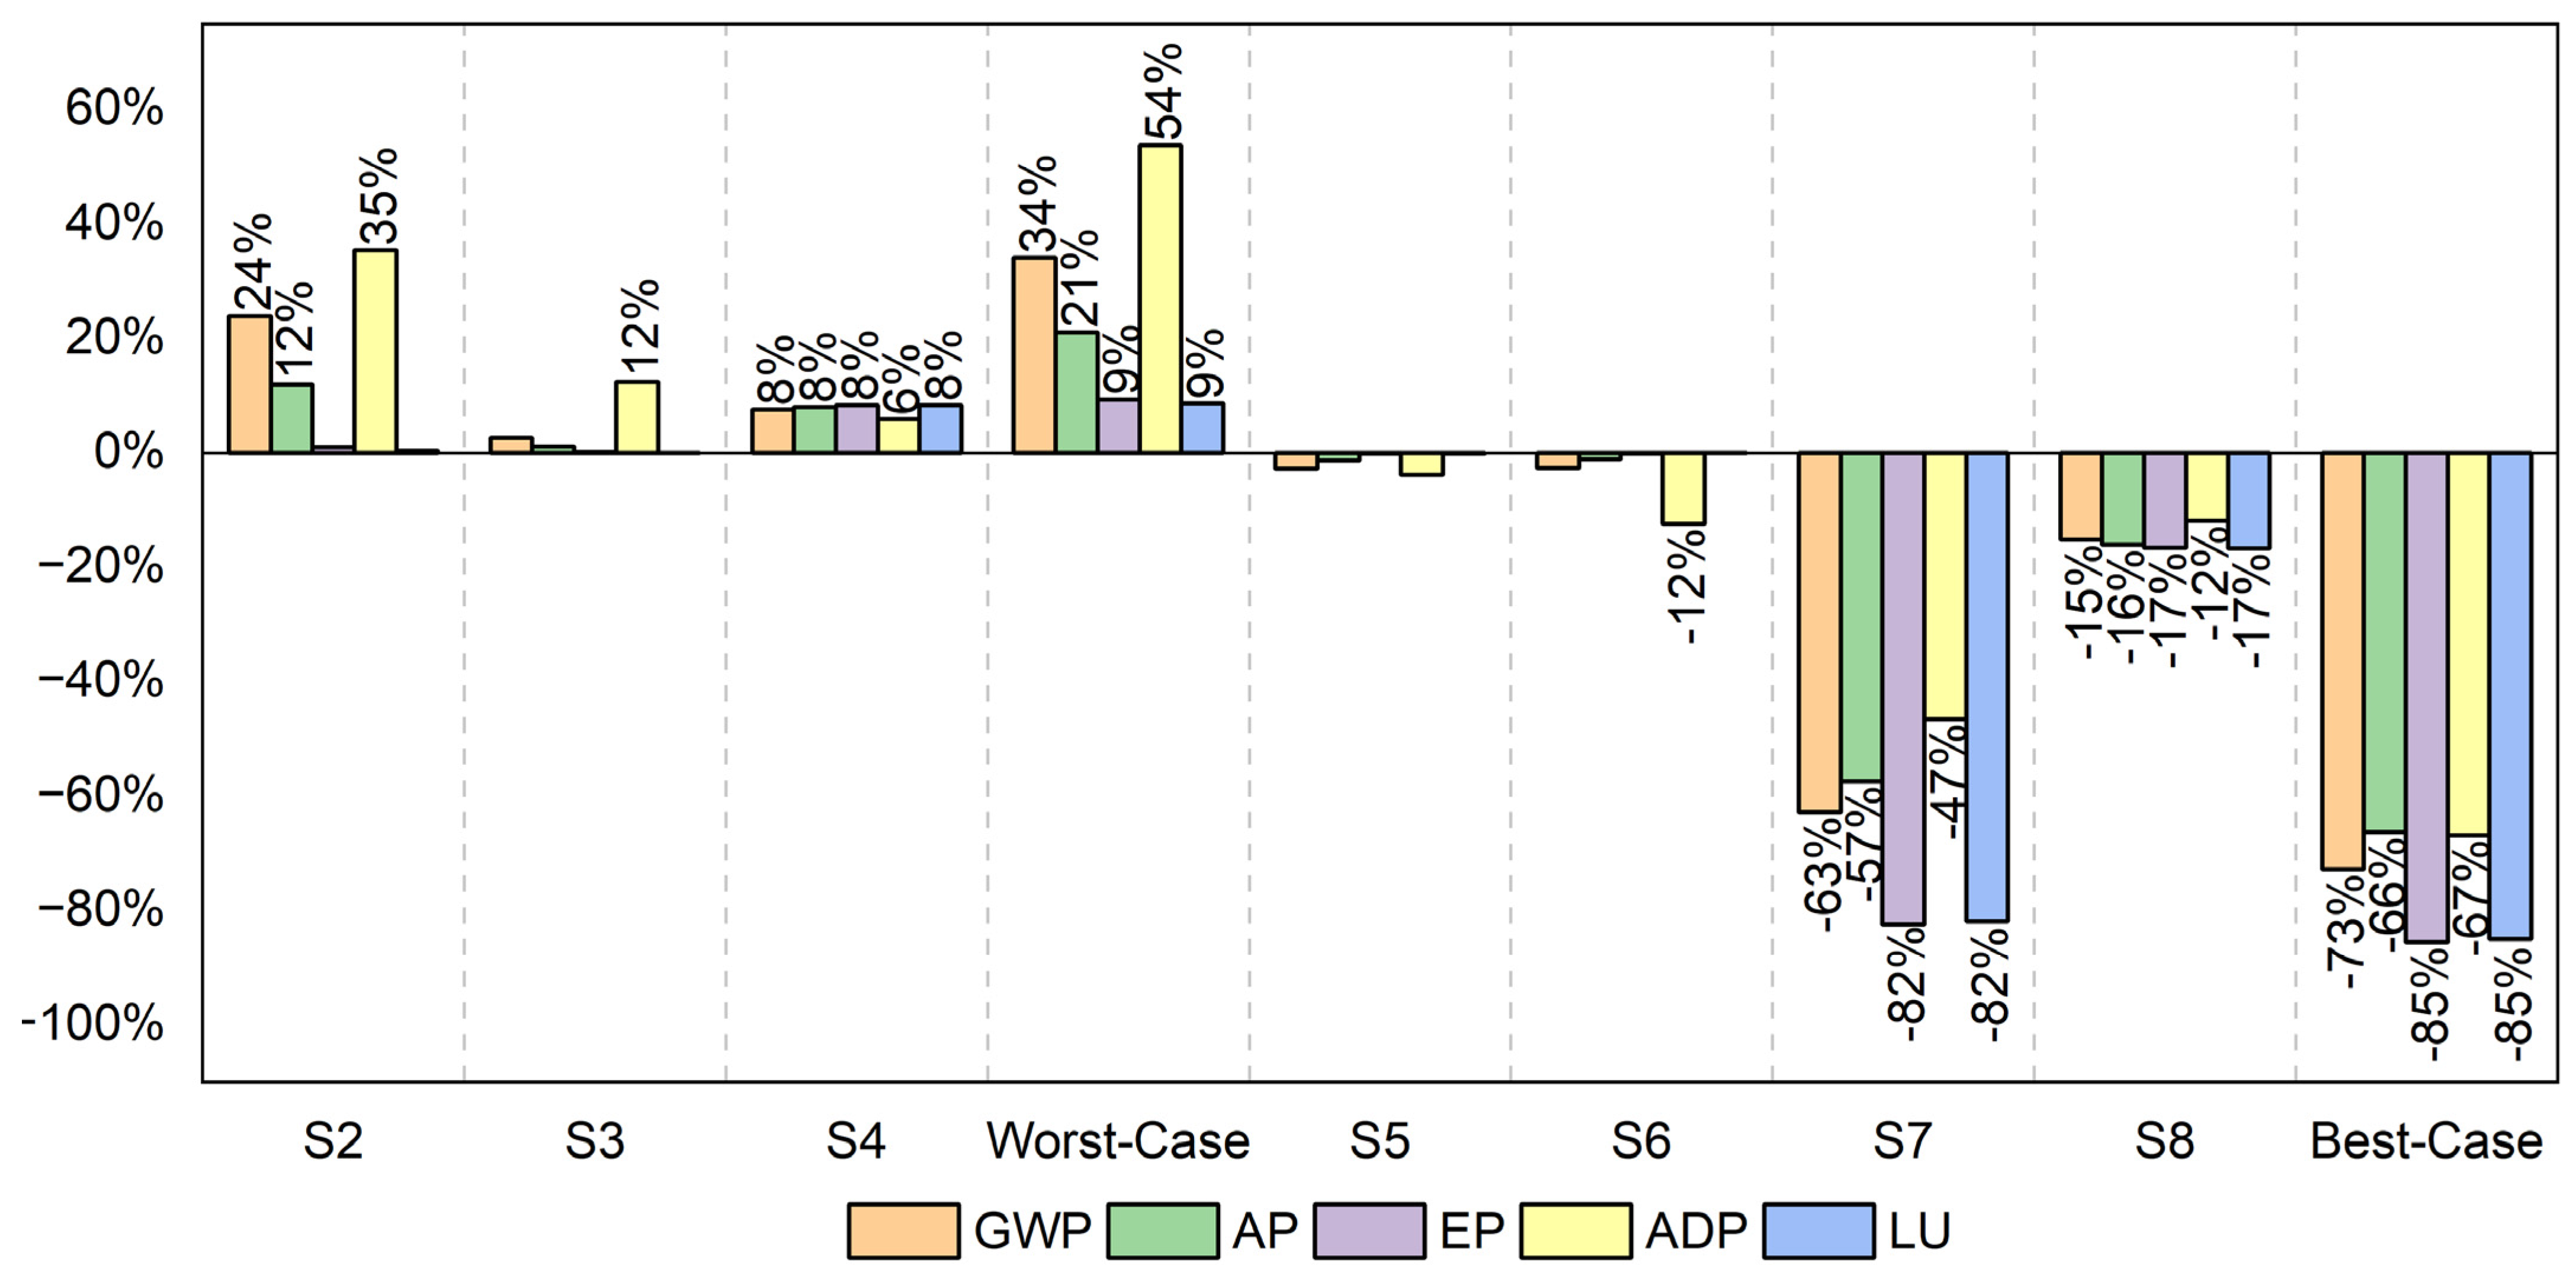
4.4. Comparison of the Environmental Impacts of Different Scenarios

Various scenarios for barbecuing were already presented in Section 2.3, reflecting different consumer habits and leading to either improved or worsened environmental results. Since the choice of grill does not significantly affect the environmental impacts, the gas grill was chosen as an example to illustrate the changes in environmental impacts in the various scenarios compared to the reference scenario. The results are shown in Figure 10, with the baseline (0%) being the reference scenario.
As can be seen from Figure 10, the environmental impacts of S2 (heavy grill, short lifespan) are significantly higher. This means that for grilling devices, a shortened lifespan would increase the GWP and ADP by 24% and 35%, respectively. Additionally, upon further analysis of the results, it was discovered that variations in the weight of the grilling devices had minimal impact on the overall environmental outcomes. This is attributed to the fact that the environmental impact caused by the grilling devices was distributed across the number of usage instances. Therefore, compared to a shorter lifespan, the impact brought about by an increase in the weight of the grilling devices is relatively small. Moreover, the results from S4 (high food waste) indicate that an increase in food waste by 10% could increase each environmental effect by between 6% and 8%. If the consumption of energy carriers, specifically LPG in this case, increases during the barbecuing process (as seen in S3—high energy demand), the ADP would rise by 12%. However, the impacts on other types of environmental impacts are not significant. It is important to highlight that for other grilling techniques, the resultant change in environmental impacts would be less significant. This is due to the fact that the contribution from the “energy source” sector to each impact category is relatively smaller for these techniques compared to gas grills. This contrast is clearly depicted in Figure 9. If all the negative factors take effect simultaneously (as given in the worst-case scenario), the environmental impact could increase by as much as 54%. The reason for the different degrees of change in environmental impact categories across each scenario is due to the varied contributions of the three grill sectors—grilling devices, energy sources, and grilling ingredients—to each category.
Considering the optimization scenarios, it is clear that the reductions in environmental impact in scenarios S5 (lightweight grill, long lifespan) and S6 (low energy demand) are not significant. This means that extending the grill’s service life and reducing energy consumption during barbecuing do not have considerable positive effects on the environment. In contrast, the implementation of the measures in scenarios S7 (adapted diet) and S8 (no food waste) results in a substantial reduction in the environmental impacts of barbecuing. Furthermore, in scenario S7 (adapted diet), all the environmental impacts are reduced by at least 47% if alternative meat types are used instead of beef for the barbecuing process. Notably, the EP and LU are reduced by 82%. This substantial decrease is primarily linked to beef production. Our findings reveal that the EP and LU associated with beef is considerably higher than that of pork and chicken. The results from S8 (no food waste) show that the environmental impacts can be reduced by 12 to 17% if food waste is avoided. In conclusion, in the best-case scenario, the environmental impacts can be reduced by 66 to 85% if these optimization options are considered simultaneously.
In summary, it can be concluded that not all consumer behaviors have a significant impact on the environmental effects of barbecuing. Of all the factors analyzed, energy consumption seems to have the least relevance. In contrast, a shortened service life of grilling devices and improper disposal at the end of life can lead to increased environmental burdens. This outcome is contrary to our initial expectations. The reason for this lies in the relatively lower contribution of grilling devices to the environmental impact of barbecuing activities compared to grilling ingredients, as demonstrated in Figure 9. When the environmental impact of grilling devices is distributed over 75 uses (equating to a 5-year lifespan) versus 30 uses (a 2-year lifespan), their contribution to the overall environmental impact of barbecuing significantly increases. Conversely, increasing the number of uses from 75 to 150 does not markedly change the proportion of their contribution, as it is already sufficiently low. However, the most significant changes in terms of environmental impacts can be achieved through adjustments in food consumption. This is consistent with the assumptions made at the beginning of the study. Specifically, the substitution of beef with other types of meat presents a particularly effective method. In combination with a reduction in food waste, this behavior can lead to significant improvements.

4.5. Recommended Actions

Based on a comprehensive analysis of the environmental impacts of various grilling ingredients and grilling devices, a series of sustainable recommendations has been formulated for consumers to minimize the environmental burden when barbecuing.
Firstly, grilling ingredients are the key factor for the environmental impacts of a barbeque event. Particularly, beef has the largest impact. Therefore, by reducing beef consumption, significant improvements can be achieved in terms of environmental impacts. Instead, consumers could opt for less environmentally damaging alternatives like poultry or pork.
Second, this study demonstrates that food waste has significant environmental effects. To reduce food waste, it is essential that consumers purchase and ingest food with care. This may involve purchasing only the quantity of food required, storing it properly, reusing it as necessary, and considering how leftovers can be used for future meals when barbecuing.
Thirdly, the disposal of grilling devices at the end of their lifespan is also of great importance. Both a shortened usage duration of the grill and improper disposal procedures can significantly increase the environmental burden of a single barbeque event. Therefore, extending the usage duration of the grill and proper waste treatment can contribute to reducing the environmental impacts.
Fourthly, the type of grill selected can also marginally reduce environmental impacts. Consumers should avoid using disposable grills, as they have the strongest impacts in almost all environmental impact categories. As an alternative, it may be worth considering using electric grills, which have the smallest environmental impacts across almost all the categories. Electronic grills are particularly beneficial when used with renewable energy sources.
In summary, the selection of sustainable grilling ingredients, avoiding food waste, and environmentally conscious handling of grilling devices at their end-of-life stage are important factors that consumers can consider to make their barbecuing experience more sustainable. By considering these factors, consumers can reduce their own environmental footprint and make a significant contribution to environmental protection. However, this significant contribution for private households does not relieve producers of grilling devices and energy carriers for barbecuing from their responsibility in contributing to more sustainable products.

5. Conclusions

Although some research has been carried out on the greenhouse gas emissions associated with barbecuing activities before, none have undertaken a comprehensive investigation of other impact categories or laid out a detailed methodology for the assessment process. Moreover, no existing research specifically delineates the extent to which different consumer behaviors affect the environment. Based on a comprehensive evaluation of the potential environmental impacts of a barbeque event for four people, this study evaluates various contributing factors such as grilling devices, energy carriers, and grilling ingredients. By comparing different barbecuing techniques and consumer behaviors, several key findings were obtained.
Regarding the elaborated results for all considered types of grilling devices, the disposable grill has the greatest environmental impact, followed by the gas grill, while the large charcoal grill and the electric grill have fewer impacts. Among the reusable grills, the electric grill proves to be the most environmentally friendly, primarily due to its minimal impact from the energy source. In terms of grilling ingredients, the consumption of beef has the highest environmental impact; far more than any other of the investigated grilling ingredients. Notably, food consumption accounts for the majority of a barbeque event’s environmental impact, with beef having the biggest effects. On the other hand, this study reveals that consumer behaviors can have a major influence on environmental impacts. A shortened lifespan of the grill and improper waste disposal procedures can significantly increase the environmental impacts of a single barbeque event. Combined with increased energy demand during use and increased food waste, an increase in environmental impacts of 9 to 47% could be observed. However, if food waste is avoided and the proportion of beef in the grilling ingredients is reduced by replacing it with alternative food, the environmental impacts of barbecuing can be significantly reduced (47 to 82%). Combined with other best practices such as less energy demand during use and increased grill lifetime, reduction potentials amount to as much as 85%.
Further studies can be carried out based on this study. In order to enhance the comprehensiveness and accuracy of future research, it is recommended that collaborative efforts should be established between researchers and grill manufacturers to collect data on material composition, energy consumption, and supply chains. The same is true for organizations and enterprises involved in the potential recycling of grilling devices. This will enable a more accurate LCA and align manufacturers with sustainability strategies, enabling informed decisions towards environmentally friendly production. Moreover, although there are already studies that have measured the composition of the emissions during barbecuing, such as PAH and PM [35,55], these air pollutants have not been linked with environmental impacts in those studies. A first screening in the scope of this study did not show relevant impacts for these emissions. This finding should be validated further. Regarding burden shifting, it must be noted that this phenomenon can still occur, as not all impact categories are included in the scope of this study. In order to eliminate the occurrence of burden shifting, further research efforts are required that include all impact categories. Lastly, this paper finds that reducing the proportion of beef in the barbecuing process can significantly decrease environmental impacts. Further reductions are possible by substituting meat with vegetables or other vegetarian products; thus, future research could focus on the environmental impacts of vegetarian barbecue structures.

Author Contributions

Conceptualization, S.A. and T.M.P.; methodology, S.G.; software, S.G.; validation, K.C.D. and T.M.P.; formal analysis, S.G.; investigation, S.G.; data curation, S.G., K.C.D. and T.M.P.; writing—original draft preparation, S.G.; writing—review and editing, K.C.D., T.M.P. and S.A.; visualization, S.G.; supervision, T.M.P., K.C.D. and S.A. All authors have read and agreed to the published version of the manuscript.

Funding

This publication was funded by the German Research Foundation (DFG) grant “Open Access Publication Funding/2023–2024/University of Stuttgart” (512689491).

Institutional Review Board Statement

Not applicable.

Informed Consent Statement

Not applicable.

Data Availability Statement

All the data generated or analyzed during this study are included in this published article. For further information or additional data, please contact the corresponding author.

Conflicts of Interest

The authors declare no conflicts of interest.

Appendix A. Bill of Materials (BoM) for the Investigated Grilling Devices

Table A1. BOM of the electric grill.
IDComponentCountWeight [g]Material Matching
in LCA Software
1Lid11548Cast aluminum
2.1Ceramic spacer216Ceramic
2.2Plastic spacer214Polycarbonate
3Handle173Polycarbonate
4Cooking grate23478Cast iron
5Heat element assembly1456Stainless steel
6Heat element support125Stainless steel
7Controller bracket sleeve1114Stainless steel
8Temperature controller1571Polycarbonate
9Cook box11744Cast aluminum
10Carrying handle2256Polycarbonate
11Rear cradle1498Polycarbonate
12Cradle logo119Polycarbonate
13Front cradle1476Polycarbonate
14Disposable drip pan150Aluminum
15Wire hanger157Stainless steel
16Catch pan1156Stainless steel
17Plastic plate2328Polycarbonate
18Screw1109Stainless steel
19Steel foot41248Painted steel
20Plastic frame11484Polycarbonate
21Packaging12035Carton (83%) and plastic (17%)
Total2914,755
Table A2. BOM of the swivel grill.
IDComponentCountWeight [g]Material Matching
in LCA Software
1Upper support1200Steel
2Drive wheel135Steel
3Leg holder1166Steel
4Upper leg1152Painted steel
5Middle leg5740Painted steel
6Bottom leg3453Painted steel
7Iron chain1331Galvanized chain
8Fire bowl11113Painted steel
9Grill grate1622Stainless steel
10Thermal insulation board1490Steel
11Fire bowl legs3206Steel
12Screw2457Stainless steel
13Packaging1735Carton (83%) and plastic (17%)
Total445300
Table A3. BOM of the gas grill.
IDComponentCountWeight [g]Material Matching
in LCA Software
1Flame cover TURBO ZONE00-
2Flame cover2602Stainless steel
3Upper part (lid)16850Stainless steel
4Grill grate32013Enameled cast iron
5Side shelf suspension2110Stainless steel
6Side shelf23616Stainless steel
7Side shelf suspension2110Stainless steel
8Control knob372Polycarbonate
9Fat drawer1200Stainless steel
10Side part underframe left112,188Painted steel
11–13Wheel axle, wheel, hub cap00-
14Suspension grease drip tray120Stainless steel
15Fat collection tray1360Stainless steel
16Front cross brace1Included in ID 10Painted steel
17Door1Included in ID 10Painted steel
18Lang gas bottle holder1Included in ID 10Painted steel
19Gas bottle holder1Included in ID 10Painted steel
20Door stoper1Included in ID 10Painted steel
21Base plate1Included in ID 10Painted steel
22Side part underframe right1Included in ID 10Painted steel
23Roller with brake4200Polycarbonate
24Gas pressure regulator with hose1145Stainless steel
25Back wall base frame1Included in ID 10Painted steel
26Heat shield with burner1Included in ID 10Painted steel
27Side stove00-
28Heat shield1Included in ID 10Painted steel
29Side stove00-
30Pot grate00-
31Thermometer178Stainless steel
32Hot grid1744Stainless steel
33Adjusting knob00-
Other components
1Back top layer11440Painted steel
2Upper side wall frame left1500Painted steel
3Upper side wall frame right1500Painted steel
4Front upper frame11199Painted steel
5Cover for lighter11326Painted steel
6Lighter1176Stainless steel
7Burner1689Stainless steel
8Packaging15302Carton (83%) and plastic (17%)
Total4438,440
Table A4. BOM of the round grill.
IDComponentCountWeight [g]Material Matching
in LCA Software
1Grill grate1230Chrome-plated steel
2Back wall base frame2110Stainless steel
3Screw, 10 mm91Stainless steel
4Screw, 20 mm32Stainless steel
5Wingnut122Stainless steel
6Plastic foot31Polycarbonate
7Reinforcement163Painted steel
8Holder369Painted steel
9Sticker with warnings1n/aPapier
10Grill tray1503Painted steel
11Packaging1157Carton (83%) and plastic (17%)
Total371138
Table A5. BOM of the kettle grill.
IDComponentCountWeight [g]Material Matching
in LCA Software
1Top handle124Polycarbonate
2Ventilation slider411Steel sheet
4Lid11614Painted steel
5Grill grate1850Chrome-plated steel
6Charcoal holder2125Steel
7Charcoal grate1737Steel
9Kettle13550Painted steel
10Bottom handle124Polycarbonate
11Ash tray1149Aluminum
12–13Support leg3350Chrome-plated steel
14Support leg cap12Polycarbonate
15Mounting bracket35Steel
16Wheel225Polycarbonate
18Floor grid1400Chrome-plated steel
Other components
1Washer32Galvanized steel
2Screw36Steel
3Screw stainless, thick27Stainless steel
4Screw stainless, thin11Stainless steel
5Nut21Aluminum
6Washer upper handle1112Chrome-plated steel
7Packaging11275Carton (83%) and plastic (17%)
Total289246
Table A6. BOM of the disposable charcoal grill.
IDComponentCountWeight [g]Material Matching
in LCA Software
1Steel grid144Stainless steel
2Aluminum bowl191Aluminum
3Plastic packaging14Polyethylene
4Paper packaging181Paper
5Charcoal1430Charcoal
Total5650

Appendix A.1. Disclaimer

All the presented BoMs are based on data obtained from the authors disassembling grilling devices, weighing the individual parts, and assuming their material to match it to datasets in the LCA background dataset. The manuals and product descriptions on the websites of manufacturers and retailers were checked to verify the data when possible. The manufacturers of the grills have not been involved in the creation or review of the presented life cycle inventory for this study. The compositions may vary between manufacturers, but the investigated devices are assumed to be robust representations of potential configurations.

Appendix B. Environmental Impacts of Grilling Ingredients

The following tables compile the environmental impacts for the production of grilling ingredients as investigated by other authors. Some of the values have been converted to align units for comparison (e.g., g CO2 eq. converted to kg CO2 eq.). It is also important to acknowledge that system boundaries differ between some of the presented studies or have not been reported transparently by their authors. Furthermore, most of the studies presented do not specify the time frame of impact mechanisms underlying the applied LCIA method. Therefore, comparisons of the single values are subject to some degree of uncertainty.
Table A7. Environmental impacts associated with the production of 1 kg of bread (FU = functional unit).
Data SourceMethod
as Stated by the Authors
Production ScaleCultivationGWP
[g CO2-eq./FU]
AP
[g SO2-eq./FU]
EP
[g PO4-eq./FU]
ADP/PED
[MJ/FU]
LU
[m2 Annual crop-eq./FU]
[56]ReCiPeIndustrial bakery-9376.27(0.49) *-2.1
[57]CML 2 baseline 2000Private householdConv.−5015.144.22--
Industrial bakeryConv.−5604.984.21--
[58]Not specifiedPrivate householdConv.6502.550.398.21.1
Industrial bakeryConv.4502.500.394.51.1
Private householdOrg.4401.000.097.01.7
Industrial bakeryOrg.2300.800.093.71.7
[59]Not specifiedPrivate householdOrg.610--14.34.58
[60]PAS 2050Industrial bakeryConv.1056----
[61]Not specifiedIndustrial bakeryConv.8043.23.12.461.4
Industrial bakeryOrg.7863.49.31.744.4
*: The unit for EP is given in g P-eq. No conversion of the unit was performed. The values are not considered in the evaluation of this paper.
Table A8. Environmental impacts associated with the production of 1 kg of vegetables *.
Data SourceMethod
as Stated by the Authors
Production ScalePlant SpeciesGWP
[kg CO2-eq./FU]
AP
[g SO2-eq./FU]
EP
[g PO4-eq./FU]
ADP/PED
[MJ/FU]
LU
[m2 Annual crop-eq./FU]
[62]PASOpen landMixed0.30.91.0--
[63]ReCiPe midpointGreenhouseLettuce0.431.75(0.3) **6.750.1
[64]CMLGreenhouseLettuce0.52.51.1--
[65]CML 2001GreenhouseLettuce2.6440.7563-
Open landLettuce0.272.50.8753-
[66]IPCCGreenhouseLettuce1.28----
Open landLettuce0.63----
[67]Not specifiedOpen landLettuce0.030.20.080.32-
GreenhouseLettuce0.211.350.283.74-
* Environmental impacts of vegetables are approximated mostly with lettuce due to its prevalence in barbecue according to [26]. **: The unit for EP is given in g P-eq. No conversion of the unit was performed. The values are not considered in the evaluation of this paper.
Table A9. Environmental impacts associated with the production of 1 L of beer.
Data SourceMethod
as Stated by the Authors
Production ScalePackageGWP
[kg CO2-eq./FU]
AP
[g SO2-eq./FU]
EP
[g PO4-eq./FU]
ADP/PED
[MJ/FU]
LU
[m2 Annual crop-eq./FU]
[68]Not specifiedLarge factory-1.26.03.0-1.2
[69]PAS 2050Large factory-1.27----
Small factory-1.92----
[70]CML 2001-Glass (330 mL)0.8423.852.7217.5-
-Aluminum (440 mL)0.5752.922.4211.3-
-Steel (440 mL)0.5102.132.3910.3-
[71]PAS 2050-Glass (330 mL)0.74----
-Glass (660 mL)0.57----
-Aluminum (330 mL)0.69----
-Steel (30 L)0.25----
[72]GWP: IPCC 2013 GWP 100a
AP, EP: ILCD 2011 Midpoint
ADP: CML-IA baseline
Large factoryGlass0.87----
Small factoryGlass1.3----
[73]PAS 2050Large factoryGlass (660 mL)1.032----
Large factoryPET (660 mL)1.015----
Small factoryGlass (660 mL)1.471----
Small factoryPET (660 mL)1.423----
[74]CML 1992-Returnable glass bottles (330 mL)0.050.786.06--
-Disposable glass bottles (330 mL)0.143.035.15--
Table A10. Environmental impacts associated with the production of 1 kg of beef.
Data SourceMethod
as Stated by the
Authors
Origin CalvesProduction System *DietGWP
[kg CO2-eq./FU]
AP
[g SO2-eq./FU]
EP
[g PO4-eq./FU]
ADP/PED
[MJ/FU]
LU
[m2 Annual crop-eq./FU]
[75]ReCiPeSucklerC/IConcentrate2332840.9--
[76]CML 2001SucklerC/IConcentrate14.8-10438.2-
SucklerC/IRoughage19.2-14248.4-
[46]EP: EDIP LCA Food; all others: ReCiPe MidpointSucklerO/ERoughage25.41220(1009.71) **-194.43
SucklerO/ERoughage26.3200(861.71) **-177.71
SucklerC/IConcentrate17.62200(779.27) **-40.67
[48]Not
specified
SucklerO/ERoughage27.3210(1651) **59.242.9
DairyC/IRoughage17.9131(737) **41.716.7
[77]Not
specified
DairyN.A.Concentrate7.9----
DairyN.A.Roughage15.9----
[78] ***Not
specified
DairyC/IN.A.20.81312---
[79] ***ReCiPe midpointDairyO/EN.A.9.34340(490) ****-118
-C/IN.A.8.86245(360) ****-48
[61]Not specifiedDairyO/EN.A.18.271132618.1-
*: C/I: Conventional and intensive systems; O/E: organic and extensive systems. **: The unit for EP is given in g NO3-eq. No conversion of the unit was performed. The values are not considered in the evaluation of this paper. ***: The environmental impacts of boneless beef were converted to bone-in beef according to ref. [47]. ****: The unit for EP is given in g P-eq. No conversion of the unit was performed. The values are not considered in the evaluation of this paper.
Table A11. Environmental impacts associated with the production of 1 kg of pork.
Data SourceMethod
as Stated by the Authors
Country of OriginGWP
[kg CO2-eq./FU]
AP
[g SO2-eq./FU]
EP
[g PO4-eq./FU]
ADP/PED
[MJ/FU]
LU
[m2 Annual crop-eq./FU]
[80]IPCC-3.6----
[81]EDIPDK3.645(147) *--
[82]Not
specified
SE4.0852-16.112.34
[83]Not
specified
FR2.343.520.815.95.43
3.9737.221.622.29.87
[61]Not
specified
UK6.4349100177.4
[84]ReCiPe MidpointES3.42186(19.5) **-4.96
[85]CML 2 Baseline 2000DE3.2257.123.319.5-
[86]CML 2001EU2.254419.016.2-
[87]Not specifiedNL2.5--18.14.4
*: The unit for EP is given in g NO3-eq. No conversion of the unit was performed. The values are not considered in the evaluation of this paper. **: The unit for EP is given in g P-eq. No conversion of the unit was performed. The values are not considered in the evaluation of this paper.
Table A12. Environmental impacts associated with the production of 1 kg of chicken.
Data SourceMethodCountry of OriginCommentGWP
[kg CO2-eq./FU]
AP
[g SO2-eq./FU]
EP
[g PO4-eq./FU]
ADP/PED
[MJ/FU]
LU
[m2 Annual crop-eq./FU]
[61]Not
specified
UKConv.4.5717249126.4
Free-range5.482306314.57.3
[88]CMLUKConv.4.4146.7520.3125.375.6
Free-range5.1359.7324.2625.657.2
Org.5.6691.5548.8240.3425
[89]CML 2 Baseline 2000IRSummer2.9341.7514.6941.16-
Winter5.3561.919.3472.63-
[90]CML 2 Baseline 2000USConv.1.4015.83.914.96-
[91]CML 2001PTConv.3.053.124.622.2-
[92]CML 2 Baseline 2000FRConv.3.1740.521.030.03.82
BRConv.2.4047.920.735.83.56

References

  1. brandlogistics.net. GFK-Studie: Der Grillmarkt in 2020. Available online: https://www.brandlogistics.net/gfk-studie-der-grillmarkt-in-2020 (accessed on 31 July 2023).
  2. Reale, F.; Castellani, V.; Hischier, R.; Corrado, S.; Sala, S. Consumer Footprint: Basket of Products Indicator on Household Appliances; European Commission, Joint Research Centre, Publication Office of the European Union: Luxembourg, 2019. [Google Scholar]
  3. Favi, C.; Germani, M.; Landi, D.; Mengarelli, M.; Rossi, M. Comparative life cycle assessment of cooking appliances in Italian kitchens. J. Clean. Prod. 2018, 186, 430–449. [Google Scholar] [CrossRef]
  4. Landi, D.; Consolini, A.; Germani, M.; Favi, C. Comparative life cycle assessment of electric and gas ovens in the Italian context: An environmental and technical evaluation. J. Clean. Prod. 2019, 221, 189–201. [Google Scholar] [CrossRef]
  5. Hischier, R.; Reale, F.; Castellani, V.; Sala, S. Environmental impacts of household appliances in Europe and scenarios for their impact reduction. J. Clean. Prod. 2020, 267, 121952. [Google Scholar] [CrossRef] [PubMed]
  6. Grignon-Masse, L.; Riviere, P.; Adnot, J. Strategies for reducing the environmental impacts of room air conditioners in Europe. Energy Policy 2011, 39, 2152–2164. [Google Scholar] [CrossRef]
  7. Ma, J.; Yin, F.; Liu, Z.; Zhou, X. The eco-design and green manufacturing of a refrigerator. Procedia Environ. Sci. 2012, 16, 522–529. [Google Scholar] [CrossRef]
  8. Spiegel. Verkaufszahlen von Fernsehern Gehen Deutlich Zurück. Available online: https://www.spiegel.de/netzwelt/gadgets/fernseher-verkaeufe-nach-coronaboom-sinkt-die-nachfrage-a-ee09c398-a9c7-45ed-b0e4-9156acc1e108 (accessed on 31 July 2023).
  9. Johnson, E. Charcoal versus LPG grilling: A carbon-footprint comparison. Environ. Impact Assess. Rev. 2009, 29, 370–378. [Google Scholar] [CrossRef]
  10. Johnson, E.; Gafford, A. USA Carbon Footprints of Grills, by Fuel & Grill Type. Fuels 2022, 3, 475–485. [Google Scholar] [CrossRef]
  11. TÜV Rheinland. Klimaoptimiertes Grillen Entlastet die Umwelt. Available online: https://kritisches-netzwerk.de/forum/oekobilanz-von-tuev-rheinland-klimaoptimiertes-grillen-entlastet-die-umwelt (accessed on 2 June 2023).
  12. Statista. Was Trinken Sie in der Regel zum Grillen? Available online: https://de.statista.com/statistik/daten/studie/719644/umfrage/beliebteste-getraenke-beim-grillen-in-deutschland/ (accessed on 16 August 2023).
  13. Sphera. Managed LCA Content (Formerly Known As GaBi Data): CUP2023.1; Sphera: Salt Lake City, UT, USA, 2023. [Google Scholar]
  14. Sphera. LCA for Experts, Version 10.6.1.35; Sphera: Leinfelden-Echterdingen, Germany, 2023. [Google Scholar]
  15. Afrane, G.; Ntiamoah, A. Comparative life cycle assessment of charcoal, biogas, and liquefied petroleum gas as cooking fuels in Ghana. J. Ind. Ecol. 2011, 15, 539–549. [Google Scholar] [CrossRef]
  16. SimaPro. Meet the Developer: PRé Sustainability. Available online: https://simapro.com/about/about-pre/ (accessed on 4 June 2023).
  17. Sphera. GaBi Databases & Modeling Principles 2021. Available online: https://sphera.com/wp-content/uploads/2020/04/Modeling-Principles-GaBi-Databases-2021.pdf (accessed on 5 June 2023).
  18. ISO 14040:1997; Environmental Management-Life Cycle Assessment-Principles and Framework. International Organization for Standardization: Geneva, Switzerland, 1997.
  19. ISO 14040:2006/Amd 1:2020; Environmental Management: Life Cycle Assessment-Principles and Framework-Amendment 1. International Organization for Standardization: Geneva, Switzerland, 2020.
  20. Davis, S.J.; Caldeira, K. Consumption-based accounting of CO2 emissions. Proc. Natl. Acad. Sci. USA 2010, 107, 5687–5692. [Google Scholar] [CrossRef]
  21. Hoekstra, A.Y.; Mekonnen, M.M. The water footprint of humanity. Proc. Natl. Acad. Sci. USA 2012, 109, 3232–3237. [Google Scholar] [CrossRef]
  22. Wiedmann, T.O.; Schandl, H.; Lenzen, M.; Moran, D.; Suh, S.; West, J.; Kanemoto, K. The material footprint of nations. Proc. Natl. Acad. Sci. USA 2015, 112, 6271–6276. [Google Scholar] [CrossRef] [PubMed]
  23. Stadler, K.; Wood, R.; Bulavskaya, T.; Södersten, C.-J.; Simas, M.; Schmidt, S.; Usubiaga, A.; Acosta-Fernández, J.; Kuenen, J.; Bruckner, M. EXIOBASE 3: Developing a time series of detailed environmentally extended multi-regional input-output tables. J. Ind. Ecol. 2018, 22, 502–515. [Google Scholar] [CrossRef]
  24. Sala, S.; Castellani, V. The consumer footprint: Monitoring sustainable development goal 12 with process-based life cycle assessment. J. Clean. Prod. 2019, 240, 118050. [Google Scholar] [CrossRef]
  25. gfu. Welchen Grilltyp Ziehen Sie vor? Available online: https://de.statista.com/statistik/daten/studie/1244014/umfrage/umfrage-zur-bevorzugten-grillart-deutschland-grossbritannien/ (accessed on 12 June 2023).
  26. POSpulse. Welche Lebensmittel Dürfen Beim Grillen Nicht Fehlen? Available online: https://de.statista.com/statistik/daten/studie/1055922/umfrage/bevorzugte-lebensmittel-beim-grillen/ (accessed on 28 May 2023).
  27. VuMA. Bevölkerung in Deutschland nach Häufigkeit von Grillen bzw. Barbecue in der Freizeit von 2017 bis 2021. Available online: https://de.statista.com/statistik/daten/studie/247175/umfrage/haeufigkeit-des-wanderns-in-der-freizeit/ (accessed on 5 June 2023).
  28. Stephan, L.; Ute, S.; Sabine, B. Analyse der Datenerhebungen nach ElektroG und UStatG über das Berichtsjahr 2018 zur Vorbereitung der EU-Berichtspflichten 2020; Umweltbundesamt: Berlin, Germany, 2020. [Google Scholar]
  29. Aufgetischt.net. Grill & BBQ Studie 2019/20. Available online: https://www.aufgetischt.net/grillstudie/ (accessed on 5 June 2023).
  30. Boeser-Wolf. Wozu Kann Man Baguette Essen. Available online: https://www.boeser-wolf.schule.de/frankreich-fuer-kinder/restaurant/reportage/brot.html (accessed on 7 June 2023).
  31. Keramikgrill. Grillen für Viele Personen: Tipps für Die Entspannte Grillparty. Available online: https://www.keramikgrills.com/ratgeber/grillen-fuer-viele-personen/ (accessed on 7 June 2023).
  32. Statista. Grillen & Outdoor Cooking 2017. Available online: https://de.statista.com/statistik/studie/id/47908/dokument/tabellenband-grillen-und-outdoor-cooking-2017/ (accessed on 5 June 2023).
  33. Swissmilk. Grillparty: Welche Mengen pro Person? Available online: https://www.swissmilk.ch/de/rezepte-kochideen/tipps-tricks/grillparty-welche-mengen-pro-person/ (accessed on 7 June 2023).
  34. Abdel-Shafy, H.I.; Mansour, M.S.M. A review on polycyclic aromatic hydrocarbons: Source, environmental impact, effect on human health and remediation. Egypt. J. Pet. 2016, 25, 107–123. [Google Scholar] [CrossRef]
  35. Liesegang, C.; Aleysa, M.; Mathias, B.; Pillhofer, T.; Alfred, T. Charakterisierung von Emissionen aus Holzkohlegrills und ihr Einfluss auf die Luftqualität. UMID Umw. Mensch Inf. 2021, 2, 27–38. [Google Scholar]
  36. Nguyen, T.L.; Hermansen, J.E.; Mogensen, L. Environmental Assessment of Danish Pork; Aarhus University: Aarhus, Denmark, 2011. [Google Scholar]
  37. Juha-Matti, K. Experiences and improvement possibilities: LCA case study of broiler chicken production. In Proceedings of the 3rd International Conference on Life Cycle Management, Zurich, Germany, 27–29 August 2007. [Google Scholar]
  38. Cimini, A.; Moresi, M. Environmental impact of the main household cooking systems: A survey. Ital. J. Food Sci. 2022, 34, 86–113. [Google Scholar] [CrossRef]
  39. Guinée, J.B. Handbook on life cycle assessment: Operational guide to the ISO standards. Int. J. Life Cycle Assess. 2001, 6, 255. [Google Scholar] [CrossRef]
  40. Huijbregts, M.A.J.; Steinmann, Z.J.N.; Elshout, P.M.F.; Stam, G.; Verones, F.; Vieira, M.; Zijp, M.; Hollander, A.; van Zelm, R. ReCiPe2016: A harmonised life cycle impact assessment method at midpoint and endpoint level. Int. J. Life Cycle Assess. 2017, 22, 138–147. [Google Scholar] [CrossRef]
  41. Britta, B.; Corinna, E.; Harald, E.; Sören, H.; Marius, K.; Carlolin, K. Deutschland Rohstoffsituationsbericht 2021; Bundesanstalt für Geowissenschaften und Rohstoffe: Hannover, Germany, 2022. [Google Scholar]
  42. Yellishetty, M.; Mudd, G.M.; Ranjith, P.G.; Tharumarajah, A. Environmental life-cycle comparisons of steel production and recycling: Sustainability issues, problems and prospects. Environ. Sci. Policy 2011, 14, 650–663. [Google Scholar] [CrossRef]
  43. Johnson, J.; Reck, B.K.; Wang, T.; Graedel, T.E. The energy benefit of stainless steel recycling. Energy Policy 2008, 36, 181–192. [Google Scholar] [CrossRef]
  44. Noleppa, S.; Cartsburg, M. Nahrungsmittelverbrauch und Fußabdrücke des Konsums in Deutschland; WWF: Berlin, Germany, 2015. [Google Scholar]
  45. Scherhaufer, S.; Schuller, H.; Leverenz, D. Ermittlung der Weggeworfenen Lebensmittelmengen und Vorschläge zur Verminderung der Wegwerfrate bei Lebensmitteln in Deutschland; Bundesministerium für Ernährung und Landwirtschaft (BMEL): Stuttgart, Germany, 2012. [Google Scholar]
  46. Bragaglio, A.; Napolitano, F.; Pacelli, C.; Pirlo, G.; Sabia, E.; Serrapica, F.; Serrapica, M.; Braghieri, A. Environmental impacts of Italian beef production: A comparison between different systems. J. Clean. Prod. 2018, 172, 4033–4043. [Google Scholar] [CrossRef]
  47. de Vries, M.; de Boer, I.J.M. Comparing environmental impacts for livestock products: A review of life cycle assessments. Livest. Sci. 2010, 128, 1–11. [Google Scholar] [CrossRef]
  48. Nguyen, T.L.T.; Hermansen, J.E.; Mogensen, L. Environmental consequences of different beef production systems in the EU. J. Clean. Prod. 2010, 18, 756–766. [Google Scholar] [CrossRef]
  49. Andreas, G.; Viola, I.; Miretti, S.; Macchi, E.; Perona, G.; Battaglini, L.M.; Baratta, M. A New Approach to LCA Evaluation of Lamb Meat Production in Two Different Breeding Systems in Northern Italy. Front. Vet. Sci. 2020, 7, 651. [Google Scholar]
  50. Geß, A.; Hazar Kalonya, D. Sustainable Husbandry?—A Comparative LCA of Three Lamb Breeding Systems in Turkey. Circ. Econ. Sustain. 2023, 3, 1769–1791. [Google Scholar] [CrossRef] [PubMed]
  51. Geß, A.; Tolsdorf, A.; Ko, N. A life cycle perspective of lamb meat production systems from Turkey and the EU. Small Rumin. Res. 2022, 208, 106637. [Google Scholar] [CrossRef]
  52. Koroneos, C.; Roumbas, G.; Gabari, Z.; Papagiannidou, E.; Moussiopoulos, N. Life cycle assessment of beer production in Greece. J. Clean. Prod. 2005, 13, 433–439. [Google Scholar] [CrossRef]
  53. Rasines, L.; Morera, S.; San Miguel, G.; Artés-Hernández, F.; Aguayo, E. Environmental and economic sustainability of fresh-cut and pre-cooked vegetables. Sci. Total Environ. 2023, 872, 162169. [Google Scholar] [CrossRef]
  54. UNECE. Life Cycle Assessment of Electricity Generation Options; UNECE: New York, NY, USA, 2021. [Google Scholar]
  55. McDonald, J.D.; Zielinska, B.; Fujita, E.M.; Sagebiel, J.C.; Chow, J.C.; Watson, J.G. Emissions from charbroiling and grilling of chicken and beef. J. Air Waste Manag. Assoc. 2003, 53, 185–194. [Google Scholar] [CrossRef]
  56. Korsaeth, A.; Jacobsen, A.Z.; Roer, A.-G.; Henriksen, T.M.; Sonesson, U.; Bonesmo, H.; Skjelvåg, A.O.; Strømman, A.H. Environmental life cycle assessment of cereal and bread production in Norway. Acta Agric. Scand. Sect. A–Anim. Sci. 2012, 62, 242–253. [Google Scholar] [CrossRef]
  57. Bimpeh, M.; Djokoto, E.; Doe, H.; Jequier, R. Life Cycle Assessment (LCA) of the Production of Homemade and Industrial Bread in Sweden; Life Cycle Assessment Course (1N1800); KTH: Stockholm, Sweden, 2006. [Google Scholar]
  58. Braschkat, J.; Patyk, A.; Quirin, M.; Reinhardt, G.A. (Eds.) Life cycle assessment of bread production: A comparison of eight different scenarios. In Proceedings of the 4th International Conference on “Life Cycle Assessment in the Agrifood Sector”, Horsens, Denmark, 6–8 October 2004. [Google Scholar]
  59. Michal, K.; Thomas, N.; Emmanuel, F.; Gerard, G. (Eds.) Ecodesign opportunities for a farmer’s bread: Two case studies from north-western France. In Proceedings of the 8th Conference on LCA in the Agri-Food Sector, Saint-Malo, France, 1–4 October 2012. [Google Scholar]
  60. Jensen, J.K.; Arlbjørn, J.S. Product carbon footprint of rye bread. J. Clean. Prod. 2014, 82, 45–57. [Google Scholar] [CrossRef]
  61. Williams, A.; Audsley, E.; Sandars, D. Determining the Environmental Burdens and Resource Use in the Production of Agricultural and Horticultural Commodities: Defra Project Report IS0205; Cranfield University and Defra: Bedford, UK, 2006. [Google Scholar]
  62. Kashyap, D.; de Vries, M.; Pronk, A.; Adiyoga, W. Environmental impact assessment of vegetable production in West Java, Indonesia. Sci. Total Environ. 2023, 864, 160999. [Google Scholar] [CrossRef]
  63. Frankowska, A.; Jeswani, H.K.; Azapagic, A. Environmental impacts of vegetables consumption in the UK. Sci. Total Environ. 2019, 682, 80–105. [Google Scholar] [CrossRef] [PubMed]
  64. Perrin, A.; Basset-Mens, C.; Gabrielle, B. Life cycle assessment of vegetable products: A review focusing on cropping systems diversity and the estimation of field emissions. Int. J. Life Cycle Assess. 2014, 19, 1247–1263. [Google Scholar] [CrossRef]
  65. i Canals, L.M.; Muñoz, I.; Hospido, A.; Plassmann, K.; McLaren, S.; Edwards-Jones, G.; Hounsome, B. Life Cycle Assessment (LCA) of Domestic vs. Imported Vegetables: Case Studies on Broccoli, Salad Crops and Green Beans; University of Surrey: Guildford, UK, 2008. [Google Scholar]
  66. Foteinis, S.; Chatzisymeon, E. Life cycle assessment of organic versus conventional agriculture: A case study of lettuce cultivation in Greece. J. Clean. Prod. 2016, 112, 2462–2471. [Google Scholar] [CrossRef]
  67. Romero-Gámez, M.; Audsley, E.; Suárez-Rey, E.M. Life cycle assessment of cultivating lettuce and escarole in Spain. J. Clean. Prod. 2014, 73, 193–203. [Google Scholar] [CrossRef]
  68. Poore, J.; Nemecek, T. Reducing food’s environmental impacts through producers and consumers. Science 2018, 360, 987–992. [Google Scholar] [CrossRef] [PubMed]
  69. Cimini, A.; Moresi, M. Mitigation measures to minimize the cradle-to-grave beer carbon footprint as related to the brewery size and primary packaging materials. J. Ind. Ecol. 2018, 236, 1–8. [Google Scholar] [CrossRef]
  70. Amienyo, D.; Azapagic, A. Life cycle environmental impacts and costs of beer production and consumption in the UK. Int. J. Life Cycle Assess. 2016, 21, 492–509. [Google Scholar] [CrossRef]
  71. Cimini, A.; Moresi, M. Carbon footprint of a pale lager packed in different formats: Assessment and sensitivity analysis based on transparent data. J. Clean. Prod. 2016, 112, 4196–4213. [Google Scholar] [CrossRef]
  72. Morgan, D.R.; Styles, D.; Lane, E.T. Thirsty work: Assessing the environmental footprint of craft beer. Sustain. Prod. Consum. 2021, 27, 242–253. [Google Scholar] [CrossRef]
  73. Cimini, A.; Moresi, M. Effect of brewery size on the main process parameters and cradle-to-grave carbon footprint of lager beer. J. Ind. Ecol. 2018, 22, 1139–1155. [Google Scholar] [CrossRef]
  74. Mata, T.M.; Costa, C.A.V. Life cycle assessment of different reuse percentages for glass beer bottles. Int. J. Life Cycle Assess. 2001, 6, 307–319. [Google Scholar] [CrossRef]
  75. Lupo, C.D.; Clay, D.E.; Benning, J.L.; Stone, J.J. Life-cycle assessment of the beef cattle production system for the northern great plains, USA. J. Environ. Qual. 2013, 42, 1386–1394. [Google Scholar] [CrossRef]
  76. Pelletier, N.; Pirog, R.; Rasmussen, R. Comparative life cycle environmental impacts of three beef production strategies in the Upper Midwestern United States. Agric. Syst. 2010, 103, 380–389. [Google Scholar] [CrossRef]
  77. McAuliffe, G.A.; Takahashi, T.; Lee, M.R.F. Framework for life cycle assessment of livestock production systems to account for the nutritional quality of final products. Food Energy Secur. 2018, 7, e00143. [Google Scholar] [CrossRef] [PubMed]
  78. Asem-Hiablie, S.; Battagliese, T.; Stackhouse-Lawson, K.R.; Alan Rotz, C. A life cycle assessment of the environmental impacts of a beef system in the USA. Int. J. Life Cycle Assess. 2019, 24, 441–455. [Google Scholar] [CrossRef]
  79. Huerta, A.R.; Güereca, L.P.; Lozano, M. Environmental impact of beef production in Mexico through life cycle assessment. Resour. Conserv. Recycl. 2016, 109, 44–53. [Google Scholar] [CrossRef]
  80. Reckmann, K.; Traulsen, I.; Krieter, J. Environmental Impact Assessment: Methodology with special emphasis on European pork production. J. Environ. Manag. 2012, 107, 102–109. [Google Scholar] [CrossRef] [PubMed]
  81. Dalgaard, R.; Halberg, N.; Hermansen, J.E. Danish Pork Production: An Environmental Assessment; University of Aarhus: Aarhus, Denmark, 2007. [Google Scholar]
  82. Cederberg, C. Environmental Assessment of Future Pig Farming Systems: Quantifications of Three Scenarios from the FOOD 21 Synthesis Work; SIK Institutet för Livsmedel och Bioteknik: Göteborg, Sweden, 2004. [Google Scholar]
  83. Basset-Mens, C.; van der Werf, H.M.G. Scenario-based environmental assessment of farming systems: The case of pig production in France. Agric. Ecosyst. Environ. 2005, 105, 127–144. [Google Scholar] [CrossRef]
  84. Noya, I.; Villanueva-Rey, P.; González-García, S.; Fernandez, M.D.; Rodriguez, M.R.; Moreira, M.T. Life Cycle Assessment of pig production: A case study in Galicia. J. Clean. Prod. 2017, 142, 4327–4338. [Google Scholar] [CrossRef]
  85. Reckmann, K.; Traulsen, I.; Krieter, J. Life Cycle Assessment of pork production: A data inventory for the case of Germany. Livest. Sci. 2013, 157, 586–596. [Google Scholar] [CrossRef]
  86. Dourmad, J.-Y.; Ryschawy, J.; Trousson, T.; Bonneau, M.; Gonzàlez, J.; Houwers, H.W.; Hviid, M.; Zimmer, C.; Nguyen, T.L.; Morgensen, L. Evaluating environmental impacts of contrasting pig farming systems with life cycle assessment. Animal 2014, 8, 2027–2037. [Google Scholar] [CrossRef] [PubMed]
  87. van Zanten, H.H.; Bikker, P.; Mollenhorst, H.; Meerburg, B.G.; de Boer, I.J. Environmental impact of replacing soybean meal with rapeseed meal in diets of finishing pigs. Animal 2015, 9, 1866–1874. [Google Scholar] [CrossRef] [PubMed]
  88. Leinonen, I.; Williams, A.G.; Wiseman, J.; Guy, J.; Kyriazakis, I. Predicting the environmental impacts of chicken systems in the United Kingdom through a life cycle assessment: Broiler production systems. Poult. Sci. 2012, 91, 8–25. [Google Scholar] [CrossRef] [PubMed]
  89. Kalhor, T.; Rajabipour, A.; Akram, A.; Sharifi, M. Environmental impact assessment of chicken meat production using life cycle assessment. Inf. Process. Agric. 2016, 3, 262–271. [Google Scholar] [CrossRef]
  90. Pelletier, N. Environmental performance in the US broiler poultry sector: Life cycle energy use and greenhouse gas, ozone depleting, acidifying and eutrophying emissions. Agric. Syst. 2008, 98, 67–73. [Google Scholar] [CrossRef]
  91. González-García, S.; Gomez-Fernández, Z.; Dias, A.C.; Feijoo, G.; Moreira, M.T.; Arroja, L. Life Cycle Assessment of broiler chicken production: A Portuguese case study. J. Clean. Prod. 2014, 74, 125–134. [Google Scholar] [CrossRef]
  92. Da Silva Junior, V.P.; Cherubini, E.; Soares, S.R. (Eds.) Comparison of Two Production Scenarios of Chickens Consumed in France. In Proceedings of the 8th Conference on LCA in the Agri-Food Sector, Saint-Malo, France, 1–4 October 2012. [Google Scholar]
Figure 1. Investigation approach for this study.
Sustainability 16 01041 g001
Figure 2. System boundary for the LCA of grilling devices.
Sustainability 16 01041 g002
Figure 3. The six grilling devices selected for this study: (a) swivel grill, (b) round grill, (c) kettle grill, (d) disposable grill, (e) electric grill, and (f) gas grill (source: authors’ own photos).
Sustainability 16 01041 g003
Figure 4. Environmental impacts of six grilling ingredients per kilogram or liter: (a) global warming potential; (b) acidification potential; (c) eutrophication potential; (d) abiotic depletion fossil; (e) land use.
Sustainability 16 01041 g004
Figure 5. Comparison of environmental impacts of six grilling ingredients per functional unit (FU = quantity consumed for one barbeque event for four people).
Sustainability 16 01041 g005
Figure 6. Comparison of the environmental impacts of four types of grilling devices, considering all of their life cycle phases (production, use, and end-of-life), excluding the grilling ingredients.
Sustainability 16 01041 g006
Figure 7. Contribution of each life stage to the environmental impacts: (a) swivel grill; (b) disposable grill; (c) electric grill; (d) gas grill.
Sustainability 16 01041 g007aSustainability 16 01041 g007b
Figure 8. Comparison of the environmental impacts of four types of grilling devices, considering all grill sectors (grilling devices, energy sources, and grilling ingredients).
Sustainability 16 01041 g008
Figure 9. Comparison of environmental impacts in five categories of four types of grilling devices in relation to three grill sectors in percentages, considering all life cycle phases (contributions smaller than 5 % are not labelled in the graph).
Sustainability 16 01041 g009
Figure 10. Comparison of the changes in the five categories of environmental impacts across the various scenarios.
Sustainability 16 01041 g010
Table 1. Average consumption of various grilling ingredients per person at an event [29,30,31,32,33].
Grilling IngredientsQuantity
Beef105 g
Pork120 g
Chicken75 g
Vegetables100 g
Bread70 g
Beer1 L
Table 2. Environmental impacts of the provision of 1 kg of charcoal, excluding transport, according to Cimini et al. [38].
Impact CategoriesUnitValues
GWPkg CO2-eq./kg2.71
APg SO2-eq./kg2.66
EPg PO4-eq./kg0.384
ADPMJ/kg4.17
LUm2 annual crop-eq./kg1.84
Table 3. Parameters of different scenarios during barbecuing.
ScenariosGrilling DeviceEnergy ConsumptionGrilling Ingredient
ReferenceLifespan: 5 a
Weight: 100%
Consumption quantity: 100%Food waste: 20%
35% Beef
40% Pork
25% Chicken
S2—heavy grill, short lifespanLifespan: 2 a
Weight: 120%
--
S3—high energy demand-Consumption quantity: 150%-
S4—high food waste--Food waste: 30%
Worst-Case Scenario
(=combination of S2 to S4)
Lifespan: 2 a
Weight: 120%
Consumption quantity: 150%Food waste: 30%
S5—lightweight grill, long lifespanLifespan: 10 a
Weight: 80%
--
S6—low energy demand-Consumption quantity: 50%-
S7—adapted diet--Without beef
60% Pork
40% Chicken
S8—no food waste--Food waste: 0%
Best-Case Scenario
(=combination of S5 to S8)
Lifespan: 10 a
Weight: 80%
Consumption quantity: 50%Without beef
60% Pork
40% Chicken
Food waste: 0%
Table 4. Environmental impacts of six grills across the life cycle phases of production, use and end-of-life.
Impact CategoriesUnitSwivel GrillRound GrillKettle GrillDisposable Charcoal GrillElectric GrillGas Grill
GWPkg CO2-eq./FU2.222.082.293.901.801.66
APg SO2-eq./FU2.812.233.187.863.836.91
EPg PO4-eq./FU0.380.330.430.870.540.64
ADPMJ/FU5.264.056.1318.5317.8840.52
LUm2 annual crop-eq./FU1.361.351.371.680.170.10
Disclaimer/Publisher’s Note: The statements, opinions and data contained in all publications are solely those of the individual author(s) and contributor(s) and not of MDPI and/or the editor(s). MDPI and/or the editor(s) disclaim responsibility for any injury to people or property resulting from any ideas, methods, instructions or products referred to in the content.

