Article

Passive Safety Assessment of Railroad Trains in Moose Herd Collision Scenarios

1
CCRC Qingdao Sifang Co., Ltd., Qingdao 266000, China
2
Key Laboratory of Traffic Safety on Track, Ministry of Education, School of Traffic & Transportation Engineering, Central South University, Changsha 410075, China
*
Author to whom correspondence should be addressed.
Sustainability 2024, 16(3), 1043; https://doi.org/10.3390/su16031043
Submission received: 4 December 2023 / Revised: 19 January 2024 / Accepted: 22 January 2024 / Published: 25 January 2024

Abstract

:
Moose herd–train collisions represent one of the potential hazards that railway operations must contend with, making the assessment of passive train safety in such scenarios a crucial concern. This study analyzes the responses of bullet trains colliding with moose herds and investigates the influence of various factors under these conditions. To achieve this goal, a multibody (MB) model was developed using the MADYMO platform. The displacement of the moose’s center of gravity (CG) was employed to assess the safety boundaries, while the relative positions between the wheels and rails were used to evaluate the risk of derailment. The findings revealed that the collision forces exhibited multi-peak characteristics that were subsequently transmitted to the wheel–rail contact system, resulting in disturbances in the relative positions of the wheels and rails. However, these disturbances did not reach a level that would induce train derailment. Furthermore, larger moose herds exhibited higher throw heights, although these heights remained within safe limits and did not pose a threat to overhead lines. The primary safety risk in moose–train collisions stemmed from secondary collisions involving moose that had fallen onto the tracks and oncoming trains. This study offers valuable insights for enhancing the operational safety of high-speed trains and safeguarding wildlife along railway corridors.

1. Introduction

The moose, the largest member of the deer family worldwide, has a widespread distribution across northern Eurasia and North America, with limited presence in China. The rapid expansion of railway networks around the world has compelled trains to traverse moose habitats, resulting in an elevated frequency of train–moose collisions [1,2]. Statistics suggest that the number of collisions between trains and ungulate animals in the United States reaches several million incidents annually, with Europe experiencing around 500,000 cases each year [3]. Trains travel at high speed along the tracks and are unable to turn or brake quickly, making collisions with wildlife nearly unavoidable [4]. Due to the substantial mass and size of moose, train–moose collisions rank among the most severe incidents in the realm of train–wildlife collisions, often yielding dire consequences such as the loss of animal and human life [5,6] and substantial economic damage [7]. Consequently, this issue has emerged as a significant societal concern in numerous countries [8,9]. Thus, it is imperative to explore train–moose collisions.
In the pursuit of mitigating train–moose collision accidents, researchers have undertaken a series of investigations. Andreassen et al. [10] conducted a comparative analysis examining the differences between accident occurrences during periods when mitigation measures were implemented and those when no measures were applied. The authors’ findings highlighted the effectiveness of strategies such as forest clearing and supplemental feeding in reducing the number of collisions. Jasinska et al. [3] conducted an analysis of the average number of animal tracks along railway lines and proposed the use of sonic deterrent devices as a means to limit train–moose collisions. Additionally, the authors evaluated the effectiveness of wildlife warning reflectors, but the results suggested that such reflectors were not effective in modifying animal behavior or reducing the risk of train–moose collisions [11]. These studies collectively underscore the formidable challenge of deterring moose from railway lines. Train–moose collisions are nearly unavoidable since trains lack the maneuverability of highway vehicles in actively avoiding collisions by changing lanes. Consequently, there is a dearth of research on train response and process analyses related to large animal–train collisions. Zhang et al. [12] conducted a comparative analysis of the dynamic responses during high-speed train collisions with various live intruders, demonstrating that larger organisms pose a higher risk to train safety, as evidenced by measures such as maximum acceleration and wheel pair lift. Meanwhile, Peng et al. investigated the motion trajectory of moose following bullet train–moose collisions. The results indicated that the dynamic response was primarily influenced by the contact area between the train and the moose [13], and in some scenarios, there was a risk of overhead line damage [14]. Furthermore, collision incidents sometimes involve entire moose herds and a train, which presents a greater risk compared to single-moose collisions. This increased risk is due to the higher collision energy, which significantly impacts wheel–rail contact forces and may elevate the risk of derailment. Moreover, the interactions between moose can alter their trajectories after collisions.
In summary, the analysis and assessment of train–moose herd collisions represent an urgent challenge in railway safety, with substantial implications for research in passive train safety. To address this knowledge gap, a comprehensive high-speed train crash safety assessment in the context of train–moose herd collisions was conducted. In Section 2, a coupled crash model for train–moose herd interactions developed using the MADYMO software version 7.5 is presented. The moose model and the train model were validated through accident reconstructions, and the coupled model was verified based on its consistency with a finite element analysis. Additionally, we built a parametric analysis matrix that involved the manipulation of four key parameters: moose size, train speed, moose speed, and moose distance intervals. Safety evaluation criteria were formulated based on the train derailment and train safety boundaries. In Section 3, the dynamic responses of train–moose herd collisions involving moose of varying body sizes during low-speed crashes are thoroughly investigated. Simulations are conducted based on a parametric analysis matrix. In Section 4, based on the evaluation indexes, this study explores the impact of individual factors on moose motion trajectories and the potential for derailment using the ANOVA statistical method. Finally, Section 5 provides a concise summary of the study’s findings and conclusions.

2. Materials and Methods

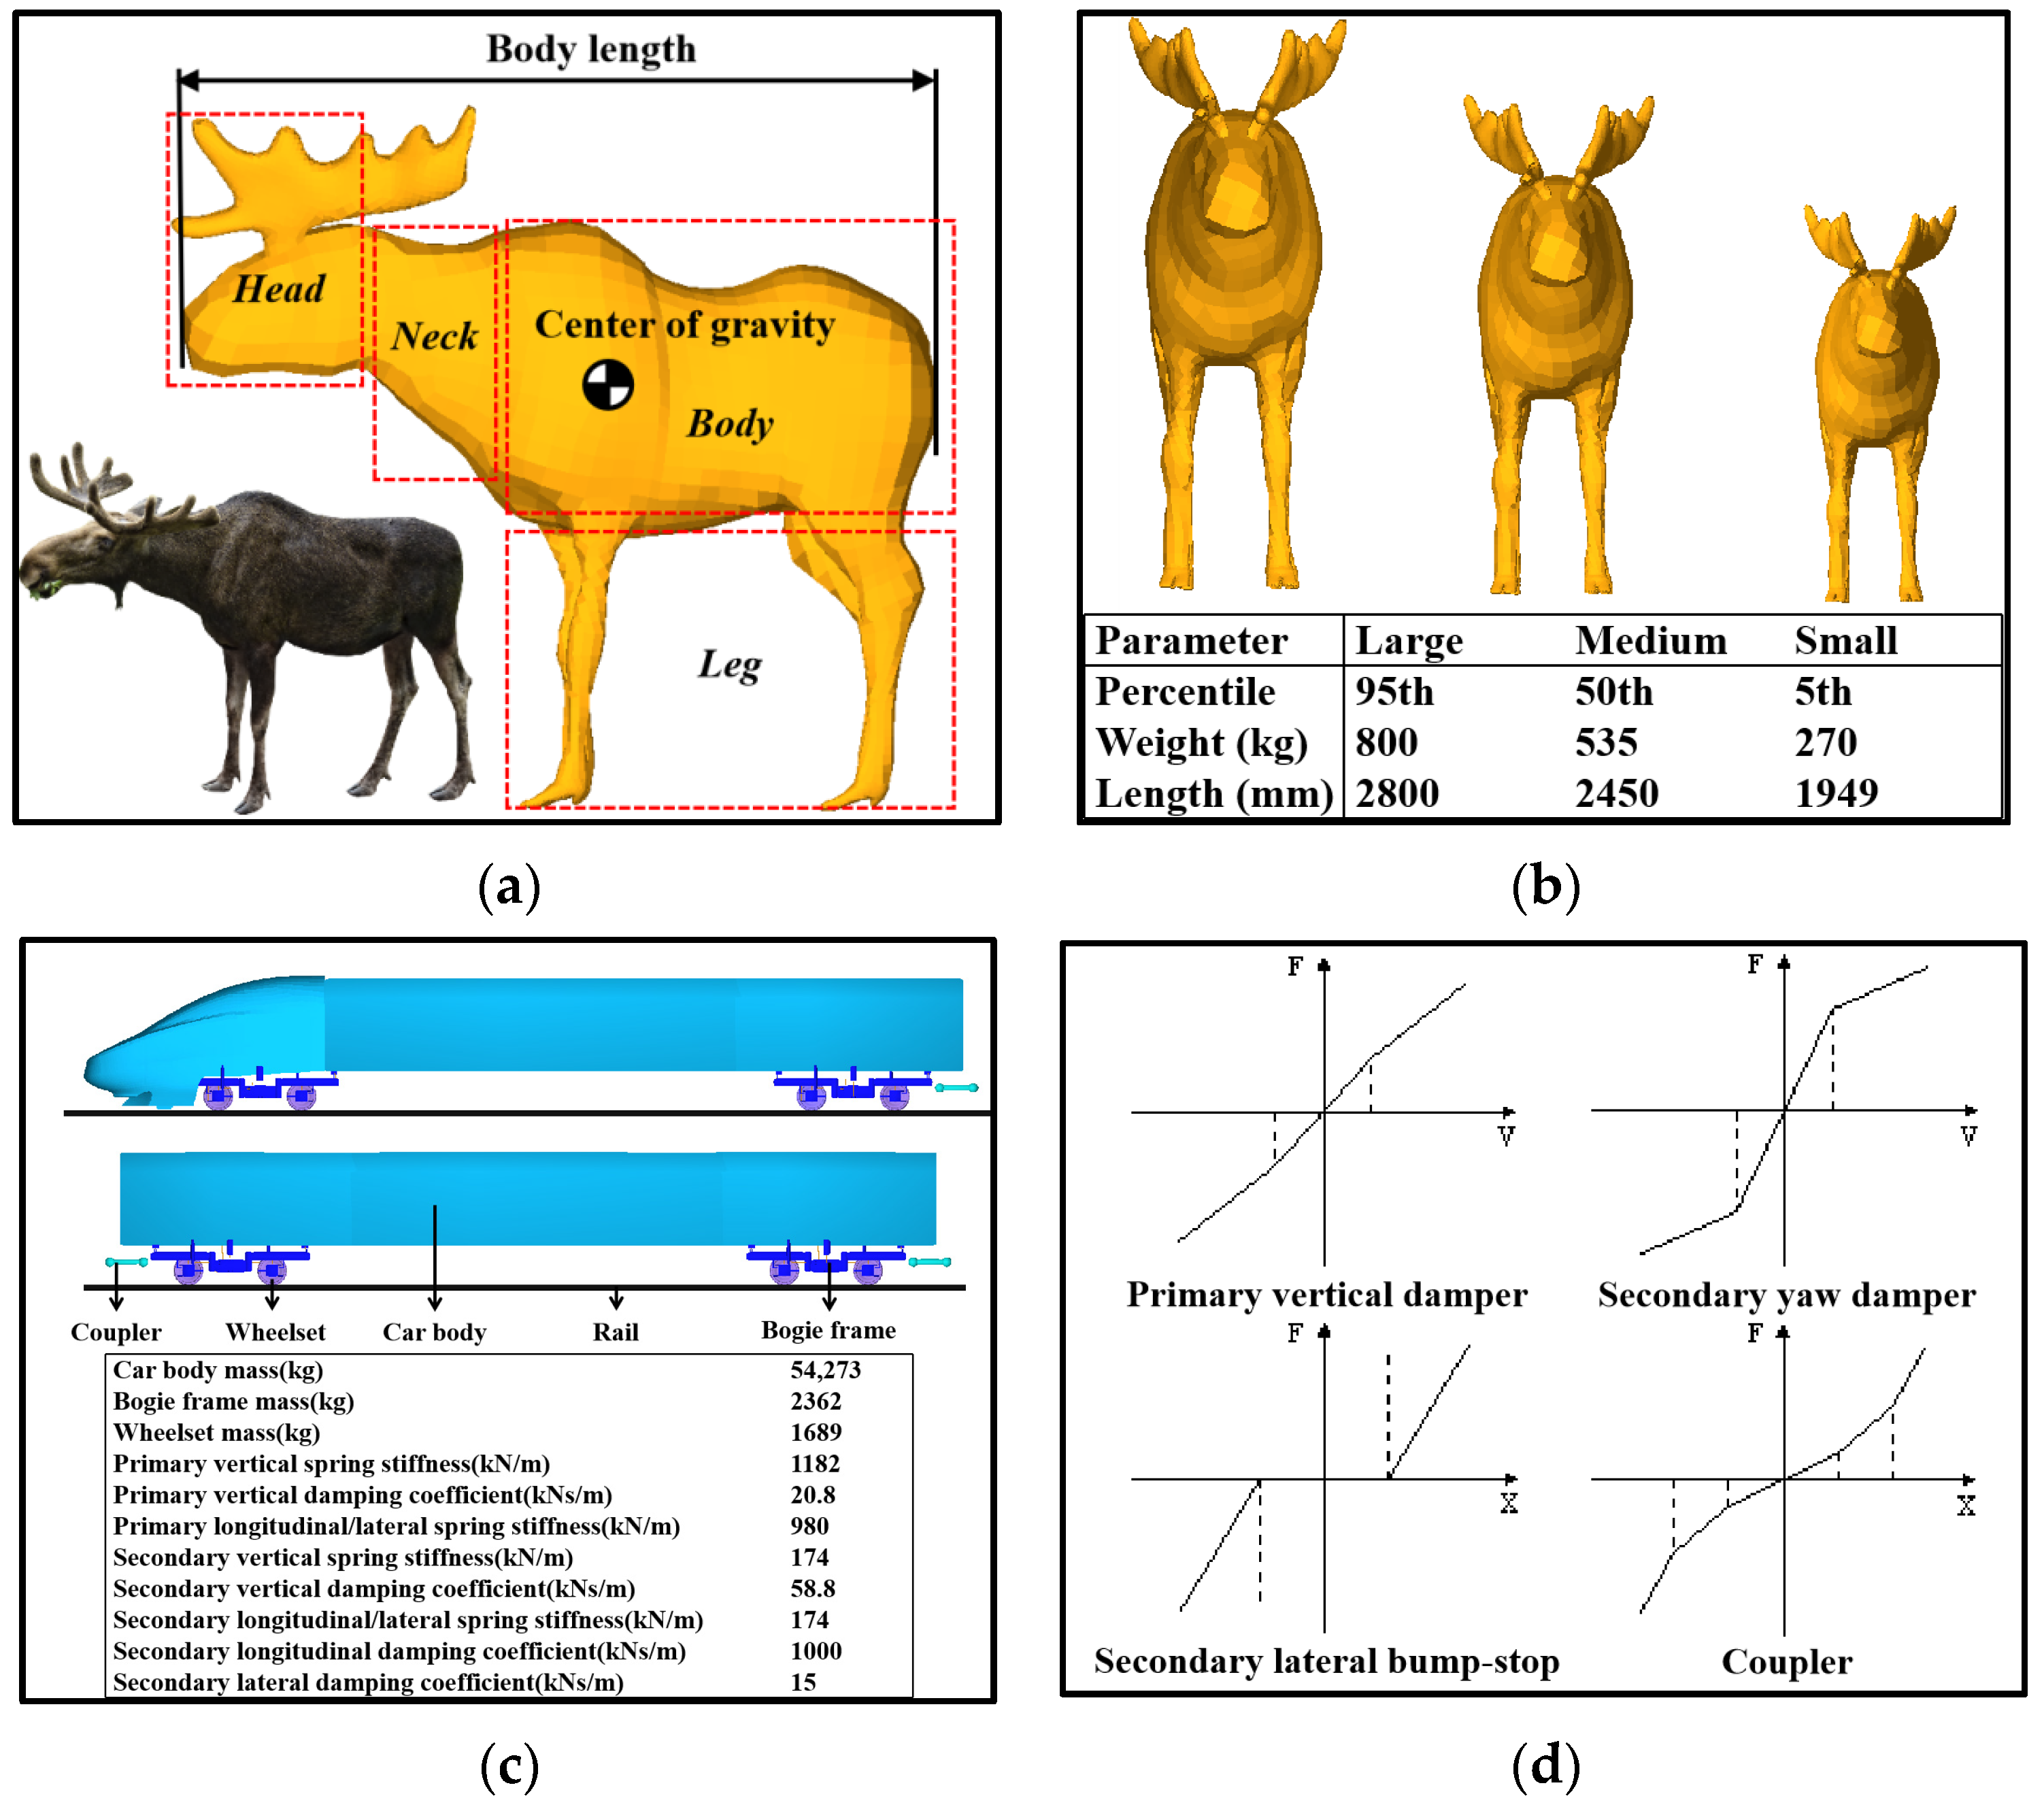
2.1. Development of Moose Models

In this research, we developed the MB moose model using the MADYMO software version 7.5, as illustrated in Figure 1a. This model was constructed based on the anatomical features of moose, drawing insights from moose biology [15]. This model was partitioned into 13 distinct components, encompassing the head, neck, front, and rear sections of the trunk, limbs, and calves. The relative motion between these adjacent parts was facilitated through spherical joints. The external surface characteristics were meticulously represented, incorporating specific contact properties for each part. To account for varying moose sizes, we employed a scaling method to create three distinct moose models, each representing different percentiles of moose size, as depicted in Figure 1b. Notably, the moose model and the modeling development methodology were previously validated in our prior research [14]. For validation, we reconstructed scenarios involving a Volvo–moose dummy crash and a Jeep–moose crash and compared the consistency of responses between the MB simulation and actual moose vehicle crash accidents.

2.2. Development of Train Models

As depicted in Figure 1c, the train model was developed based on an actual train manufactured by CRRC SIFANG Co., Ltd. (Qingdao, China), comprising a total of 6 vehicles. Each vehicle consisted of 1 vehicle body, 2 bogie systems (comprising 1 frame and 2 wheelsets), and 2 couplers, with each part incorporating 6 degrees of freedom [16]. The vehicles were sequentially numbered from 1 to 6, proceeding from the train’s nose to its tail. The foremost and aft bogie frames were designated as bogies 1 and 2. Within bogie 1, the front and rear wheelsets were designated as wheelsets 1 and 2, while the corresponding wheelsets in bogie 2 were identified as wheelsets 3 and 4. The distinctions between the left and right sides were determined based on the train’s running direction. The vehicle’s surface stiffness was characterized using specific contact properties. Notably, vehicle 1 was created utilizing the facet modeling method to closely match its actual shape and represent deformation [17]. The train’s suspension system consisted of both primary and secondary suspension components, which were defined using piecewise linear spring and damping models, as depicted in Figure 1d. The primary suspension linked the wheelset to the bogie frame, while the secondary suspension connected the bogie frame to the vehicle body. The coupler model was designed using 3 rigid bodies, 3 kinematic joints, and 1 nonlinear spring to simulate swing, pitching, and translational motion, respectively. The couplers between adjacent vehicles were constrained using RESTRAINT.JOINT. The wheel model and the rail model were both defined using FE_MODEL and were coupled using CONTACT_METHOD.NODE_TO_SURFACE_CHAR. The interactions between the wheel and rail were simulated using the penalty method of Cho and Koo, incorporating penetration and contact stiffness as key parameters [18]. For geometry, wheel and rail profiles adhered to the eLMa type and the CN60 type commonly used in China. Notably, train models were previously validated in other studies through comparison with the wheel displacement and collision forces in published numerical results, demonstrating the suitability of such models in train collision investigations and their ability to accurately represent collision forces, relative wheel–rail positions, and other relevant dynamics [14,19,20].

2.3. Collision Scenarios and Simulation Matrix

The coupled model for train–moose herd collisions comprised several components, as illustrated in Figure 2. This model included the train model, three moose models, rail models, and sleeper models. A right-handed coordinate system was established with the train’s direction of motion as the positive X-axis and the vertical ground as the positive Z-axis. The three moose models collectively represented the moose herd and were evenly spaced along the track at the track level, with their centers of gravity aligned with the longitudinal section of the train and their direction of motion facing the positive Y-axis. These moose models were designated as moose1, moose2, and moose3, corresponding to their proximity to the train in descending order. Moose1 was positioned as close to the front of the train as possible to ensure that the collision speed was maintained. The rail model was designed based on the geometry of the TB2344 60 kg/m rail profile [21], which was fixed on the sleeper model based on the CRTS Ⅱ slab design using RESTRAINT.JOINT. Both the ground and the sleeper were represented as rigid surfaces. Contact interactions were established between the moose models themselves and between the moose models and the train, the ground, the rails, and the sleepers using CONTACT.FE_FE, with the CONTACT.TYPE specified as COMBINED.
A simulation matrix was developed to explore the impact responses in train collisions with four distinct sizes of moose herds. These sizes included the 5th percentile-sized moose herd, the 50th percentile-sized moose herd, the 95th percentile-sized moose herd, and a mixed moose herd. The mixed moose herd was composed of the 95th percentile-sized moose1, the 50th percentile-sized moose2, and the 5th percentile-sized moose3. For each moose herd scenario, the impact responses were investigated while considering three parameterized factors: the velocity of the train (vt, 36–250 km/h), the velocity of the moose (vm, 0–60 km/h), and the moose distance interval (d, 1.5–2.5 m), as outlined in Table 1. A baseline case served as the initial reference point for each moose herd scenario, with vt = 100 km/h, vm = 0, and d = 2.0 m. The parameterized factors were systematically altered one at a time, while keeping the others constant, in order to isolate the influence of individual parameters. This process led to a total of 9 cases for each scenario and 36 cases in the entire simulation matrix. All simulation cases were conducted within a three second timeframe following the collision event, aiming to capture the complete interaction process between the moose herd and the train.

2.4. Evaluation Index

The significant transfer of high collision energy to the wheel–rail contact system can have a profound impact on wheel–rail contact dynamics, consequently elevating the risk of derailment. Additionally, the interactions between the moose and train induce changes in their trajectories following collisions, potentially leading to the moose colliding with the overhead line or landing on the track. To gauge the safety of train operations, evaluation criteria for train derailment and safety boundaries were established as key reference points.

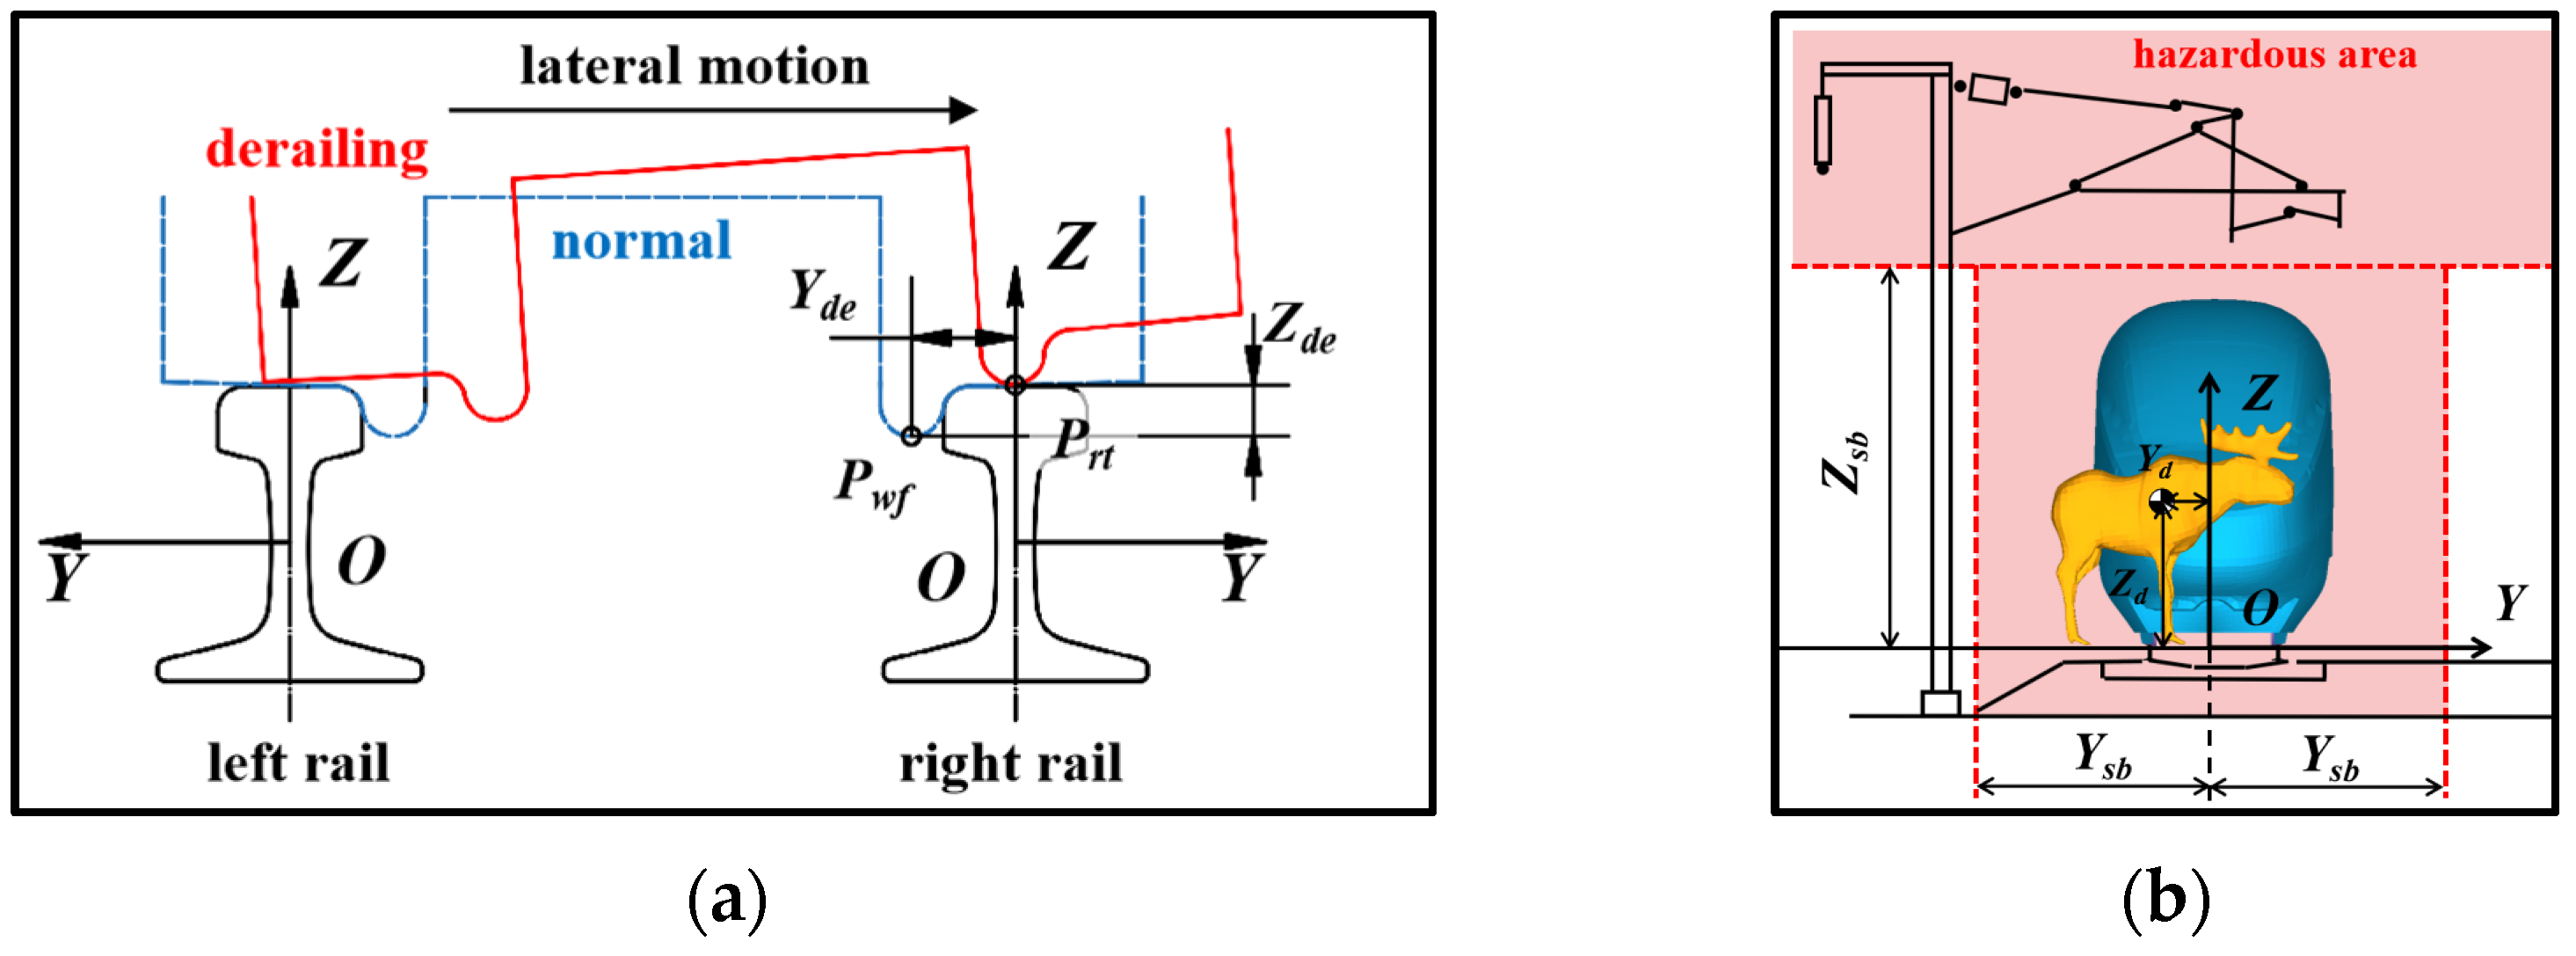
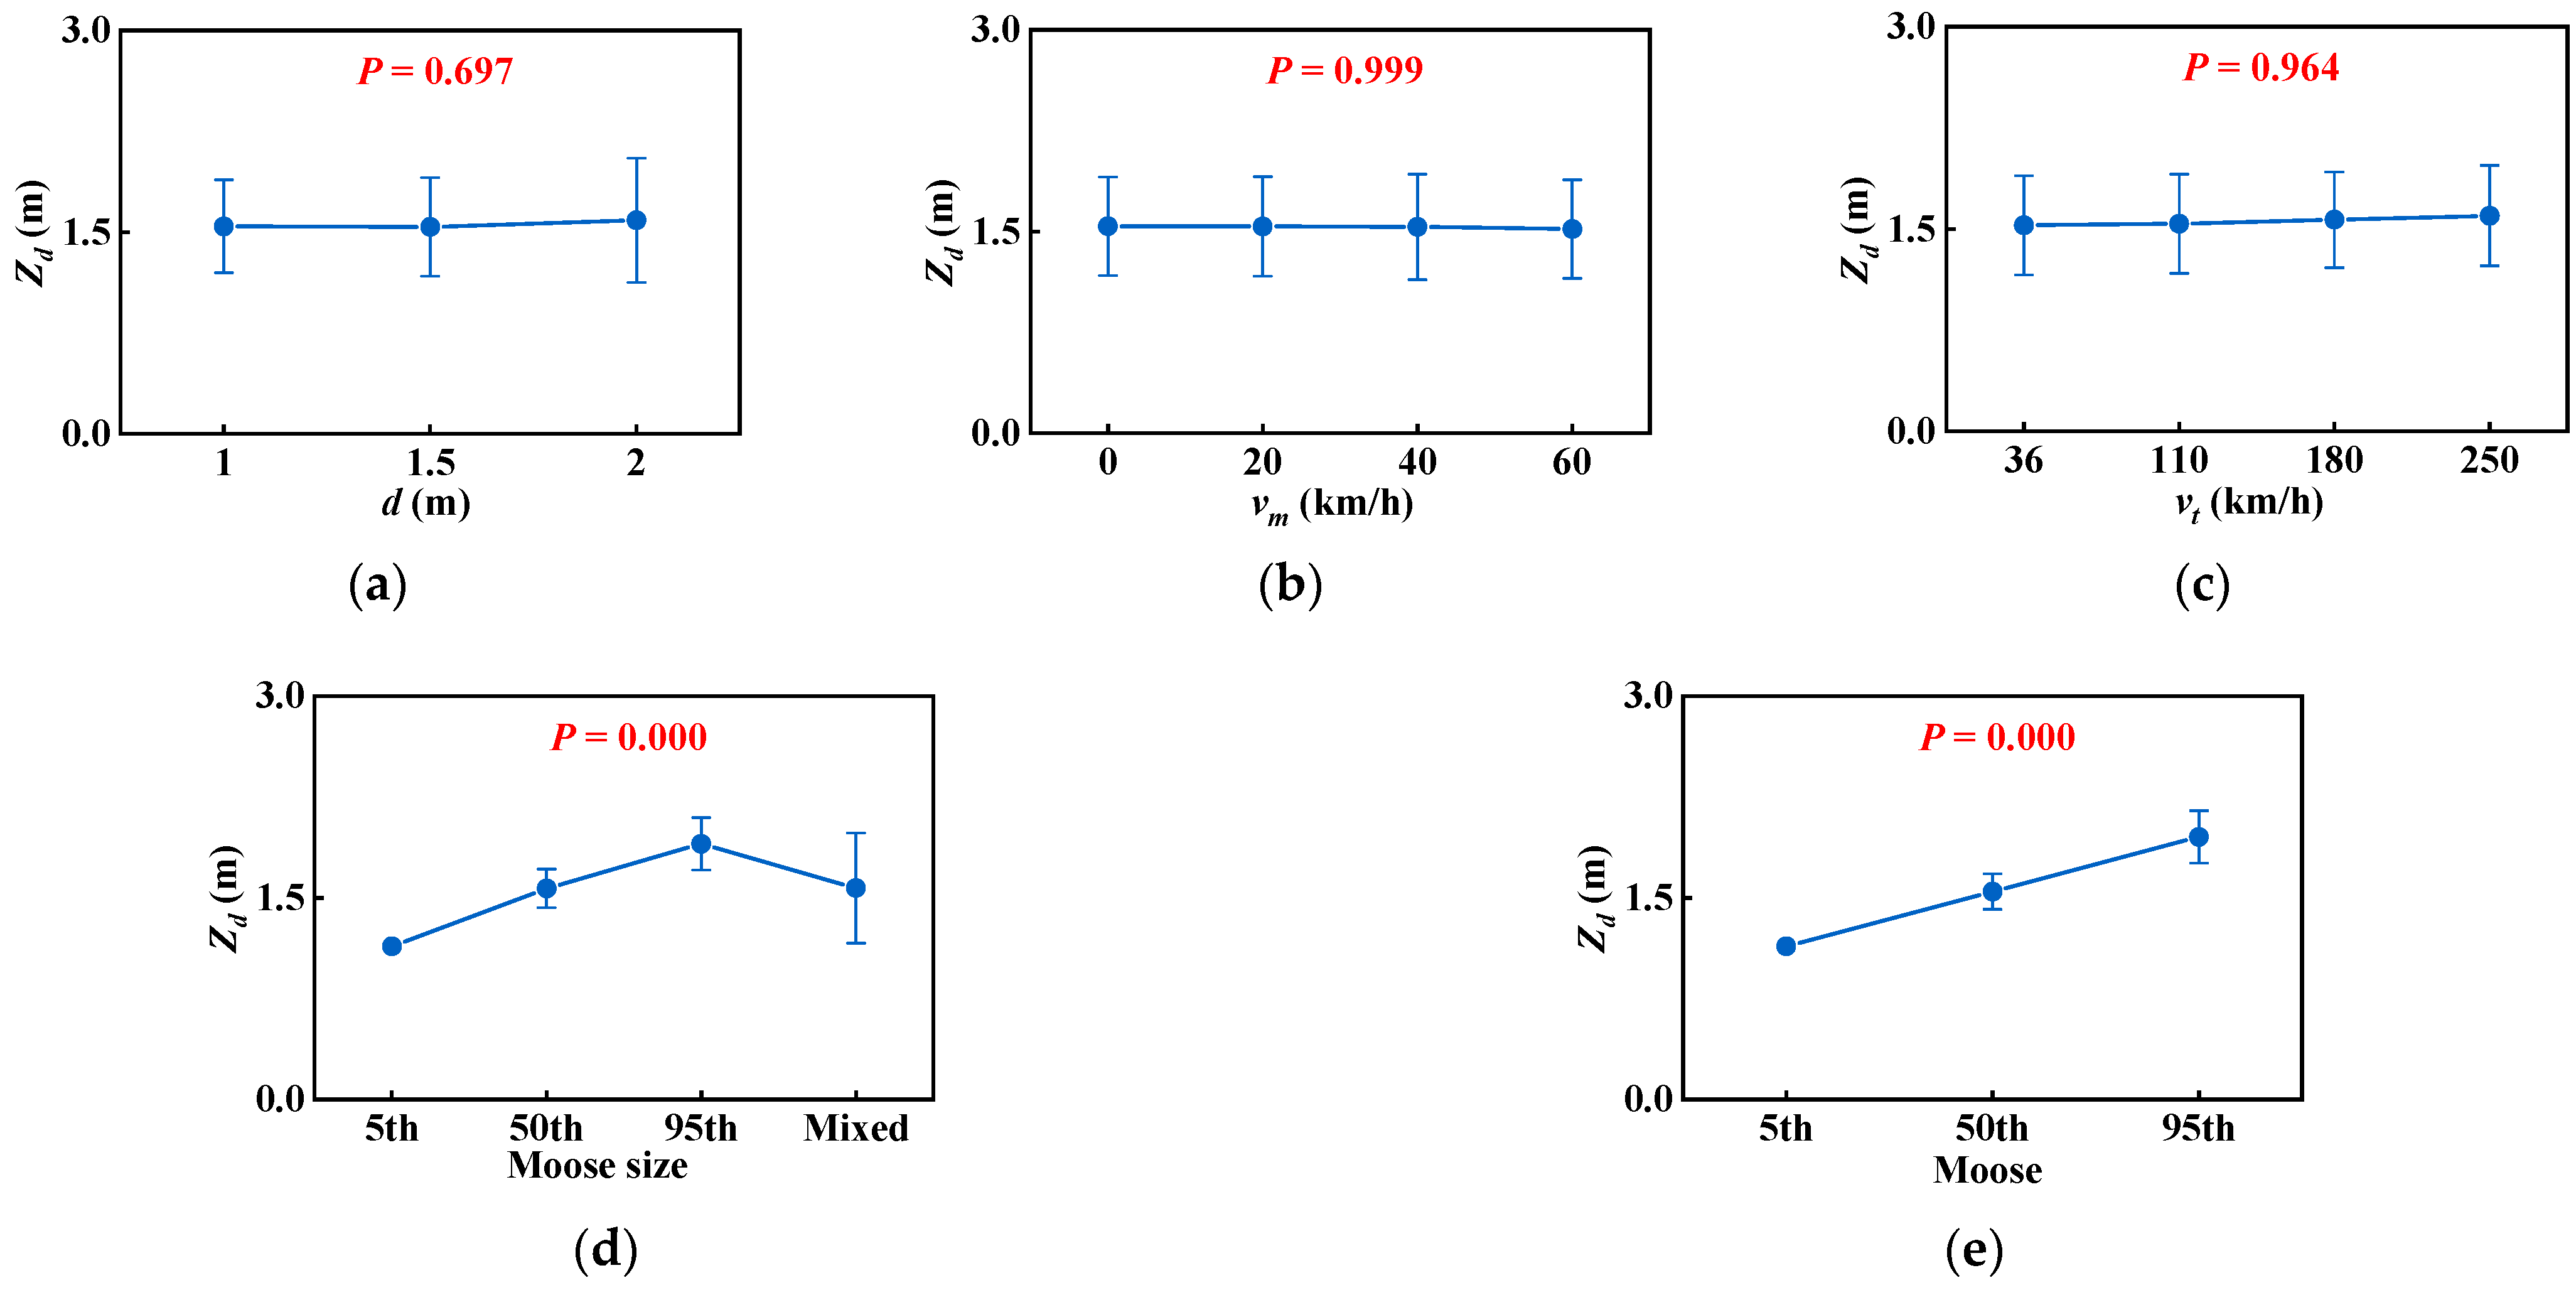
2.4.1. The Evaluation Index of the Train Derailment

Train derailment can be evaluated based on the wheel–rail relative position, which was validated in our previous study. The constraints between the wheels and rails ensure that the train can travel smoothly along the track. Nevertheless, in train collision accidents, it is possible for the collision force to cause the wheels to jump from the tracks and lose the wheel–rail interaction force. As shown in Figure 3a, when the lowest point of the wheel flange (Pwf) exceeds the highest point of the railhead (Prt), the interaction force between the wheel and rail disappears, representing the occurrence of derailment. Therefore, the lateral (Yde) and vertical (Zde) can be calculated to judge train displacements, as outlined in Equations (1) and (2):
Y d e ( t ) = y w f ( t ) y r t ( t )
Z d e ( t ) = z w f ( t ) z r t ( t )
where Yde(t) and Zde(t) are the lateral and vertical displacement between the wheel and rail, respectively; ywf(t) and zwf(t) are the lateral and vertical displacement of the wheel flange (Pwf), respectively; and yrt(t) and zrt(t) are the lateral and vertical displacement of the railhead top (Prt), respectively. The units of all measurements are in millimeters. As shown in Figure 3a, the wheelset exists in a critical derailment condition when Yde = 55 mm and Zde = 27 mm. In this state, any increase in Yde and Zde results in a loss of contact between the right wheel and the right rail. Thus, the derailment condition was defined as follows:
Y d e ( t ) 55   m m   o r   Z d e ( t ) 27   m m

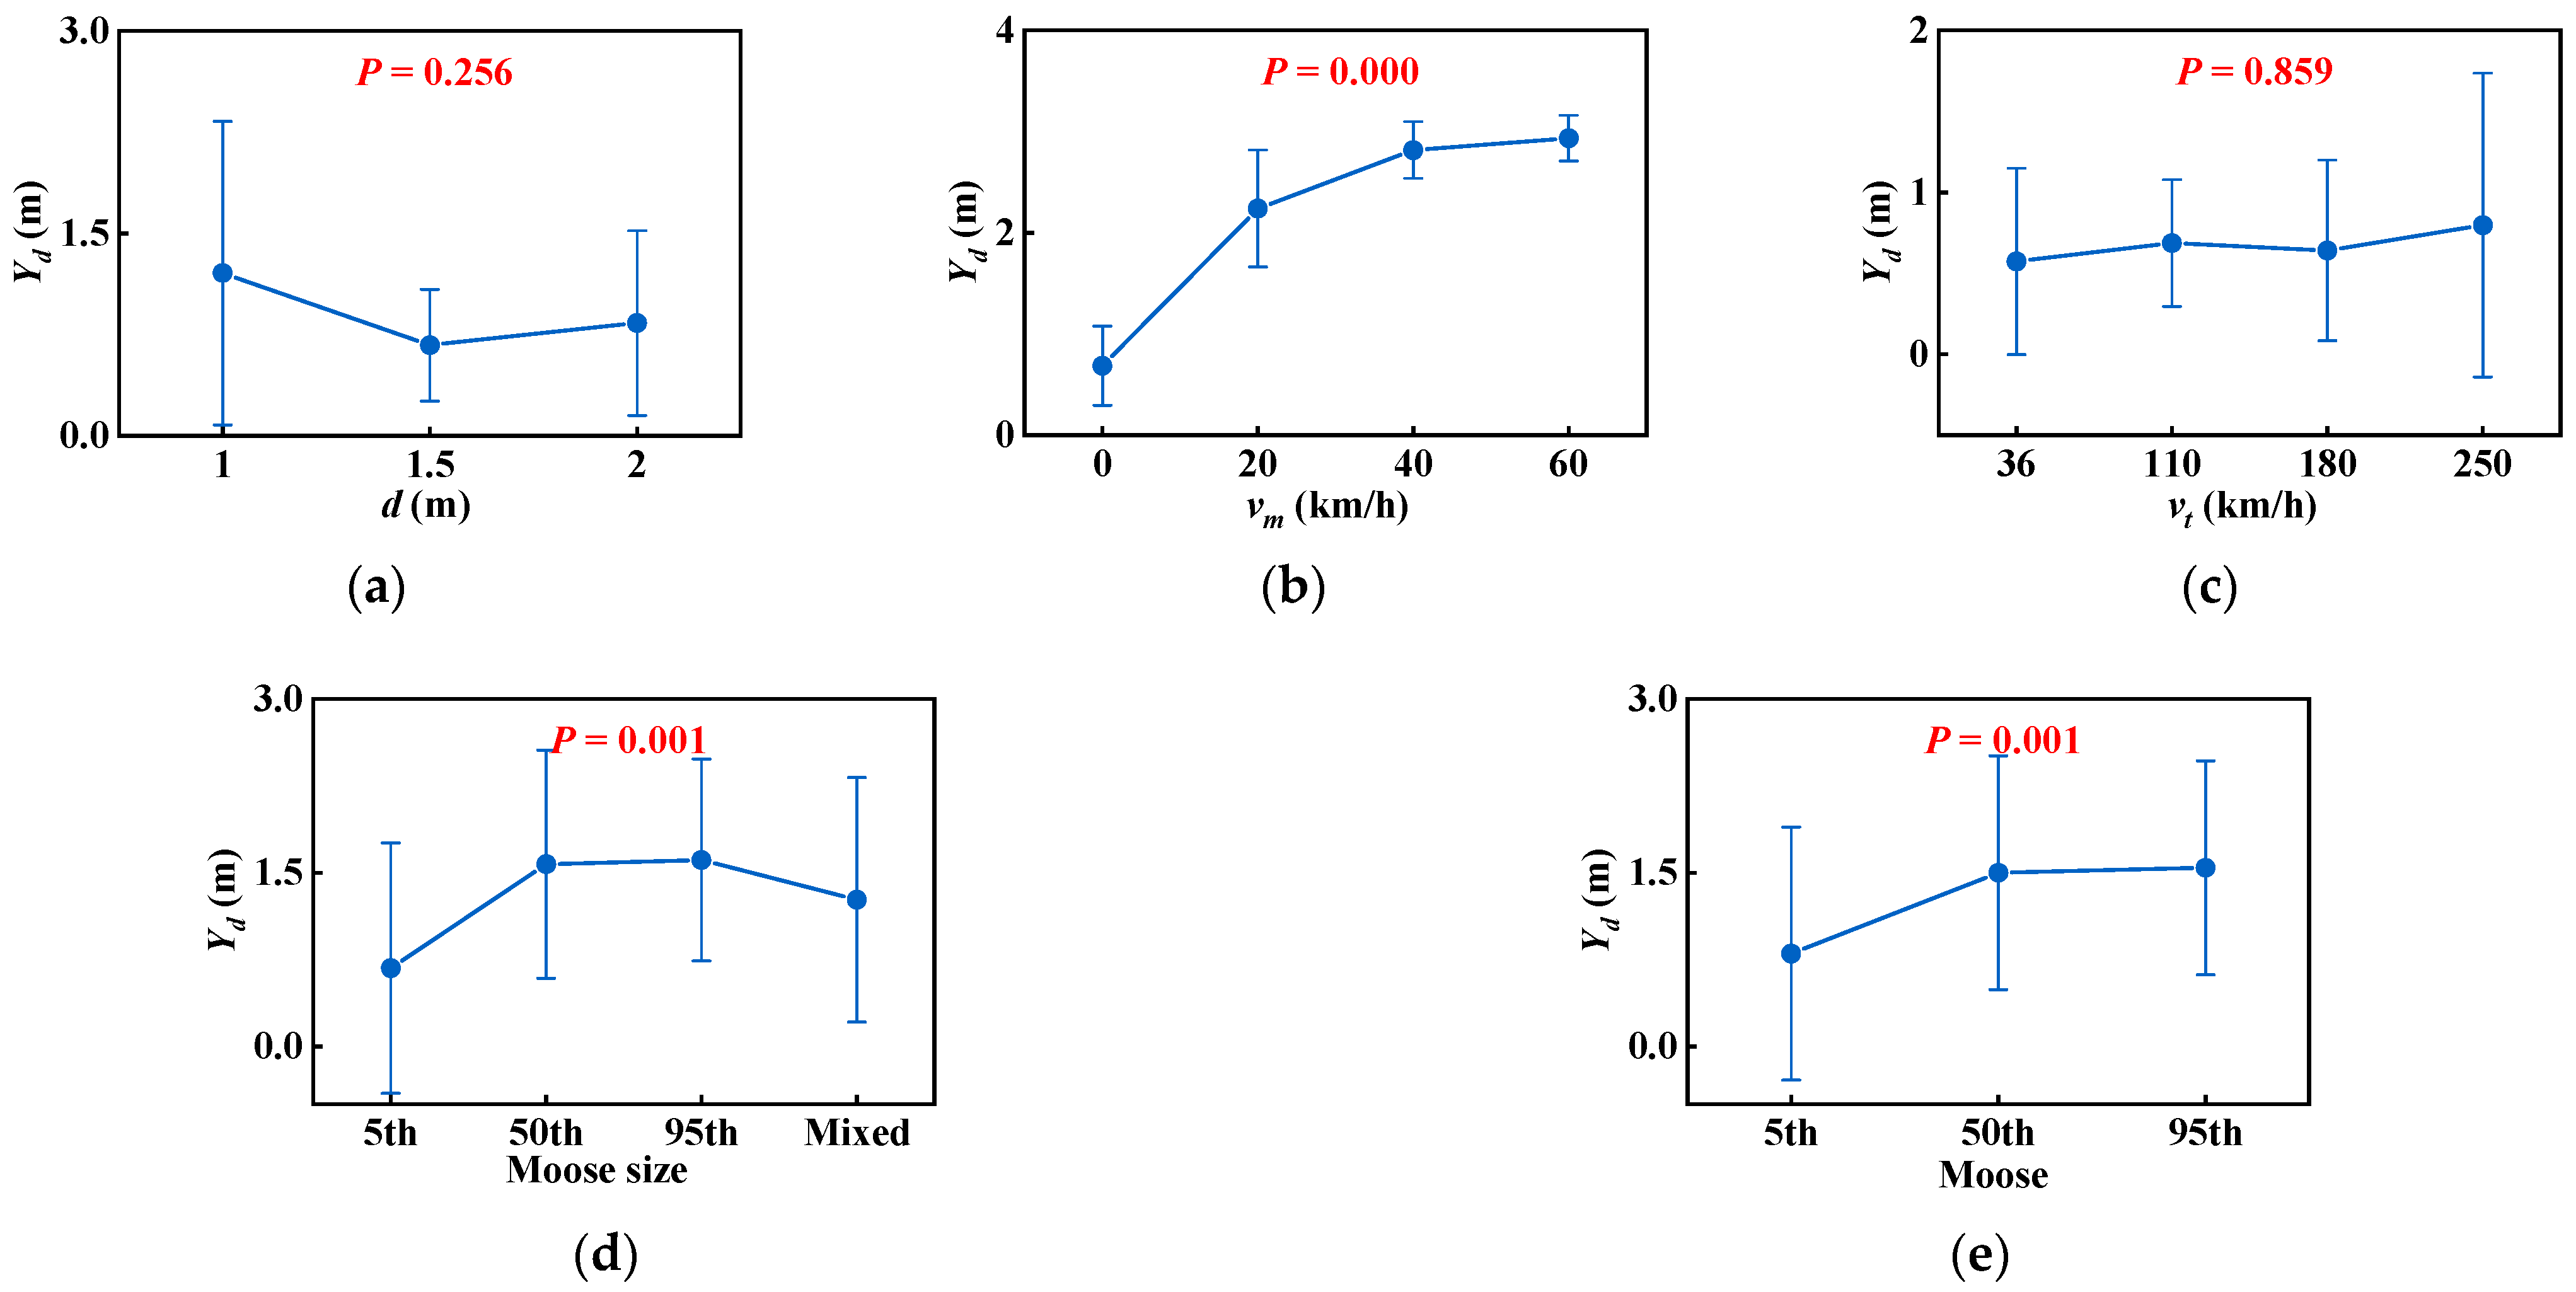
2.4.2. The Evaluation Index of the Safety Boundary

The safety boundary was assessed based on the relative position of moose–railroad facilities. As shown in Figure 3b, when the height of the moose’s center of gravity (CG) exceeds the height safety boundary, i.e., Zd > Zsb, there is a risk of damage to the overhead line. Meanwhile, when the lateral displacement of the moose’s CG is less than the width of the safety boundary, i.e., Yd < Ysb, the moose may land on the track, threatening train operations. Based on GB 146.1-2020 [22] and TB 10621-2014 [23], the width limit of train operation is ±1.7 m away from the central axis of the track, and the height limit of the overhead line is 5.3 m. Considering the effect of moose body length, the width of the safety boundary Ysb and the height of the safety boundary Zsb were set to 3.0 m and 4.0 m, respectively. Thus, the condition of railroad line risk was defined as follows:
Y d ( t ) 3.0   m   o r   Z d e ( t ) 4.0   m

3. Results

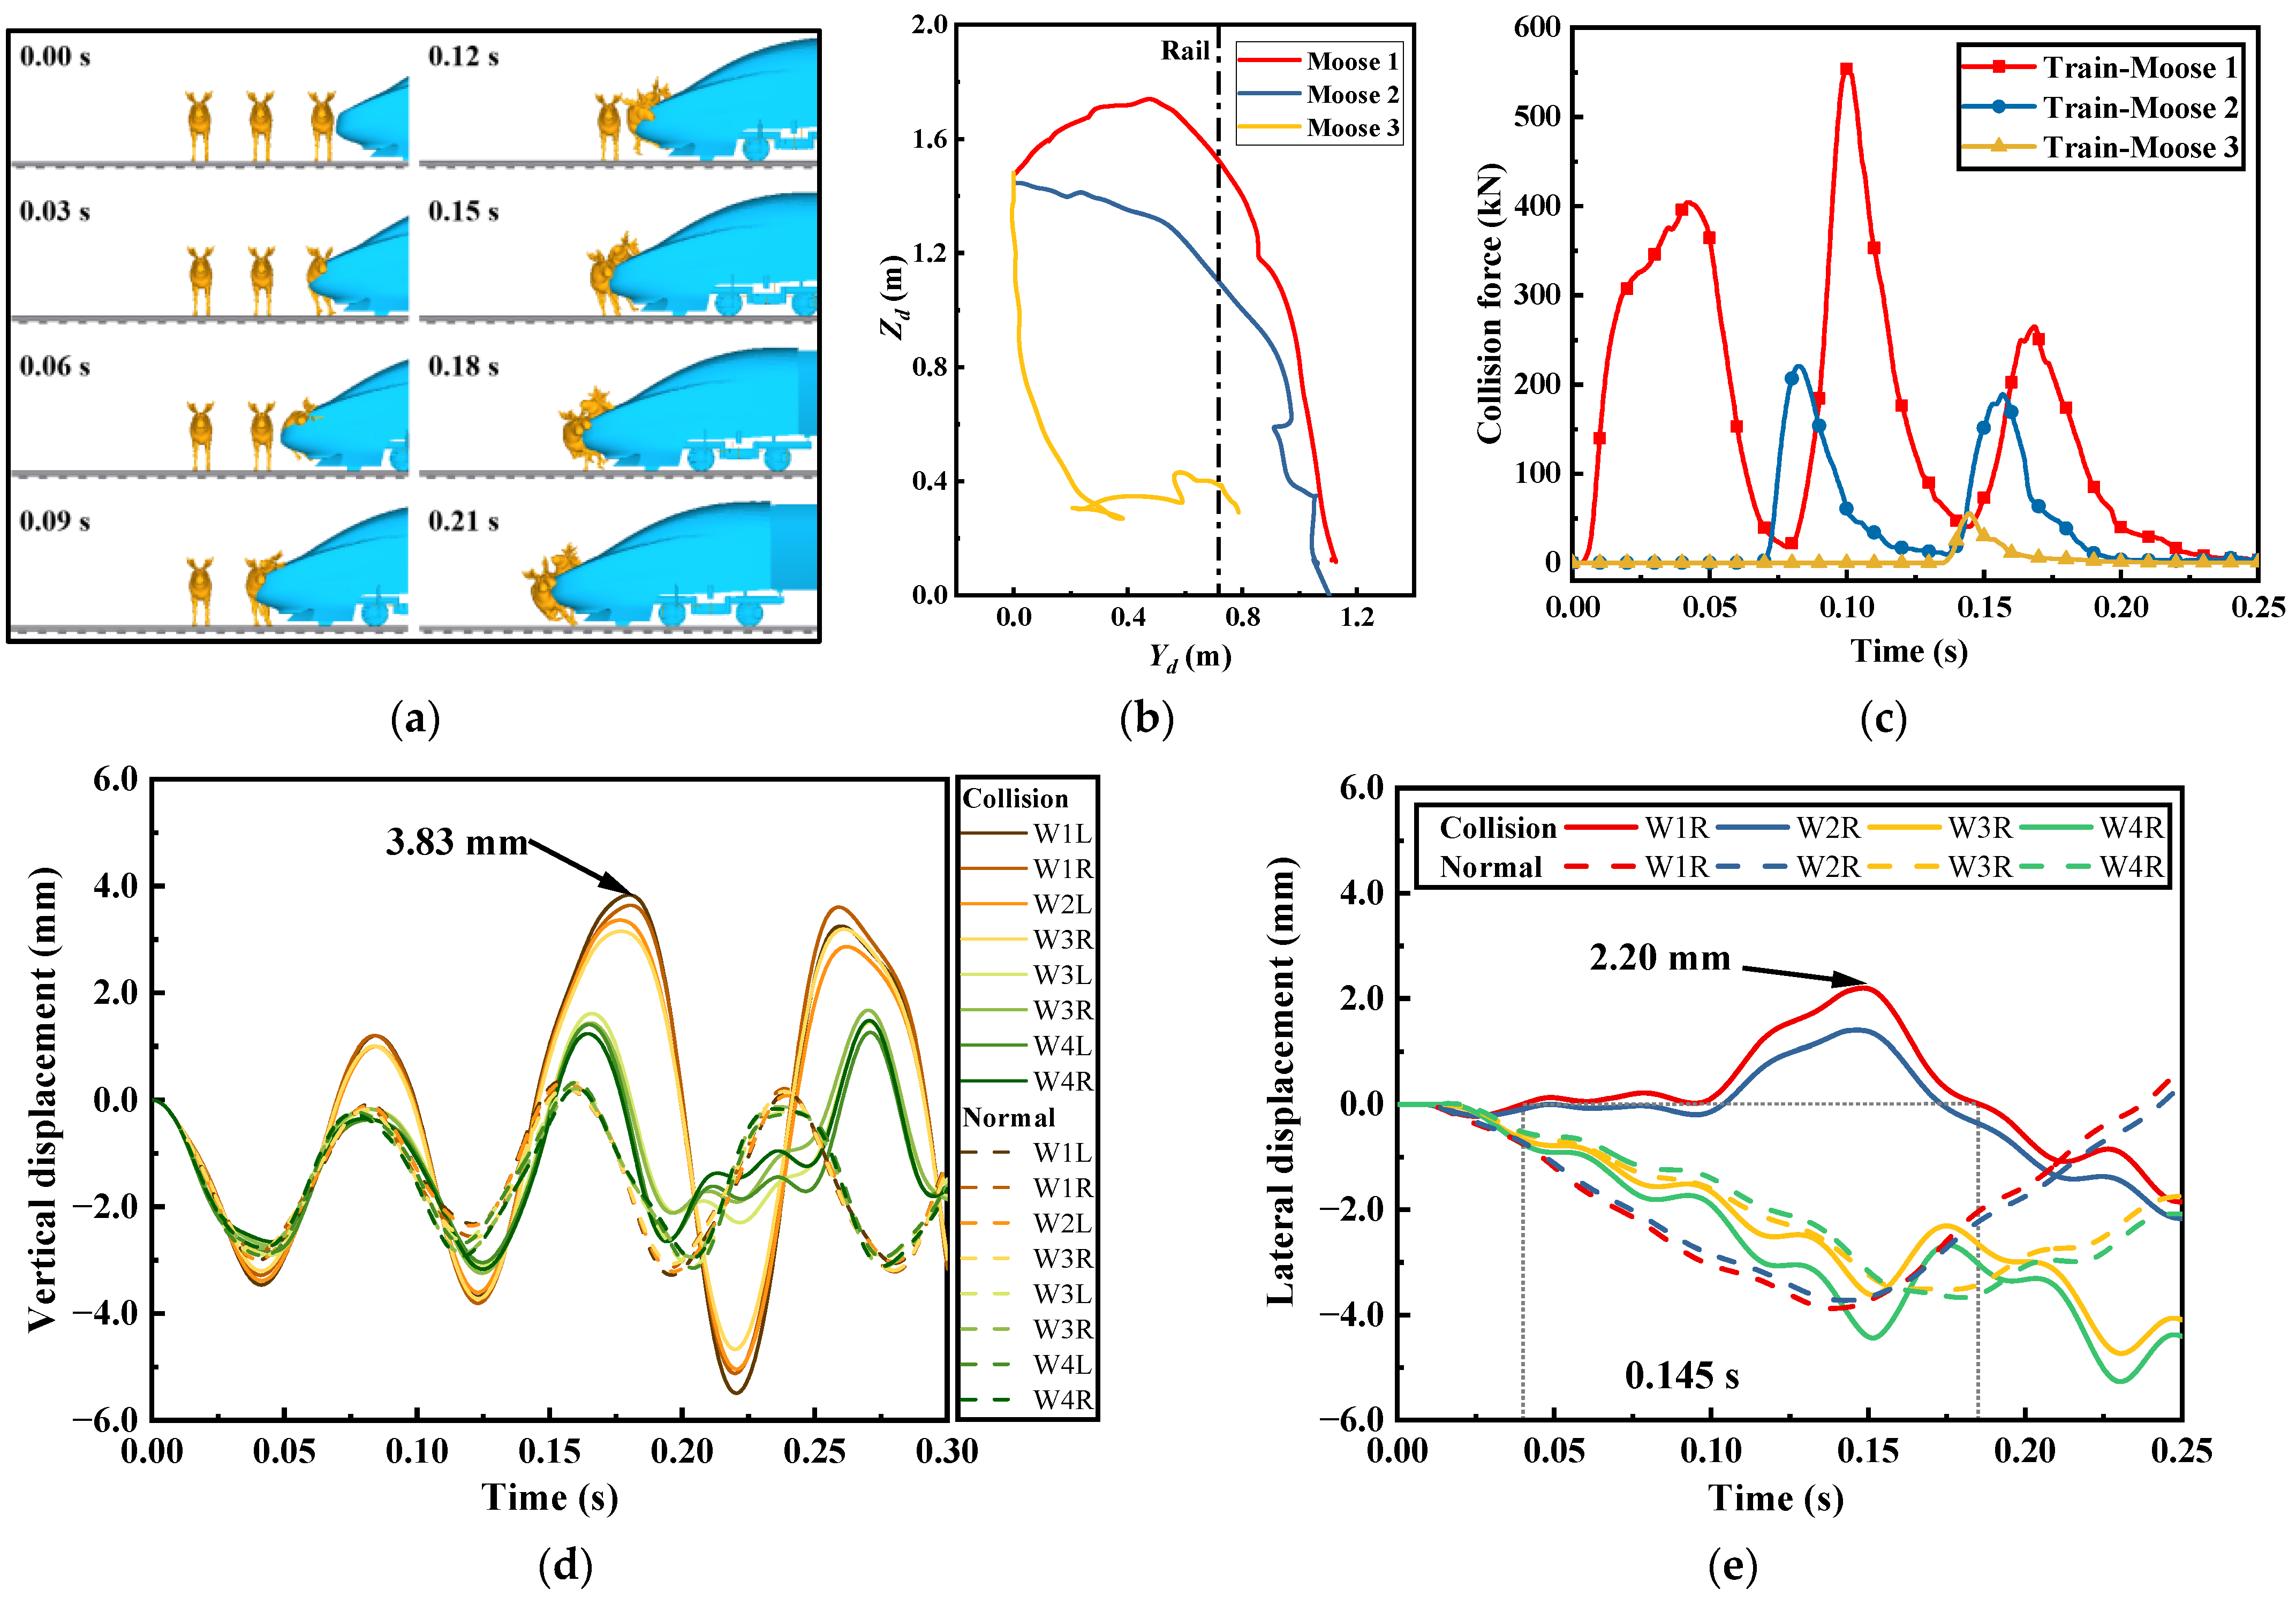
3.1. The Response Process of the Moose Herd–Train Collision in the Baseline Case

The baseline case of the moose herd–train collision simulations involved a train traveling at a speed of 110 km/h colliding with a moose herd consisting of 50th percentile-sized individuals standing stationary on the track with a 2 m gap, as shown in Figure 4a. At 30 ms, the front hatch of the train first impacted the costal region of moose1. Subsequently, moose1’s dorsocostal region and back region came into contact with the front of the train and rolled upward (60 ms). At 90 ms, moose2 was impacted in the same costal region, but after the impact, moose2 did not roll upward and instead fell directly onto the ground (120 ms). Starting from 150 ms, kinematic behavior similar to that observed with moose2 also occurred with moose3, which was impacted and fell directly onto the track. Based on the XY-plane trajectory of the center of gravity (CG) of the moose in Figure 4b, it can be observed that the Zd of moose1 was the largest but was still less than that of Zsb. This result indicates that moose1 was thrown into the air after the collision, but the height it reached was not sufficient to pose a threat to the safety of the overhead line. Moose1’s Yd was greater than that of moose2, which was greater than that of moose3; however, the Yd for all moose models was less than Ysb. This result indicates that after the collision process, all three moose in the group ultimately landed near the track, resulting in a risk of secondary collisions.
The time histories of the resulting collision forces reveal differences in the collision processes of the train and different moose, as shown in Figure 4c. The collision force curve between the train and moose1 exhibited a three-peak characteristic. This result occurred because throughout the entire collision process, moose1 maintained contact with the front of the train and was positioned between moose2 and moose3. The impact of moose2 and moose3 resulted in a second and a third collision between moose1 and the train. Similarly, the collision force curve between the train and moose2 displayed a two-peak characteristic for the same reason. In terms of peak force, the collision force from moose1 to moose3 decreased sequentially.
The time histories of Yde and Zde demonstrated the response of the front car in terms of the relative wheel–rail position. Additionally, a normal case without the moose herd under the same conditions as the baseline case was calculated to facilitate comparative analysis and eliminate the influence of rail irregularities on the results. As shown in Figure 4d, in the normal case, wheelsets 1–4 oscillated around their initial positions. After the collision occurred, the impact energy transferred to the wheelsets amplified this oscillation. Wheelset 1 and wheelset 2 were notably affected, and at approximately 0.180 s, the vertical displacement of W1L reached its maximum value (3.83 mm). However, this displacement was significantly smaller than the level of displacement that would lead to derailment conditions. As shown in Figure 4e, in the normal case, W1–4 exhibited lateral oscillations within a certain range. The collision force affected wheels 1–2, causing W1R and W2R to move to the left. However, the magnitude of this disturbance (2.20 mm) and its duration (0.145 s) were both small and insufficient to induce derailment. To summarize, in the moose herd–train collision in the baseline case, there was no risk of damage to the overhead line and derailment, but there was a risk of secondary collisions.

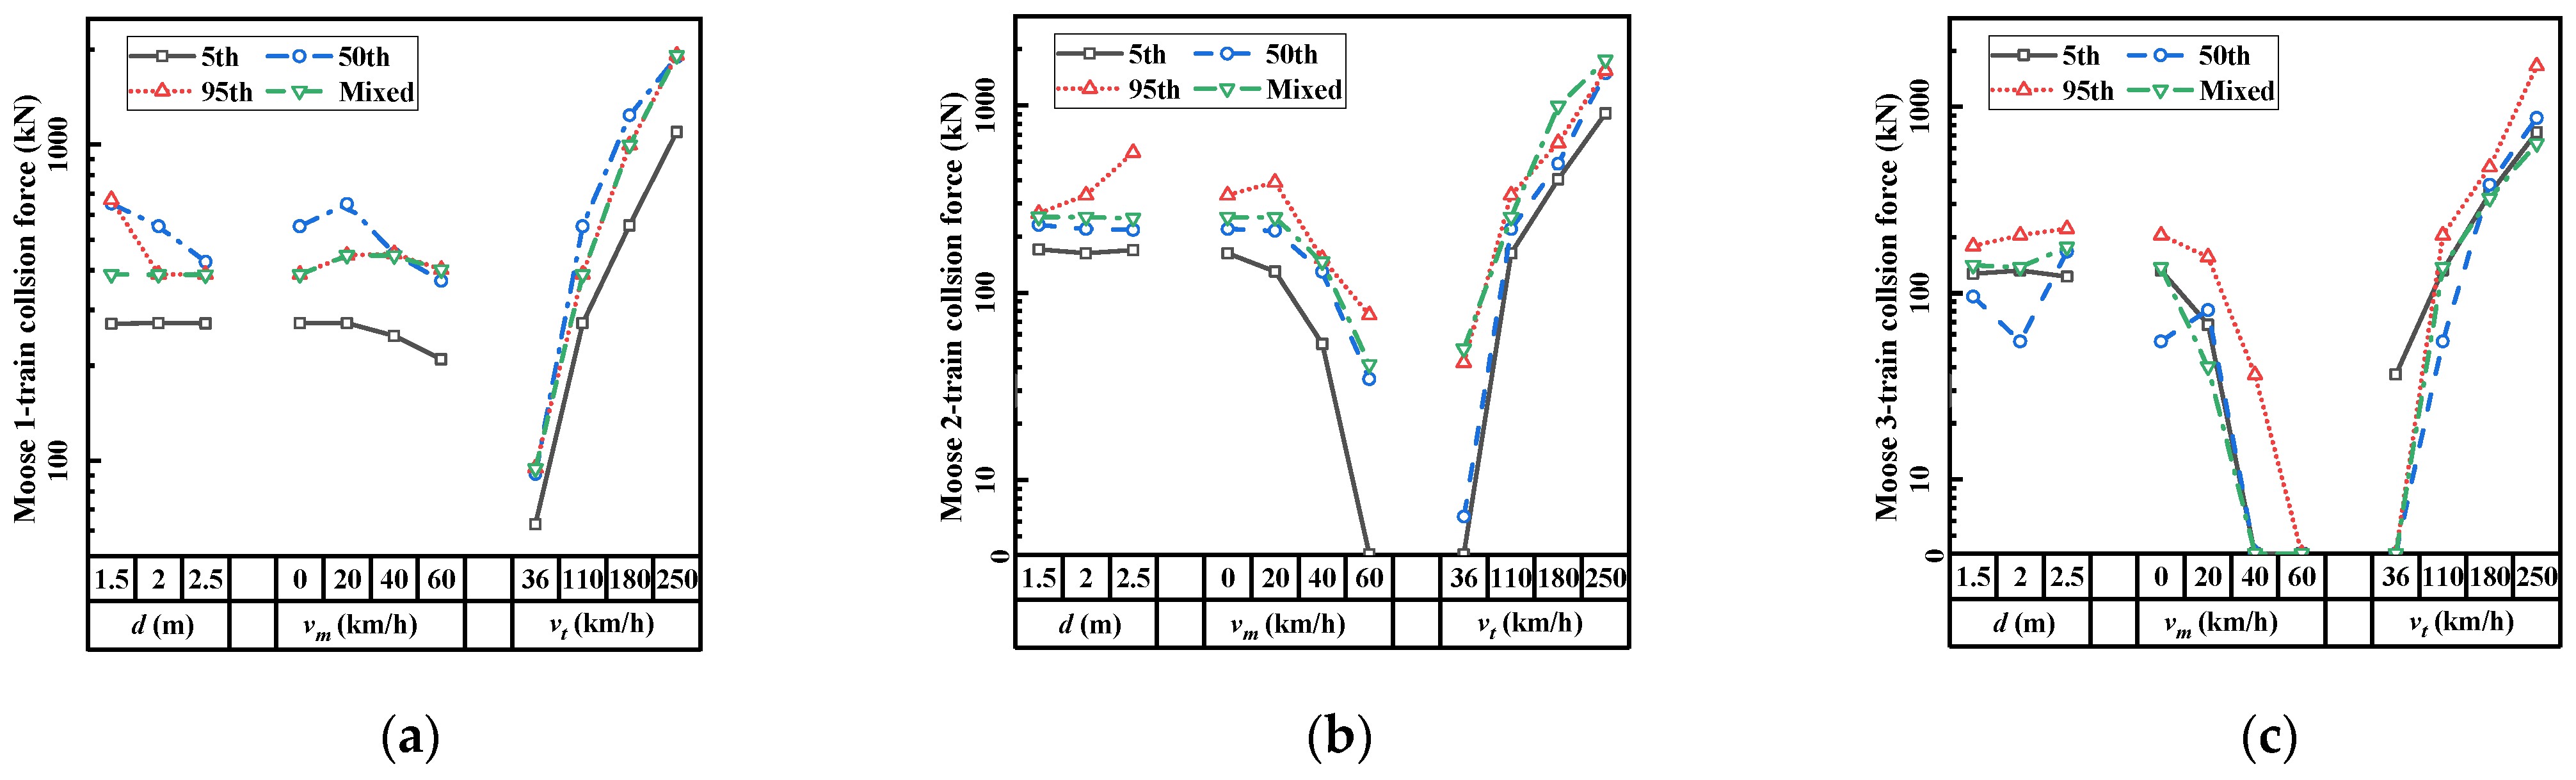
3.2. Simulation Matrixes of Different Collision Scenarios

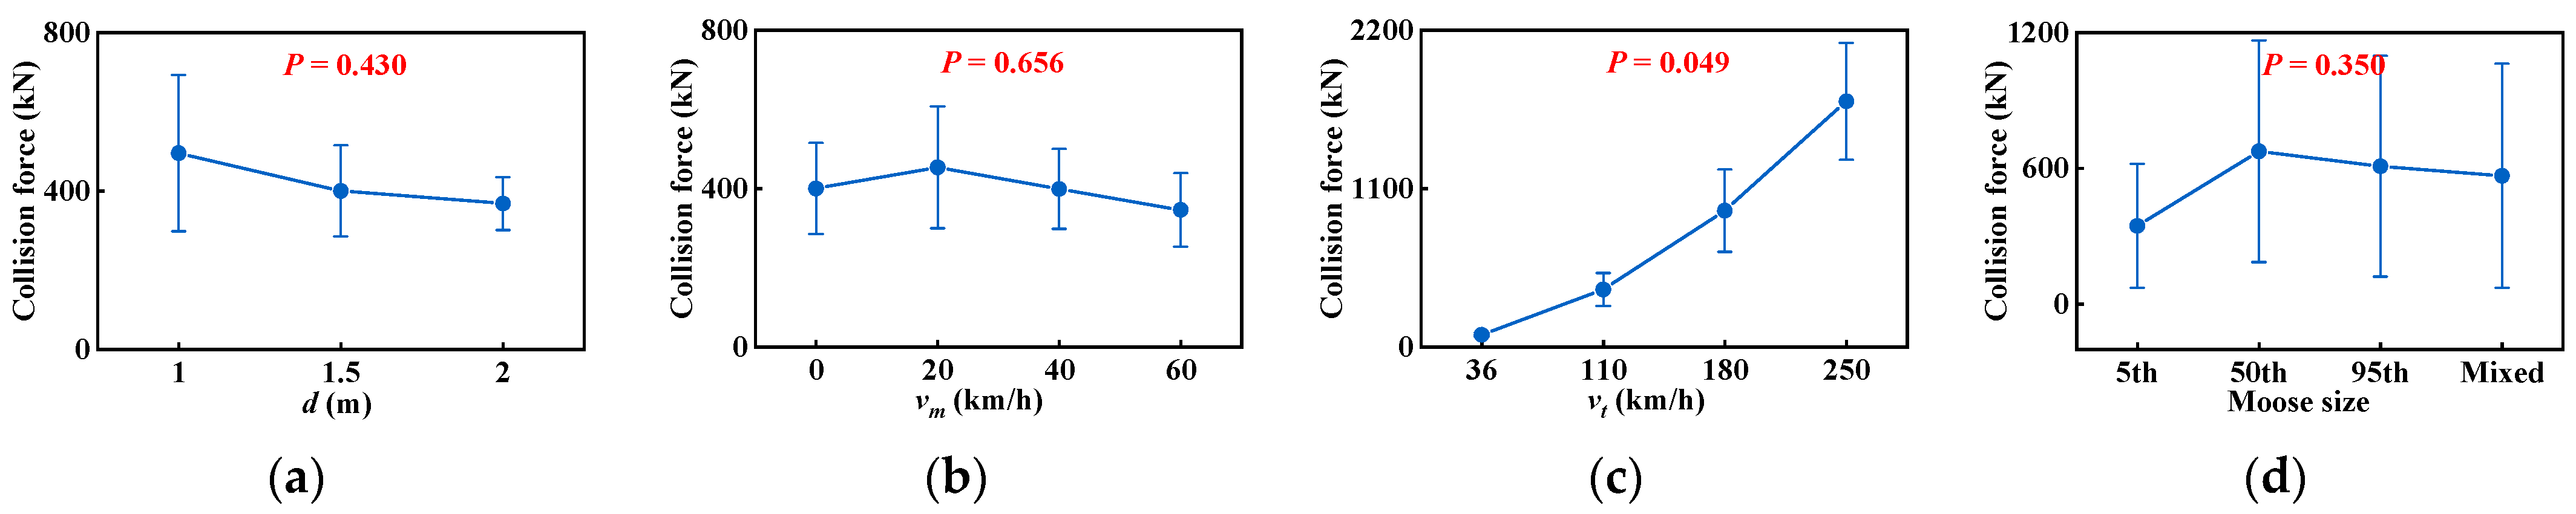
3.2.1. Collision Force

As shown in Figure 5, the impacts of different parameters (d, vm, or vt) on the peak collision force between the three moose in the moose herd and the train exhibit consistent patterns. Here, the interval between the moose has a minimal impact on the collision force. Moose velocity showed a negative correlation with the collision force, while train velocity showed a positive correlation. In terms of the overall collision force level, the peak collision force between moose1 and the train was higher than that between moose2 and moose3 and the train. This occurred because moose1, positioned in the middle, reduced the contact area between the other moose in the herd and the train. Therefore, in the subsequent analysis of the collision force between the moose herd and the train, we focused on the collision force involving moose1 and the train, especially with different moose and train velocities.

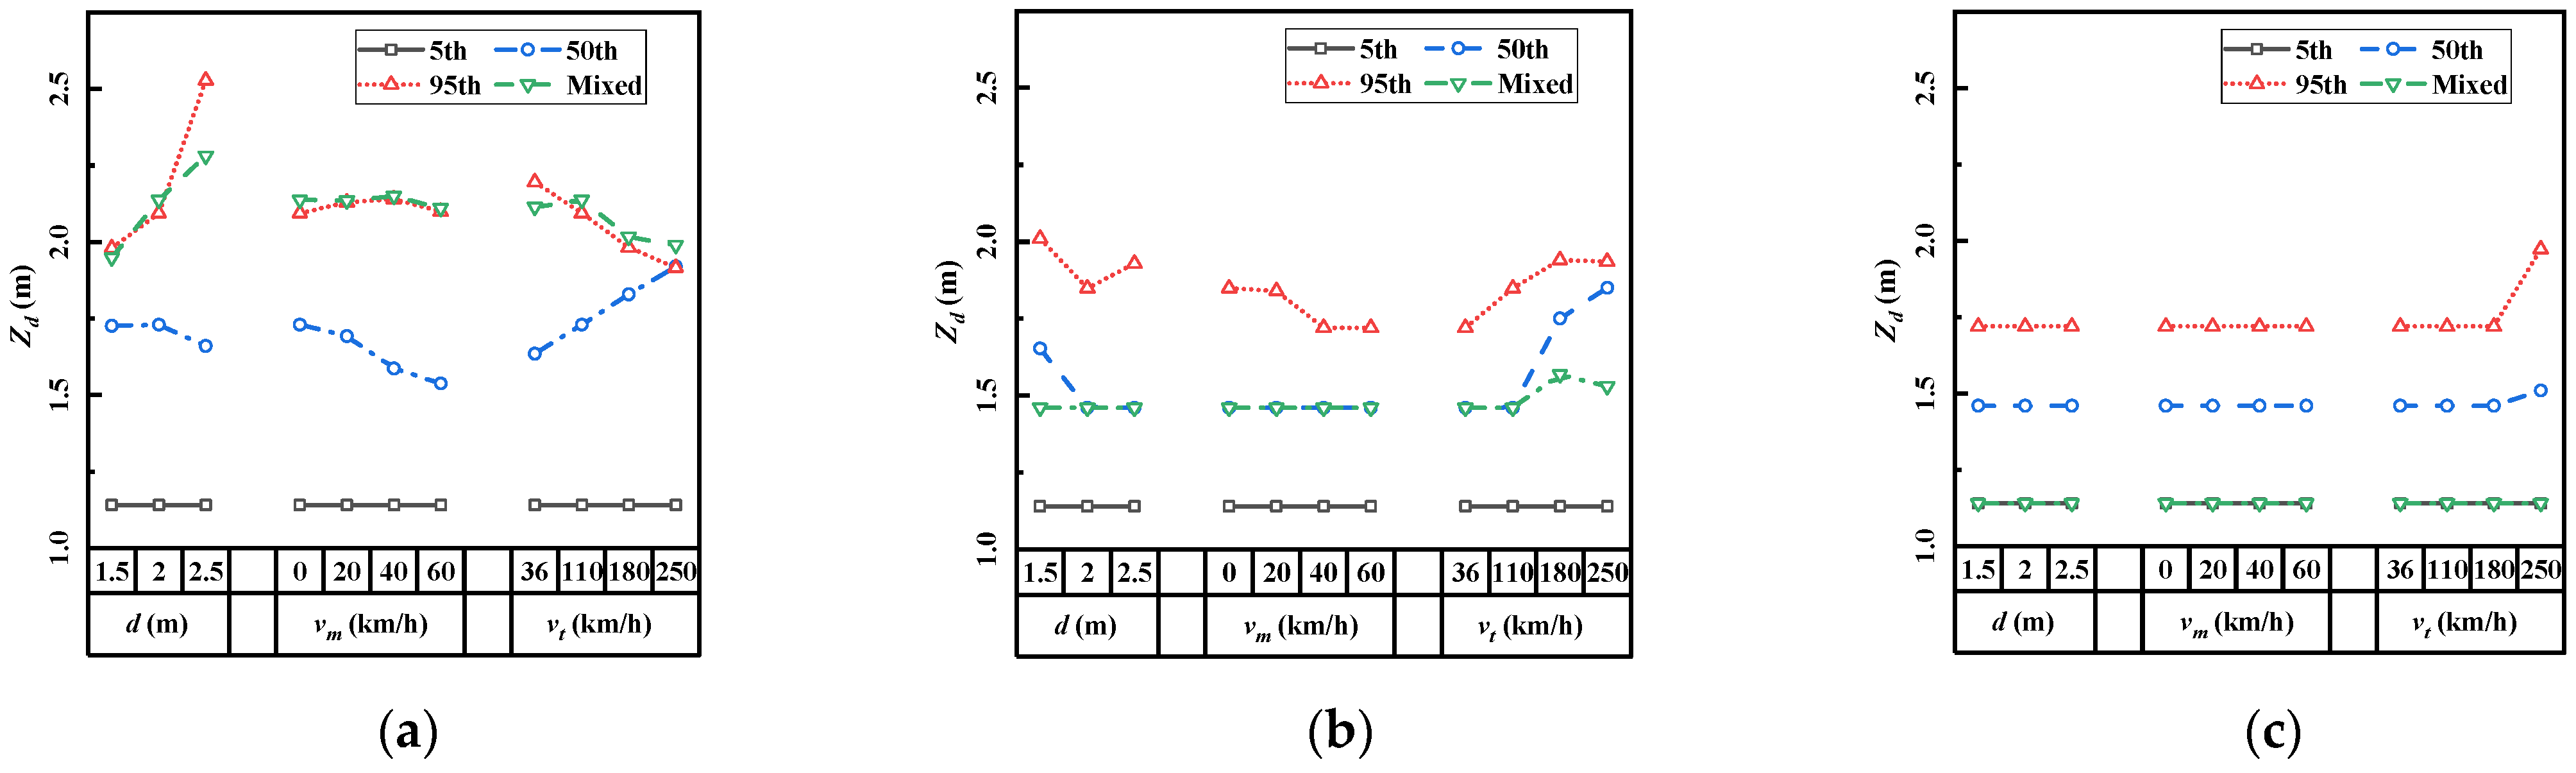
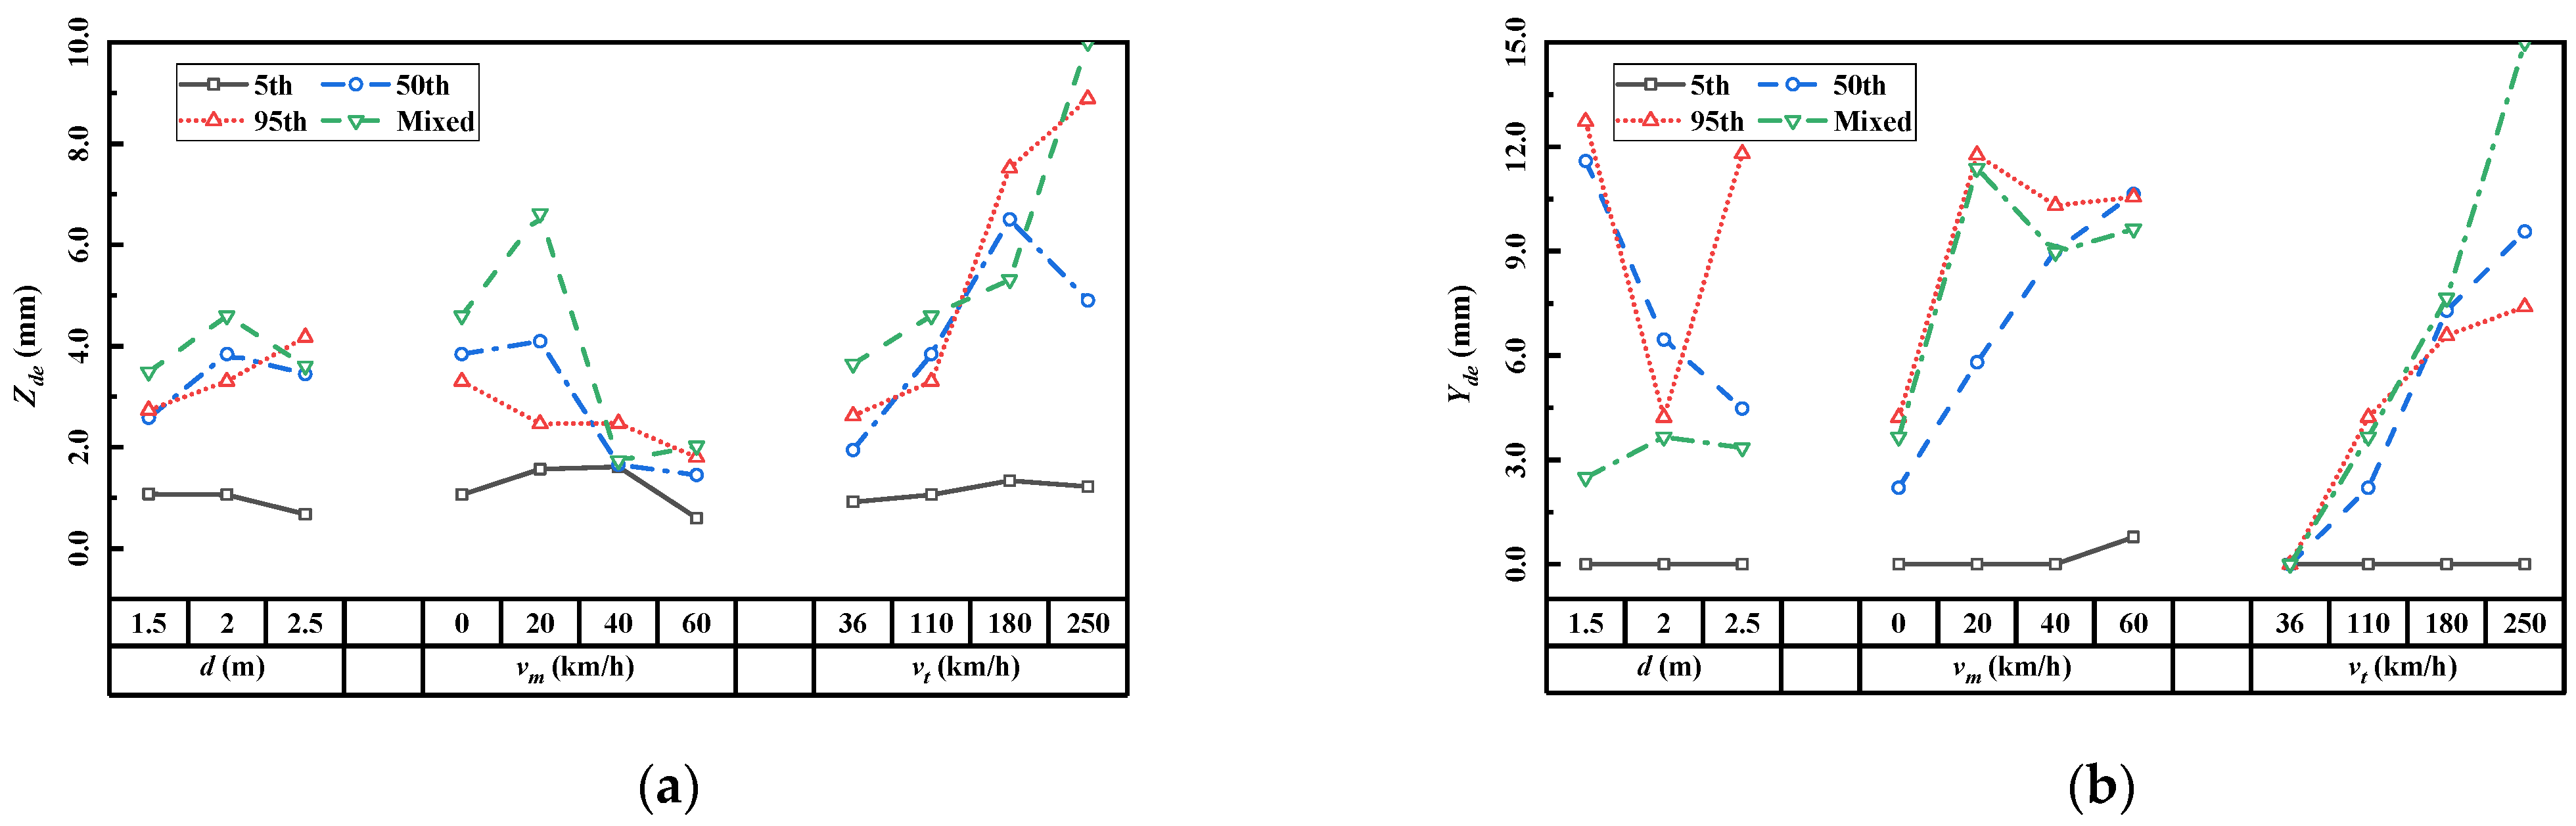
3.2.2. Moose Trajectory

The Zd values of the three moose in the moose herd are shown in Figure 6. As shown in Figure 6a, moose1 was thrown into the air in all cases, except for moose1 in the 5th percentile-sized moose herd, but the Zd remained below the safety boundary of train operation. As shown in Figure 6b, in some cases, moose2 was thrown into the air, but these cases were less frequent than those among the moose1 group and mainly occurred in the 95th percentile-sized moose herds. As shown in Figure 6c, only moose3 in the 95th percentile-sized moose herd and the 50th percentile-sized moose herd was thrown into the air when the train velocity reached 250 km/h. In all moose herd–train simulation scenarios, the Zd values of the moose were below the safety boundary value, indicating that there was no risk of damage to the overhead line.
The opposite situation arose for the width safety boundary index of train operation. The Yd of the three moose in the moose herd are shown in Figure 7, where the Yd was recorded as 3.0 m when the moose landed outside the safety boundary. In most cases, except for vm above 20 km/h, the three moose in the moose herd fell within the width safety boundaries, indicating that a secondary collision between the moose and train deflector is a concern that must be addressed in a moose herd–train collision incident.
In summary, moose1 in the moose herd presented the highest throwing height. However, this height remained lower than the boundary value, indicating an absence of risk in the moose herd–train collisions explored by this study. However, moose were difficult to remove from the safety boundary via collision, leading to a high risk of secondary collisions.

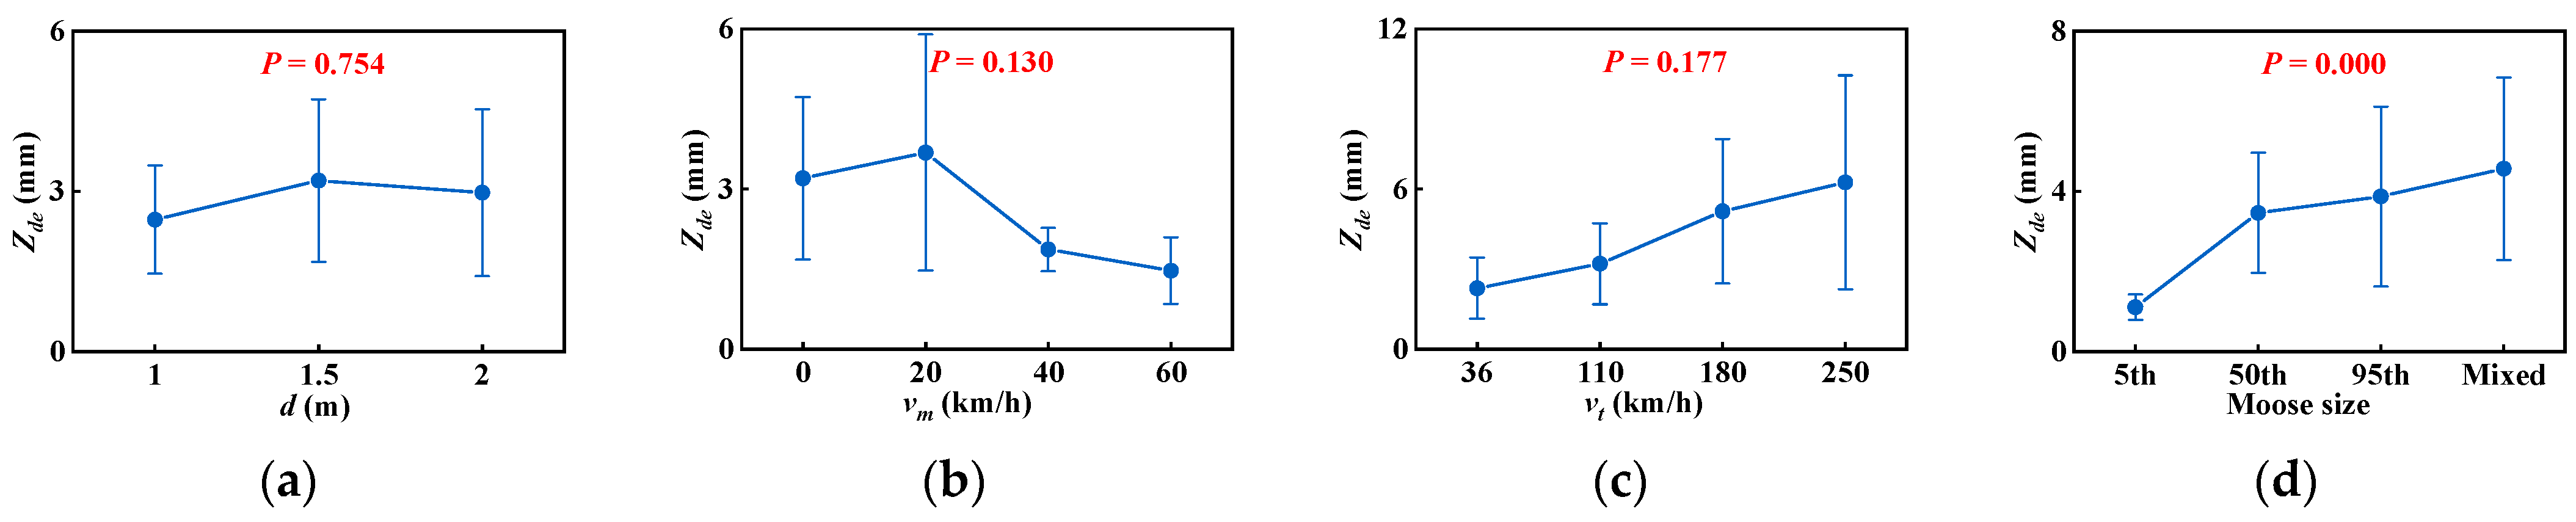
3.2.3. Wheel–Rail Response

Based on Figure 4b, disturbances in wheel–rail contact due to moose herd–train collisions were primarily observed in wheel1 of the front vehicle. Therefore, statistical analyses were only conducted on Zde and Yde for the front vehicle. As shown in Figure 8, under different conditions, the collision energy transmitted from the train front to the wheelset resulted in longitudinal bouncing and lateral displacement. The maximum values of Yde and Zde both occurred in the mixed–size moose herd scenario with vt = 250 km/h. However, the Zde and Yde values were significantly less than those under the derailment condition in all simulation scenarios, indicating the absence of a derailment risk from a direct collision with a moose herd.

4. Discussion

To further explore the influence of parameters on train derailment and operational safety, a statistical significance analysis was performed. One-way analysis of variance (ANOVA) can determine whether there are significant differences among three or more groups. This type of analysis can also identify specific group differences through post hoc tests [14,24], which are calculated using Equation (4):
F = M S B M S W
where F is the F-statistic value, MSB is the between-group mean square, and MSW is the within-group mean square. The p value can be found by consulting the F-distribution table. If the p value is lower than 0.05, the parameter has a significant effect. In this study, the simulation results of all cases were taken together, and the influence of a single factor (MS, v t , v t , and d) on different impact response indexes (Collision force, Yde, Zde, Zd, and Yd) was determined via ANOVA (Figure 9, Figure 10, Figure 11, Figure 12 and Figure 13).

4.1. The Effect on Collision Force

As depicted in Figure 9, the influence of the intervals between moose in the herd, moose velocity, and moose size on collision force was not statistically significant (p > 0.05). However, there was a significant positive correlation between collision force and train velocity (p < 0.05). This result suggests that in any scenario involving a collision between a moose herd and a train, reducing the train’s operating speed can effectively decrease the collision force, thus contributing to enhanced operational safety.

4.2. The Effect on Train Derailment Indexes

The lateral (Yde) and vertical (Zde) wheel/rail relative positions are used here as evaluation indices to assess train derailment. An ANOVA analysis was employed to examine the correlation between various influencing factors and the Yde and Zde derailment indices, reflecting the impact of these factors on train derailment safety. As shown in Figure 10 and Figure 11, the spacing between moose in the herd and the velocity of the moose have a non-significant effect on the derailment indices (p > 0.05). However, the size of the moose in the herd exhibits a significant correlation with both Yde and Zde (p < 0.05). Zde and Yde both increase with an increase in train speed, but only the latter demonstrates a statistically significant relationship with train speed. The results above suggest that moose herd density and the movement status of moose have a minimal impact on wheel–rail responses. However, higher train speeds and larger-sized moose herds lead to more significant changes in wheel/rail relative positions. This result may be attributable to the presence of greater collision energy in such cases, with larger-sized moose herds being considered to collectively represent a heavier collision object.

4.3. The Effect on Safety Boundary Indexes

The relative position of the moose in relation to railroad facilities is used to evaluate whether trains pose a danger to the railway. The maximum height of the moose’s center of gravity (Zd) and the longitudinal throwing distance (Yd) were selected as evaluation indicators. As shown in Figure 12, ANOVA analysis revealed that the spacing between moose, moose velocity, and train speed had a non-significant impact on Zd. The influence of moose spacing and train speed on Yd was also not significant (p > 0.05). However, moose velocity exhibited a clear and significant relationship with Yd (p < 0.05). This result can be readily explained: moose running at high speeds have a greater initial velocity component in the horizontal direction after being struck by a train, causing them to land farther from the original track. Yd and Zd display a significant correlation with the composition of the moose herd. This correlation is likely due to differences in the sizes of individual moose, as supported by the results in Figure 12e and Figure 13e, with p < 0.05. Large-sized moose, due to their higher centers of gravity, exhibit greater throw heights and longer lateral distances after being struck. These factors suggest that larger-sized moose herds pose a greater threat to overhead lines, while smaller-sized moose herds may result in a higher risk of secondary collisions.

5. Limitations

The multi-body collision model of moose herd–train collisions used in this study neglects the active reactions of moose to the train and the influence of muscle forces. Additionally, the pre-collision motion posture of the moose is disregarded. Furthermore, in actual accidents involving train collisions with animals, dismemberment of the animals may occur, and simulating this process poses a challenge for our future research endeavors. According to our study, the relative height between the train’s nose tip and the moose’s center of mass influences collision responses. Therefore, the impacts of different train exterior designs during accidents should also be considered in future research.

6. Conclusions

This paper investigated the impact response processes and factors associated with train–moose herd collisions. The results indicate that when a train collides with a moose herd, the collision force exhibits a multi-peak characteristic. When this collision force is transmitted to the wheel–rail contact, it leads to changes in the relative position of the wheel–rail. However, these changes are far below the boundary conditions for train derailment, meaning that there is no possibility of inducing train derailment. Following the collision, interactions among the moose result in the moose that is hit first having the highest vertical throw, which shows a significant correlation with differences in moose size. Larger-sized moose exhibit greater throw heights, but these heights remain below the safety limits and do not pose a safety threat to overhead lines. The primary safety risk in moose–train collisions arises from the secondary collisions between moose that have fallen on the tracks and the oncoming train. Smaller-sized moose herds, due to their lower centers of gravity compared to the train nose, are directed towards the ground upon impact, with their landing points concentrated near the tracks, making them the main source of this safety risk.
Based on our study, we believe that the main risk of moose–train collisions arises from the secondary collision between the train and the moose that fall onto the track after impact. Therefore, designing a new type of deflector or optimizing the front shape of the train to redirect moose beyond the safety boundary is an effective means to address this issue. Additionally, the development of sensory technologies and traffic sign recognition [25,26,27] represent new approaches to solving the moose–train collision problem. By recognizing the status of the moose herd on the track, including the size, speed, and quantity of the constituent moose, the train can proactively adopt corresponding control strategies such as warning signals, acceleration, or braking, effectively reducing the safety threats posed by collisions.

Author Contributions

Conceptualization, Z.H. and S.Z.; methodology, Z.H. and G.D.; software, Z.H.; validation, S.Z., M.D. and Y.Y.; formal analysis, S.Z.; investigation, S.Z.; resources, S.Z. and Y.Y.; data curation, S.Z.; writing—original draft preparation, Z.H. and S.Z.; writing—review and editing, S.Z.; visualization, S.Z. and M.D.; supervision, S.Z.; project administration, S.Z.; funding acquisition, S.Z. All authors have read and agreed to the published version of the manuscript.

Funding

This research was funded by Evaluation of Passive Safety Design of EMU in Large Animal Impact Scenarios (Numerical Simulation Study) [SF/JS-2021-109]; Evaluation of Passive Safety Design of EMU in Large Animal Impact Scenarios (Animal Impact Experiment) [SF/JS-2021-164]; Fundamental Research Funds for the Central Universities of Central South University [2021XQLH135].

Institutional Review Board Statement

Not applicable.

Informed Consent Statement

Not applicable.

Data Availability Statement

Data available upon request from the authors.

Conflicts of Interest

Authors Shizhong Zhao and Yangyang Yu were employed by the company CCRC Qingdao Sifang Co., Ltd. The remaining authors declare that the research was conducted in the absence of any commercial or financial relationships that could be construed as a potential conflict of interest.

References

  1. Tomáš, K.; Ježek, M.; Keken, Z. Mortality of large mammals on railway tracks. Sci. Agric. Bohemoslov. 2011, 4, 12–18. [Google Scholar]
  2. Jasinska, K.D.; Zmihorski, M.; Krauze-Gryz, D.; Kotowska, D.; Werka, J.; Piotrowska, D.; Part, T. Linking habitat composition, local population densities and traffic characteristics to spatial patterns of ungulate–train collisions. J. Appl. Ecol. 2019, 56, 2630–2640. [Google Scholar] [CrossRef]
  3. Jasinska, K.D.; Bijak, S.; Child, K.N.; Rea, R.V. Temporal patterns of moose–train collisions in British Columbia–implications for mitigation. Sylwan 2020, 164, 32–40. [Google Scholar] [CrossRef]
  4. Samar, A.S.P.; Klemen, K. Providing Wildlife Corridors In The Area Of Railway Infrastructure. Acta Silvae Et. Ligni 2023, 131, 29–46. [Google Scholar] [CrossRef]
  5. Backs, J.A.J.; Nychka, J.A.; St. Clair, C.C. Low audibility of trains may contribute to increased collisions with wildlife. Transp. Res. Interdiscip. Perspect. 2022, 13, 100516. [Google Scholar] [CrossRef]
  6. Bhardwaj, M.; Olsson, M.; Hakansson, E.; Seiler, A.; Soderstrom, P. Ungulates and trains–Factors influencing flight responses and detectability. J. Environ. Manag. 2022, 313, 114992. [Google Scholar] [CrossRef] [PubMed]
  7. Backs, J.A.J.; Nychka, J.A.; St. Clair, C.C. Warning systems triggered by trains increase flight–initiation times of wildlife. Transport. Res. Part D Transp. Environ. 2020, 87, 102502. [Google Scholar] [CrossRef]
  8. Nezval, V.; Bil, M. Spatial analysis of wildlife–train collisions on the Czech rail network. Appl. Geogr. 2020, 125, 102304. [Google Scholar] [CrossRef]
  9. Krauze-Gryz, D.; Zmihorski, M.; Jasinska, K.; Kwasny, L.; Werka, J. Temporal pattern of wildlife–train collisions in Poland. J. Wildl. Manag. 2017, 81, 1513–1519. [Google Scholar] [CrossRef]
  10. Andreassen, H.P.; Gundersen, H.; Storaas, T. The effect of scent–marking, forest clearing, and supplemental feeding on moose–train collisions. J. Wildl. Manag. 2005, 69, 1125–1132. [Google Scholar] [CrossRef]
  11. Jasinska, K.D.; Babinska-Werka, J.; Krauze-Gryz, D. A test of wildlife warning reflectors as a way to reduce risk of wildlife–train collisions. Nat. Conserv. 2022, 47, 303–316. [Google Scholar] [CrossRef]
  12. Zhang, H.; Fu, G.; Su, Y.; Yue, Y.; Zhu, W.; Zhang, C.; Lu, Y. Safety study of high–speed collisions between trains and live intruder. Sensors 2022, 228, 824. [Google Scholar] [CrossRef]
  13. Peng, Y.; Deng, M.; Yu, Y.; Hu, Z.; Wang, K.; Wang, X.; Yi, S.; Deng, G. Analysis of moose motion trajectory after bullet train–moose collisions. Eng. Fail. Anal. 2023, 151, 107373. [Google Scholar] [CrossRef]
  14. Peng, Y.; Hu, Z.; Deng, M.; Wang, K.; Yu, Y.; Che, Q.; Deng, G. High–speed Train Crash Safety Assessment for Train–Moose Collisions. Proc. Inst. Mech. Eng. Part. F J. Rail Rapid Transit. 2023; submitted. [Google Scholar]
  15. Gens, M. Moose Crash Test Dummy. Master’s Thesis, Swedish Nation Road and Transport Research Institute, Linköping, Sweden, 2001. [Google Scholar]
  16. Zhang, H.; Peng, Y.; Hou, L.; Wang, D.; Tian, G.; Li, Z. Multistage impact energy distribution for whole vehicles in high–speed train collisions: Modeling and solution methodology. IEEE Trans. Ind. Inf. 2019, 16, 2486–2499. [Google Scholar] [CrossRef]
  17. TASS BV. MADYMO Human Body Models Manual; TASS International: Helmond, The Netherlands, 2013. [Google Scholar]
  18. Cho, H.J.; Koo, J.S. A numerical study of the derailment caused by collision of a rail vehicle using a virtual testing model. Veh. Syst. Dy. 2012, 50, 79–108. [Google Scholar] [CrossRef]
  19. Hou, L.; Peng, Y.; Sun, D. Dynamic analysis of railway vehicle derailment mechanism in train–to–train collision accidents. Proc. Inst. Mech. Eng. Part. F J. Rail Rapid Transit. 2021, 235, 1022–1034. [Google Scholar] [CrossRef]
  20. Hou, L.; Peng, Y.; Sun, D. Hybrid framework for safety design of human–rail vehicle transportation system using stochastic approach and optimization. IEEE Trans. Ind. Inf. 2022, 19, 6599–6612. [Google Scholar] [CrossRef]
  21. Chinese Standard TB/T 2344-2012; Technical Specifications for Procurement of 43 kg/m–75 kg/m Rails. Standards Press of China: Beijing, China, 2017.
  22. Standard NO. GB 146.1-2020; Gauge for Standard Gauge Railways Part 1: Rolling Stock Gauge. SAMR: Beijing, China, 2020.
  23. Standard NO.TB 10621-2014; Code for Design of High Speed Railway. National Railways Beijing: Beijing, China, 2014.
  24. Yang, W.; Xie, S.; Li, H.; Chen, Z. Design and injury analysis of the seated occupant protection posture in train collision. Safety Sci. 2019, 117, 263–275. [Google Scholar] [CrossRef]
  25. Guo, K.; Wu, Z.; Wang, W.; Ren, S.; Zhou, X.; Gadekallu, T.R.; Luo, E.; Liu, C. GRTR: Gradient Rebalanced Traffic Sign Recognition for Autonomous Vehicles. IEEE T. Autom. Sci. Eng. 2023, 1–13. [Google Scholar] [CrossRef]
  26. Lian, Z.; Zeng, Q.; Wang, W.; Xu, D.; Meng, W.; Su, C. Traffic Sign Recognition using Optimized Federated Learning in Internet of Vehicles. IEEE Internet Things 2023, 1. [Google Scholar] [CrossRef]
  27. Deebak, B.D.; Memon, F.H.; Dev, K.; Khowaja, S.A.; Wang, W.; Qureshi, N.M. TAB-SAPP: A Trust-Aware Blockchain-Based Seamless Authentication for Massive IoT-Enabled Industrial Applications. IEEE T. Ind. Inform. 2023, 19, 243–250. [Google Scholar] [CrossRef]
Figure 1. Models of moose and the train: (a) moose model; (b) three sizes of models; (c) train model; (d) nonlinear performance of the train suspension system.
Sustainability 16 01043 g001
Figure 2. Train–moose herd collision scenario.
Sustainability 16 01043 g002
Figure 3. The evaluation indexes: (a) derailment indexes; (b) safety boundary.
Sustainability 16 01043 g003
Figure 4. Moose herd–train collision in the baseline case: (a) kinematics of the moose; (b) Zd and Yd; (c) collision force between the train and moose; (d) Zde; (e) Yde.
Sustainability 16 01043 g004
Figure 5. Peak collision force in the simulation matrix: (a) moose1–train collision force; (b) moose2–train collision force; (c) moose3–train collision force.
Sustainability 16 01043 g005
Figure 6. Zd in the simulation matrix: (a) Zd of moose1; (b) Zd of moose2; (c) Zd of moose3.
Sustainability 16 01043 g006
Figure 7. Yd in the simulation matrix: (a) Yd of moose1; (b) Yd of moose2; (c) Yd of moose3.
Sustainability 16 01043 g007
Figure 8. Evaluation index for train derailment in the simulation matrix: (a) Zde; (b) Yde.
Sustainability 16 01043 g008
Figure 9. Interval plots of the collision force with 95% confidence intervals for the means and corresponding p values from ANOVA: (a) d; (b) vm; (c) vt; (d) moose size of the herd.
Sustainability 16 01043 g009
Figure 10. Interval plots of Zde with 95% confidence intervals for the means and corresponding p values from ANOVA: (a) d; (b) vm; (c) vt; (d) moose size of the herd.
Sustainability 16 01043 g010
Figure 11. Interval plots of Yde with 95% confidence intervals for the means and corresponding p values from ANOVA: (a) d; (b) vm; (c) vt; (d) moose size of the herd.
Sustainability 16 01043 g011
Figure 12. Interval plots of Zd with 95% confidence intervals for the means and corresponding p values from ANOVA: (a) d; (b) vm; (c) vt; (d) moose size of the herd; (e) moose size.
Sustainability 16 01043 g012
Figure 13. Interval plots of Yd with 95% confidence intervals for the means and corresponding p values from ANOVA: (a) d; (b) vm; (c) vt; (d) moose size of the herd; (e) moose size.
Sustainability 16 01043 g013
Table 1. Parameter variations in the simulation matrix.
Input ParameterValue Sample (Baseline Case Shown in Bracket)
Moose size MS5th 50th95thmixed
Train   speed   v t (km/h)36(110)180250
Moose   speed   v m (km/h)(0)204060
Interval d (m)1.5(2.0)2.5
Disclaimer/Publisher’s Note: The statements, opinions and data contained in all publications are solely those of the individual author(s) and contributor(s) and not of MDPI and/or the editor(s). MDPI and/or the editor(s) disclaim responsibility for any injury to people or property resulting from any ideas, methods, instructions or products referred to in the content.

