Article

Disparities in Urban Park Visitation Patterns among Socioeconomically Vulnerable Communities during the COVID-19 Pandemic

1
Department of Landscape Architecture, University of Seoul, Seolusiripdae-ro 163, Dongdaemun-gu, Seoul 02504, Republic of Korea
2
School of Architecture & Architectural Engineering, Hanyang University ERICA, Ansan 15588, Republic of Korea
3
Department of Architectural Engineering, Hanyang University ERICA, Ansan 15588, Republic of Korea
4
Department of Civil Engineering, Korea National University of Transportation, Chungju 27469, Republic of Korea
*
Authors to whom correspondence should be addressed.
Sustainability 2024, 16(3), 1070; https://doi.org/10.3390/su16031070
Submission received: 29 December 2023 / Revised: 20 January 2024 / Accepted: 23 January 2024 / Published: 26 January 2024
(This article belongs to the Section Health, Well-Being and Sustainability)

Abstract

:
Urban parks played an important role during the COVID-19 pandemic among urban dwellers. Numerous studies have shown that park visitations increased or decreased during the pandemic depending on the parks’ contexts, locations, and populations. However, a lack of research has been conducted regarding the impact of COVID-19 on vulnerable and non-vulnerable communities. Therefore, this study seeks to identify the differences between socioeconomic levels in responses to COVID-19′s impact on urban park visits. To observe park users’ movements in real-world scenarios, mobile signaling data were used to capture their movements. Then, using Repeated Measures ANOVA (RM ANOVA), the effectiveness of park visit patterns was statistically verified by considering two variables: “time” and “vulnerability”. The results showed that park visits increased during the early stages of the COVID-19 pandemic regardless of the vulnerability. As COVID-19 spread, underserved communities experienced decreased park visits, demonstrating park inequality after the pandemic. The comparisons in this study provide recommendations for park managers and policymakers in terms of reducing park inequality.

1. Introduction

The coronavirus disease 2019 (COVID-19) pandemic has had a profound and far-reaching impact on society [1,2]. To contain the spread of the virus, social distancing measures have severely limited daily and economic activities [3]. This has had a particularly devastating effect on vulnerable groups, such as those with low wages, low education levels, non-regular employment, and women who are disproportionately employed in non-essential and face-to-face intensive jobs [4].
The phenomenon of polarization has not been limited to social issues but has also been observed in the use of parks during the COVID-19 pandemic. Previous literature on environmental inequality [5,6] noted that those with low incomes, poor working conditions, or are from immigrant groups lack accessibility to green spaces and have fewer of them. Recent studies [7,8] have emphasized the critical role that urban parks have played during the COVID-19 pandemic in mitigating the adverse effects of physical inactivity, social isolation, anxiety, and depression, especially for the most vulnerable and socially marginalized populations.
Numerous studies have examined the relationship between COVID-19 and park visitation patterns. Their results have been mixed, with some studies showing an increase in park visits during the pandemic and others showing decreases. For instance, according to the “Community Mobility Report” by Google, park visits in March 2020, when the COVID-19 pandemic was in full swing, were 51% higher compared to January and February [9]. However, other studies have found that park visits decreased due to social distancing measures and stay-at-home orders [10,11]. Additionally, the varying impact of the pandemic on different communities, particularly those more vulnerable due to socioeconomic factors, underscores the need for a nuanced exploration of how these disparities have influenced park visitation patterns. These studies did not examine park visitation rates based on the vulnerability levels of communities, leaving open the possibility that differences in park visits may exist based on socioeconomic status.
This study aims to fill this research gap by investigating the differing responses to the COVID-19 pandemic between communities, explicitly focusing on socioeconomic vulnerabilities. To this end, this study is guided by the following hypotheses: Hypothesis 1 (H1) posits that park usage patterns in vulnerable communities have been significantly altered during the COVID-19 pandemic. Hypothesis 2 (H2) proposes that there are significant differences between the effects of the COVID-19 pandemic on different socioeconomic communities, particularly regarding vulnerable populations such as seniors. These hypotheses are formulated to explore the nuanced impacts of the pandemic on urban park usage across various socioeconomic strata and will guide the subsequent analysis in this study. To answer these questions, this study utilized mobile signaling data to analyze park visitation patterns in two urban parks in Seoul, South Korea, with one being located in a vulnerable community and the other in a non-vulnerable community. The impact of COVID-19 on urban park visits was analyzed using repeated measure analysis of variance (RM-ANOVA), with “time” (pre-, during, and post-COVID-19) as the within-subject factor and “vulnerability” (vulnerable and non-vulnerable communities) as the between-subject factor.
The results of this study can contribute to the field of environmental inequalities by demonstrating how infectious diseases like COVID-19 can impact park usage patterns. Additionally, this study aims to provide practical insights for policymakers and park managers on how to increase access to parks for underprivileged or disadvantaged populations.

2. Literature Review

A significant amount of research has confirmed the increased need for urban green spaces (UGSs) among city residents during the COVID-19 pandemic [12], and the quarantine period highlighted the importance of these spaces as places for recreation, physical activity, appreciation of the natural environment, and restoration [13,14].
Many studies conducted during the spread of COVID-19 focused on changes in park visit patterns [7,8]. Due to strict restrictions, researchers commonly used big data analysis techniques such as social media platforms and smartphone mobility data instead of traditional data collection methods such as self-reported surveys [13]. With the advent of big data analysis, researchers can now gather substantial data to understand daily experiences and infer user preferences and perceptions regarding urban parks [15,16]. For instance, the Community Mobility Report by Google was used in several studies, such as Sulyok and Walker [17], to track the number of visitors in multiple parks. One analysis that utilized mobile device location tracking in South Korea reported a 51% increase in park visits in March 2020 compared to January and February 2020, before the implementation of social distancing measures.
Studies examining changes in park activities due to COVID-19 also analyzed keywords or hashtags extracted from social media posts. Volenec et al. [18] used location information from Instagram posts to study changes in park visits. The results showed that park visits increased during the first month after the outbreak of COVID-19 but then decreased due to park closures. However, after reopening, park visits returned to normal or even slightly higher levels than before the closure. A study by Lu et al. [19] analyzed Instagram data to understand how park visit patterns changed in various Asian countries. The study results showed that people preferred large parks near city centers, leading to a 5.3% increase in visitation. As a result, previous studies indicate that people preferred outdoor activities in safe environments when there was a park or a residence nearby during the early stages of the pandemic.
However, some studies noted that park use and access to outdoor recreational activities vary based on socioeconomic circumstances [11,20,21]. A study by Larson et al. [22] found that park use decreased significantly among the racially diverse (i.e., BIPOC) group, a socially vulnerable group, using surveys and cell phone location data. Another study by Zhang et al. [10] examined changes in travel to UGSs based on different levels of COVID-19 risk. The study found that park use overall decreased with increasing COVID-19 risk, but those with higher incomes, higher education levels, and female visitors who took fewer public transportation trips were less likely to reduce park visits. This suggests that neighborhoods with higher concentrations of low-income households or socially disadvantaged racial/ethnic groups have fewer opportunities for outdoor recreational activities and walking [23].
In addition to the profound impact of the COVID-19 pandemic, it is essential to consider other influential factors on visitor behavior patterns in urban green spaces. Extensive research predating the pandemic has highlighted various elements such as urban development, demographic changes, and environmental factors that significantly affect park visitation patterns [24,25]. For instance, studies have shown how urban sprawl and the availability of public transportation can influence the accessibility and usage of parks [26]. Demographic shifts, such as aging populations or changing family structures, also play a crucial role in determining how different groups interact with urban green spaces [27]. Environmental factors, including weather patterns and seasonal changes, have been found to significantly impact park visitation trends, as they affect the attractiveness and accessibility of these spaces [28]. Understanding these multifaceted influences is crucial for a comprehensive analysis of park visitation patterns, as they contribute to the dynamic nature of how urban spaces are used and valued by different communities. This broader perspective complements the insights gained from pandemic-focused research, offering a more holistic understanding of the factors driving visitor behavior in urban parks.
In conclusion, the demand for UGS access increased during the COVID-19 pandemic due to the perception of relatively safe environments. However, the “stay-at-home” order and social distancing guidelines forced people to reduce park usage, leading to varying changes in park visit patterns based on time, location, and user groups. Despite numerous studies measuring park visits before and during the pandemic, a comparison of park visits between socially disadvantaged and non-vulnerable communities, considering both time and location, is yet to be conducted. Furthermore, in South Korea, the identification of socially vulnerable populations and their park visitation patterns is primarily influenced by socioeconomic factors rather than racial diversity, reflecting the country’s relatively homogenous ethnic composition [29]. Hence, it is crucial to understand park visit patterns during the COVID-19 pandemic by considering socioeconomic indicators specific to the Korean context.

3. Site Selection, Data Preparation, and Analysis

3.1. Park Selection

The process of selecting a park for analysis involved the following stages: (1) creating social vulnerability indexes (SVIs) suited to Korea and mapping, (2) conducting a spatial analysis of Seoul’s vulnerability, and (3) identifying suitable parks for comparison. To initiate the process, an SVI was developed for Seoul, drawing upon previous research [30]. The SVI developed by the Centers for Disease Control and Prevention (CDC) was adapted to suit the Korean context. Specific indicators such as race, language, and transportation indices were excluded as they were deemed irrelevant to vulnerabilities in Korea. The resulting indexes used in this study include housing (physical features of buildings and areas with limited facilities), household composition (age 65 or above and population density), and socioeconomic status (poverty and income). These six indicators were used to evaluate socioeconomic vulnerability in Seoul and were obtained from various public databases. These are summarized in Table 1.
Second, the values of the six previously mentioned indicators were mapped in 425 of the administrative districts of Seoul (as shown in Figure 1). To create the map, each socioeconomic indicator was normalized to adjust the data distribution (as described by Plakas et al. [31]). Normalization is a technique that minimizes the impact of the variable size on the relative size of the data. The normalization process was determined by the nature of the variables in this study. For instance, the higher the officially assessed reference land price, the higher the socioeconomic status, whereas the higher the percentage of individuals aged ≥ 65, the lower the socioeconomic status. The data were analyzed and presented using QGIS3.34.2 software, and the criteria for classification are outlined in Figure 1, accompanied by a graphical representation of the method.
Z i   ( p o s i t i v e   s e r i e s ) = X i m i n X i m a x X i m i n ( X i )   Z i ( n e g a t i v e   s e r i e s ) = m a x X i X i m a x X i m i n ( X i )
Third, to distinguish between districts with relatively high socioeconomic levels and those with lower levels, a spatial autocorrelation analysis was performed. Spatial autocorrelation analysis is the standard method used to determine whether features are clustered, randomly distributed, or dispersed based on the proximity of the values [32]. Specifically, Local Indicators of Spatial Autocorrelation (LISAs) were used to measure spatial autocorrelation at the local level and distinguish between hotspots (represented by red to indicate non-vulnerable communities) and cold spots (represented by blue to show vulnerable communities) (see Figure 2). Parks with comparable sizes were selected for analysis from both vulnerable and non-vulnerable communities, with Seoul Forest and North Seoul Dream Forest being chosen due to their similar spatial dimensions and amenities.

3.2. Data Collection and Preparation

In this study, the foot traffic data from Seoul Open Data Plaza were utilized to examine changes in park visits. These anonymized location-tracking data allow researchers to uncover park user behavior patterns and identify populations not typically represented in research studies [23]. However, it has been noted that some people, such as children and low-income individuals without cell phones, may be excluded, leading to an under-representation of park visits [33]. Despite this limitation, South Korea has the highest rate of smartphone ownership at 94% [34], making it a legitimate data source. Additionally, data for young age groups and those over 80 years old were estimated based on comparisons with adjacent age groups (10–14 years old and 70–79 years old) and the resident population ratio at the administrative district level. In this study, the data utilized, including representations of age groups typically under-represented in mobile data, such as children under 10 and seniors over 80, were pre-adjusted by the telecom company. This adjustment was made using the official data from the National Statistical Office to ensure a more accurate representation of these age groups. Therefore, our analysis includes a comprehensive depiction of park visitation patterns across all age demographics by leveraging this pre-adjusted data.
Compared to other GPS-based mobility data, foot traffic data offer several advantages. The data are provided by Korea Telecom (KT), which accounts for a large portion of domestic telecommunication companies (33% of all users). KT provides more detailed information compared to other sources. For example, while SafeGraph offers weekly data on the number of smartphones [23], the foot traffic data by KT provide the number of individuals in one-hour increments (00:00, 01:00, …, 23:00). Furthermore, foot traffic data are more accurate since it incorporates big data generated by the City of Seoul, such as statistics on public transportation usage, demographics, business survey data, and building databases, along with KT’s communication data.
The data analysis time period was selected based on the COVID-19 outbreak period in Korea. The second (July–August) and third (December) waves were excluded as calendar variations were likely to influence park visits [33], and there were very few park visits during these periods due to typhoons or home quarantine policies. The reference period of 30 days before and after the first wave of COVID-19 was used as this period was likely to provide the most accurate representation of park visits. Thus, the annual data for 17 January to 11 April in 2019, 2020, and 2021 were used to estimate park visits in both Seoul Forest and Dream Forest.

3.3. Analysis Plan

To achieve the purpose of this study, multiple steps were performed. First, a scatterplot was created to visualize the daily park visits for both parks. To accomplish this, rows matching the census tract assigned to each park were extracted from the original foot traffic data. The original age group data (i.e., 0 to 9 years old, 10 to 14 years old, …, 60 to 64 years old, 65 to 79 years old, 70 years of age or older) were converted into age groups by combining data based on the decade (the 20s, 30s, etc.). Then, the number of visitors to the Seoul Forest and Dream Forest were collected, and the raw data were plotted daily for visual description using an Excel 2012 spreadsheet (Microsoft Corp., Redmond, WA, USA).
Second, to examine the effect of COVID-19 on both vulnerable and non-vulnerable parks, we used a repeated measure ANOVA (RM-ANOVA) method. This is because the census tract data were collected over time in the same area; therefore, statistically, the correlation between parks may be abnormally high, resulting in a high p value because of the large variance [35]. Thus, a two-way mixed design was used to analyze two variables: “time” and “vulnerability”. Specifically, an outcome measure, “difference in time due to COVID-19 outbreak” (before, mid, and after), was entered into RM-ANOVA with “vulnerability” (Seoul Forest vs. Dream Forest) as the within-subject factor.
Lastly, to determine whether the effect of COVID-19 was exacerbated in vulnerable groups, RM-ANOVA was conducted again during 2019–2021 by filtering only the elderly (>60 years of age) population data. It should be noted that children under the age of 10 can also be classified as vulnerable groups, but since their parents often accompany them, they are not included in this data analysis. All main effects and interactions were examined, and the Greenhouse–Geisser corrected values were provided. Estimates of effect sizes were based on partial eta squared, and 95% confidence intervals were provided when appropriate. The threshold for statistical significance was set at p < 0.05. JAMOVI Statistics, version 2.3.18, was used for statistical analysis.

4. Results

4.1. Park Visit Patterns in Vulnerable and Non-Vulnerable Communities

The scatterplot for Seoul Forest (Figure 3), located in a non-vulnerable community, indicates that the park was primarily visited by individuals in their 30s, 40s, 50s, and 60s, as opposed to teenagers and younger individuals. This is possibly due to the proximity of business and commercial districts, which draws many office workers from nearby areas to the park. Surprisingly, the most active visitors were those aged 60 and older, despite expectations that Seongsu Café Street would attract younger generations to Seoul Forest.
Observations of park visitation patterns in 2019 revealed routine behaviors. During the holiday season, such as the Lunar New Year, the visit rate declined on 4 February, while the number of visitors in their 20s dropped in March due to the start of the school semester. In April, the number of visitors in their 30s increased rapidly, especially when the cherry blossoms were in bloom.
With the onset of COVID-19 in March 2020, the park visitation rate drastically increased for all age groups compared to 2019. This sudden increase was likely due to the closure of schools and entertainment venues, leading to more frequent park visits. Additionally, outdoor activities were recommended over indoor activities during this period, influencing park visitation, particularly for those in their 20s due to the shift to online classes. Interestingly, teenagers and younger individuals, previously considered vulnerable and not to visit parks frequently, started visiting more frequently during the COVID-19 pandemic. In 2021, park visitation remained high, with an increase in visitors compared to 2019.
Dream Forest, located in a vulnerable area, had a higher frequency of visitors aged 60 and older compared to other age groups, suggesting that the elderly population primarily used the park (Figure 4). This was likely due to the high proportion of elderly residents in the surrounding area. The park’s visitation patterns revealed a distinct difference between weekdays and weekends, with significantly increased weekend activity. In contrast to Seoul Forest, park visits increased in all age groups on Lunar New Year’s Day, possibly due to Dream Forest’s location in a residential area where families and friends gather to celebrate the holiday.
In 2020, park visitation at Dream Forest increased in all age groups, similar to that observed at Seoul Forest. This could be attributed to the ban on indoor activities and the encouragement of outdoor activities during the COVID-19 pandemic. However, in 2021, although the number of visitors was slightly higher than in 2019, the park was still used less frequently than in 2020, indicating a different trend in visitation compared to Seoul Forest.

4.2. COVID-19 and Park Visitation in Vulnerable/Non-Vulnerable Communities

To test the first hypothesis of this study—whether a statistically significant difference exists between the visitations of the two parks, RM-ANOVA was used. Before analyzing the main effects, Mauchly’s test was conducted to evaluate the sphericity condition [36]. Mauchly’s Test of Sphericity indicated that the assumption of sphericity had been violated (p < 0.001). Hence, a Huynh–Feldt correction was used, as the Greenhouse–Geisser ε (0.877) value was larger than 0.75. The results indicated a statistically significant effect of time on park visitations, F(1.77, 297.48) = 142.9, p < 0.001, indicating that park visitation changed over time.
The main effect of the interaction term (Period × Park type; F(1, 168) = 455, p < 0.001) was also statistically significant, suggesting significant differences in park visitation rates between the two parks from 2019 to 2021. The graph of interaction terms (Figure 5) provides a clearer explanation of the results. In 2019, park visits to Seoul Forest were slightly higher than those to Dream Forest. When COVID-19 spread in 2020, Dream Forest’s growth rate was greater than Seoul Forest’s due to Seoul Forest’s higher previous visitation rate. However, as the COVID-19 pandemic extended in 2021, the difference in visitation between the two parks became more apparent, indicating different park visitations in vulnerable and non-vulnerable communities following COVID-19.
In summary, park visitation increased regardless of whether the park was located in vulnerable or non-vulnerable communities following the outbreak of COVID-19. However, as the effects of the COVID-19 pandemic extended, different park visitation patterns were observed depending on park location.

4.3. COVID-19 and Park Visitation by the Elderly Population

The second hypothesis of this study was tested using RM-ANOVA to determine if there was a statistically significant difference between the visitations of the two parks by vulnerable groups, specifically the elderly population. The sphericity assumption was met as evidenced by Mauchly’s test (Greenhouse–Geisser ε = 0.986, Huynh–Feldt ε = 0.998, p = 0.311); therefore, no adjustments were necessary. The RM-ANOVA results indicated no significant difference in the number of elderly visitors between the two parks (Between-Subject Effects; p = 0.303). However, a statistically significant interaction effect was observed between the time variable (COVID-19 effect) and park type (Period × Park type; F(1, 168) = 1.07, p < 0.001; Figure 5), revealing that COVID-19 had a significant impact on the difference between the two parks for the elderly population. Specifically, in 2019 and 2020, more elderly people visited Dream Forest than Seoul Forest, but after COVID-19, visitations to Seoul Forest increased, while those to Dream Forest decreased. In summary, there were no differences in elderly visitor numbers between the two parks, but significant differences were observed when the COVID-19 effect was considered.

5. Discussion

5.1. Discussion of the Study Results

This study investigated the effects of the spread of COVID-19 on park equity. Park visits were first compared in vulnerable and non-vulnerable communities and between pre-, mid-, and post-COVID-19 periods to achieve this. A second objective was to investigate changes in park visits during the COVID-19 pandemic by the vulnerable population (≥60 years old). While some previous studies have investigated the effect of COVID-19 on urban park visitations [11,13], a comprehensive study has not examined the impact of COVID-19 on urban park visitations considering the time (pre-, during, and post-) and vulnerability together. Given this gap, this study sought to determine the impact of COVID-19 on urban park visitations by comparing vulnerable and non-vulnerable communities.
Concurring with previous research by Lu et al. [19] and Volenec et al. [18], the present study also found that park visits increased at the start of the COVID-19 outbreak in early 2020. Urban parks were found to provide safe outdoor spaces for leisure activities away from infectious diseases, which explains the rise in visits during the pandemic [33]. This study also found that the increase in park visits occurred across both vulnerable and non-vulnerable communities, indicating that urban parks are essential for ensuring a safe and healthy social environment, particularly for socioeconomically vulnerable communities that may not have access to indoor leisure spaces like nursing homes.
Further analysis revealed that the patterns of increased park visits due to COVID-19 varied based on community vulnerability. While initial trends showed an overall increase in park visits, a more nuanced examination indicated that park visits in vulnerable communities, exemplified by Dream Forest, exhibited a decreasing trend over time as the pandemic progressed. In contrast, non-vulnerable communities demonstrated a consistent pattern of park visits, possibly reflecting better adherence to social distancing measures.
This disparity in park visitation patterns may be influenced by broader socioeconomic factors and public health challenges faced by vulnerable populations, as seen in various global contexts [25]. For instance, in the U.S., significant portions of the population face challenges like underinsurance, high healthcare costs, a lack of basic amenities like running water, and the absence of paid sick leave, particularly among low-wage earners [24]. Such conditions make adherence to public health guidelines, including self-quarantining and basic infection prevention practices, less feasible. Moreover, the necessity for many low-income workers to hold multiple jobs, often involving face-to-face interaction, increases their risk of contracting or spreading COVID-19. These factors, which contribute to the overall vulnerability of certain populations, can be paralleled in other contexts, including in the setting of our study. Thus, our findings suggest that socioeconomic status, along with the associated public health challenges, plays a crucial role in shaping responses to public health policies during pandemics. The varying patterns of park visits in different communities, as observed in our study, reflect these broader socioeconomic disparities and public health vulnerabilities.
Previous research indicates that people prefer large and easily accessible greenspaces [37,38]. However, recent studies suggest that during the COVID-19 pandemic, people tend to visit parks closer to their homes more often than distant parks [33,39]. Additionally, parks in areas with more parks are less likely to experience decreased visitation [40,41]. Interestingly, the present study found that while visits to Dream Forest, located in a residential area, decreased, Seoul Forest, closer to commercial and office areas, experienced an increase in visitors. Lee et al.’s [8] study proved that recreational walking and park visits were more severely reduced in areas with lower socioeconomic status during the COVID-19 pandemic. Another reason can be that many visitors to Seoul Forest traveled to the park using personal vehicles, as the pandemic significantly reduced the usage of public transportation [12], while the number of visitors walking or using cars increased [21,42].
In general, the elderly population followed a similar pattern to other age groups. When comparing the visits of the elderly population in 2019 and 2020, Dream Forest had a higher proportion of elderly users than Seoul Forest. However, in 2021, the number of elderly visitors to Seoul Forest increased along with the park’s overall usage, surpassing that of Dream Forest. Previous studies [10,12] have demonstrated that park visitations decreased among vulnerable populations, mostly among female visitors. However, this study revealed that park visitations by vulnerable populations differed depending on park location.
The increase in elderly visitors to Seoul Forest in 2021 may reflect their greater need for recreation, social contact, and physical activity in urban parks. Supporting this, Zhang et al. [10] observed that older visitors are inclined to visit urban parks despite the COVID-19 risks, provided the parks are accessible. On the other hand, the initial high visitation in Dream Forest, located in a vulnerable community, can be interpreted in the context of the early stages of the pandemic. The stringent social distancing measures during this period likely limited long-distance travel, prompting people to frequent more accessible neighborhood parks [43]. This suggests that the park visitation patterns, particularly in vulnerable communities, might have been influenced more by accessibility and proximity during the early pandemic stages than by the community’s vulnerability status itself. Therefore, the observed trends in park visitation among the elderly across different communities might reflect a broader response to pandemic-related mobility restrictions rather than a direct correlation with community vulnerability.

5.2. Practical Implications and Limitations

This study aims to provide practical guidelines to reduce park inequality. Park managers and practitioners should consider vulnerable populations in their decision making, especially when developing long-term responses to a pandemic. First, addressing the transportation needs of vulnerable communities regarding safety and affordability is crucial. These individuals require accessible and affordable transportation options, and a compact and walkable urban environment would benefit their daily travel needs [23]. Second, it is essential to regularly clean and disinfect outdoor recreational facilities during the COVID-19 pandemic since the fear of infection is greater among vulnerable populations. Lastly, to address the equity problem of parks, it is important to consider the primary user group. In Dream Forest, senior-friendly park programs and designs, such as barrier-free designs and community gardens, are necessary for areas with limited park access.
There are limitations in this study that should be acknowledged. Foot traffic data were used to determine park usage, but it was challenging to identify users’ exact movements relative to the parks’ boundaries because the county district provided the data without “origin” data (as opposed to “destination”) or information. Future studies could benefit from incorporating origin data to enrich study findings. Moreover, the study did not consider external factors like weather and temperature, which could affect park usage. In a follow-up study, adjusting for internal and external factors that impact park visits may be useful. Lastly, while this study compared park usage before and after COVID-19 for three years, the long-term effects of COVID-19 on park usage in vulnerable areas and groups should be monitored, and efforts should be made to increase their utilization.

6. Conclusions

This study analyzed mobile signaling data to investigate park usage among vulnerable and non-vulnerable communities during the COVID-19 pandemic. The results indicate that park visitation increased in both types of communities during the early stages of the pandemic. However, we also found that it was challenging to maintain or increase park attendance in vulnerable areas as the pandemic persisted. These findings emphasize the need for park managers and policymakers to focus on improving park accessibility and environmental equality in the post-COVID-19 period to encourage vulnerable populations to visit parks. Overall, this study provides insights that could inform the development of effective policies and strategies to reduce park inequality and promote equitable access to parks.

Author Contributions

Conceptualization, J.H.L.; methodology, Y.A.; formal analysis, D.K.; investigation, H.K.; data curation, D.K.; writing—original draft preparation, J.H.L.; writing—review and editing, Y.A.; visualization, J.H.L.; supervision, Y.A. All authors have read and agreed to the published version of the manuscript.

Funding

This work was supported by the 2020 Research Fund of the University of Seoul for Jae Ho Lee. Also, this work was supported by the Korea Institute of Energy Technology Evaluation and Planning (KETEP) grant funded by the Korea government (MOTIE) for Yonghan Ahn (20227200000010, Building Crucial Infrastructure in order for Demonstration Complex Regarding Distributed Renewable Energy System).

Data Availability Statement

The data presented in this study are available on request from the corresponding author.

Conflicts of Interest

The authors declare no conflicts of interest.

References

  1. Saladino, V.; Algeri, D.; Auriemma, V. The Psychological and Social Impact of COVID-19: New Perspectives of Well-Being. Front Psychol 2020, 11, 2550. [Google Scholar] [CrossRef]
  2. Ali, I.; Alharbi, O.M. COVID-19: Disease, Management, Treatment, and Social Impact. Sci. Total Environ. 2020, 728, 138861. [Google Scholar] [CrossRef]
  3. Marek, D.; Patrik, R.; Veronika, G.; Marina, F. Economic Impacts of COVID-19 on the Labor Market and Human Capital. Terra Econ. 2020, 18, 78–96. [Google Scholar]
  4. Wilson, S.M.; Bullard, R.; Patterson, J.; Thomas, S.B. Roundtable on the Pandemics of Racism, Environmental Injustice, and COVID-19 in America. Environ. Justice 2020, 13, 56–64. [Google Scholar] [CrossRef]
  5. Reijneveld, S.A.; Verheij, R.A.; de Bakker, D.H. The Impact of Area Deprivation on Differences in Health: Does the Choice of the Geographical Classification Matter? J. Epidemiol. Community Health 2000, 54, 306–313. [Google Scholar] [CrossRef]
  6. Rigolon, A. A Complex Landscape of Inequity in Access to Urban Parks: A Literature Review. Landsc Urban Plan 2016, 153, 160–169. [Google Scholar] [CrossRef]
  7. Geng, D.; Innes, J.; Wu, W.; Wang, G. Impacts of COVID-19 Pandemic on Urban Park Visitation: A Global Analysis. J. Res. 2021, 32, 553–567. [Google Scholar] [CrossRef]
  8. Lee, S.; Lee, C.; Xu, M.; Li, W.; Ory, M. People Living in Disadvantaged Areas Faced Greater Challenges in Staying Active and Using Recreational Facilities during the COVID-19 Pandemic. Health Place 2022, 75, 102805. [Google Scholar] [CrossRef] [PubMed]
  9. Fitzpatrick, J.; DeSalvo, K. Helping Public Health Officials Combat COVID-19 the Keyword. Available online: https://www.blog.google/technology/health/covid-19-community-mobility-reports?hl = en (accessed on 28 December 2023).
  10. Zhang, W.; Li, S.; Gao, Y.; Liu, W.; Jiao, Y.; Zeng, C.; Wang, T. Travel Changes and Equitable Access to Urban Parks in the Post COVID-19 Pandemic Period: Evidence from Wuhan, China. J. Environ. Manag. 2022, 304, 114217. [Google Scholar] [CrossRef] [PubMed]
  11. Addas, A.; Maghrabi, A. How Did the COVID-19 Pandemic Impact Urban Green Spaces? A Multi-Scale Assessment of Jeddah Megacity (Saudi Arabia). Urban Urban Green 2022, 69, 127493. [Google Scholar] [CrossRef] [PubMed]
  12. Ugolini, F.; Massetti, L.; Calaza-Martínez, P.; Cariñanos, P.; Dobbs, C.; Ostoić, S.K.; Sanesi, G. Effects of the COVID-19 Pandemic on the Use and Perceptions of Urban Green Space: An International Exploratory Study. Urban Urban Green 2020, 56, 126888. [Google Scholar] [CrossRef]
  13. Huang, J.H.; Floyd, M.F.; Tateosian, L.G.; Hipp, J.A. Exploring Public Values through Twitter Data Associated with Urban Parks Pre-and Post-COVID-19. Landsc Urban Plan 2022, 227, 104517. [Google Scholar] [CrossRef]
  14. Wan, C.; Shen, G.Q.; Choi, S. Eliciting Users’ Preferences and Values in Urban Parks: Evidence from Analyzing Social Media Data from Hong Kong. Urban Urban Green 2021, 62, 127172. [Google Scholar] [CrossRef]
  15. Grzyb, T.; Kulczyk, S.; Derek, M.; Woźniak, E. Using Social Media to Assess Recreation across Urban Green Spaces in Times of Abrupt Change. Ecosyst. Serv. 2021, 49, 101297. [Google Scholar] [CrossRef]
  16. Heikinheimo, V.; Tenkanen, H.; Bergroth, C.; Järv, O.; Hiippala, T.; Toivonen, T. Understanding the Use of Urban Green Spaces from User-Generated Geographic Information. Landsc Urban Plan 2020, 201, 103845. [Google Scholar] [CrossRef]
  17. Sulyok, M.; Walker, M. Community Movement and COVID-19: A Global Study Using Google’s Community Mobility Reports. Epidemiol Infect 2020, 148, e284. [Google Scholar] [CrossRef] [PubMed]
  18. Volenec, Z.M.; Abraham, J.O.; Becker, A.D.; Dobson, A.P. Public Parks and the Pandemic: How Park Usage Has Been Affected by COVID-19 Policies. PLoS ONE 2021, 16, e0251799. [Google Scholar] [CrossRef] [PubMed]
  19. Lu, Y.; Zhao, J.; Wu, X.; Lo, S.M. Escaping to Nature during a Pandemic: A Natural Experiment in Asian Cities during the COVID-19 Pandemic with Big Social Media Data. Sci. Total Environ. 2021, 777, 146092. [Google Scholar] [CrossRef]
  20. Derks, J.; Giessen, L.; Winkel, G. COVID-19-Induced Visitor Boom Reveals the Importance of Forests as Critical Infrastructure. Policy Econ. 2020, 118, 102253. [Google Scholar] [CrossRef] [PubMed]
  21. Venter, Z.S.; Barton, D.N.; Gundersen, V.; Figari, H.; Nowell, M. Urban Nature in a Time of Crisis: Recreational Use of Green Space Increases during the COVID-19 Outbreak in Oslo, Norway. Environ. Res. Lett. 2020, 15, 104075. [Google Scholar] [CrossRef]
  22. Larson, L.R.; Zhang, Z.; Oh, J.I.; Beam, W.; Ogletree, S.S.; Bocarro, J.N.; Wells, M. Urban Park Use during the COVID-19 Pandemic: Are Socially Vulnerable Communities Disproportionately Impacted? Front. Sustain. Cities 2021, 3, 710243. [Google Scholar] [CrossRef]
  23. Song, Y.; Lee, S.; Park, A.H.; Lee, C. COVID-19 Impacts on Non-Work Travel Patterns: A Place-Based Investigation Using Smartphone Mobility Data. Environ. Plan. B Urban Anal. City Sci. 2019, 50, 642–659. [Google Scholar] [CrossRef]
  24. Karaye, I.M.; Horney, J.A. The Impact of Social Vulnerability on COVID-19 in the US: An Analysis of Spatially Varying Relationships. Am. J. Prev. Med. 2020, 59, 317–325. [Google Scholar] [CrossRef]
  25. Dasgupta, S.; Bowen, V.B.; Leidner, A.; Fletcher, K.; Musial, T.; Rose, C.; Oster, A.M. Association between Social Vulnerability and a County’s Risk for Becoming a COVID-19 Hotspot—United States, June 1–July 25. Morb. Mortal. Wkly. Rep. 2020, 69, 1535. [Google Scholar] [CrossRef]
  26. Chang, Z.; Chen, J.; Li, W.; Li, X. Public Transportation and the Spatial Inequality of Urban Park Accessibility: New Evidence from Hong Kong. Transp. Res. D Transp. Environ. 2019, 76, 111–122. [Google Scholar] [CrossRef]
  27. Donahue, M.L.; Keeler, B.L.; Wood, S.A.; Fisher, D.M.; Hamstead, Z.A.; McPhearson, T. Using Social Media to Understand Drivers of Urban Park Visitation in the Twin Cities, MN. Landsc. Urban Plan 2018, 175, 1–10. [Google Scholar] [CrossRef]
  28. Sun, P.; Liu, P.; Song, Y. Seasonal Variations in Urban Park Characteristics and Visitation Patterns in Atlanta: A Big Data Study Using Smartphone User Mobility. Urban Urban Green 2024, 91, 128166. [Google Scholar] [CrossRef]
  29. Shin, G.-W. Racist South Korea? Diverse but Not Tolerant of Diversity. In Race and Racism in Modern East Asia; Brill: Leiden, The Nederlands, 2013; pp. 369–390. [Google Scholar]
  30. Flanagan, B.E.; Hallisey, E.J.; Adams, E.; Lavery, A. Measuring Community Vulnerability to Natural and Anthropogenic Hazards: The Centers for Disease Control and Prevention’s Social Vulnerability Index. J. Environ. Health 2018, 80, 34–36. [Google Scholar]
  31. Plakas, K.V.; Georgiadis, A.A.; Karabelas, A.J. Sustainability Assessment of Tertiary Wastewater Treatment Technologies: A Multi-Criteria Analysis. Water Sci. Technol. 2016, 73, 1532–1540. [Google Scholar] [CrossRef]
  32. Griffith, D.A.; Li, B. Advanced Introduction to Spatial Statistics; Edward Elgar: Chltenham, UK, 2022. [Google Scholar]
  33. Curtis, D.S.; Rigolon, A.; Schmalz, D.L.; Brown, B.B. Policy and Environmental Predictors of Park Visits during the First Months of the COVID-19 Pandemic: Getting out While Staying In. Environ. Behav. 2022, 54, 487–515. [Google Scholar] [CrossRef]
  34. Poushter, J.; Bishop, C.; Chwe, H. Social Media Use Continues to Rise in Developing Countries But Plateaus across Developed Ones. Available online: https://www.pewresearch.org/global/2018/06/19/social-media-use-continues-to-rise-in-developing-countries-but-plateaus-across-developed-ones/ (accessed on 24 January 2023).
  35. Verma, J.P. Repeated Measures Design for Empirical Researchers; John Wiley & Sons: Hoboken, NJ, USA, 2016. [Google Scholar]
  36. Ugwuanyi, C.S. Developing Sound Knowledge of Basic Science Concepts in Children Using Flipped Classroom: A Case of Simple Repeated Measures. Educ. Inf. Technol. 2022, 27, 6353–6365. [Google Scholar] [CrossRef]
  37. Ekkel, E.D.; de Vries, S. Nearby Green Space and Human Health: Evaluating Accessibility Metrics. Landsc Urban Plan 2017, 157, 214–220. [Google Scholar] [CrossRef]
  38. Sugiyama, T.; Francis, J.; Middleton, N.J.; Owen, N.; Giles-Corti, B. Associations between Recreational Walking and Attractiveness, Size, and Proximity of Neighborhood Open Spaces. Am. J. Public Health 2010, 100, 1752–1757. [Google Scholar] [CrossRef]
  39. Park, I.K.; Chung, I.R.; Oh, D.; Jung, Y. Changes in the Number of Urban Park Users Due to the Spread of COVID-19: Time Series Big Data Analysis. J. Korean Reg. Dev. Assoc. Sci. Assoc. 2021, 37, 17–33. [Google Scholar]
  40. Sugiyama, T.; Cerin, E.; Owen, N.; Oyeyemi, A.L.; Conway, T.L.; Van Dyck, D.; Sallis, J.F. Perceived Neighbourhood Environmental Attributes Associated with Adults’ Recreational Walking: IPEN Adult Study in 12 Countries. Health Place 2014, 28, 22–30. [Google Scholar] [CrossRef] [PubMed]
  41. Wood, L.; Hooper, P.; Foster, S.; Bull, F. Public Green Spaces and Positive Mental Health–Investigating the Relationship between Access, Quantity and Types of Parks and Mental Wellbeing. Health Place 2017, 48, 63–71. [Google Scholar] [CrossRef] [PubMed]
  42. Beck, M.J.; Hensher, D.A. Insights into the Impact of COVID-19 on Household Travel and Activities in Australia–The Early Days of Easing Restrictions. Transp. Policy 2020, 99, 95–119. [Google Scholar] [CrossRef] [PubMed]
  43. Weill, J.A.; Stigler, M.; Deschenes, O.; Springborn, M.R. Social Distancing Responses to COVID-19 Emergency Declarations Strongly Differentiated by Income. Proc. Natl. Acad. Sci. USA 2020, 177, 19658–19660. [Google Scholar] [CrossRef]
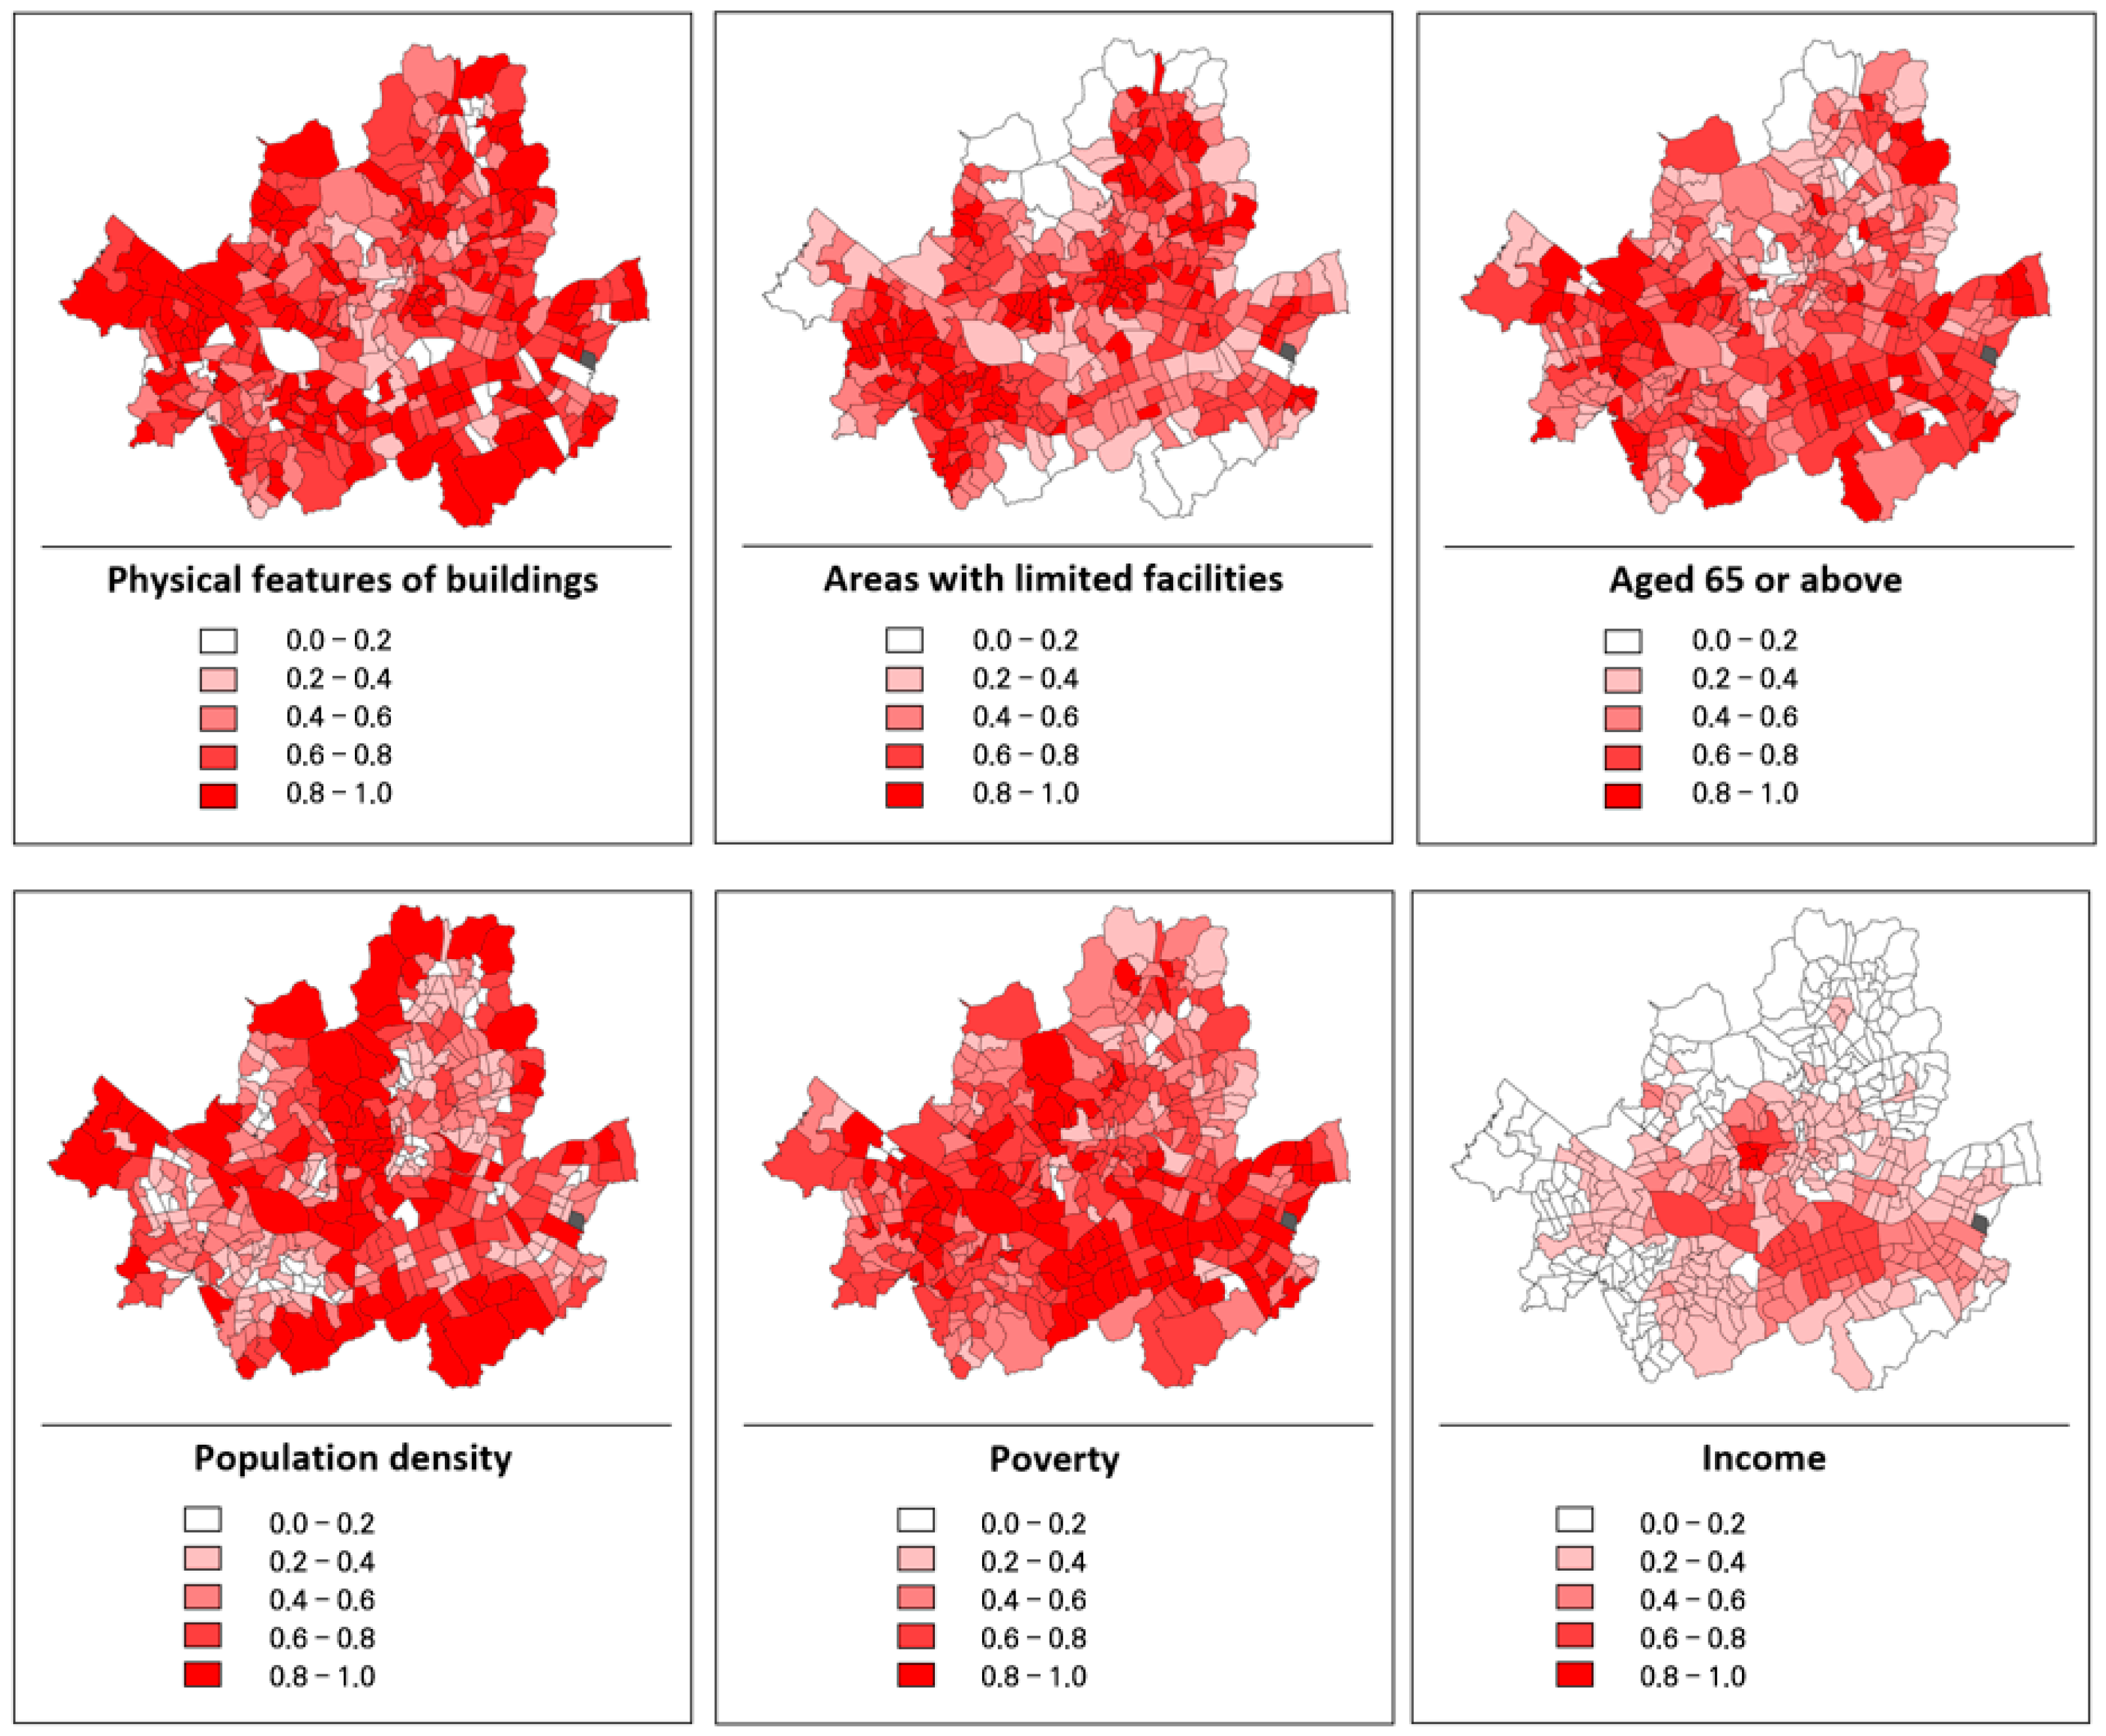
Figure 1. Maps of vulnerability for the 425 administrative districts representing the spatial distribution of each socioeconomic indicator variable. The district colored in black was excluded due to incomplete data.
Sustainability 16 01070 g001
Figure 2. Spatial distribution of hotspots and cold spots and indication of Seoul Forest and Dream Forest (Source of Dream Forest photo: https://parks.seoul.go.kr/template/sub/dreamforest.do, accessed on 28 December 2023. Source of Seoul Forest photo: https://parks.seoul.go.kr/template/sub/seoulforest.do, accessed on 28 December 2023).
Sustainability 16 01070 g002
Figure 3. Changes in the number of park visitors by 10-year age intervals (left), and by year (right) in Seoul Forest.
Sustainability 16 01070 g003
Figure 4. Changes in the number of park visitors by 10-year age intervals (left) and by year (right) in Dream Forest.
Sustainability 16 01070 g004
Figure 5. Interaction term graphs of park visitors in both parks (left) and for those aged ≥60 years (right).
Sustainability 16 01070 g005
Table 1. Socioeconomic vulnerability indicators used in this study.
IndicatorsData Calculated Source (Ref. Year)
HousingPhysical features of buildings
(% of housing constructed before 2000)
Seoul Open Data Plaza (2020)
Areas with limited facilities
(% of the area with no Social Overhead Capital (SOC) facilities (e.g., community centers))
Household compositionAged ≥ 65
(% of elderly population aged 65 or older)
Statistical Geographic Information Service (SGIS) (2020)
Population density
(Number of people per unit of area)
Seoul Open Data Plaza (2020)
Socioeconomic statusPoverty
(Basic livelihood security recipient %)
Income
(Officially assessed reference land price)
Disclaimer/Publisher’s Note: The statements, opinions and data contained in all publications are solely those of the individual author(s) and contributor(s) and not of MDPI and/or the editor(s). MDPI and/or the editor(s) disclaim responsibility for any injury to people or property resulting from any ideas, methods, instructions or products referred to in the content.

