Article

Future Projections of Heat Waves and Associated Mortality Risk in a Coastal Mediterranean City

Laboratory of Atmospheric Physics, School of Physics, Aristotle University of Thessaloniki, 54124 Thessaloniki, Greece
*
Authors to whom correspondence should be addressed.
Sustainability 2024, 16(3), 1072; https://doi.org/10.3390/su16031072
Submission received: 8 December 2023 / Revised: 15 January 2024 / Accepted: 19 January 2024 / Published: 26 January 2024
(This article belongs to the Section Air, Climate Change and Sustainability)

Abstract

:
Climate change has been linked to the escalating frequency, duration, and intensity of heat waves in the Mediterranean region, intensifying health concerns for the general populace. Urban environments face elevated health risks due to concentrated populations and the urban heat island effect, further amplifying nighttime heat conditions. This study aims to project changes in heat wave characteristics and the associated population exposure risk in a large Mediterranean city, Thessaloniki, Greece. High-resolution climate simulations, using the WRF model, were conducted for three 5-year periods (2006–2010, 2046–2050, 2096–2100) under the RCP8.5 emission scenario, covering Thessaloniki with a 2 km grid. By the end of the century, Thessaloniki is projected to experience over 60 annual heat wave days, compared to ~8 in the present climate, while some episodes were found to persist beyond 30 days. The relative risk during heat wave days is expected to rise, which is primarily due to nighttime heat stress. Interestingly, the results indicate that minimum apparent temperature might be a more reliable indicator in predicting heat-related mortality compared to maximum apparent temperature. These findings emphasize the growing importance of informed heat mitigation and adaptation strategies and healthcare preparedness in urban areas facing escalating heat-related health challenges.

1. Introduction

Climate change is widely considered as one of the greatest global threats and health hazards of the 21st century. The latest IPCC report notes that in the last decade (2011–2020), global surface temperature was approximately 1.09 °C higher than the reference period of 1850–1900. Meanwhile, future projections suggest a total warming of 1.4–4.4 °C, depending on the emission scenario [1]. Rising temperature rates are even more prominent in the Mediterranean region, which has been characterized as a climate change ‘hotspot’ because of the particular responsiveness and vulnerability of the region [2,3,4,5,6,7]. Mediterranean warming has exceeded global average rates since the 1980s, with present annual mean temperatures being 1.5 °C above the late 19th century levels, and with future annual and summer warming rates projected to be 20% and 50% larger than the annual global average, respectively [7,8]. Further increases in the summer temperatures of the region are of major concern, since future projections indicate a warming of up to 7 °C in daily maximum temperatures compared to the late 20th century, under high emission scenarios [9,10].
An especially alarming feature of climate change is the increase in the frequency of hot extremes [11]. Climate change may impact both the means and variances of temperature distributions, variously affecting the likelihood of extreme temperatures [12]. Specifically for the Mediterranean region, there have been numerous studies reporting increases in the frequency, duration and intensity of heat waves during the past few decades [7,13,14]. For example, [14] found that the heat wave intensity, length and number increased by a factor of 7.6, 7.5 and 6.2, respectively, in the period 1960–2006 in the eastern Mediterranean. In addition, the number of tropical nights ( T m i n > 20 °C) also presents a significant increase in various studies across the region [7]. Looking at the future, significant rises in hot extremes are expected across the Mediterranean, especially in the summer season, with regard to both daytime and nighttime temperatures [13,15]. Defining warm nights and cold days using T m i n 90th percentile and T m a x 10th percentile of the daily values of the calendar day, respectively, [16] showed that under a global warming of 4 °C, the region will experience predominantly warm nights and almost no cold days during the year. Model projections also indicate a lengthening in the season of hot extremes (by ~1 month until the middle of and by more than two months until the end of the century) as well as major increases in the frequency, duration and intensity of heat waves, with some studies demonstrating increases of the order of 20 times more heat wave days in southern Europe by the end of the century [13,15,17,18,19].
The growing concern over the impact of excessive heat on human health under climate change is further emphasized in urban areas because of two specific features of the urban environment. The first is related to the large concentration of the population in urban areas (~55% globally), which is projected to further increase in the future (~68% by mid-century) [20,21]. The second is related to the well-documented Urban Heat Island phenomenon, under which higher temperatures are observed in the urban environment compared to the suburban and rural surrounding areas, especially during the nighttime [22,23,24,25]. Meanwhile, station measurements suggest a slightly faster warming trend in urban centers compared to rural areas in the Mediterranean and the Middle-East–North Africa region [26]. These urban features raise major implications regarding the safety of the Mediterranean populations and necessitate comprehensive investigation of the relationship between climate change, heat exposure and the urban environment.
When modeling urban areas, using small horizontal grid cell sizes is crucial for the correct representation of their microclimatic features [27]. In the absence of small enough grid cells, features from urban areas are averaged together with the surrounding suburban and rural areas, leading to obscuration of the distinctive features of each category. High-resolution modeling allows for the proper distinction of the above-mentioned areas and even for the discrimination between different intra-urban levels of heat exposure (e.g., due to different elevations, proximity to sea or land use categories), ensuring more reliable and representative projections [28]. Nevertheless, increasing the modeling resolution significantly increases the computational resources and time necessary for the simulations, and it often requires compromises in other modeling parameters (e.g., larger time steps or less simulated time). As a consequence, studies evaluating the future evolution of hot extremes in urban environments commonly employ large model grid cells, restricting the analysis to a few (or even one) grid cells. For instance, studies by [29,30] focus on future heat waves in various cities of Europe and the Iberian Peninsula by analyzing the model grid cell nearest to each city. Similarly, [31,32] assess future heat wave conditions in multiple European cities by examining a few grid cells closest to the city centers.
The potential impacts of prolonged exposure to extreme heat stress during heat waves have become clearer in recent decades [33,34,35,36,37]. Standout illustrations consist of the 2003 European and the 2010 Russian heat waves that caused tens of thousands of excess deaths [38,39,40,41]. The USA Center for Disease Control and Prevention reports that heat waves were the highest cause of death related to weather conditions during the decade 2000–2009 [42], while in Australia, heat waves are responsible for more deaths than all the other natural hazards combined [43]. Apart from extreme heat events, increases in moderate ambient temperatures have been shown to also impact mortality rates substantially [44,45]. Multiple studies demonstrate the adverse effects of heat on mortality in several European and Mediterranean cities [46,47,48,49]. In a study by [47], it was demonstrated that while the maximum temperature threshold for increased mortality rates was higher in Mediterranean cities (29.4 °C) compared to north-continental cities (23.3 °C), the overall increase in all-natural mortality per 1 °C was greater in the Mediterranean cities (3.12% versus 1.84%). In addition, [49] found that for the 50+ age group, the percentage increase in daily mortality during heat wave days was by 22% higher in Rome and 8% higher in Stockholm compared to normal summer days. Both studies also highlight the importance of locally conducted research, since the varying city population, topographical and climatic characteristics can result in important differences in heat mortality estimates.
In the context of heat-related mortality studies, thermal exposure metrics that employ more meteorological variables than temperature alone are often utilized in order to better capture the heat stress on the human body, such as the apparent temperature [44,45]. For example, refs. [50,51] found that a 5.5 °C increase in mean apparent temperature corresponds to 2.3% and 1.8% increases in mortality, respectively, while [52] found that an increase of 1 °C in the same metric resulted in a 2.1% and a 1.5% increase for Lisbon and Oporto, respectively. It is also noteworthy that most of the studies regarding heat-related mortality typically employ daily maximum or mean values of the heat stress indicator. There are studies, however, which indicate that the lack of relief and rest through sleep, attributed to high nighttime temperatures, are additional important contributions to heat mortality [53,54,55]. Ref. [53] used the Hot Night Excess (HNE) index to quantify the intensity of thermal stress during nighttime. They indicate that under the SSP2–4.5 scenario, the increased nocturnal thermal stress could lead to ~1% higher attributable fraction of mortality compared to increases in mean daily temperatures. Such findings further exacerbate future health impact concerns for urban areas. Meanwhile, future projections indicate a greater heat mortality burden under climate change [31,56,57,58,59].
The objective of this work is to leverage high-resolution modeling (2 km) in order to comprehensively assess the future impacts of climate change in the frequency, duration and intensity of heat waves and the associated health impacts in large Mediterranean urban environments. This study’s focus is Thessaloniki, Greece, which is a large city that combines vulnerability traits stemming both from its Mediterranean location and urban characteristics. At the same time, its complex topography, coastal location and land use heterogeneity make it particularly suitable for demonstrating the benefits of high-resolution modeling. Regarding the recent trends of hot extremes in the city, [60] demonstrate that the annual number of heat wave episodes has increased by 72% during the period 1990–2020 and that the duration of the longest heat wave episode per summer has been increasing at a rate of 0.4 days/decade since the mid-20th century. Meanwhile, [61] found that 2.34% of all-cause deaths during 2006–2016 in the city were attributable to heat stress, while mortality was estimated to increase by 1.95% per 1 °C above neutral heat conditions.
Six heat wave indices typically examined in the heat wave-related literature were computed for the middle and the end of the century and were compared to the present climate. Furthermore, exposure–response relationships derived by [56,61] for the area of Thessaloniki were used to investigate potential increases in mortality risk during heat wave days. For both the definition of heat waves and the derivation of the exposure–response relationships, the apparent temperature was employed, since it is a heat metric that also accounts for the effect of humidity in heat-related discomfort. Lastly, the effects of exacerbated urban nighttime heat conditions on health were also investigated. This was achieved by defining heat waves and establishing exposure–response relationships not solely based on the daily maximum but also the daily minimum values of apparent temperature.
Put simply, this study aims to achieve the following objectives: (1) to reinforce the literature concerning the impact of climate change on heat waves in large Mediterranean urban environments through very high spatial resolution modeling, (2) to investigate the use of a more physiologically oriented heat metric in the analysis of heat waves and the associated health risks in a Mediterranean city, (3) to investigate the potential exacerbation of health impacts due to the aggravated nighttime heat conditions in a Mediterranean urban environment, (4) to facilitate a better understanding of the potential heat-related health impacts due to climate change for the city of Thessaloniki and thus bolster the background for more well-informed and targeted mitigation and adaptation strategies.

2. Materials and Methods
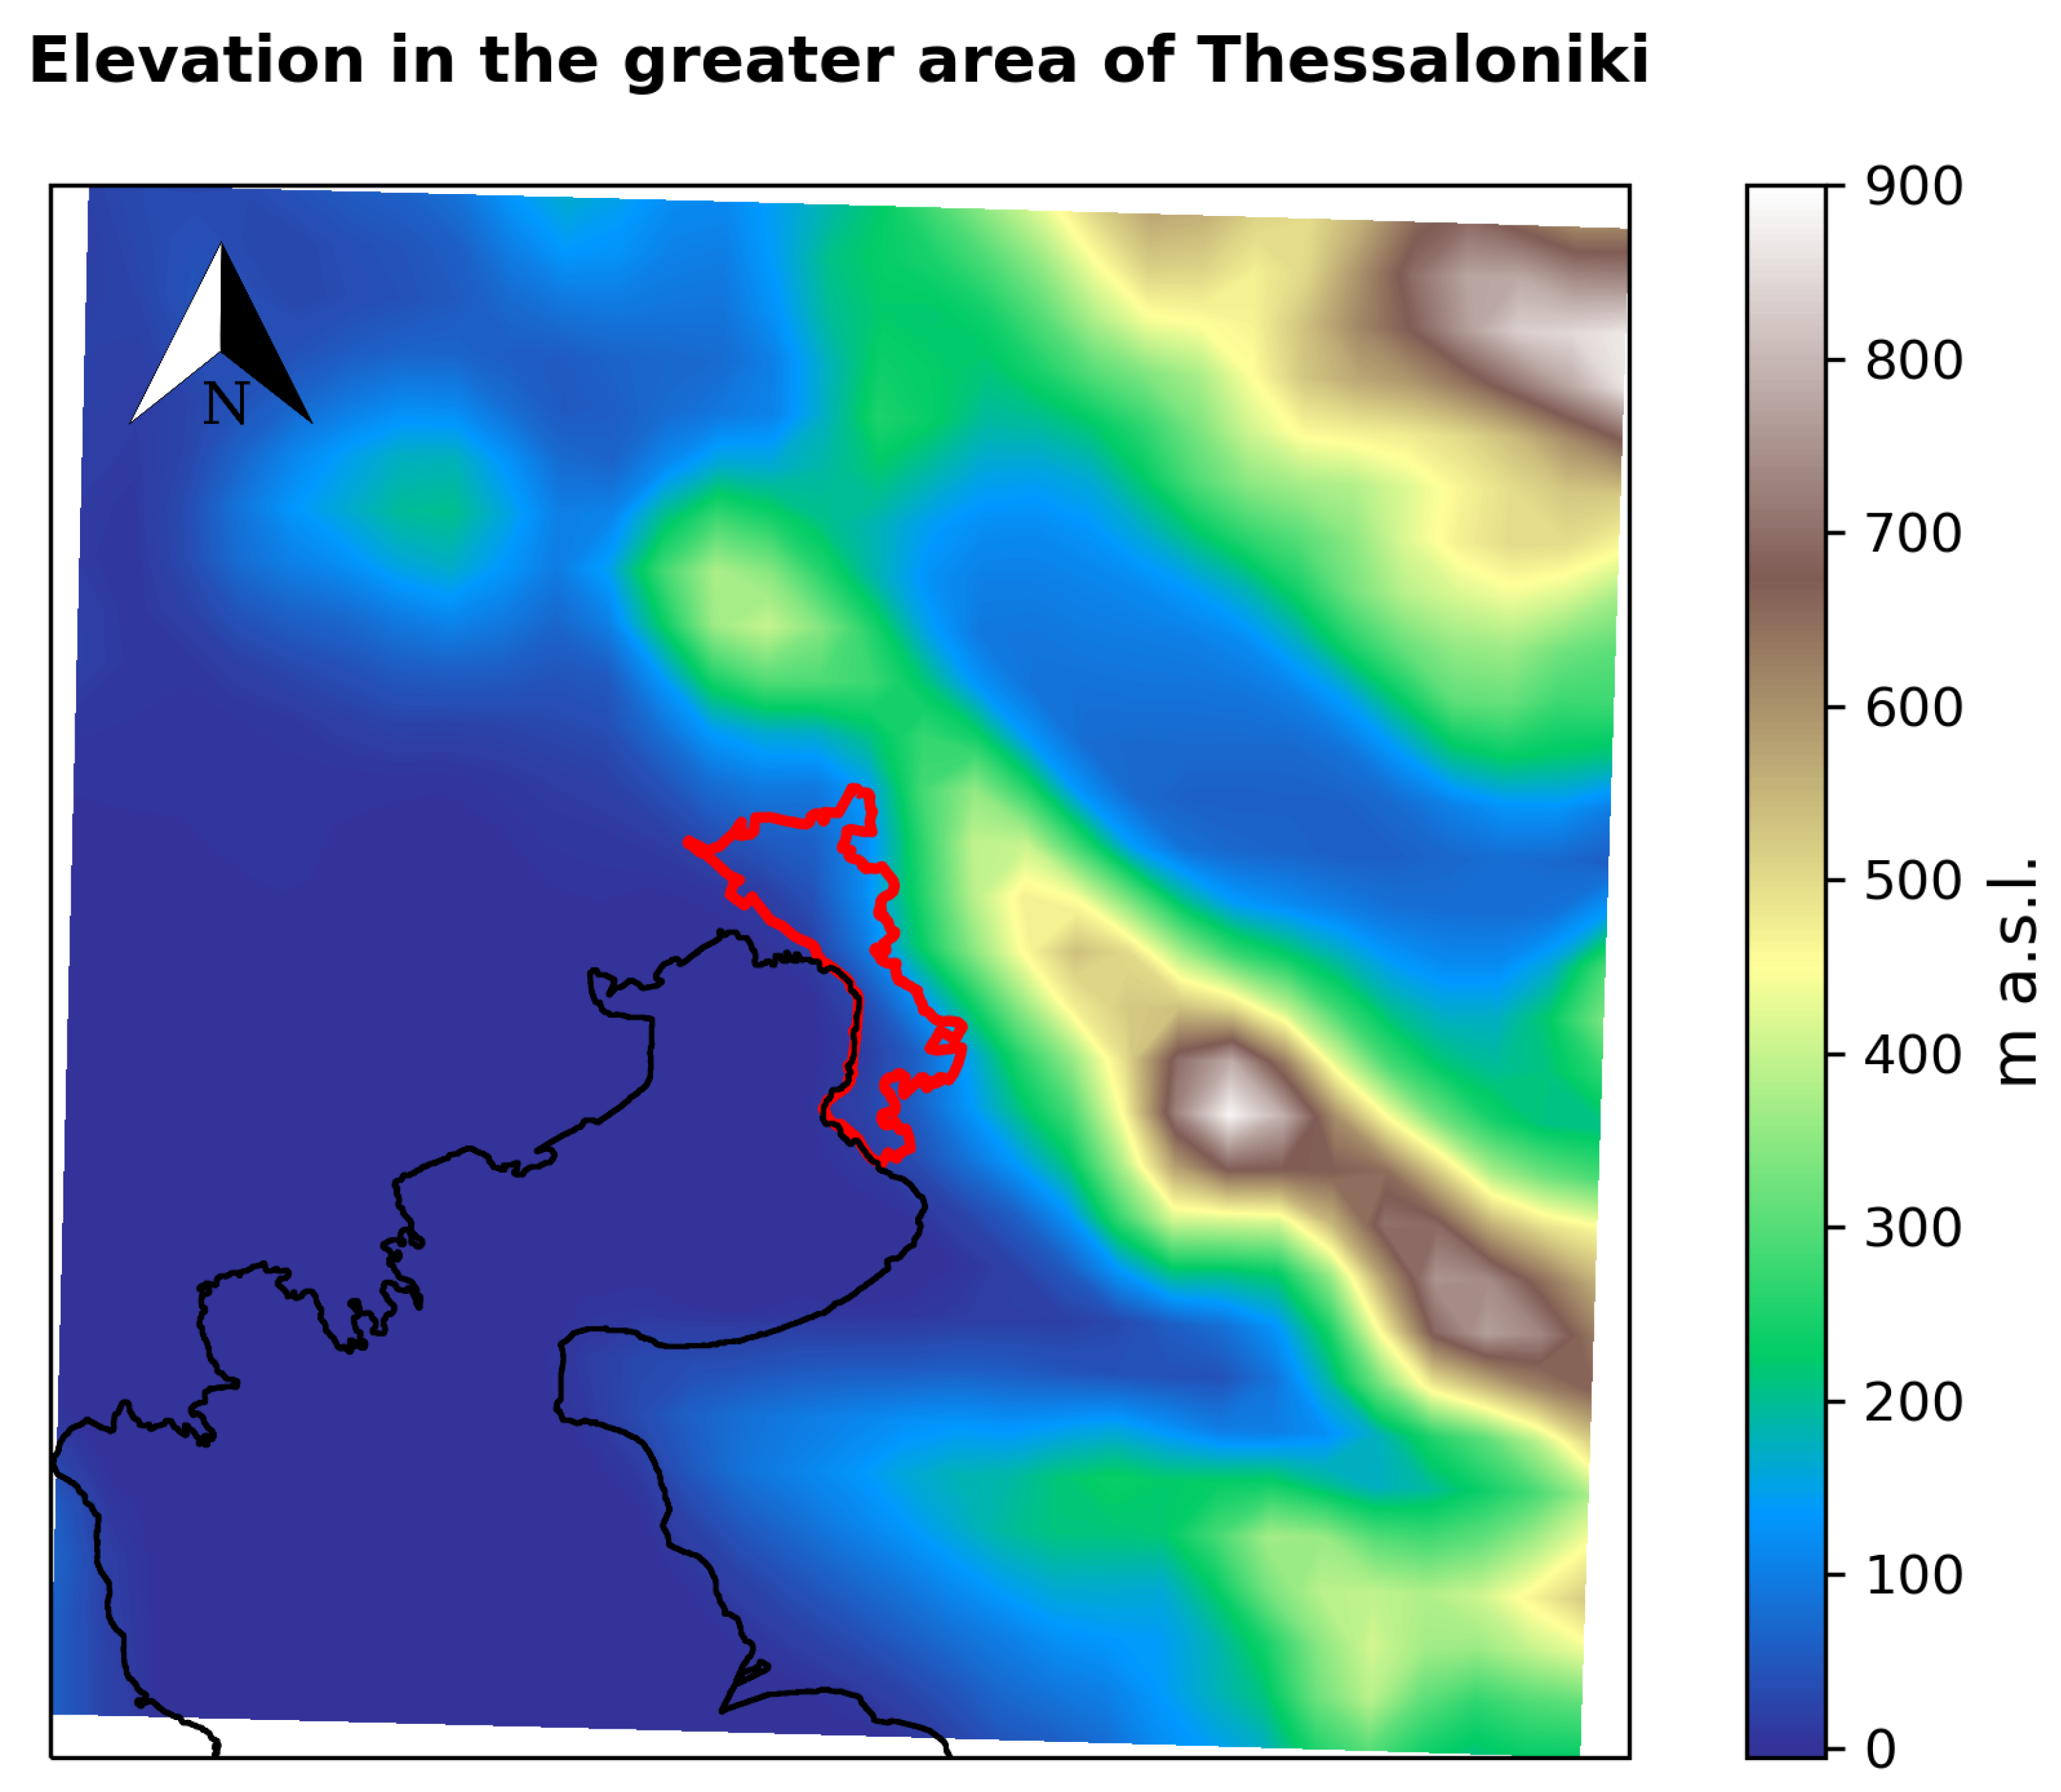
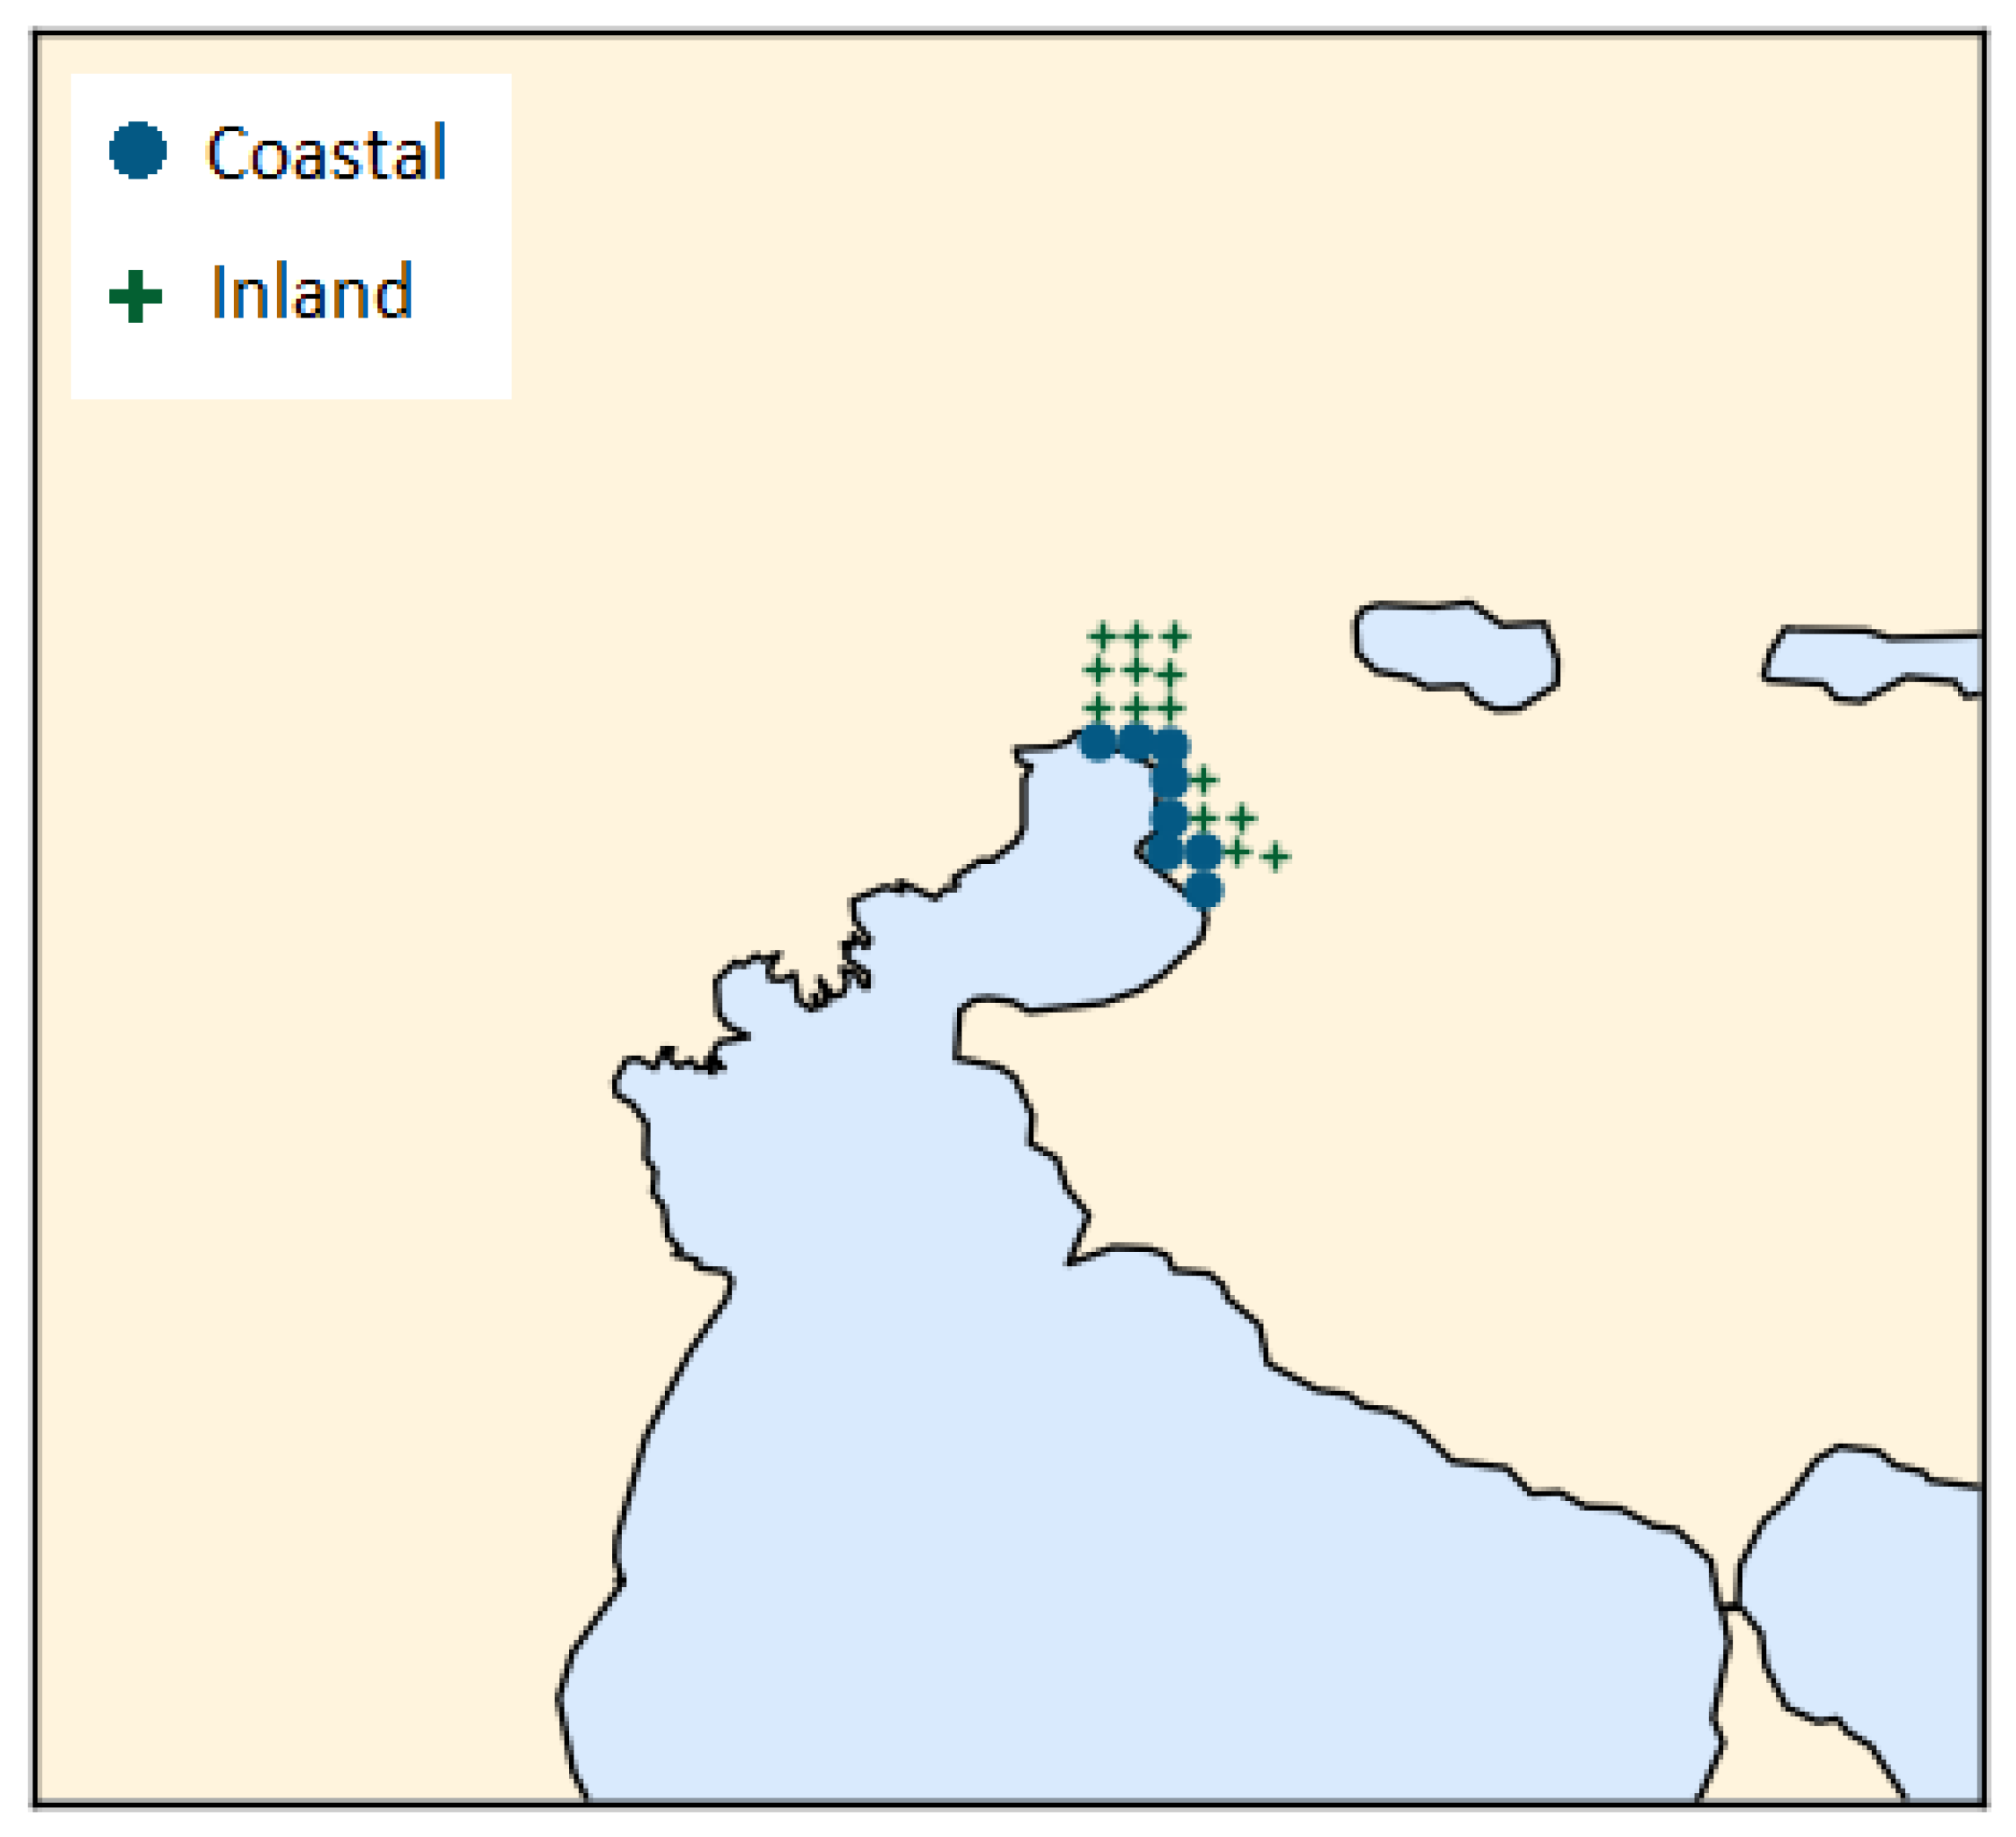
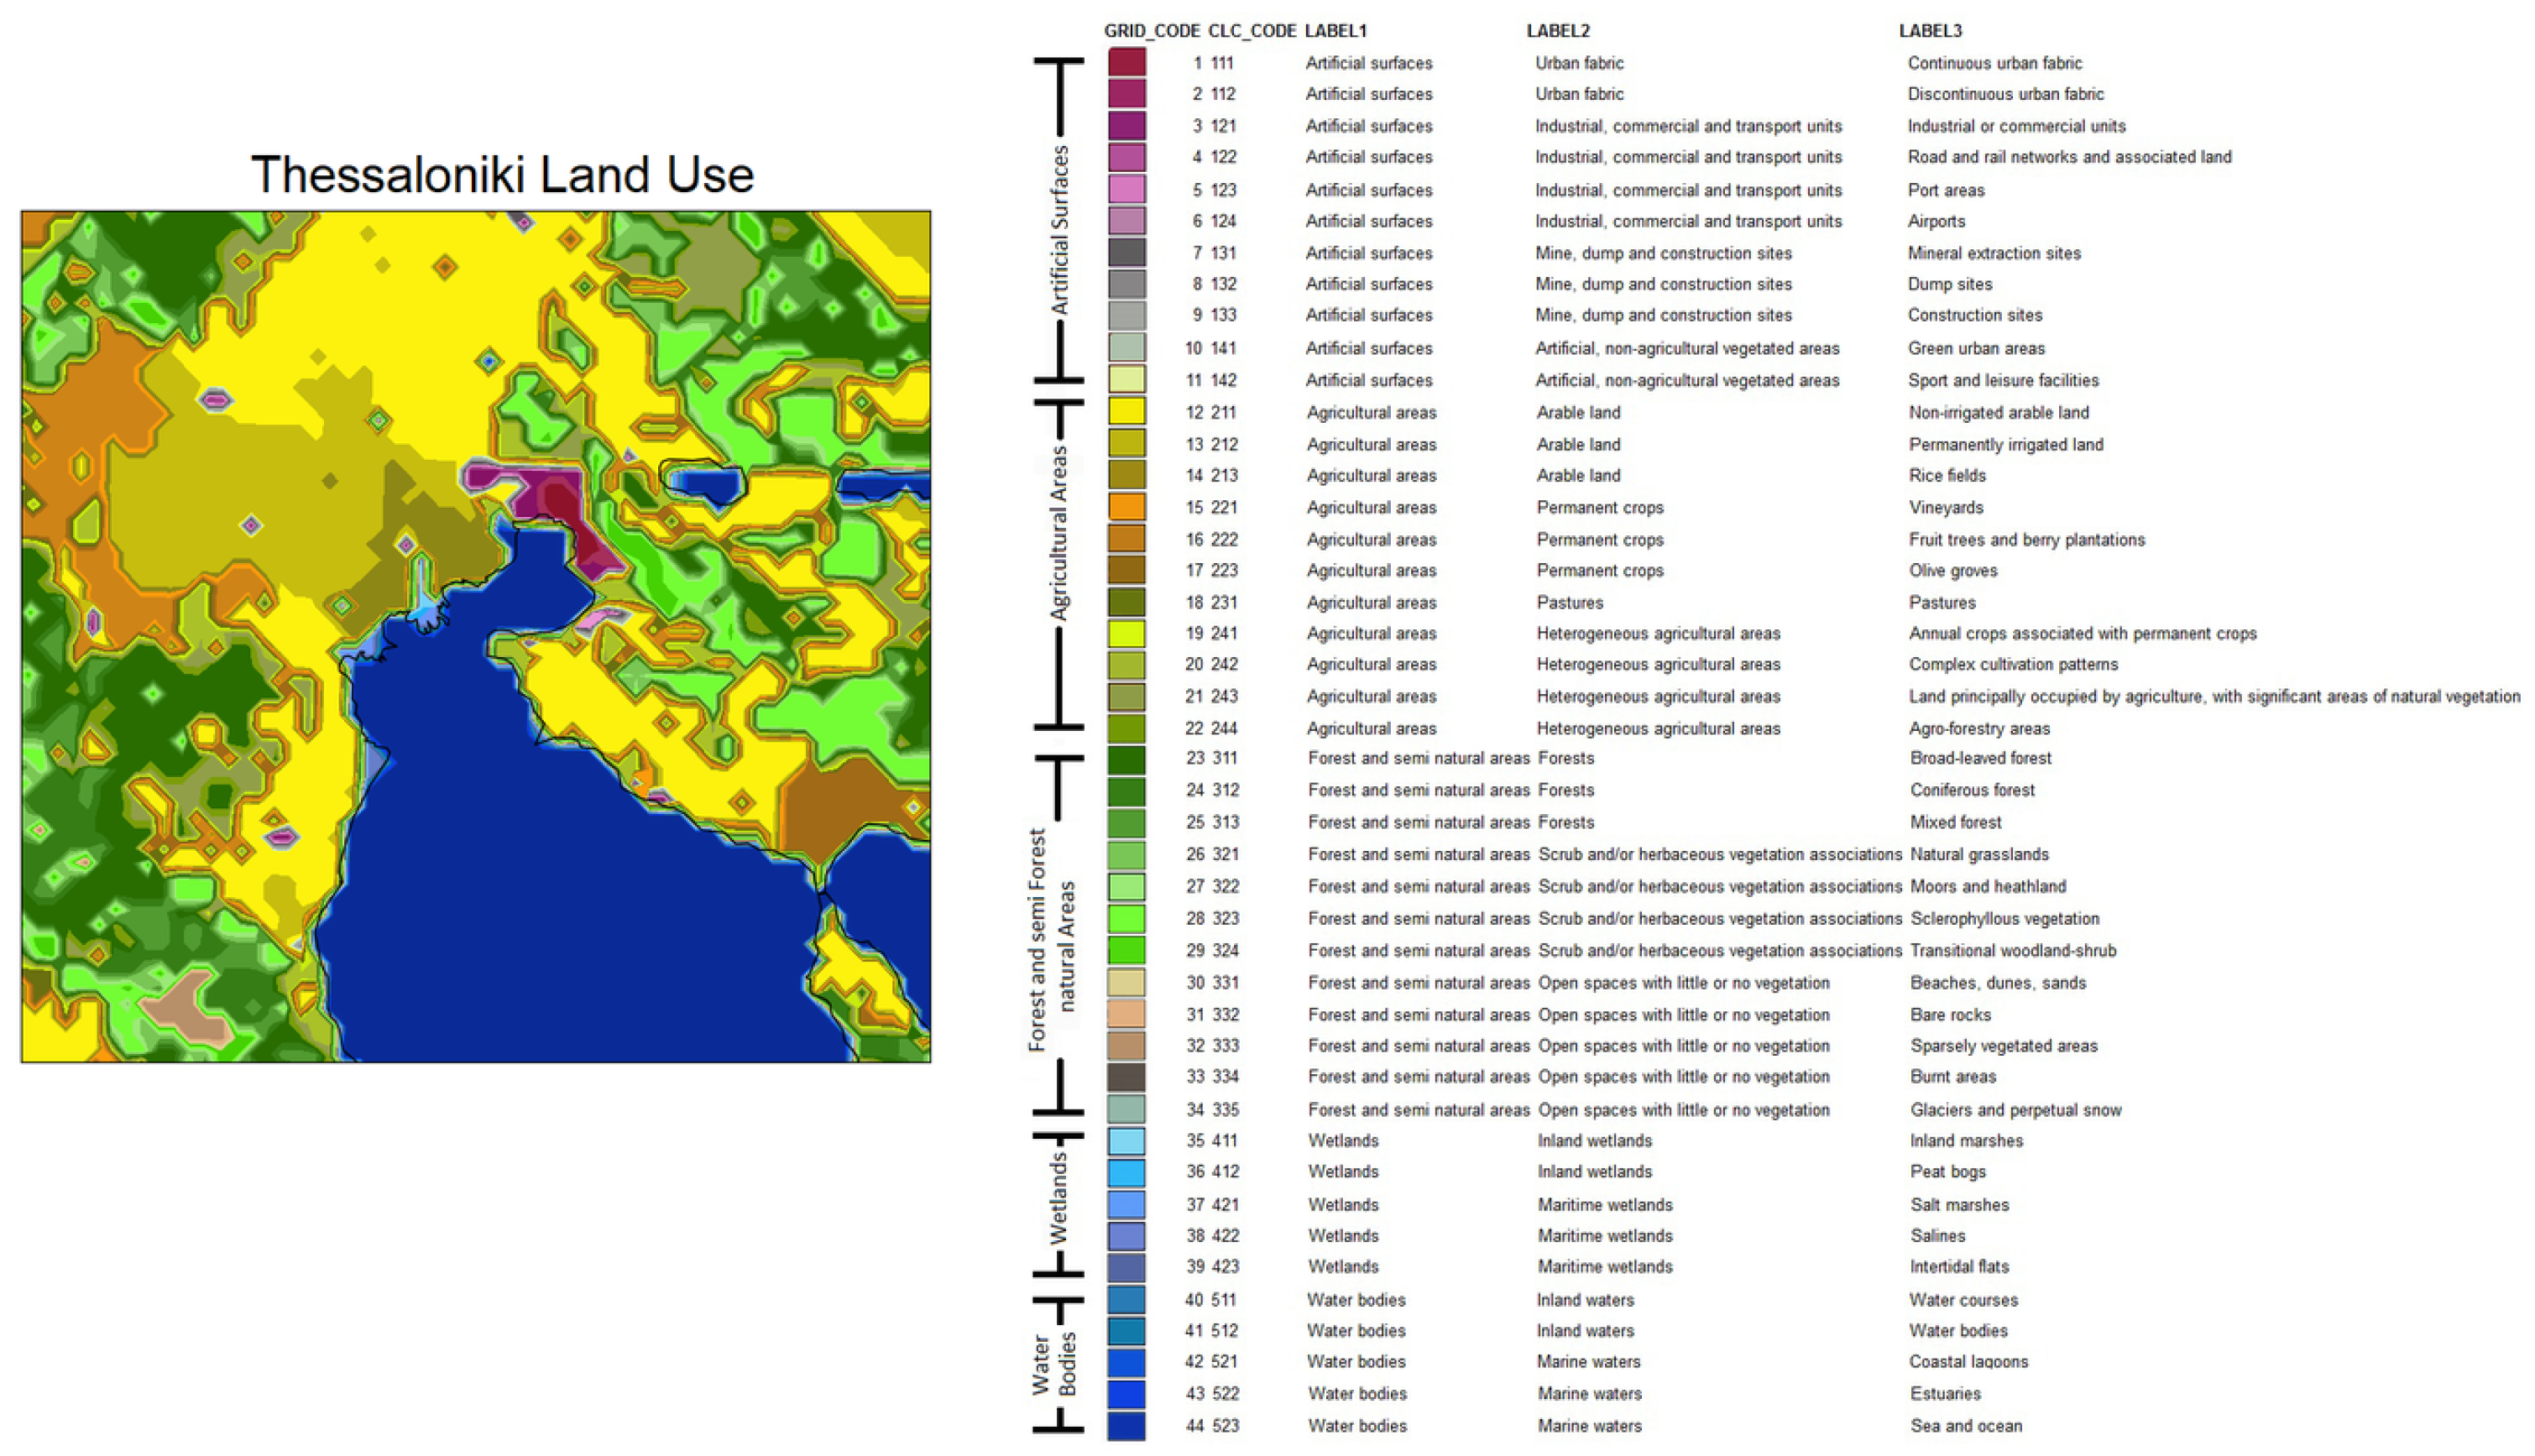
2.1. Study Area

Thessaloniki is the co-capital of Greece, and the second largest city in the country, with a population of ~1,100,000. It is located in northern Greece, bounded by Thermaikos gulf in its west and Hortiatis mountain (~1200 m) in the east [62]. The city’s climate is typically characterized as Mediterranean, with hot and dry conditions during the summer and mild and wet conditions during the winter [24,62]. The mean annual temperature is ~15.9 °C and the mean annual relative humidity is ~66.55%, while the corresponding hot season (May–September) means are ~23.96 °C and ~57.6% respectively (Hellenic National Meteorological Service, http://www.emy.gr, accessed on 18 June 2023). The maximum UHI intensity ranges from 2 to 4 °C (1 to 3 °C) during the warm (cold) half of the year, and it is typically observed after sunset [62].
The unique geographical features of the city, with a sea and a mountain on opposite sides, create significant variations in topography and microclimate, variously affecting the population of the sub-regions of the city (Figure 1). Moving away from the sea, there are noticeable changes in elevation, resulting in diverse landscapes. Additionally, the coastal regions experience high humidity and frequent sea breeze conditions due to their proximity to the sea [24]. In this study, in order to account for potential discrepancies between the coastal and inland areas of Thessaloniki, two different time series were constructed by averaging the output of selected urban inland and urban coastal grid cells, as shown in Figure 2. The analysis described in Section 3 was applied separately for the inland and coastal time series as well as for the greater area of Thessaloniki.

2.2. Model Setup and Input Data

In this study, climate simulations were performed using the regional WRF-ARW numerical weather prediction model. The simulations were conducted as part of the LIFE–ASTI project (https://app.lifeasti.eu/, accessed on 6 July 2021), which aims to forecast urban heat island effects. The simulations used in the current work consisted of three nested domains covering Europe, central–east Mediterranean, Thessaloniki. The horizontal grid resolutions for the domains were set at 50 km (d01), 10 km (d02), and 2 km (d03), respectively. The physics schemes used in these simulations were based on previous setups specifically designed to analyze the urban heat island effect in Greece [63]. To improve the simulation of physical processes in urban areas, the single-layer urban canopy model (SLUCM) was employed. This model effectively captures the complexity of the urban environment and the various physical interactions within it, such as energy exchange between urban surfaces and the atmosphere, street canyons, urban geometry, and the influence of buildings on radiation and surface temperature [64,65]. The SLUCM considers three different types of urban land use: high-density residential, low-density residential, and industrial–commercial areas. By incorporating these elements, the model provides a comprehensive representation of the urban environment and its associated processes. A comprehensive description of the model set up and its evaluation can be found in [24].
For the land use input, the Global Land Cover by National Mapping Organizations version 1 (GLCNMO v1) dataset was utilized for domains d01 and d02 with a resolution of 30 arcseconds. For the 03 domain, the Corine Land Cover (CLC) dataset version 2012 was used, offering a spatial resolution of 250 m (Figure 3). The CLC dataset classifies land use into five main categories: artificial areas, agricultural areas, forests, wetlands, and water bodies. It further subdivides these categories into 44 different subclasses, providing a more refined representation of land use patterns [66].
Finally, the WRF model simulations were executed for three distinct time periods: the reference period of 2006–2010, representing the present climate conditions, and the periods 2046–2050 and 2096–2100, providing insights into the climate projections for the mid- and late-21st century. For these periods, boundary conditions were obtained from the National Centre for Atmospheric Research (NCAR) and the Community Earth System Model (CESM), as part of the Coupled Model Intercomparison Experiment phase 5 (CMIP5), which has demonstrated robust performance both at the global level [67,68] and specifically in the Mediterranean region [69,70]. The data used have a spatial resolution of 1° and a time step of 6 h. The simulations were based on the Representative Concentration Pathway 8.5 (RCP8.5), which is a high-end emissions scenario under which radiative forcing levels reach 8.5 W/m2 by the end of the century, leading to a projected increase in global mean surface temperature by 4.5 °C relative to pre-industrial levels [71].

2.3. Heat Wave Definition and Indices

Even though heat waves are generally described as prolonged periods of excessively higher than normal temperatures, it has been impossible to derive an all-encompassing and strict mathematical definition of a heat wave. The reason is that many different perspectives to which a heat wave study would be of interest (e.g., climatological, health, wildfires, energy consumption, agriculture) would require different choices of appropriate heat metrics, heat metric thresholds and duration [72,73]. This issue is further complicated, since different regions have a large climatological, demographic, socioeconomic and population sensitivity heterogeneity. Thus, sector- and local-based definitions are often used. In the context of this study, a definition was customized by considering several factors. With regard to the most appropriate heat metric, apparent temperature (hereon T a p p ) was chosen, since:
  • It is a physiologically oriented metric that also includes humidity, accounting for the negative effect of high humidity in the thermoregulatory mechanisms of the body by evaporative cooling inhibition [74].
  • It is a metric often employed in heat-related mortality studies [56,61,75,76,77] and is found to be a robust indicator for predicting heat-related mortality and issuing health alerts [78,79].
  • It is extensively used as a thermal discomfort metric in studies concerning many Mediterranean cities [46,47,80,81,82,83]. Moreover, [61] found that maximum daily apparent temperature was a better predictor of heat-related mortality for the area of Thessaloniki compared to mean daily temperature.
T a p p was computed from the model projected temperature and dew-point data as follows:
T a p p = 2.653 + 0.994 · T a + 0.0153 · T d 2
where T a is the air temperature (°C) and T d is the dew point temperature (°C).
In accordance with multiple previous studies, the daily maximum value of the heat metric ( T a p p m a x ) was employed as an optimal indicator of daily heat stress exposure [18,56,61,73,79,84,85]. Furthermore, through consideration of studies that demonstrate the effect of high nighttime temperatures on mortality [53,54,55,86] and the urban heat island phenomenon, which mostly affects urban heat conditions during the nighttime, it was deemed suitable that minimum daily apparent temperature ( T a p p m i n ) was also included in the definition. Out of the heat wave metric thresholds (relative or absolute) typically employed in the literature, the 90th percentiles of the daily values of hot season (May–September) T a p p m a x and T a p p m i n were deemed optimal (as this study focuses mainly on the urban future heat wave conditions, the thresholds were derived using the urban model grid cells depicted in Figure 2), as they allow for sufficient heat wave day sample sizes in the reference period [72]. Percentile-based definitions also allow for an easier intercomparison of studies across various locations and climates [11], while at the same time, they circumvent the potential limitation associated with poorly simulated absolute thresholds. Finally, the duration threshold was set to 2 days, which is a threshold frequently employed in heat wave mortality studies [87,88]. As such, a heat wave episode was detected when T a p p m a x > T a p p m a x 90th and T a p p m i n > T a p p m i n 90th simultaneously for at least 2 consecutive days.
Heat waves are typically studied through their aspects, such as their frequency, duration, and intensity. There is a vast number of indices that have been used to study heat waves in previous studies and so far, it has not been clear which of them are the most appropriate. To quantify heat wave aspects, namely frequency, duration, and intensity, six indices were employed based on those most commonly explored in the literature [18,72,89]. The indices are listed and described in Table 1. It must be mentioned that the HWF index only considers days that participate in heat wave episodes and not standalone days that individually meet the heat wave thresholds. In addition, for each 5-year period, the frequency-related indices (HWF, HWN) were calculated and then divided by 5 to obtain annual values. The duration (HWD, HWDm) and intensity (HWI, HWA) indices represent averages and maximum values across the entire 5-year periods.

2.4. Health Impact Projection Framework

The health impact projection framework employed in this study is based on [56,61], who used distributed lag non-linear models to investigate the exposure–lag–response relationship between daily T a p p m a x and daily non-accidental mortality in Thessaloniki for the period 2006–2016. The daily mortality data were provided by the Hellenic Statistical Authority (ELSTAT), while the apparent temperature was derived from hourly temperature and dew point measurements from the Makedonia Airport weather station (longitude 22.97, latitude 40.53, elevation 2 m), which is operated by the Hellenic National Meteorological Service. In their work, they investigated both the effects of cold and heat exposure on mortality and found the typical J-shaped curve (Figure 4a) often resulting in multiple-related studies across many geographical areas and populations [80,90]. They also found that using daily T a p p m a x as a heat exposure metric provided a better model fit for the area of Thessaloniki in comparison to daily mean temperature, further reinforcing the choice of T a p p as a better-suited metric for a health-impact based heat wave definition. Furthermore, they accounted for different causes of death (cardiovascular, cerebrovascular and respiratory), as well as for all-cause mortality, while also separately examining the health impacts on the elderly (>65 years old).
In the preliminary framework used in this study, only the exposure–response relationship for all-cause mortality and across all age groups was adopted. In addition, while scoping to investigate the effect of high nighttime heat exposure on mortality, the same methodology was used and expanded by also separately deriving an exposure–response relationship based on T a p p m i n (Figure 4b) for the reasons mentioned in the previous sections. The application of the E-R functions to the modeled reference and future periods was made by 10th degree polynomial fits of the E-R functions and their 95% empirical CI upper and lower bounds. The polynomials were then applied to all heat wave days in each period and daily relative risk (RR) scores based on T a p p m a x (hereon RR( T a p p m a x )) and T a p p m i n (hereon RR( T a p p m i n )) were derived for each heat wave day along with their respective 95% CI values. The RR values of the heat wave days were then averaged separately for each study period, resulting in the average RR( T a p p m a x ) and RR( T a p p m i n ) conditions during heat waves for each corresponding period.
It is important to note that this methodological framework cannot account for any potential risk amplification effects due to consecutive days of heat exposure during heat wave episodes. However, the existence of such an amplification effect remains a subject of unresolved dispute in the literature, and the exposure to heat conditions of each corresponding day is typically found to be the main contributor to daily heat mortality [76,88,91].

3. Results and Discussion
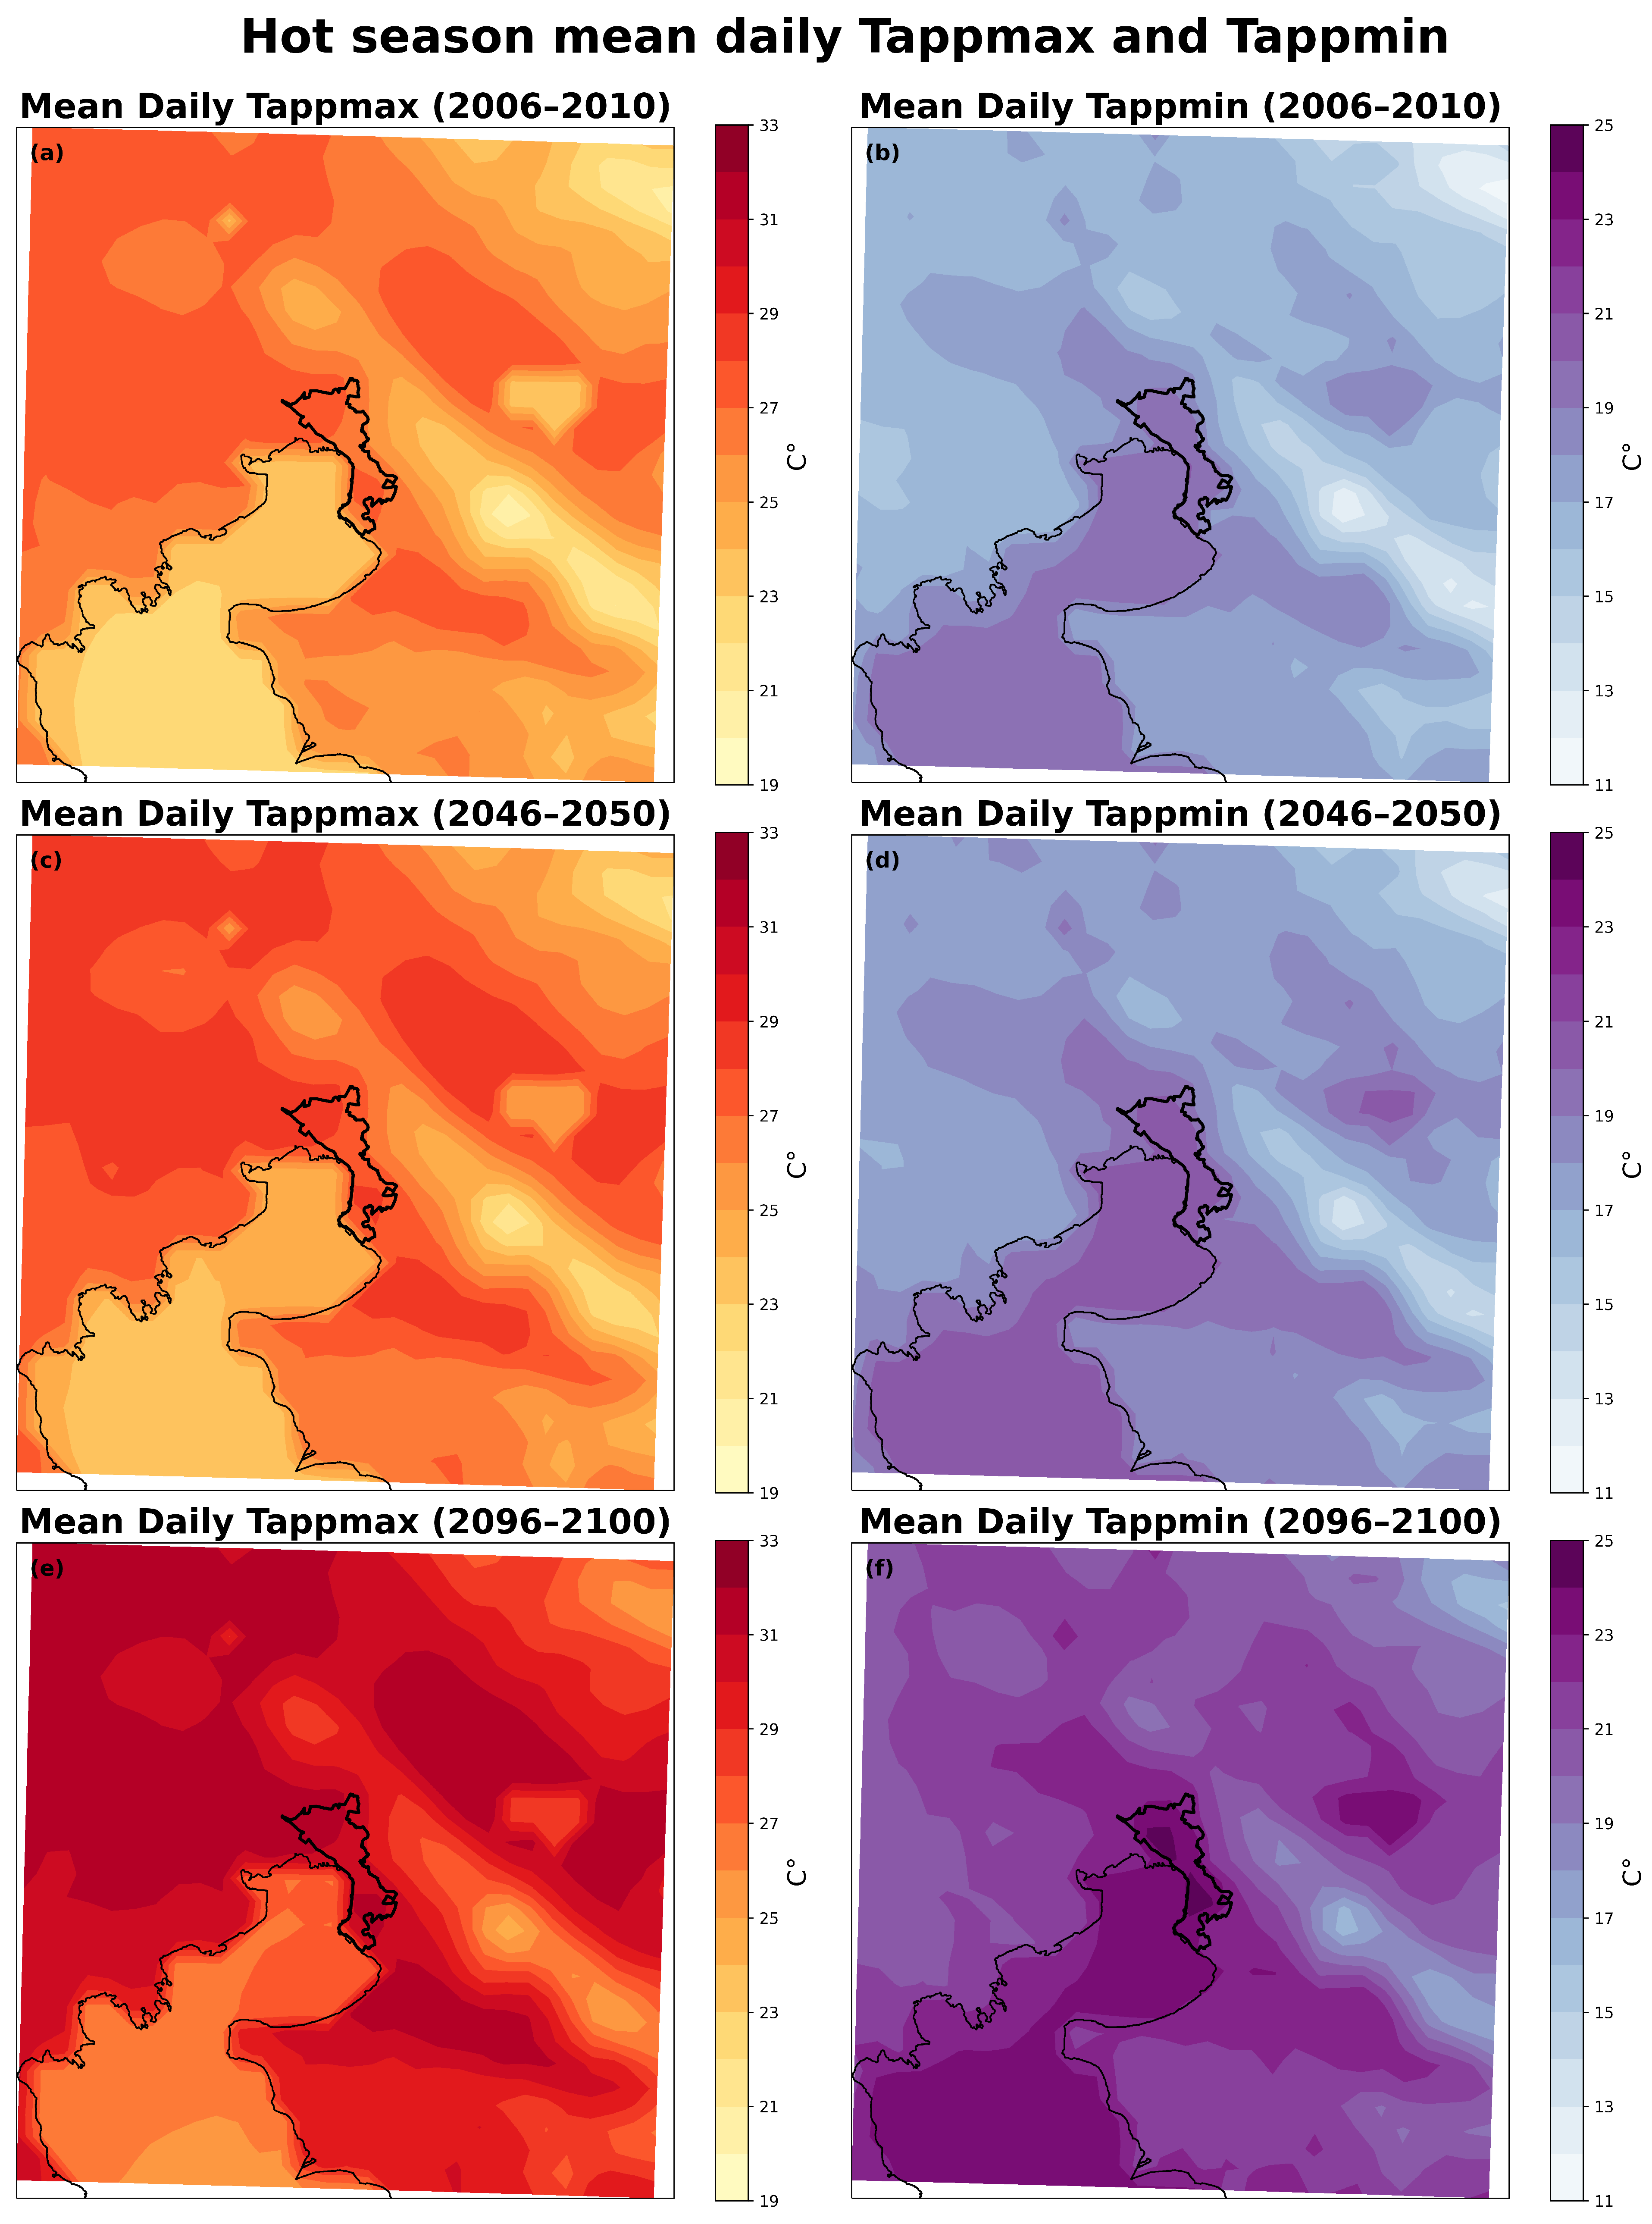
In this section, we discuss the results of our study in three subsections. The first subsection aims to provide the context of the present and future hot season (May–September) heat conditions, under which heat wave aspects and health impacts are explored. The second examines the future evolution of heat wave indices that describe their aspects (frequency, duration and intensity). Finally, the third subsection provides an estimate of the potential future increase in heat related mortality risk during heat wave days.

3.1. Hot Season T a p p m a x and T a p p m i n Projections

Looking at T a p p m a x and T a p p m i n for the periods 2006–2010, 2046–2050 and 2096–2100, significant increases are presented both inside the city (Figure 5, Table 2) and in the greater surrounding area (Figure 6). Within the confines of the city, under the present climate, the hot season mean daily T a p p m a x for the inland (coastal) areas of Thessaloniki is calculated at 26.5 °C (26.8 °C), while the respective STD is 4.0 °C (3.9 °C). The difference between inland and coastal areas is more apparent during hot season nighttime conditions, with the coastal mean T a p p m i n (19.2 °C) exceeding the inland mean T a p p m i n (18.5 °C) by 0.7 °C. By 2050, the hot season mean daily T a p p m a x will increase by between 0.9 and 1 °C in both inland and coastal areas of Thessaloniki compared to the reference period with respective T a p p m a x STD increases between 0.2 and 0.3 °C. Mean daily T a p p m i n increases of the order of ~1 °C are also expected by mid-century, with corresponding increases in STD of 0.4 °C. By the end of the century, mean daily T a p p m a x will further increase by ~3 °C, for a total increase of ~15% compared to the reference period, while the corresponding increase in T a p p m i n will be ~3.2 °C for a total increase of ~22%. STDs will also increase from mid to the end of the century but by a smaller amount compared to the reference to mid-century increases. The total increase in daily T a p p m a x STD will be ~7.5% in both inland and coastal areas, while the corresponding daily T a p p m i n STD increase is ~11%.
Interestingly, even though the largest changes in the mean daily values of T a p p m a x and T a p p m i n are projected to occur between the middle and end of the century, the largest changes in T a p p m a x and T a p p m i n STD are found to occur until the middle of the century (Figure 5). As such, due to the impact of increased STDs on the probability of extremes [12], significant increases in the frequency of extremes are expected already by the middle of the 21st century. The results also indicate that the amplification in nighttime heat conditions (daily T a p p m i n ) is proportionally greater than the ones during the daytime (daily T a p p m a x ) in the urban area of Thessaloniki in both inland and coastal regions.
It should be noted that during all study periods, coastal areas present slightly larger mean T a p p m a x values by 0.1–0.2 °C compared to inland areas, while the difference is more pronounced during nighttime, with coastal T a p p m i n values larger by 0.6–0.7 °C in each study period. When examining temperature alone, coastal areas are typically expected to present lower daytime temperatures compared to inland areas [92,93,94]. This is due to the significantly larger heat capacity of the sea compared to that of the land and the resulting sea breeze that is generated through the temperature difference between the sea and the coastal land. However, considering the apparent temperature, it appears that the relatively cooler temperatures induced by the sea breeze conditions are not enough to counter the added discomfort due to the larger relative humidity values that are present in the coastal areas during the daytime. Discomfort conditions are further exacerbated during the nighttime, when sea breeze conditions dump down and switch to land breeze conditions.
The spatial variability of the hot season mean T a p p m a x and T a p p m i n in the greater area of Thessaloniki, for each study period, can be captured quite adequately with a 2 km grid cell size, as depicted in Figure 6. The northwestern (industrial zone) and southeastern (dense, continuous urban fabric) areas of the city present the highest hot season T a p p m a x values (26–28 °C in the reference period). However, similarly high T a p p m a x values are presented in the low-elevation continental agricultural lands to the northwest and southeast of the city, as well as the continental agricultural lands to the northeast, behind Hortiatis mountain. The future increases in T a p p m a x are uniformly distributed in the greater area (by ~1 °C by the middle and by ~4 °C by the end of the century), and, as a result, the spatial pattern of the mean hot season T a p p m a x remains almost the same throughout the century (Figure 6a,c,e). The manifestation of the urban heat island effect becomes apparent when examining the spatial distribution of T a p p m i n (Figure 6b,d,f). In all three study periods, the highest hot season mean T a p p m i n values are always located inside the confines of the urban area of Thessaloniki (20–21 °C in the reference period) and exhibit descending trends with increasing distance from the city. The extension of the city’s industrial zone (to the northwest) and the agricultural lands to the southeast also retain relatively high T a p p m i n values (19–20 °C in the reference period). In contrast to T a p p m a x , the future increases in T a p p m i n (also by ~1 °C by the middle and by ~4 °C by the end of the century) are not uniformly distributed in the greater area. High T a p p m i n areas expand to the northwest, northeast and southeast agricultural lands, covering most of the simulation domain by 2100.

3.2. Heat Wave Indices

As mentioned in Section 2.3, the indices employed in the present study describe three broadly studied aspects of heat waves: (i) frequency, (ii) duration and (iii) intensity. The subsequent paragraphs provide a comprehensive discussion of these findings with regard to the time series representing the urban inland and coastal areas of Thessaloniki. However, the spatial distribution of heat waves is discussed only with respect to the frequency indices (HWF, HWN). This is due to the fact that the duration and intensity indices are derived as averages or maximum values out of the heat wave days or episodes samples. As the definition of heat waves was based on percentiles of T a p p m a x and T a p p m i n of the relatively hotter urban region (especially with regard to T a p p m i n ), the majority of the model domain presents inadequate heat wave days and episodes sample sizes in the reference period, as presented in Section 3.2.1. Thus, the indices derived from these small sample sizes are not robust, are sensitive to outliers and could be misleading when being compared to future periods or presented in maps alongside the areas with adequate sample sizes.

3.2.1. Frequency

(a)
Heat Wave Frequency (HWF)
During the reference period and under the heat wave definition employed in this study, the inland and coastal areas of Thessaloniki experience on average 7.6 and 7.8 (Table 3) heat wave days/year, respectively. However, as a combined result of the mean and STD increases in hot season T a p p m a x and T a p p m i n , the picture drastically changes already by the middle of the century. By 2050, the mean number of heat wave days per year will more than double (~16 days/year) in the inland areas, while the increase will be slightly more prominent in the coastal areas, which will experience almost 20 heat wave days/year. By the end of the century, the combined impact of increased means and STDs in T a p p m a x and T a p p m i n is predicted to cause more than 60 heat wave days per year across both inland and coastal Thessaloniki. This represents an approximately 8-fold increase in the yearly number of heat wave days compared to the present climate. It is also noteworthy that the HWF index solely takes into account days involved in the defined heat wave episodes, as outlined in Section 2.3. This approach disregards individual days that independently meet the heat wave temperature criteria. Consequently, these findings suggest that by century’s end, most of summer days and nights will adhere to the heat wave standards.
The spatial distribution of the HWF index throughout the greater area of Thessaloniki is depicted in Figure 7a,c,d, for all study periods. During the reference period, high annual numbers of heat wave days are located only inside the confines of the urban area of Thessaloniki (5–12.5 heat wave days/year). Most of the domain area presents values between 0 and 2 heat wave days/year, while a few agricultural areas to the southeast and northeast, as well as the northwestern extension of the industrial area of the city present values between 5 and 7.5 heat wave days/year. By the middle of the century, all non-mountainous areas of the domain present non-zero values of HWF, while a few areas in Thessaloniki present up to 27 heat wave days/year. Interestingly, the area of high HWF values spreads both to the northwest and the southeast of the city, where HWF values comparable to those of the urban area are presented. While this spatial pattern remains similar by the end of the century, the absolute values of the HWF index rise dramatically thoughout the domain with almost all non-mountainous areas presenting more than 30 heat wave days/year and some areas of the city reaching almost up to 70 heat wave days/year.
(b)
Heat Wave Number (HWN)
In the current climate, the mean annual count of heat wave episodes is found equal to 1.8 episodes per year inland and 2 episodes per year along the coastal regions of Thessaloniki (Table 3). By the middle of the century, heat wave occurrences will increase by over two-fold in inland regions (3.8 episodes/year) and nearly triple in coastal areas (6.2 episodes/year). This discrepancy between inland and coastal regions is related to the corresponding differences in the mean heat wave durations in the same period, as presented in the next section (Section 3.2.2). By the year 2100, both inland and coastal regions can expect an approximately 4.5 to 5-fold rise in the frequency of heat wave episodes. The greater escalation of HWF compared to HWN toward the end of the century can also be attributed to the concurrent extension of heat wave durations, as presented in Section 3.2.2.
The spatial pattern of the HWN index fairly resembles that of the HWF index (Figure 7b,d,f). In the reference period, most of the domain presents between 0 and 1 episodes/year, while the highest values are found in the urban area and its northwestern and southeastern extensions as well as a few agricultural lands to the northeast (1–3 episodes/year). As with HWF, by the middle of the century, all non-mountainous areas of the domain present non-zero HWN values. However, the spatial pattern of high HWN values remains fairly similar. Interestingly, a few areas in the northwestern and southeastern parts of Thessaloniki present more than 7 episodes/year already by 2050. By the end of the century, the spatial pattern changes. The majority of the domain areas present HWN values > 7 episodes/year, while the urban area presents between 7 and 10 episodes/year. In addition, this pattern is different than that of the HWF index, which is in contrast to the previous study periods where the spatial patterns of HWF and HWN were fairly similar.
It is also worthwhile to note that in contrast to the reference and middle of the century, where heat wave episodes are detected exclusively in the summer months (June–August), by the end of the century, heat wave episodes are also detected in May and September in the urban region of Thessaloniki. Specifically, during the study period 2096–2100, the urban inland areas experience three episodes in May and three in September, for a total of nine and eight heat wave days respectively, while the urban coastal areas experience two episodes in May and three in September, for a total of five and nine heat wave days, respectively.

3.2.2. Duration

(a)
Heat Wave Duration (HWD)
The mean heat wave duration (HWD) does not present substantial differences by the mid-century in comparison to the present climate for the inland urban areas (Table 3). The average heat wave in both study periods persists for ~4.2 days. By the end of the century, the mean heat wave duration in the urban inland regions increases to 6.1 days for a total increase of ~60% compared to the present climate. The picture is modestly different for the coastal urban areas, where HWD presents a slight decline by the middle of the century (3.2 days) compared to the present climate (3.9 days). However, as mentioned in Section 3.2.1, the yearly number of heat wave episodes presented increases by the middle of the century in the coastal regions compared to the inland. Thus, the total number of heat wave days per year is fairly similar for the inland and coastal regions. By 2100, HWD in the coastal regions increases to 6.8 days for a total increase of ~74%.
(b)
Heat Wave Maximum Duration (HWDm)
The maximum heat wave duration (HWDm) index in the present climate presents identical values for the inland and coastal regions (7 days). By 2050, HWDm presents a 3-day increase for the inland regions (10 days), while its value increases by 1 day for the coastal regions (8 days). However, by the end of the century, dramatic increases are found in HWDm for both the inland and coastal regions of Thessaloniki. In the period 2096–2100, the longest heat wave episode persists for more than a month (33 days) in the inland regions, which is almost a 5-fold increase compared to the present climate. The longest episode in the coastal regions persists for up to 29 days (~×4 longer than in the present climate). This result is particularly alarming with regard to the potential existence of an added impact on mortality due to consecutive exposure to heat wave conditions, which should be investigated thoroughly in future works.

3.2.3. Intensity

(a)
Heat Wave Intensity (HWI)
HWI refers to the mean daily T a p p (derived by averaging the daily T a p p m a x and T a p p m i n ) of all days that participate in all heat wave episodes (Table 3). Despite the severe increases in the frequency, heat wave intensity remains stable until mid-century, hovering around ~29 °C for both inland and coastal regions. However, HWI increases by approximately 1 °C, reaching ~30 °C in both coastal and inland areas by 2100. As the HWI index basically represents the average heat wave intensity, this increase in combination with the dramatic increases in heat wave frequency by the end of the century raises major concerns for the well-being of the urban population of Thessaloniki.
(b)
Heat Wave Amplitude (HWA)
Heat wave amplitude presents similar results as HWI with minimal changes by the middle and significant increases by the end of the century (Table 3). During the present climate and by 2050, HWA remains stable at ~32 °C in both the inland and the coastal areas of Thessaloniki, while by the end of the century, HWA is expected to reach ~35.7 °C and ~36.4 °C for the inland and coastal areas, respectively.
Direct comparison of results between studies is challenging, since different studies use different heat metrics and heat wave definitions, while the employed heat wave indices that typically describe frequency, duration and intensity might also mildly or substantially differ. Most importantly, the vast majority of studies model the Mediterranean region with lower resolutions (typically ~25–50 km, e.g., [15,18,95]), while even studies that are more locally oriented typically employ resolutions no higher than ~9–10 km (e.g., [29,96]). This is a severe limitation, since low model resolutions mask a lot of the local characteristics that strongly modify heat wave behavior. The importance of high-resolution modeling in the manifestation of strong local modification effects, especially when studying urban environments, is evident in Figure 6 and Figure 7. Older studies concerning the Mediterranean region use emission scenarios from previous generations, which further inhibits the ability to directly compare results. For example, the important works of [15,18] use the SRES A2 and A1B scenarios, under which the best estimate of the projected global warming for the end of the century is found between those of the RCP6.0 and RCP8.5 [97].
Using an ensemble of six regional models, [18] found the northern Mediterranean regional averages of yearly heat wave days to be 13.2 (6–24.1) by the middle and 40.4 (27.5–67.3) by the end of the century. The authors of [15] employed the same heat wave definition and indices as [18] and studied the Eastern Mediterranean and the Middle East, finding that the yearly number of heat wave days in the Greek region will increase by 70–85 days (under the A1B scenario) and by 85–100 days (under the A2 scenario) by the end of the century. They also found the yearly number of heat wave events to increase by 5–6. However, both of these studies used modeling resolutions of ~25 km and employed heat wave definitions based solely on maximum temperature, which is in contrast to this study. The authors of [95] studied future heat waves in the Middle East and North Africa region under the RCP8.5 scenario. For northern Greece, where Thessaloniki is located, the results indicated an increase between 3 and 6 in the yearly number of heat wave events and an increase in the duration of the longest detected event by between 20 and 40 days by the end of the century. However, they employed the Excess Heat Factor (EHF) as the basis of their heat wave definition, while their modeling resolution was ~50 km.
Studies that used higher modeling resolutions include [29], who studied future heat waves in the Iberian Peninsula with a resolution of ~9 km under the RCP8.5 scenario. They assessed heat wave conditions in several cities in the peninsula by examining the closest model grid cell for each location. Since the northern and western parts of the peninsula are strongly affected by maritime westerlies, resulting in mild summers [29], while the southern and eastern parts are directly affected by the Mediterranean Sea, we only compared results with cities in the latter regions (namely Barcelona, Valencia, Sevilla and Jerez). In these cities, the yearly number of heat wave days (events) in the middle of the century was found to vary in the range of 10.9–30.7 (2.2–5.3), while by the end of the century they varied in the range of 45.2–80.2 (4.8–7.2). The mean (95th percentile) of the heat wave duration distribution by the middle of the century varied in the range of 4.8–7 (10.3–15.9) and by the end of the century in the range of 7.5–16.5 (17.0–60.4). Interestingly, by the end of the century, both the mean and the 95th percentile of heat wave intensity in Valencia (a Mediterranean city) was found to decrease by ~1.1 °C and ~2.3 °C respectively, while the rest of the cities saw increases of ~0.4–1.4 °C and ~0.5–1.9 °C, respectively.

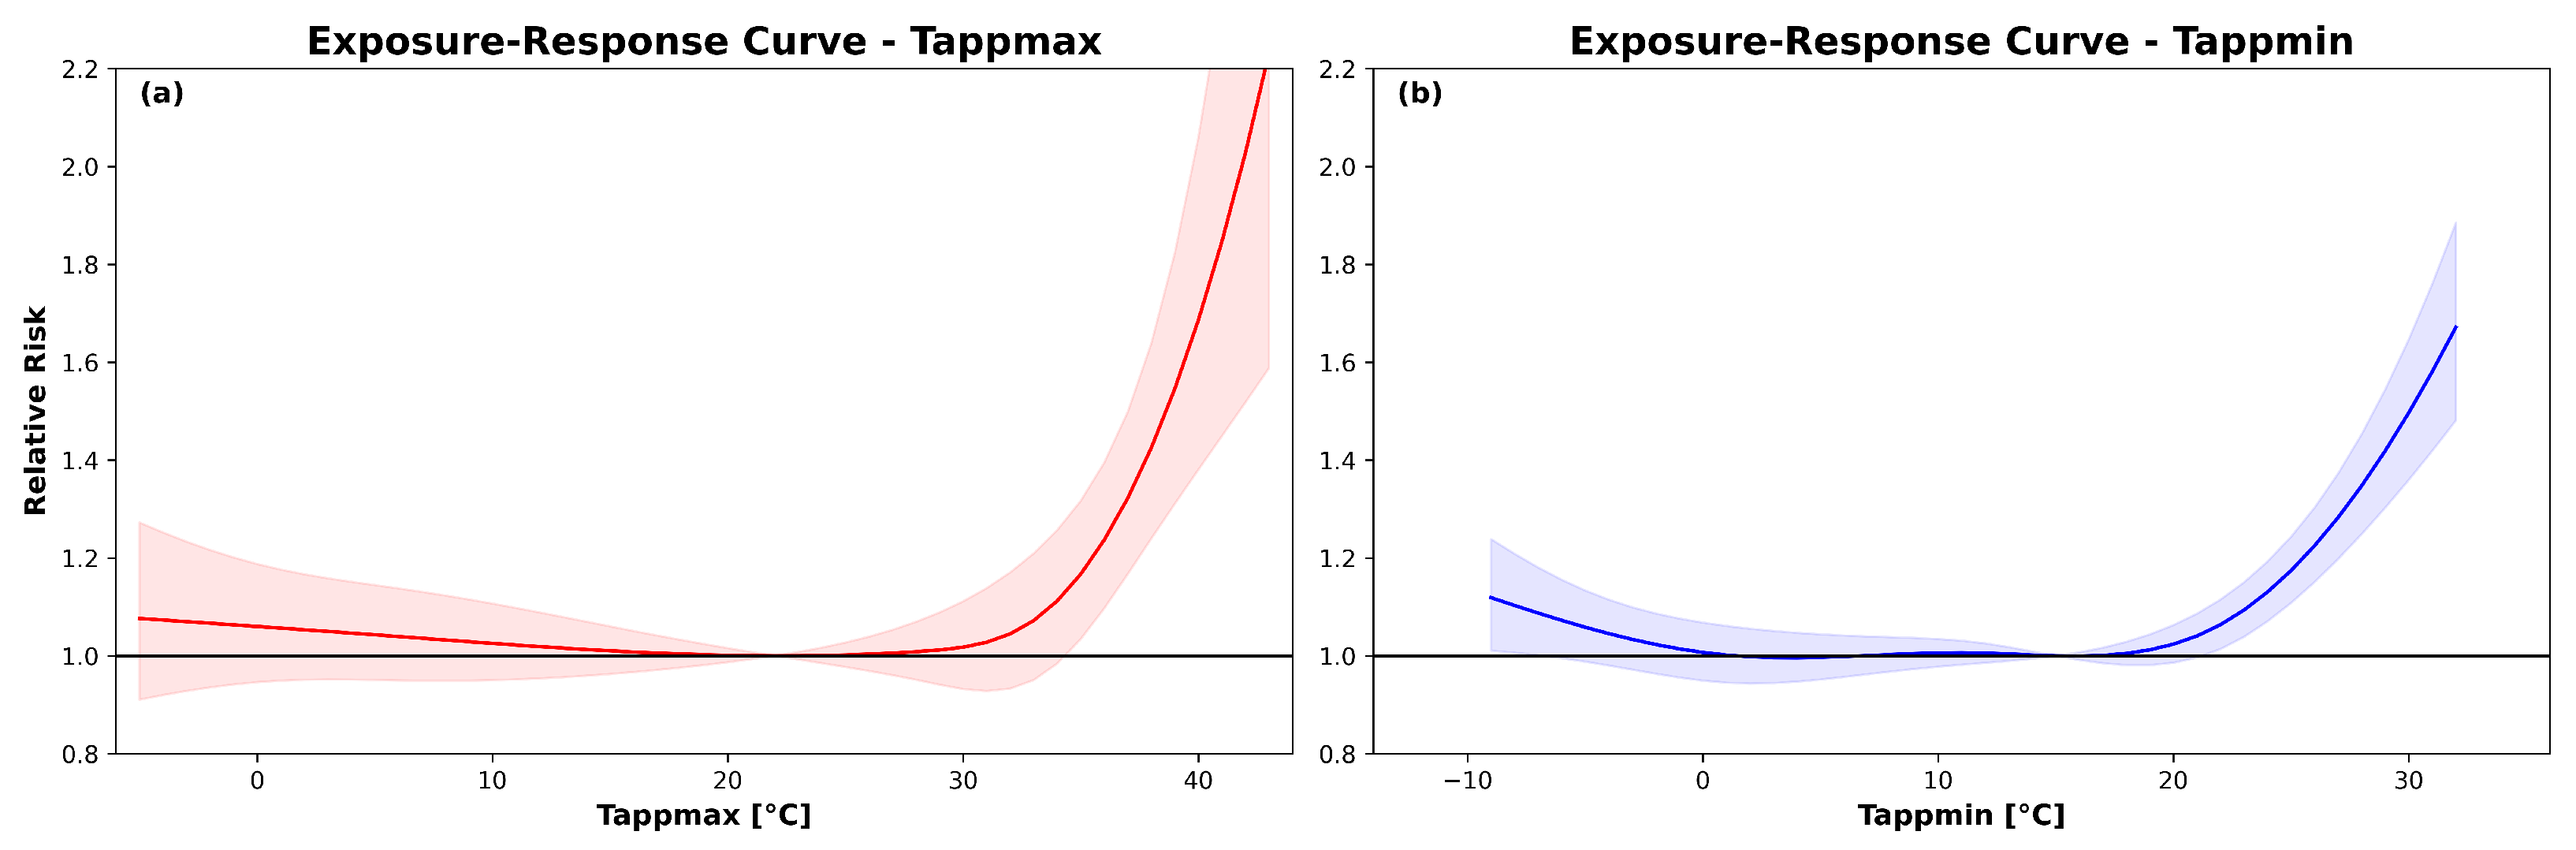
3.3. RR during Heat Wave Days

As a final part of this study, the mean relative risk during heat wave days was investigated for the Mediterranean city of Thessaloniki, during all study periods, by applying the framework presented in Section 2.4. As mentioned, two exposure–response functions were derived separately for T a p p m a x and T a p p m i n (Figure 4), while the heat wave definition included both T a p p m a x and T a p p m i n thresholds.
Interestingly, the results indicate that the relative risk for mortality during heat wave days appears to be substantially higher by applying the T a p p m i n -based E-R relationship (RR( T a p p m i n )) compared to the T a p p m a x –based (RR( T a p p m a x )) (Figure 8, Table 4). Meanwhile, similar results are found for the inland and coastal areas of Thessaloniki for all three periods. During the present climate, RR( T a p p m a x ) during heat wave days is 1.11 (95% CI: 1.01–1.24), while RR( T a p p m i n ) is 1.16 (95% CI: 1.09–1.22). Similar results are obtained during the mid-century period with insignificant shifts in the means and 95% CIs of RR( T a p p m a x ) and RR( T a p p m i n ) by 0.01–0.02. Nevertheless, as outlined in Section 3.2.1, Thessaloniki is anticipated to encounter more than double the number of heat wave days in both inland and coastal regions; thus, the increased RR conditions will persist for longer. By 2100, the mean daily RR( T a p p m a x ) during heat wave days increases to 1.17 (95% CI: 1.05–1.32), while RR( T a p p m i n ) jumps to 1.26 (95% CI: 1.19–1.37) for the inland and 1.28 (95% CI: 1.18–1.35) for the coastal areas of Thessaloniki. The total increase in mean heat wave day RR( T a p p m a x ) from the reference period to the end of the century is 5.4% for both inland and coastal regions. In comparison, the increase in RR( T a p p m i n ) is even more substantial, reaching 8.6% for inland areas and 10.3% for coastal areas over the same time frame. At the same time, Thessaloniki will experience 8 more heat wave days yearly by the end of the century.
The collective impact of the mean shift in daily RR( T a p p m a x )/RR( T a p p m i n ) and the substantial increase in the yearly number of heat wave days is depicted in Figure 8. Another interesting result depicted in the figure is the difference between the skewnesses of the end of the century RR( T a p p m a x ) and RR( T a p p m i n ) distributions. The RR( T a p p m i n ) distributions not only appear more shifted toward larger RR values, but they also appear significantly less positively skewed (toward lower RR values) compared to the RR( T a p p m a x ) distributions. As a result, while the vast majority of heat wave days (more than 45 days/year) present RR( T a p p m a x ) values between 1.00 and 1.25, a substantial amount of heat wave days (more than 30 days) present severely high RR( T a p p m i n ) values (i.e., >1.25).
Another interesting result is that not only is the mean RR( T a p p m i n ) always higher than RR( T a p p m a x ), but its 95% CIs are always substantially smaller, suggesting that T a p p m i n can potentially provide a better fit and be a more reliable predictor when studying heat-related mortality. This could be attributed to the fact that daily T a p p m i n can potentially represent both the impact of extreme heat throughout the day and the lack of relief and rest during hot nights, which as already mentioned is often suggested to exacerbate impacts on health.
Finally, an especially alarming consideration is that even by leaving out any potential amplification effects due to consecutive exposure to extreme heat conditions, excess mortality RR is found to substantially increase by the end of the century. However, as previously mentioned, the existence of such an effect remains uncertain with various studies yielding conflicting results. For example, [98] indicate that longer heatwaves substantially increase cardiovascular disease mortality risk and that the longer the heat wave, the greater the excess mortality risk. The authors of [88] found that this amplification effect was small compared to the independent effects of the individual days’ temperatures, and they only appeared after 4 consecutive days of exposure to heat wave conditions. On the contrary, [91] found that the effects of exposure to extreme heat over consecutive days are similar to what would be experienced if high-temperature days occurred independently. By also considering the increases in heat wave mean, and especially maximum duration presented in Section 3.2.2 of this study, the potential existence of an added heat effect could further amplify the increases in RR by the end of the century. Therefore, future research should prioritize investigating both the effects of consecutive days of exposure and the absence of nighttime relief due to exacerbated nocturnal heat conditions to yield more comprehensive, realistic and utilizable results.

4. Conclusions

This study explored the future impact of climate change in the frequency, duration and intensity of heat waves, as well as in the associated mortality risk, in the large Mediterranean city of Thessaloniki, Greece. For that purpose, high-resolution (2 km) climate simulations were conducted with the WRF model for three 5-year periods describing the present, mid-century and end of the century conditions, under the RCP8.5 scenario. Using small horizontal grid cells allowed not only for proper discrimination between urban and non-urban areas but also for the examination of differences within the urban environment itself, which is caused by elevation, proximity to sea or land-use differences. Nevertheless, while the allocation of computational resources to achieve a more realistic representation through high resolution is valuable, it comes with the trade-off of the inability to execute an ensemble of model projections. This limitation hinders the capacity to provide robust uncertainty quantification for the model results, and, therefore, the uncertainty of the model results in this study can only be characterized by the model evaluation performed in [24].
In the context of this study, potential intra-urban discrepancies were examined by constructing two different time series based on selected inland and coastal grid cells. Apparent temperature was the heat metric employed for defining heat waves and estimating heat-related mortality, since it offers a more physiologically oriented measure compared to temperature alone. Both the daily maximum and minimum values of apparent temperature were employed for defining heat waves and estimating heat-related mortality in order to also include the amplified health impacts due to exacerbated nighttime heat conditions in urban environments. Changes in six heat wave indices that describe heat wave frequency, duration and intensity were explored. The associated changes in heat-related mortality during heat waves was examined by applying heat–mortality exposure–response relationships that were derived for the city of Thessaloniki and were based on daily maximum and minimum apparent temperature.
An initial analysis of the future thermal environment of the area indicated an exacerbation of similar magnitude in both urban inland and coastal regions. Both T a p p m a x and T a p p m i n were found to increase by ~1 °C by the middle and by ~4–4.2 °C by the end of the century compared to the present climate. Examining T a p p instead of temperature, the hot season daytime thermal stress was found to be similar for the inland and coastal urban regions, while the coastal thermal environment was found to be slightly more aggravated during the nighttime. Looking at the greater area of Thessaloniki through high resolution, the increases in T a p p m a x were found to be relatively homogeneous, while high T a p p m i n areas were found to expand, changing the spatial pattern in the greater area by the end of the century.
While heat wave frequency indices present noteworthy increases already by the middle of the century, the picture changes drastically by 2100 with the HWF increasing by a factor of ×8 and HWN by a factor of ×5 in both inland and coastal urban regions. The results suggest that not only will the majority of future summer days adhere to heat wave conditions, but a few heat wave episodes will also occur in May and September. Indices related to duration and intensity showed relatively stable behavior until 2050. By 2100, the mean heat wave duration increases by ×1.7, while heat wave episodes that last about a month were detected in both inland and coastal urban regions. Finally, HWI presented an increase of ~1 °C, while HWA was found to increase by ~3.5 °C in the inland and by ~4.2 °C in the coastal areas. Using high modeling resolution also allowed an assessment of the frequency heat wave indices in the greater area of Thessaloniki. By 2050, all non-mountainous areas will present non-zero values in HWF and HWN, which is in contrast to the reference period. Results from the period 2096–2100 indicate that the majority of the area will experience more than 30 heat wave days and seven heat wave episodes annually, while a few areas inside the city will experience almost up to 70 heat wave days per year. These results further reinforce concerns for heat-related health impacts under climate change in Mediterranean urban environments while also highlighting the importance of high modeling resolution in differentiating between micro-climatic features that are averaged when coarser resolutions are used.
The relative risk induced by both daytime and nighttime exposure to heat wave conditions was found to remain stable by the middle of the century and similar in magnitude for both coastal and inland urban regions. Nevertheless, the corresponding increase in the annual number of heat wave days that the increased mortality risk persists for raises major concerns for a potentially considerable increase in annual heat-related mortality in urban environments already by the middle of the century. By 2100, the heat-related mortality regime was found to change drastically, with both T a p p m a x - and T a p p m i n -induced daily relative risk increasing to 1.17 (+5.4%) and 1.27 (+9.5%), respectively. At the same time, these conditions will persist for the majority of summer days, calling for rigorous and multi-sector measures for the mitigation of health impacts. The mean heat wave day RR( T a p p m i n ) was found to be higher than the corresponding RR( T a p p m a x ) in all study periods, while RR( T a p p m i n ) distributions were found to be significantly less positively skewed than the corresponding RR( T a p p m a x ) distributions. Meanwhile, the 95% empirical CIs for the RR( T a p p m i n ) values were found smaller compared to those of RR( T a p p m a x ), indicating that by including effects of lack of relief during nighttime, T a p p m i n can serve as a more reliable predictor for predicting daily heat-related mortality.
As already mentioned, the relative risk results presented in this work are rather conservative, as the exposure–response functions employed cannot account for any risk amplification due to exposure to consecutive days of heat wave conditions. The potential existence of such an amplification effect could further increase the relative risk during heat wave days estimated in this study and should be further investigated alongside the effect of lack of stress relief during nighttime. However, even without including any amplification effects, the results of this study incite considerable health alarms for Mediterranean urban environments. In addition to climate change mitigation policies, targeted adaptation strategies and proper public communication must be the focus of local authorities throughout the next few decades, as such measures have been shown to be effective in reducing heat-induced mortality in multiple countries [99].

Author Contributions

Conceptualization, G.P. and S.C.K.; methodology, G.P., S.C.K. and D.P.; software, G.P., S.K., D.P. and S.C.K.; validation, S.P. and D.P.; formal analysis, G.P.; investigation, G.P.; data curation, G.P. and D.P.; writing—original draft preparation, G.P. and S.C.K.; writing—review and editing, S.C.K., D.P., S.K., S.P. and D.M.; visualization, G.P., D.P. and S.C.K.; supervision, S.C.K. and D.M.; project administration, D.M. All authors have read and agreed to the published version of the manuscript.

Funding

This research was funded by the LIFE Programme of the European Union in the framework of the project LIFE21-GIE-EL-LIFE-SIRIUS/101074365 and the project ‘Support for enhancing the operation of the National Network for Climate Change (CLIMPACT)’, National Development Program, General Secretariat of Research and Innovation (2023NA11900001-N. 5201588).

Institutional Review Board Statement

Not applicable.

Informed Consent Statement

Not applicable.

Data Availability Statement

Upon request to the authors. Mortality data provided by ELSTAT are confidential.

Acknowledgments

The authors would like to acknowledge the Hellenic Statistical Service (ELSTAT) for providing the mortality data and the Hellenic National Meteorological Service (HNMS) for providing the meteorological station data.

Conflicts of Interest

The authors declare no conflicts of interest.

References

  1. Arias, P.; Bellouin, N.; Coppola, E.; Jones, R.; Krinner, G.; Marotzke, J.; Naik, V.; Palmer, M.; Plattner, G.K.; Rogelj, J.; et al. Technical Summary. In Climate Change 2021: The Physical Science Basis. Contribution of Working Group I to the Sixth Assessment Report of the Intergovernmental Panel on Climate Change; Masson-Delmotte, V., Zhai, P., Pirani, A., Connors, S., Péan, C., Berger, S., Caud, N., Chen, Y., Goldfarb, L., Gomis, M., et al., Eds.; Cambridge University Press: Cambridge, UK; New York, NY, USA, 2021; pp. 33–144. [Google Scholar] [CrossRef]
  2. Giorgi, F. Climate change Hot-Spots. Geophys. Res. Lett. 2006, 33, 101029. [Google Scholar] [CrossRef]
  3. Giorgi, F.; Lionello, P. Climate change projections for the Mediterranean region. Glob. Planet. Chang. 2008, 63, 90–104. [Google Scholar] [CrossRef]
  4. Tuel, A.; Eltahir, E.A.B. Why Is the Mediterranean a Climate Change Hot Spot? J. Clim. 2020, 33, 5829–5843. [Google Scholar] [CrossRef]
  5. Cramer, W.; Joel, G.; Fader, M.; Garrabou, J.; Gattuso, J.P.; Iglesias, A.; Lange, M.; Lionello, P.; Llasat, M.; Paz, S.; et al. Climate change and interconnected risks to sustainable development in the Mediterranean. Nat. Clim. Chang. 2018, 8, 972–980. [Google Scholar] [CrossRef]
  6. Drobinski, P.; Da Silva, N.; Bastin, S.; Mailler, S.; Muller, C.; Ahrens, B.; Christensen, O.; Lionello, P. How warmer and drier will the Mediterranean region be at the end of the twenty-first century? Reg. Environ. Chang. 2020, 20, 78. [Google Scholar] [CrossRef]
  7. MedECC. Climate and Environmental Change in the Mediterranean Basin–Current Situation and Risks for the Future. First Mediterranean Assessment Report; MedECC: Marseille, France, 2020; p. 632. [Google Scholar] [CrossRef]
  8. Ali, E.; Cramer, W.; Carnicer, J.; Georgopoulou, E.; Hilmi, N.; Cozannet, G.L.; Lionello, P. Cross-Chapter Paper 4: Mediterranean Region. In Climate Change 2022: Impacts, Adaptation and Vulnerability. Contribution of Working Group II to the Sixth Assessment Report of the Intergovernmental Panel on Climate Change; Pörtner, H.O., Roberts, D.C., Tignor, M., Poloczanska, E.S., Mintenbeck, K., Alegría, A., Craig, M., Langsdorf, S., Löschke, S., Möller, V., et al., Eds.; Cambridge University Press: Cambridge, UK; New York, NY, USA, 2022; pp. 2233–2272. [Google Scholar] [CrossRef]
  9. Lelieveld, J.; Proestos, Y.; Hadjinicolaou, P.; Tanarhte, M.; Tyrlis, E.; Zittis, G. Strongly increasing heat extremes in the Middle East and North Africa (MENA) in the 21st century. Clim. Chang. 2016, 137, 245–260. [Google Scholar] [CrossRef]
  10. Sillmann, J.; Kharin, V.V.; Zwiers, F.W.; Zhang, X.; Bronaugh, D. Climate extremes indices in the CMIP5 multimodel ensemble: Part 2. Future climate projections. J. Geophys. Res. 2013, 118, 2473–2493. [Google Scholar] [CrossRef]
  11. Barriopedro, D.; García-Herrera, R.; Ordóñez, C.; Miralles, D.; Salcedo-Sanz, S. Heat waves: Physical understanding and scientific challenges. Rev. Geophys. 2023, 61, e2022RG000780. [Google Scholar] [CrossRef]
  12. Meehl, G.A.; Karl, T.; Easterling, D.R.; Changnon, S.; Pielke, R.; Changnon, D.; Evans, J.; Groisman, P.Y.; Knutson, T.R.; Kunkel, K.E.; et al. An Introduction to Trends in Extreme Weather and Climate Events: Observations, Socioeconomic Impacts, Terrestrial Ecological Impacts, and Model Projections. Bull. Am. Meteorol. Soc. 2000, 81, 413–416. [Google Scholar] [CrossRef]
  13. Zittis, G.; Almazroui, M.; Alpert, P.; Ciais, P.; Cramer, W.; Dahdal, Y.; Fnais, M.; Francis, D.; Hadjinicolaou, P.; Howari, F.; et al. Climate Change and Weather Extremes in the Eastern Mediterranean and Middle East. Rev. Geophys. 2022, 60, 762. [Google Scholar] [CrossRef]
  14. Kuglitsch, F.G.; Toreti, A.; Xoplaki, E.; Della-Marta, P.M.; Zerefos, C.S.; Türkeş, M.; Luterbacher, J. Heat wave changes in the eastern Mediterranean since 1960. Geophys. Res. Lett. 2010, 37, 1841. [Google Scholar] [CrossRef]
  15. Zittis, G.; Hadjinicolaou, P.; Fnais, M.; Lelieveld, J. Projected changes in heat wave characteristics in the eastern Mediterranean and the Middle East. Reg. Environ. Chang. 2015, 16, 1876. [Google Scholar] [CrossRef]
  16. Lionello, P.; Scarascia, L. The relation of climate extremes with global warming in the Mediterranean region and its north versus south contrast. Reg. Environ. Chang. 2020, 20, 31. [Google Scholar] [CrossRef]
  17. Founda, D.; Varotsos, K.; Pierros, F.; Giannakopoulos, C. Observed and projected shifts in hot extremes’ season in the Eastern Mediterranean. Glob. Planet. Chang. 2019, 175, 190–200. [Google Scholar] [CrossRef]
  18. Fischer, E.; Schär, C. Consistent geographical patterns of changes in high-impact European heatwaves. Nat. Geosci. 2010, 3, 866. [Google Scholar] [CrossRef]
  19. Dosio, A.; Fischer, E. Will Half a Degree Make a Difference? Robust Projections of Indices of Mean and Extreme Climate in Europe Under 1.5 °C, 2 °C, and 3 °C Global Warming. Geophys. Res. Lett. 2018, 45, 6222. [Google Scholar] [CrossRef]
  20. United Nations. World Urbanization Prospects: The 2018 Revision; United Nations: New York, NY, USA, 2019. [Google Scholar]
  21. Gu, D. Exposure and Vulnerability to Natural Disasters for World’s Cities; United Nations: New York, NY, USA, 2019. [Google Scholar]
  22. Oke, T.; Mills, G.; Christen, A.; Voogt, J. Urban Climates; Cambridge University Press: Cambridge, MA, USA, 2017. [Google Scholar] [CrossRef]
  23. Li, D.; Bou-Zeid, E. Synergistic Interactions between Urban Heat Islands and Heat Waves: The Impact in Cities Is Larger than the Sum of Its Parts. J. Appl. Meteorol. Climatol. 2013, 52, 2051–2064. [Google Scholar] [CrossRef]
  24. Keppas, S.C.; Papadogiannaki, S.; Parliari, D.; Kontos, S.; Poupkou, A.; Tzoumaka, P.; Kelessis, A.; Zanis, P.; Casasanta, G.; de’Donato, F.; et al. Future Climate Change Impact on Urban Heat Island in Two Mediterranean Cities Based on High-Resolution Regional Climate Simulations. Atmosphere 2021, 12, 884. [Google Scholar] [CrossRef]
  25. Keppas, S.; Parliari, D.; Kontos, S.; Poupkou, A.; Papadogiannaki, S.; Tzoumaka, P.; Kelessis, A.; Melas, D. Urban Heat Island and Future Projections: A Study in Thessaloniki, Greece; Springer International Publishing: Cham, Switzerland, 2021; pp. 201–212. [Google Scholar] [CrossRef]
  26. Hadjinicolaou, P.; Tzyrkalli, A.; Zittis, G.; Lelieveld, J. Urbanisation and Geographical Signatures in Observed Air Temperature Station Trends Over the Mediterranean and the Middle East–North Africa. Earth Syst. Environ. 2023, 7, 649–659. [Google Scholar] [CrossRef]
  27. Sharma, A.; Wuebbles, D.J.; Kotamarthi, R. The Need for Urban-Resolving Climate Modeling Across Scales. AGU Adv. 2021, 2, e2020AV000271. [Google Scholar] [CrossRef]
  28. Rummukainen, M. Added value in regional climate modeling. WIREs Clim. Chang. 2016, 7, 145–159. [Google Scholar] [CrossRef]
  29. Pereira, S.C.; Marta-Almeida, M.; Carvalho, A.C.; Rocha, A. Heat wave and cold spell changes in Iberia for a future climate scenario. Int. J. Climatol. 2017, 37, 5192–5205. [Google Scholar] [CrossRef]
  30. Fallmann, J.; Wagner, S.; Emeis, S. High resolution climate projections to assess the future vulnerability of European urban areas to climatological extreme events. Theor. Appl. Climatol. 2017, 127, 667–683. [Google Scholar] [CrossRef]
  31. Karwat, A.; Franzke, C.L.E. Future Projections of Heat Mortality Risk for Major European Cities. Weather Clim. Soc. 2021, 13, 913–931. [Google Scholar] [CrossRef]
  32. Junk, J.; Goergen, K.; Krein, A. Future Heat Waves in Different European Capitals Based on Climate Change Indicators. Int. J. Environ. Res. Public Health 2019, 16, 3959. [Google Scholar] [CrossRef]
  33. World Meteorological Organization (WMO); World Health Organization (WHO). Heat Waves and Health: Guidance on Warning System Development; WMO: Geneva, Switzerland, 2015; Available online: https://library.wmo.int/records/item/54600-heatwaves-and-health (accessed on 3 June 2023).
  34. Ebi, K.L.; Vanos, J.; Baldwin, J.W.; Bell, J.E.; Hondula, D.M.; Errett, N.A.; Hayes, K.; Reid, C.E.; Saha, S.; Spector, J.; et al. Extreme Weather and Climate Change: Population Health and Health System Implications. Annu. Rev. Public Health 2021, 42, 293–315. [Google Scholar] [CrossRef]
  35. Tuholske, C.; Caylor, K.; Funk, C.; Verdin, A.; Sweeney, S.; Grace, K.; Peterson, P.; Evans, T. Global urban population exposure to extreme heat. Proc. Natl. Acad. Sci. USA 2021, 118, e2024792118. [Google Scholar] [CrossRef]
  36. Can, G.; Sahin, Ü.; Sayılı, U.; Dubé, M.; Kara Esen, B.; Culpan, H.C.; İnan, B.; Aksu Sayman, Ö.; Lebel, G.; Bustinza, R.; et al. Excess Mortality in Istanbul during Extreme Heat Waves between 2013 and 2017. Int. J. Environ. Res. Public Health 2019, 16, 4348. [Google Scholar] [CrossRef]
  37. Gilabert, J.; Deluca, A.; Lauwaet, D.; Ballester, J.; Corbera, J.; Llasat, M.C. Assessing heat exposure to extreme temperatures in urban areas using the Local Climate Zone classification. Nat. Hazards Earth Syst. Sci. 2021, 21, 375–391. [Google Scholar] [CrossRef]
  38. Conti, S.; Meli, P.; Minelli, G.; Solimini, R.; Toccaceli, V.; Vichi, M.; Beltrano, C.; Perini, L. Epidemiologic study of mortality during the Summer 2003 heat wave in Italy. Environ. Res. 2005, 98, 390–399. [Google Scholar] [CrossRef] [PubMed]
  39. Fouillet, A.; Rey, G.; Laurent, F.; Pavillon, G.; Bellec, S.; Guihenneuc-Jouyaux, C.; Clavel, J.; Jougla, E.; Hémon, D. Excess Mortality Related to the August 2003 Heat Wave in France. Int. Arch. Occup. Environ. Health 2006, 80, 16–24. [Google Scholar] [CrossRef]
  40. Shaposhnikov, D.; Revich, B.; Bellander, T.; Bedada, G.B.; Bottai, M.; Kharkova, T.; Kvasha, E.; Lind, T.; Pershagen, G. Long-Term Impact of Moscow Heat Wave and Wildfires on Mortality. Epidemiology 2015, 26, e21–e22. [Google Scholar] [CrossRef]
  41. Russo, S.; Sillmann, J.; Fischer, E. Top ten European heatwaves since 1950 and their occurrence in the coming decades. Environ. Res. Lett. 2015, 10, 124003. [Google Scholar] [CrossRef]
  42. National Center for Environmental Health (U.S.). Climate Change and Extreme Heat Events. Available online: https://stacks.cdc.gov/view/cdc/13697 (accessed on 2 June 2023).
  43. Coates, L.; Haynes, K.; O’Brien, J.; McAneney, J.; de Oliveira, F.D. Exploring 167 years of vulnerability: An examination of extreme heat events in Australia 1844–2010. Environ. Sci. Policy 2014, 42, 33–44. [Google Scholar] [CrossRef]
  44. Basu, R. High ambient temperature and mortality: A review of epidemiologic studies from 2001 to 2008. Environ Health. 8:40. Environ. Health Glob. Access Sci. Source 2009, 8, 40. [Google Scholar] [CrossRef]
  45. Song, X.; Wang, S.; Hu, Y.; Yue, M.; Zhang, T.; Liu, Y.; Tian, J.; Shang, K. Impact of ambient temperature on morbidity and mortality: An overview of reviews. Sci. Total. Environ. 2017, 586, 241–254. [Google Scholar] [CrossRef]
  46. Leone, M.; D’Ippoliti, D.; De Sario, M.; Analitis, A.; Menne, B.; Katsouyanni, K.; de’Donato, F.; Basagana, X.; Ben Salah, A.; Casimiro, E.; et al. A time series study on the effects of heat on mortality and evaluation of heterogeneity into European and Eastern-Southern Mediterranean cities: Results of EU CIRCE project. Environ. Health Glob. Access Sci. Source 2013, 12, 55. [Google Scholar] [CrossRef] [PubMed]
  47. Baccini, M.; Biggeri, A.; Accetta, G.; Kosatsky, T.; Katsouyanni, K.; Analitis, A.; Anderson, H.; Bisanti, L.; D’Ippoliti, D.; Danova, J.; et al. Heat Effects on Mortality in 15 European Cities. Epidemiology 2008, 19, 711–719. [Google Scholar] [CrossRef] [PubMed]
  48. Tsekeri, E.; Kolokotsa, D.; Santamouris, M. On the association of ambient temperature and elderly mortality in a Mediterranean island - Crete. Sci. Total. Environ. 2020, 738, 139843. [Google Scholar] [CrossRef] [PubMed]
  49. Oudin Åström, D.; Schifano, P.; Asta, F.; Lallo, A.; Michelozzi, P.; Rocklöv, J.; Forsberg, B. The effect of heat waves on mortality in susceptible groups: A cohort study of a mediterranean and a northern European City. Environ. Health 2015, 14, 30. [Google Scholar] [CrossRef] [PubMed]
  50. Basu, R.; Feng, W.Y.; Ostro, B. Characterizing Temperature and Mortality in Nine California Counties. Epidemiology 2008, 19, 138–145. [Google Scholar] [CrossRef]
  51. Zanobetti, A.; Schwartz, J. Temperature and Mortality in Nine US Cities. Epidemiology 2008, 19, 563–570. [Google Scholar] [CrossRef]
  52. Almeida, S.; Casimiro, E.; Calheiros, J. Effects of apparent temperature on daily mortality in Lisbon and Oporto, Portugal. Environ. Health Glob. Access Sci. Source 2010, 9, 12. [Google Scholar] [CrossRef]
  53. He, C.; Kim, H.; Hashizume, M.; Lee, W.; Honda, Y.; Kim, S.; Kinney, P.; Schneider, A.; Zhang, Y.; Zhu, Y.; et al. The effects of night-time warming on mortality burden under future climate change scenarios: A modelling study. Lancet Planet. Health 2022, 6, e648–e657. [Google Scholar] [CrossRef]
  54. Murage, P.; Hajat, S.; Kovats, R.S. Effect of night-time temperatures on cause and age-specific mortality in London. Environ. Epidemiol. 2017, 1, e005. [Google Scholar] [CrossRef] [PubMed]
  55. Royé, D.; Sera, F.; Tobias, A.; Lowe, R.; Gasparrini, A.; Pascal, M.; de’Donato, F.; Nunes, B.; Teixeira, J.P. Effects of Hot Nights on Mortality in Southern Europe. Epidemiology 2021, 32, 487–498. [Google Scholar] [CrossRef] [PubMed]
  56. Parliari, D.; Keppas, S.; Papadogiannaki, S.; Papadopoulos, G.; Kontos, S.; Melas, D. Projections of Heat-Related Mortality under the Impact of Climate Change in Thessaloniki, Greece. Environ. Sci. Proc. 2023, 26, 6072. [Google Scholar] [CrossRef]
  57. Ballester, J.; Robine, J.M.; Herrmann, F.; Rodo, X. Long-term projections and acclimatization scenarios of temperature-related mortality in Europe. Nat. Commun. 2011, 2, 358. [Google Scholar] [CrossRef] [PubMed]
  58. Gasparrini, A.; Guo, Y.; Sera, F.; Vicedo-Cabrera, A.M.; Huber, V.; Tong, S.; de Sousa Zanotti Stagliorio Coelho, M.; Nascimento Saldiva, P.H.; Lavigne, E.; Matus Correa, P.; et al. Projections of temperature-related excess mortality under climate change scenarios. Lancet Planet. Health 2017, 1, e360–e367. [Google Scholar] [CrossRef] [PubMed]
  59. Chen, H.; Zhao, L.; Cheng, L.; Zhang, Y.; Wang, H.; Gu, K.; Bao, J.; Yang, J.; Liu, Z.; Huang, J.; et al. Projections of heatwave-attributable mortality under climate change and future population scenarios in China. Lancet Reg. Health West. Pac. 2022, 28, 100582. [Google Scholar] [CrossRef]
  60. Galanaki, E.; Giannaros, C.; Kotroni, V.; Lagouvardos, K.; Papavasileiou, G. Spatio-Temporal Analysis of Heatwaves Characteristics in Greece from 1950 to 2020. Climate 2023, 11, 5. [Google Scholar] [CrossRef]
  61. Parliari, D.; Cheristanidis, S.; Giannaros, C.; Keppas, S.C.; Papadogiannaki, S.; de’Donato, F.; Sarras, C.; Melas, D. Short-Term Effects of Apparent Temperature on Cause-Specific Mortality in the Urban Area of Thessaloniki, Greece. Atmosphere 2022, 13, 852. [Google Scholar] [CrossRef]
  62. Giannaros, T.M.; Melas, D. Study of the urban heat island in a coastal Mediterranean City: The case study of Thessaloniki, Greece. Atmos. Res. 2012, 118, 103–120. [Google Scholar] [CrossRef]
  63. Giannaros, C.; Nenes, A.; Giannaros, T.; Kourtidis, K.; Melas, D. A comprehensive approach for the simulation of the Urban Heat Island effect with the WRF/SLUCM modeling system: The case of Athens (Greece). Atmos. Res. 2017, 201, 86–101. [Google Scholar] [CrossRef]
  64. Kusaka, H.; KIMURA, F. Coupling a Single-Layer Urban Canopy Model with a Simple Atmospheric Model: Impact on Urban Heat Island Simulation for an Idealized Case. J. Meteorol. Soc. Jpn. 2004, 82, 67–80. [Google Scholar] [CrossRef]
  65. Martilli, A.; Clappier, A.; Rotach, M. An Urban Surface Exchange Parameterisation for Mesoscale Models. Bound. Layer Meteorol. 2002, 104, 261–304. [Google Scholar] [CrossRef]
  66. Buttner, G. CORINE Land Cover and land cover change products. Remote Sens. Digit. Image Process. 2014, 18, 55–74. [Google Scholar] [CrossRef]
  67. Bruyere, C.L.; Monaghan, A.J.; Steinhoff, D.F.; Yates, D. Bias-Corrected CMIP5 CESM Data in WRF/MPAS Intermediate File Format; Technical Report NCAR/TN-515+STR; National Center for Atmospheric Research: Boulder, CO, USA, 2015. [Google Scholar] [CrossRef]
  68. Knutti, R.; Masson, D.; Gettelman, A. Climate model genealogy: Generation CMIP5 and how we got there. Geophys. Res. Lett. 2013, 40, 1194–1199. [Google Scholar] [CrossRef]
  69. Kaspar-Ott, I.; Hertig, E.; Kaspar, S.; Pollinger, F.; Ring, C.; Paeth, H.; Jacobeit, J. Weights for general circulation models from CMIP3/CMIP5 in a statistical downscaling framework and the impact on future Mediterranean precipitation. Int. J. Climatol. 2019, 39, 3639–3654. [Google Scholar] [CrossRef]
  70. Çağatay Bağçaci, S.; Yucel, I.; Duzenli, E.; Yilmaz, M.T. Intercomparison of the expected change in the temperature and the precipitation retrieved from CMIP6 and CMIP5 climate projections: A Mediterranean hot spot case, Turkey. Atmos. Res. 2021, 256, 105576. [Google Scholar] [CrossRef]
  71. Meinshausen, M.; Smith, S.; Calvin, K.; Daniel, J.; Kainuma, M.; Lamarque, J.F.; Matsumoto, K.; Montzka, S.; Raper, S.; Riahi, K.; et al. The RCP greenhouse gas concentrations and their extensions from 1765 to 2300. Clim. Chang. 2011, 109, 213–241. [Google Scholar] [CrossRef]
  72. Perkins-Kirkpatrick, S.; Alexander, L. On the Measurement of Heat Waves. J. Clim. 2013, 26, 4500–4517. [Google Scholar] [CrossRef]
  73. Perkins, S.E. A review on the scientific understanding of heatwaves—Their measurement, driving mechanisms, and changes at the global scale. Atmos. Res. 2015, 164–165, 242–267. [Google Scholar] [CrossRef]
  74. Budd, G. Wet-bulb globe temperature (WBGT)—Its history and its limitations. J. Sci. Med. Sport 2008, 11, 20–32. [Google Scholar] [CrossRef]
  75. Xu, Z.; FitzGerald, G.; Guo, Y.; Jalaludin, B.; Tong, S. Impact of heatwave on mortality under different heatwave definitions: A systematic review and meta-analysis. Environ. Int. 2016, 89–90, 193–203. [Google Scholar] [CrossRef]
  76. Hajat, S.; Armstrong, B.; Baccini, M.; Biggeri, A.; Bisanti, L.; Russo, A.; Paldy, A.; Menne, B.; Kosatsky, T. Impact of High Temperatures on Mortality: Is There an Added Heat Wave Effect? Epidemiology 2006, 17, 632–638. [Google Scholar] [CrossRef]
  77. D’Ippoliti, D.; Michelozzi, P.; Marino, C.; de’Donato, F.; Menne, B.; Katsouyanni, K.; Kirchmayer, U.; Analitis, A.; Medina-Ramón, M.; Paldy, A.; et al. The impact of heat waves on mortality in 9 European cities: Results from the EuroHEAT project. Environ. Health Glob. Access Sci. Source 2010, 9, 37. [Google Scholar] [CrossRef]
  78. Lin, Y.K.; Chang, C.K.; Li, M.H.; Wu, Y.C.; Wang, Y.C. High-temperature indices associated with mortality and outpatient visits: Characterizing the association with elevated temperature. Sci. Total. Environ. 2012, 427–428, 41–49. [Google Scholar] [CrossRef]
  79. Zhang, K.; Li, Y.; Schwartz, J.D.; O’Neill, M.S. What weather variables are important in predicting heat-related mortality? A new application of statistical learning methods. Environ. Res. 2014, 132, 350–359. [Google Scholar] [CrossRef] [PubMed]
  80. Michelozzi, P.; De Sario, M.; Accetta, G.; de’Donato, F.; Kirchmayer, U.; D’Ovidio, M.; Perucci, C. Temperature and summer mortality: Geographical and temporal variations in four Italian cities. J. Epidemiol. Community Health 2006, 60, 417–423. [Google Scholar] [CrossRef] [PubMed]
  81. Michelozzi, P.; Accetta, G.; De Sario, M.; D’Ippoliti, D.; Marino, C.; Baccini, M.; Biggeri, A.; Anderson, H.; Katsouyanni, K.; Ballester, F.; et al. High Temperature and Hospitalizations for Cardiovascular and Respiratory Causes in 12 European Cities. Am. J. Respir. Crit. Care Med. 2009, 179, 383–389. [Google Scholar] [CrossRef]
  82. Michelozzi, P.; Bisanti, L.; Russo, A.; Cadum, E.; Demaria, M.; D’Ovidio, M.; Costa, G.; Perucci, C. The impact of the summer 2003 heat waves on mortality in four Italian cities. Eurosurveillance 2005, 10, 161–165. [Google Scholar] [CrossRef]
  83. Forastiere, F.; Agostini, D.; Caranci, N.; de’Donato, F.; Demaria, M.; Michelozzi, P.; Miglio, R.; Rognoni, M.; Russo, A.; Perucci, C. Factors affecting in-hospital heat-related mortality: A multi-city case-crossover analysis. J. Epidemiol. Community Health 2008, 62, 209–215. [Google Scholar] [CrossRef]
  84. Meehl, G.A.; Tebaldi, C. More Intense, More Frequent, and Longer Lasting Heat Waves in the 21st Century. Science 2004, 305, 994–997. [Google Scholar] [CrossRef]
  85. Schoetter, R.; Cattiaux, J.; Douville, H. Changes of western European heat wave characteristics projected by the CMIP5 ensemble. Clim. Dyn. 2014, 45, 1601–1616. [Google Scholar] [CrossRef]
  86. Shi, Z.; Xu, X.; Jia, G. Urbanization Magnified Nighttime Heat Waves in China. Geophys. Res. Lett. 2021, 48, e2021GL093603. [Google Scholar] [CrossRef]
  87. Yang, J.; Yin, P.; Sun, J.; Wang, B.; Zhou, M.; Li, M.; Tong, S.; Meng, B.; Guo, Y.; Liu, Q. Heatwave and mortality in 31 major Chinese cities: Definition, vulnerability and implications. Sci. Total. Environ. 2019, 649, 695–702. [Google Scholar] [CrossRef]
  88. Gasparrini, A.; Armstrong, B. The Impact of Heat Waves on Mortality. Epidemiology 2011, 22, 68–73. [Google Scholar] [CrossRef] [PubMed]
  89. Perkins-Kirkpatrick, S.; Lewis, S. Increasing trends in regional heatwaves. Nat. Commun. 2020, 11, 3357. [Google Scholar] [CrossRef]
  90. Ma, W.; Chen, R.; Kan, H. Temperature-related mortality in 17 large Chinese cities: How heat and cold affect mortality in China. Environ. Res. 2014, 134, 127–133. [Google Scholar] [CrossRef]
  91. Guo, Y.; Gasparrini, A.; Armstrong, B.G.; Tawatsupa, B.; Tobias, A.; Lavigne, E.; de Sousa Zanotti Stagliorio Coelho, M.; Pan, X.; Kim, H.; Hashizume, M.; et al. Heat Wave and Mortality: A Multicountry, Multicommunity Study. Environ. Health Perspect. 2017, 125, 087006. [Google Scholar] [CrossRef] [PubMed]
  92. Miller, S.T.K.; Keim, B.D.; Talbot, R.W.; Mao, H. Sea breeze: Structure, forecasting, and impacts. Rev. Geophys. 2003, 41, 124. [Google Scholar] [CrossRef]
  93. Emmanuel, R.; Johansson, E. Influence of urban morphology and sea breeze on hot humid microclimate: The case of Colombo, Sri Lanka. Clim. Res. 2006, 30, 189–200. [Google Scholar] [CrossRef]
  94. Bonnardot, V.; Carey, V.; Planchon, O.; Cautenet, S. Sea breeze mechanism and observations of its effects in the Stellenbosch wine producing area. Wynboer 2001, 10–14, 107–113. Available online: https://hal.science/hal-00319262 (accessed on 7 December 2023).
  95. Driouech, F.; Elrhaz, K.; Moufouma-Okia, W.; Arjdal, K.; Balhane, S. Assessing Future Changes of Climate Extreme Events in the CORDEX-MENA Region Using Regional Climate Model ALADIN-Climate. Earth Syst. Environ. 2020, 4, 477–492. [Google Scholar] [CrossRef]
  96. Viceto, C.; Cardoso Pereira, S.; Rocha, A. Climate Change Projections of Extreme Temperatures for the Iberian Peninsula. Atmosphere 2019, 10, 229. [Google Scholar] [CrossRef]
  97. Rogelj, J.; Meinshausen, M.; Knutti, R. Global Warming under Old and New Scenarios Using IPCC Climate Sensitivity Range Estimates. Nat. Clim. Chang. 2012, 2, 248–253. [Google Scholar] [CrossRef]
  98. Yin, Q.; Wang, J. The association between consecutive days’ heat wave and cardiovascular disease mortality in Beijing, China. BMC Public Health 2017, 17, 223. [Google Scholar] [CrossRef]
  99. Sanchez Martinez, G.; de’Donato, F.; Kendrovski, V.; Díaz, J.; Linares, C. Heat and Health in the WHO European Region: Updated Evidence for Effective Prevention; WHO: Geneva, Switzerland, 2021. [Google Scholar]
Figure 1. Model elevation (in meters above sea level) in the greater area of Thessaloniki. The coastlines are denoted with black, while the city’s edgelines are denoted with red.
Sustainability 16 01072 g001
Figure 2. Model grid cells averaged for the construction of the urban inland (green cross) and coastal (blue dot) time series.
Sustainability 16 01072 g002
Figure 3. Model land use provided by the Corine Land Cover dataset version 2012 for the greater area of Thessaloniki.
Sustainability 16 01072 g003
Figure 4. Exposure–response curves based on (a) T a p p m a x (red) and (b) T a p p m i n (blue) and corresponding 95% empirical confidence intervals for the T a p p m a x -based curve (light red) and the T a p p m i n -based curve (light blue).
Sustainability 16 01072 g004
Figure 5. Hot season daily T a p p m a x (red hues) and T a p p m i n (blue hues) distributions for the inland (a,b) and coastal (c,d) areas of Thessaloniki in the present (2006–2010, orange/light blue), middle (2046–2050, red/blue) and end (2096–2100, dark red/dark blue) of the 21st century.
Sustainability 16 01072 g005
Figure 6. Spatial distribution of average hot season daily T a p p m a x (a,c,e) and T a p p m i n (b,d,f) in the greater Thessaloniki area for the periods 2006–2010 (a,b), 2046–2050 (c,d) and 2096–2100 (e,f).
Sustainability 16 01072 g006
Figure 7. Spatial distribution of the HWF (a,c,e) and HWN (b,d,f) indices in the greater Thessaloniki area for the periods 2006–2010 (a,b), 2046–2050 (c,d) and 2096–2100 (e,f).
Sustainability 16 01072 g007
Figure 8. Distributions of daily RR based on daily T a p p m a x (red) and T a p p m i n (blue) during heat wave days for the inland (a,c) and coastal (b,d) areas of Thessaloniki in the present (2006–2010, orange/light blue), middle (2046–2050, red/blue) and end (2096–2100, dark red/dark blue) of the 21st century.
Sustainability 16 01072 g008
Table 1. The heat wave frequency, duration and intensity indices used in this study.
AspectIndexDescriptionUnit
FrequencyHWFAnnual sum of HW days that participate in HW episodesdays/year
HWNAnnual number of HW episodesepisodes/year
DurationHWDMean duration of HW episodes in a 5-year perioddays
HWDmThe duration of the longest HW episode in a 5-year perioddays
IntensityHWIThe average daily mean * apparent temperature of all HW days in a 5-year period°C
HWAThe daily mean * apparent temperature of the hottest HW day in a 5-year period°C
* The daily mean apparent temperature is derived by averaging the corresponding daily maximum and minimum values.
Table 2. Hot season daily T a p p m a x and T a p p m i n means and standard deviations for the inland and coastal areas of Thessaloniki in the present (2006–2010), middle (2046–2050) and end (2096–2100) of the 21st century. The final column illustrates the corresponding percentage increases from the reference period to the end of the century.
2006–20102046–20502096–2100Increase%
InlandCoastalInlandCoastalInlandCoastalInlandCoastal
T a p p m a x (°C)Mean26.526.827.527.730.630.715.514.6
St. D.4.03.94.24.24.34.27.57.7
T a p p m i n (°C)Mean18.519.219.520.122.723.322.721.3
St. D.3.73.54.13.94.13.910.811.4
Table 3. Heat wave indices for the inland and coastal areas of Thessaloniki in the present (2006–2010), middle (2046–2050) and end (2096–2100) of the 21st century.
2006–20102046–20502096–2100
IndexInlandCoastalInlandCoastalInlandCoastal
HWF (days/year)7.67.815.819.660.460.8
HWN (episodes/year)1.82.03.86.29.09.0
HWD (days)4.23.94.23.26.76.8
HWDm (days)7.07.010.08.033.029.0
HWI (°C)29.028.929.128.929.930.1
HWA (°C)32.232.231.832.135.736.4
Table 4. Relative risk based on T a p p m a x and T a p p m i n and corresponding 95% Confidence Intervals (CIs) for the inland and coastal areas of Thessaloniki in the present (2006–2010), middle (2046–2050) and end (2096–2100) of the 21st century. The final column illustrates the corresponding percentage increases in mean heat wave day RR from the reference period to the end of the century.
2006–20102046–20502096–2100Increase%
InlandCoastalInlandCoastalInlandCoastalInlandCoastal
RR( T a p p m a x )Mean1.111.111.101.101.171.175.45.4
95% CI(1.01–1.24)(1.01–1.24)(1.00–1.22)(1.00–1.22)(1.05–1.32)(1.05–1.32)
RR( T a p p m i n )Mean1.161.161.171.181.261.288.610.3
95% CI(1.09–1.22)(1.09–1.22)(1.10–1.24)(1.11–1.24)(1.19–1.37)(1.18–1.35)
Disclaimer/Publisher’s Note: The statements, opinions and data contained in all publications are solely those of the individual author(s) and contributor(s) and not of MDPI and/or the editor(s). MDPI and/or the editor(s) disclaim responsibility for any injury to people or property resulting from any ideas, methods, instructions or products referred to in the content.

