


Evaluation of Technological Properties of Mortars with the Addition of Plaster Byproduct
 ,
,  and
and
Abstract
1. Introduction
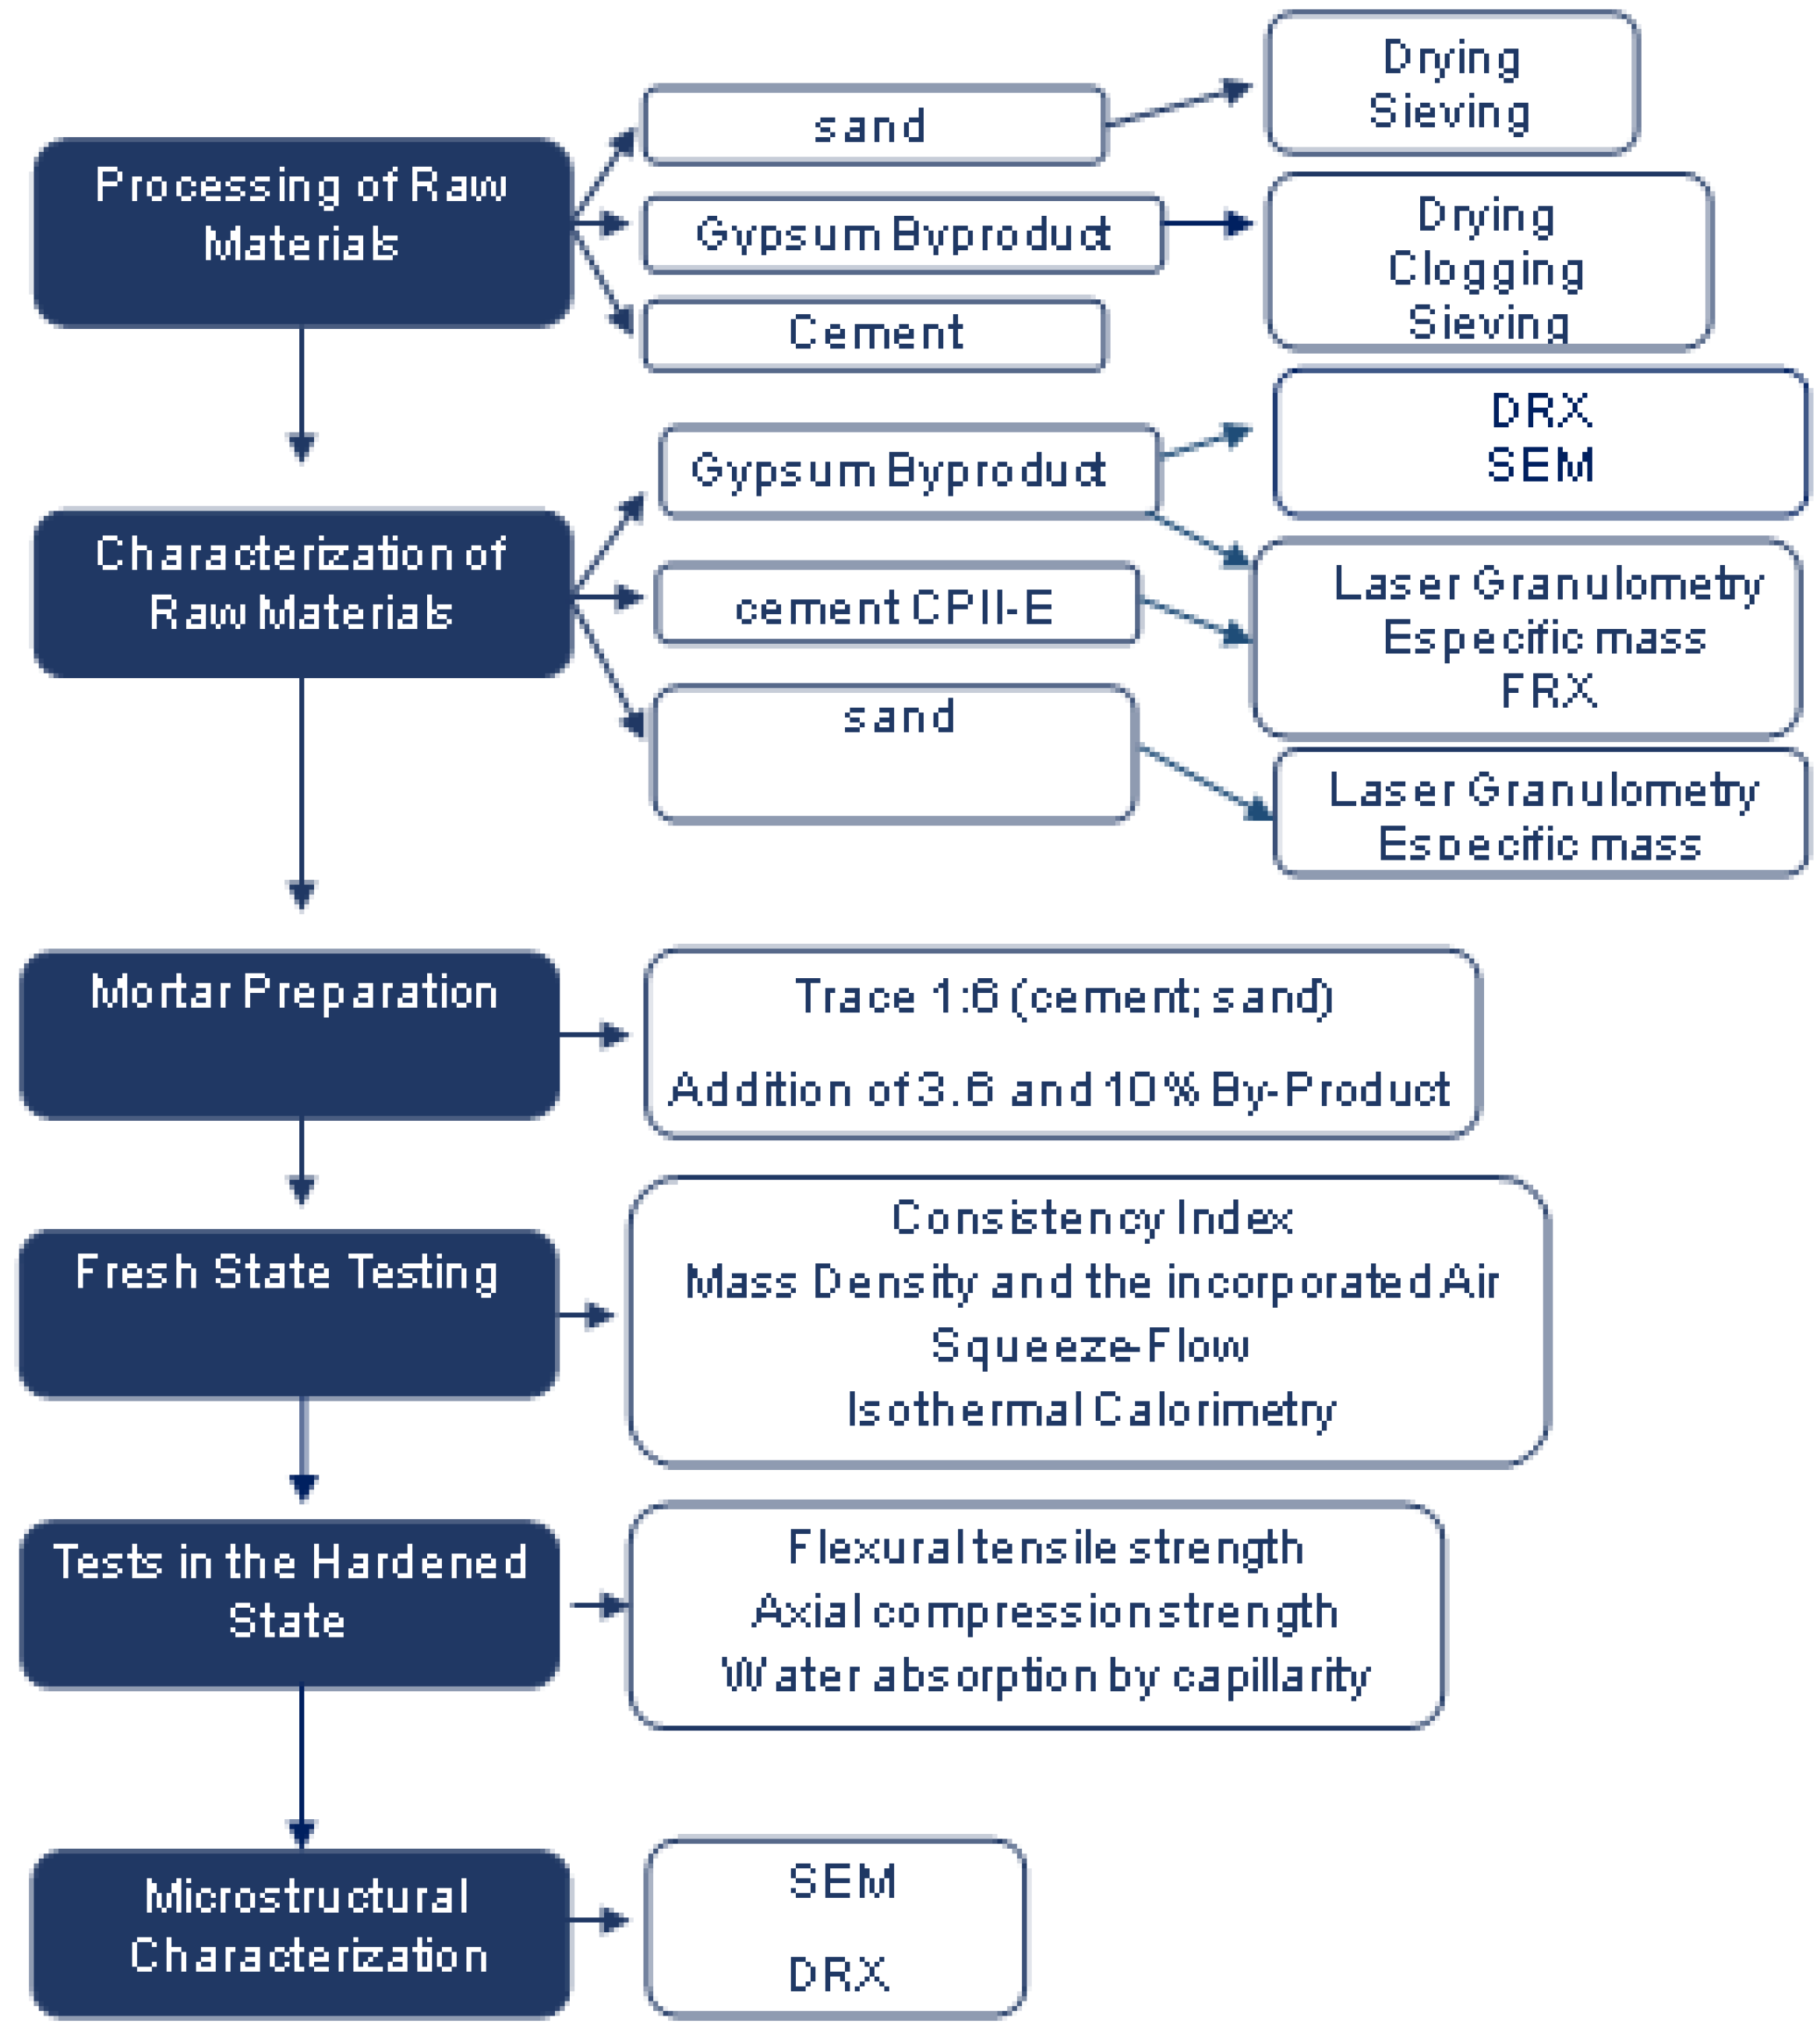
2. Materials and Methods
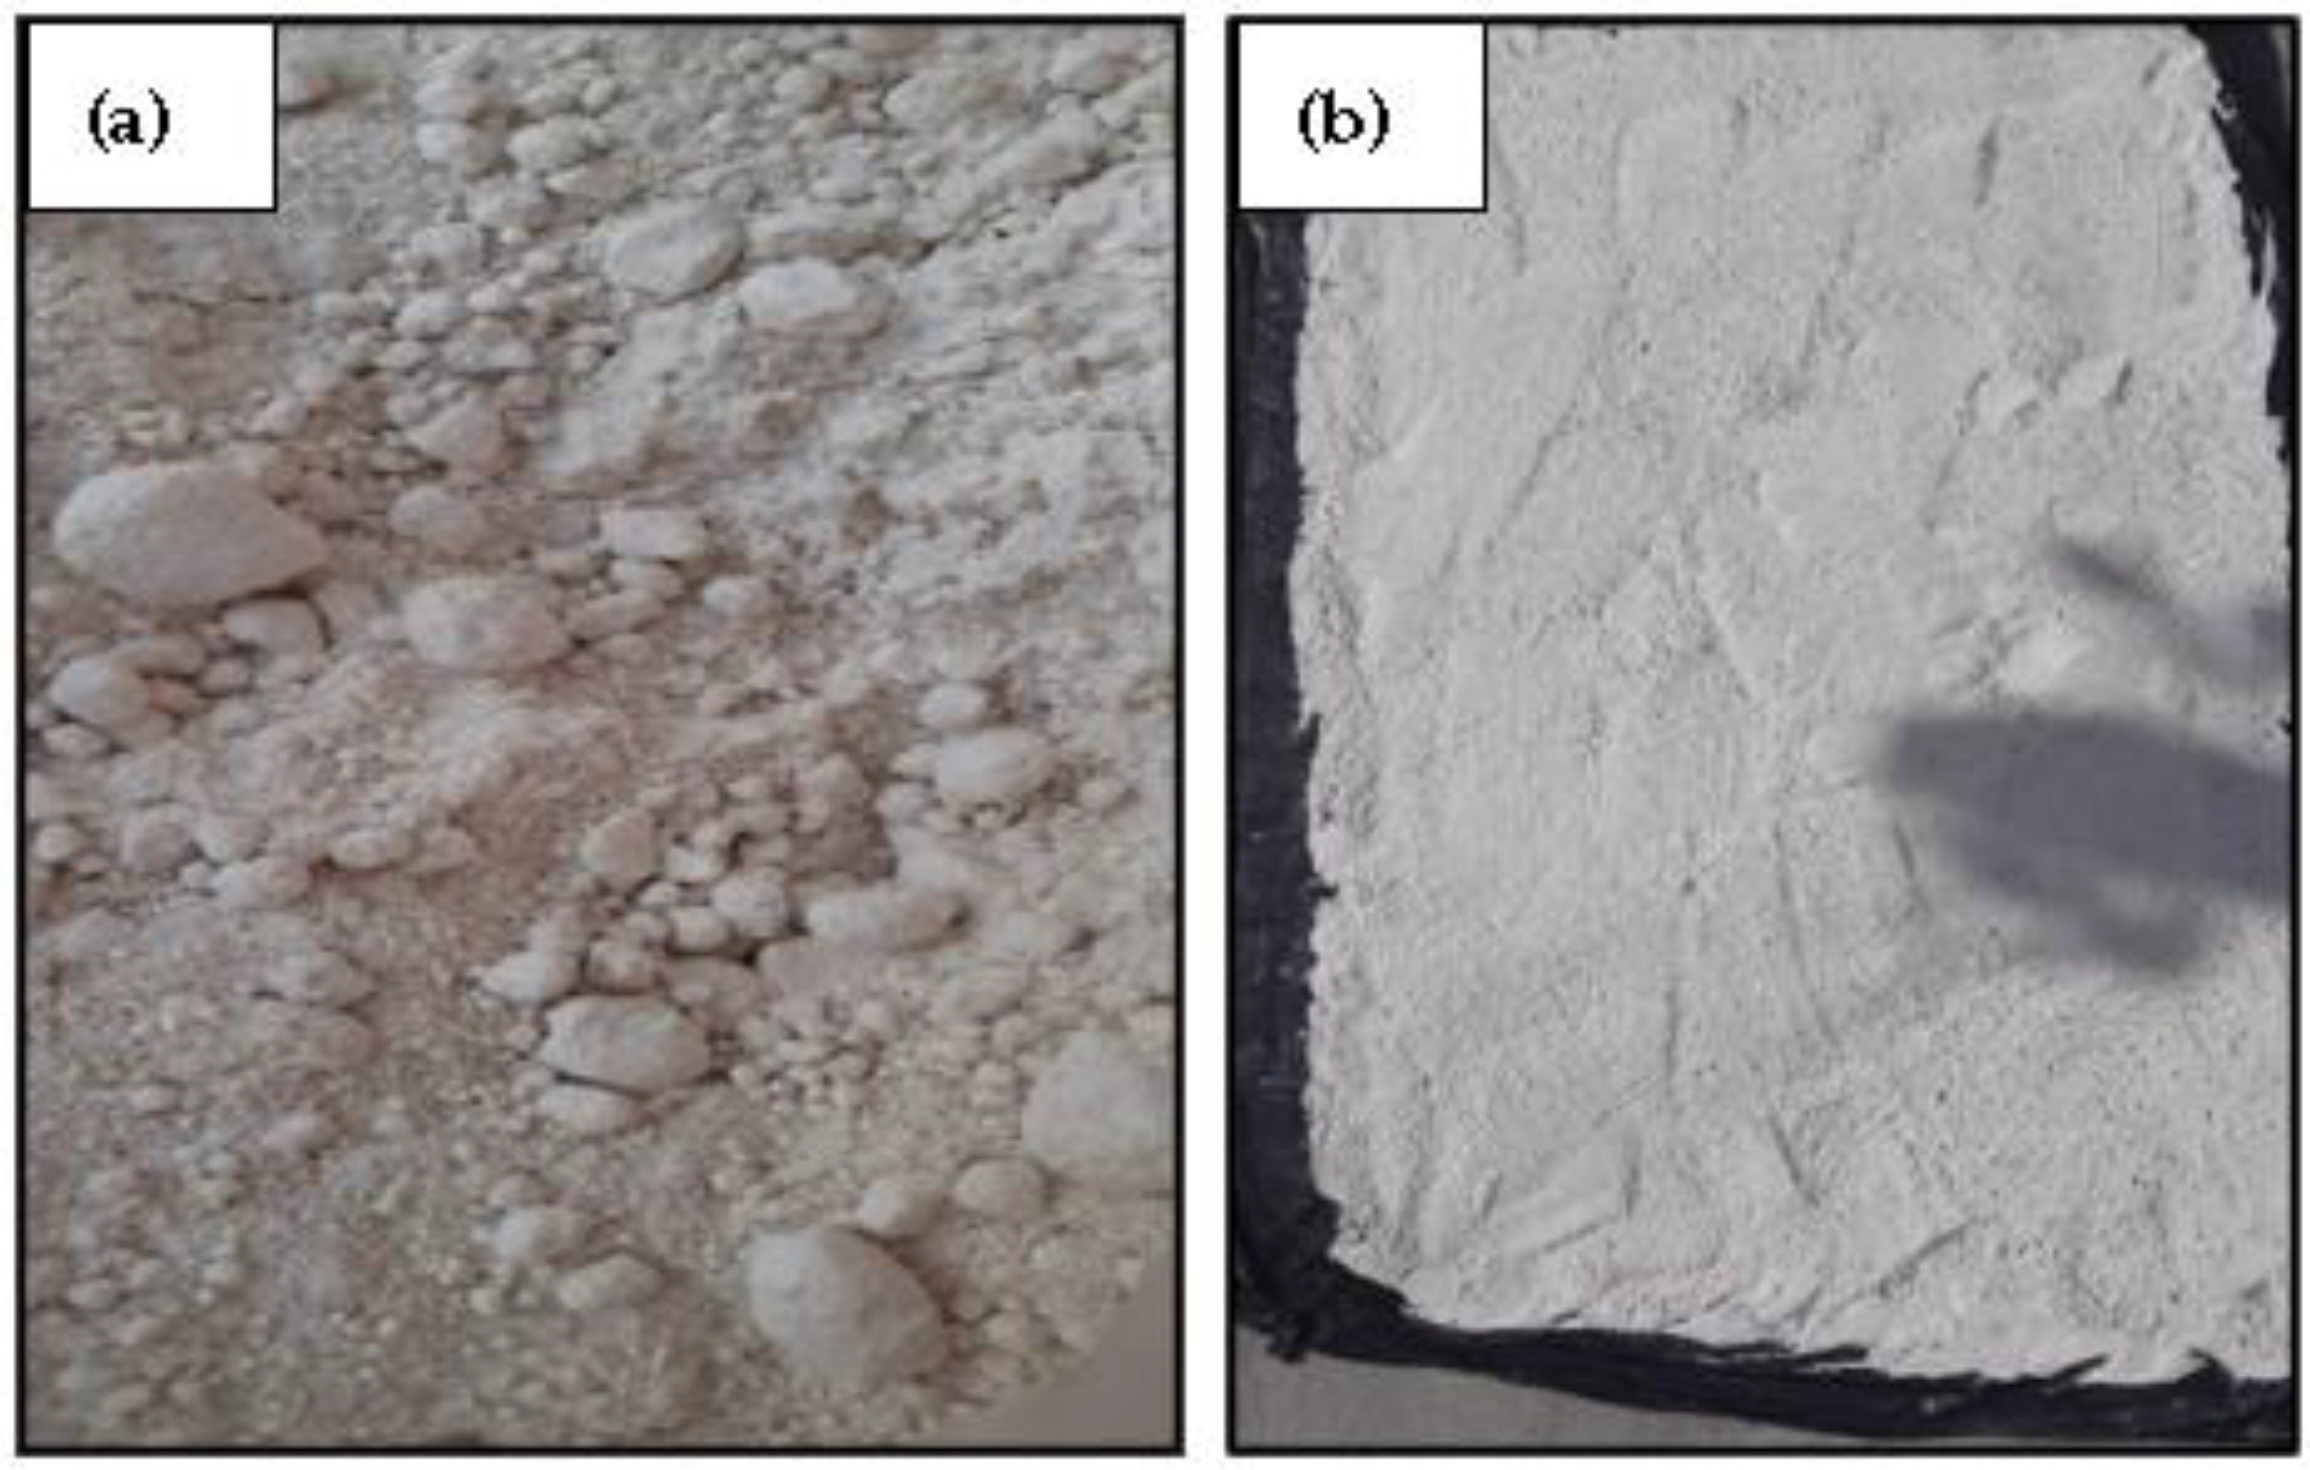
2.1. Raw Material
2.2. Characterization of Raw Materials
2.3. Preparation of the Experimental Mortar
2.4. Tests in the Fresh State
2.5. Tests in the Hardened State
3. Results and Discussions
3.1. Characterization of Materials
- X-ray fluorescence
- X-ray diffraction
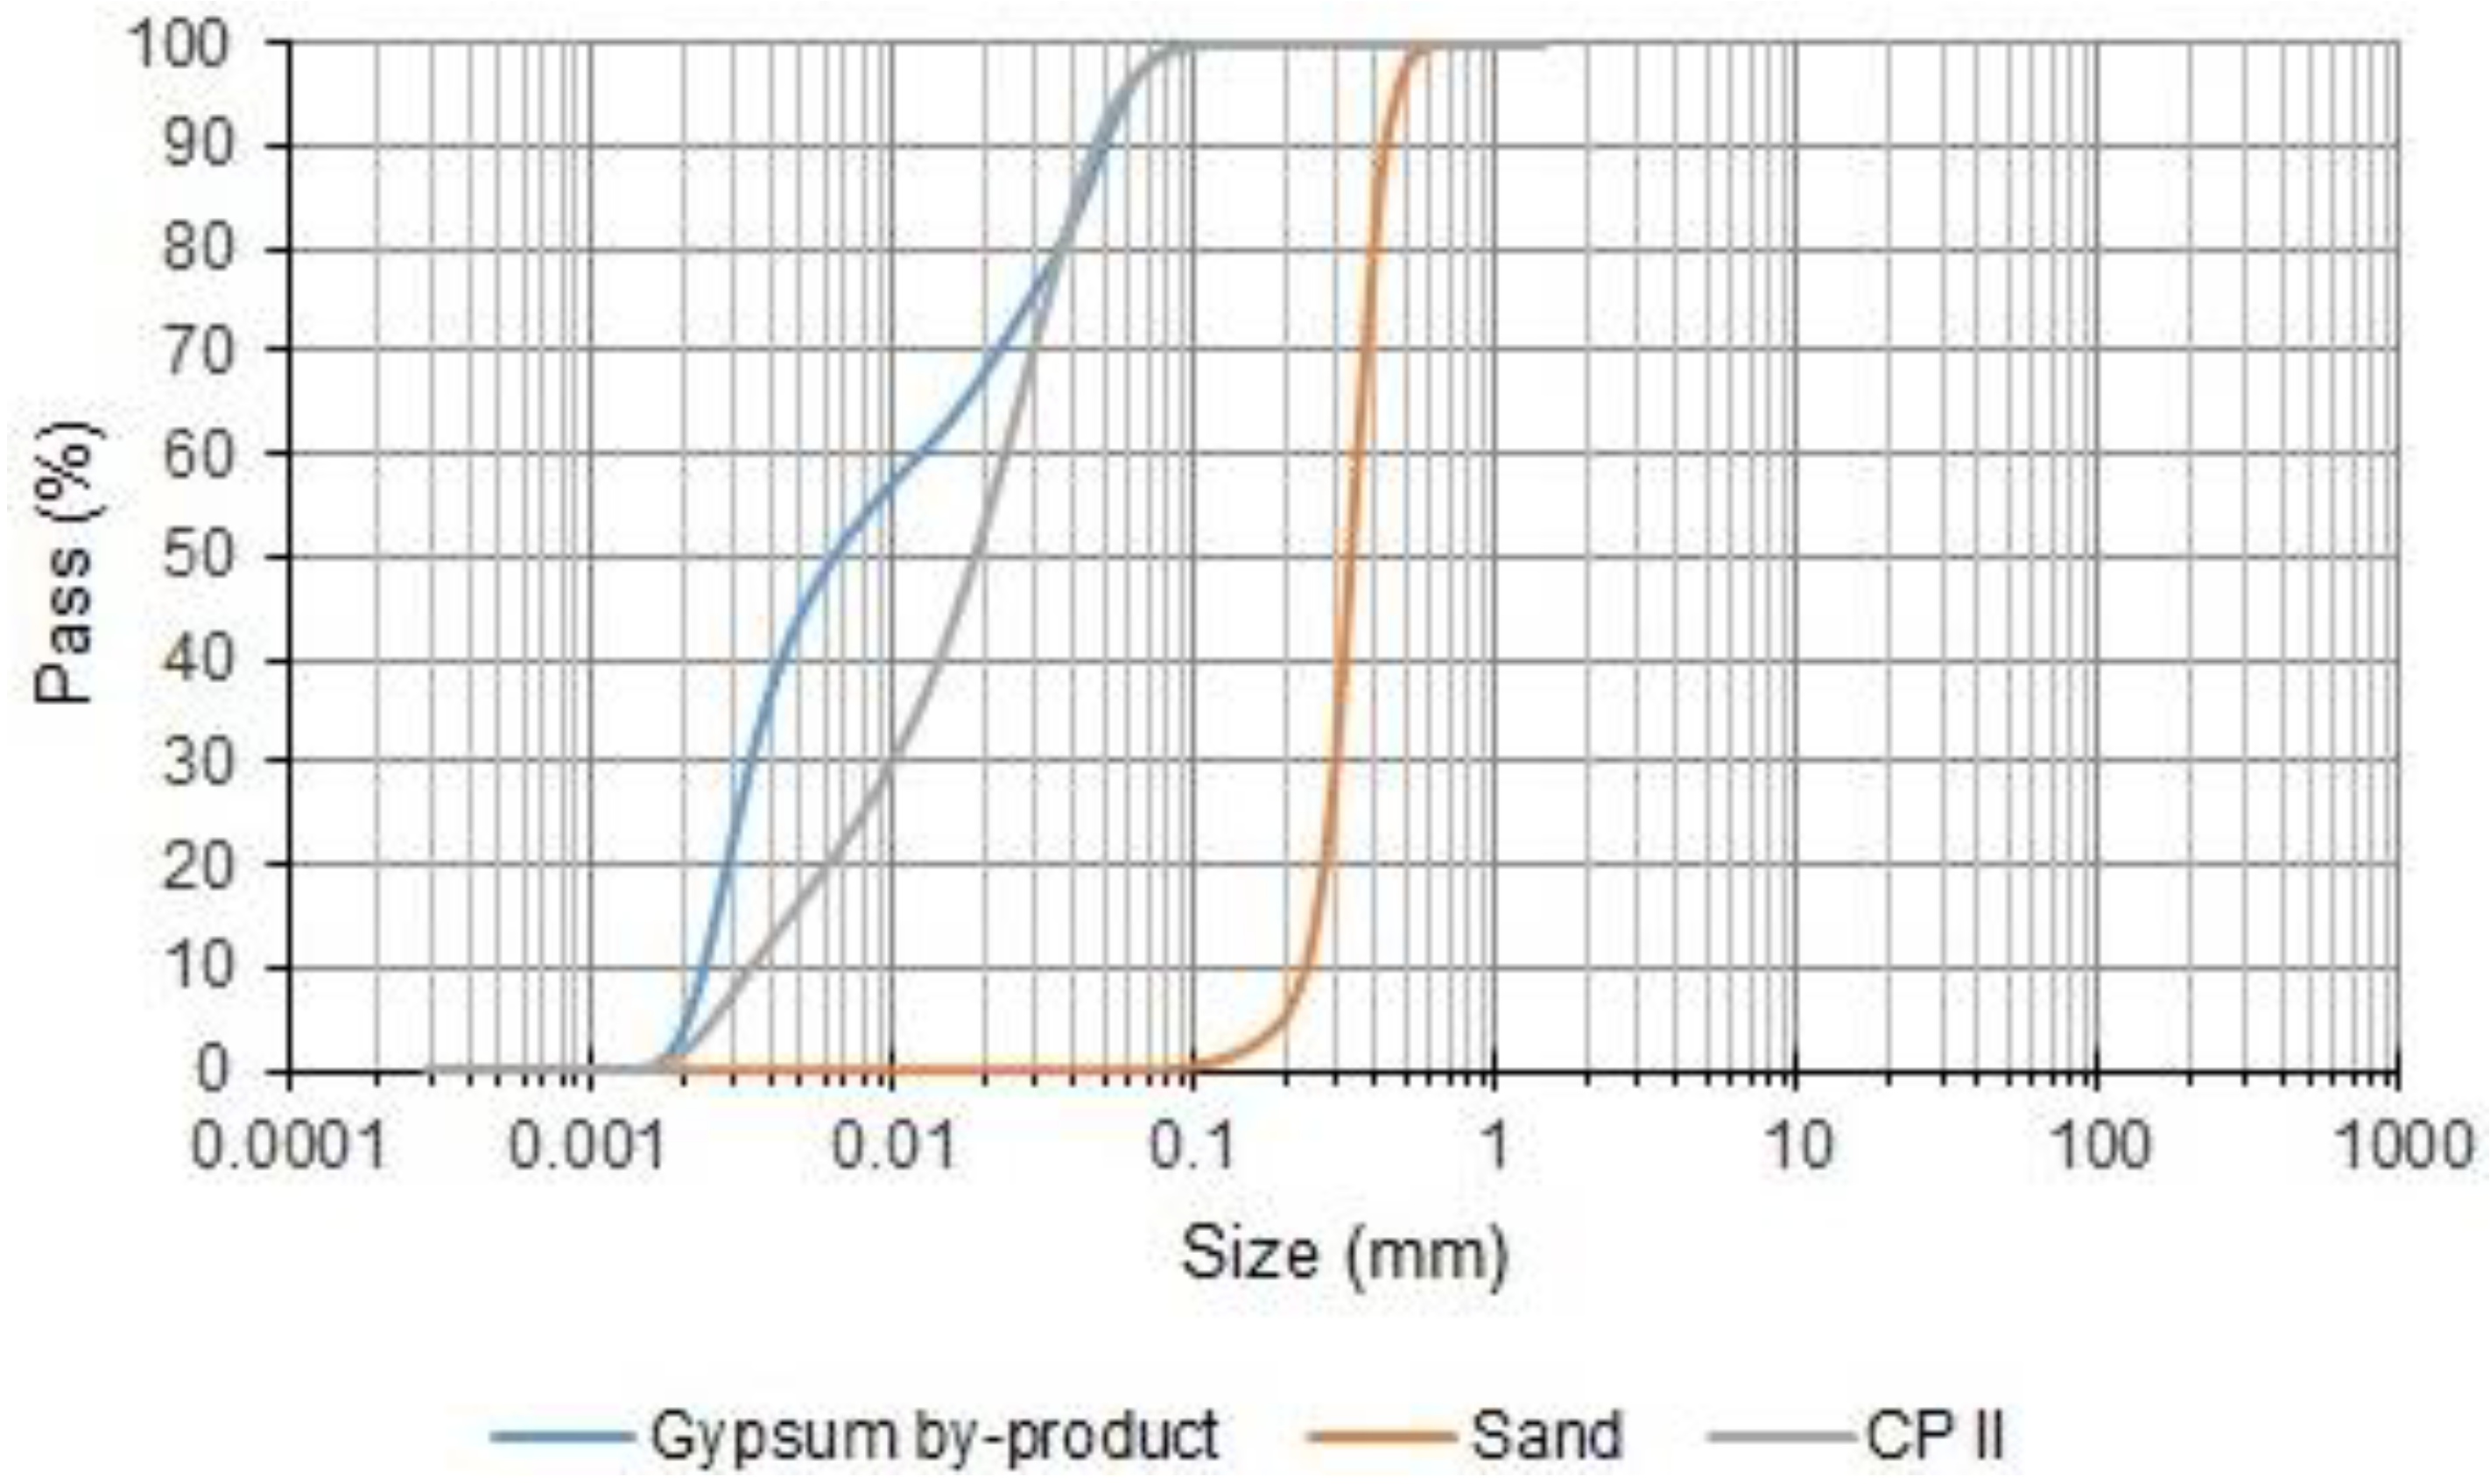
- Granulometric distribution
- Specific mass
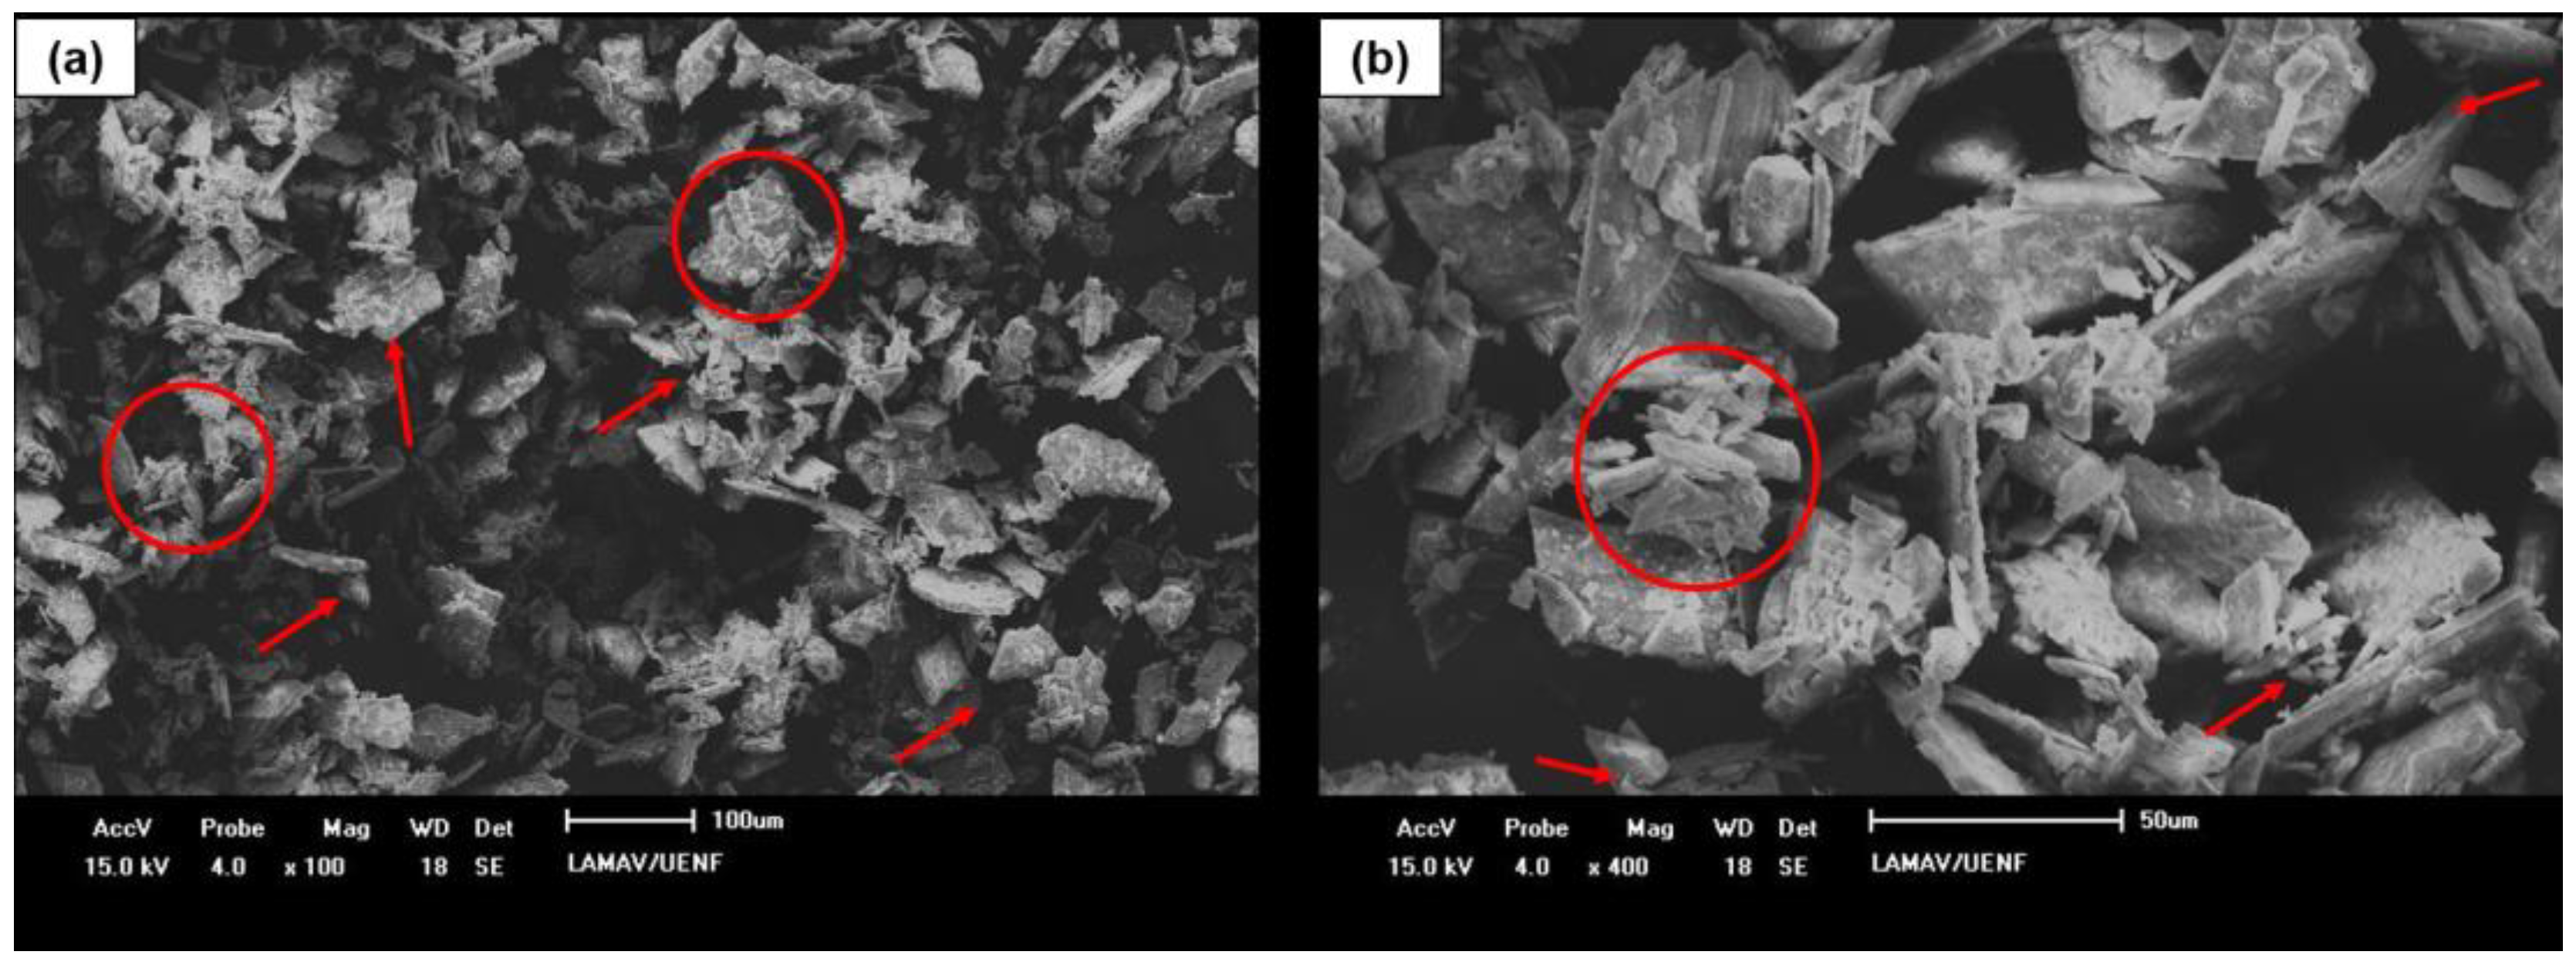
- Scanning electron microscopy (SEM) of byproduct gypsum
3.2. Tests Results in the Fresh State
- Consistency index
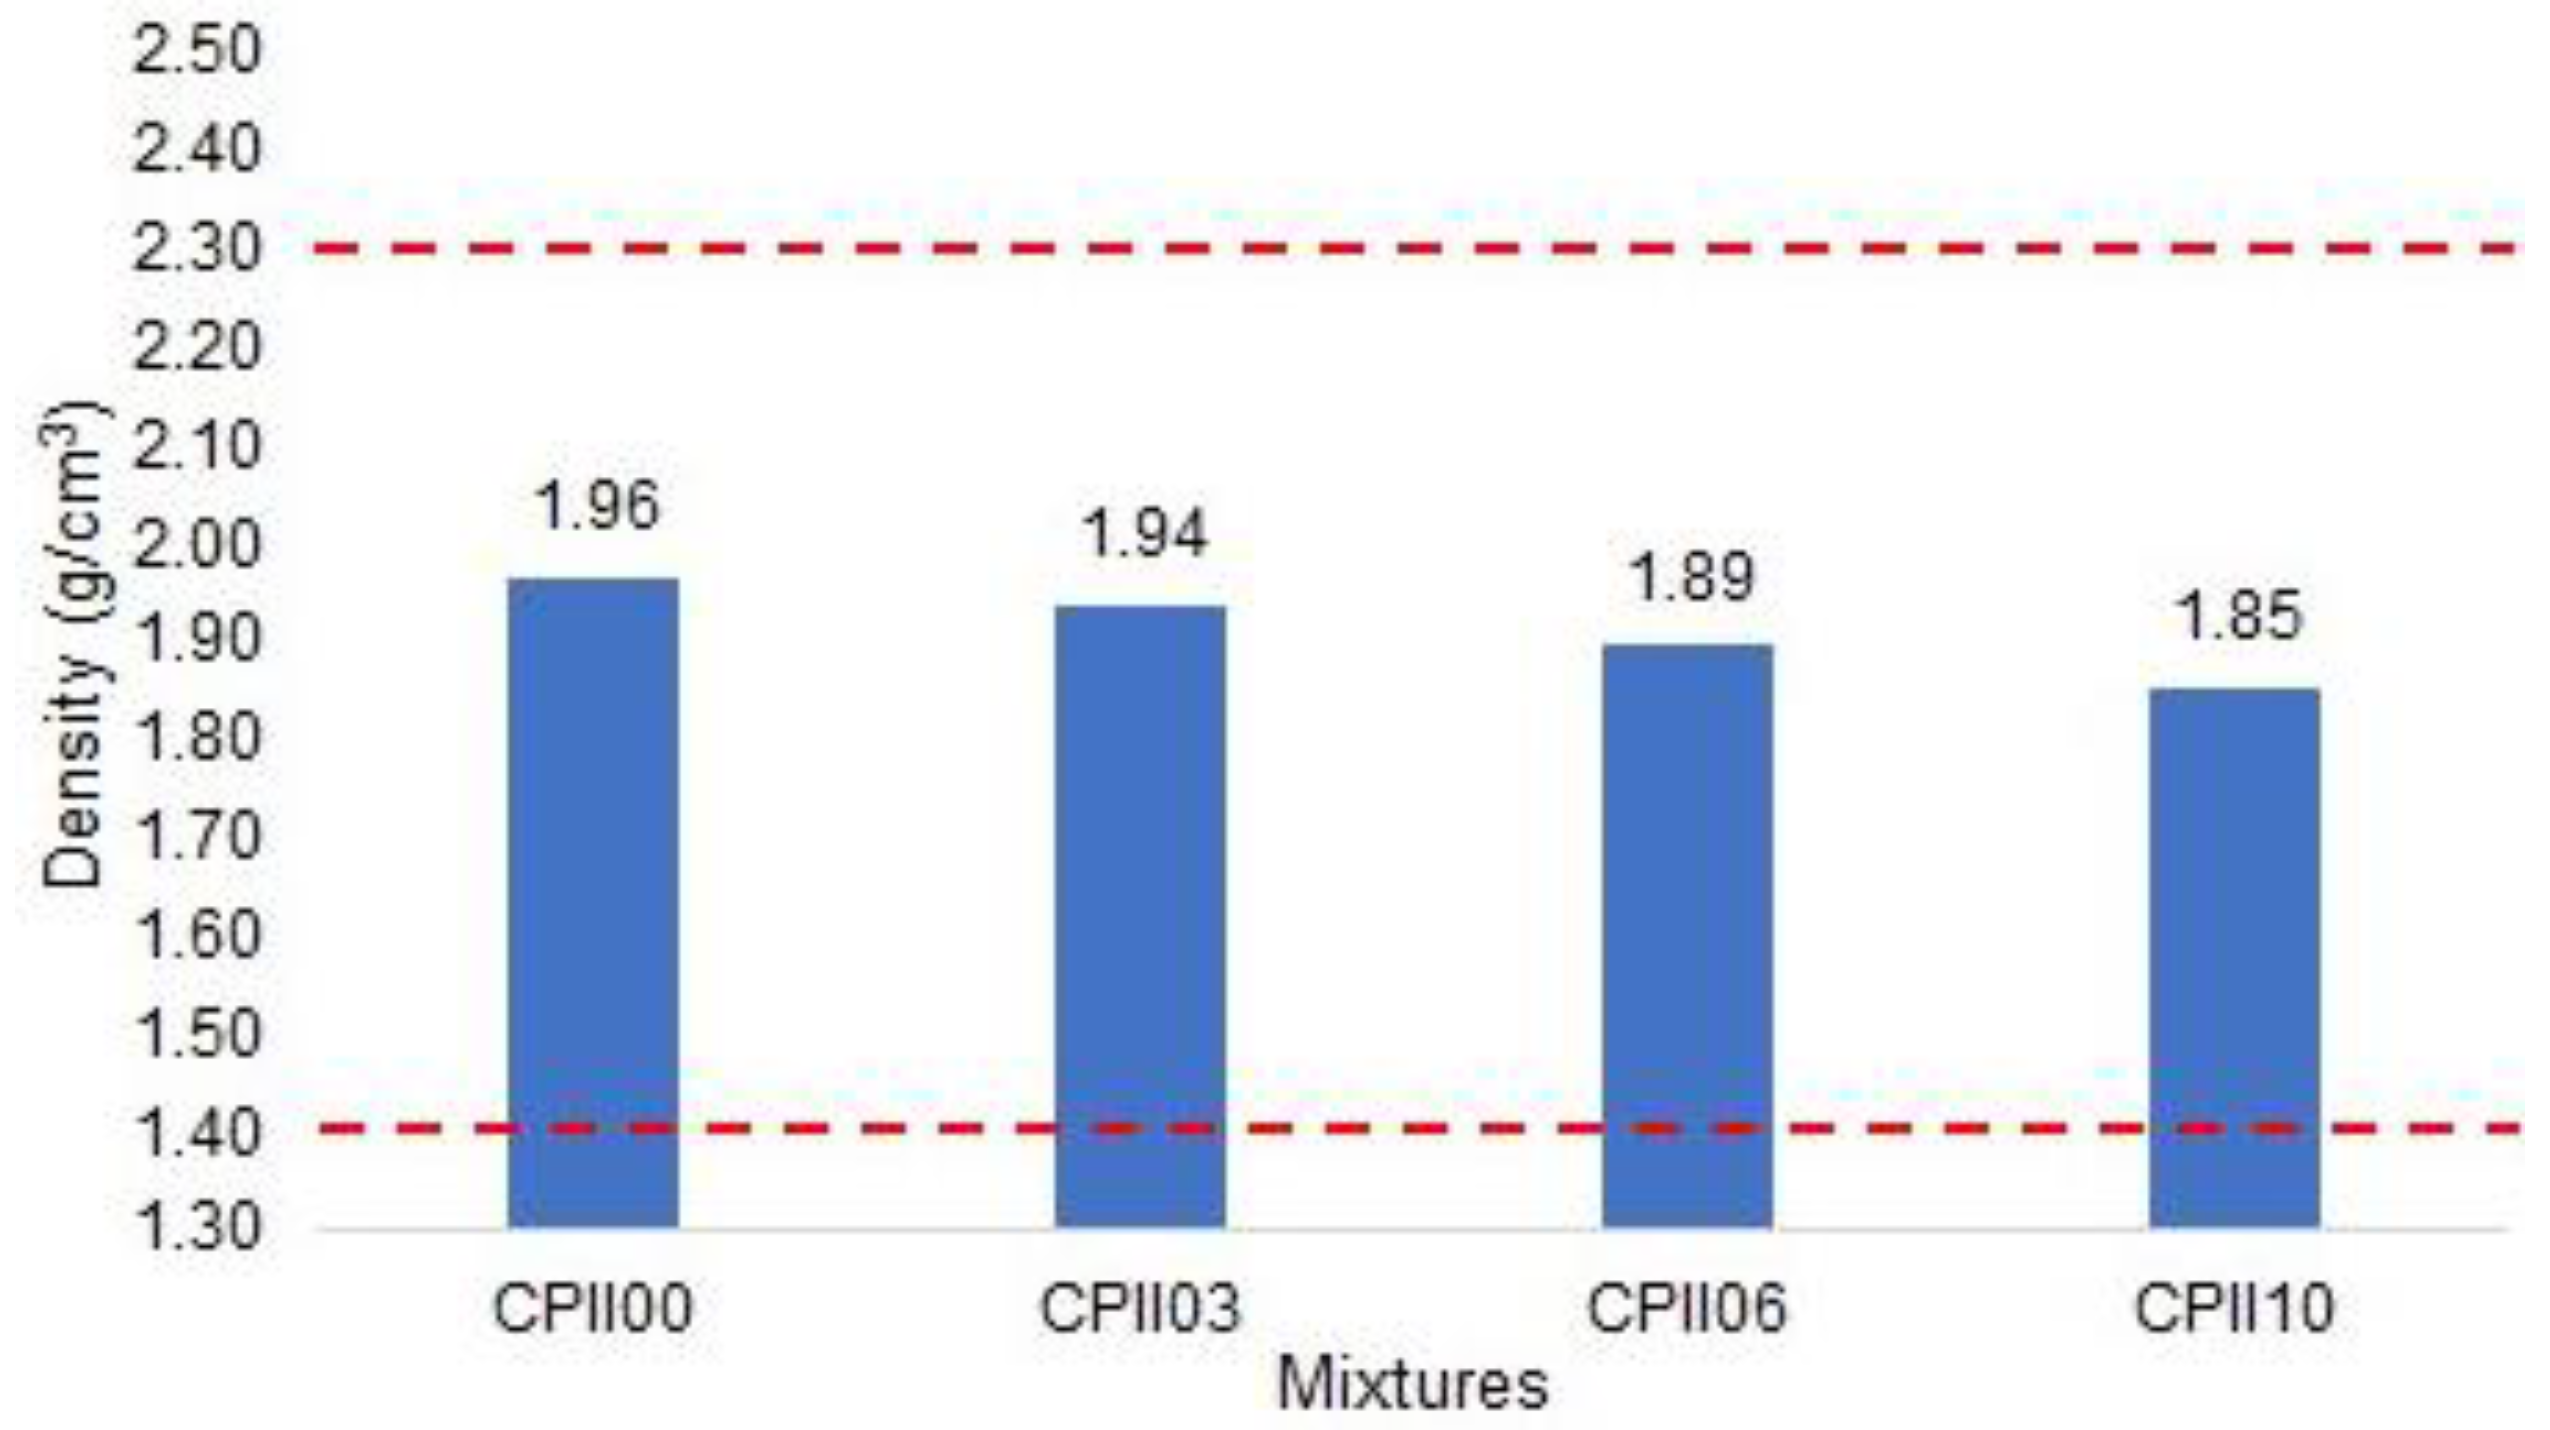
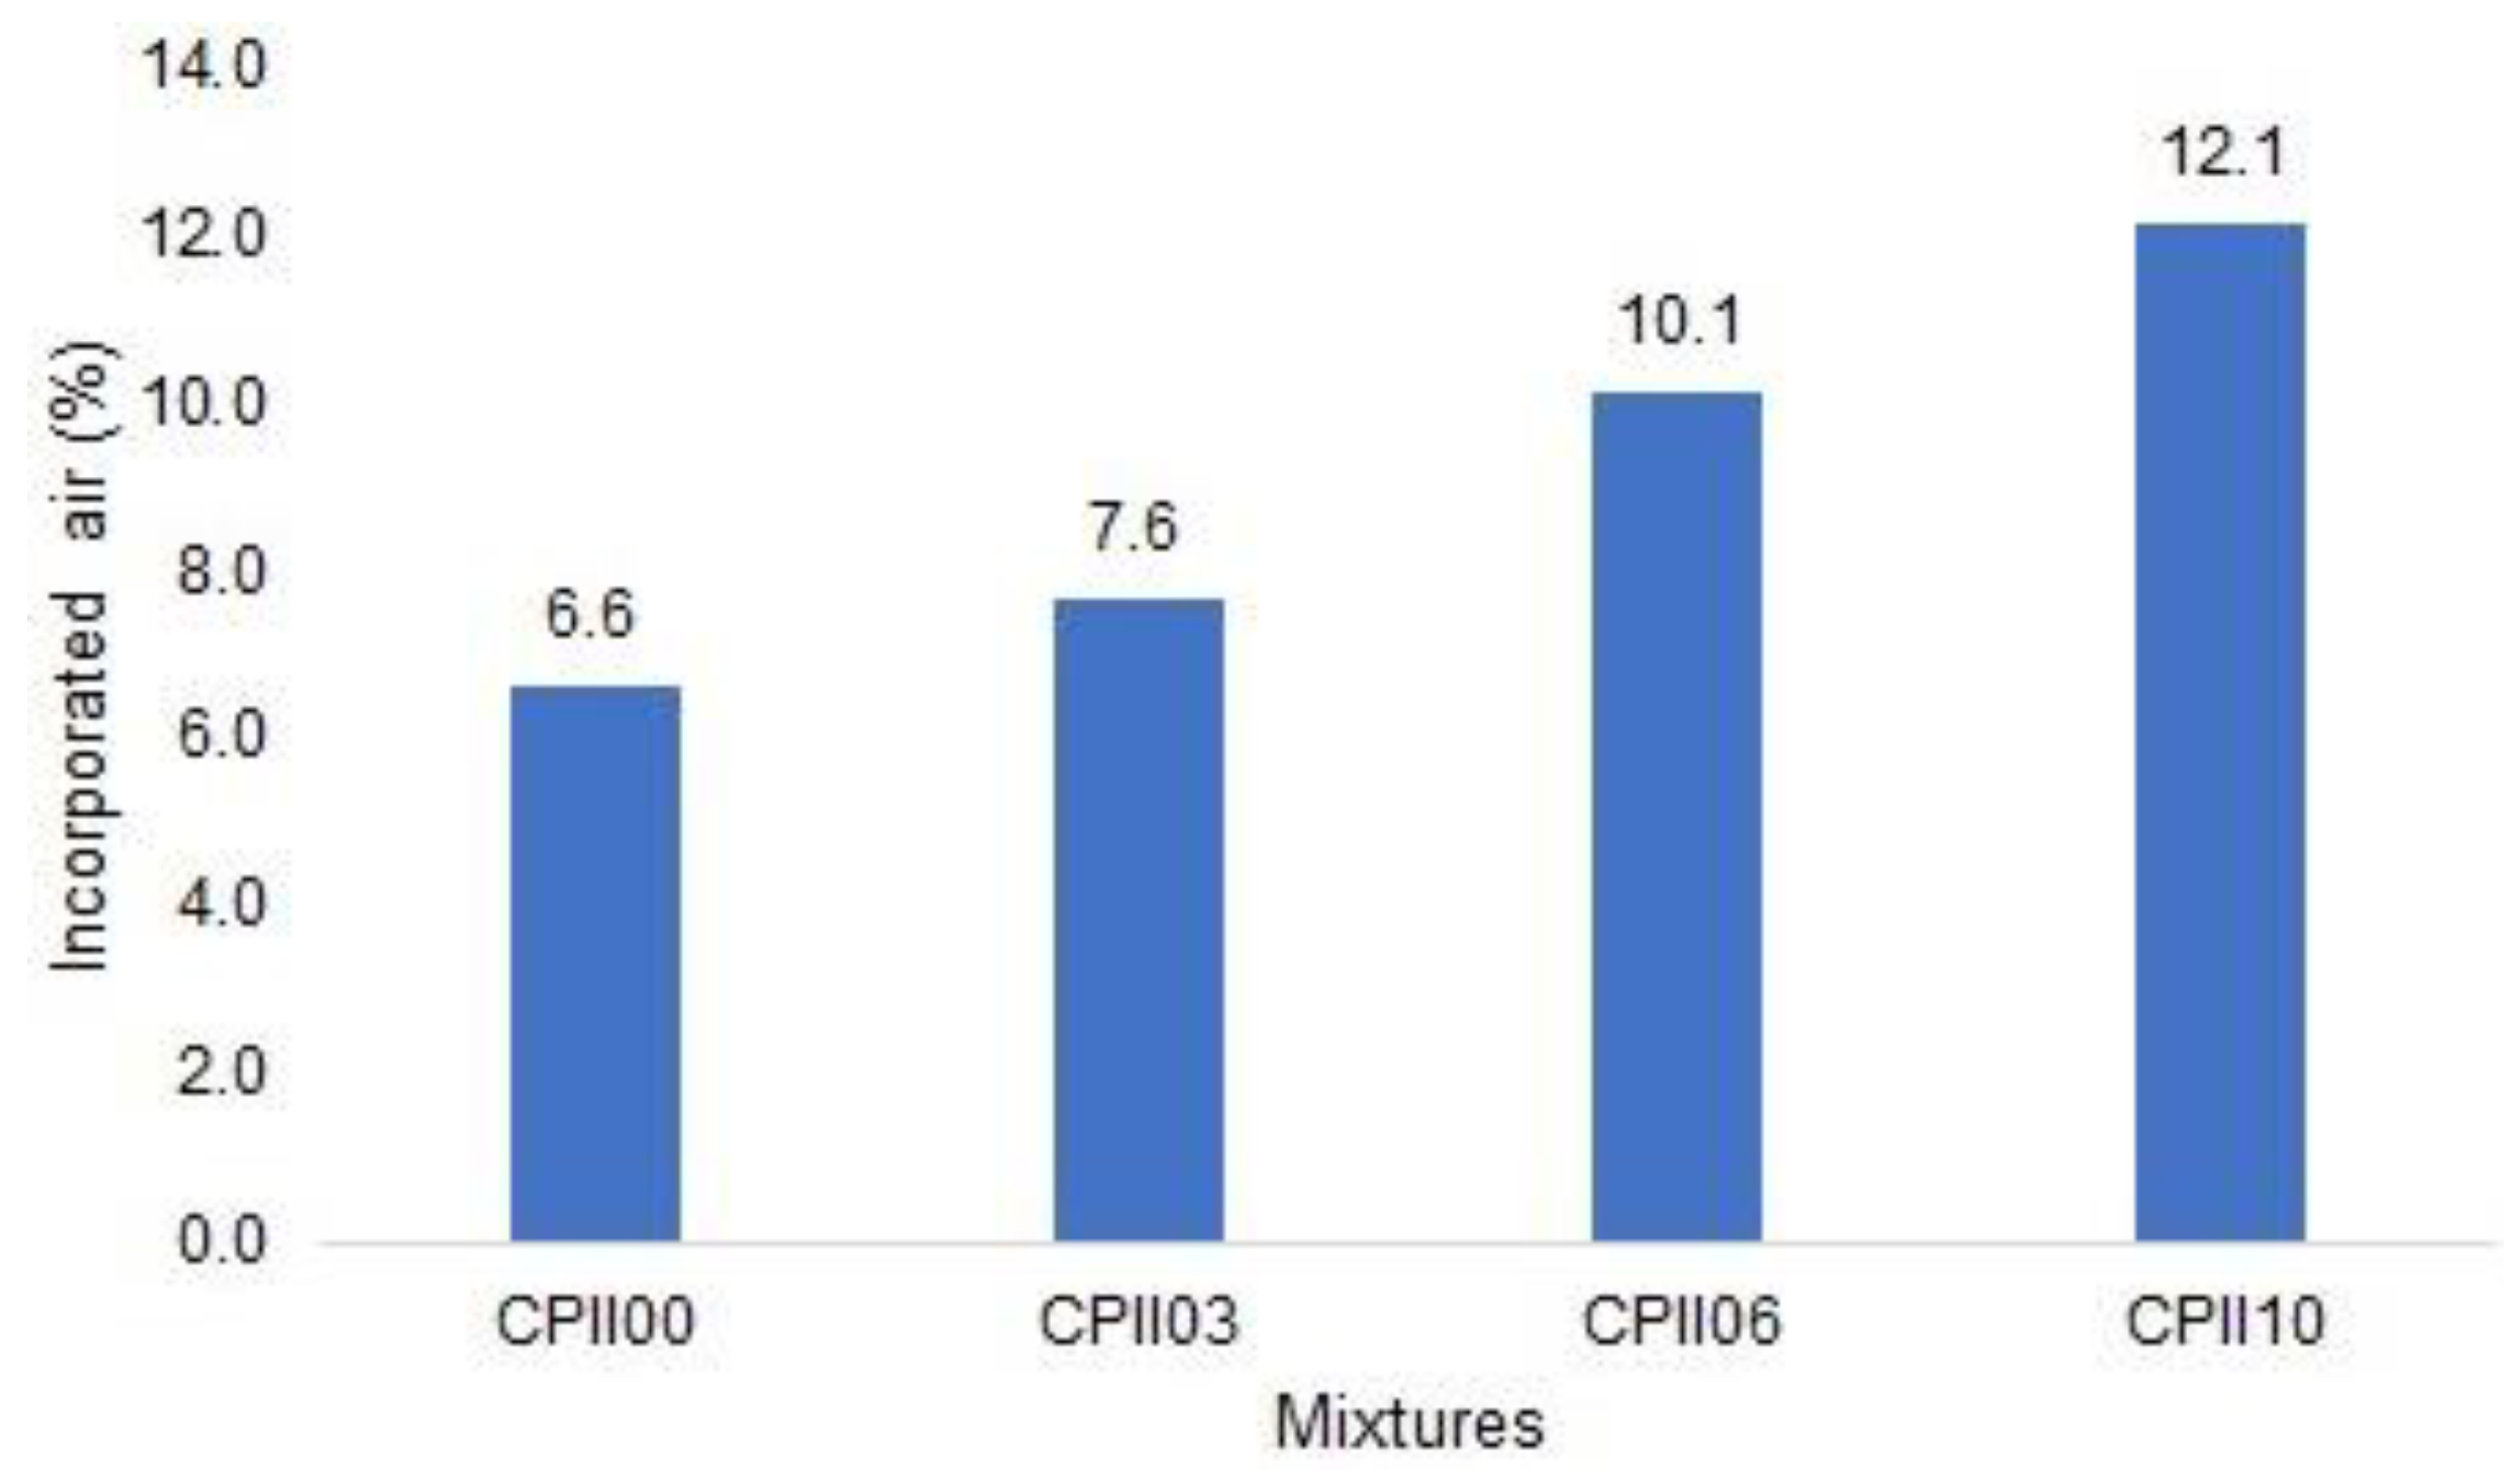
- Fresh mass density and incorporated air content
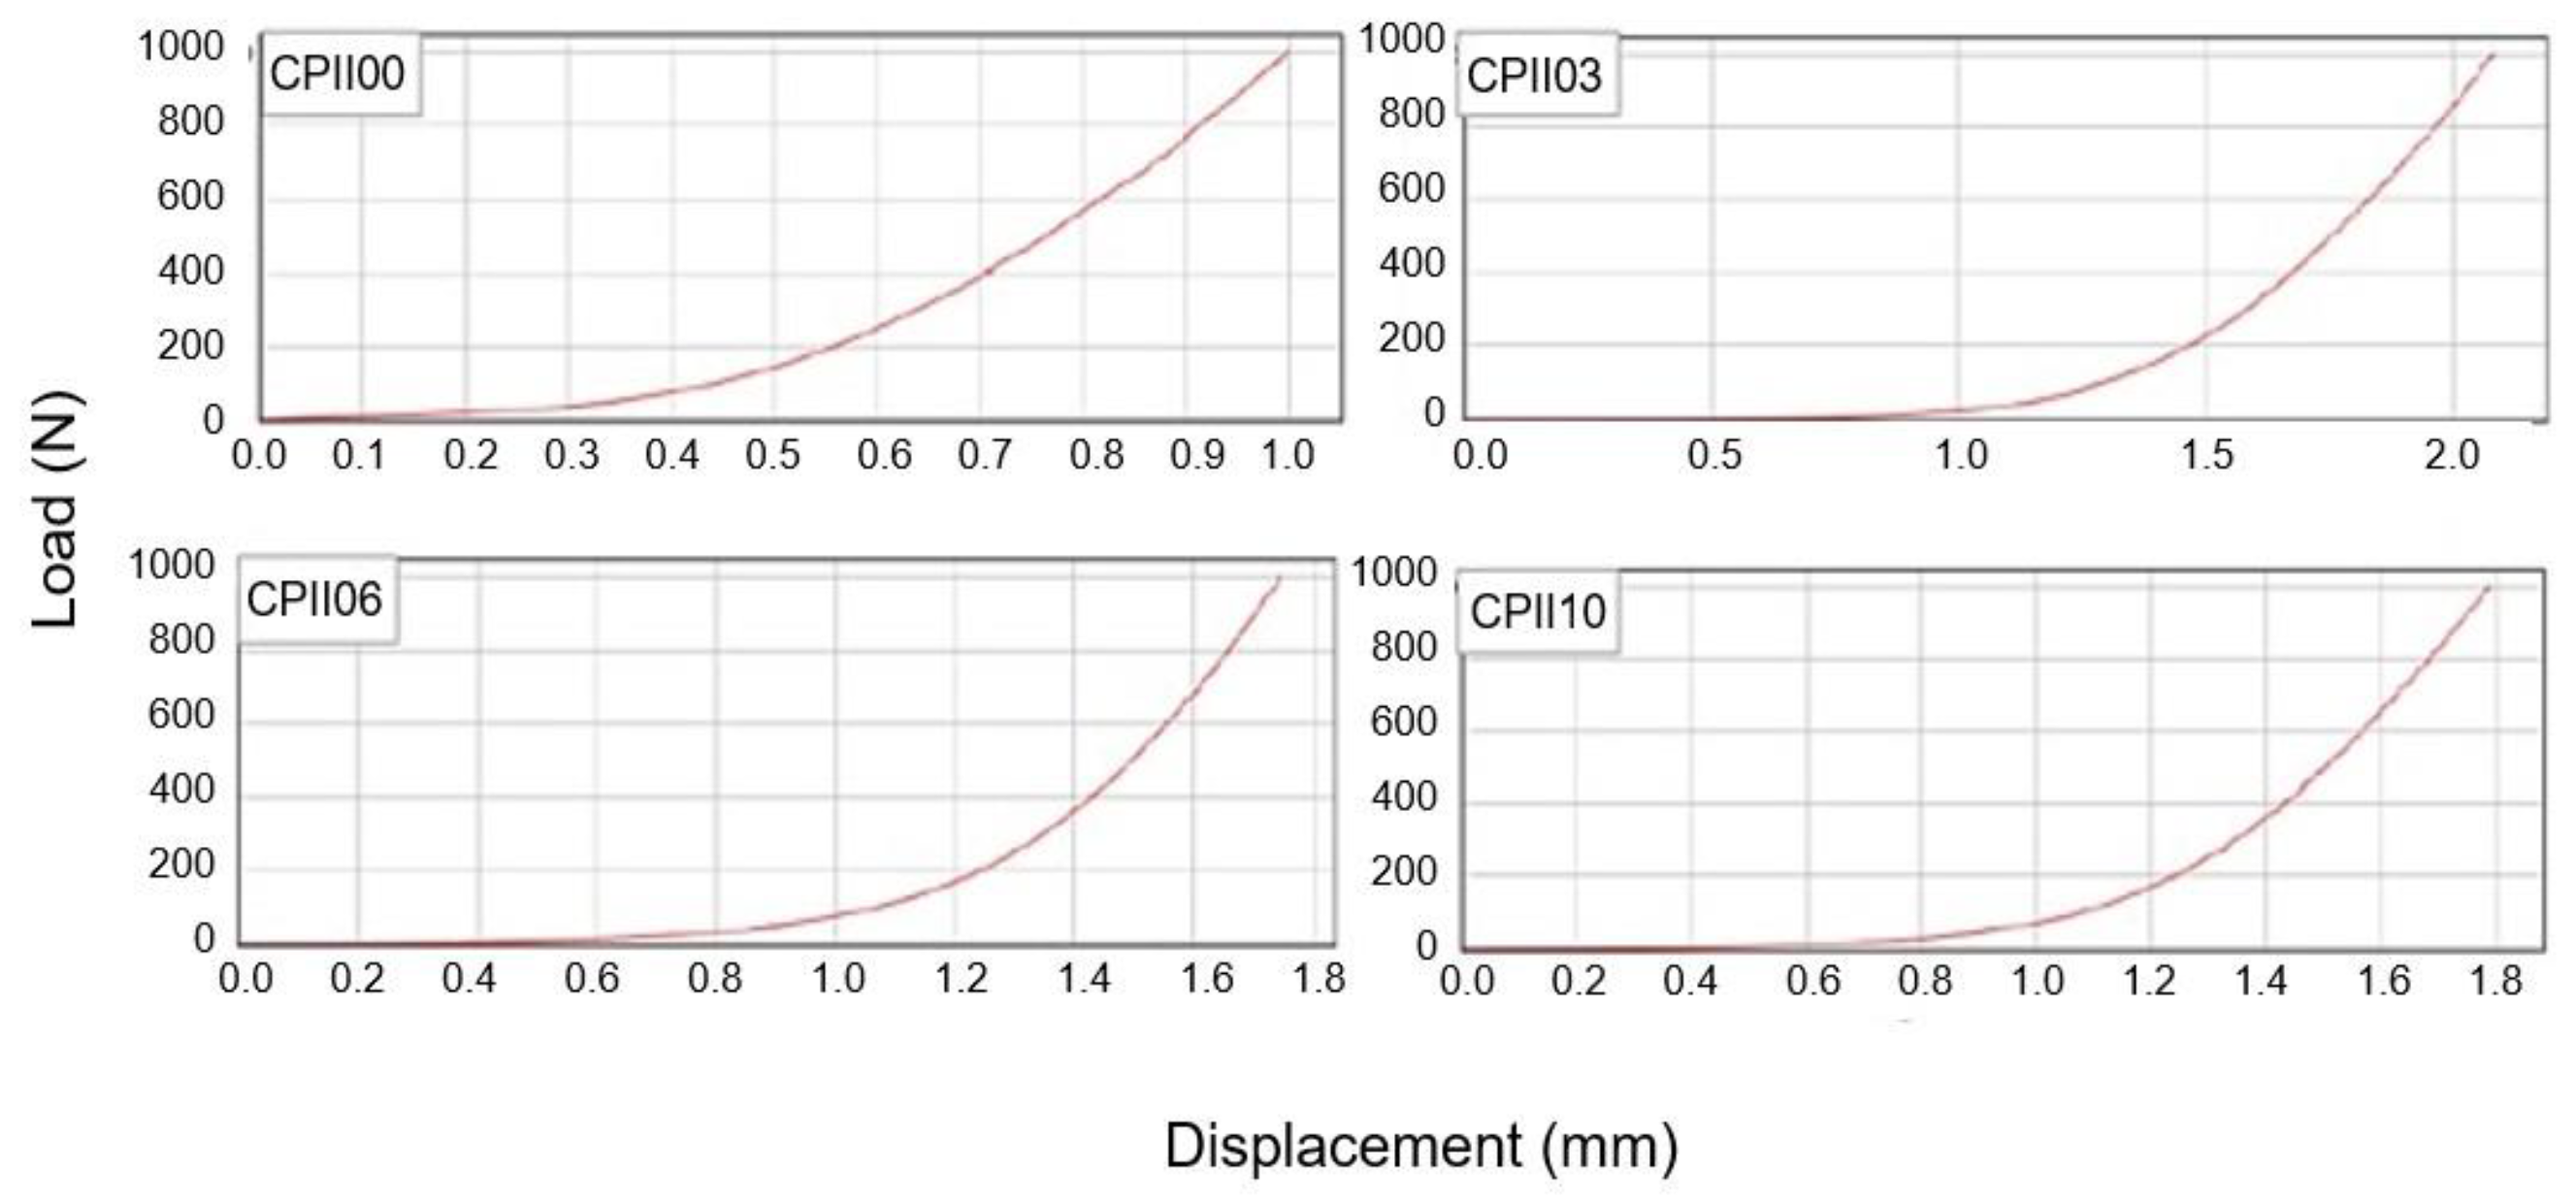
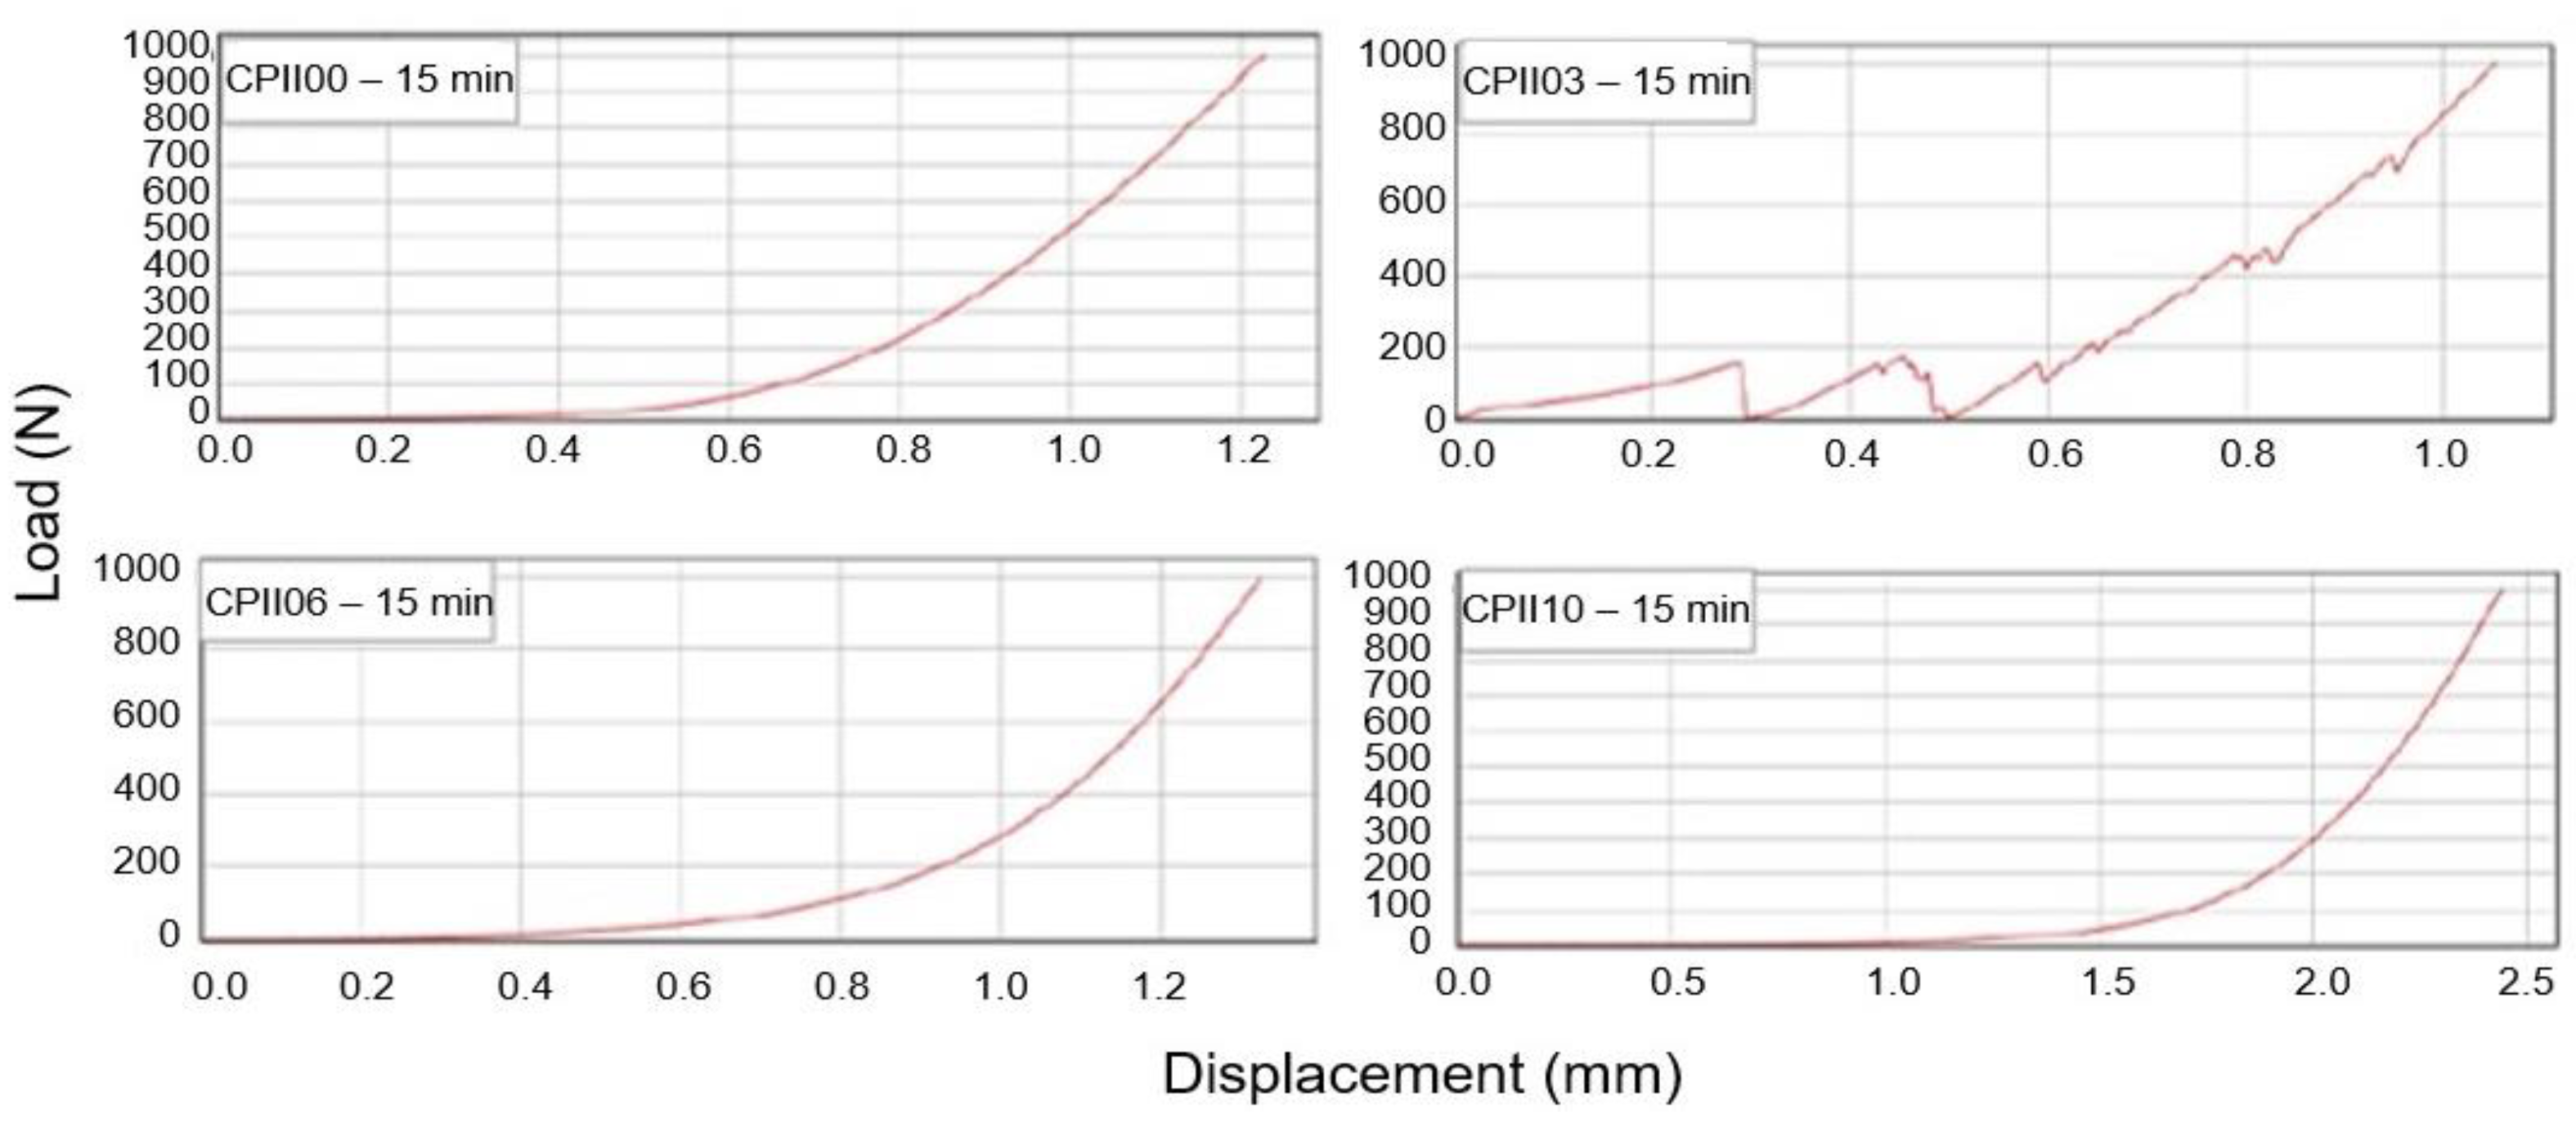
- Rheological characterization: squeeze flow method
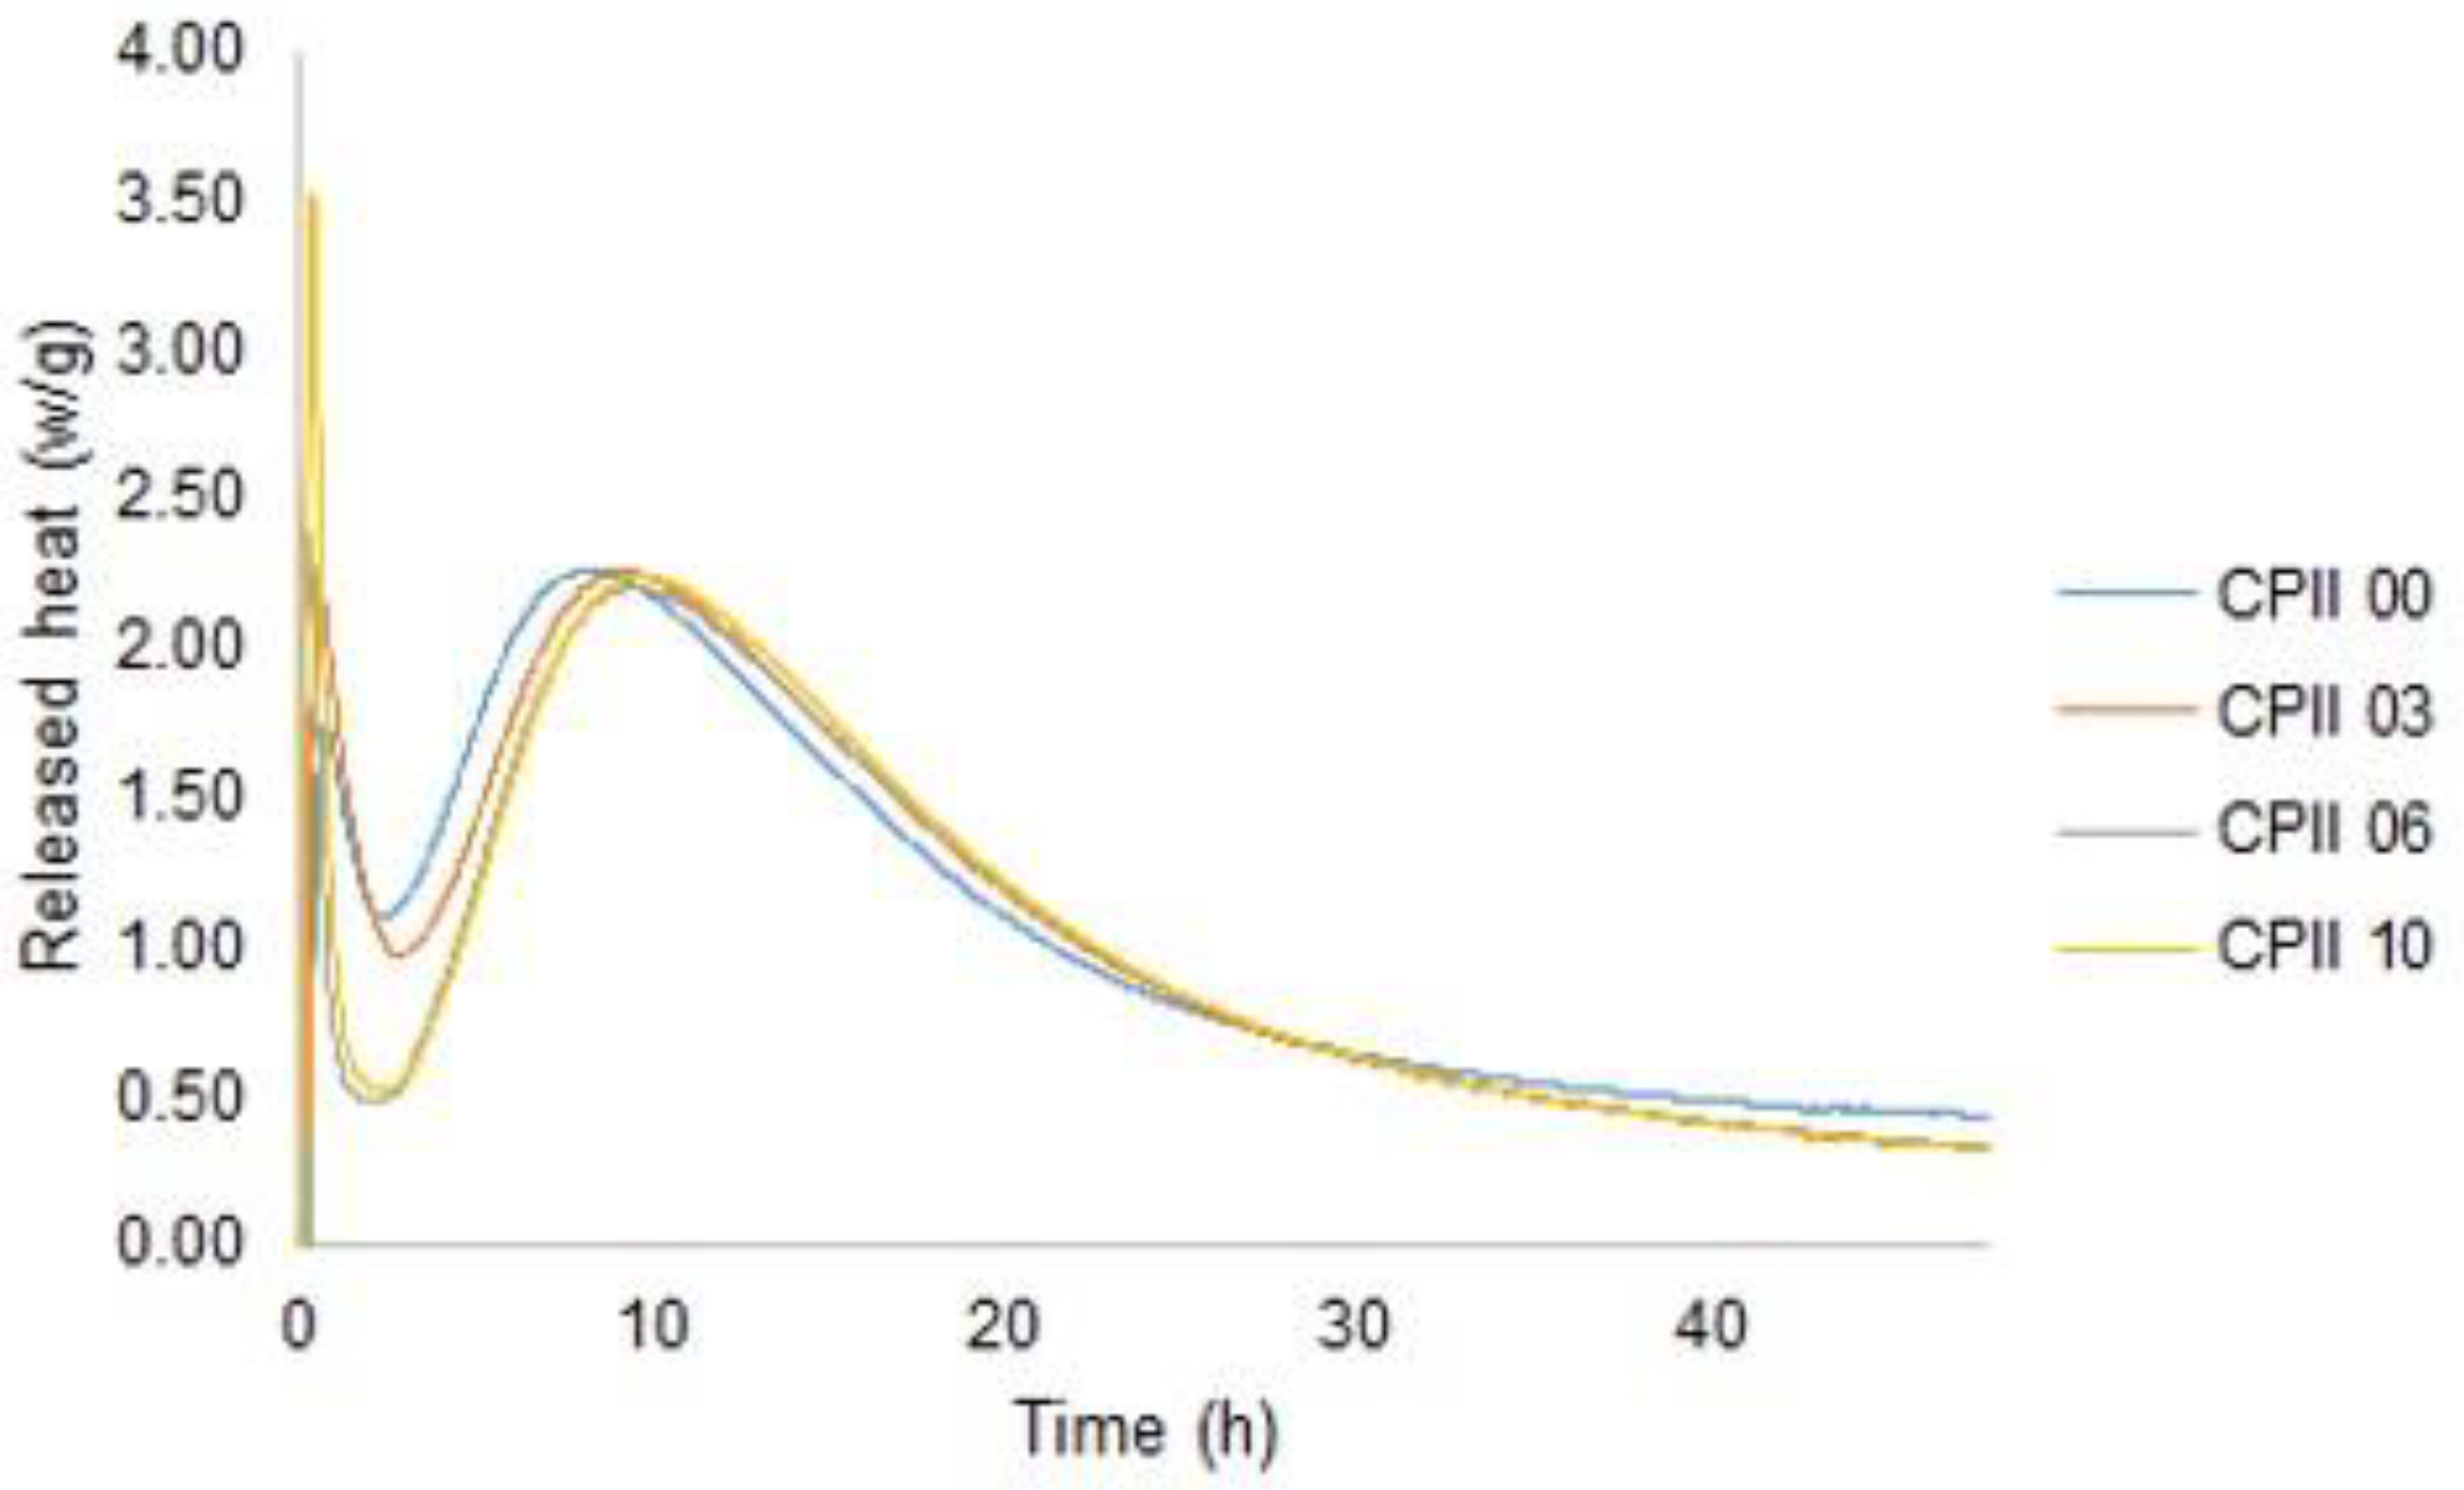
- Isothermal calorimetry
3.3. Test Results in the Hardened State
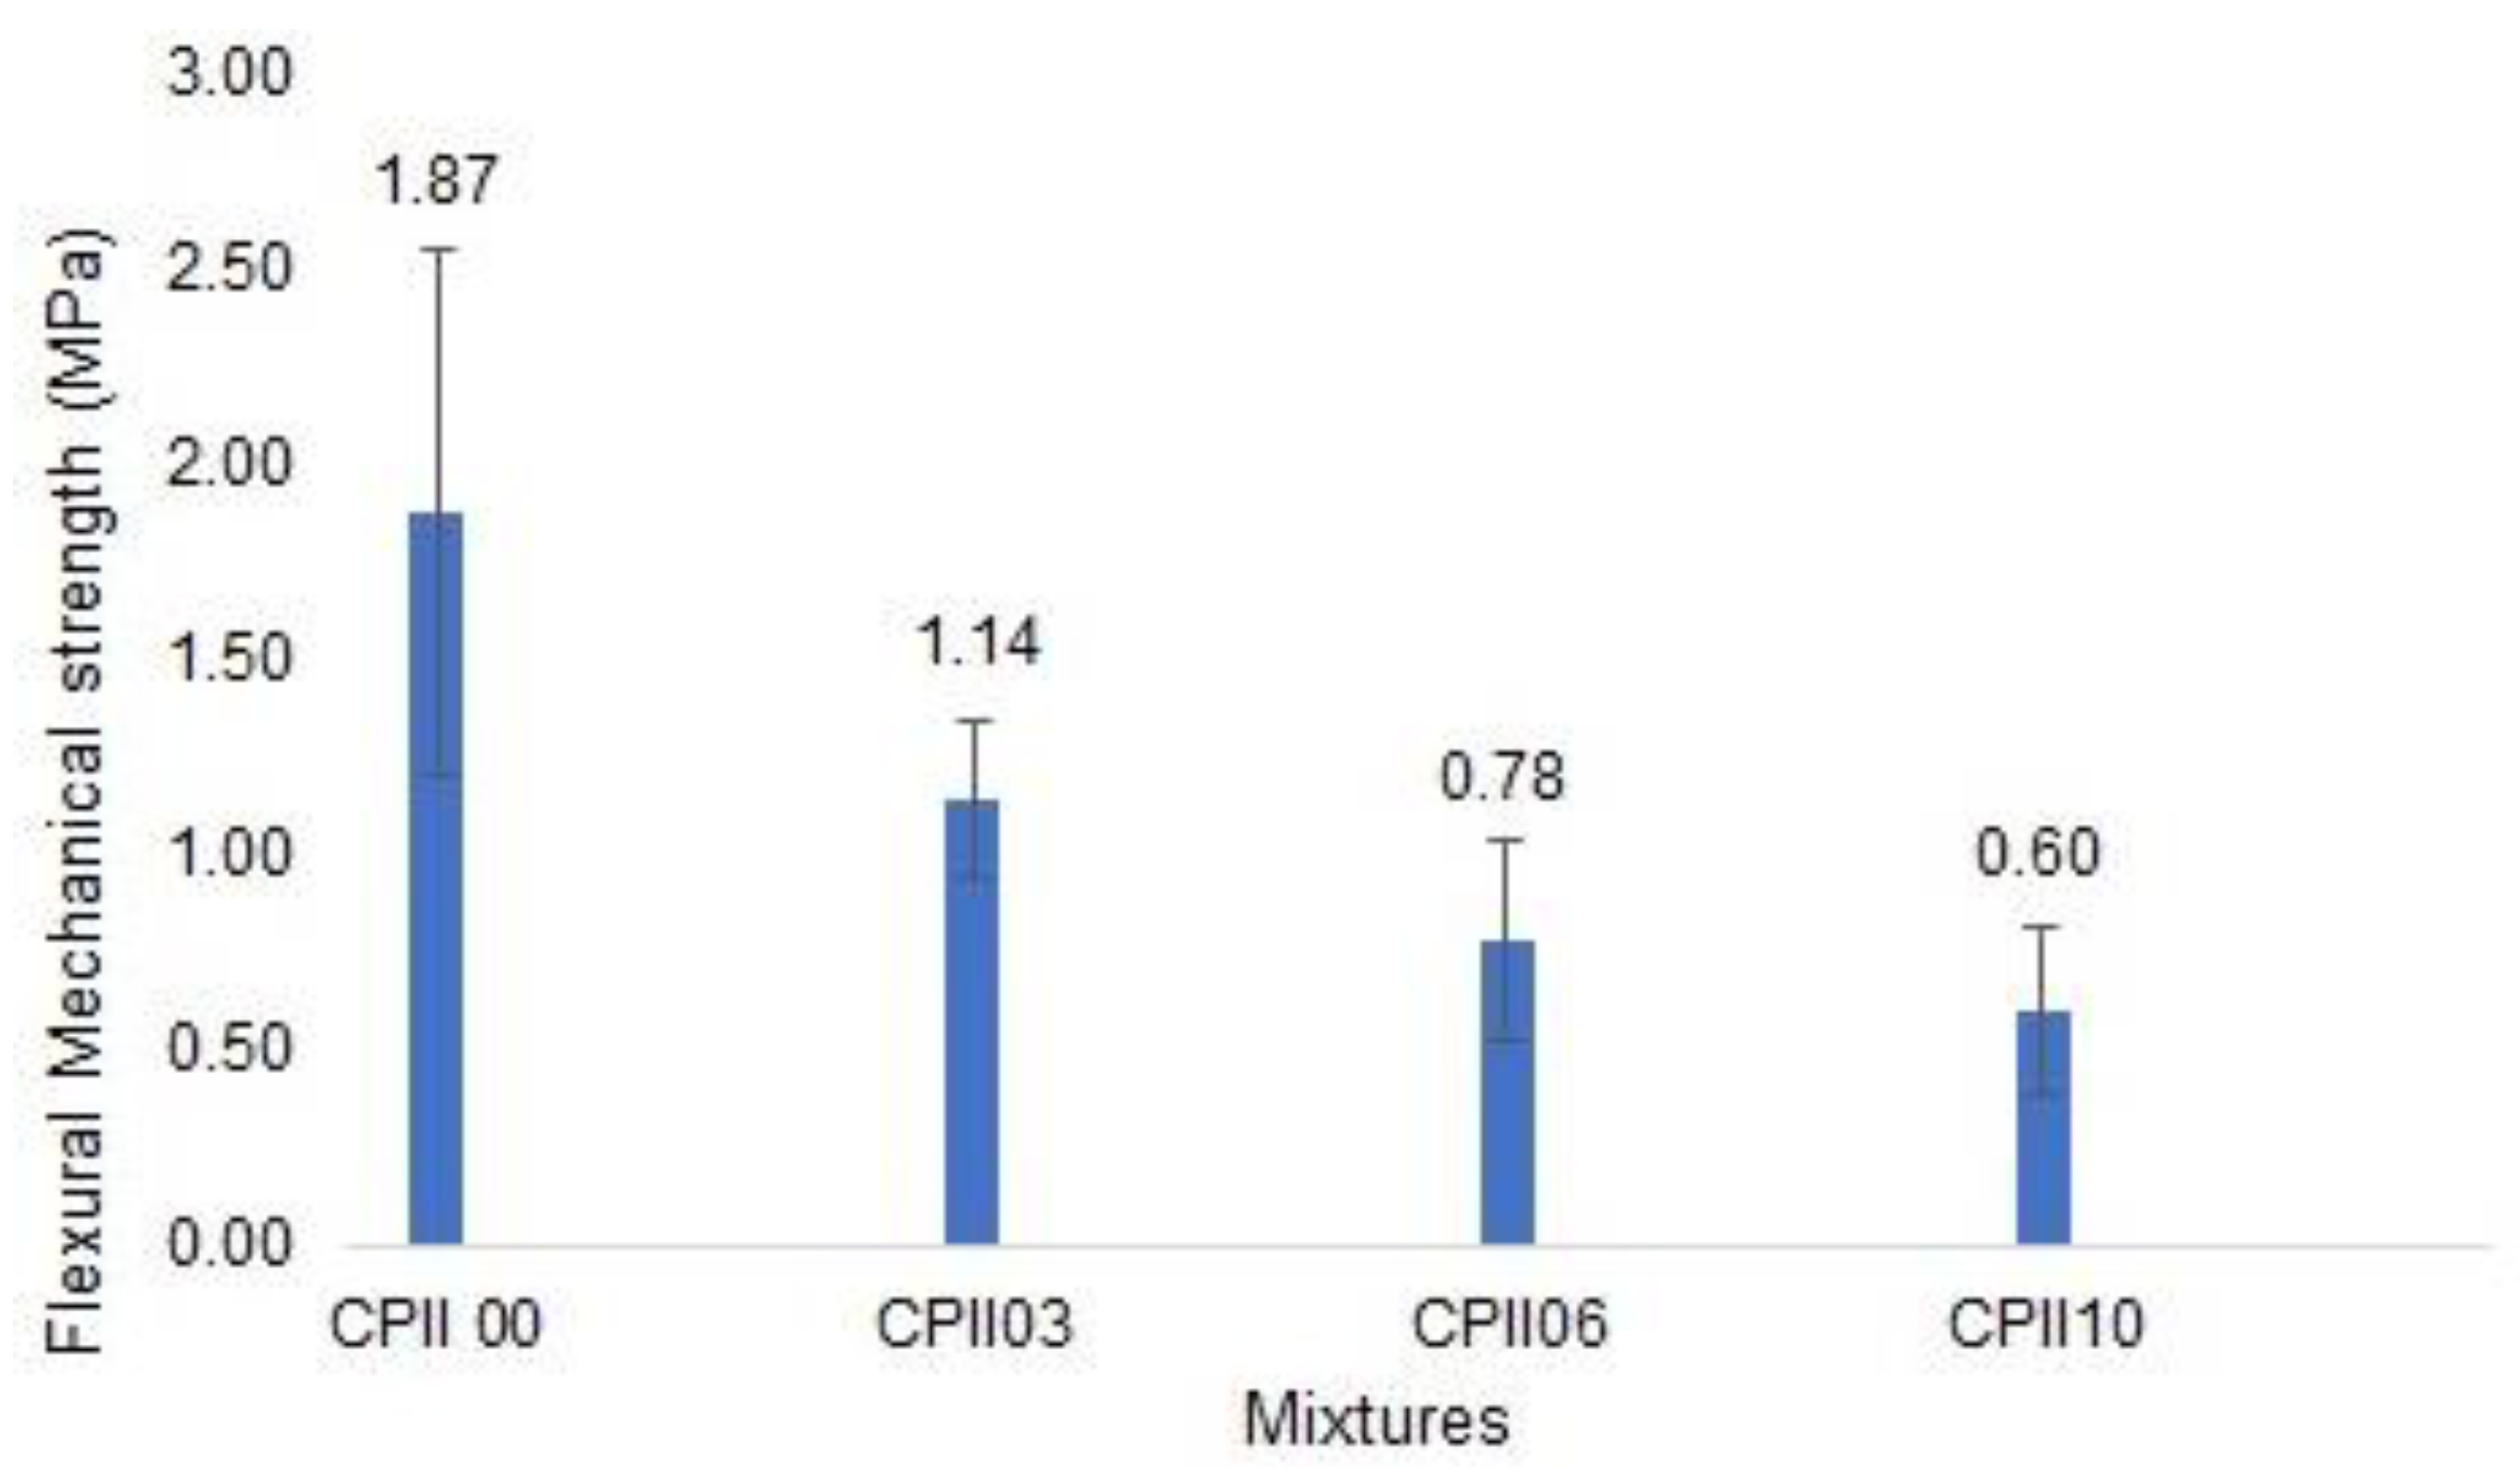
- Flexural mechanical strength
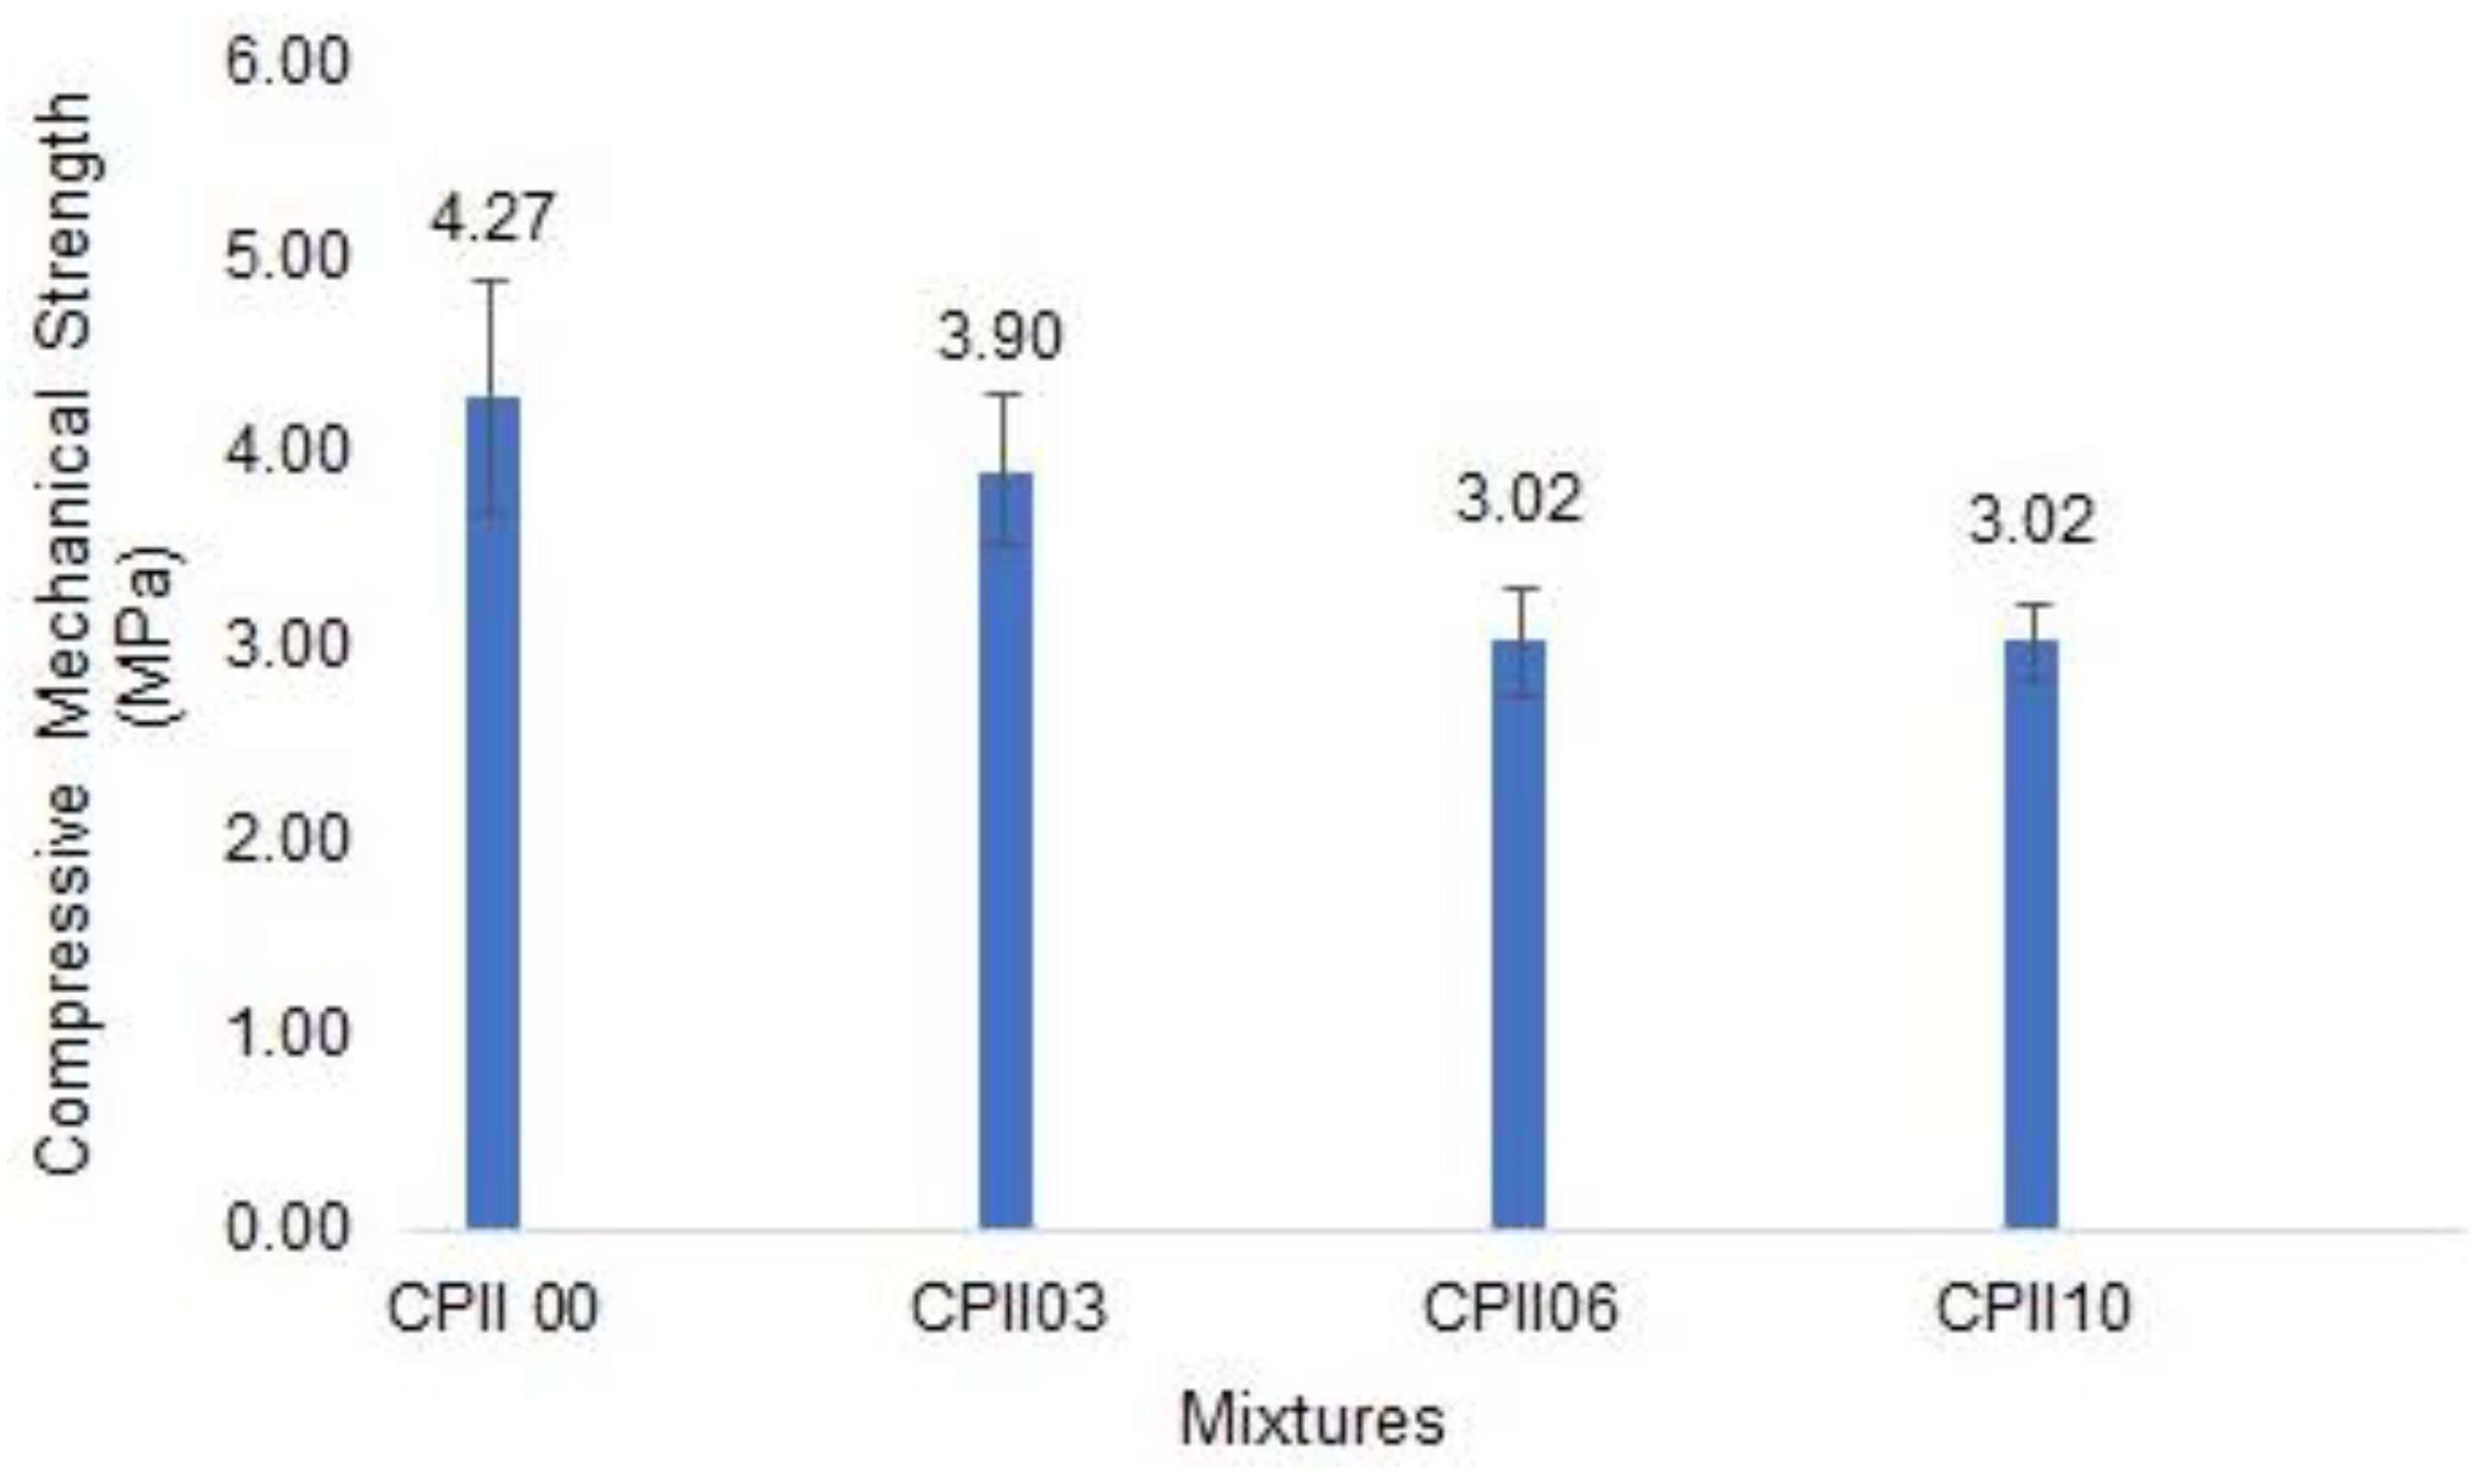
- Compressive mechanical strength
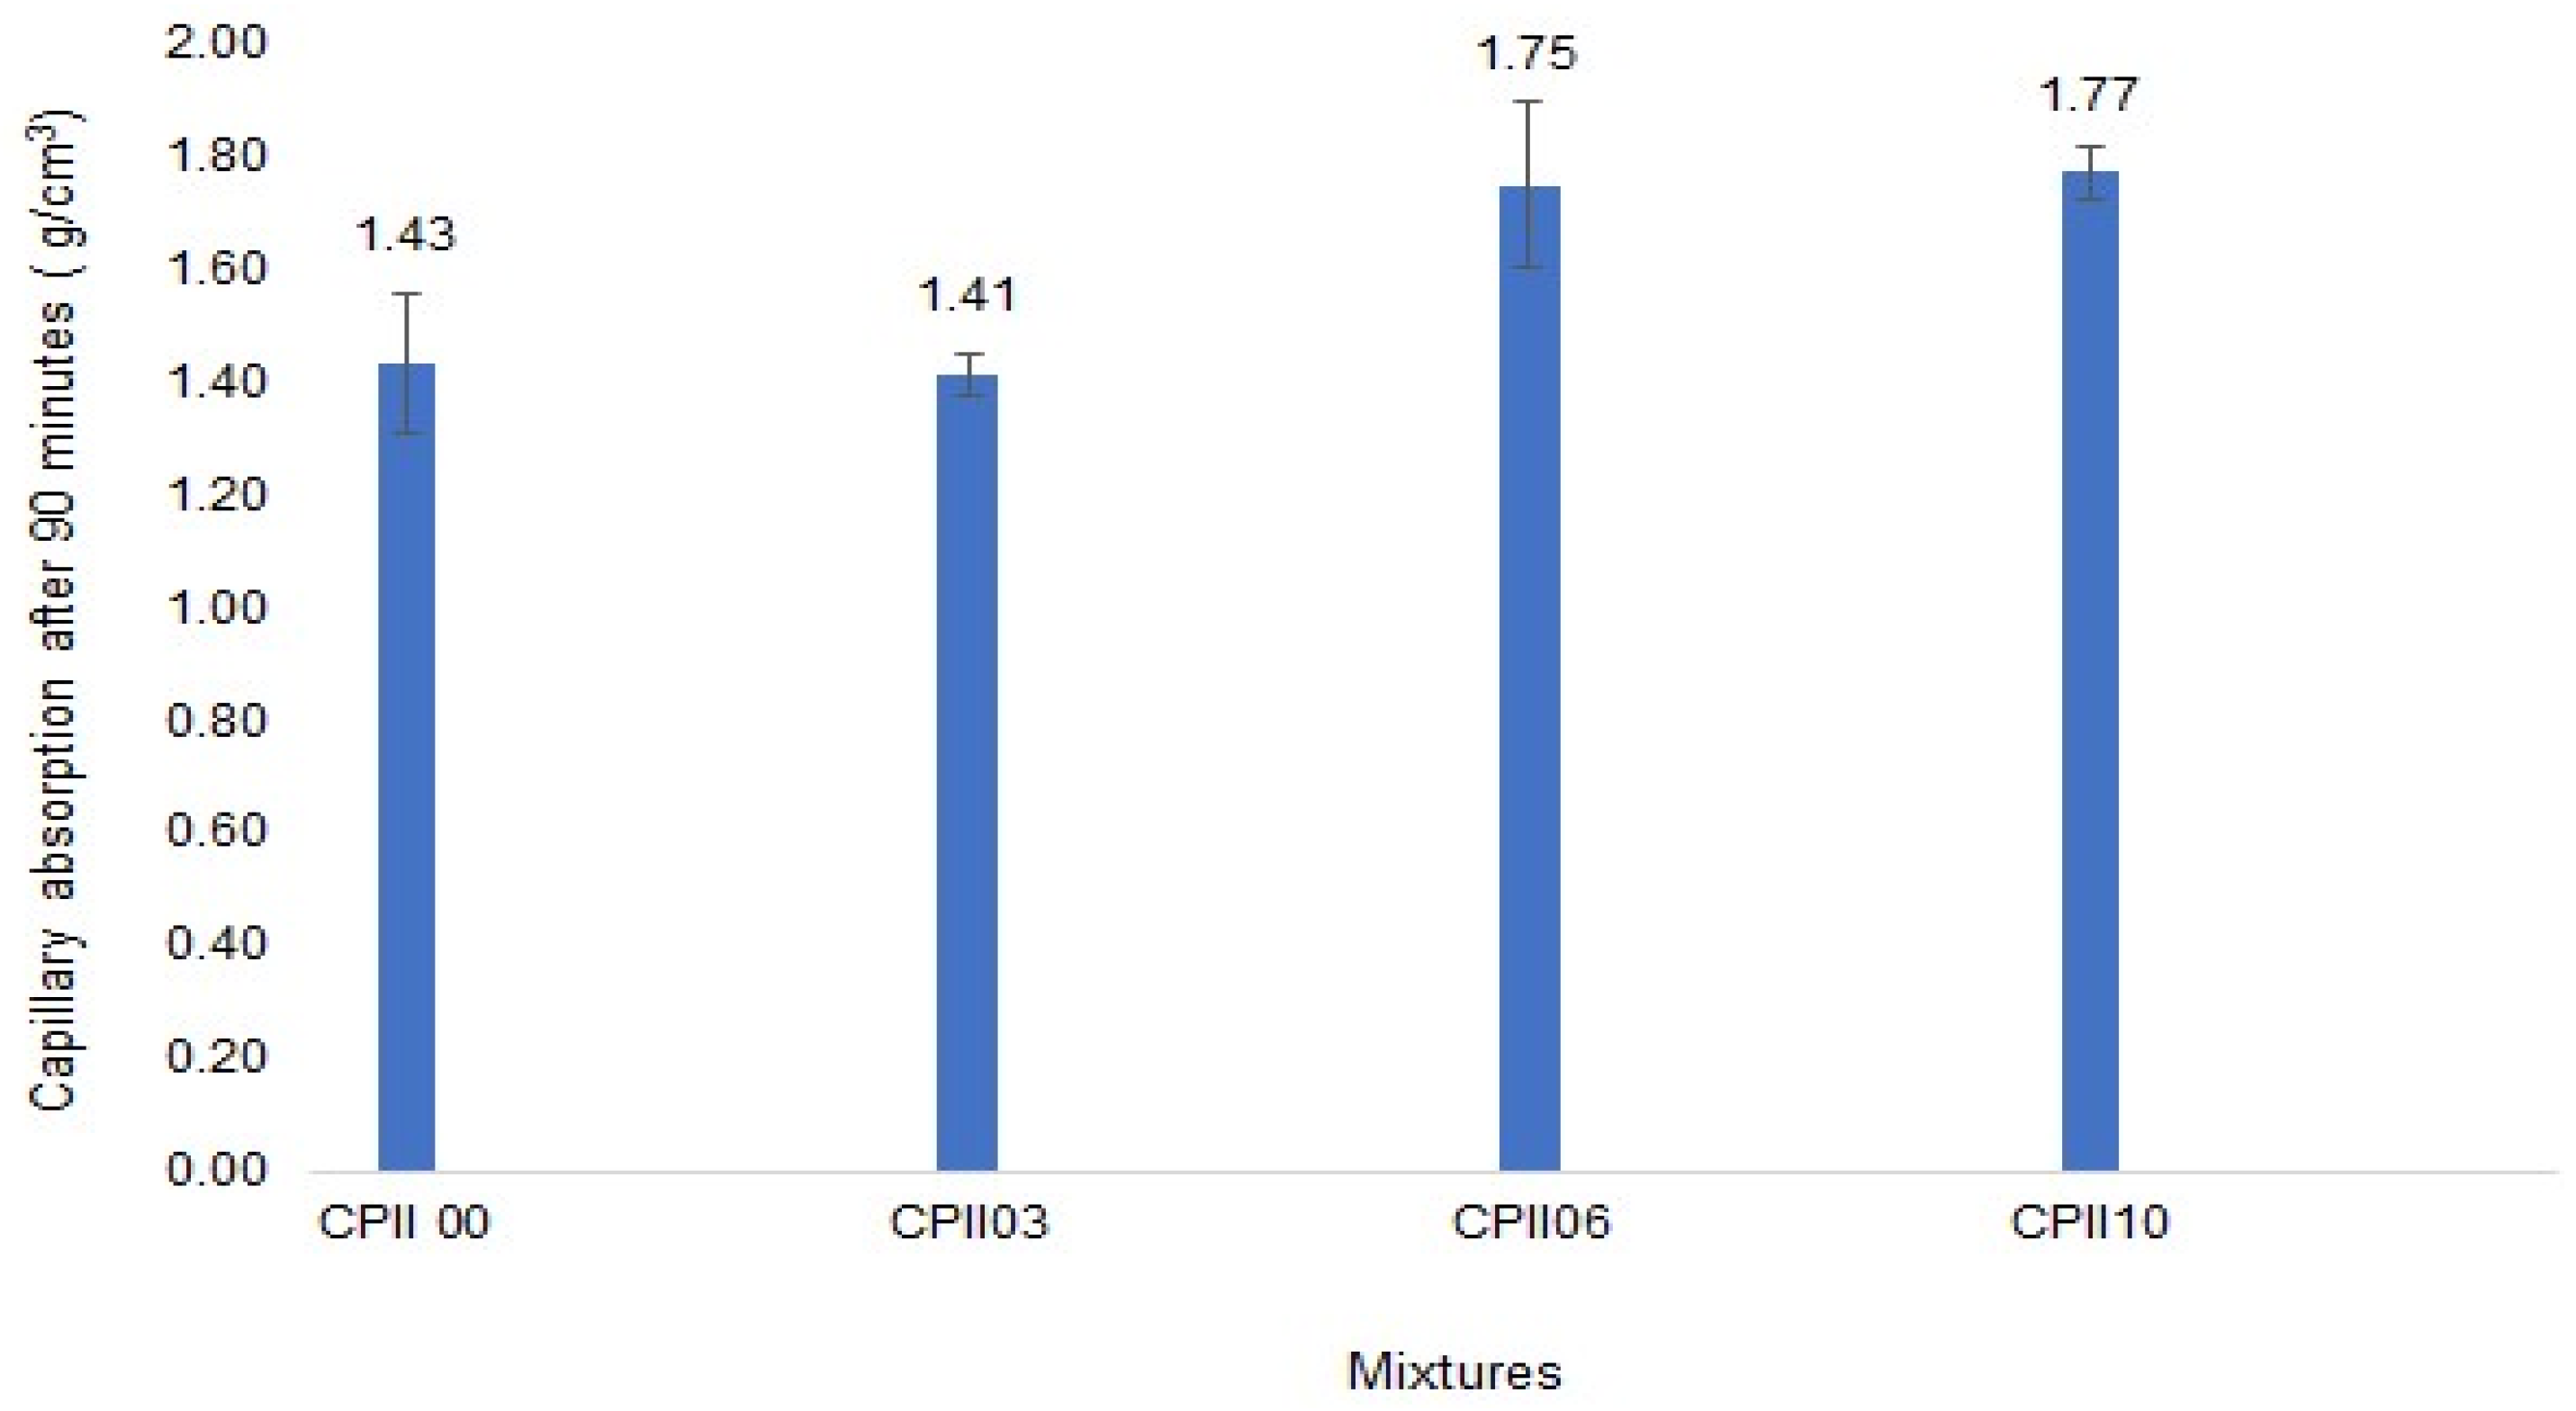
- Capillary absorption
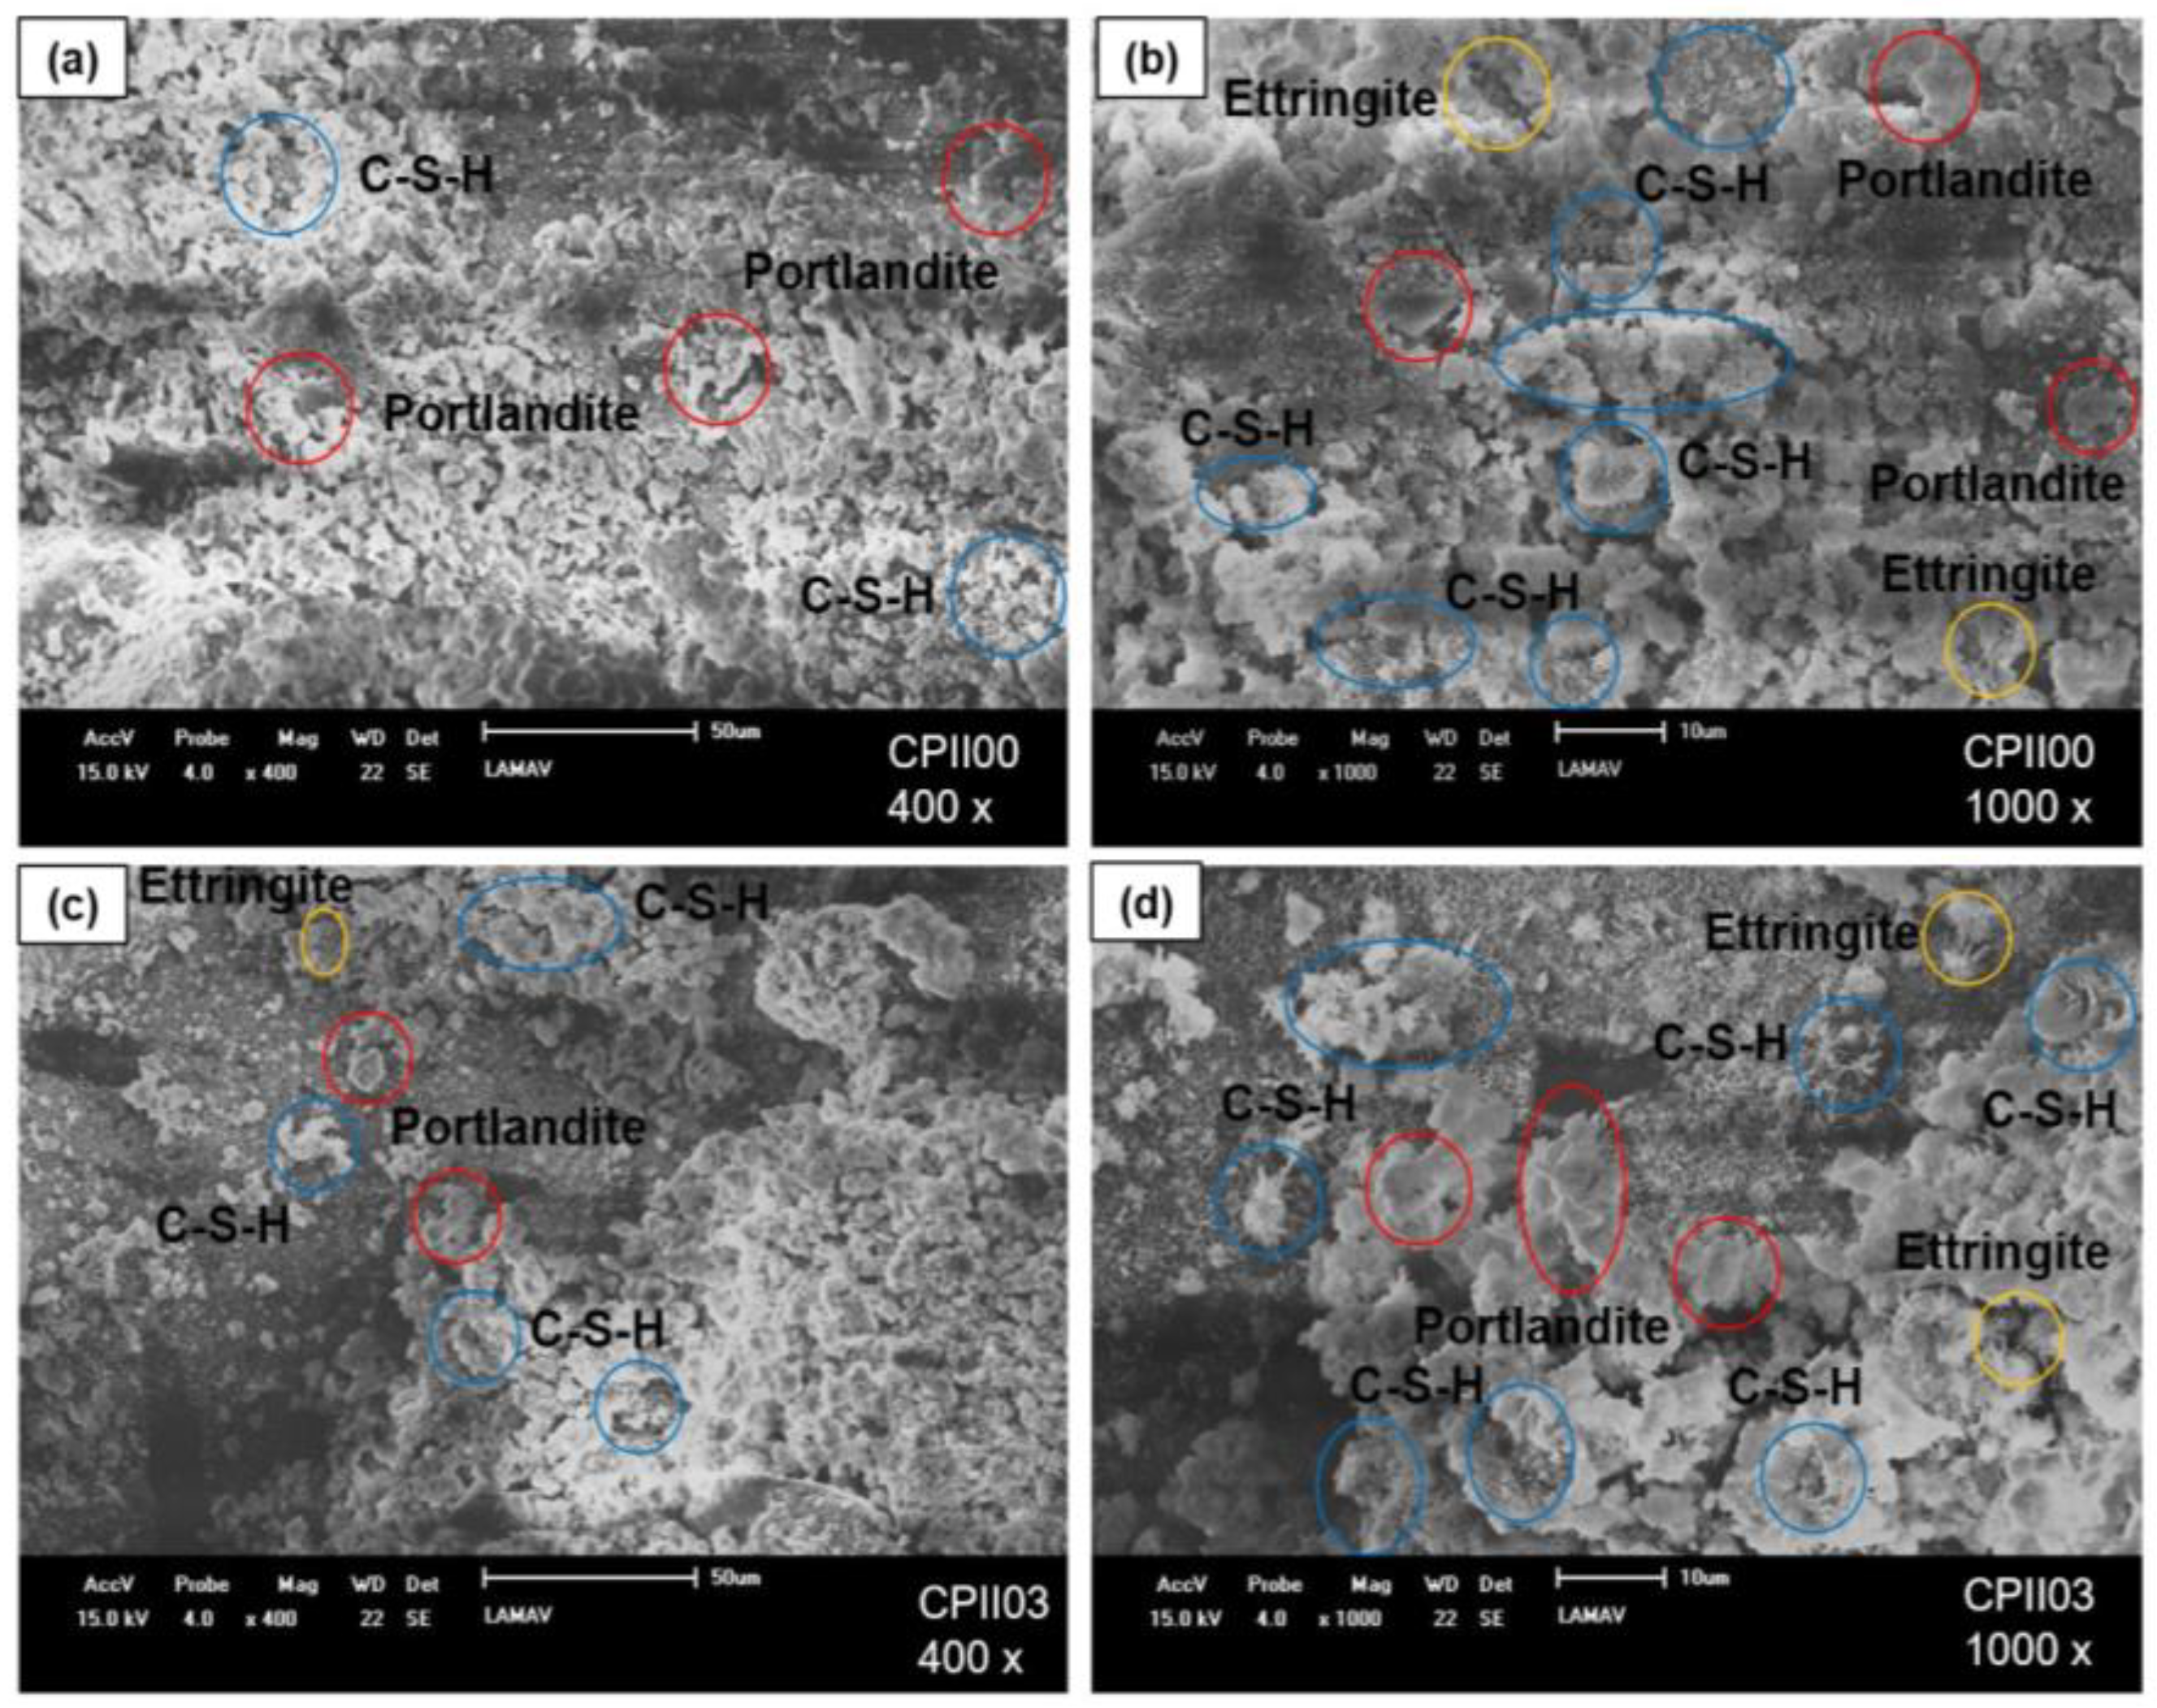
3.4. Microstructural Characterization of Samples after 60 Days
- Scanning electron microscopy (SEM)
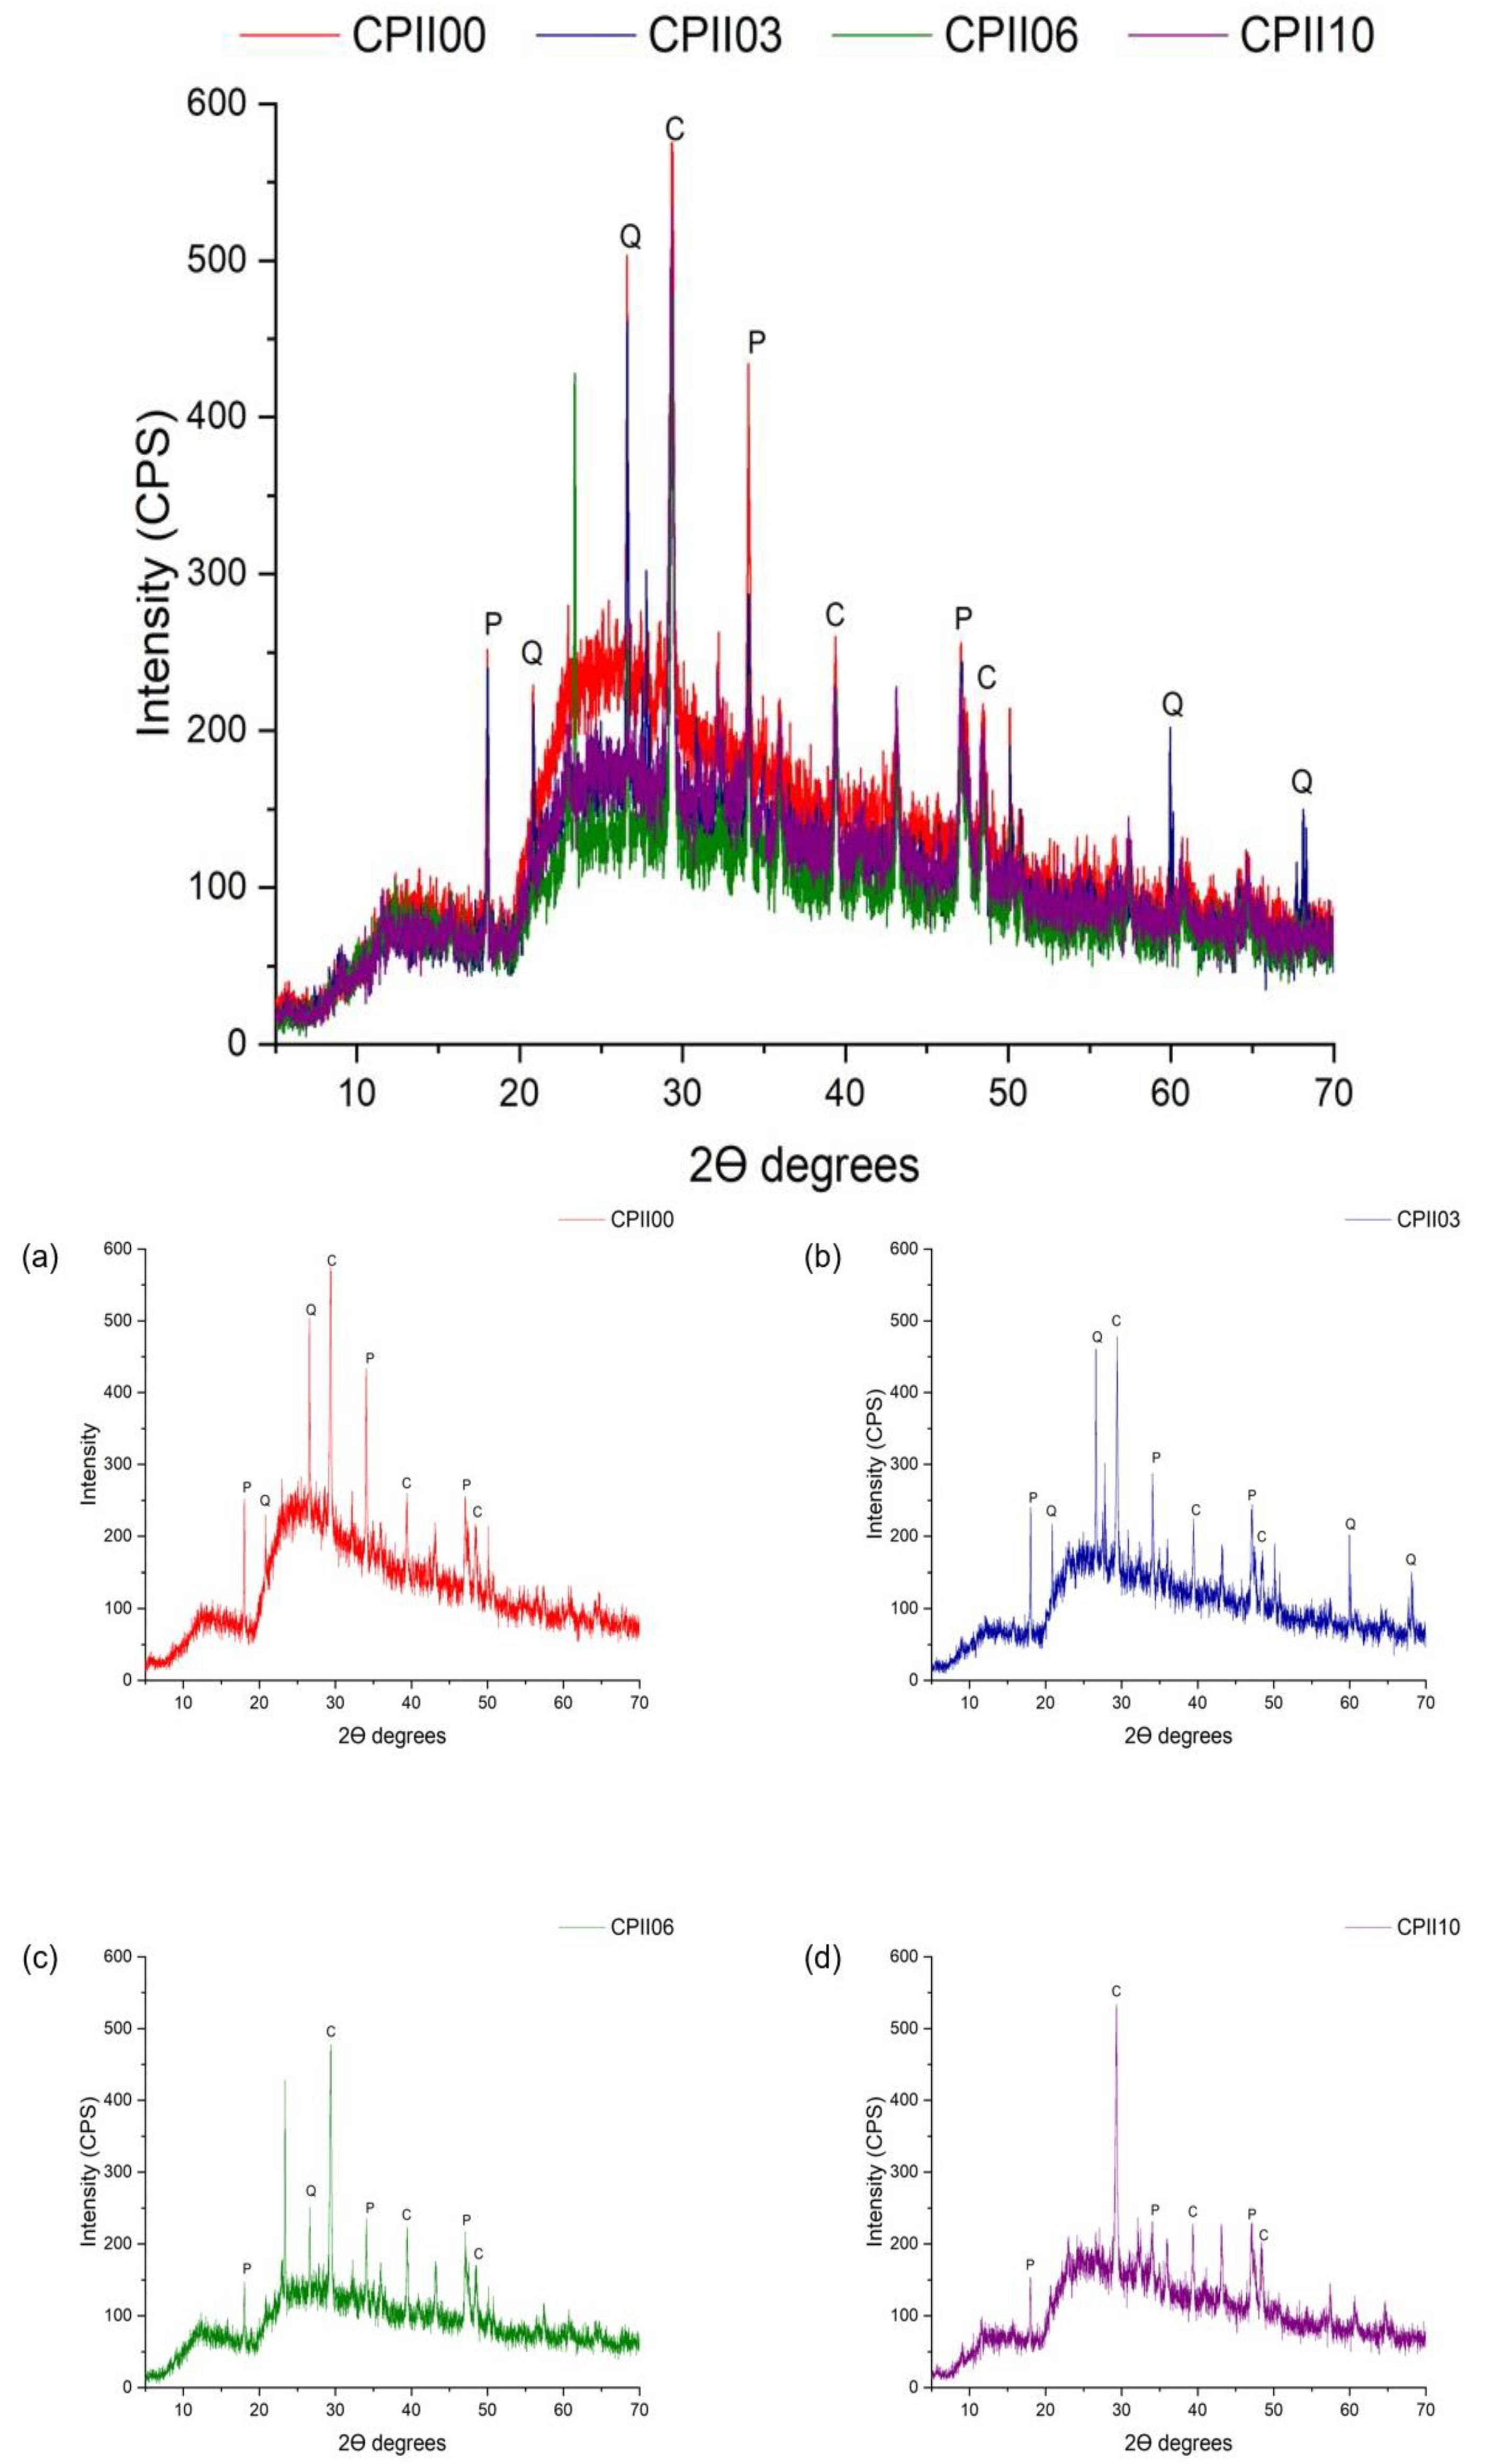
- X-ray diffraction
4. Conclusions
5. Suggestions for Future Work
- Evaluate the resistance of mortars with additions of byproduct gypsum for ages greater than 28 days;
- Evaluate the combined incorporation with other pozzolanic residues, together with the byproduct gypsum;
- Evaluate mortars with higher levels of gypsum addition;
- Check the feasibility of using lime in mortars with gypsum additions;
- Test the viability of plaster mortar for coverings.
Author Contributions
Funding
Institutional Review Board Statement
Informed Consent Statement
Data Availability Statement
Acknowledgments
Conflicts of Interest
List of Abbreviations
References
- Veiga, R. Air lime mortars: What else do we need to know to apply them in conservation and rehabilitation interventions? A review. Constr. Build. Mater. 2017, 157, 132–140. [Google Scholar] [CrossRef]
- Vijayakumar, J.; Aravindan, R.; Viruthagiric, T. Recent Trends in the Production, Purification and Application of Lactic Acid. Chem. Biochem. Eng. Q. 2008, 22, 245–264. [Google Scholar]
- Lima, U.A. Industrial Biotechnology: Fermentative and Enzymatic Processes; Edgard Blucher: New York, NY, USA, 2002; Volume 3, 616p. [Google Scholar]
- Pinho, C.L.C.; Oliveira, C.E.S.D.; Coimbra, J.C.; Cotrim, W.D.S. Production of lactic acid in a medium based on food industry effluents using an immobilized mixed dairy culture. Braz. J. Food Technol. 2019, 22. [Google Scholar] [CrossRef]
- NBR NM 52; Fine Aggregate—Determination of Specific Mass and Apparent Specific Mass. Brazilian Association of Technical Standards: Rio de Janeiro, Brazil, 2009.
- NBR 16605; Determination of the Specific Mass of Cement. Brazilian Association of Technical Standards: Rio de Janeiro, Brazil, 2017.
- NBR 16541; Mortar for Laying and Covering Walls and Ceilings—Preparation of the Mixture for Carrying Out Tests. Brazilian Association of Technical Standards: Rio de Janeiro, Brazil, 2016.
- NBR 13276; Mortars for Laying and Covering Walls and Ceilings—Determination of the Consistency Index. Brazilian Association of Technical Standards: Rio de Janeiro, Brazil, 2016.
- Mohammed, S.; Safiullah, O. Optimization of the SO3 content of an Algerian Portland cement: Study on the effect of various amounts of gypsum on cement properties. Constr. Build. Mater. 2018, 164, 362–370. [Google Scholar] [CrossRef]
- NBR 13278; Mortar for Laying Walls and Coating Walls and Ceilings: Determination of Mass Density and Incorporated Air Content. Brazilian Association of Technical Standards: Rio de Janeiro, Brazil, 2005.
- NBR 13279; Mortar for Laying Walls and Cladding Walls and Ceilings Determination of Compressive Resistance. Brazilian Association of Technical Standards: Rio de Janeiro, Brazil, 2005.
- NBR 15259; Mortar for Laying and Covering Walls and Ceilings—Determination of Water Absorption by Capillarity and Capillarity Coefficient. Brazilian Association of Technical Standards: Rio de Janeiro, Brazil, 2005.
- NBR 13207; Plaster for Civil Construction. Brazilian Association of Technical Standards: Rio de Janeiro, Brazil, 2017.
- Costa, J.E.B.; Costa, A.F.; Melo, M.A.F.; Melo, D.M.A.; Melo, V.R.M. Comparative Analysis between Gypsum Obtained from Salt Production and Commercial Gypsum. In Proceedings of the 58º Congresso Brasileiro de Cerâmica, Bento Gonçalves, RS, Brasil, 18–21 May 2014. [Google Scholar]
- Moreira, P.I.; Dias, J.O.; Xavier, G.C.; Vieira, C.M.; Alexandre, J.; Monteiro, S.N.; Ribeiro, R.P.; Azevedo, A.R.G. Ornamental Stone Processing Waste Incorporated in the Production of Mortars: Technological Influence and Environmental Performance Analysis. Sustainability 2022, 14, 5904. [Google Scholar] [CrossRef]
- Barbosa, A.A.; Ferraz, A.V.; Santos, G.A. Chemical, mechanical and morphological characterization of gypsum obtained at Araripe, PE, Brazil). Cerâmica 2014, 60, 501–508. [Google Scholar] [CrossRef]
- Bortoletto, M.; Sanches, A.O.; Santos, J.A.; Silva, R.G.d.; Tashima, M.M.; Payá, J.; Soriano, L.; Borrachero, M.V.; Malmonge, J.A.; Akasaki, J.L. New insights on understanding the Portland cement hydration using electrical impedance spectroscopy. Constr. Build. Mater. 2023, 407, 133566. [Google Scholar] [CrossRef]
- Mohit, M.; Haftbaradaran, H.; Riahi, H.T. Investigating the ternary cement containing Portland cement, ceramic waste powder, and limestone. Constr. Build. Mater. 2023, 369, 130596. [Google Scholar] [CrossRef]
- Caldas, P.H.C.H.; de Azevedo, A.R.G.; Marvila, M.T. Silica fume activated by NaOH and KOH in cement mortars: Rheological and mechanical study. Constr. Build. Mater. 2023, 400, 132623. [Google Scholar] [CrossRef]
- Gardette, M.; Thérias, S.; Gardette, J.L.; Murariu, M.; Dubois, P. Photooxidation of polylactide/calcium sulphate Composites. Polym. Degrad. Stab. 2011, 96, 616–623. [Google Scholar] [CrossRef]
- Murariu, M.; Ferreira, A.d.S.; Pluta, M.; Bonnaud, L.; Alexandre, M.; Dubois, P. Polylactide (PLA)–CaSO4 composites toughened with low molecular weight and polymeric ester-like plasticizers and related performances. Eur. Polym. J. 2008, 44, 3842–3852. [Google Scholar] [CrossRef]
- Bardella, P.S.; Camarini, G. Recycled Plaster: Physical and Mechanical Properties. Adv. Mater. Res. 2011, 374377, 1307–1310. [Google Scholar] [CrossRef]
- Ferreira, F.C.; Sousa, J.G.G.; Carneiro, A.M.P. Mechanical characterization of plaster for coating produced at the Araripe Gesseiro Complex. Ambiente Construído 2019, 19, 207–221. [Google Scholar] [CrossRef]
- Qin, W.; Haiyu, Z.; Yue, W.; Sihan, S.; Kejun, L. Influence of phosphorus impurities on the structure and performance of cellulose-ether-modified gypsum. Constr. Build. Mater. 2022, 345, 128230. [Google Scholar] [CrossRef]
- Nalon, G.H.; Alves, M.A.; Pedroti, L.G.; Ribeiro, J.C.L.; Fernandes, W.E.H.; Oliveira, D.S. Compressive strength, dynamic, and static modulus of cement—Lime laying mortars obtained from samples of various geometries. J. Build. Eng. 2021, 44, 102626. [Google Scholar] [CrossRef]
- Hagemann, S.E.; Gastaldini, A.L.G.; Cocco, M.; Jahn, S.L.; Terra, L.M. Synergic effects of the substitution of Portland cement for water treatment plant sludge ash and ground limestone: Technical and economic evaluation. J. Clean. Prod. 2019, 214, 916–926. [Google Scholar] [CrossRef]
- Assis, M.S.; da Silva, M.A.; Cortez, F.L.C.; Leitão, M.d.S.A. Influence of Calcination and Granulometry on the Manufacturing of Recycled Gypsum Blocks. In Proceedings of the 3rd South American Congress on Solid Waste and Sustainability, Gramado, RS, Brazil, 25 March 2020. [Google Scholar]
- Rashad, M.M.; Mahmoud, I.A.; Ibrahim, E.A.; Abdel-Aal, E.A. Crystallization of calcium sulfate dehydrate under simulated conditions of phosphoric acid production in the presence of aluminum and magnesium ions. J. Cristal. Growth 2004, 267, 372–379. [Google Scholar] [CrossRef]
- Singh, N.B.; Middendorf, B. Calcium sulphate hemihydrates hydration leading to gypsum crystallization. Prog. Cryst. Growth Charact. Mater. 2007, 53, 57–77. [Google Scholar] [CrossRef]
- Antoniazzi, J.P.; Mohamad, G.; Casali, J.M.; Schmidt, R.P.B. Air incorporation in ready mix mortars: Influence of admixtures, aggregates and mixing time. Ambiente Construído 2020, 20, 285–304. [Google Scholar] [CrossRef]
- Tokarski, R.B.; Matoski, A.; Cechin, L.; Weber, A.M. Behavior of coating mortars in the fresh state, composed of limestone crushed sand and natural sand. Revista Matéria 2018, 23, 3. [Google Scholar] [CrossRef]
- NBR 13281; Mortar for Laying and Covering Walls and Ceilings—Requirements. Brazilian Association of Technical Standards: Rio de Janeiro, Brazil, 2005.
- NBR 15839; Mortar for Laying and Covering Walls and Ceilings—Rheological Characterization Using the Squeeze-Flow Method. Brazilian Association of Technical Standards: Rio de Janeiro, Brazil, 2010.
- Marvila, M.T.; Azevedo, A.R.; Barroso, L.S.; Barbosa, M.Z.; de Brito, J. Gypsum plaster using rock waste: A proposal to repair the renderings of historical buildings in Brazil. Constr. Build. Mater. 2020, 250, 118786. [Google Scholar] [CrossRef]
- C1679-17; Measuring Hydration Kinetics of Hydraulic Cementitious Mixtures Using Isothermal Calorimetry. American Society for Testing and Materials: West Conshohocken, PA, USA, 2017.
- Huang, T.; Yuan, Q.; Zuo, S.; Xie, Y.; Shi, C. New insights into the effect of gypsum on hydration and elasticity development of C3S paste during setting. Cem. Concr. Res. 2022, 159, 106860. [Google Scholar] [CrossRef]
- Langaro, E.A.; da Luz, C.A.; Buth, I.S.; Moraes, M.C.; Filho, J.I.P.F.; Matoski, A. The influence of chemical composition and fineness on the performance of alkali activated cements obtained from blast furnace slags. Rev. Matéria 2017, 11792, 1517–7076. [Google Scholar]
- Gesoglu, M.; Güneyisi, E.; Nahhab, A.H.; Yazıcı, H. The effect of aggregates with high gypsum content on the performance of ultra-high strength concretes and Portland cement mortars. Constr. Build. Mater. 2016, 110, 346–354. [Google Scholar] [CrossRef]
- Filho, J.H.; Pires, C.; Leite, O.; Garcez, M.; Medeiros, M. Red ceramic waste as supplementary cementitious material: Microstructure and mechanical properties. Constr. Build. Mater. 2021, 296, 123653. [Google Scholar] [CrossRef]
- Cherene, M.G.P.; Xavier, G.d.C.; Barroso, L.d.S.; Oliveira, J.d.S.M.; de Azevedo, A.R.G.; Vieira, C.M.; Alexandre, J.; Monteiro, S.N. Technological and microstructural perspective of the use of ceramic waste in cement-based mortars. Constr. Build. Mater. 2023, 367. [Google Scholar] [CrossRef]
- Robayo-Salazar, R.A.; Valencia-Saavedra, W.; Ramírez-Benavides, S.; de Gutiérrez, R.M.; Orobio, A. Eco-House Prototype Constructed with Alkali-Activated Blocks: Material Production, Characterization, Design, Construction, and Environmental Impact. Materials 2021, 14, 1275. [Google Scholar] [CrossRef] [PubMed]


| Nomenclature | Composition |
|---|---|
| CPII00 | Reference mortar with Portland CPII cement without added byproduct gypsum. |
| CPII03 | Mortar with Portland CPII cement and 3% waste addition. |
| CPII06 | Mortar with Portland CPII cement and 6% waste addition. |
| CPII10 | Mortar with Portland CPII cement and 10% waste addition. |
| Component | Byproduct Gypsum (% Mass) | CPII (% Mass) |
|---|---|---|
| MgO | - | 1.14 |
| Al2O3 | 0.91 | 5.54 |
| SiO2 | 0.92 | 17.06 |
| P2O5 | 0.08 | 0.18 |
| SO3 | 53.29 | 2.64 |
| Cl | 0.09 | 0.07 |
| K2O | 0.16 | 0.71 |
| CaO | 44.56 | 67.84 |
| Fe2O3 | - | 3.30 |
| Ag2O | - | 1.52 |
| Material | Specific Mass (g/cm3) (NBR 16605, 2017) [6] |
|---|---|
| Byproduct gypsum | 2.73 |
| CPII-E | 2.94 |
| Sand | 2.67 |
| Mixture | Consistency Index (mm) | Water/Dry Materials Ratio | W/C |
|---|---|---|---|
| CPII00 | 255 | 0.2040 | 1.43 |
| CPII03 | 257 | 0.2031 | 1.43 |
| CPII06 | 263 | 0.2023 | 1.43 |
| CPII10 | 265 | 0.2011 | 1.43 |
Disclaimer/Publisher’s Note: The statements, opinions and data contained in all publications are solely those of the individual author(s) and contributor(s) and not of MDPI and/or the editor(s). MDPI and/or the editor(s) disclaim responsibility for any injury to people or property resulting from any ideas, methods, instructions or products referred to in the content. |
© 2024 by the authors. Licensee MDPI, Basel, Switzerland. This article is an open access article distributed under the terms and conditions of the Creative Commons Attribution (CC BY) license (https://creativecommons.org/licenses/by/4.0/).
Share and Cite
Ribeiro, C.G.D.; de Castro Xavier, G.; da Silva Barroso, L.; Vieira, C.M.F.; Monteiro, S.N.; de Azevedo, A.R.G. Evaluation of Technological Properties of Mortars with the Addition of Plaster Byproduct. Sustainability 2024, 16, 1193. https://doi.org/10.3390/su16031193
Ribeiro CGD, de Castro Xavier G, da Silva Barroso L, Vieira CMF, Monteiro SN, de Azevedo ARG. Evaluation of Technological Properties of Mortars with the Addition of Plaster Byproduct. Sustainability. 2024; 16(3):1193. https://doi.org/10.3390/su16031193
Chicago/Turabian StyleRibeiro, Carolina Gomes Dias, Gustavo de Castro Xavier, Laimara da Silva Barroso, Carlos Mauricio Fontes Vieira, Sergio Neves Monteiro, and Afonso Rangel Garcez de Azevedo. 2024. "Evaluation of Technological Properties of Mortars with the Addition of Plaster Byproduct" Sustainability 16, no. 3: 1193. https://doi.org/10.3390/su16031193
APA StyleRibeiro, C. G. D., de Castro Xavier, G., da Silva Barroso, L., Vieira, C. M. F., Monteiro, S. N., & de Azevedo, A. R. G. (2024). Evaluation of Technological Properties of Mortars with the Addition of Plaster Byproduct. Sustainability, 16(3), 1193. https://doi.org/10.3390/su16031193