Abstract
Melamine-impregnated paper waste (MIPW) is an unavoidable byproduct of the melamine-impregnated paper production process, and it must be urgently disposed. In this paper, due to its high N content, MIPW was used as a N source to co-pyrolyze with camellia oleifera shell (COS). By changing the proportion of MIPW in the raw materials, the migration path of the N was studied during the co-pyrolysis process. X-ray photoelectron spectroscopy (XPS), elemental analysis (EA), total nitrogen analysis (TN) and ultraviolet spectrophotometry were used to determine the content and the types of N-containing components in raw materials and products. The results showed that during the co-pyrolysis process, the N in MIPW and COS would be converted into different types of N-containing components, and the proportion of MIPW in raw materials directly impacts the product distribution and the N migration path. With the increase in the proportion of MIPW from 10 to 50 wt.% (daf, mass ratio), the proportion of N in raw materials that migrated into the solid phase decreased from 27.58 to 16.31 wt.%, while that which migrated to the gas and liquid phases increased from 24.92 and 47.50 wt.% to 25.97 and 57.72 wt.%, respectively. The proportions of N in the raw materials that changed into pyridinic-N, pyrrolic-N and graphitic-N in the solid phase and N2-N in the gas phase were decreased. The proportions of NH3-N and HCN-N in the gas phase and NH3-N and organic-N in the liquid phase were increased. Moreover, synergies were observed during the co-pyrolysis process, which affected the N migration path in the raw material. This study will provide policy directions and theoretical support for the comprehensive utilization of MIPW and COS.
1. Introduction
In recent years, high-value methods of utilizing biomass, such as molding fuel technology, gasification technology, pyrolysis liquefaction technology, carbonization technology, and biogas technology, have developed rapidly [1]. Biomass carbonization technology refers to the process of biochar, bio-oil, and non-condensable gas products’ formation from raw biomass material. This process occurs in an anaerobic or hypoxic environment, making it a low-temperature slow pyrolysis technology. However, compared with activated carbon, the pore structure of biochar is less developed, and the number of surface-active sites is lower. To improve the structure and properties of biochar, many studies have found that the surface morphology and activity of biochar can be effectively improved by introducing N-containing functional groups. The type and content of N-containing functional groups can be analyzed qualitatively and quantitatively by X-ray photoelectron spectroscopy (XPS), such as pyrrolic-N, pyridinic-N, graphitic-N and pyridinic-N-O [2]. N-containing substances such as N-containing chemicals [3,4] and ammonia [5,6] are used as N sources, and various biomass materials are used as C sources to improve the energy storage efficiency and stability of biochar [7]. For example, Cheng et al. [3] prepared N-doped biochar with a N content as high as 3.97% via N-doping modification using pistachio as a C source and melamine as a N source, and its specific surface area increased by 1000 m2/g compared with undoped biochar. Xu et al. [8] used sawdust and dicyandiamide for mixed co-pyrolysis to prepare N-doped biochar at 800 °C. The specific surface area of biochar was increased by N-doping from 75.6 m2/g to 174.4 m2/g. However, N-containing chemicals such as melamine and dicyandiamide are expensive and toxic. Therefore, it is necessary to look for N sources with low prices, high N contents, few impurities, and large reserves.
At present, about 5 wt.% of MIPW is generated during the process of hot-pressing melamine-impregnated paper and substrate. It is estimated that about 1 million tons of MIPW is generated every year. An elemental analyzer was used to analyze the elemental composition and content of MIPW. The results indicate that MIPW contains more than 26 wt.% N. MIPW is often treated by simple incineration or burial in landfills, which will have an adverse impact on the environment. However, little attention has been paid to the disposal of MIPW, and there has only been one attempt to use MIPW powder to replace part of the urea-formaldehyde resin adhesive used to press particleboard [9]. Therefore, it is important to find a clean and efficient way to dispose of or reuse MIPW.
However, during the pyrolysis of N-rich raw materials, gas phases such as N2, NH3, and HCN and tar containing ammonia-N and organic-N will be formed. If they are not collected and studied, they may cause waste and environmental pollution. Therefore, it is particularly important to study the migration path of N during the co-pyrolysis process of MIPW and biomass. In this paper, MIPW was used to co-pyrolyze with COS (with low N content). The morphology and yield of N in each product under different C/N source mixing ratios were studied. The migration path of N in the raw material during pyrolysis was found, which provides data support for the utilization of COS and MIPW.
2. Materials and Methods
2.1. Experimental Raw Materials and Reagents
The camellia oleifera shell was taken from the Experimental Forest Farm of Hunan Academy of Forestry Sciences, washed with deionized water, dried naturally, crushed and sifted through 0.25 mm mesh. MIPW was taken from a factory floor from Hengshanqiao Town, Changzhou City. H2SO4 and NaOH were purchased from Shanghai Macklin Biochemical Technology (Shanghai, China), for analytical purity. The results of industrial analysis and elemental analysis of COS and MIPW are shown in Table 1. It can be seen that COS has low content of N, which is not conducive to the formation of C and N-containing functional groups during the co-pyrolysis process. The content of N in MIPW is very high. Adding N into biochar can effectively improve the species and content of N-containing functional groups.

Table 1.
Industrial and element analysis data of COS and MIPW.
2.2. Experimental Equipment and Pyrolysis Steps
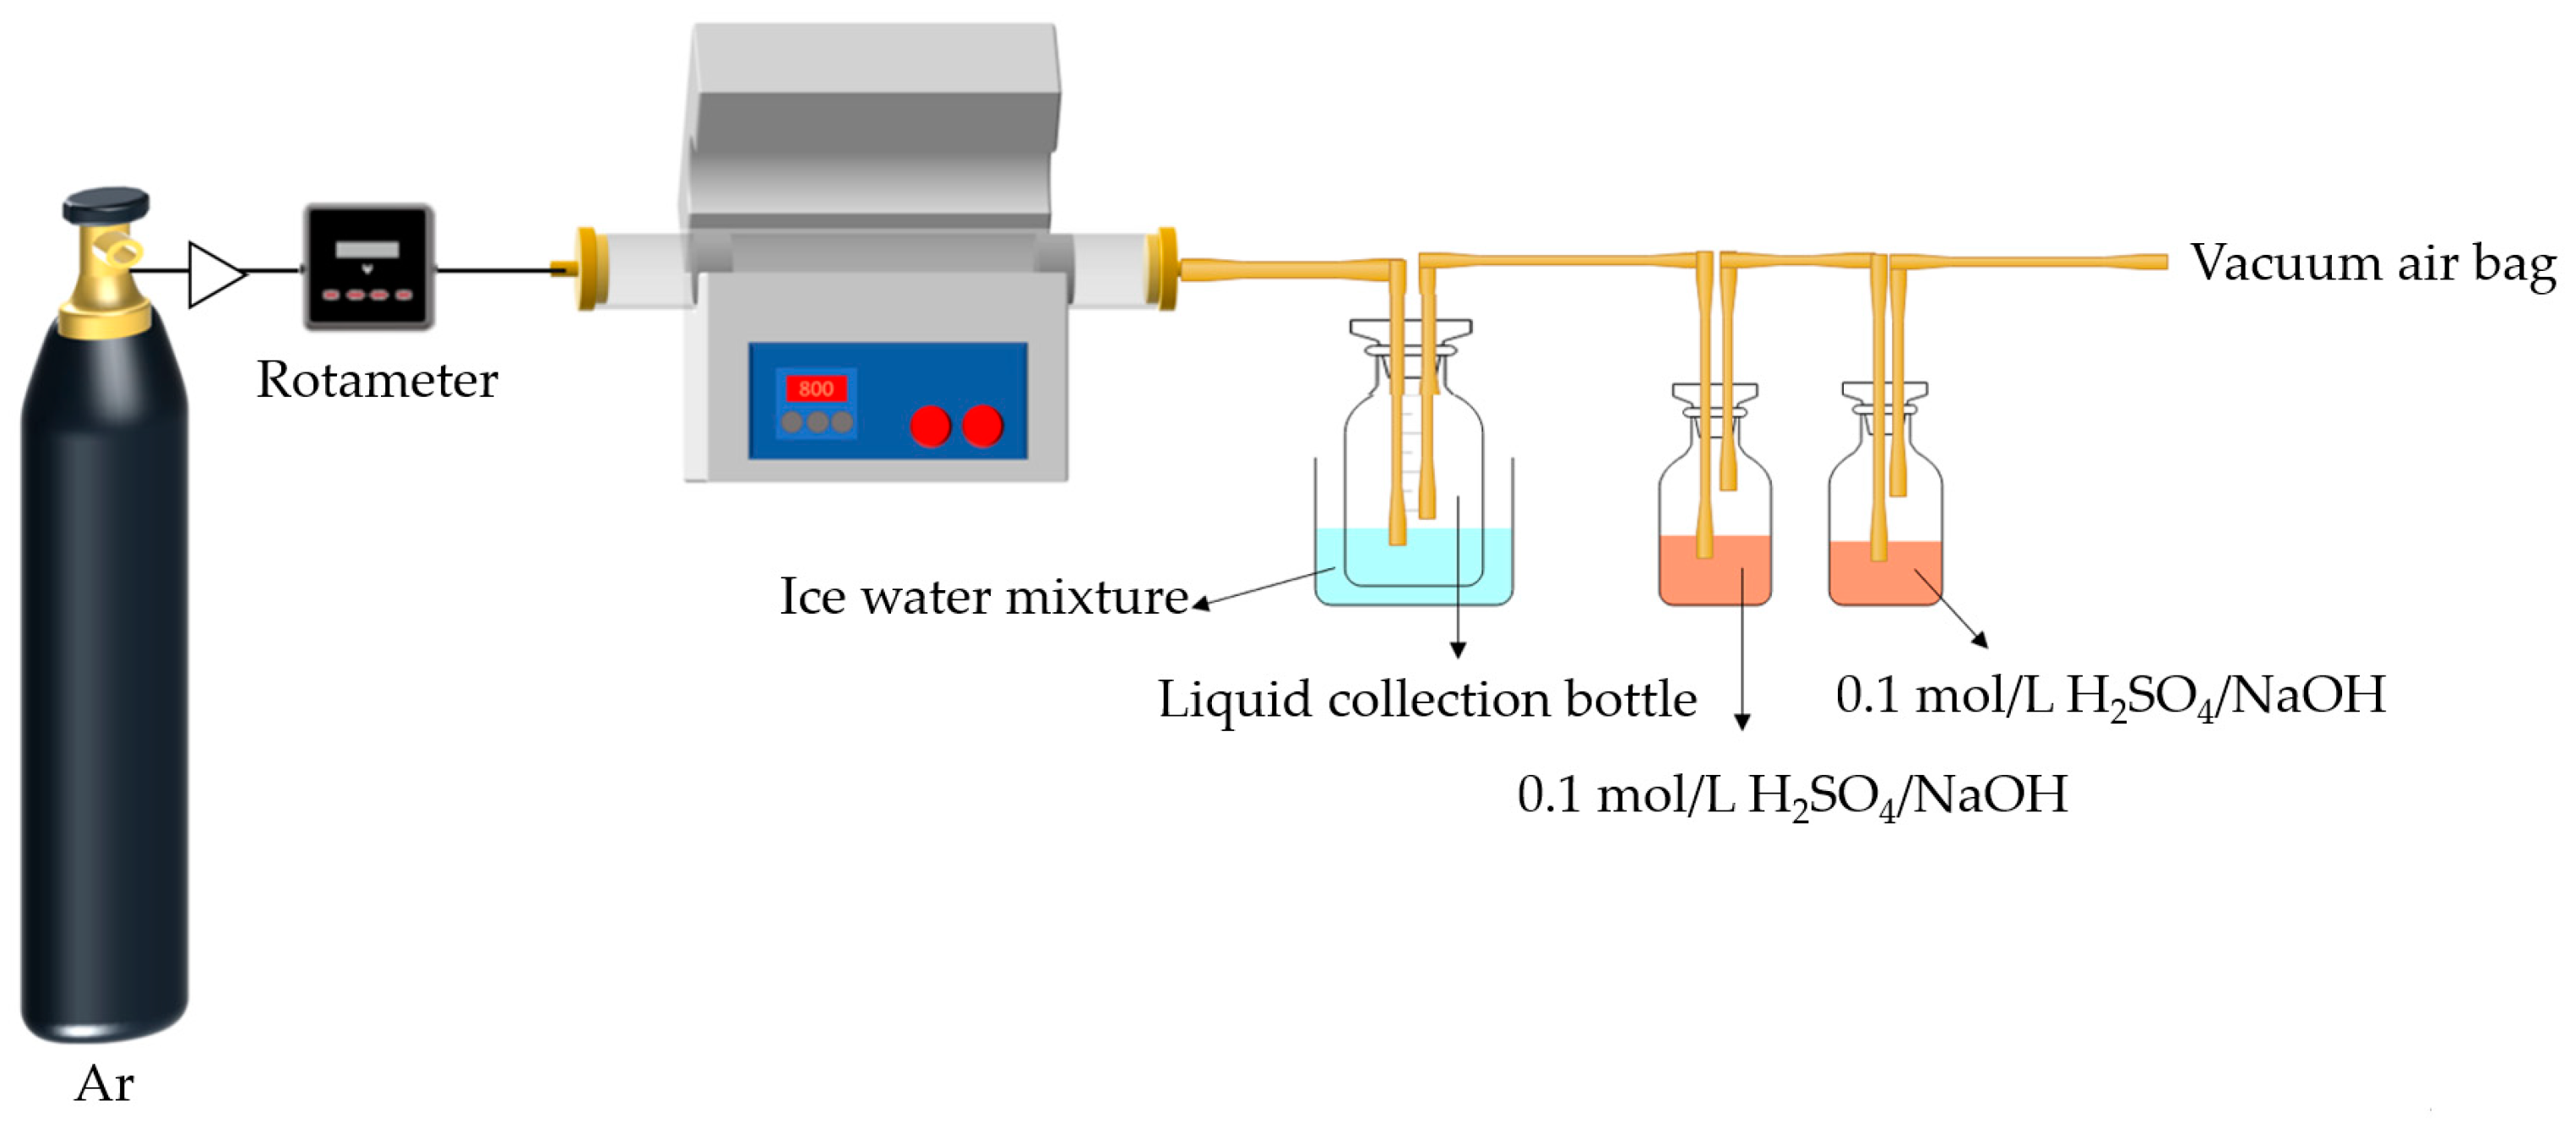
The experiments were conducted in the atmosphere of argon, as shown in Figure 1. About 10 g of COS, MIPW, or COS/MIPW mixture with 10, 20, 30 and 50 wt.% (daf, mass ratio) MIPW was placed into a quartz boat. The heating program was as follows. The mixture was rapidly heated from room temperature to 650 °C within 65 min at a rate of 5 °C/min and held for 60 min. To condense the liquid-phase products (tar and water), a conical bottle was placed in an ice–water mixture, and a gas bottle with H2SO4/NaOH (100 mL, 0.1 mol/L) was used to absorb the NH3/HCN products. The remaining gas-phase products were collected in a vacuum airbag. Once the pyrolysis process was finished, the quartz boat was removed after it had cooled down. The char was taken out from the quartz boat and weighted to calculate the char yield (wt.%, on the basis of dry and ash-free raw materials). The mass of liquid products was calculated by weight increments in the conical flask (wt.%, on the basis of dry and ash-free raw materials). Gas phase yield was calculated by difference (wt.%, on the basis of dry and ash-free raw materials).

Figure 1.
Experimental equipment diagram of tubular pyrolysis furnace.
For convenience, CM-10, CM-20, CM-30, and CM-50 were used to carry out each COS and MIPW co-pyrolysis experiment with 10, 20, 30 and 50 wt.% of MIPW. CMC-10, CMC-20, CMC-30, and CMC-50 were used to donate each biochar produced by CM-10, CM-20, CM-30, and CM-50.
2.3. Calculation of Yield of Pyrolysis Products
The yield of COS and MIPW co-pyrolysis products was calculated by the following formula, which is based on dried ash-free raw materials.
where m1 is the mass of COS added to the quartz boat, g; m2 is the mass of MIPW added to the quartz boat, g; m3 is the mass of the quartz boat, g; m4 is the mass of the quartz boat and biochar, g; m5 is the mass of liquid in the collection bottle, g; m6 is the mass of the liquid collection bottle and liquid, g; Mad,1 is the moisture content of COS, wt.%, on an air-dry basis; Mad,2 is the moisture content of MIPW, wt.%, on an air-dry basis; Ad,1 is the ash content of COS, wt.%, on a dry basis; Ad,2 is the ash content of MIPW, wt.%, on a dry basis; Ychar is the solid phase yield, wt.%, on a dry ash-free basis; Yliq is the liquid phase yield, wt.%, on a dry ash-free basis; and Ygas is the gas phase yield, wt.%, on a dry ash-free basis.
2.4. N-Containing Components and Their Determination Methods
The types and contents of N-containing functional groups in biochar were determined and analyzed using an element analyzer (Vario MACRO cube, Langenselbold, Heisenia, Germany) and X-ray photoelectron spectroscopy (XPS, Waltham, MA, USA). Determination of NH3-N in the gas phase and NH3-N in the liquid phase was carried out with a multi-parameter water quality analyzer (5B-6C, Shanghai, China). Pyridine–barbituric acid spectrophotometry was used to quantify the HCN-N generated during the co-pyrolysis process. The collected gas mixture was quantitatively analyzed by gas chromatograph (A91, Santa Clara, CA, USA), and the amount of N2-N produced was calculated. NO3-N and NO2-N in the liquid phase were determined by the thymol method and diazo-coupling method. Because the contents of NO3-N and NO2-N in this paper were very low, both were lower than the minimum detection limit and can be ignored. The total N in liquid phase was quantitatively determined using a TOC/TN total N analyzer (Jena multi-N/C 3100, Jena, Germany), and organic-N was calculated via the subtraction method.
3. Results and Discussion
3.1. Thermogravimetric Analysis of Raw Materials
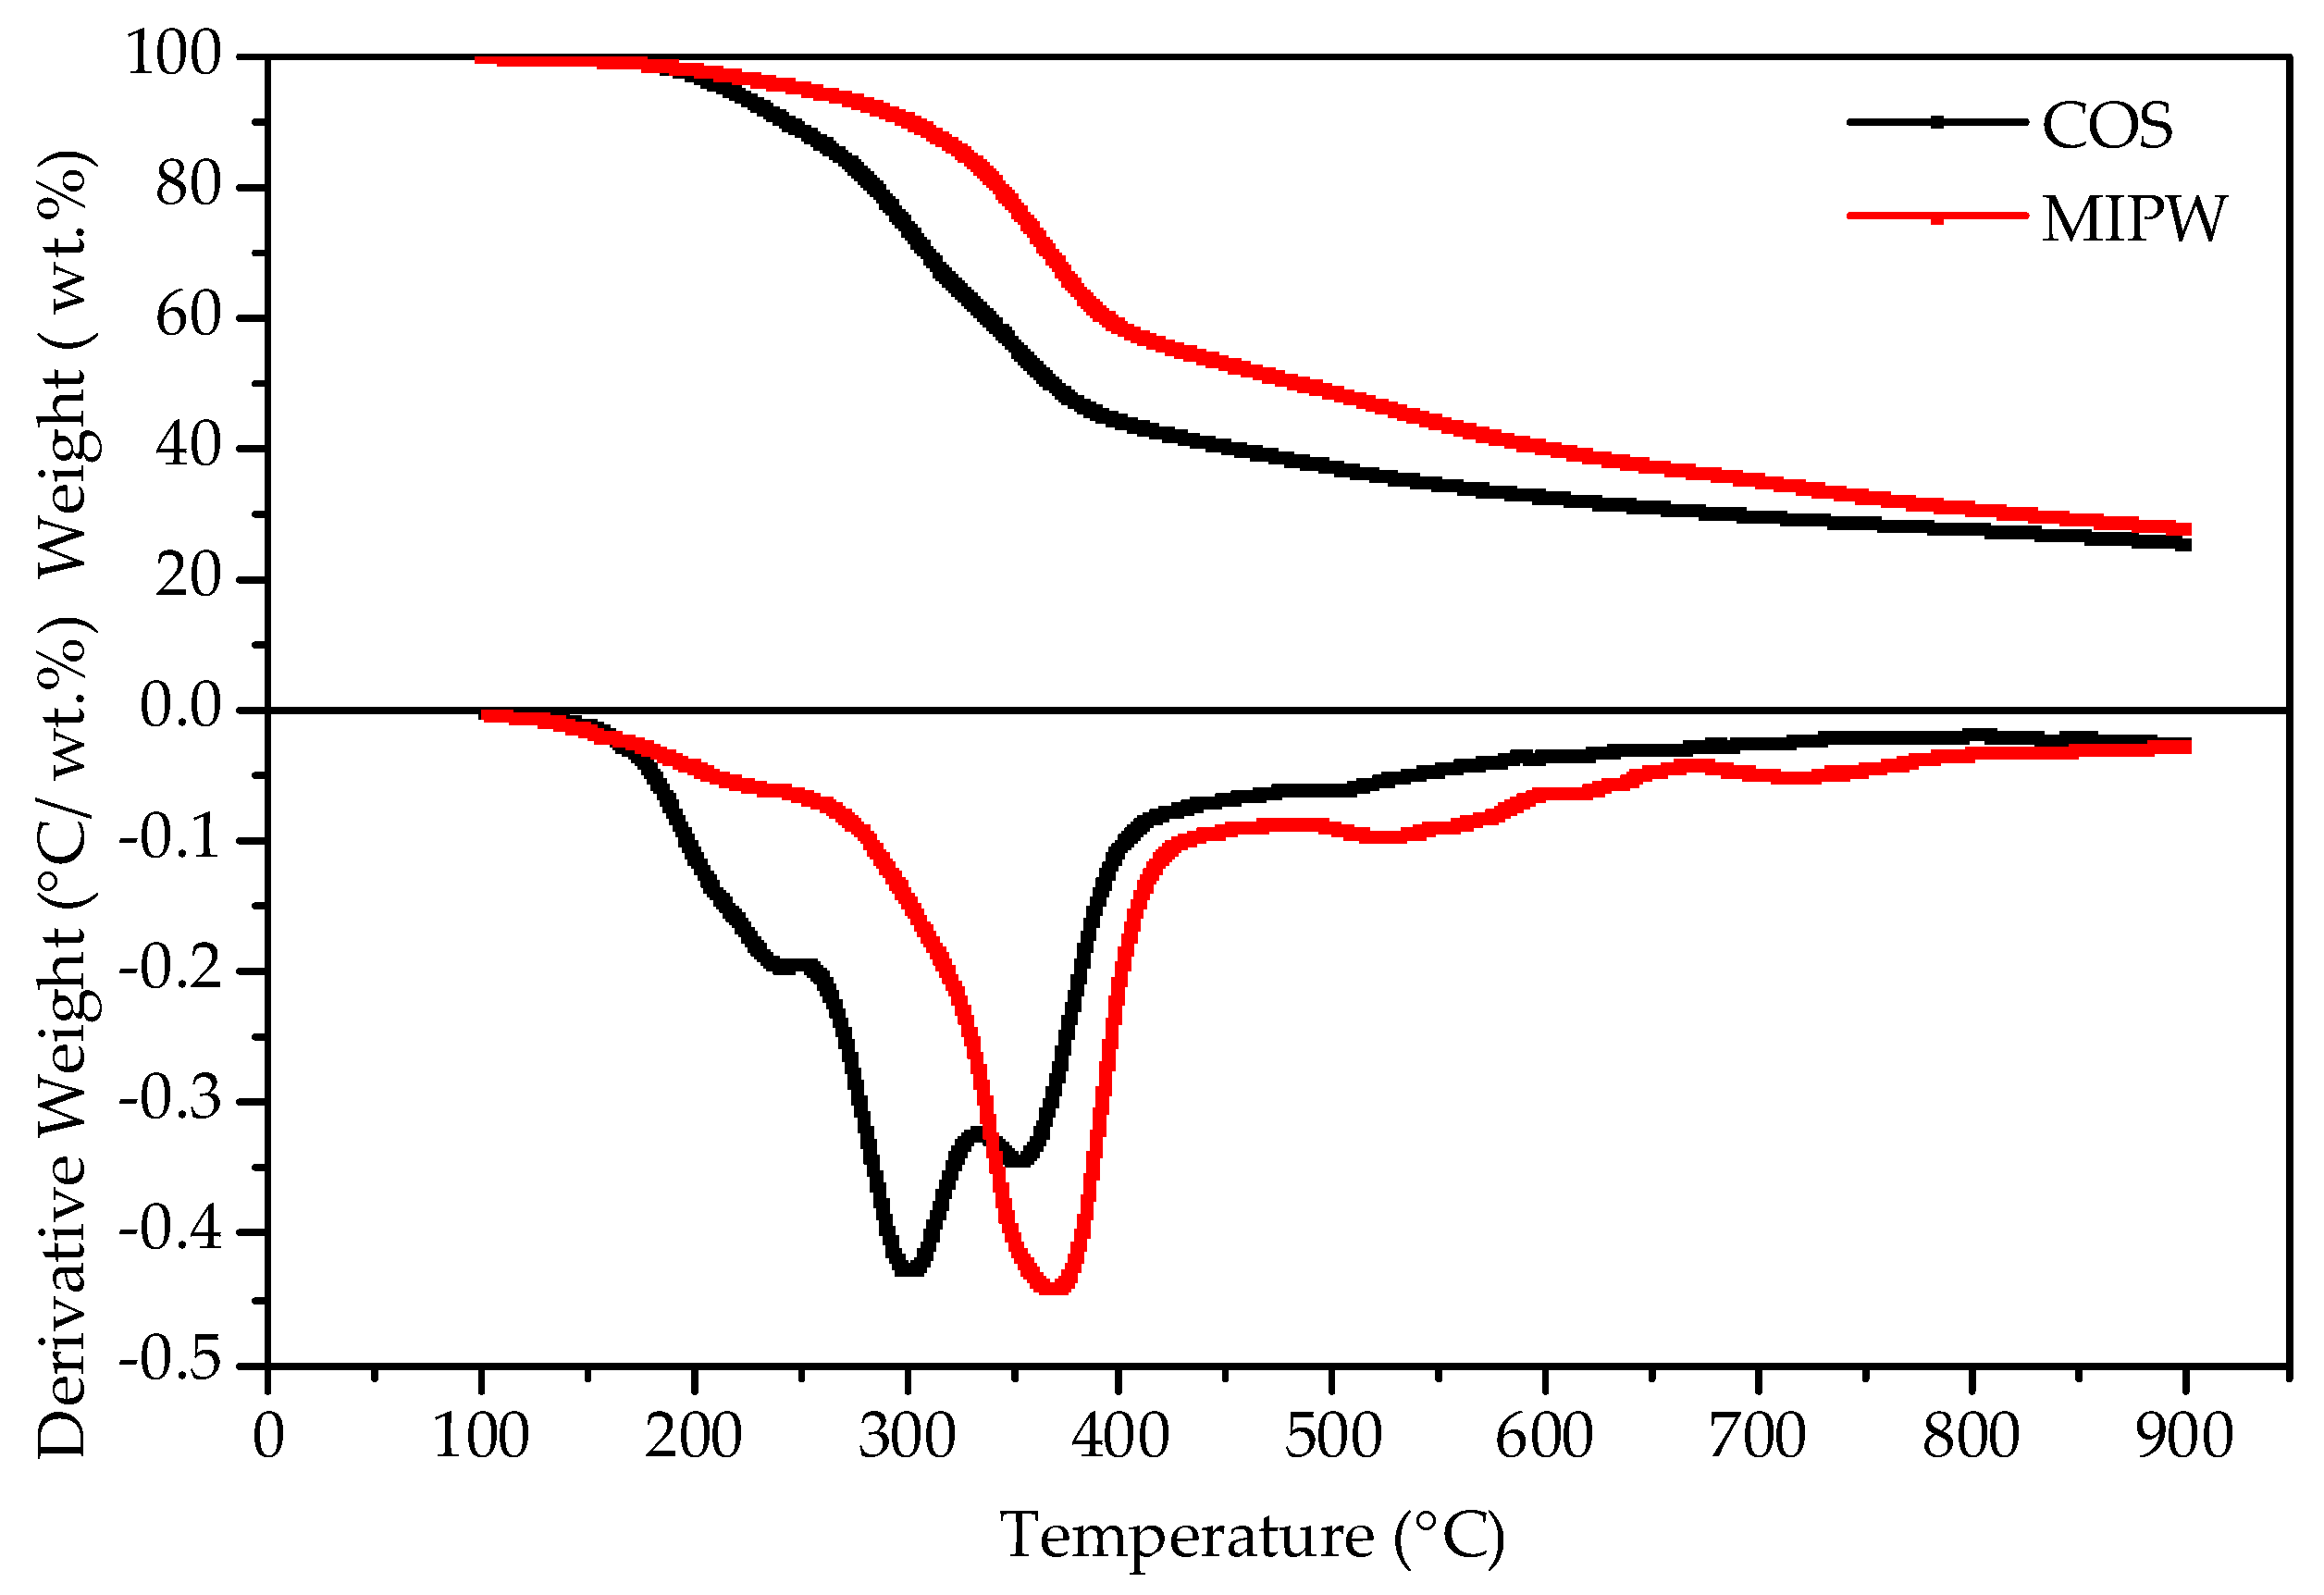
The TG-DTG curve of COS and MIPW is shown in Figure 2. In the initial stage, a small amount of weight loss occurred in the COS and MIPW from room temperature to 200 °C, respectively, which was mainly due to the removal of residual water, including crystalline water and free water; the weight loss rates were 8.67 and 6.95 wt.%, respectively. Between 200 and 400 °C, the TG curve exhibits rapid weight loss for both COS and MIPW. Additionally, within this stage, the DTG curve of COS had only one weightlessness peak, and the weightlessness rate was 32.08 wt.%. The results of the DTG curve of MIPW were basically consistent with data from the literature [10]. This stage was mainly caused by the decomposition of hydroxymethyl urea and the cleavage of the methylene ether bond in urinary formaldehyde resin, resulting in formaldehyde and phenols, ketones, olefins, etc. [11,12]. In addition, the weight loss of MIPW near 380 °C also includes the dehydration of silane alcohol groups in amorphous silica in MIPW, which changes the structure of silicon dioxide and makes the modified silica particles more prone to water loss at 500 °C to 600 °C, forming a more obvious weight loss peak [12].

Figure 2.
Thermogravimetric curves of COS and MIPW raw materials.
Compared with MIPW, the DTG curve of COS has more obvious weight loss peaks around 250, 300 and 360 °C, a result similar to the data of Yang et al. (10 °C/min) [13].
The weight loss rate of this weightlessness interval was 32.08 wt.%, and the main occurrence in the COS was the cracking of cellulose, hemicellulose and lignin. Among them, the depolymerization and ring-opening of cellulose will produce various dehydrated oligosaccharides and aldehydes, ketones, alcohols, esters and other products of small molecules. The content of hemicellulose was generally low and similar to that of cellulose. The cracking of lignin was much more difficult than the glycosidic bond cleavage of cellulose, which was mostly converted to coke and small molecular liquid phases such as methanol and ethanol [1]. The rapid weight loss ranges of COS and MIPW coincide with each other in the range of 320 to 380 °C, indicating that there was a possibility of synergism between them in the process of co-pyrolysis.
3.2. XPS Analysis of Raw Materials
The raw materials of COS and MIPW were analyzed by XPS, and the types and contents of N in the raw materials were studied by peak fitting of N1s.
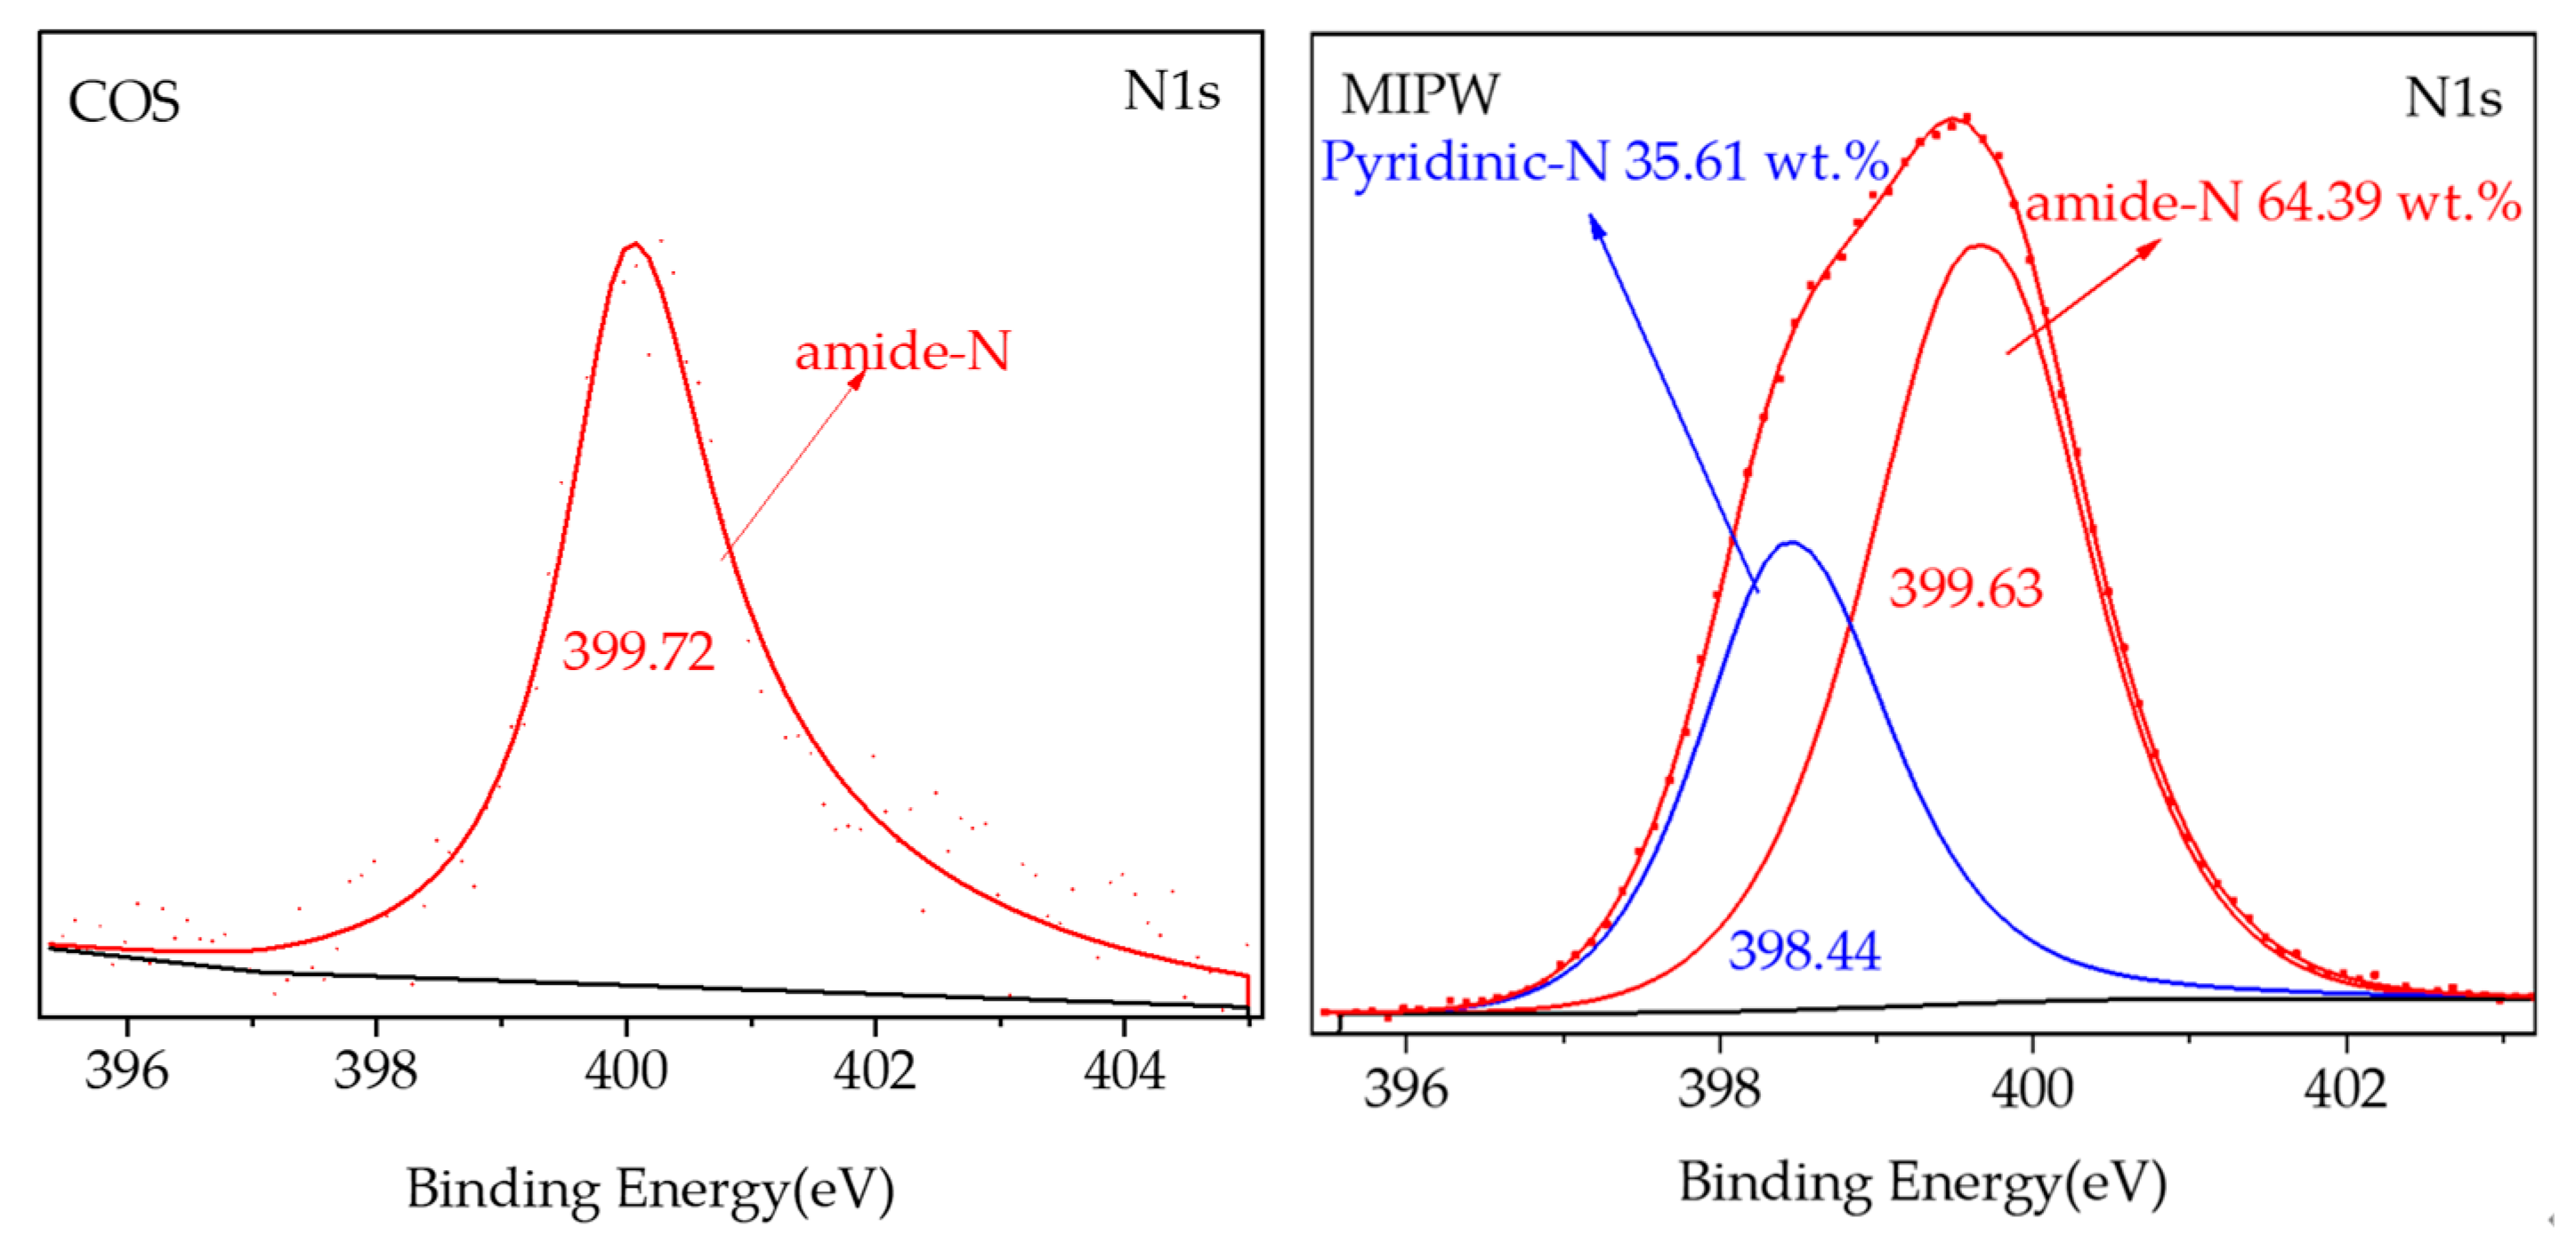
As shown in Figure 3, only amide-N formed the primary structure of the protein in the N-containing functional groups in COS, indicating that the N in COS exists mainly in the form of protein/amino acid structure. Amide-N mainly produces pyridinic-N and NOX precursors during pyrolysis at low temperatures [14]. This will be confirmed and described in detail later in the XPS and co-pyrolysis experiments of CM-0. The N1s spectra of MIPW were found at 398.44 and 399.63 eV, respectively, with N-containing functional groups, pyridinic-N and amide-N (C-N), which were similar to the presence of N in melamine and urea-formaldehyde resin, as researched by Yu et al. [15,16].
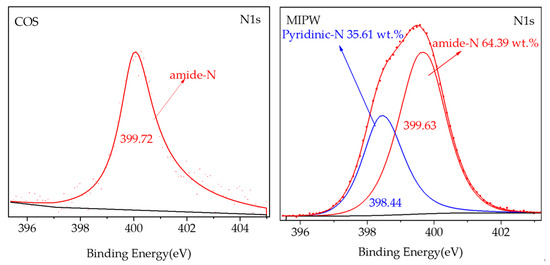
Figure 3.
N1s peak separation fitting diagram of COS and MIPW raw material XPS.
3.3. Pyrolysis Product Distribution
MIPW was mixed with COS in a certain proportion (0,10, 20, 30, 50 and 100 wt.%), and then a co-pyrolysis experiment was performed. The distribution of the pyrolysis products is shown in Figure 4.
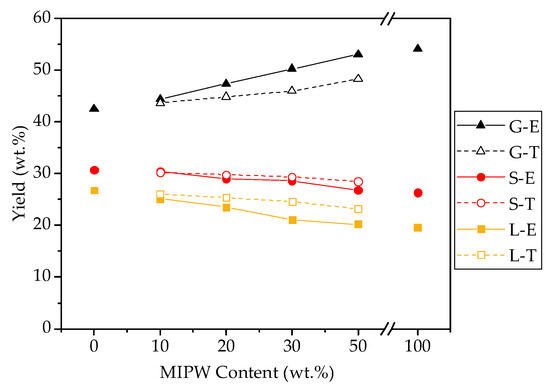
Figure 4.
COS and MIPW co-pyrolysis product distribution (S, L, and G represent the solid phase, liquid phase, and gas phase; A represents experimental value, and T represents theoretical value).
Figure 4 shows that COS pyrolysis results in a solid phase yield of 30.68 wt.%, a liquid phase yield of 26.80 wt.%, and a gas phase yield of 42.52 wt.%. MIPW pyrolysis has lower yields in the solid and liquid phase than COS pyrolysis alone, but higher yields in the gas phase at 26.32, 19.54, and 54.14 wt.%. The pyrolysis product distribution of MIPW was the same as that in the results of Chen [17], who studied MIPW pyrolysis, both showing that MIPW tends to be converted into a gas phase rather than biochar and a liquid phase. In terms of co-pyrolysis, with the increase in the proportion of MIPW, the gas phase yield increased from 44.38 wt.% (CM-10) to 53.05 wt.% (CM-50), while the solid and liquid phase yields decreased from 30.46 and 25.16 wt.% (CM-10) to 26.76 and 20.19 wt.% (CM-50), respectively.
To fully explain the increase in gas phase yield and the decrease in solid and liquid phase yields, the theoretical and experimental values of the yields of each product under different raw material ratios were compared. The results showed that the proportion of MIPW increases continuously; the experimental values of solid and liquid phase yields were lower than the theoretical ones, and the experimental value of the gas phase yield was larger than the theoretical one. The addition of MIPW promotes the secondary cleavage of pyrolysis coke and pyrolysis oil. This acts to further convert polymer compounds and small molecules in the liquid and solid phase into a non-condensing gas phase, which reduces the yield of the liquid and solid phases and increases gas phase production.
3.4. N in Biochar
3.4.1. Elemental Analysis of Biochar
The content of total N in the solid phase was quantitatively determined by an elemental analyzer, and the results are shown in Table 2.
Table 2.
N content in biochar from each experiment (on a dry ash-free basis).
As can be seen from the data in Table 2, the N content in COSC was 1.45 wt.%, which was much lower than that in MIPWC (19.05 wt.%). It shows that when MIPW was used as a N source to co-pyrolyze with COS, co-pyrolysis was achieved easily, and we observed the migration of N to find the path of N migration. In the co-pyrolysis experiment, with the gradual increase in the proportion of MIPW, the content of N in biochar obtained by co-pyrolysis increased from 3.01 wt.% (CM-10) to 9.63 wt.% (CM-50), indicating that the abundant amide-N and pyridinic-N in MIPW decomposed, reacted with the C skeleton of COSC, and existed in biochar in the form of various N-containing functional groups, thus realizing N-doping and increasing the N contents of biochar [18]. In terms of synergistic effect, the addition of MIPW makes the theoretical value of N content in biochar larger than the experimental value, indicating that there was a synergistic effect in the co-pyrolysis of COS and MIPW, and this synergistic effect makes the N-containing components in raw materials more likely to migrate to gas and liquid phases than solid phase after thermal decomposition.
3.4.2. XPS Analysis of Biochar
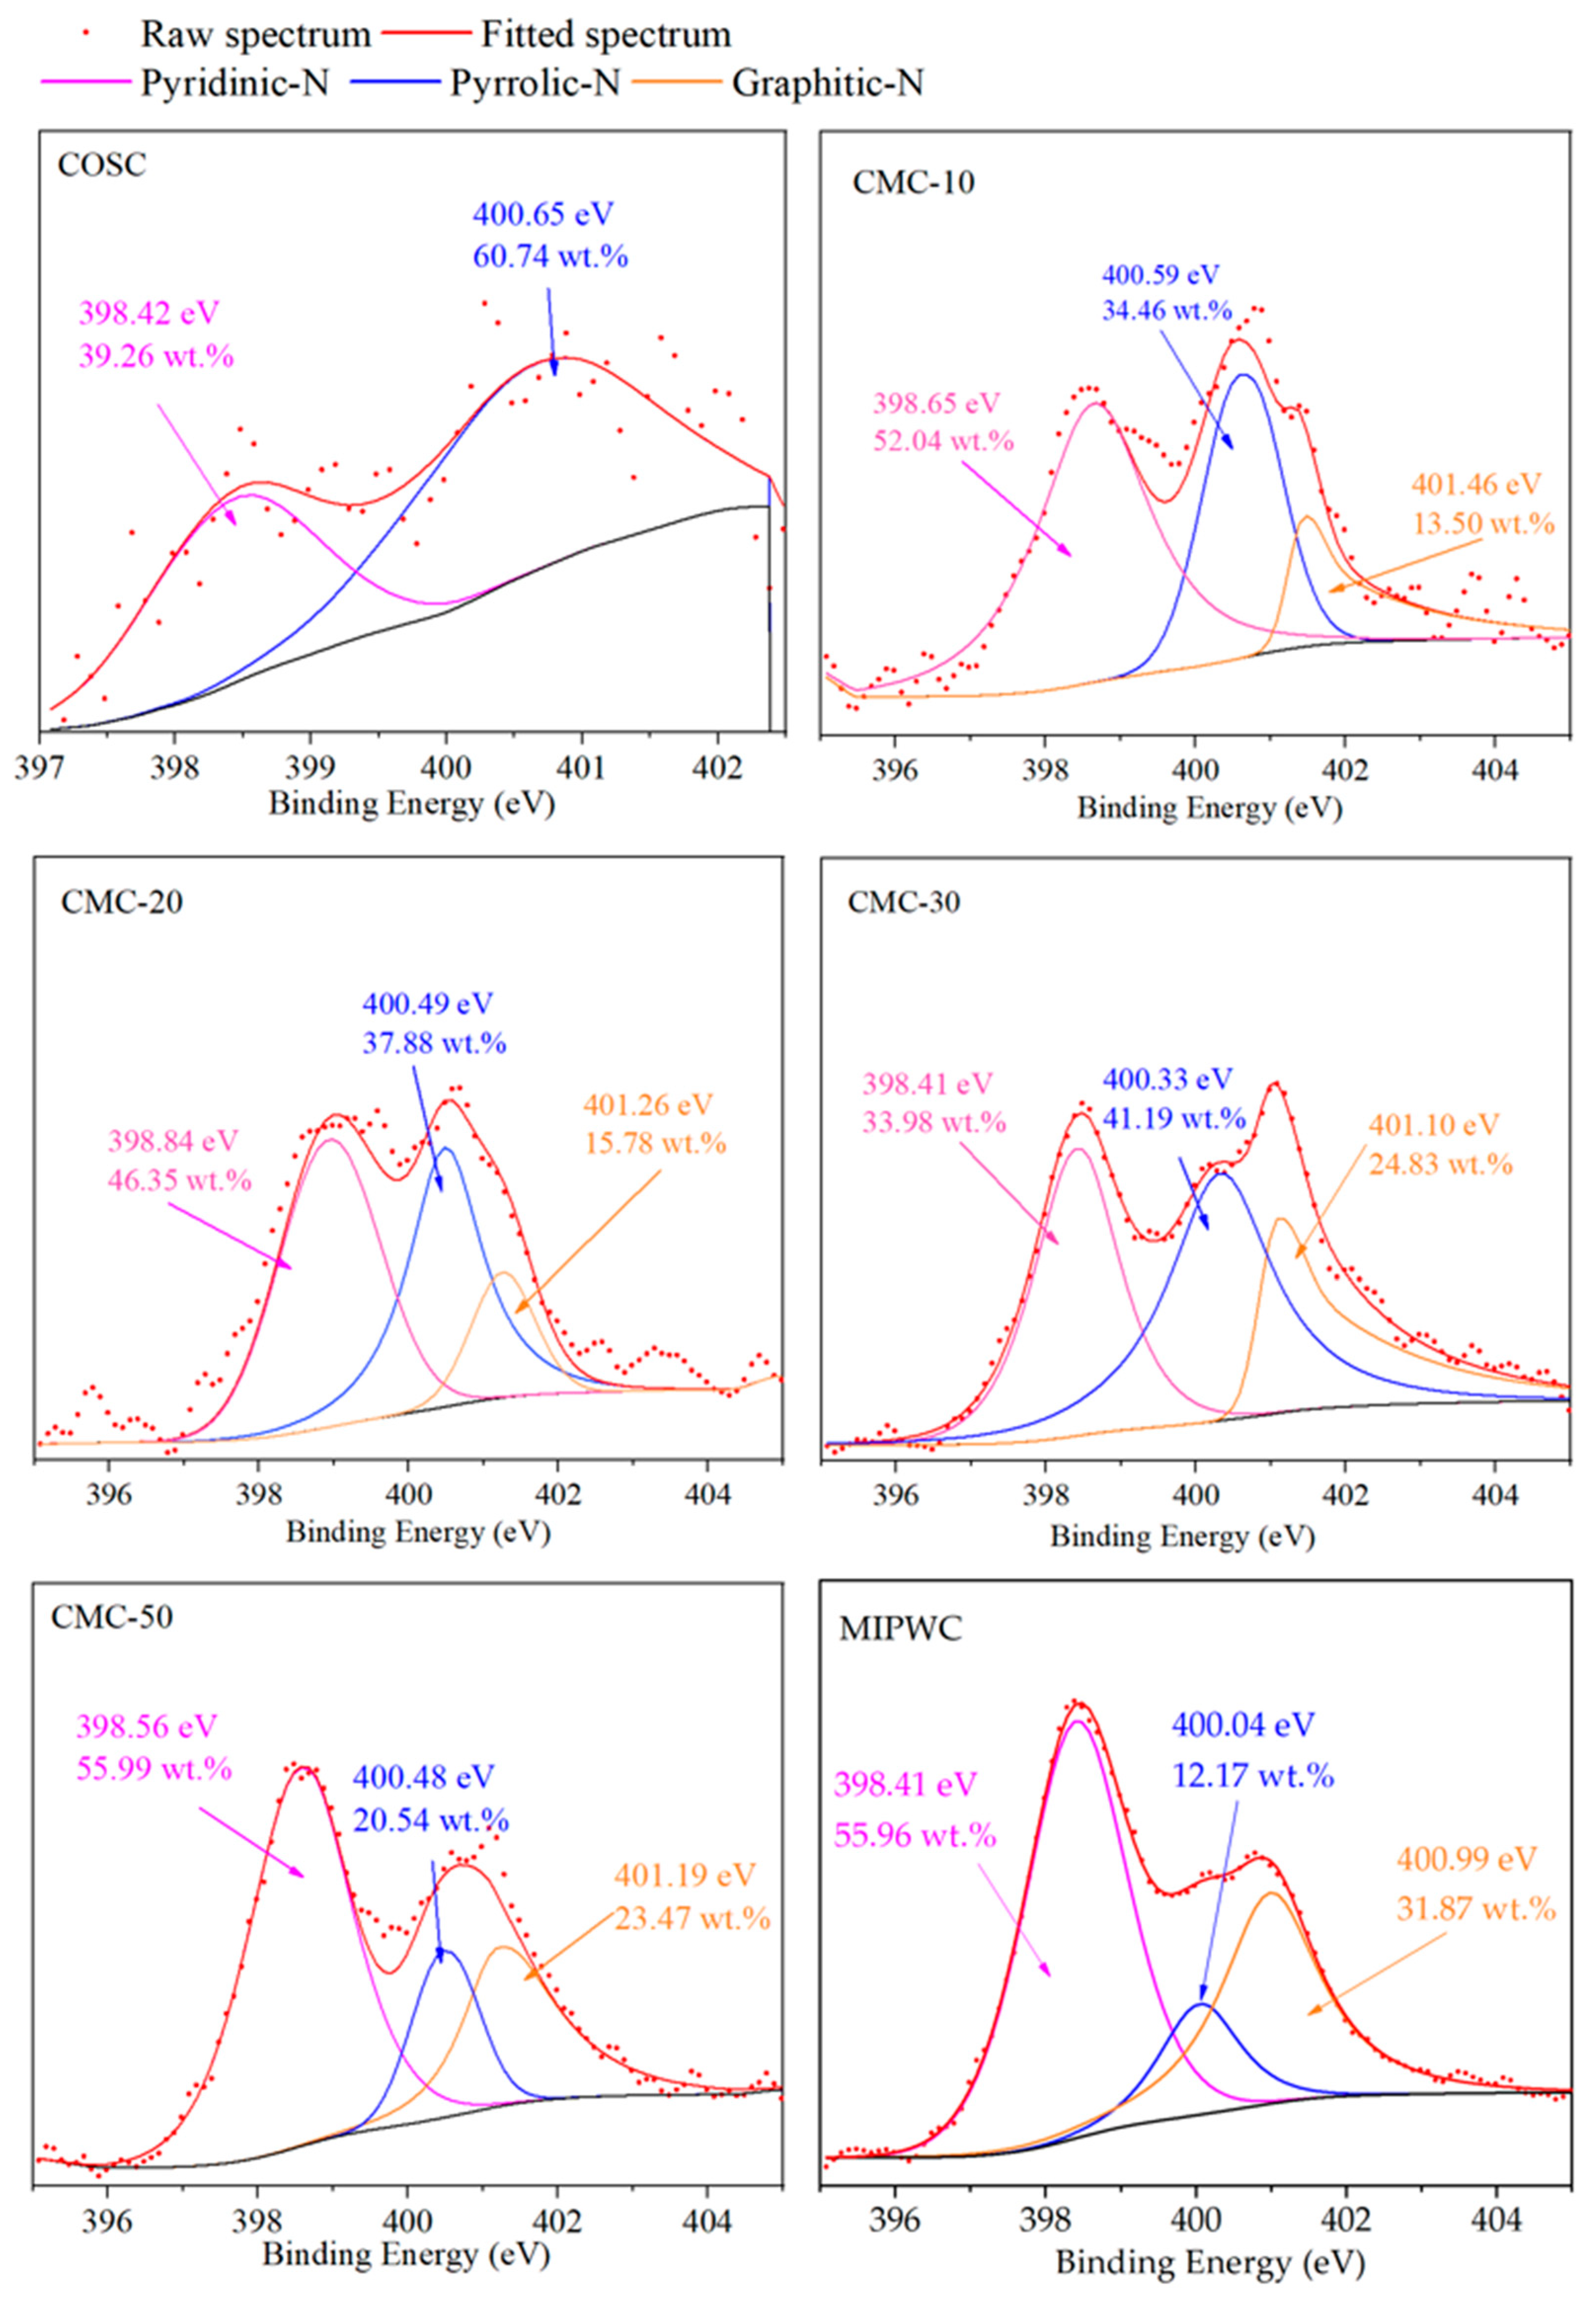
To study the effect of MIPW addition on the types and content of N-containing functional groups in biochar, we used XPS. The N1s peaks of biochar were fitted. XPS shows that the N-containing functional groups in biochar included pyrrolic-N (398.6 ± 0.3 eV), pyridinic-N (400.5 ± 0.3 eV) and graphitic-N (401.3 ± 0.3 eV) [2]. As shown in Figure 5, the N1s spectral lines in COSC prepared by COS pyrolysis alone were disordered, indicating that the content of N in COSC was very low, and there were only two N-containing functional groups, pyridinic-N and pyrrolic-N. The biochar obtained from MIPW pyrolysis alone has clear N1s spectral lines, and with high N content, there are large amounts of pyridinic-N, pyrrolic-N and graphitic-N; these results are consistent with the results of Grimm et al. [19].
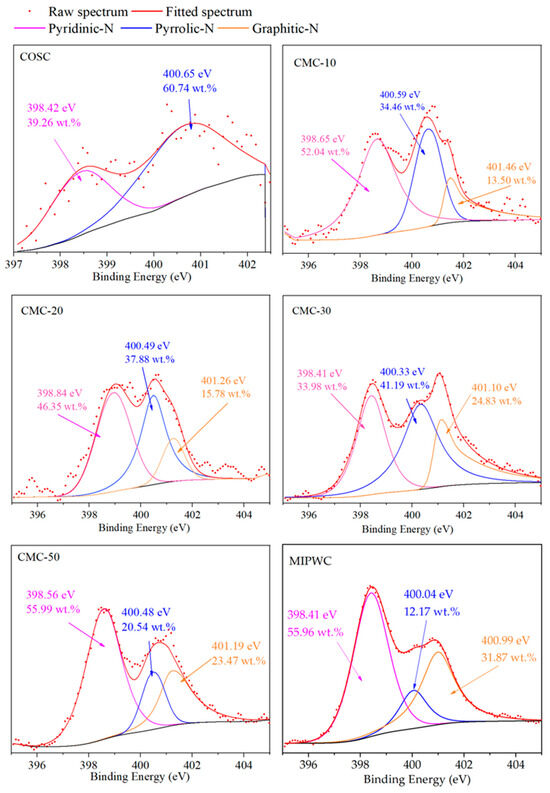
Figure 5.
N1s peak fitting of biochar.
It can be seen that with the increase in the proportion of MIPW in the raw materials, the relative content of Pyridinic-N in biochar prepared by co-pyrolysis firstly decreased from 52.04 wt.% (CMC-10) to 33.98 wt.% (CMC-30), then increased to 55.99 wt.% (CMC-50); The relative content of pyrrolic-N and graphitic-N firstly increased from 34.46 wt.% and 13.50 wt.% (CMC-10) to 41.19 wt.% and 24.83 wt.% (CMC-30), then decreased to 20.54 wt.% and 23.47 wt.% (CMC-50). The results show that when the ratio of MIPW in raw materials is less than 30 wt.%, It will inhibit the formation of pyridinic-N and increase the generation of pyrrolic-N and graphitic-N. When the MIPW ratio was more than 30 wt.%, the opposite trend was observed, and the distribution law of pyridinic-N, graphitic-N and pyrrolic-N in CMC-50 is similar to that in MIPWC rather than CMC-10, 20, and 30. This indicates that there was some MIPW pyrolysis alone in the co-pyrolysis experiment of CM-50.
As mentioned above, the CM-50 experiment exhibits that there was some MIPW pyrolysis alone. So, if we removed the results of CM-50 in Figure 6, we can see a slight increase in the theoretical value of pyridinic-N and graphitic-N; pyrrolic-N showed a rapid decrease. While the experimental value of pyridinic-N underwent a rapid decrease, pyrrolic-N and graphitic-N had a slight increase. There was a large difference between the theoretical and experimental values of pyridinic-N, pyrrolic-N and graphitic-N. This means that there was an obvious synergistic effect in the co-pyrolysis process with COS and MIPW.
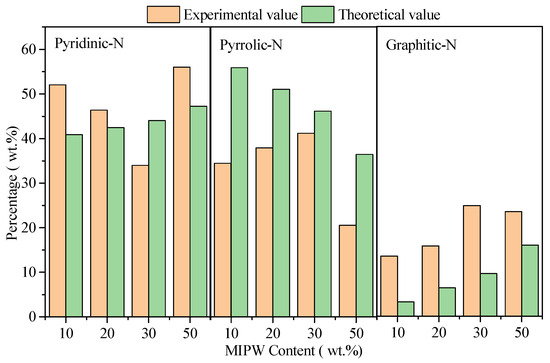
Figure 6.
Relative content of N-containing functional groups in the solid phase.
3.4.3. N-Containing Functional Groups in the Gas Phase
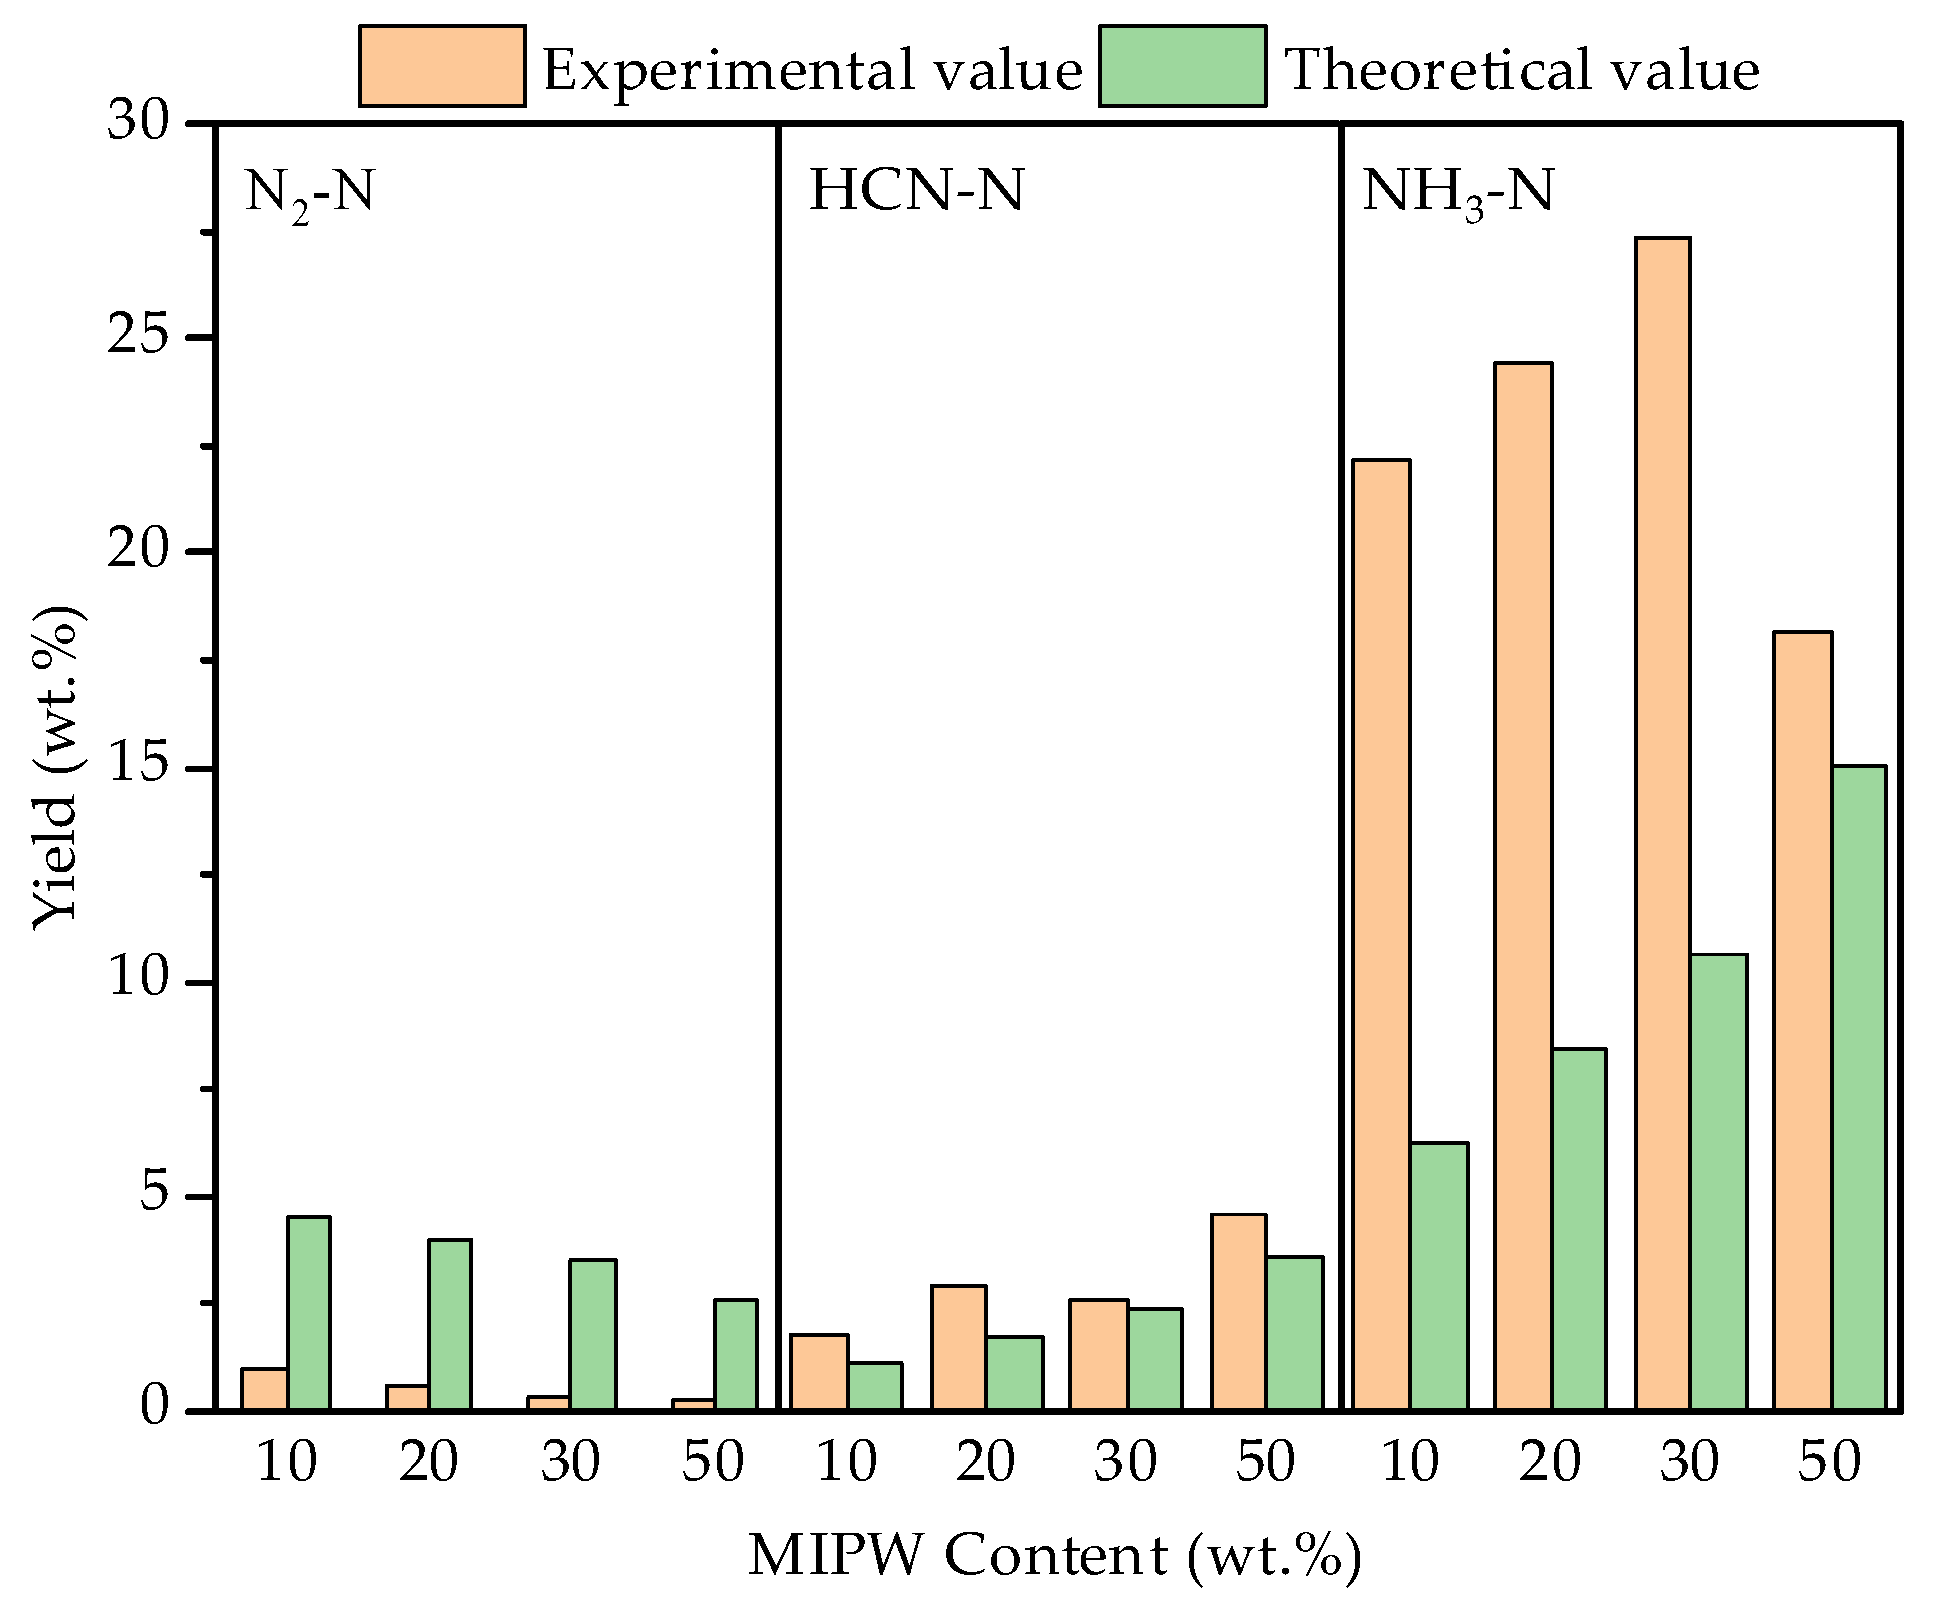
The co-pyrolysis experiment found that NH3, HCN, and N2 were the main N-containing components, which were mainly transformed by dehydrogenation, dehydration, decarboxylation and a ring-opening reaction during the formation of pyridinic-N and pyrrolic-N in the solid phase [20,21]. It can be seen from Figure 7 that the highest content of NH3-N was 27.36 wt.% when the proportion of MIPW was 30 wt.%, which was much higher than that of HCN-N (2.62 wt.%), because the N in COS and MIPW was mainly in the form of protein-N [21]. Zhan [22] and others pointed out that 80 wt.% of NH3 comes from the devolatilization stage, which produces NH3 during the cyclization of protein-N to pyridinic-N and pyrrolic-N. The formation of HCN depends on the decomposition of the intermediate in the secondary reaction with the help of the H radical, which is formed by the continuous dehydrogenation of ammonia-N and nitrile-N and the ring breakage of heterocyclic-N [20]. N2 has a low N content, which is mainly formed by the oxidation of N in coke with O2 to form NOX, which then continues to be oxidized into N2 [23]. The yield of N-containing components in the gas phase was consistent with the type and relative content of N from XPS analysis of the raw materials.
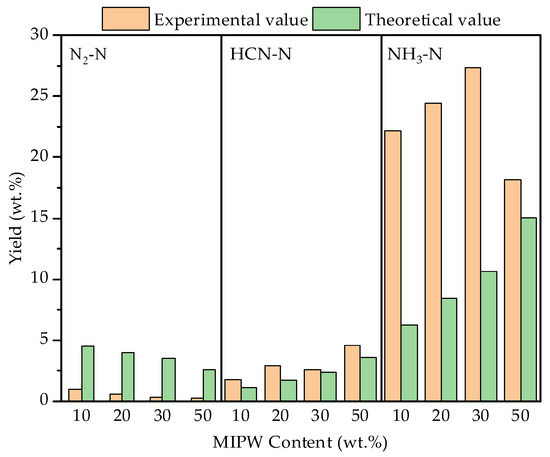
Figure 7.
Yield and synergistic effect of N-containing components in the gas phase.
From the data shown in Figure 7, the experimental values of NH3-N and HCN-N yield in the gas phase were higher than the theoretical values, and the experimental value of N2-N yield was much lower than the theoretical value. With the increase in the proportion of MIPW, the difference between experimental values and theoretical values reaches the maximum at 30 wt.% and then decreases at 50 wt.%. It shows that the synergistic effect of co-pyrolysis promotes the formation of NH3-N and HCN-N and inhibits the formation of N2-N.
3.4.4. N-Containing Components in the Liquid Phase
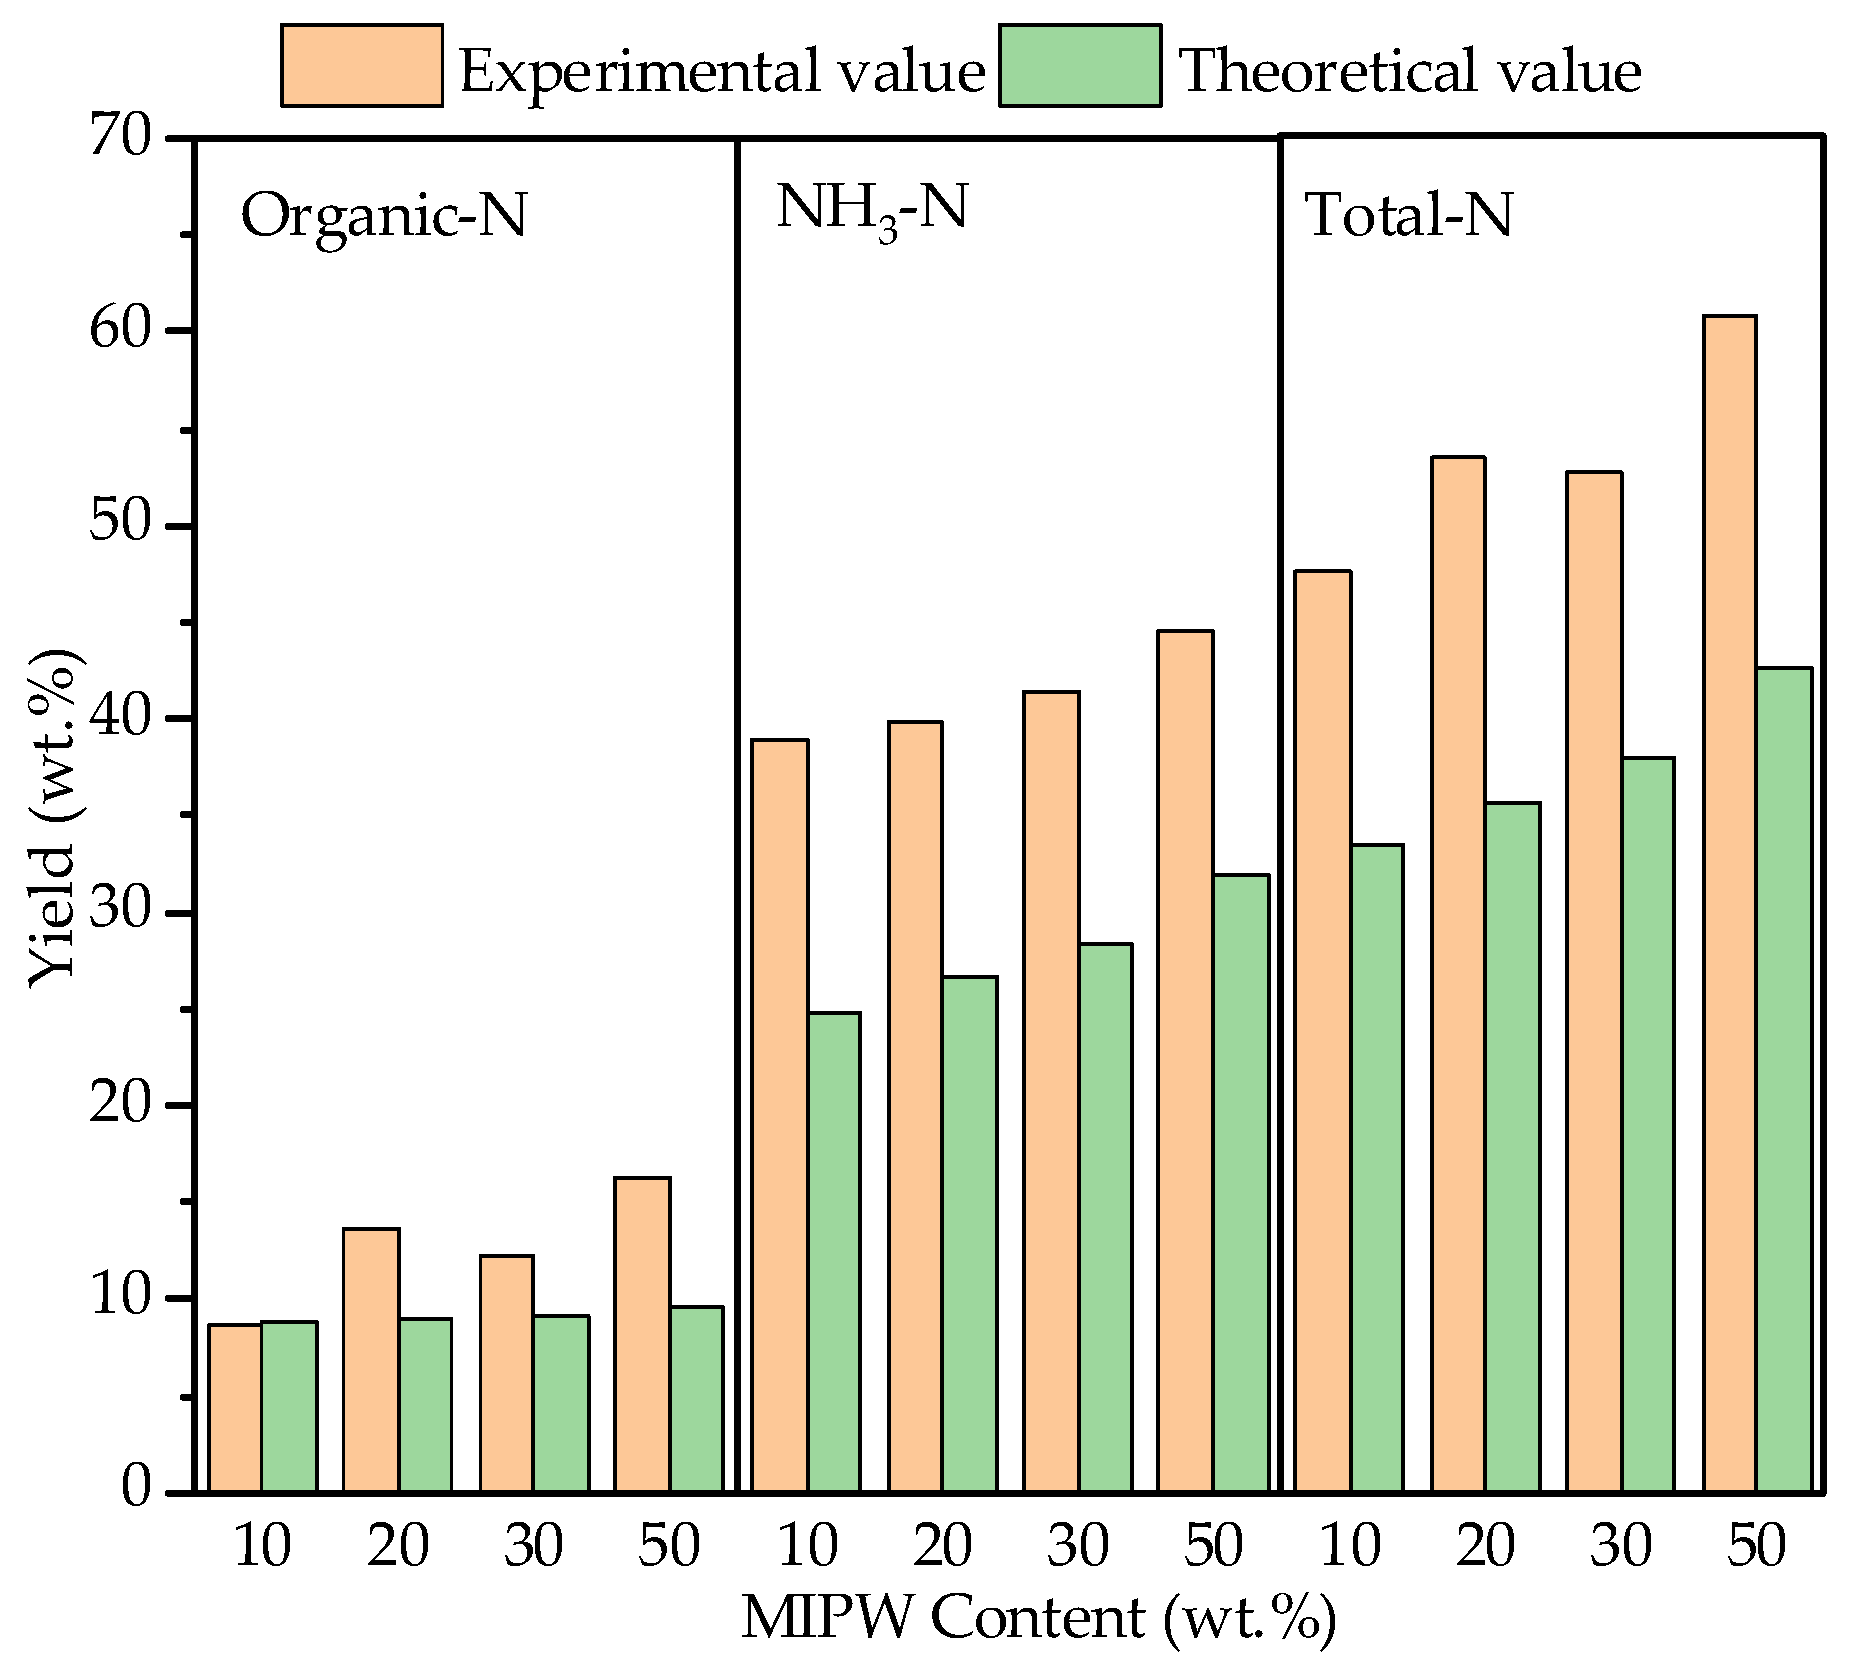
The liquid phase formed by co-pyrolysis mainly contains water and tar, in which the N-containing components include NH3-N in water and organic-N in the tar, which were mainly converted from heterocyclic-N and ammonia-N [24]. According to the data in Figure 8, NH3-N in the liquid phase increased from 38.90 wt.% (CM-10) to 43.51 wt.% (CM-50), and organic-N increased from 8.60 wt.% (CM-10) to 14.21 wt.% (CM-50). This showed that the liquid phase products mainly contain NH3. With the increase in the MIPW proportion, the proportion of N converted to NH3 further increased. In addition, because the N-containing component in tar was mainly ammonia-N, and the dehydrogenation reaction between tar and coke was a path to form NH3, a small amount of ammonia-N was formed by dehydrogenation or dehydration during devolatilization to form nitrile-N, which was the main source of HCN-N formation [8]. From the perspective of the synergistic effect, the experimental values of the liquid phase, the NH3-N, and organic-N yields were larger than the theoretical values, indicating that the migration of the N in raw materials to the liquid phase had been promoted and increased with the increase in the proportion of MIPW.

Figure 8.
Yield and synergistic effect of N-containing components in the liquid phase.
3.4.5. N Balance
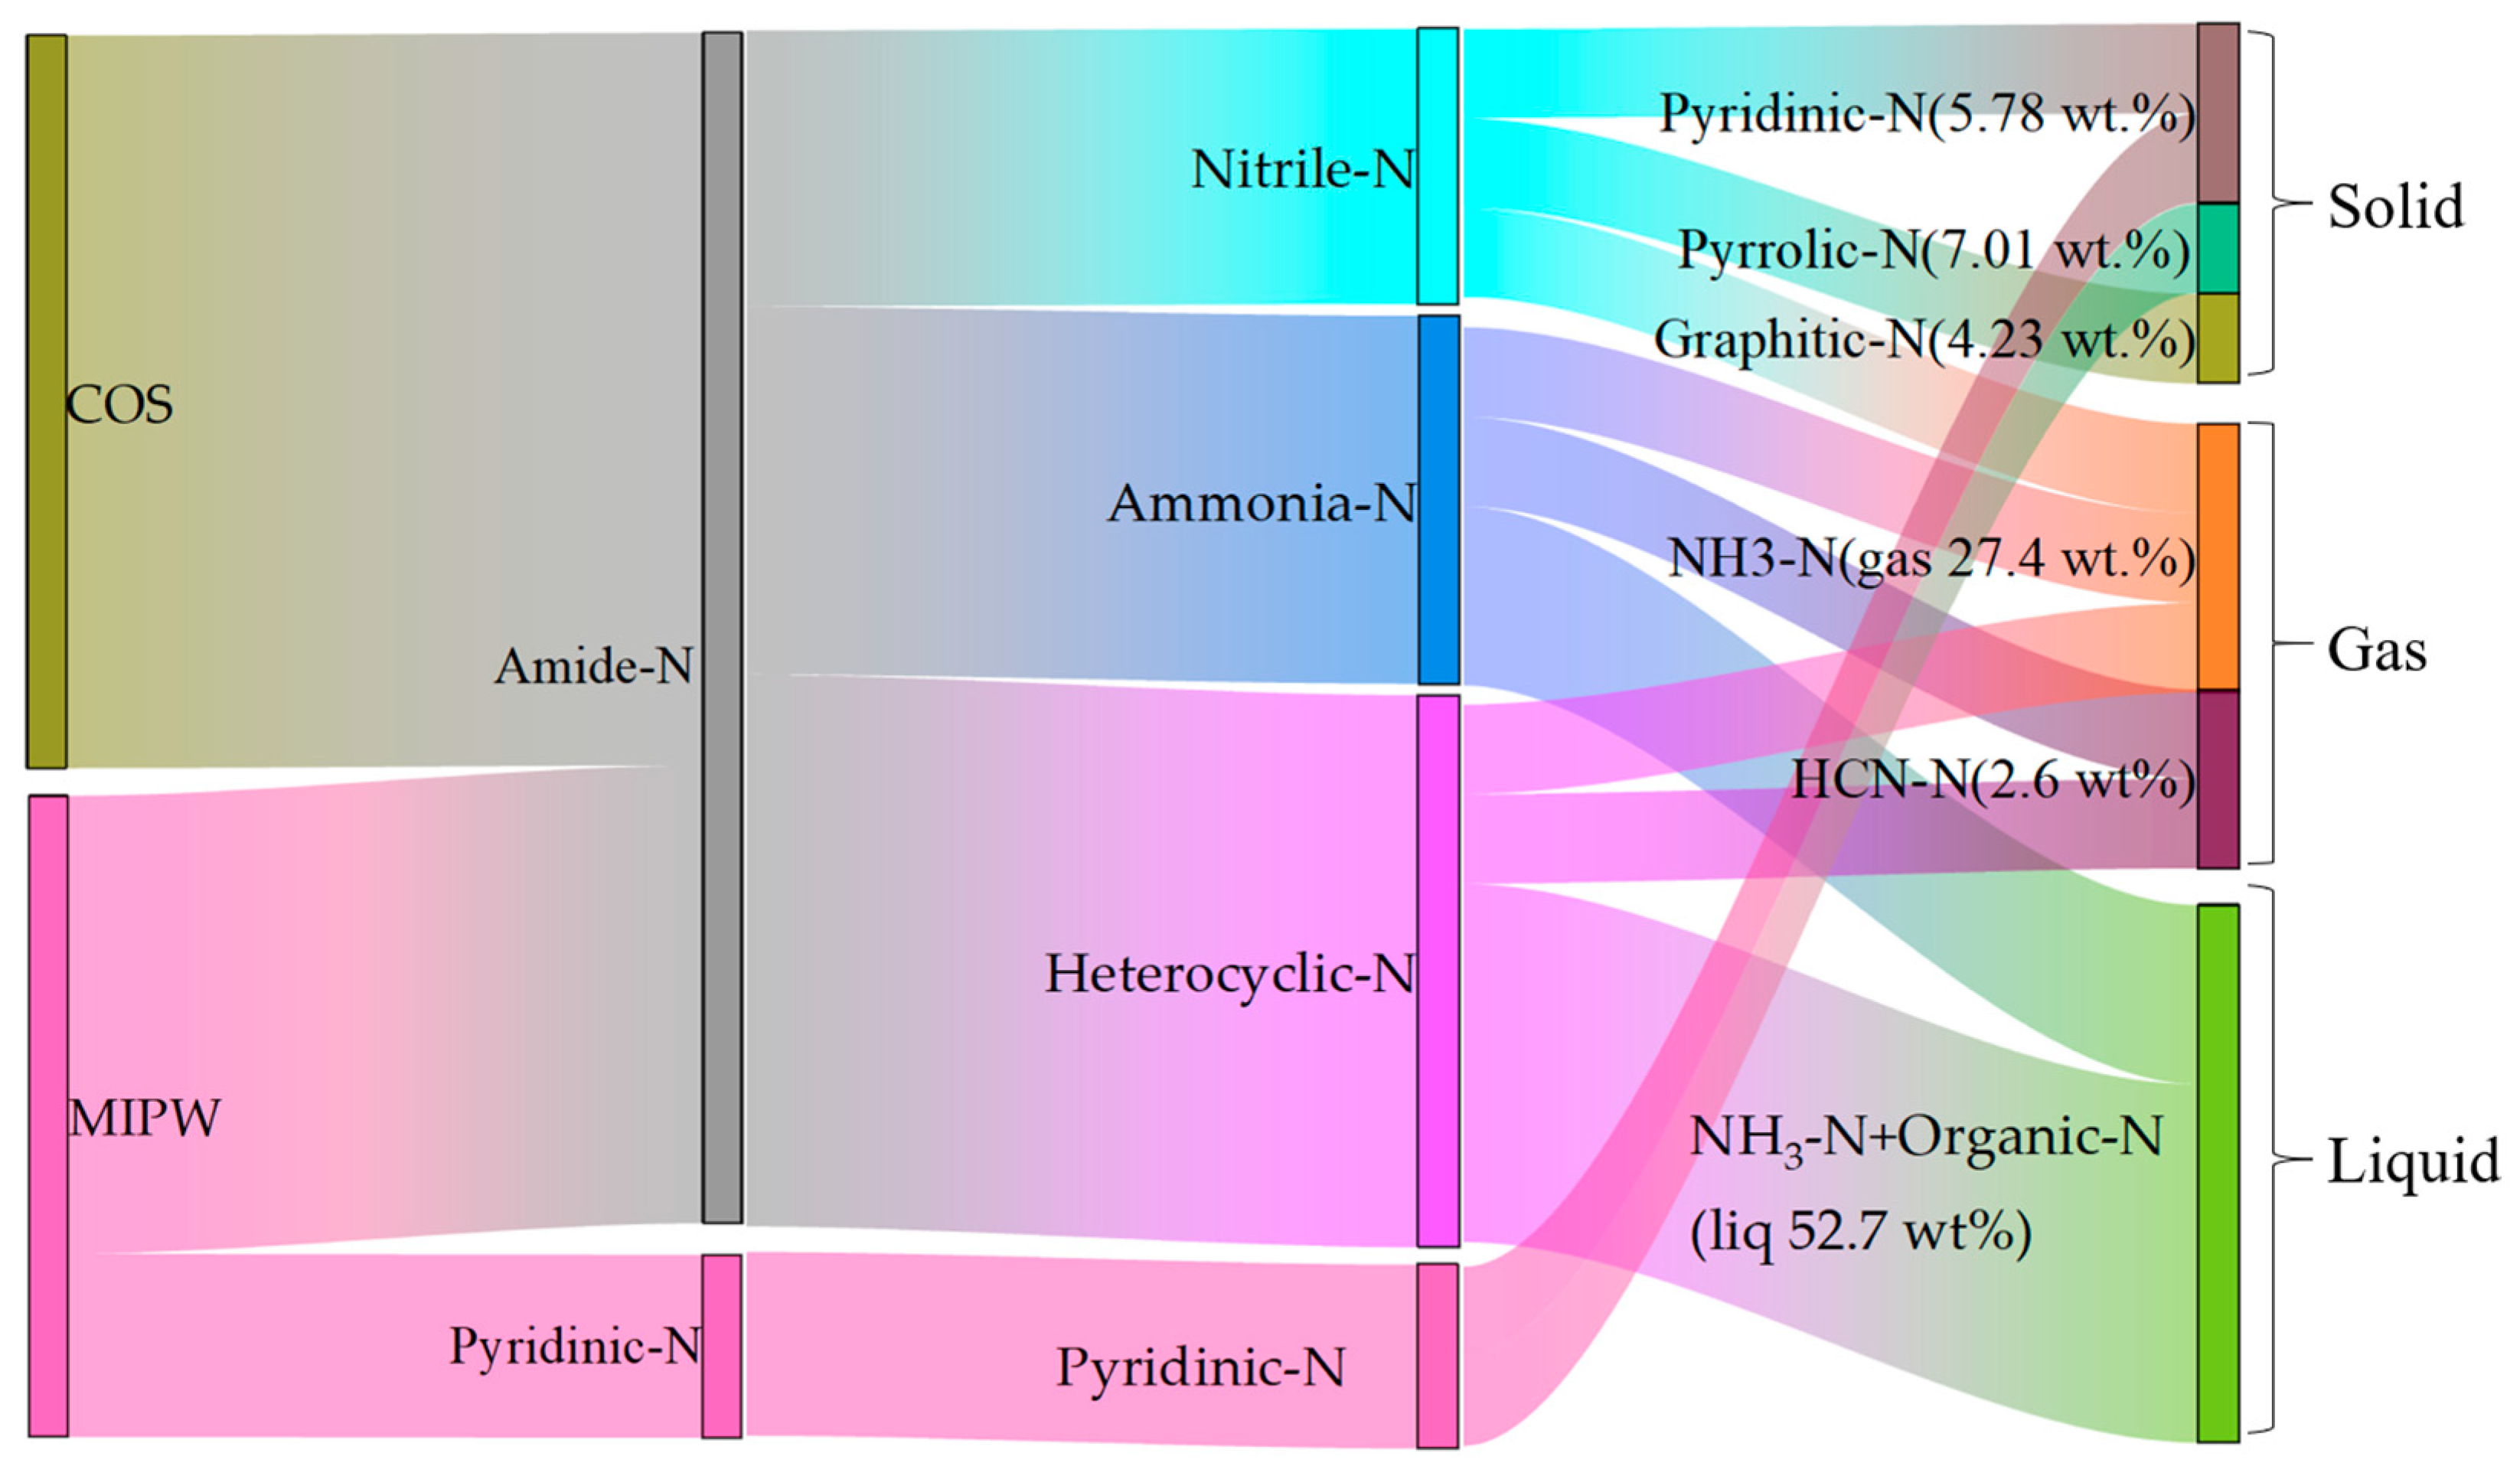
The data shown in Table 3 are the normalized data of the N measured in each component. It can be seen that in the process of COS pyrolysis, the proportion of N migration to the gas phase was low, and most of it was transferred to the liquid and solid phases, within which the content of N in the solid phase was as high as 58.81 wt.%. Compared with COS pyrolysis alone, the proportion of N migration to the gas phase and liquid phase was higher in MIPW pyrolysis, and was 32.82 and 51.00 wt.%, in the form of NH3-N. Figure 9 shows the migration path and transformation mechanism of N in raw materials to pyrolysis products during the whole co-pyrolysis process (taking CM-30 as an example). COS and MIPW have the most similar amide-N content, which is the main kind of N composition within the whole N migration path. Amide-N was crosslinked to form nitrile-N, which was then converted to pyridinic-N, graphitic-N in the solid phase, and HCN-N in the gas phase. Amide-N will generate ammonia-N and heterocyclic-N after open-loop and open-chain reactions, which will then be converted into NH3-N by deamination and HCN-N by dehydrogenation. NH3-N and organic-N in the liquid phase were also derived from this. The remaining N in MIPW was mainly in the form of N in aromatic heterocycles, which can be easily converted into pyrrolic-N and graphitic-N.
Table 3.
Yield of N-containing components in pyrolysis products (wt.%).
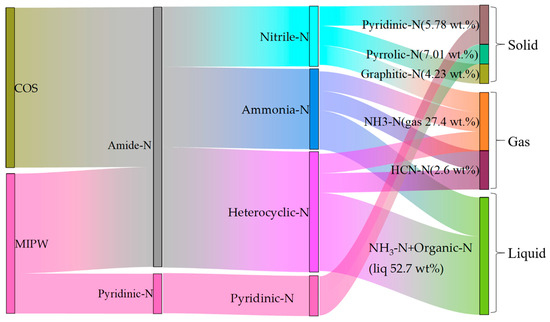
Figure 9.
The migration path of N during CM-30 co-pyrolysis (the percentage in the bracket represents the N mass ratio of each N-containing component).
4. Conclusions
As a form of industrial waste with high N content, direct combustion of MIPW can cause waste of resources and pollute the environment. To accomplish the treatment and reuse of MIPW, it can be used as a N source to prepare N-doped biochar by co-pyrolysis with COS. The N migration path is a problem that must be studied in both the disposal of substances containing high amounts of N and the preparation of N-doped biochar. The migration path of N in the co-pyrolysis process was as follows:
In terms of the migration of N content from raw materials to products, the products could be sequenced from high to low N content as follows: liquid phase (47.50~57.72 wt.%), gas phase (24.92~30.33 wt.%), and solid phase (27.58~16.31 wt.%), with the MIPW proportion being from 10 wt.% to 50 wt.% in raw materials.
In terms of the content of each N-containing component in products, the N-containing components in the solid phase were mainly pyridinic-N (5.78~9.13 wt.%) and pyrrolic-N (3.35~9.11 wt.%), and a small amount of Graphic-N (3.72~4.23 wt.%).
In the liquid phase, the N-containing components were dominated by NH3-N (38.90~43.51 wt.%) accompanied by a small amount of organic-N (8.60~14.21 wt.%). In the gas phase, the N-containing components were dominated by NH3-N (22.18%~21.14 wt.%) and HCN-N (1.78~4.57 wt.%), with a small amount of N2-N (0.26~0.96 wt.%).
Overall, with the increase in the proportion of MIPW in the raw materials, the content of HCN-N and NH3-N (liquid) showed a slight increase; the contents of organic-N and N2-N were basically unchanged; and the contents of NH3-N (gas), pyridinic-N and graphitic-N firstly increased and then decreased.
Moreover, there were obvious synergies in the COS and MIPW co-pyrolysis process. In terms of products, this allowed the co-pyrolysis experiment to produce more gas components. In terms of N migration, this made the N in the raw materials more likely to be converted into NH3-N in the gas and liquid phases and pyrrolic-N and graphitic-N in the solid phase.
Author Contributions
Methodology, Z.Z., Y.L. and P.L.; Writing—original draft, Z.Z.; Writing—review & editing, Y.L.; Project administration, Y.L., P.L., T.S. and T.L. All authors have read and agreed to the published version of the manuscript.
Funding
This research was funded by the National Natural Science Foundation of China (Grant No. 52306224) and Changzhou Sci&Tech Program (Grant No. CJ20220138).
Institutional Review Board Statement
Not applicable.
Informed Consent Statement
Not applicable.
Data Availability Statement
Data are contained within the article.
Conflicts of Interest
The authors declare no conflict of interest.
References
- Zhu, X.; Lu, Q. Principles and Technologies of Biomass Pyrolysis; University of Science and Technology of China Press: Hefei, China, 2006. (In Chinese) [Google Scholar]
- Chen, X.Y.; Chen, C.; Zhang, Z.J.; Xie, D.H.; Deng, X.; Liu, J.W. Nitrogen-doped porous carbon for supercapacitor with long-term electrochemical stability. J. Power Sources 2013, 230, 50–58. [Google Scholar] [CrossRef]
- Cheng, T.; Bian, Y.; Li, J.; Ma, X.; Yang, L.; Zhou, L.; Wu, H. Nitrogen-doped porous biochar for selective adsorption of toluene under humid conditions. Fuel 2023, 334, 126452. [Google Scholar] [CrossRef]
- Yu, B.; Man, Y.; Wang, P.; Wu, C.; Xie, J.; Wang, W.; Jiang, H.; Zhang, L.; Zhang, Y.; Mao, L.; et al. Catalytic degradation of dimethomorph by nitrogen-doped rice husk biochar. Ecotoxicol. Environ. Saf. 2023, 257, 114908. [Google Scholar] [CrossRef]
- Zhang, X.; Wu, J.; Yang, H.; Shao, J.; Wang, X.; Chen, Y.; Zhang, S.; Chen, H. Preparation of nitrogen-doped microporous modified biochar by high temperature CO2–NH3 treatment for CO2 adsorption: Effects of temperature. RSC Adv. 2016, 6, 98157–98166. [Google Scholar] [CrossRef]
- Zhong, Y.; He, J.; Duan, S.; Cai, Q.; Pan, X.; Zou, X.; Zhang, P.; Zhang, J. Revealing the mechanism of novel nitrogen-doped biochar supported magnetite (NBM) enhancing anaerobic digestion of waste-activated sludge by sludge characteristics. J. Environ. Manag. 2023, 340, 117982. [Google Scholar] [CrossRef]
- Ma, L.L.; Hu, X.; Liu, W.J.; Li, H.C.; Lam, P.K.; Zeng, R.J.; Yu, H.Q. Constructing N, P-dually doped biochar materials from biomass wastes for high-performance bifunctional oxygen electrocatalysts. Chemosphere 2021, 278, 130508. [Google Scholar] [CrossRef] [PubMed]
- Xu, L.; Fu, B.; Sun, Y.; Jin, P.; Bai, X.; Jin, X.; Shi, X.; Wang, Y.; Nie, S. Degradation of organic pollutants by Fe/N co-doped biochar via peroxymonosulfate activation: Synthesis, performance, mechanism and its potential for practical application. Chem. Eng. J. 2020, 400, 125870. [Google Scholar] [CrossRef]
- Lan, C. Experimental Study on Producing Particleboard by Using Waste Impregnated Paper. China For. Prod. Ind. 2016, 43, 6–9. (In Chinese) [Google Scholar]
- Zhang, Y.; Lin, X.; Hu, C.; Yun, H. Activated carbon from melamine-impregnated paper. BioResources 2023, 18, 1128. [Google Scholar] [CrossRef]
- Peng, J.; Liao, D.; Yan, C.; Yang, F.; Zhang, P.; Du, G.; Zhou, X. Effect of zinc chloride on the properties of tannin-urea-formaldehyde (TUF) co-polycondensation resins. J. Northwest For. Univ. 2023, 38, 228–234. [Google Scholar]
- Samaržija-Jovanović, S.; Jovanović, V.; Konstantinović, S.; Marković, G.; Marinović-Cincović, M. Thermal behavior of modified urea–formaldehyde resins. J. Therm. Anal. Calorim. 2011, 104, 1159–1166. [Google Scholar] [CrossRef]
- Yang, Z.; Fu, L.; Fan, F. Thermal Characteristics and Kinetics of Waste Camellia oleifera Shells by TG–GC/MS. ACS Omega 2019, 4, 10370–10375. [Google Scholar] [CrossRef]
- Zhan, H.; Zhuang, X.; Song, Y.; Yin, X.; Cao, J.; Shen, Z.; Wu, C. Step pyrolysis of n-rich industrial biowastes: Regulatory mechanism of no x precursor formation via exploring decisive reaction pathways. Chem. Eng. J. 2018, 344, 320–331. [Google Scholar] [CrossRef]
- Li, X.; Zhang, P.; Huang, H.; Zhai, X.; Chen, B.; He, Y.; Guo, Z. Etched Carbon Fiber/Polyaniline Composite with p–n Heterojunction for High-Energy Electrochemical Supercapacitor. ECS J. Solid State Sci. Technol. 2021, 10, 013005. [Google Scholar] [CrossRef]
- Yu, D.L.; He, J.L.; Liu, Z.Y.; Xu, B.; Li, D.C.; Tian, Y.J. Phase transformation of melamine at high pressure and temperature. J. Mater. Sci. 2008, 43, 689–695. [Google Scholar] [CrossRef]
- Chen, Q.; Dong, Z.; Zhang, C.; Yue, Y.; Xu, Q. Variation behavior of organic compounds in melamine-urea-formaldehyde impregnated bond paper in different pyrolysis stages. J. Hazard. Mater. 2022, 436, 129237. [Google Scholar] [CrossRef]
- Wan, Z.; Sun, Y.; Tsang, D.C.; Khan, E.; Yip, A.C.; Ng, Y.H.; Rinklebe, J.; Ok, Y.S. Customised fabrication of nitrogen-doped biochar for environmental and energy applications. Chem. Eng. J. 2020, 401, 126136. [Google Scholar] [CrossRef]
- Grimm, A.; dos Reis, G.S.; Khokarale, S.G.; Ekman, S.; Lima, E.C.; Xiong, S.; Hultberg, M. Shiitake spent mushroom substrate as a sustainable feedstock for develop highly efficient nitrogen-doped biochar for treatment of dye-contaminated water. J. Water Process Eng. 2023, 56, 104435. [Google Scholar] [CrossRef]
- Zheng, Y.; Li, D.; Wang, J.; Chen, Y.; Liu, C.; Lu, Y.; Lin, X.; Lv, B.; Li, J.; Zheng, Z. Ammonia (NH3)/nitrogen (N2) torrefaction pretreatment of waste biomass for the production of renewable nitrogen-containing chemicals via catalytic ammonization pyrolysis: Evolution of fuel-N under a N2/NH3-rich atmosphere. J. Energy Inst. 2022, 102, 143–159. [Google Scholar] [CrossRef]
- Wang, Z.; Zhang, J.; Zhao, Y.; Li, Y.; Zheng, C. Release characteristics of NO, NH3 and HCN during biomass pyrolysis. J. Fuel Chem. Technol. 2011, 39, 99–102. (In Chinese) [Google Scholar]
- Zhan, H.; Yin, X.; Huang, Y.; Yuan, H.; Wu, C. NOx precursors evolving during rapid pyrolysis of lignocellulosic industrial biomass wastes. Fuel 2017, 207, 438–448. [Google Scholar] [CrossRef]
- Anca-Couce, A.; Sommersacher, P.; Evic, N.; Mehrabian, R.; Scharler, R. Experiments and modelling of NOX precursors release (NH3 and HCN) in fixed-bed biomass combustion conditions. Fuel 2018, 222, 529–537. [Google Scholar] [CrossRef]
- Wang, X.; Li, C.; You, P.; Liu, X.; Wang, Y. Migration and transformation of nitrogen during sludge hydrothermal treatment. Chin. J. Chem. Eng. 2018, 69, 2688–2696. (In Chinese) [Google Scholar]


Disclaimer/Publisher’s Note: The statements, opinions and data contained in all publications are solely those of the individual author(s) and contributor(s) and not of MDPI and/or the editor(s). MDPI and/or the editor(s) disclaim responsibility for any injury to people or property resulting from any ideas, methods, instructions or products referred to in the content. |
© 2024 by the authors. Licensee MDPI, Basel, Switzerland. This article is an open access article distributed under the terms and conditions of the Creative Commons Attribution (CC BY) license (https://creativecommons.org/licenses/by/4.0/).