Abstract
To cope with the growing penetration rate of renewable energy and to enhance the absorption capacity of wind power, this paper investigates the applications of an Integrated Energy System (IES), Hydrogen Compressed Natural Gas (HCNG), and power-to-hydrogen (P2H) devices within the IES. It employs power-to-gas and gas blending with hydrogen to construct an efficient electricity–gas–electricity energy flow loop, establishing a Natural Gas–Electricity Coupling System (NGECS) model. On this basis, a coordinated scheduling method for gas–electric coupling systems using gas blended with hydrogen is proposed. A carbon trading mechanism is introduced to constrain carbon emissions, further reducing the system’s carbon footprint. Multiple scenarios are set up for a comparative analysis in order to validate the effectiveness of the proposed model. This study also analyzes the impact of different hydrogen blending ratios and methods on the low-carbon and economic performance of IES.
1. Introduction
Balancing the increasing energy demand and reducing carbon emissions has always been a crucial issue for human society. In the face of pressing climate issues, various decarbonization methods have been developed in accordance with the Paris Agreement. The goal is to limit the increase in the global average temperature to within the range of 2 °C above that of the pre-industrial era [1].
In response to the continuous increase in the penetration rate of renewable energy caused by the ongoing energy transition, an IES is an important pathways toward achieving the large-scale integration of renewable energy sources [2,3]. It effectively integrates various energy sources, such as electricity, natural gas, and thermal energy, within a region, allowing for coordinated planning and complementary operation [4]. The synergy between different energy sources in an IES is environmentally friendly, addressing the challenges of waste associated with renewable energy sources, such as wind and solar, ultimately improving overall energy efficiency [2,5]. To address the uncontrollability of renewable energy and the continuous increase in penetration rates, storing surplus electricity for reuse has become a powerful measure that can be used to accommodate the growth of renewable energy [6]. There is an urgent need for an energy storage method that is rational, efficient, and environmentally friendly. Without a doubt, hydrogen, as a green energy source, possesses advantages, such as zero carbon emissions, high calorific value, and easy storage and transmission [7], making it the preferred solution for the green development, storage, and utilization of renewable energy. It aligns with the current societal demand for clean energy and has been widely applied in various energy sectors in recent years. The maturation of technologies, such as power-to-hydrogen and gas blending with hydrogen, further promotes energy transition [8,9]. This, in turn, provides new optimization approaches for the coordinated planning and complementary operation of IESs [10,11].
Hydrogen has undoubtedly become a key driver in promoting the transformation of power systems and advancing the low-carbonization of energy. It plays a crucial role in achieving decarbonization, with more than half of the countries in the European Union having already formulated development roadmaps for hydrogen.
NGECS serves as a reliable support for coordinating comprehensive energy output, achieving the integration of renewable energy, and reducing carbon emissions. Currently, research on NGECS in the power-to-gas (P2G) field primarily focuses on the production of methane (power-to-methane, P2M) [6,12]. However, there is relatively less research on the more efficient power-to-hydrogen (P2H) utilization. Shuting Zhang et al. [13] considers the differences between the electrolyzer and methanization reactor in NGECS, proposing a model that reflects the optimal capacity configuration for a hydrogen injection into the natural gas network and the operation of power-to-gas investments. He Guixiong et al. [14] examines the economic impact of injecting hydrogen and biogas into NGECS but does not consider P2H as a component of NGECS for integrating surplus wind power. Liu J and Zhou C [15] combine wind power hydrogen production with hydrogen storage tanks and fuel cells to verify the economic and low-carbon characteristics of P2H technology. Siyun, Yan, Wang Chen, and Zhou Dengji [16] investigate an optimization method for a comprehensive energy system involving mixed transportation with hydrogen blending in the gas network. However, they do not consider the fine constraints on electrolytic hydrogen production or the impact of the heat value difference between hydrogen and natural gas on the load. Cui Yang et al. [17] points out that the efficiency of P2M is only 55%, while P2H achieves an efficiency of up to 80%. P2H can effectively improve the energy utilization efficiency of IESs [18].
In the year 2022, global carbon dioxide emissions from energy combustion and industrial processes reached 36.8 billion tons, with natural gas emissions accounting for 7.3 billion tons. Natural gas possesses a significant potential for decarbonization. The decarbonization of the natural gas sector can be tackled with the use of green hydrogen blended with natural gas [19,20]. ENEA, the Italian national research center, published a report stating that, in an HCNG blend with 20% hydrogen content, there was a 7% effective reduction in carbon emissions. The goal of Hy-deploy in the UK is to use HCNG with a 15% hydrogen blending ratio in end-user devices, and feasibility proof has been carried out [21]. Gondal indicates that natural gas pipelines can withstand a 50% hydrogen blending ratio; gas turbines, water heaters, and boilers can tolerate a 20% hydrogen blending ratio; and gas stoves can accept a 50% blending ratio [22]. Song [23] considered (HCNG) and constructed an IES model for hydrogen production, storage, and hydrogen blending. The operational outcomes for different hydrogen blending ratios were validated. Jin [24] evaluated hydrogen blending schemes and costs based on different time constraints, considering the actual situation in Italy. Zhou et al. [25] evaluated the coupling capacity of hydrogen blending between natural gas and the electrical grid under different hydrogen blending ratios.
The mentioned literature focuses on NGECS involving P2M or a combination of P2M and P2H. There is little consideration given to thermoelectric optimization of the system through different pathways of HCNG or fuel cell utilization to improve system economics and low-carbon performance.
In summary, this paper considers the refinement of the multiple modes of hydrogen utilization, strengthening the bidirectional coupling of electricity and gas in IESs. Specifically, by injecting hydrogen into a natural gas pipeline, we directly utilize HCNG and introduce a carbon trading mechanism to construct a corresponding model. In NGECS, we integrate P2H, gas blending with hydrogen technology, and a carbon trading mechanism. This approach takes into account the changes in the calorific value and blending ratio of the mixed hydrogen and natural gas while balancing factors such as system safety, carbon trading prices, and NGECS constraints to conduct research on low-carbon economic dispatch. The main contributions of this paper are as follows:
Through a detailed model based on P2H technology, we constructed a mathematical model for the gas–electric coupling system by considering the use of gas blending with hydrogen. We refined the multiple modes of hydrogen utilization. In the optimized dispatch of an IES, we comprehensively considered the changes in the calorific value of the gas and the constraints on the hydrogen blending ratio of HCNG. Based on the load conditions and time-of-day electricity prices in a specific region, we devised a dispatch plan that aligns more closely with real-world scenarios. Building upon this dispatch model, we introduced a tiered carbon trading mechanism to further reduce the system’s carbon emissions. Subsequently, we conducted a detailed analysis and comparison of case studies, confirming the superiority of gas blending with hydrogen in the IES for absorbing renewable energy, improving the energy utilization efficiency, and reducing the system’s carbon emissions.
2. Structural Improvement of Integrated Energy System with HCNG
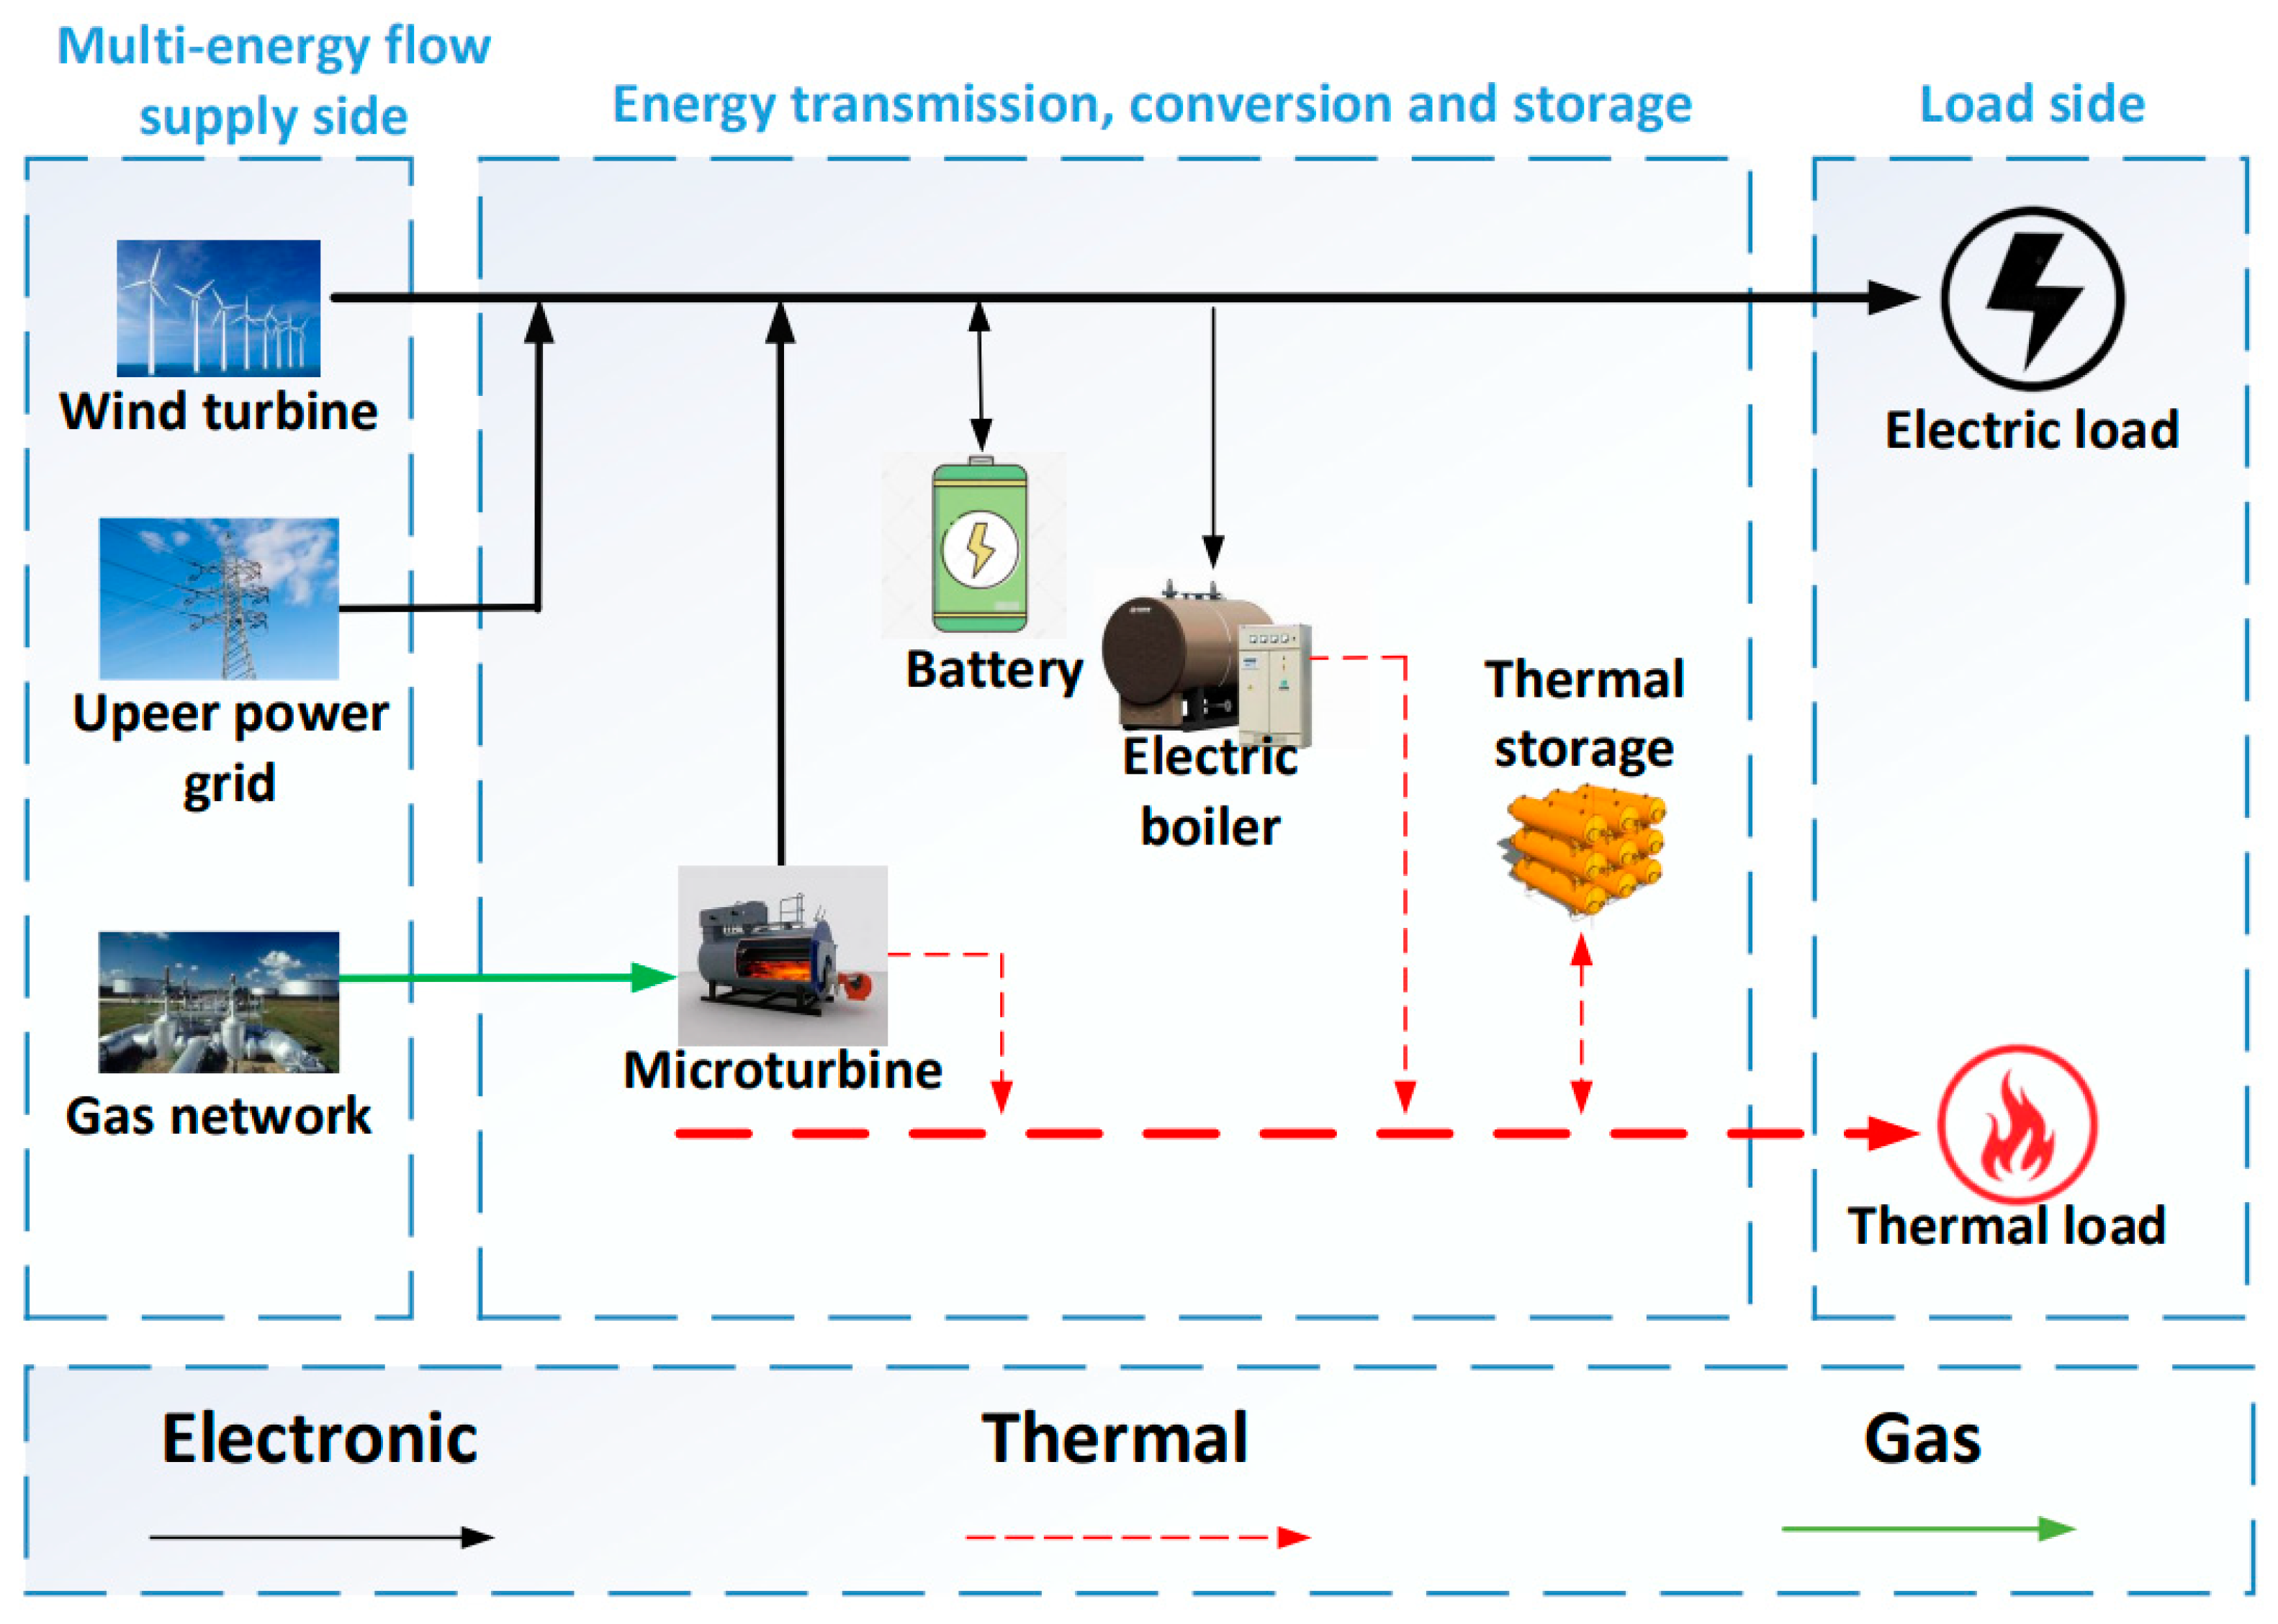
Figure 1 illustrates the typical structure of an Integrated Energy System (IES). This structure is based on electricity, with both electrical and thermal energy as the primary forms of energy. The aim is to enhance the model’s applicability in a wide range of regions. The main components of this system include combined heat and power (CHP) units, renewable distributed power sources, electric boilers (EBs), energy storage devices, and various types of loads.

Figure 1.
Typical IES structure.
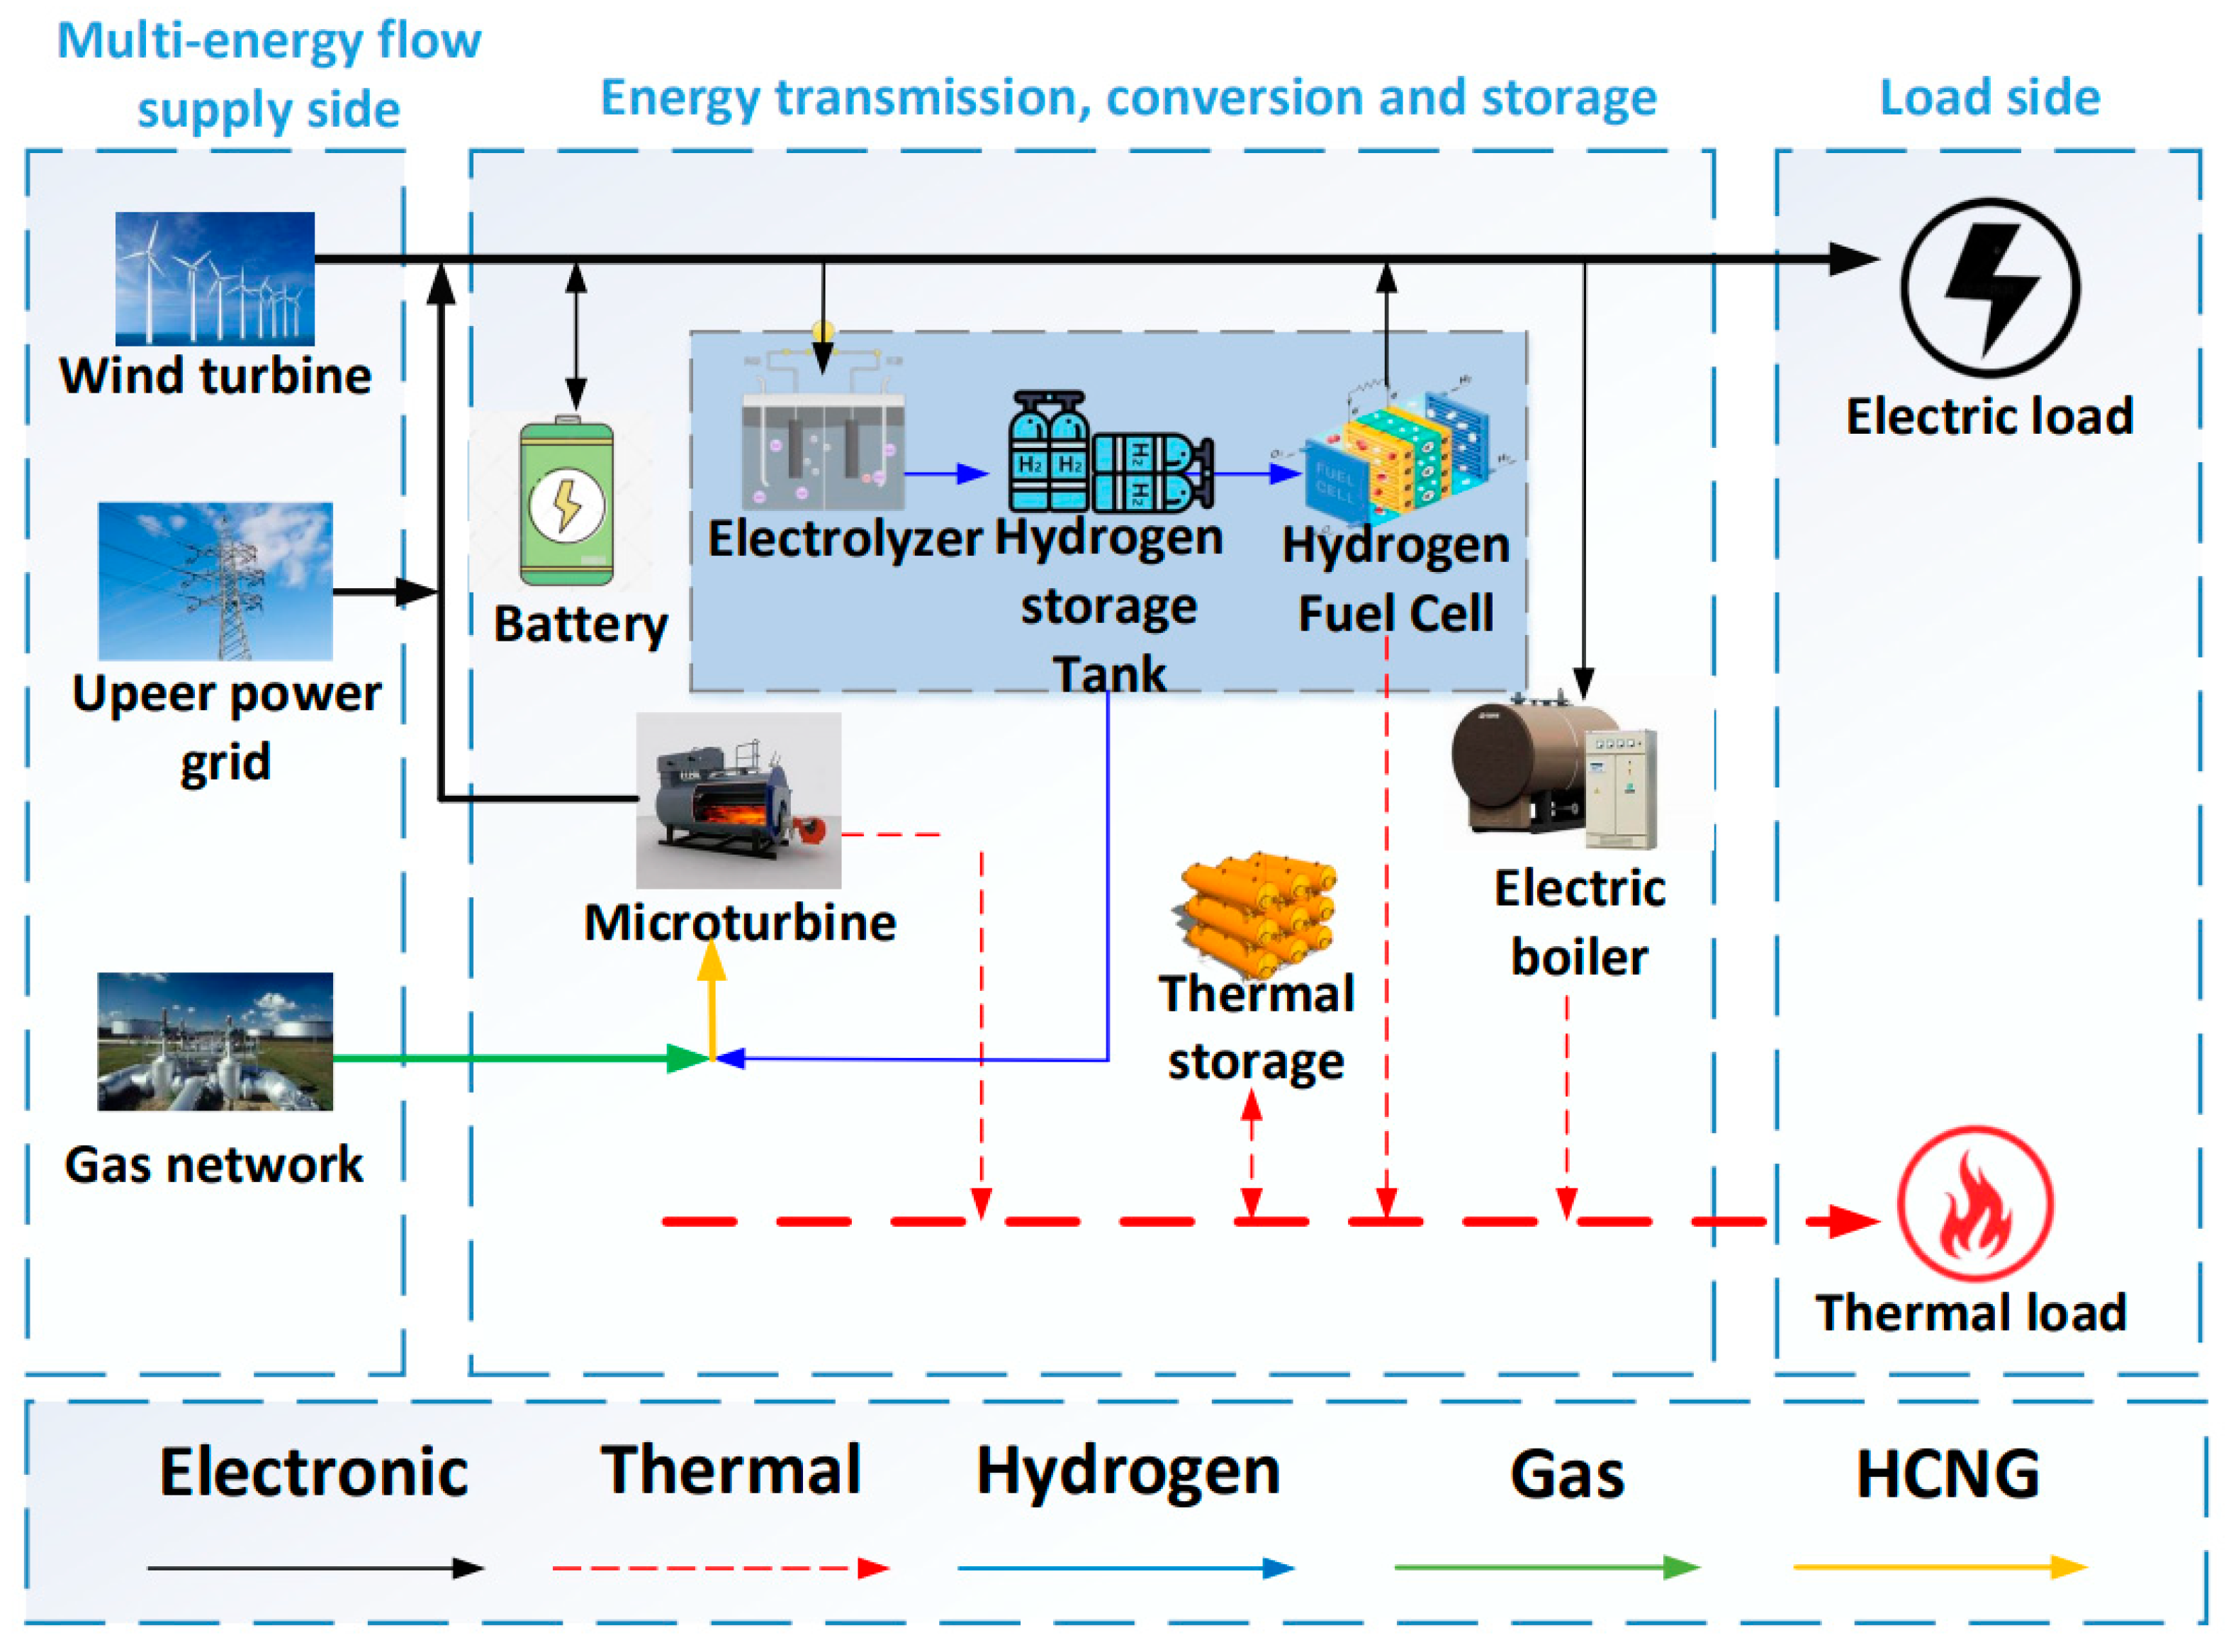
Electrolyzers (ELs), hydrogen storage equipment, fuel cells (hydrogen fuel cells, HFCs), and other NGECS devices are added to the typical IES shown in Figure 1, and this specific structure is illustrated in Figure 2.
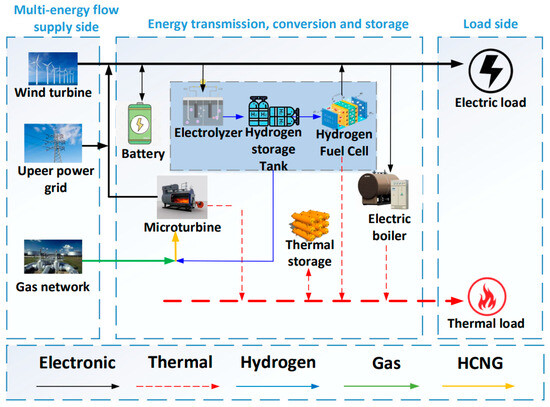
Figure 2.
IES structure diagram of gas–electric coupling.
This paper proposes a comprehensive energy system model with a hydrogen multi-utilization pattern, as shown in Figure 1, based on the traditional IES by incorporating P2H and gas blending with hydrogen. According to the system’s scheduling scheme, surplus electricity is converted into hydrogen and stored in hydrogen storage devices, injected into hydrogen fuel cells for combined heat and power (CHP) supply, or blended with natural gas to produce HCNG. HCNG is directly utilized by CHP to convert chemical energy into electrical and thermal energy to meet user load demands. Renewable distributed energy is provided by wind turbines (WTs) connected to the IES to supply electricity. In addition, to ensure the reliability of user energy supply, the IES can exchange electricity with the higher-level power grid. The power supply of the IES is mainly composed of WT, CHP, and the upper power grid, with a small portion supplied by HFC; the thermal load is mainly supplied by CHP and electric boilers (EBs), while HFC provides thermal energy to some extent.
To build a highly energy-efficient IES, the coordinated scheduling method proposed in this paper focuses on P2H technology rather than P2M technology, aiming to reduce energy losses in the conversion process. It is currently the most energy-saving and straightforward solution among P2G types. The approach also adopts fuel cells for combined heat and power (CHP) and microturbine (MT) cogeneration to further improve the efficiency of the gas-to-electricity conversion process, with a maximum conversion efficiency of up to 87%. The studies in [26,27,28] indicate that HCNG is a feasible transition to pure hydrogen, addressing the issues of hydrogen transport, storage, and utilization. Compared to pure hydrogen, HCNG is safer and more cost-effective. Table 1 and the study in [29] demonstrate that micro-gas turbines do not require modifications when the hydrogen blending ratio is below 30%.

Table 1.
Effects of different hydrogen blending ratios and standard natural gas turbine design.
In order to ensure the possibility of the hybrid transportation of HCNG, the influence of hydrogen on the pipeline’s transportation conditions should also be taken into account. Hydrogen is corrosive and can cause hydrogen embrittlement when it touches metallic materials, inducing cracks or even the splitting of the pipeline. In order to minimize the effect of hydrogen on the pipeline and to ensure the normal operation of gas equipment and pipelines [30,31], it is concluded, based on the parameter calculations performed by Cui and Huang [32,33], that the hydrogen mixing ratio of HCNG should be less than 23%, and it is taken as 20% in this paper.
3. Modeling of IES Scheduling with HCNG Based on Stepped Carbon Trading
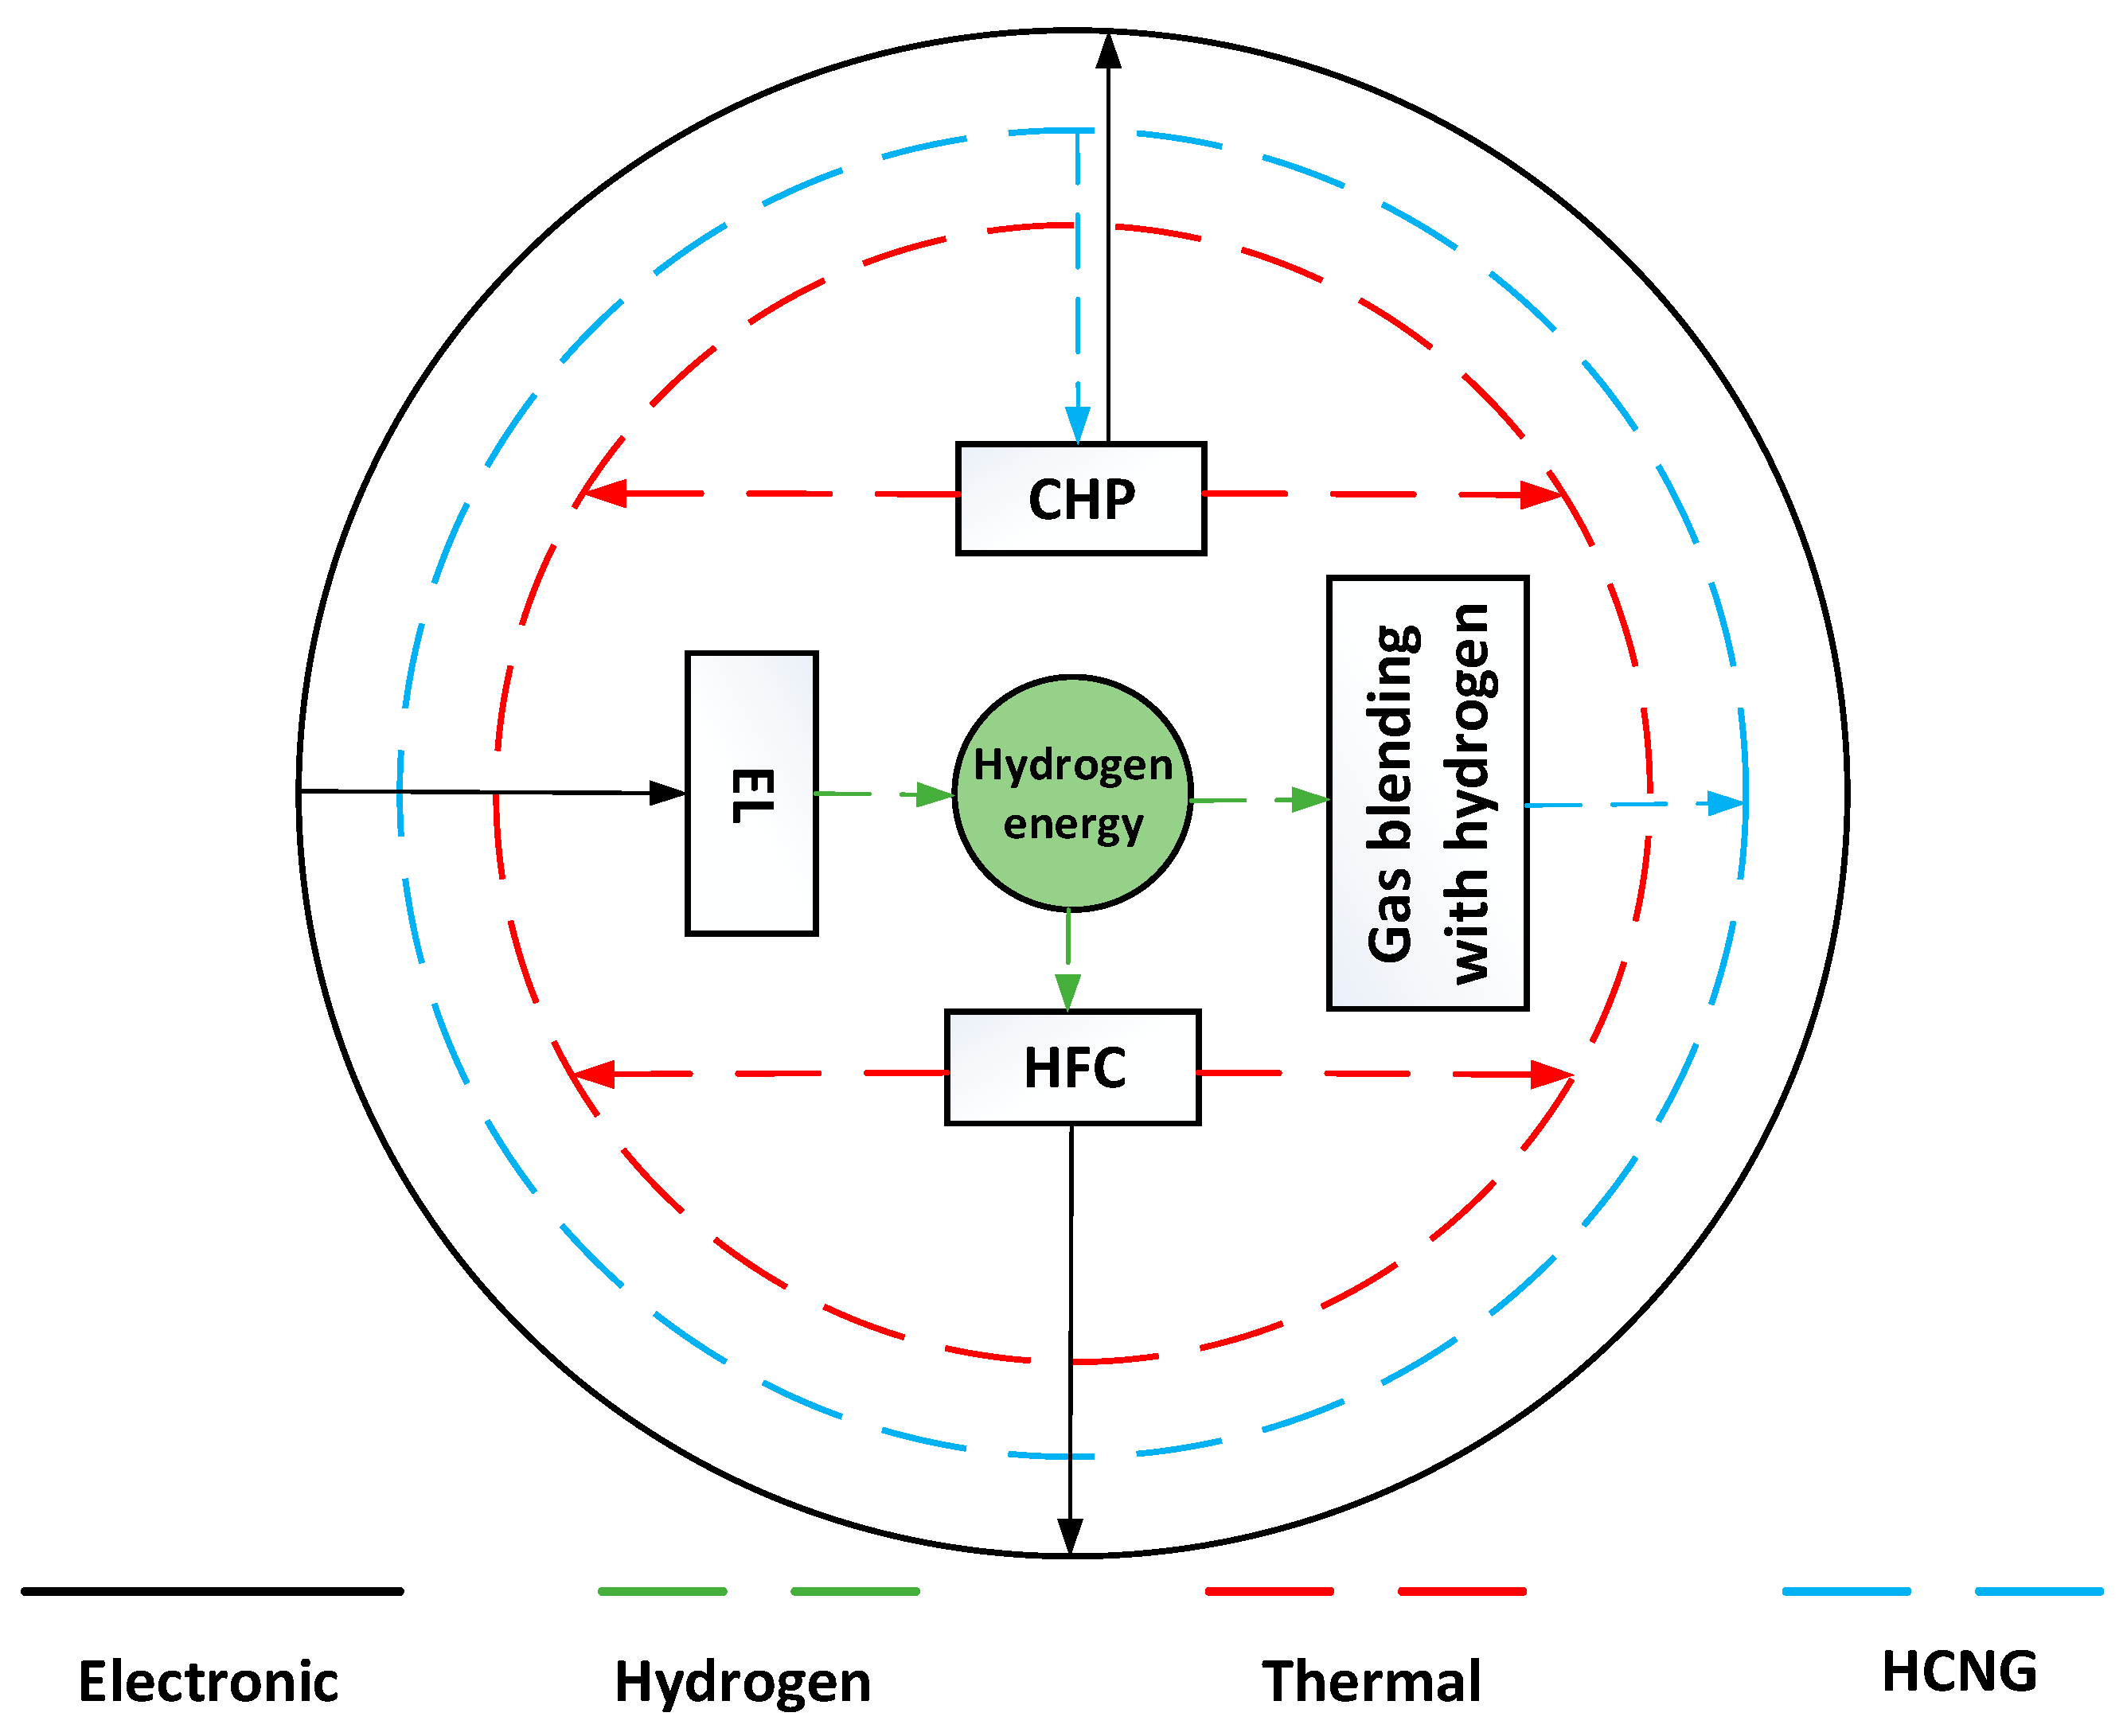
This paper refines the utilization pathways of hydrogen and proposes a coordinated scheduling method for a gas–electric coupling system that considers gas blending. The aim is to improve energy efficiency while reducing the carbon emissions of the IES. The raw material, hydrogen, for the IES is generated by the P2H device, absorbing the surplus wind and solar energy. Natural gas is directly purchased from the gas source. The multi-mode utilization pathways of P2H overcome the issue of significant energy losses in traditional P2G systems, establishing an efficient energy utilization channel. Figure 3 this approach reduces carbon emissions and addresses challenges in the integration of renewable energy systems.
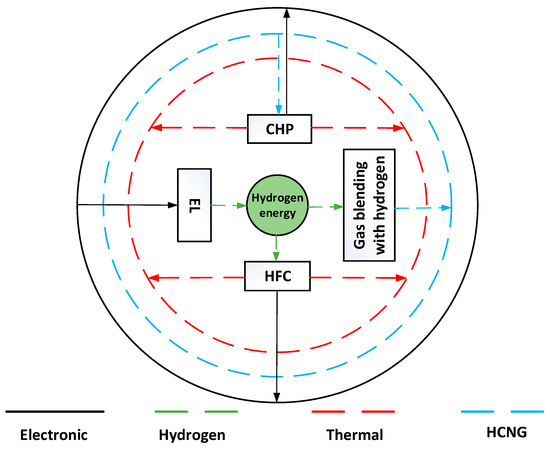
Figure 3.
Hydrogen as an electrical, thermal, and gas coupling hub.
3.1. P2H Equipment Modeling
Currently, there are three mainstream methods for P2H technology: alkaline electrolysis, proton exchange membrane (PEM) electrolysis, and high-temperature solid oxide electrolysis. These three devices have significant differences in startup, shutdown, and ramp-up working conditions. High-temperature solid oxide electrolysis requires relatively stable electrical conditions. However, in this paper, the EL utilizes uncertain and strong wind power waste to produce hydrogen, which cannot provide long-term stable electricity. The mainstream electrolysis forms present in IESs are alkaline electrolysis and PEM electrolysis. These two electrolysis modes can operate stably under intermittent fluctuating power, a high current density, and low-voltage conditions. PEM electrolysis has a strong ramping capability and is more flexible. Therefore, PEM technology is selected as the electrolysis method for the system.
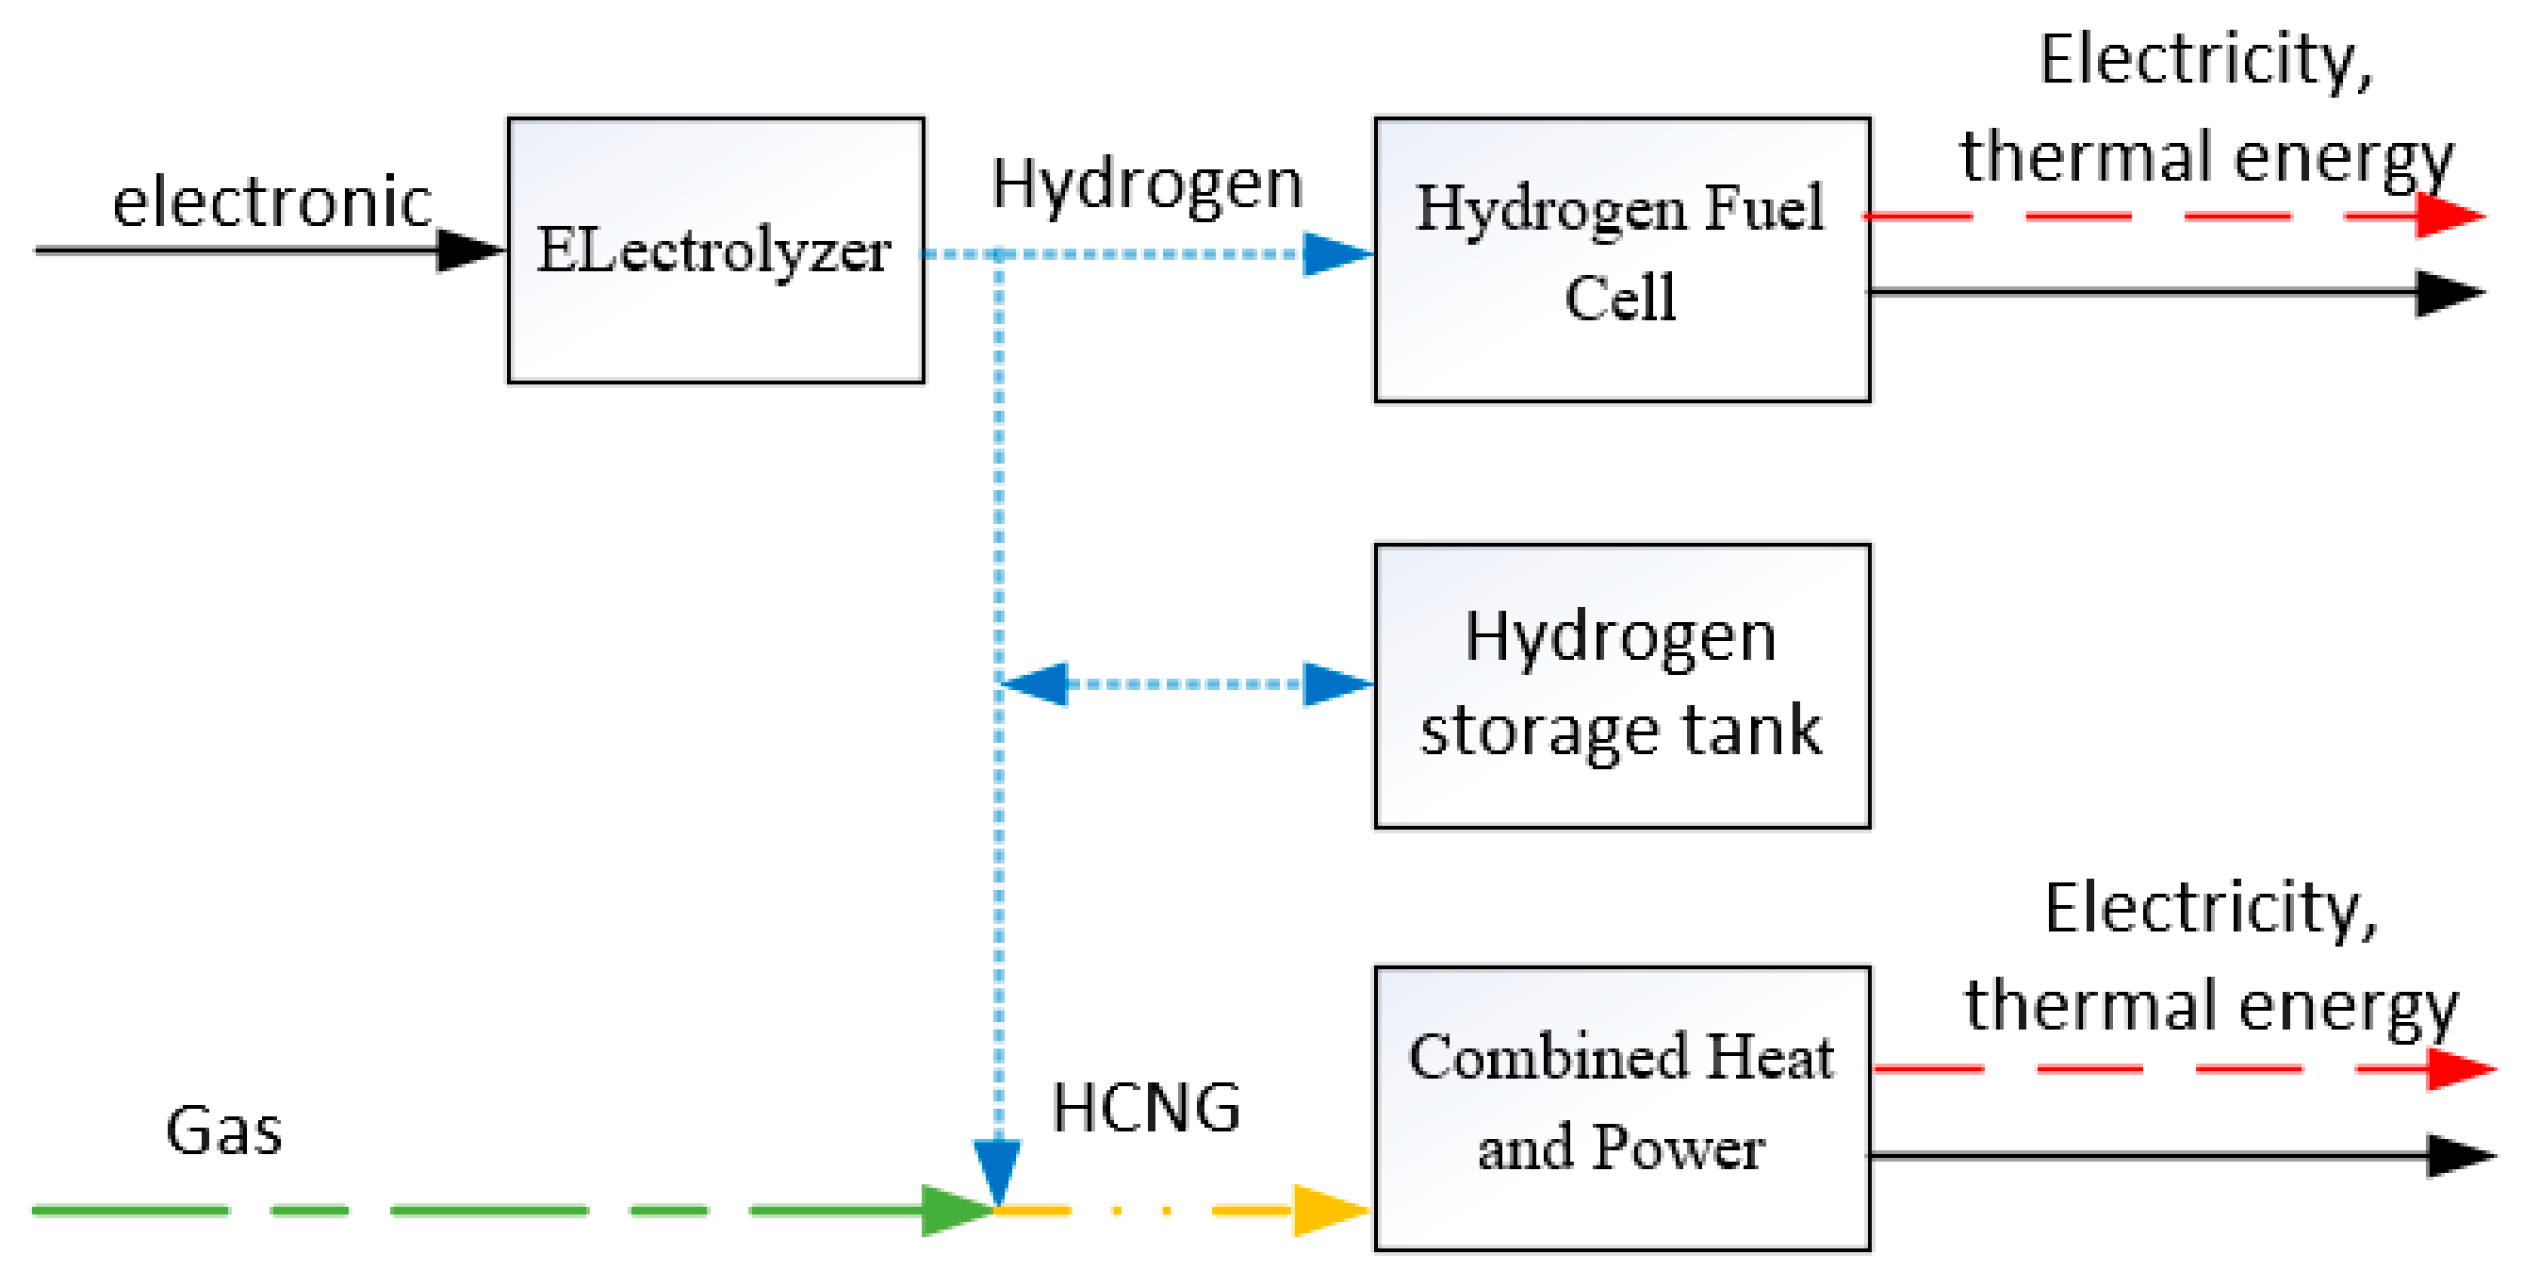
The EL converts surplus electricity into hydrogen. A portion of this hydrogen is input into the HFC for the generation of electrical and thermal energy; another portion is injected into the hydrogen storage tanks for later use; and yet another portion is injected into the natural gas pipeline to supply the CHP unit, converting it into electrical and thermal energy. The specific transformation process is shown in Figure 4.
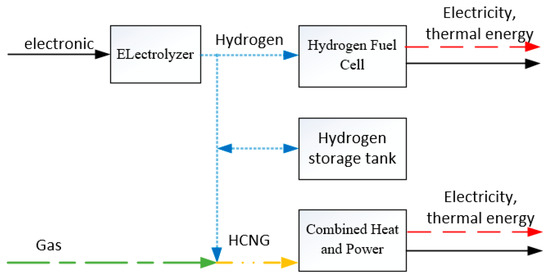
Figure 4.
Multi-modal utilization of hydrogen.
Through the direct utilization forms of the HFC and gas blending with hydrogen, the traditional step of conversion into natural gas is reduced, avoiding energy cascade losses and reducing carbon emissions. The conversion models for the aforementioned equipment are as follows:
- (1)
- Electrolyzer equipment:
- (2)
- Hydrogen fuel cell equipment:
Applying HFCs to a combined heat and power mode can improve the energy conversion efficiency. Compared to HFCs that provide only electricity in the market, the efficiency can be increased by about 20%. The thermal and electrical efficiencies after HFC CHP can be considered constant. The HFC model constructed in this paper refers to references [34,35].
- (3)
- Energy storage equipment:
The hydrogen storage tank in this paper serves as a stable, cross-temporal hydrogen source for HFC and HCNG production. The study in [35] suggests that energy storage device models are similar, and this paper undertakes unified modeling based on that foundation. Physical processes, such as hydrogen storage in the tank, are neglected, and at the scheduling level, a unified model is developed for hydrogen storage, as well as thermal storage and grid charging. However, different types of energy storage have varying coefficients, such as charging and discharging efficiency, capacity, and power coefficients. The energy losses resulting from physical processes are characterized using charging and discharging efficiencies.
where represents the capacities of the hydrogen, thermal, and electrical energy storage devices in time period t; and represent the charging and discharging efficiencies of the hydrogen, thermal, and electrical energy storage devices; and , respectively, represent the charging and discharging power of the hydrogen, thermal, and electrical energy storage devices in time period t; and , respectively, represent the upper and lower limits of the capacities of the hydrogen, thermal, and electrical energy storage devices; and , respectively, represent the maximum charging and discharging power of the hydrogen, thermal, and electrical energy storage devices; and and are binary variables (0 or 1), representing the charging and discharging states of the hydrogen, thermal, and electrical energy storage devices in time period t, where = 1 and = 0 indicate charging, and the opposite indicates discharging.
3.2. Gas–Hydrogen Doping and Gas Turbine Operation Modeling
The comparison of the physical and chemical characteristics of hydrogen and methane as provided in Reference [29] is presented in Table 2.
Table 2.
Hydrogen and methane parameters.
The heating value per unit volume of hydrogen is approximately one-third that of methane, and the heating value of HCNG is influenced by the volume fraction of hydrogen. Due to the different chemical properties of hydrogen and methane, the hydrogen blending ratio affects the heating value, electrical generation efficiency, and thermal production efficiency. References [9,36] discuss the operational modeling of CHP using HCNG, and this paper improves the modeling of CHP using HCNG for combined heat and power production based on these studies.
where represents the hydrogen blending ratio (by volume) during time period t; and denote the volumes of hydrogen and natural gas consumed by the CHP during time period t; and correspond to the power consumption of hydrogen and natural gas by the CHP during time period t, respectively; and are the corresponding calorific values for hydrogen and methane; and are the electrical and thermal efficiencies of CHP cogeneration; and and represent the power generation and heat production rates of the CHP during time period t, respectively.
3.3. Carbon Trading Mechanism
The carbon trading mechanism establishes legal carbon emission rights, allowing producers to trade carbon emission rights with each other in a way that is similar to the buying and selling of commodities. Taking into account their own costs, economic factors, and various aspects of the process, producers control carbon emissions. If the actual carbon emissions of the system are lower than the allocated quota, surplus shares can be traded; otherwise, carbon emission quotas need to be purchased. This carbon trading model effectively controls the carbon emissions of the system. In this paper, a stepped carbon trading approach is adopted for the system.
3.3.1. Calculation of Actual Carbon Emissions
The carbon source of this system includes the carbon emissions from the gas turbine and the equivalent carbon emissions from the purchasing of electricity from the higher-level grid. The use of HCNG as a raw material reduces the carbon emissions from the gas turbine. Hydrogen, as a green energy source, has zero carbon emissions. This results in a direct relationship between the carbon emissions of the gas turbine and the hydrogen blending ratio. The higher the hydrogen blending ratio, the lower the carbon emissions of the gas turbine when generating the same electrical power. The higher-level power grid still includes a portion of renewable energy output; hence, the carbon emissions for purchased electricity are set at 70% of the standard coal-fired generating units.
where , , and represent the actual carbon emissions of IES, the actual carbon emissions from the purchasing of electricity from the higher-level grid and the combined CHP system of the gas turbine unit; and represents the carbon emissions associated with the consumption of natural gas per unit of power.
3.3.2. Carbon Emission Quotas
The distribution method used in Reference [16] is free allocation, utilizing the baseline to determine the allocation share. This paper adopts the same distribution method, allocating carbon emission rights to objects with carbon emissions, including the heating carbon emission rights of the gas turbine and the power supply carbon emission rights of the gas turbine.
where represents the free carbon emission rights allocated to the IES system in time period t; is the free allocation quota of carbon emission rights that the gas turbine can obtain per unit of power generation; and is the free allocation quota of carbon emission rights that the gas turbine can obtain per unit of heating power.
3.3.3. Stepped Carbon Trading Model
Using Equations (7) and (8), the number of carbon transactions that the system needs to process through the carbon trading market is calculated.
where is the amount of carbon traded by the IES.
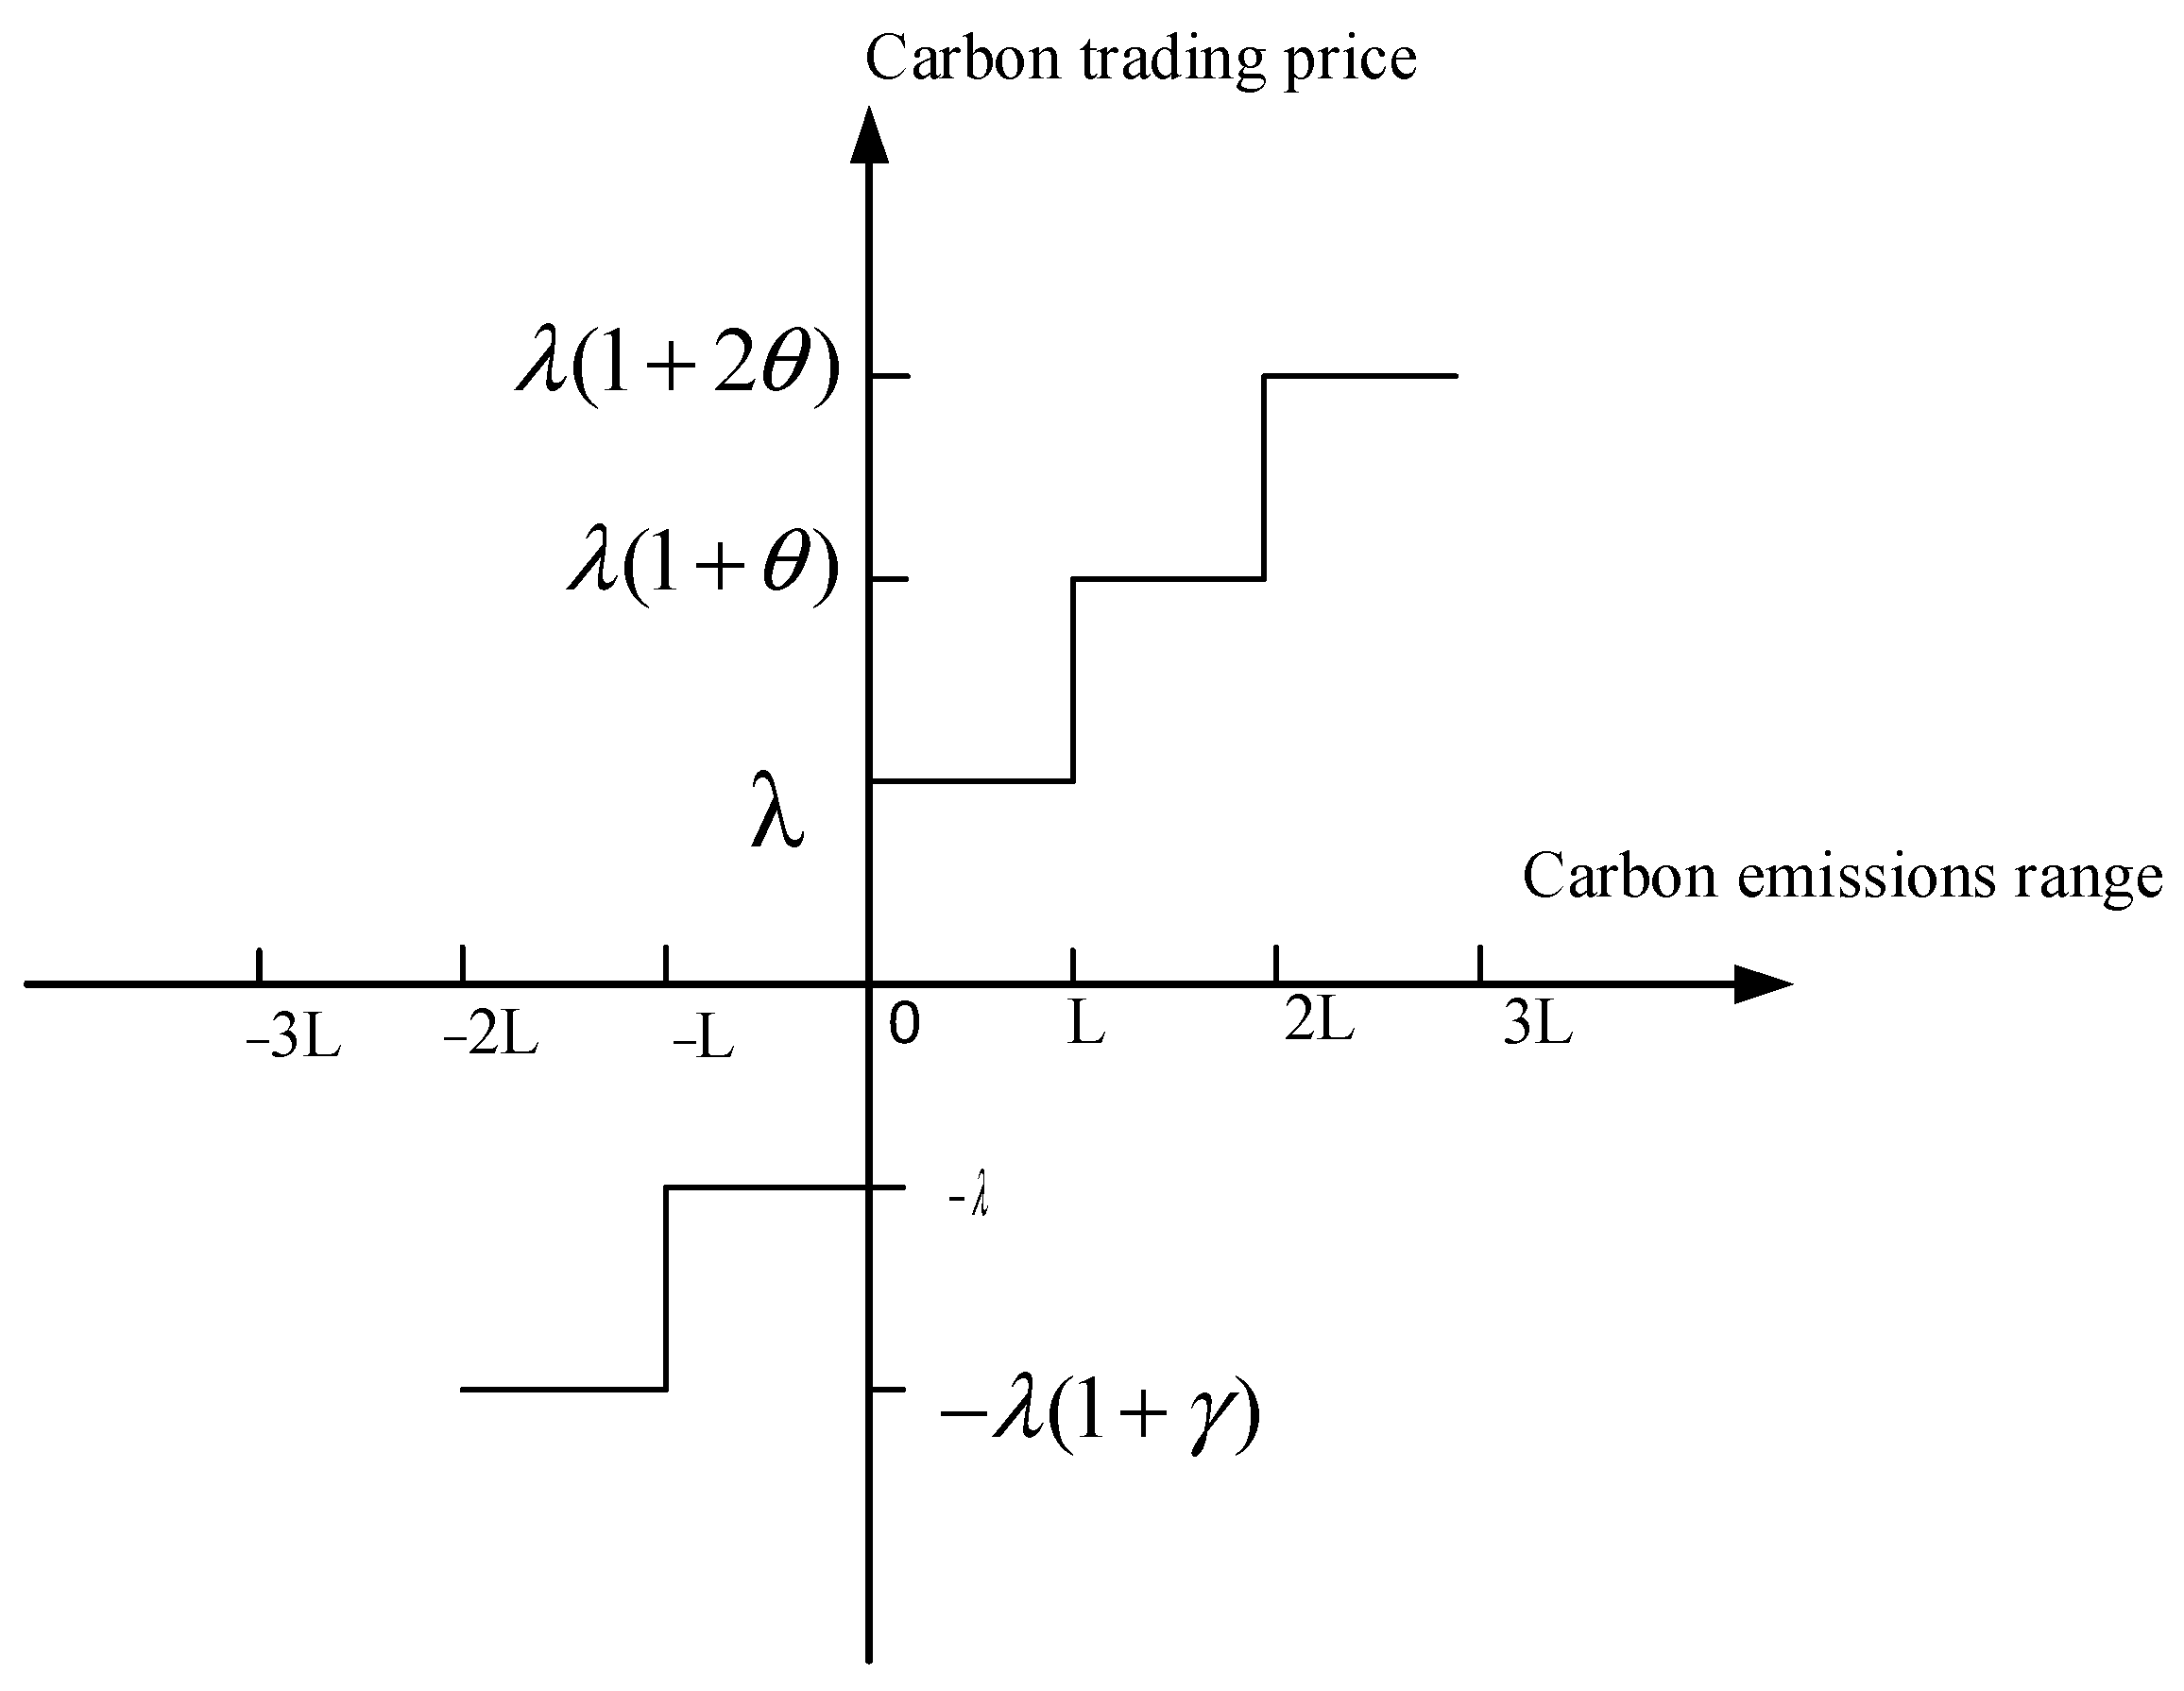
The carbon trading price in the traditional carbon trading pricing mechanism remains constant throughout the scheduling period. In contrast, the carbon trading mechanism adopted in this paper, based on stepped carbon emission trading, is improved to further restrict the system’s carbon emissions. The establishment of the stepped carbon trading model is illustrated in Figure 5.

Figure 5.
A schematic diagram of the stepped carbon trading mechanism.
The stepped carbon emission pricing divides the different carbon emission trading intervals, with higher unit carbon prices for intervals with greater carbon emissions. As the carbon emission quantity increases, the unit carbon emission price rises, leading to an increase in the system’s carbon trading costs accordingly. The reference for the stepped carbon trading cost calculation model is found in [34], and the model is as follows:
where represents the carbon trading base price; L is the length of the carbon emission unit interval; is the price growth rate; is the compensation coefficient; and is the carbon trading cost in time period t.
The fundamental parameters for carbon trading are configured as follows: the base price is set at USD 0.035/kg, the price growth rate is established at 30%, and the compensation factor is determined to be 0.3. The stepped carbon interval, L, is set at 2000 kg.
3.4. Optimization Goals
The objective function, F, aims to minimize the total cost of the IES:
where represents the cost of purchasing electricity, represents the cost of purchasing gas, represents the carbon trading cost, and represents wind abandonment costs. These four factors are as follows:
where represents the unit price of electricity for time period t, and T is the scheduling period; is the unit price of natural gas for time period t. represents the carbon trading cost of the system at time t, as shown in Equation (9) above; is the penalty factor for unit wind abandonment with a value of 0.0282; is the wind abandonment quantity in time period t; is the output power of the WT at time t; and is the upper limit of the WT output in time period t.
3.5. Restrictive Condition
- Electrical power balance constraints:
The high proportion of wind power in the system leads to significant uncertainty in IES electricity generation. Selling electricity to the upper-level grid would increase grid-side security. To reduce pressure on the upper-level power grid, the IES only considers a unidirectional electricity purchase from the upper-level grid. Considering the capacity of the interconnection line limits the purchased power.
where is the power purchased from the higher grid in time period t; is the upper limit of the power purchased from the higher grid with a value of 500; is the electricity demand in time period t; and is the power consumed by the EB in time period t.
- Thermal power balance constraints:
- Hydrogen power balance constraints:
Due to the limitations in the development of the hydrogen network, the connection with external hydrogen networks is not considered. The IES utilizes P2H to produce hydrogen as the sole source of hydrogen.
- Natural gas balance constraints:
4. Results and Discussion
The comprehensive energy system constructed in this paper includes key components such as WTs, CHP, HFCs, EBs, and Els, and it is equipped with energy storage devices for electricity, heat, and hydrogen. The system achieves coordinated planning and complementary operation of energy through the integrated utilization of different forms of energy and storage devices.
4.1. Algorithm Parameterization
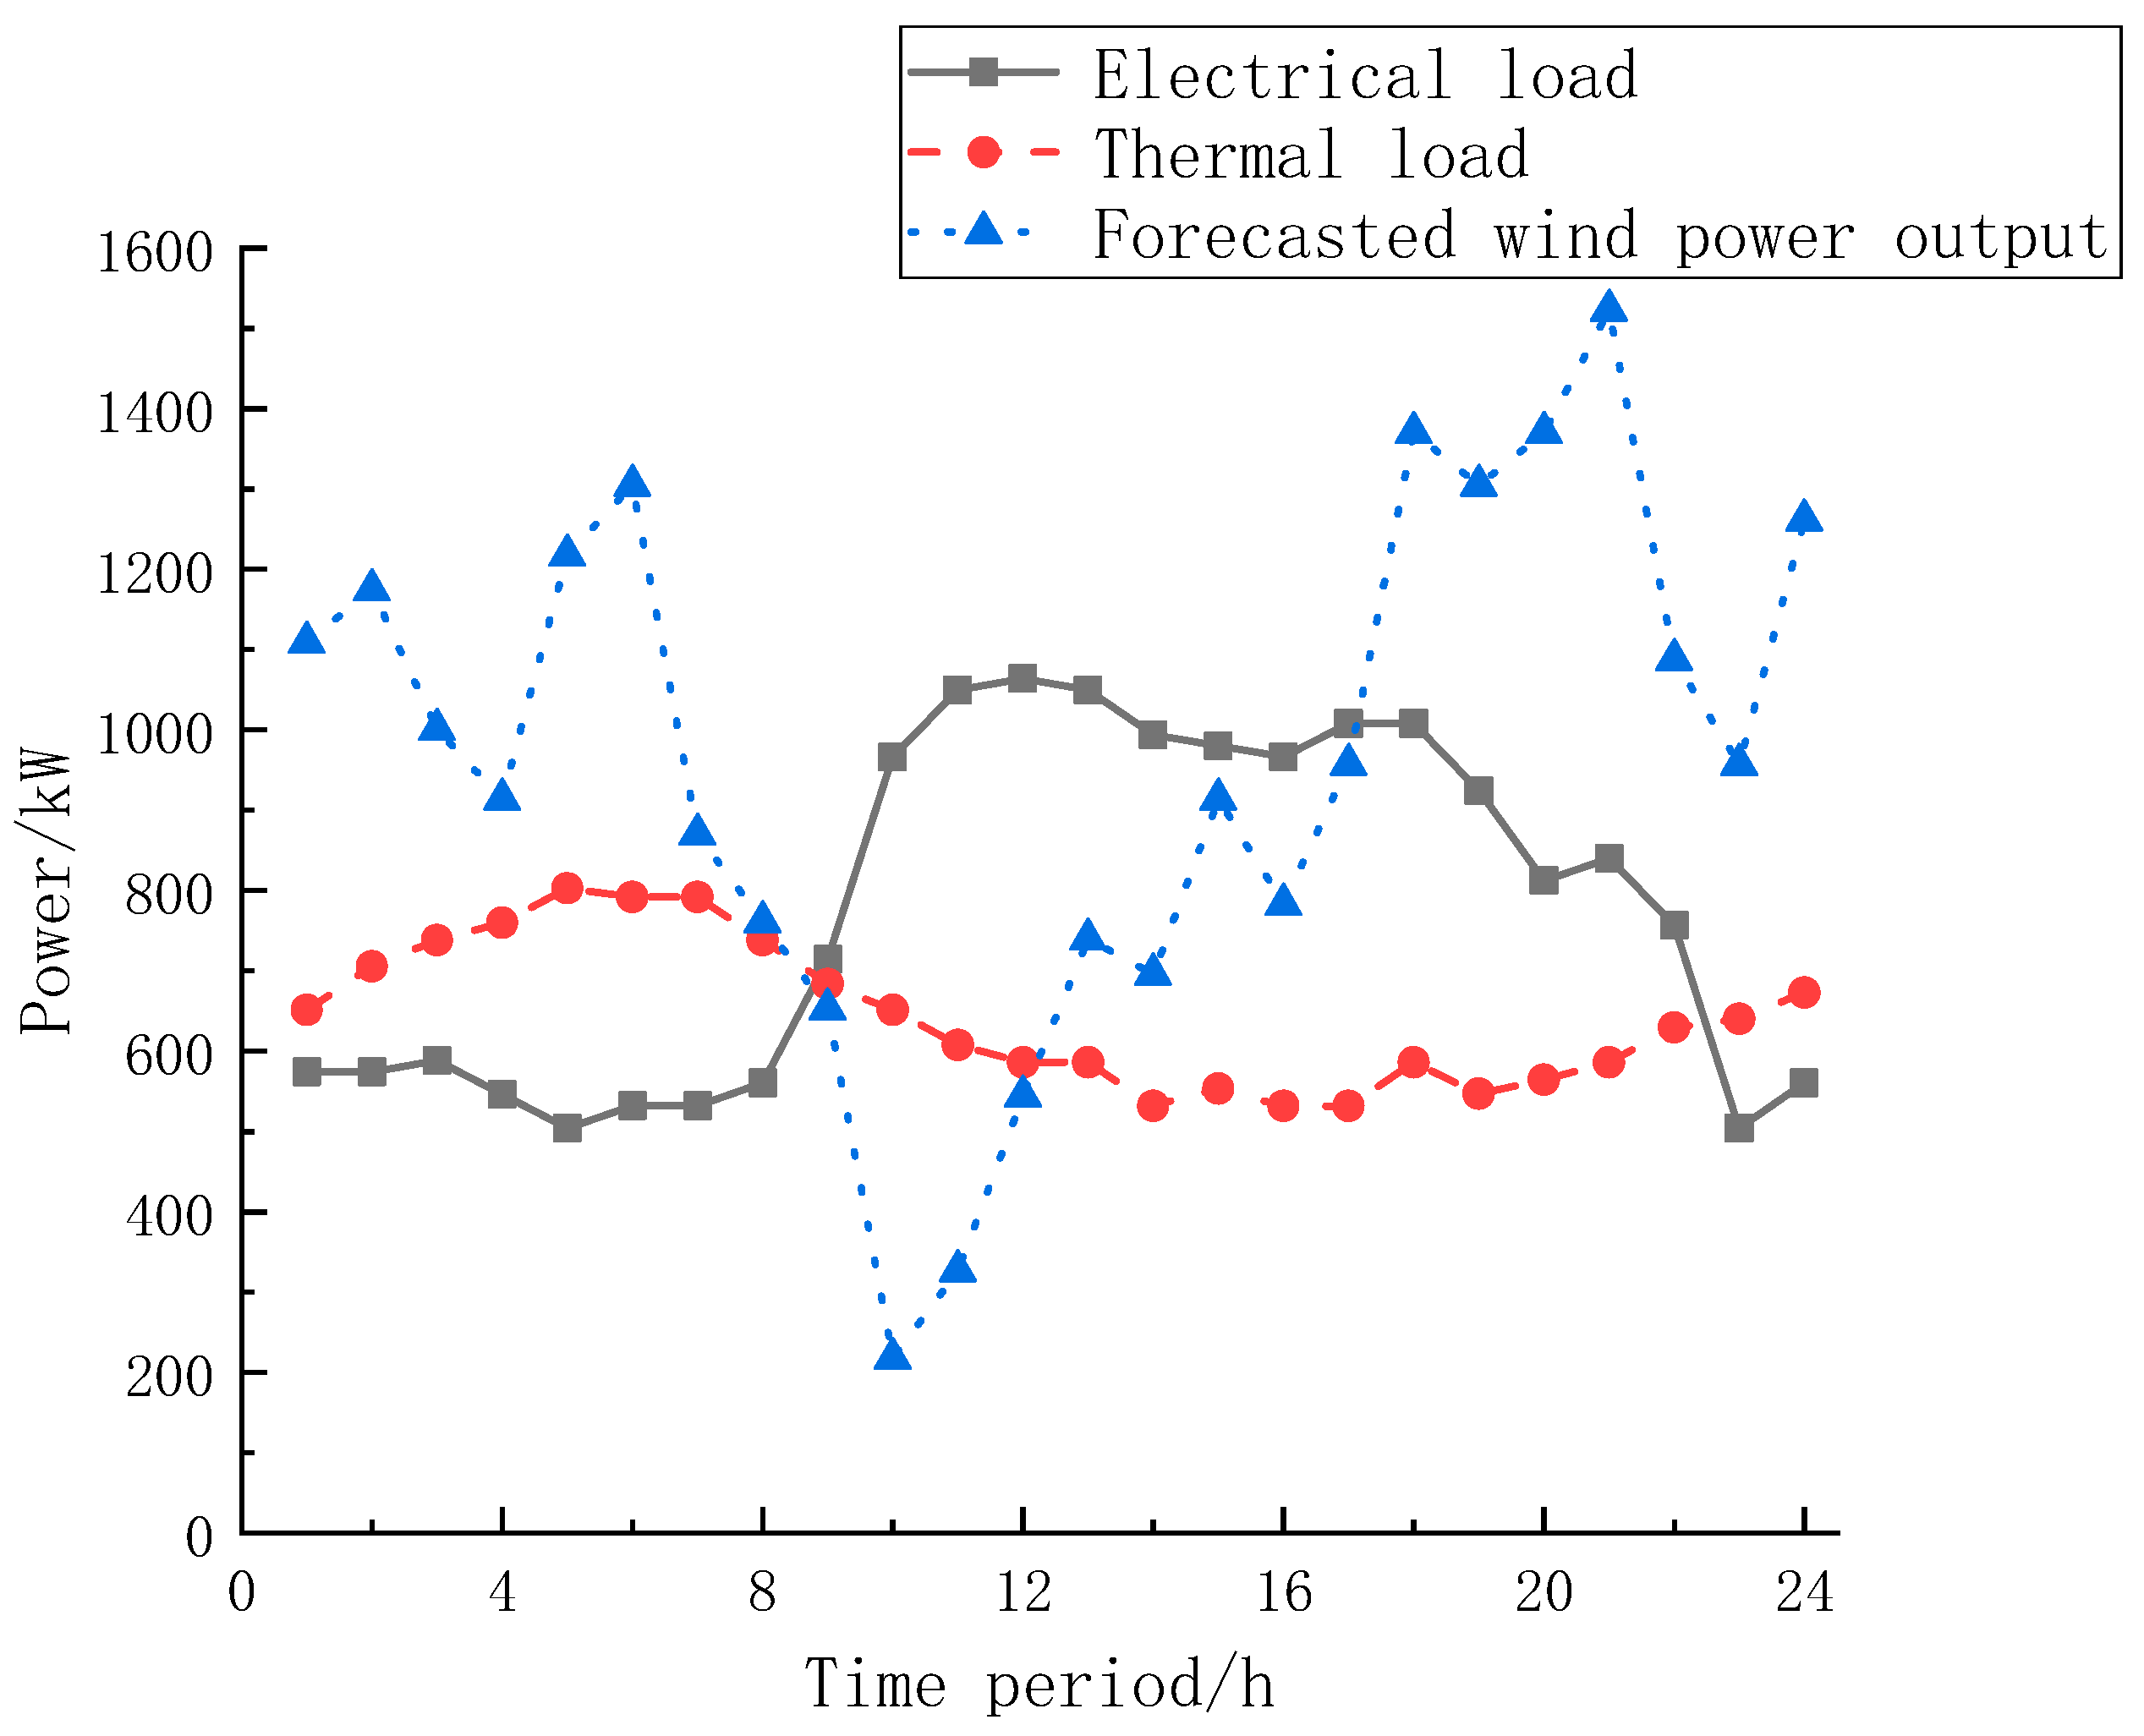
To verify the economic and low-carbon performance of the coordinated scheduling method for the gas–electric coupling system considering hydrogen blending, four scenarios are set for a validation analysis, as detailed in Table 3. The optimization is carried out using Matlab R2016b software and the Cplex 12.6 solver, with a simulation period of 24 h as one cycle with 1 h time steps. The WT output, electrical and thermal loads, and energy prices remain identical in each scenario. The predicted output of the WT and the electric–thermal loads are determined using parameters from real data for a day in a specific location, as referenced in the study in [15]. The corresponding parameters are illustrated in Figure 3, and the energy prices are provided in Table 4.
Table 3.
Scene setting.
Table 4.
Time share energy price.
The WT output, electrical and thermal loads, and energy prices are identical in each scenario. The predicted output of the WT and the electrical and thermal loads in Reference [10] were determined using parameters based on real data from a day at a specific location and are shown in Figure 6; the energy prices are shown in Table 4.
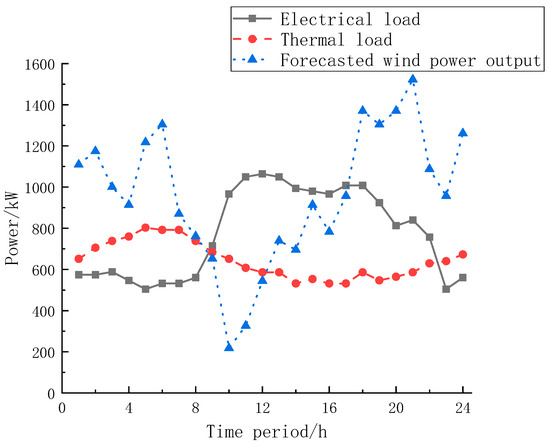
Figure 6.
Electric heating load and fan output prediction chart.
4.2. Model Validation of Multi-Modal Utilization of Hydrogen Energy
To validate the economic and low-carbon performance of the proposed coordinated scheduling method in this paper, optimization scheduling is conducted for the four scenarios set according to Table 4. Scenario 4 represents the coordinated scheduling method proposed in this paper, and the scheduling results are presented in Table 5.
Table 5.
Scheduling results of four scenarios.
- Comparison Analysis between Scenario 1 and Scenario 2
In Table 5, it can be seen that, in Scenario 2, the total cost decreases by USD 22.678, wind abandonment decreases by 43.44%, and carbon emissions decrease by 0.97% compared to those in Scenario 1. This is because the addition of the hydrogen blending process enhances the energy flow between electricity and hydrogen, improving the wind power absorption capacity and reducing the system’s purchasing cost. The economic and low-carbon advantages of gas blending are verified, effectively reducing wind abandonment.
- Comparison Analysis between Scenario 1 and Scenario 3
With the introduction of stepped carbon trading, Scenario 3 shows a 7.21% reduction in carbon emissions. The purchase cost of electricity with high carbon emissions decreases by 56.70%, while the purchase cost of gas with low carbon emissions increases by 9.9%. The overall system purchasing cost increases by 0.52%. However, the significant reduction in carbon emissions offsets these costs, resulting in considerable decarbonization benefits.
- Comparison Analysis between Scenario 3 and Scenario 4
Scenario 3 and Scenario 4 both operate under the stepped carbon trading mechanism, but, in Scenario 4, the further integration of HCNG taps into the system’s decarbonization potential and reduces the overall system costs, enhancing economic efficiency. Compared to Scenario 3, Scenario 4, even with carbon emissions already restrained, further reduces emissions by 1.55% and lowers the overall system cost by 1.72%.
- Comparison Analysis between Scenario 1 and Scenario 4
Scenario 4, which comprehensively considers gas blending with hydrogen and the stepped carbon trading mechanism, exhibits a significant 8.65% reduction in carbon emissions, a 0.64% decrease in purchasing energy costs, and a substantial 47.20% reduction in wind abandonment compared to Scenario 1.
The above comparisons clearly demonstrate that, in the gas–electric coupling system considering the multi-mode utilization of hydrogen energy, hydrogen is utilized as an energy storage and buffering element in the IES. This approach takes into account the multi-mode utilization of hydrogen energy, including gas blending with hydrogen. Without additional system equipment, CHP can directly utilize HCNG, improving the wind curtailment in the hydrogen utilization process and enhancing the system’s economic performance. Furthermore, by further exploring the system’s carbon reduction potential on the basis of the original carbon trading mechanism, sustainable development and emission reduction goals can be achieved.
4.3. Analysis of Multi-Modal Utilization of Hydrogen Energy
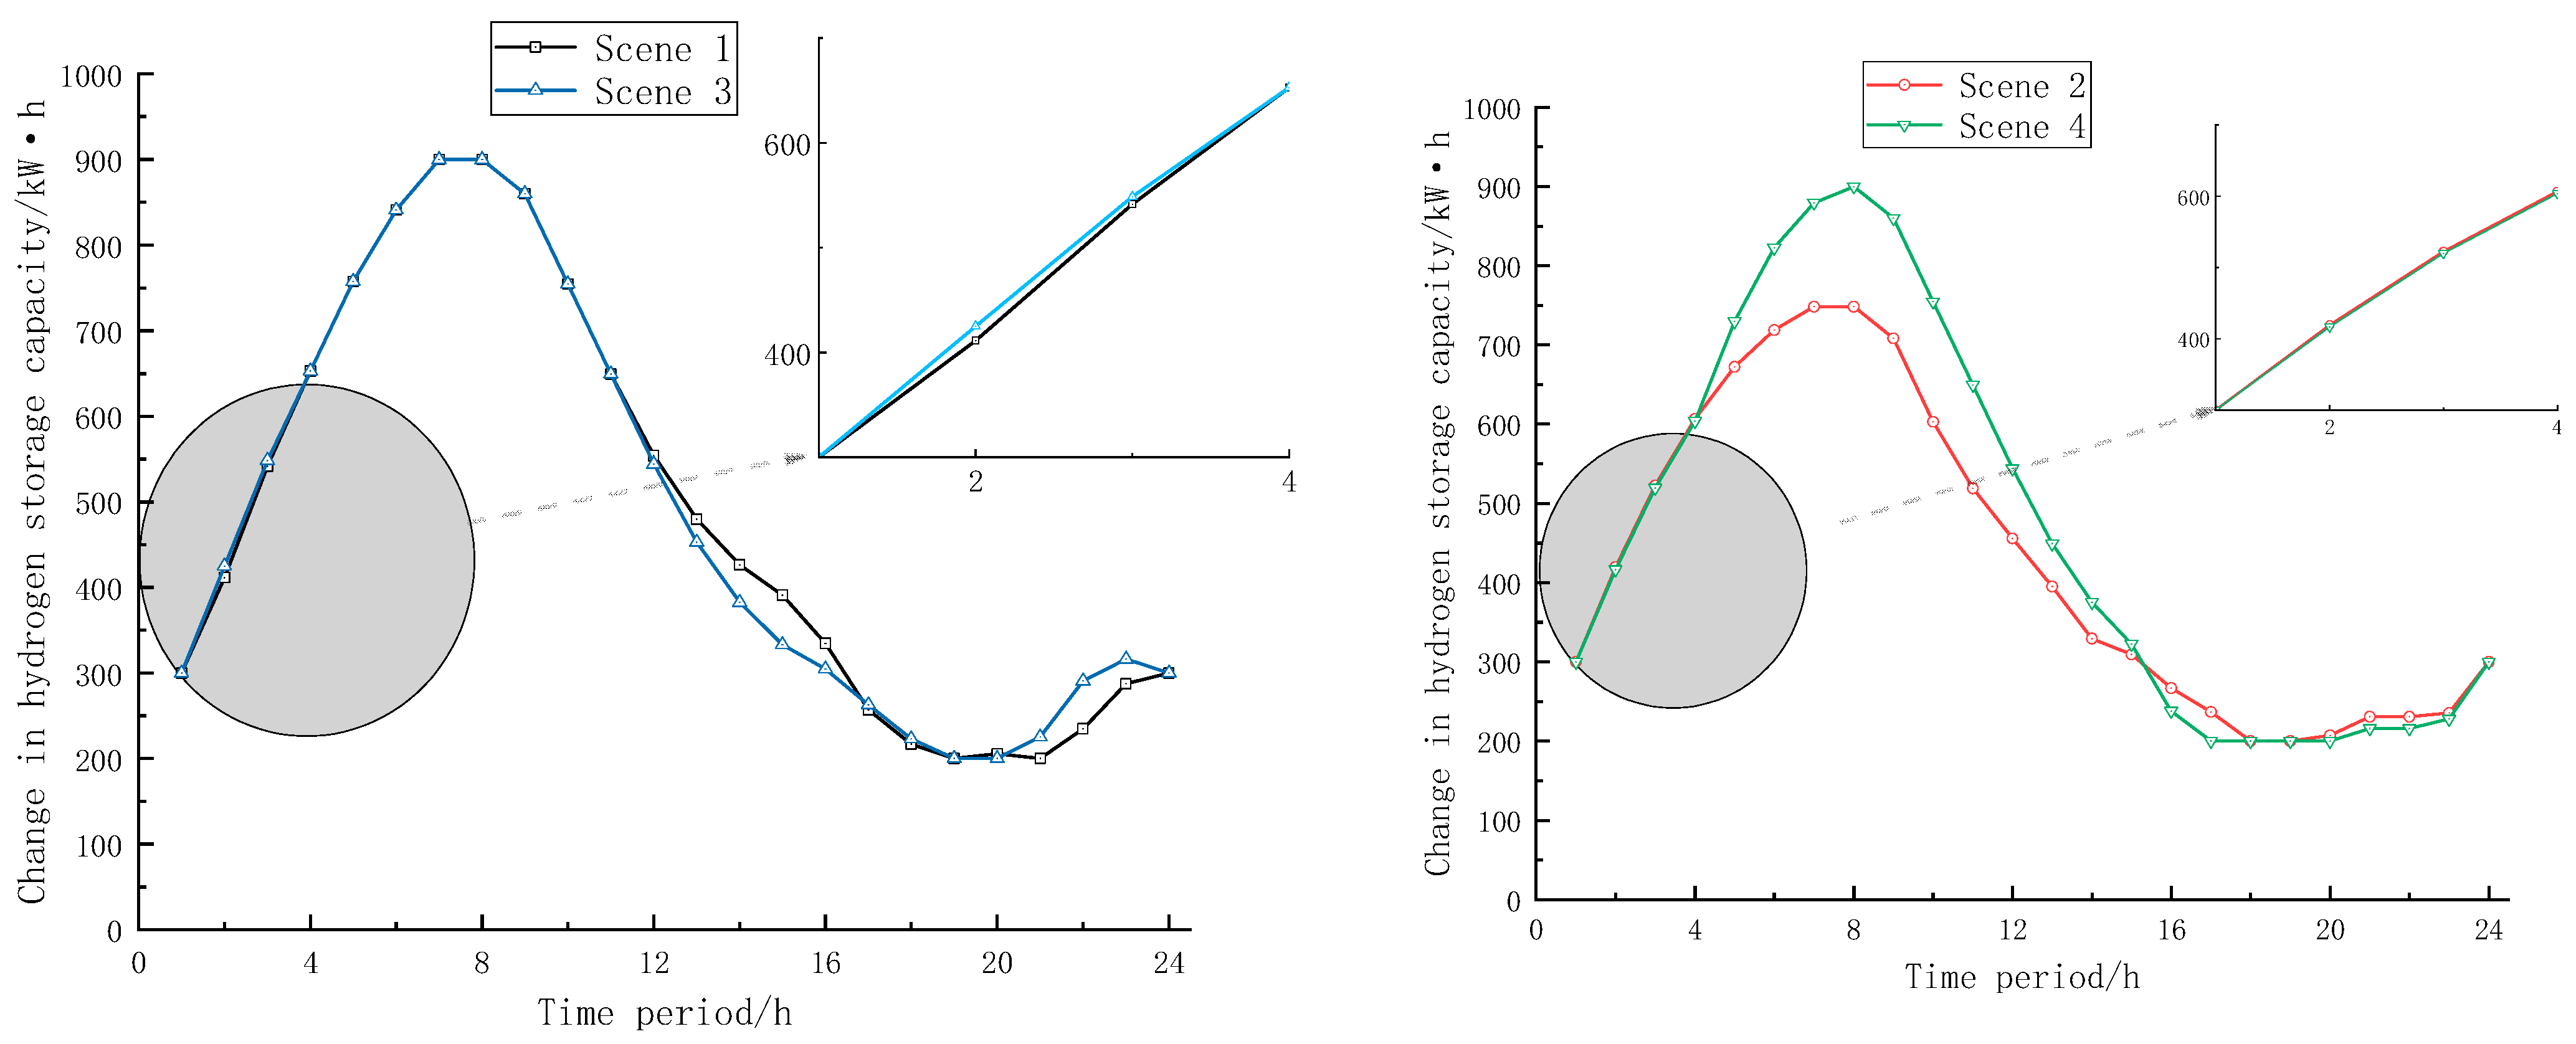
- From Figure 7, it can be seen that during the periods from 0:00 to 8:00 and from 20:00 to 24:00, the wind power output is significant. Excess wind energy, while meeting electrical and heating loads, is transformed into hydrogen through the EL for storage. In Scenarios 1 and 3, the utilization of hydrogen produced by the EL is relatively singular, serving only the system-configured HFC. The hydrogen storage tank reaches its capacity limit by 7:00. In Scenarios 2 and 4, there is demand for hydrogen in both the HFC and CHP, allowing for multiple pathways for hydrogen utilization. This enhances P2H efficiency and increases the demand for hydrogen. Scenario 2 does not reach the hydrogen storage limit, reaching its maximum capacity at 8:00. Simultaneously, in Scenario 4, the hydrogen storage tank reaches its limit at 8:00.
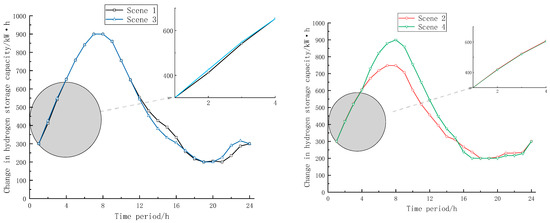 Figure 7. Fluctuations in hydrogen storage capacity.
 - In the time period from 8:00 to 11:00, the hydrogen storage capacity variation curves for Scenario 1 and Scenario 3 are roughly fitted. The hydrogen storage tank is responsible for supplying hydrogen to the HFC. In Scenarios 2 and 4, the utilization of hydrogen takes into account the different demands of energy prices and thermal–electric loads, determining the power distribution of hydrogen between CHP and the HFC. From 8:00 to 9:00, hydrogen is transported to CHP and the HFC, and, in Figure 3, it can be observed that, from 9:00 to 11:00, the thermal–electric ratio of the system decreases, leading to a substantial transfer of hydrogen to the HFC with a relatively lower thermal–electric ratio.
- From 11:00 to 20:00, when electricity and gas-purchasing prices are high, and the wind power output is at a daily low, no surplus electricity is available for hydrogen production. During this period, the hydrogen storage tank serves as the sole source of hydrogen for the fuel cells and gas turbines in Scenarios 1 and 3. The fuel cells in Scenarios 1 and 3 act as the exclusive hydrogen load, and, due to their higher costs and lower system capacity, their conversion pathway is relatively singular, leading to a fixed utilization rate of the thermal–electric ratio. In Scenarios 2 and 4, hydrogen is converted through both the HFC and CHP pathways. The differing thermal–electric ratios between the two are managed through coordinated unit output, enhancing efficiency. Additionally, the greater hydrogen-to-electric and thermal power ratios can meet energy demands during peak electricity usage. In all four scenarios, from 11:00 to 14:00, during the peak electricity price period, the hydrogen release rate from the storage tank is increased, directing the hydrogen mostly towards the HFC to reduce the system’s purchased electricity costs. From 14:00 to 20:00, in the off-peak electricity price periods, Scenarios 1 and 3 decrease the power of the HFC, increasing it during the peak electricity price periods. In Scenarios 2 and 4, the system comprehensively considers different thermal–electric ratios and energy prices, directing some hydrogen towards CHP to reduce the system’s purchased gas costs.
In summary, blending hydrogen into the gas supply can improve the utilization of hydrogen without the need for additional system equipment. Under the coordinated output of the HFC and gas turbines in CHP units, the variation in thermal–electric output ratios enhances the efficiency of hydrogen utilization. Furthermore, the gas turbine can utilize hydrogen without the need for modification, increasing the flexibility and efficiency of hydrogen utilization.
4.4. Hydrogen Blending Ratio Benefit Analysis
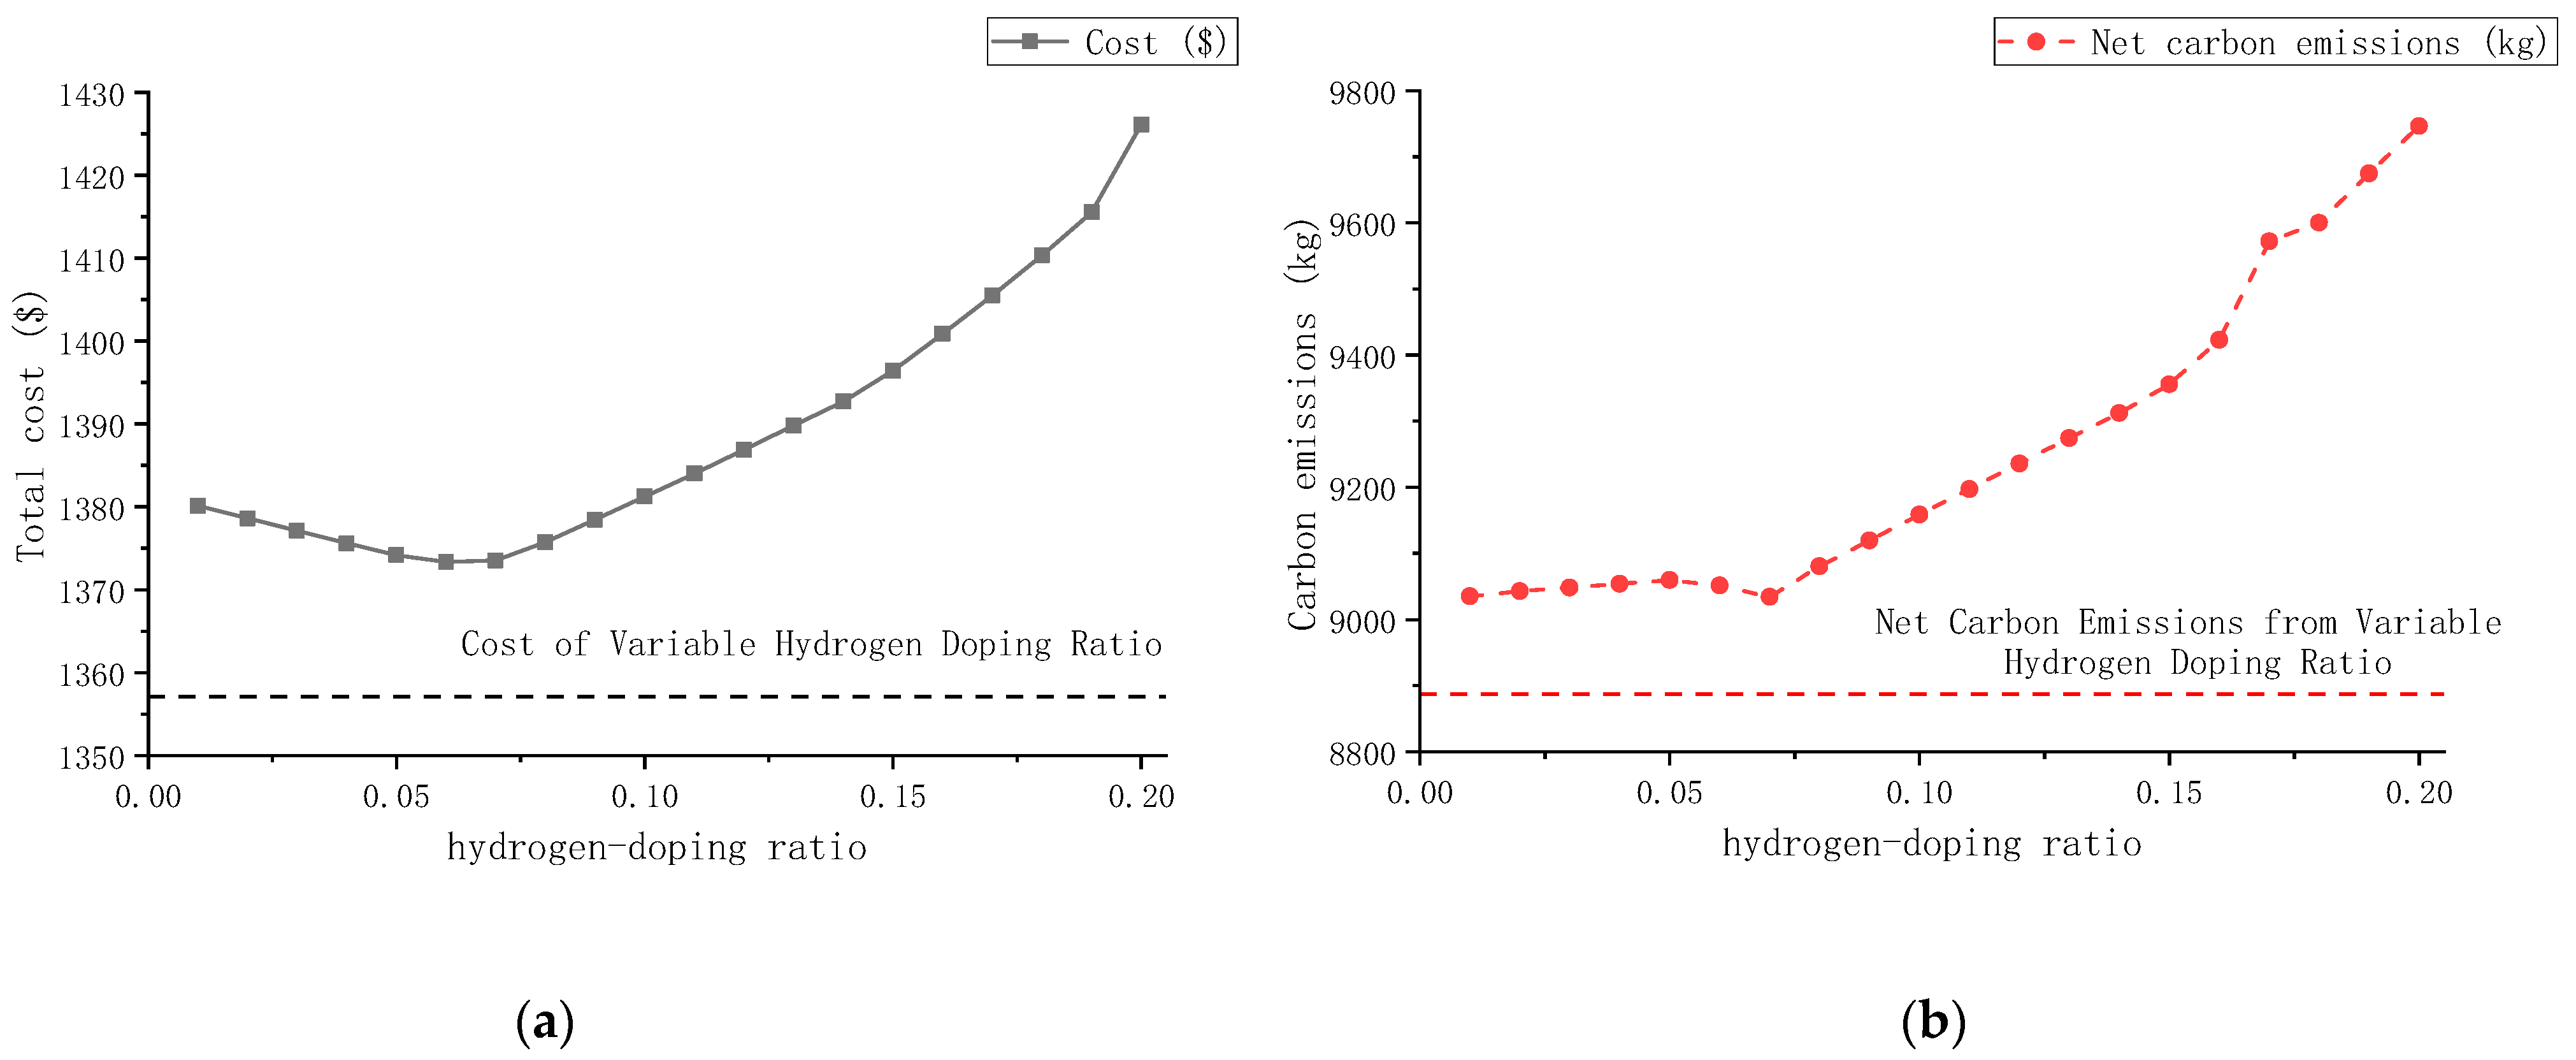
On the basis of Scenario 4, the benefits of the fixed and variable hydrogen blending ratios are further analyzed. The benefits of hydrogen doping are further analyzed using fixed and variable doping ratios based on a coordinated scheduling approach for gas–electric coupled systems by considering gas–hydrogen doping. The figure below shows the carbon emissions and total costs for different fixed and variable doping ratios.
Figure 8 indicates that, when a fixed hydrogen blending ratio is adopted, the ratio of hydrogen to natural gas input into CHP remains constant, resulting in a lack of flexibility in hydrogen utilization. In the 0% to 7% hydrogen blending ratio range, the total cost decreases slowly from USD 1380 to USD 1373, and the net carbon emissions remain around 9040 kg, slightly higher than that of the variable hydrogen blending system. In the 7% to 20% hydrogen blending ratio range, the total cost continues to rise from USD 1373 to USD 1426, and the net carbon emissions increase from 9034 kg to 9746 kg. The economic and low-carbon performance of the system is lower than that of the non-blended hydrogen system. Figure 8a,b shows that the variable hydrogen blending ratio performs significantly better in terms of low-carbon and economic performance than the fixed hydrogen blending ratio. Compared to the optimal fixed hydrogen blending ratio of 7%, the total cost and carbon emissions decrease by 1.2% and 1.64%, respectively.
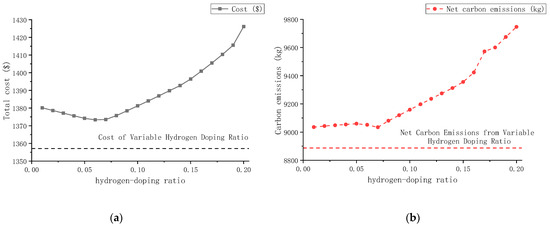
Figure 8.
Carbon emissions and total cost with different hydrogen blending ratios. (a) Total cost at different hydrogen blending ratios. (b) Net carbon emissions at different hydrogen blending ratios.
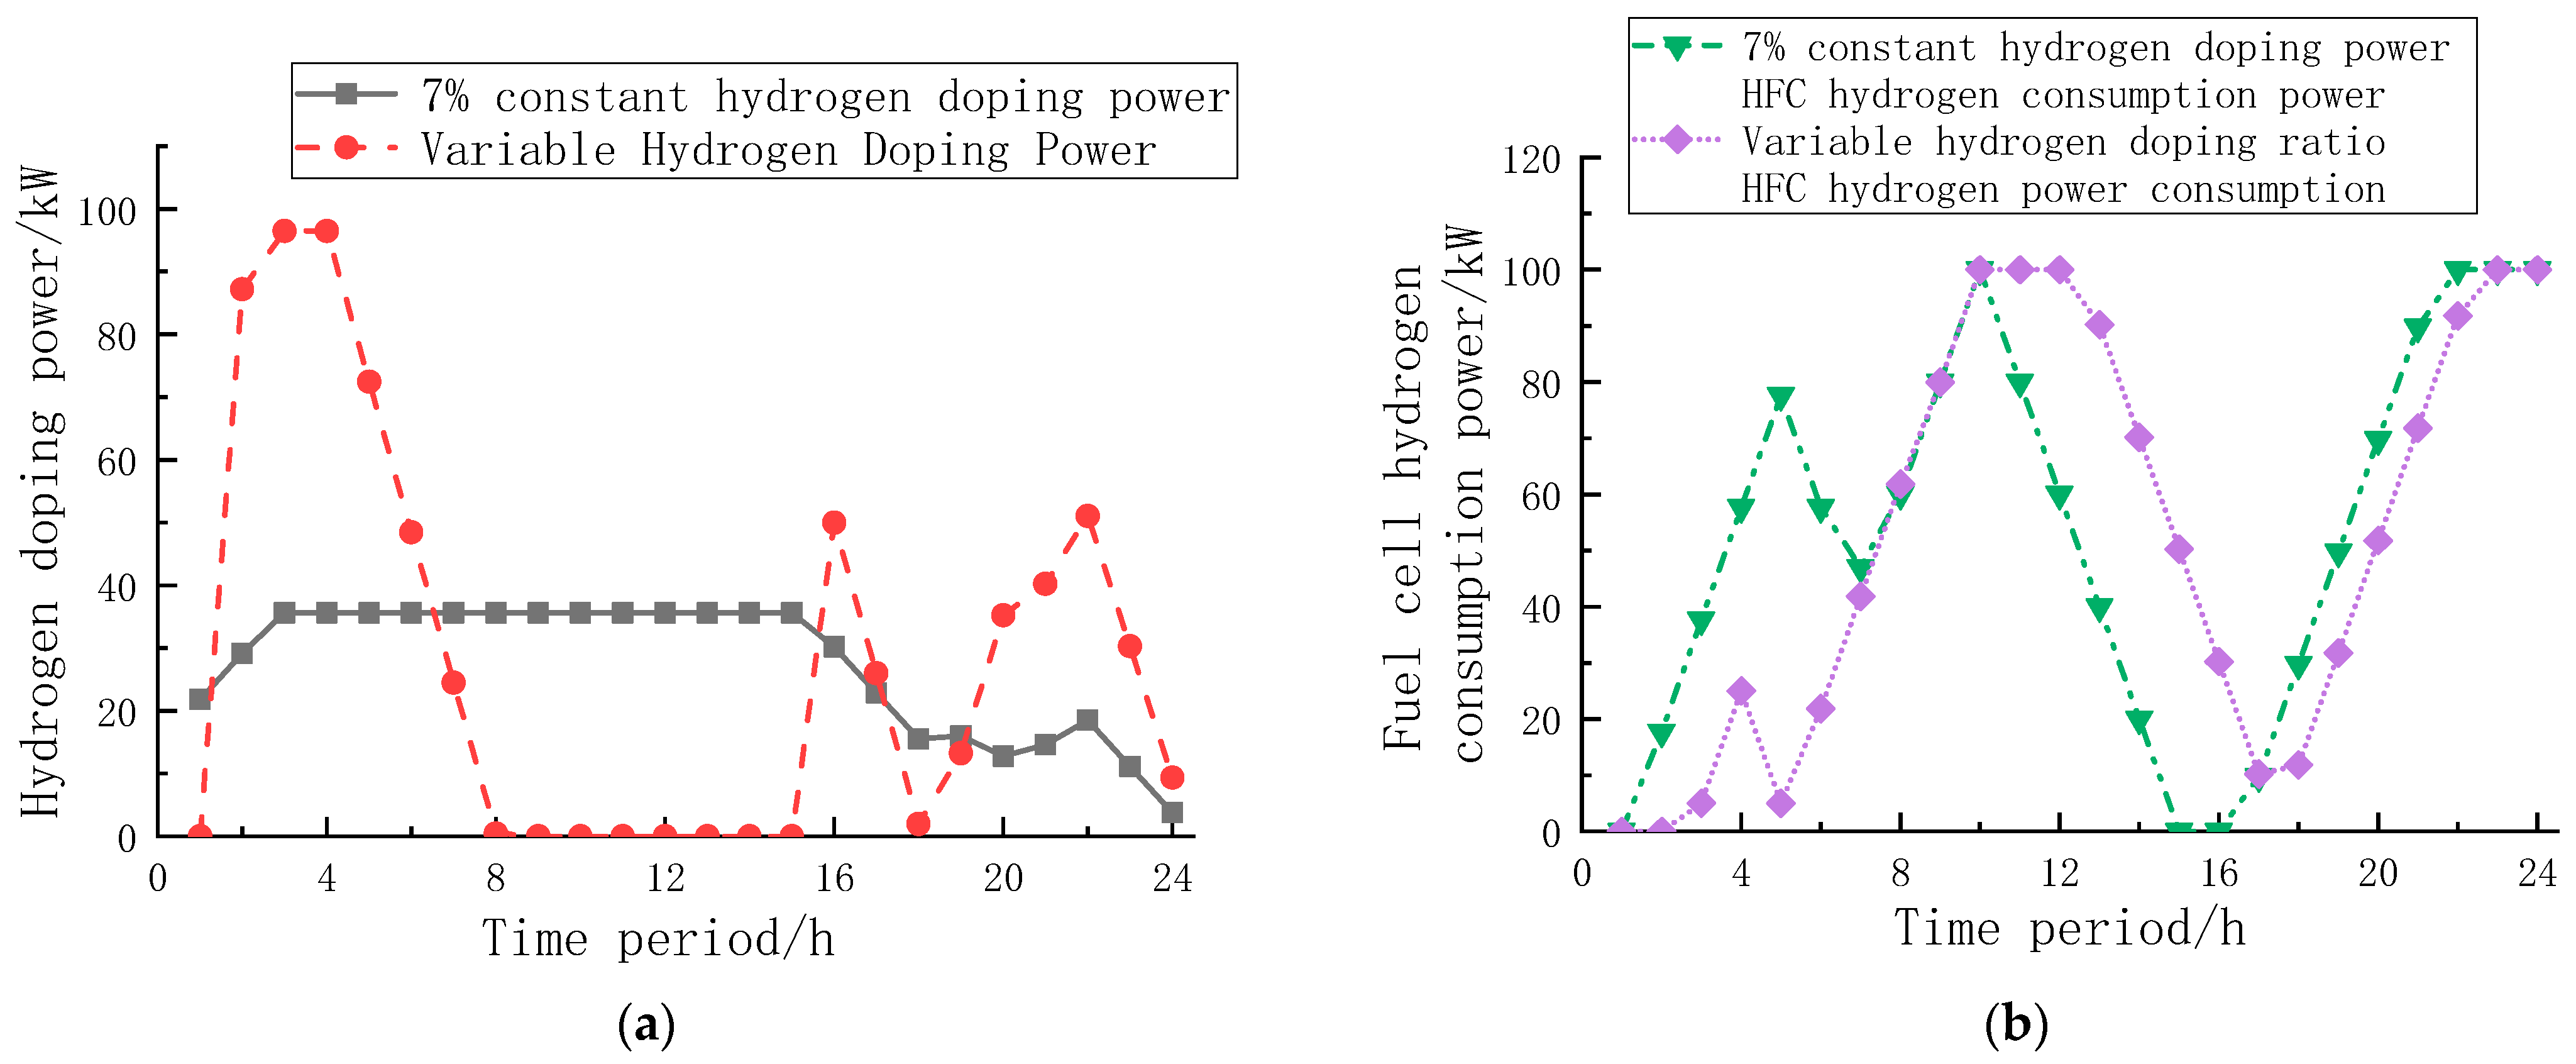
To further analyze the reasons for the different low-carbon performance and economic performance caused by the fixed and variable hydrogen blending ratios, the figure below illustrates the hydrogen consumption power of CHP and fuel cells under variable hydrogen blending ratios and a 7% fixed hydrogen blending ratio.
In Figure 9a, it is evident that, when operating at a fixed hydrogen blending ratio, the hydrogen and natural gas consumption by CHP maintains a fixed ratio, making it impossible to adjust the hydrogen blending power and lacking flexibility. Moreover, to maintain a fixed hydrogen blending ratio, uneconomical off-peak electricity is purchased for hydrogen production, significantly reducing both economic performance and low-carbon performance. In Figure 9b, it can be observed that the output of the hydrogen fuel cell (HFC) is essentially inversely fitted to the daily time-of-use electricity price curve, reducing output during off-peak hours and gradually reaching the maximum output during peak hours.
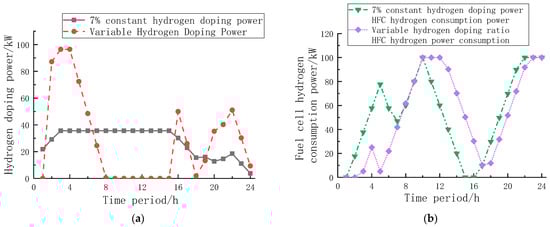
Figure 9.
Hydrogen doping power consumption. (a) Gas turbine hydrogen doping power. (b) Fuel cell hydrogen consumption power.
Under the variable hydrogen blending ratio mode, during the 0:00–6:00 and 13:00–18:00 periods with peak gas prices, the variable hydrogen blending power is high to reduce gas purchase costs. From 6:00 to 13:00, when gas prices are low, electricity prices are high, and no excess wind power is used for electrolytic hydrogen production; the system reduces the CHP hydrogen blending power, increases the HFC power, and reduces the peak electricity purchase costs. From 18:00 to 24:00, the electrolyzer utilizes excess wind power to produce hydrogen. At this time, gas prices are low, and electricity prices are at a peak. The HFC gradually increases the output power, and the hydrogen storage tank stores some hydrogen energy for the system when energy prices rise. Coordinating hydrogen blending power and HFC hydrogen consumption power according to energy prices and load demand adjusts the thermal–electric ratio of hydrogen energy conversion, avoiding the forced start of electrolysis for hydrogen production and achieving economically and environmentally friendly system operation.
4.5. The Thermal–Electric Analysis of Hydrogen Energy Conversion
We wish to delve deeper into the reasons behind the utilization pathways illustrated in Figure 8 and Figure 9. Therefore, we conduct an in-depth investigation into thermal–electric optimization. The upper graph in Figure 10 depicts the 24 h variation curve of the hydrogen blending ratio in the system. The overall trend maintains a higher hydrogen blending ratio during the night and a lower ratio during the day. During the night, the load’s thermal–electric ratio is relatively high and the hydrogen blending ratio is higher. In contrast, during the day, when the load’s thermal–electric ratio is relatively low and the wind power output is in a valley period, the hydrogen blending ratio is lower. The CHP unit has a higher thermal–electric ratio than the HFC unit in terms of energy output. By studying key parameters, such as the hydrogen blending ratio, the thermal–electric ratio, and the thermal–electric ratio of hydrogen energy utilization, we can provide strong support for the thermal–electric optimization of the system, ensuring that the system can optimally utilize hydrogen energy resources under different conditions.
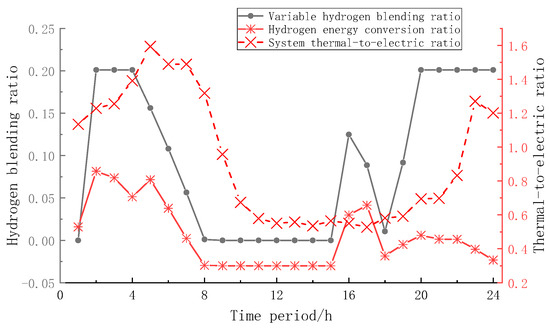
Figure 10.
Relationship between hydrogen blending and thermal–electric ratio.
4.6. Analysis of Optimized Scheduling Results
4.6.1. Power Dispatch Analysis
An energy balance analysis is performed on the scheduling results using the coordinated scheduling method in this paper.
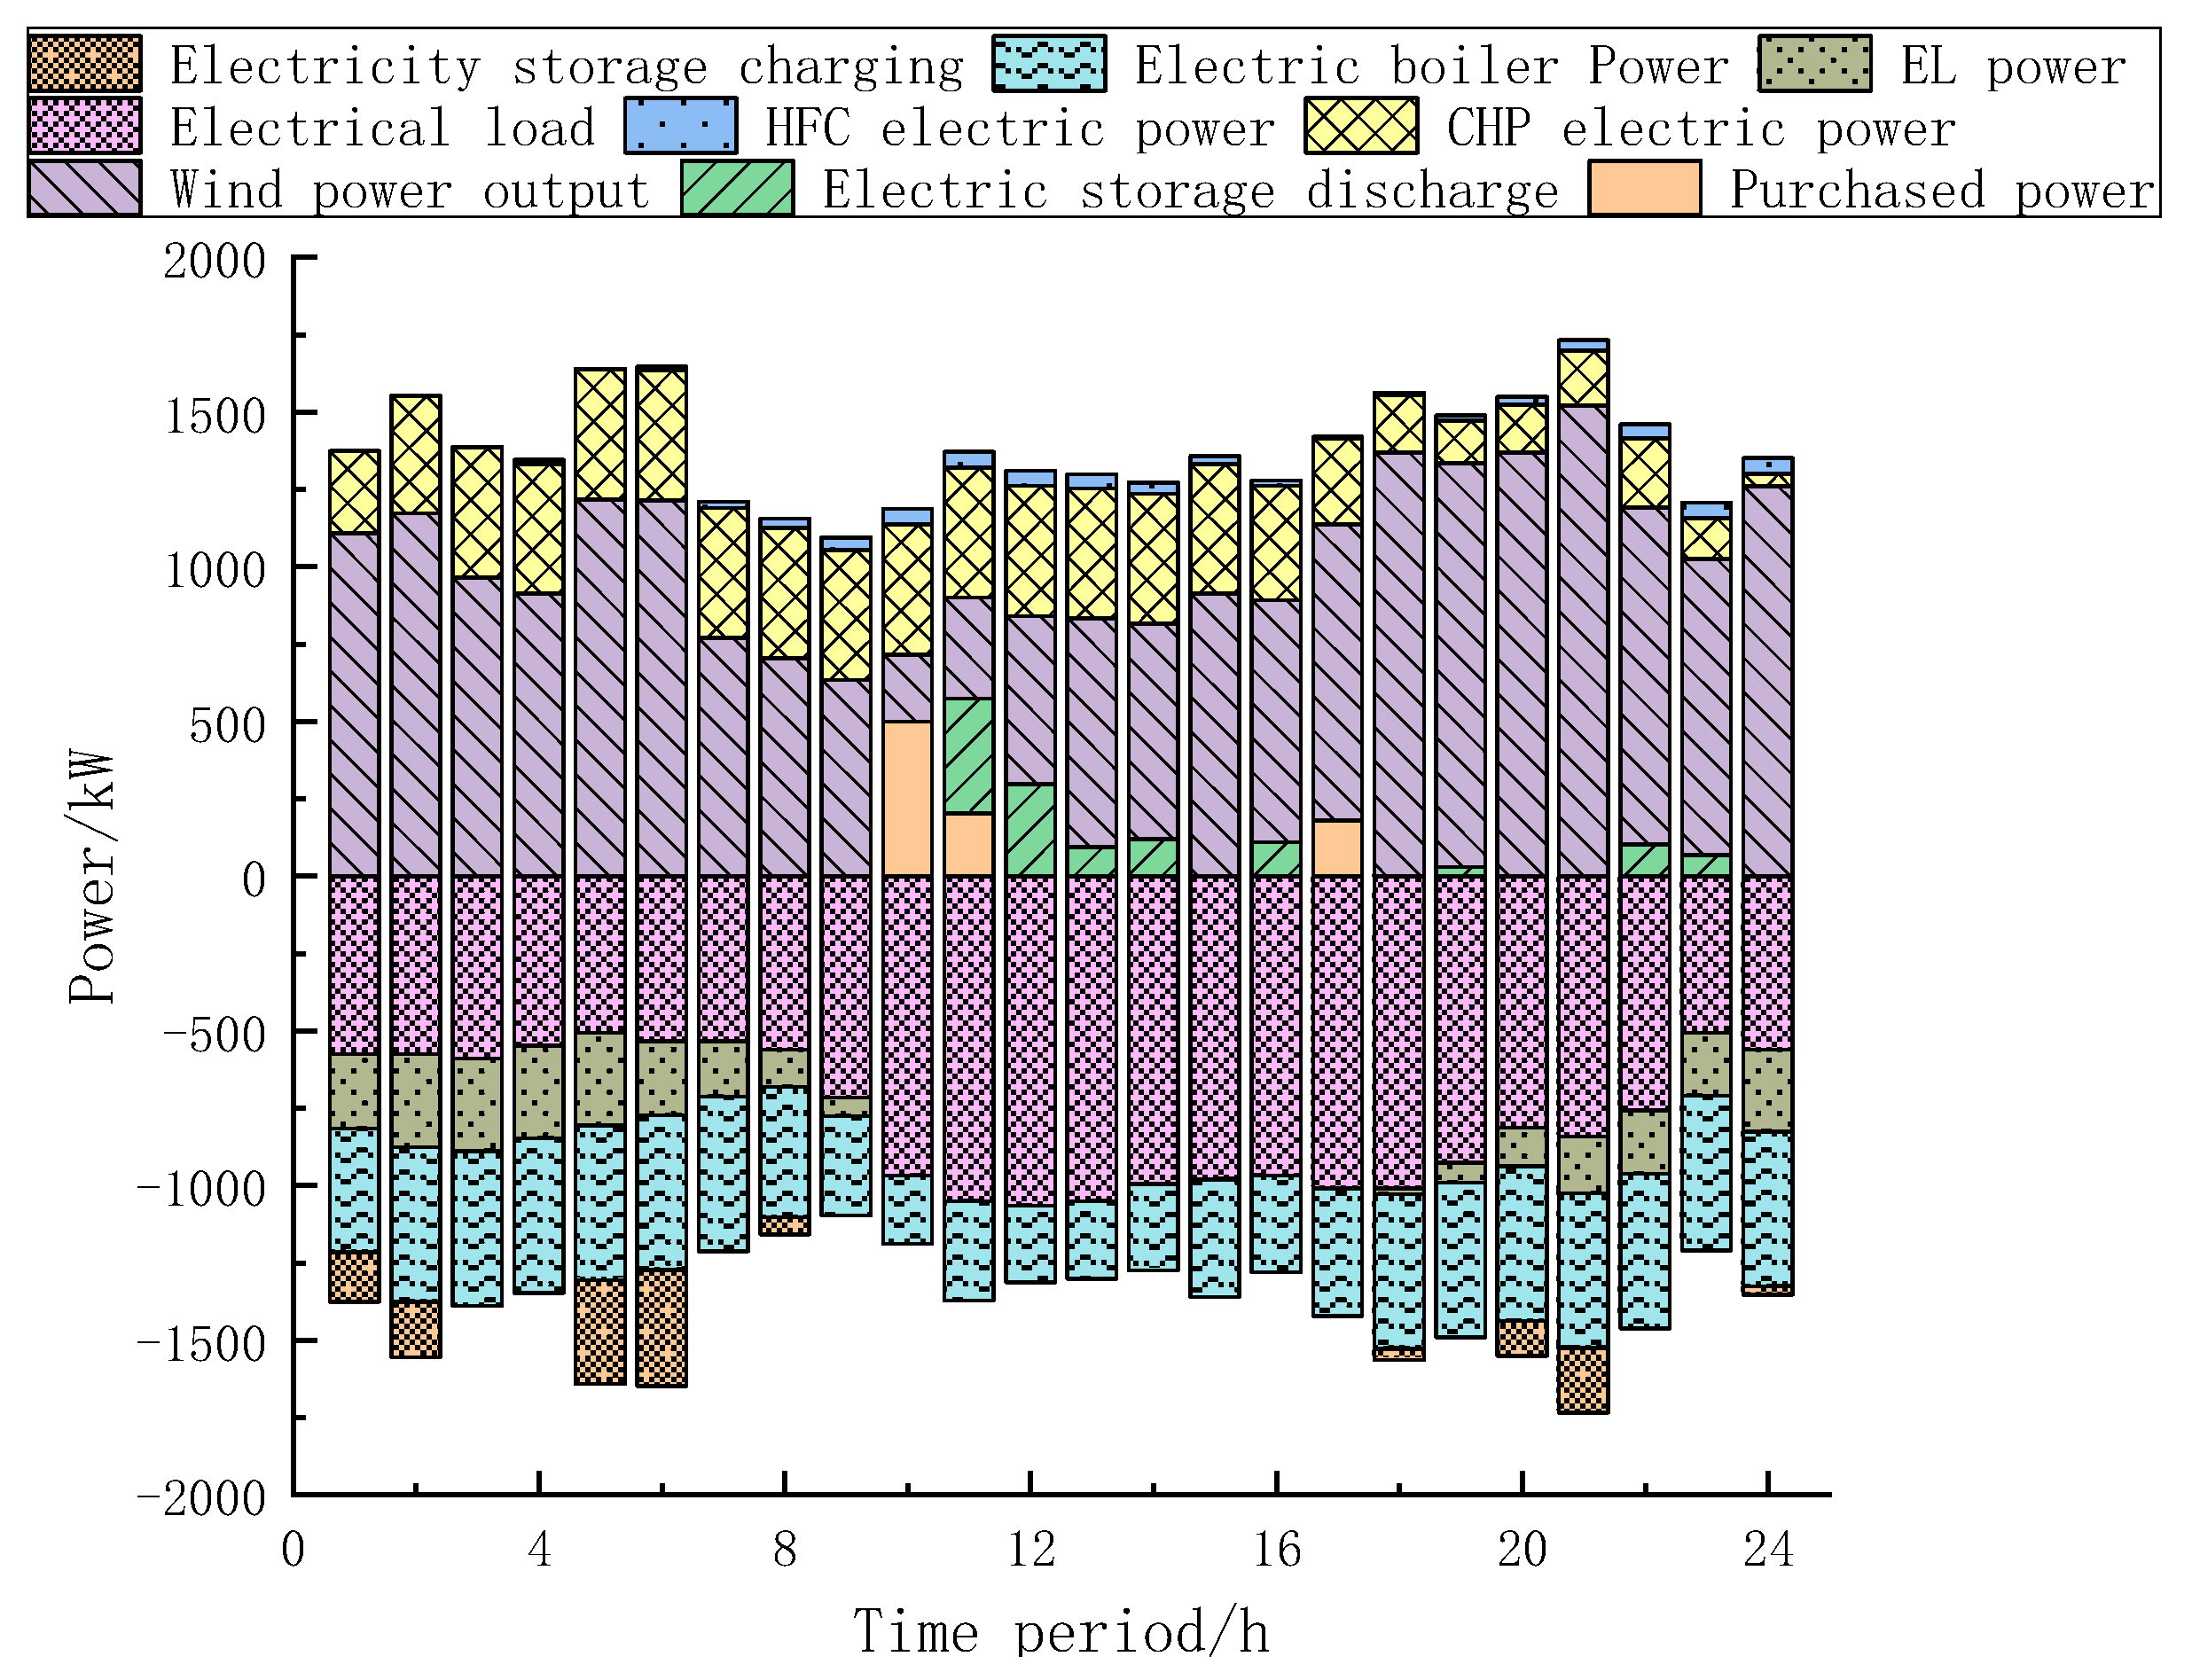
In Figure 11, it can be observed that the system is primarily supplied by the WT and CHP to meet the electricity demand. When there is a power deficit, the system relies on purchasing electricity from the grid, discharging energy from storage, and supplying power from the fuel cell. During the periods of 0:00~9:00 and 17:00~24:00, the WT output is high, and the electricity demand is low. The EL maintains a high power level in order to absorb excess wind power. From 9:00 to 11:00, as the wind power decreases, the system fully absorbs the wind power, and CHP operates at full capacity while purchasing electricity from the grid to meet the power deficit. Between 11:00 and 17:00, when the WT output reaches a trough and the electricity demand peaks, there is a power deficit. At this time, the energy storage system releases energy, and CHP operates at a high power level.
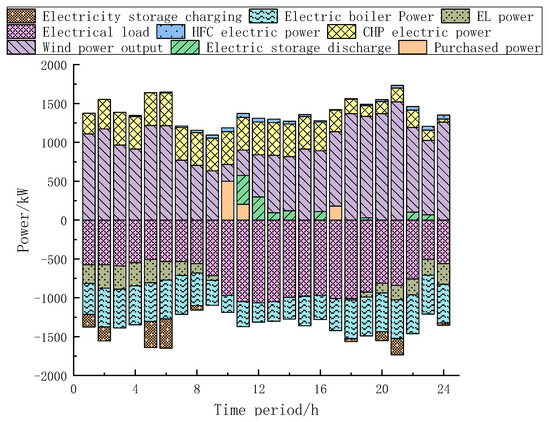
Figure 11.
Electrical power balance.
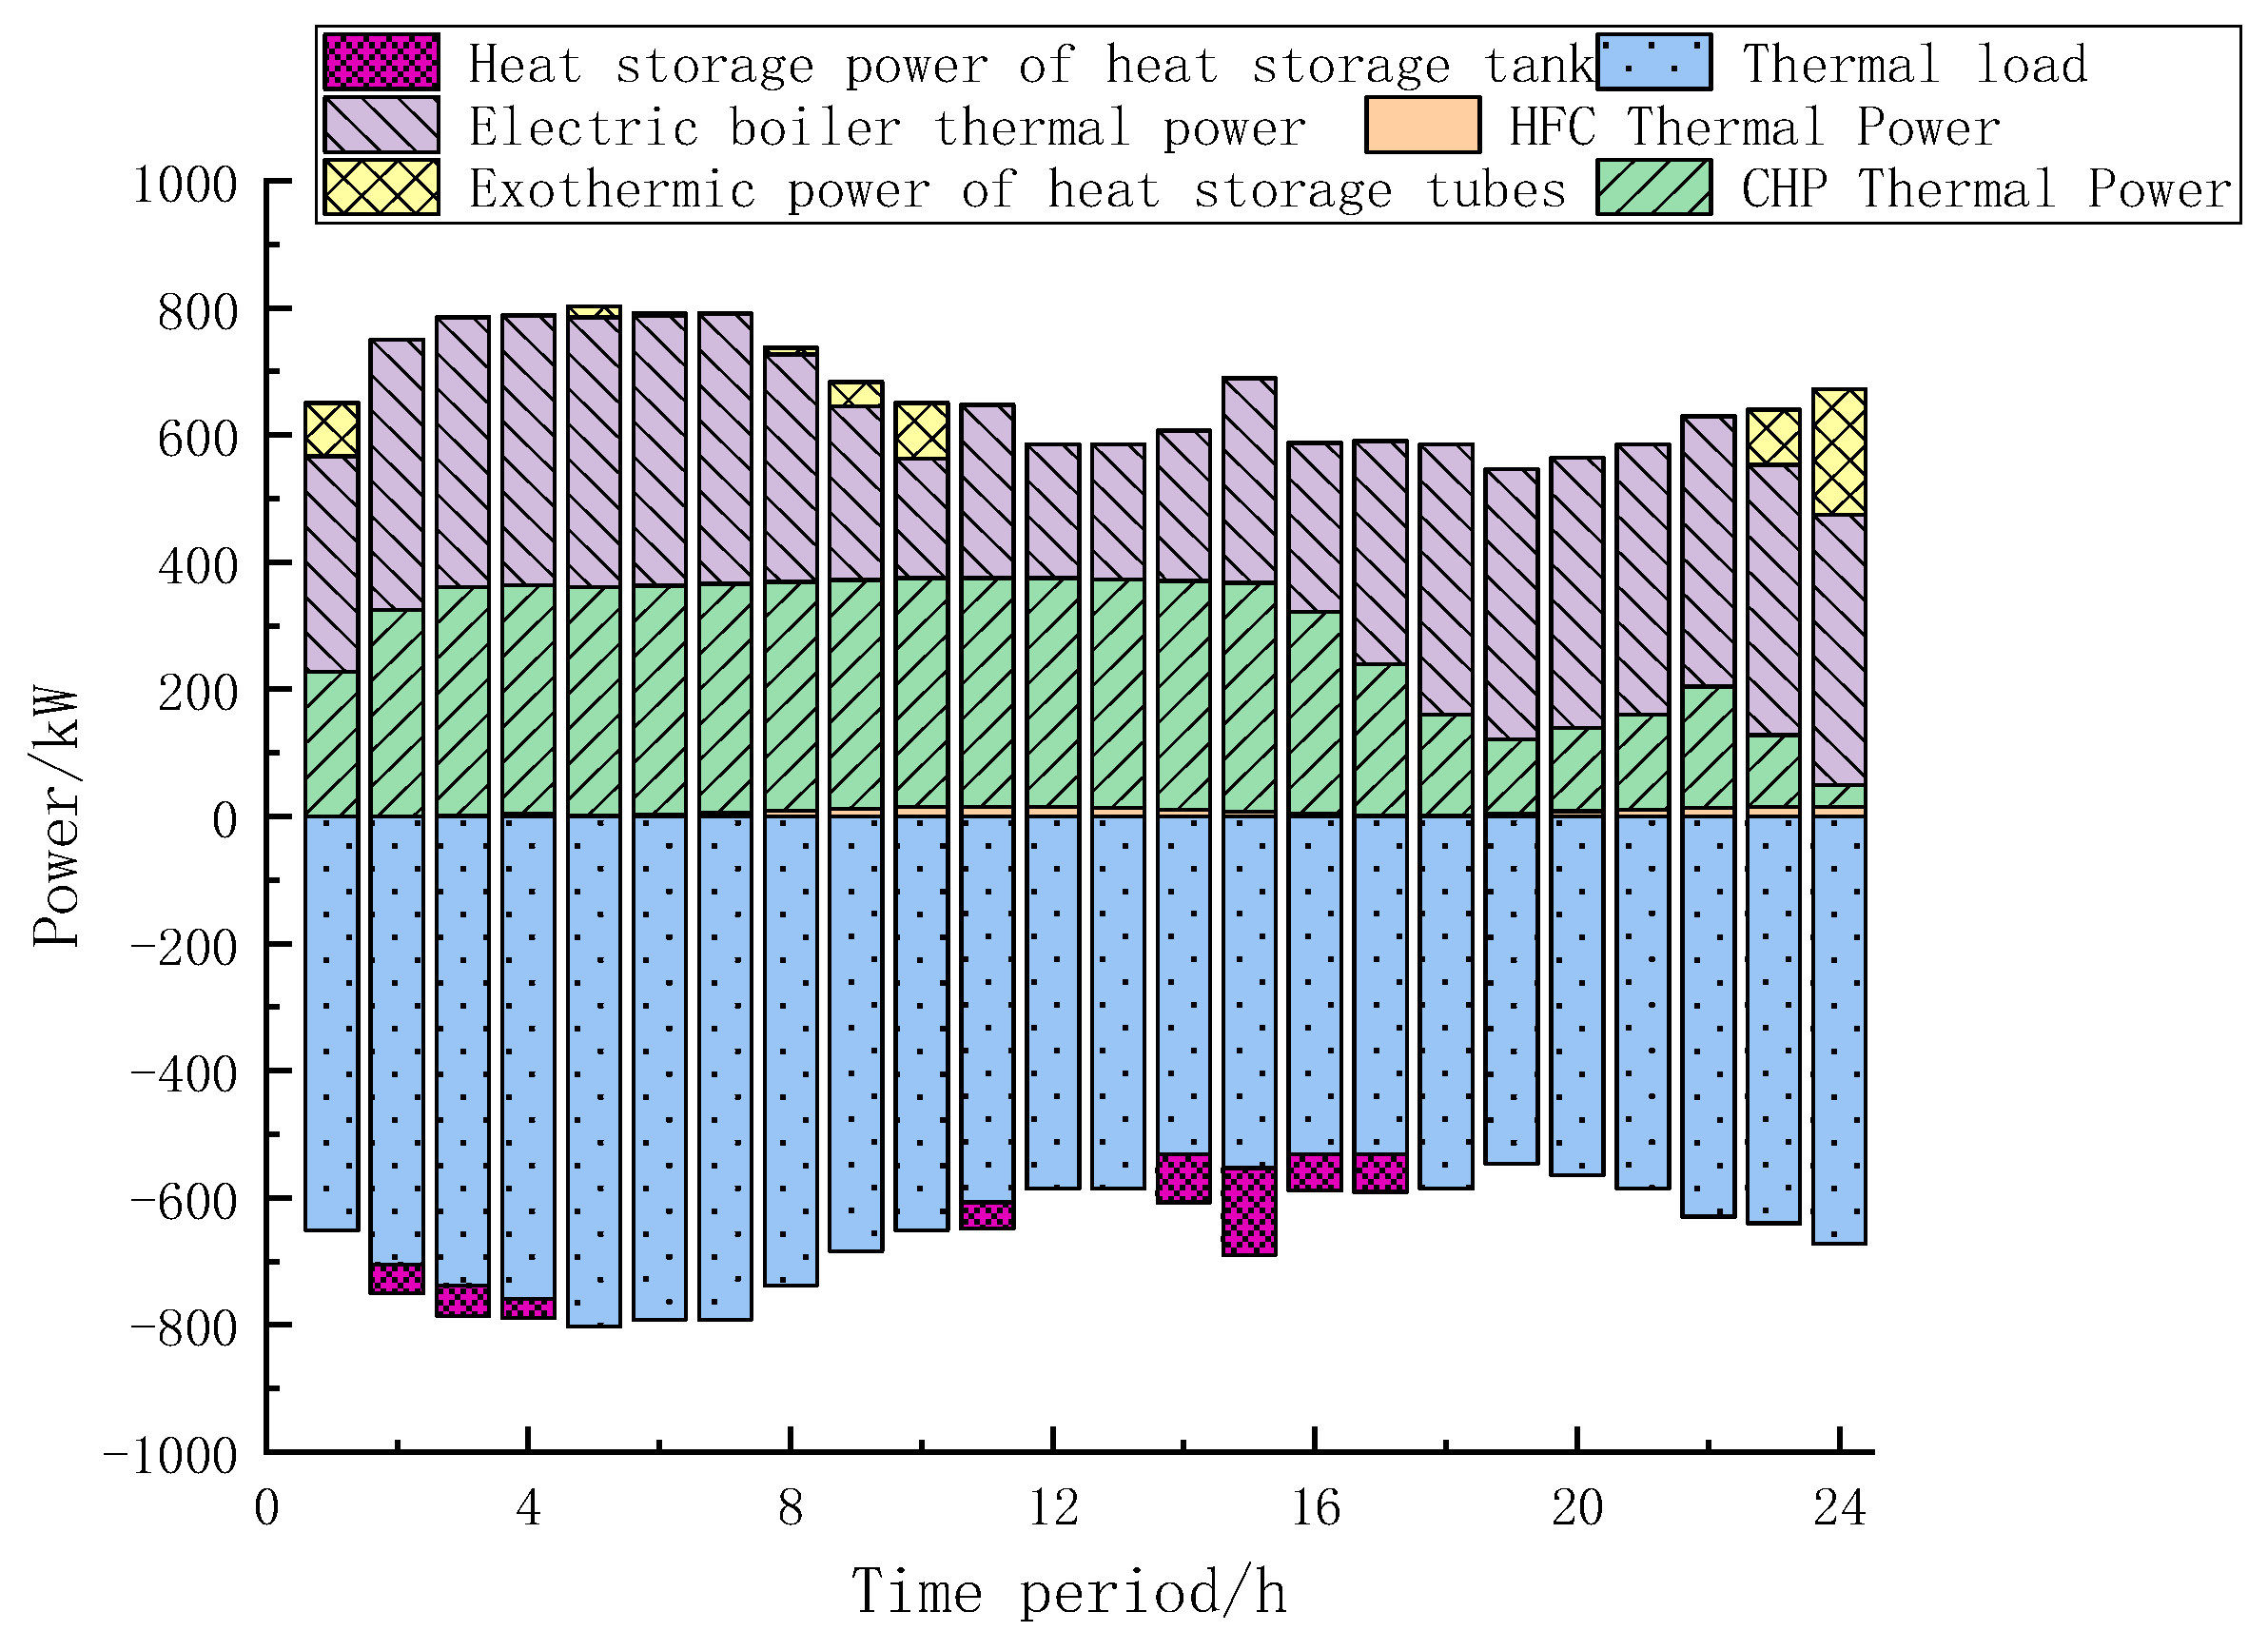
4.6.2. Thermal Dispatch Analysis
The IES relies on the EB for heat production, CHP for combined heat and power generation, the HFC for combined heat and power supply, and thermal storage tanks to meet the thermal load demand. In Figure 11 and Figure 12, it can be observed that, during the period from 0:00 to 8:00, the WT has a significant surplus after meeting the electricity demand. At this time, there is a large capacity for surplus electricity, and to meet the thermal load demand, the surplus electricity from the WT is supplied to the EB to reduce the system’s external energy purchases. From 8:00 to 14:00, the WT prioritizes supplying electricity to the load. As electricity prices rise and gas prices decrease, heating is prioritized through the CHP unit. When there is a thermal energy deficit, it is addressed by releasing heat from the thermal storage tank and directly supplying heat to EB production through system purchases from the superior power grid. From 14:00 to 17:00, the EB utilizes wind power for heat production, and CHP’s combined heat and power generation stores excess heat energy in the thermal storage tank. From 17:00 to 24:00, when the wind power reaches its peak for the day, the EB is supplied by the WT to maintain maximum power operation, and part of the thermal deficit is supplied by CHP’s combined heat and power generation and the thermal storage tank.

Figure 12.
Thermal power balance.
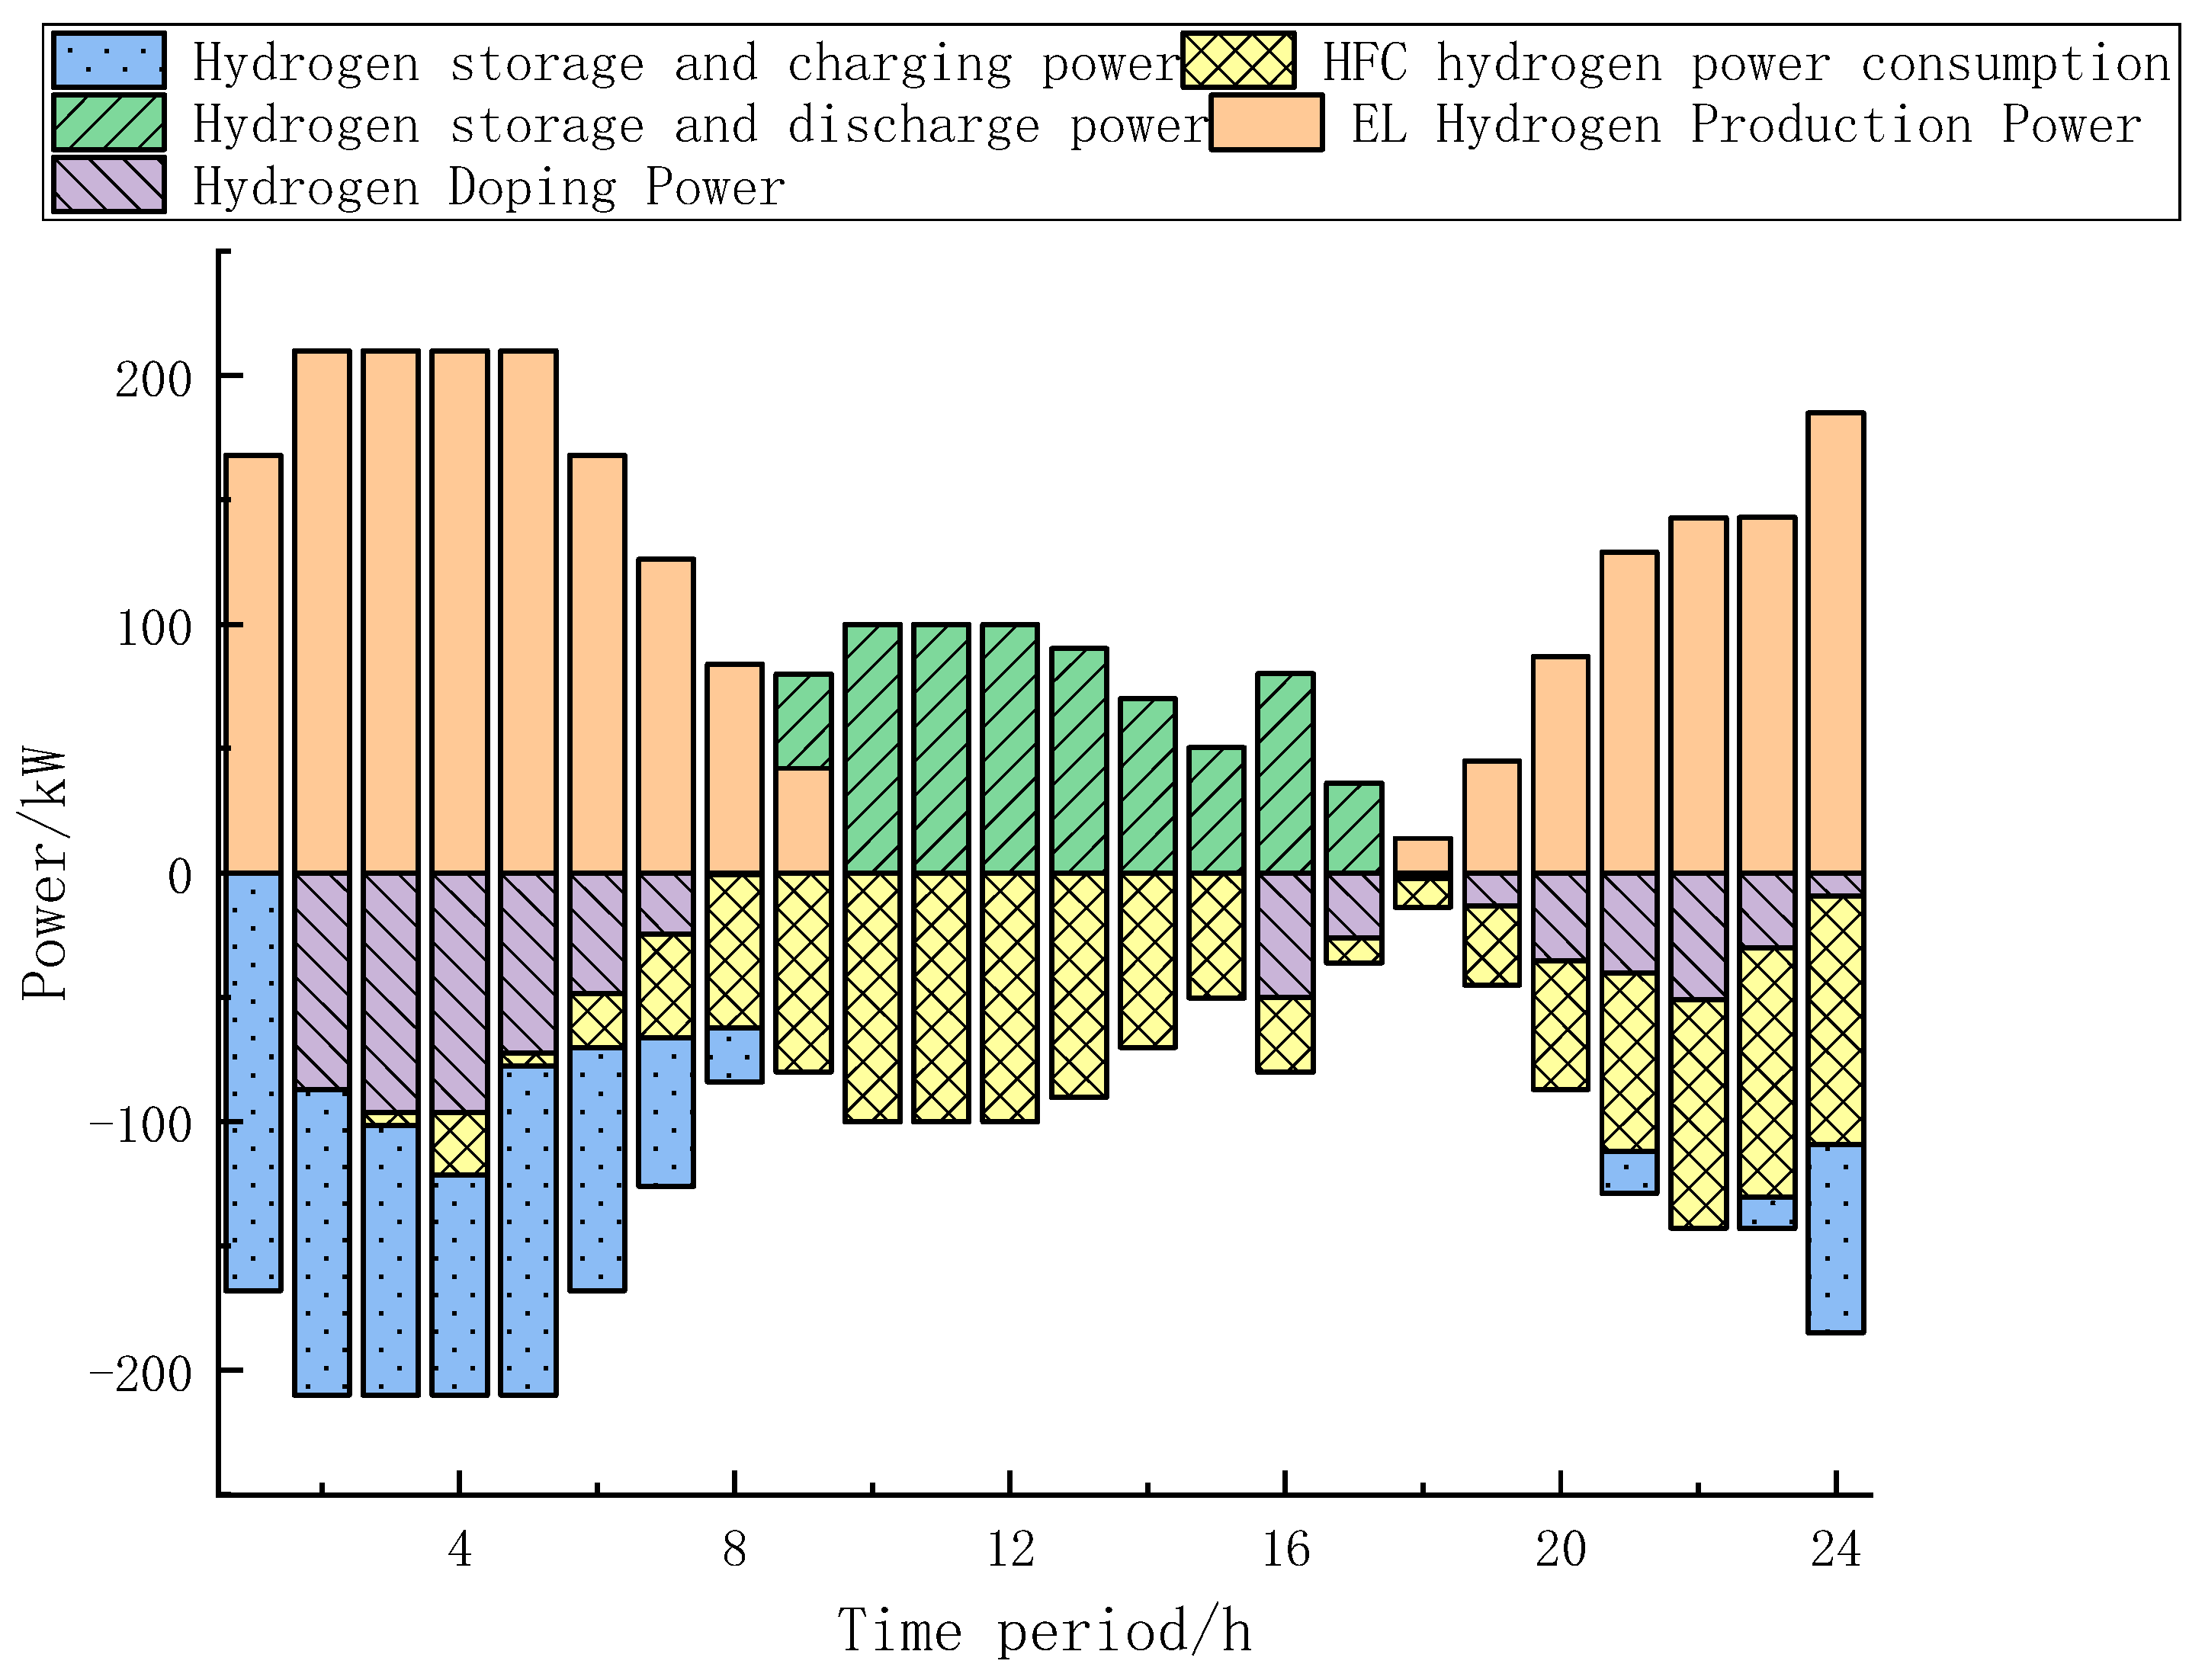
4.6.3. Hydrogen Energy Dispatch Analysis
In Figure 13, it can be observed that, during the period from 0:00 to 7:00, the WT output is significant. The EL utilizes surplus wind power for hydrogen production through electrolysis. Most of the hydrogen is used for blending to reduce the system’s gas-purchasing costs. From 7:00 to 9:00, the IES electric-to-thermal ratio increases, leading to higher HFC hydrogen consumption and blending rates. This adjustment allows the hydrogen utilization–electric-to-thermal ratio to fit the system’s electric-to-thermal ratio. From 9:00 to 17:00, there is no surplus wind power available for hydrogen production. The hydrogen supply to hydrogen-consuming devices is managed by the hydrogen storage tank. From 17:00 to 24:00, the wind power reaches its peak for the day, and the EL utilizes surplus wind power for hydrogen production. The HFC and blending rates are adjusted based on the IES electric-to-thermal ratio, and any excess hydrogen gas is stored.
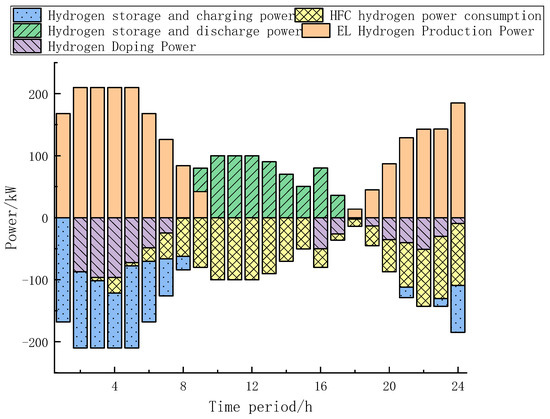
Figure 13.
Hydrogen power balance.
5. Conclusions
This paper discusses the challenges posed by a high proportion of wind power in comprehensive energy systems and the inefficiency of traditional power-to-gas (P2G) processes. Building upon a carbon trading system, this paper proposes an efficient electricity–gas–electricity energy flow system using electrolysis and gas blending. By considering the multi-mode utilization of hydrogen, refining the usage pathways, and enhancing the efficiency of hydrogen utilization while mitigating surplus wind power, this study analyzes various scenarios and draws the following conclusions:
The coordinated scheduling method proposed in this paper, NGECS, refines the multi-mode utilization pathways of hydrogen. This enhances the flexibility of hydrogen utilization. The use of gas blending establishes an efficient electricity–gas–electricity energy flow system. Combined with other hydrogen utilization modes, it improves the system’s low-carbon and economic performance. By combining gas blending with hydrogen and the integration of a tiered carbon trading mechanism, it is possible to further exploit the decarbonization potential of the system. In Scenario 1, the addition of a tiered carbon trading mechanism reduces carbon emissions by 7.21%. Building upon this foundation, the introduction of gas blending with hydrogen further decreases carbon emissions by an additional 1.72%.
Furthermore, the variable hydrogen blending ratio offers greater flexibility in hydrogen utilization than a fixed blending ratio, allowing adjustments based on energy prices and the output of various units. The use of a variable hydrogen blending ratio system reduces net carbon emissions and total costs by 1.64% and 1.20%, respectively, compared to the optimal fixed blending ratio of 7%.
The scheduling method developed in this paper holds significant value for the operation of Integrated Energy Systems (IES) in regions where power infrastructure is weak but renewable energy sources such as wind energy are abundant. The research findings are supported by references [19,20,23]. Utilizing hydrogen as an energy coupling hub optimizes the economic efficiency and low-carbon characteristics of the overall IES operation. This paper has not taken into account the uncertainties on the generation and demand side, as well as the dynamic processes in the natural gas network. Subsequent research will further investigate the impact of uncertainties in generation and demand on system scheduling, as well as the dynamic processes in the natural gas network in the context of hydrogen blending and mixed transmission models.
Author Contributions
Conceptualization, Y.S.; Methodology, C.G.; Software, C.G. and L.H.; Validation, C.G. and L.H.; Investigation, Y.S.; Resources, C.C.; Data curation, C.G.; Writing—original draft, C.G.; Writing—review & editing, X.A.; Project administration, X.A.; Funding acquisition, X.A. and C.C. All authors have read and agreed to the published version of the manuscript.
Funding
This research was funded by Xinjiang Uygur Autonomous Region Natural Science Foundation Grant Project 2022D01C664.
Institutional Review Board Statement
Not applicable.
Informed Consent Statement
Not applicable.
Data Availability Statement
Data is contained within the article.
Conflicts of Interest
The authors declare no conflict of interest.
Nomenclature
| IES | Integrated Energy System |
| HCNG | Hydrogen Compressed Natural Gas |
| P2G | Power-to-hydrogen |
| P2H | Power-to-hydrogen |
| P2M | Power-to-methane |
| NGECS | Natural Gas–Electricity Coupling System |
| WT | Wind turbines |
| EL | Electrolyzer |
| MT | Microturbine |
| CHP | Combined heat and power |
| HFC | Hydrogen fuel cell |
| PEM | Proton exchange membrane |
| System scheduling interval,1h | |
| The volume fraction of the hydrogen in HCNG | |
| The corresponding calorific values for hydrogen and methane | |
| The volumes of hydrogen and natural gas consumed by the CHP during time period t | |
| The actual carbon emissions of IES | |
| The actual carbon emissions from the purchasing of electricity from the higher-level grid | |
| The combined CHP system of the gas turbine unit | |
| Carbon emissions associated with the consumption of natural gas per unit of power | |
| Electrical and thermal efficiencies of CHP cogeneration | |
| Length of the carbon emission unit interval | |
| Price growth rate | |
| Compensation coefficient | |
| Carbon trading cost | |
| Electricity–hydrogen conversion efficiency | |
| The charging efficiencies of the hydrogen, thermal, and electrical energy storage devices | |
| The discharging efficiencies of the hydrogen, thermal, and electrical energy storage devices | |
| Electrical efficiencies of CHP cogeneration | |
| Thermal efficiencies of CHP cogeneration | |
| The electrical energy input to the EL in time period t | |
| The hydrogen energy produced by the EL device in time period t | |
| The power consumption of hydrogen and natural gas by the CHP during time period t | |
| The electrical and thermal power generated by the HFC through CHP during time period t | |
| The power generation and heat production rates of the CHP during time period t | |
| The charging and discharging power of the hydrogen, thermal, and electrical energy storage devices in time period t | |
| Maximum charging and discharging power of the hydrogen, thermal, and electrical energy storage devices | |
| The capacities of the hydrogen, thermal, and electrical energy storage devices in time period t | |
| The climbing constraints for the EL |
References
- Bel, G.; Joseph, S. Climate change mitigation and the role of technological change: Impact on selected headline targets of Europe’s 2020 climate and energy package. Renew. Sustain. Energy Rev. 2018, 82, 3798–3807. [Google Scholar] [CrossRef]
- Wang, D.; Huang, D.; Hu, Q. Modeling and strategy of integrated demand response based on joint electricity-heat clearing market. Autom. Electr. Power Syst. 2020, 44, 13–21. [Google Scholar]
- Liu, W.; Huang, Y.; Li, Z.; Yang, Y.; Yi, F. Optimal allocation for coupling device in an integrated energy system considering complex uncertainties of demand response. Energy 2020, 198, 117279. [Google Scholar] [CrossRef]
- Gu, W.; Wu, Z.; Bo, R.; Liu, W.; Zhou, G.; Chen, W. Modeling, planning and optimal energy management of combined cooling, heating and power microgrid: A review. Int. J. Electr. Power Energy Syst. 2014, 54, 26–37. [Google Scholar] [CrossRef]
- Li, Q.; Zhao, S.; Pu, Y.; Chen, W.; Yu, J. Capacity optimization of hybrid energy storage microgrid considering electricity-hydrogen coupling. Trans. China Electrotech. Soc. 2021, 36, 486–495. [Google Scholar]
- Guandalini, G.; Campanari, S.; Romano, M.C. Power-to-gas plants and gas turbines for improved wind energy dispatchability: Energy and economic assessment. Appl. Energy 2015, 147, 117–130. [Google Scholar] [CrossRef]
- Dawood, F.; Anda, M.; Shafiullah, G.M. Hydrogen production for energy: An overview. Int. J. Hydrog. Energy 2020, 45, 3847–3869. [Google Scholar] [CrossRef]
- Staffell, I.; Scamman, D.; Abad, A.V.; Balcombe, P.; Dodds, P.E.; Ekins, P.; Shah, N.; Ward, K.R. The role of hydrogen and fuel cells in the global energy system. Energy Environ. Sci. 2019, 12, 463–491. [Google Scholar] [CrossRef]
- Zhou, S.; Sun, K.; Wu, Z.; Gu, W.; Wu, G.; Li, Z.; Li, J. Optimized operation method of small and medium-sized integrated energy system for P2G equipment under strong uncertainty. Energy 2020, 199, 117269. [Google Scholar] [CrossRef]
- Xu, X.; Jia, H.; Wang, D.; David, C.Y.; Chiang, H.D. Hierarchical energy management system for multi-source multi-product microgrids. Renew. Energy 2015, 78, 621–630. [Google Scholar] [CrossRef]
- Hongjie, J.; Dan, W.; Xiandong, X.; Xiaodan, Y. Research on some key problems related to integrated energy systems. Autom. Electr. Power Syst. 2015, 39, 198–207. [Google Scholar]
- Schiebahn, S.; Grube, T.; Robinius, M.; Tietze, V.; Kumar, B.; Stolten, D. Power to gas: Technological overview, systems analysis and economic assessment for a case study in Germany. Int. J. Hydrog. Energy 2015, 40, 4285–4294. [Google Scholar] [CrossRef]
- Zhang, S.; Lu, H.; Lin, X.; Zhong, W.; Liu, S. Operation scheduling optimization of integrated-energy system in industrial park in consideration of energy storage. High Volt. Eng. 2021, 47, 93–101. [Google Scholar]
- He, G.X.; Yan, H.; Chen, L.; Tao, W.Q. Economic dispatch analysis of regional Electricity–Gas system integrated with distributed gas injection. Energy 2020, 201, 117512. [Google Scholar] [CrossRef]
- Liu, J.; Zhou, C.; Gao, H.; Guo, Y.; Zhu, Y. A day-ahead economic dispatch optimization model of integrated electricity-natural gas system considering hydrogen-gas energy storage system in microgrid. Power Syst. Technol. 2018, 42, 170–179. [Google Scholar]
- Yan, S.; Chen, W.; Zhou, D. Optimization of integrated electricity and gas system considering hydrogen-natural-gas mixture transportation. Electr. Power Eng. Technol. 2021, 40, 10–16. [Google Scholar]
- Cui, Y.; Yan, S.; Zhong, W.; Wang, Z.; Zhang, P.; Zhao, Y. Optimal thermoelectric dispatching of regional integrated energy system with power-to-gas. Power Syst. Technol. 2020, 44, 4254–4264. [Google Scholar]
- Huo, X.; Wang, J.; Jiang, L.; Xu, Q. Review on key technologies and applicatongs of hydrogen energy storage system. Energy Storage Sci. Technol. 2016, 5, 197–203. [Google Scholar]
- Quintino, F.M.; Nascimento, N.; Fernandes, E.C. Aspects of hydrogen and biomethane introduction in natural gas infrastructure and equipment. Hydrogen 2021, 2, 301–318. [Google Scholar] [CrossRef]
- Radoushinsky, D.; Gogolinskiy, K.; Dellal, Y.; Sytko, I.; Joshi, A. Actual Quality Changes in Natural Resource and Gas Grid Use in Prospective Hydrogen Technology Roll-Out in the World and Russia. Sustainability 2023, 15, 15059. [Google Scholar] [CrossRef]
- Isaac, T. HyDeploy: The UK’s first hydrogen blending deployment project. Clean Energy 2019, 3, 114–125. [Google Scholar] [CrossRef]
- Gondal, I.A. Hydrogen integration in power-to-gas networks. Int. J. Hydrog. Energy 2019, 44, 1803–1815. [Google Scholar] [CrossRef]
- Song, X.; Qu, Z.; Kou, J.; Wang, Y.; Georgievitch, P.M. Environmental Economical Dispatching of Electric–Gas Integrated Energy System Considering Hydrogen Compressed-Natural Gas. Processes 2022, 10, 2642. [Google Scholar] [CrossRef]
- Jin, L.; Ferrario, A.M.; Cigolotti, V.; Comodi, G. Evaluation of the impact of green hydrogen blending scenarios in the Italian gas network: Optimal design and dynamic simulation of operation strategies. Renew. Sustain. Energy Transit. 2022, 2, 100022. [Google Scholar] [CrossRef]
- Zhou, D.; Yan, S.; Huang, D.; Shao, T.; Xiao, W.; Hao, J.; Chen, W.; Yu, T. Modeling and simulation of the hydrogen blended gas-electricity integrated energy system and influence analysis of hydrogen blending modes. Energy 2022, 239, 121629. [Google Scholar] [CrossRef]
- Hao, Z.; Li, C.; Zhu, Y. Feasibility analysis of hydrogen doped natural gas in China. Yunnan Chem. 2021, 48, 94–96. [Google Scholar]
- Qiu, Y.; Zhou, S.; Gu, W.; Pan, G.; Chen, X. Application prospect analysis of hydrogen enriched compressed natural gas technologies under the target of carbon emission peak and carbon neutrality. Proc. Chin. Soc. Electr. Eng. 2022, 42, 2642. [Google Scholar]
- Ren, R.X.; You, S.J.; Zhu, X.Y.; Yue, X.W.; Jiang, Z.C. Development status and prospects of hydrogen compressed natural gas transportation technology. Pet. New Energy 2021, 33, 26–32. [Google Scholar]
- Tian, S.; Zhu, Z.; Jiang, J. Research and development status and the latest technological progress of hydrogen fuel gas tur bine research. Energy Esearch Manag. 2021, 41, 10–17. [Google Scholar]
- Li, J.F.; Su, Y.; Zhang, H.; Yu, B. Research progresses on pipeline transportation of hydrogen-blended natural gas. Nat. Gas Ind. 2021, 41, 137–152. [Google Scholar]
- Liao, Q.; Chen, Z. The safety research on blending hydrogen into natural gas pipeline. Urban Gas 2021, 4, 19–26. [Google Scholar]
- Huang, M.; Wu, Y.; Wen, X.; Liu, W.; Guan, Y. Feasibility analysis of hydrogen transport in natural gas pipeline. Gas Heat 2013, 33, 39–42. [Google Scholar]
- Cui, Y.; Liu, X.; Chen, M. Experimental study of natural gas mixed with hydrogen under full pressure of f-class heavy duty gas turbine burner. Gas Turbine Technol. 2021, 34, 38–42. [Google Scholar]
- Chen, J.; Hu, Z.J.; Chen, Y.G.; Chen, J.; Chen, W. Thermoelectric optimization of integrated energy system considering ladder-type carbon trading mechanism and electric hydrogen production. Electr. Power Autom. Equip. 2021, 41, 48–55. [Google Scholar]
- Jiang, C.F.; Ai, X. Integrated energy system operation optimization model considering uncertainty of multi-energy coupling units. Power Syst. Technol. 2019, 43, 10. [Google Scholar]
- Chen, D.; Liu, F.; Liu, S. Optimization of virtual power plant scheduling coupling with P2G-CCS and doped with gas hydrogen based on stepped carbon trading. Power Syst. Technol. 2022, 46, 2042–2054. [Google Scholar]

Disclaimer/Publisher’s Note: The statements, opinions and data contained in all publications are solely those of the individual author(s) and contributor(s) and not of MDPI and/or the editor(s). MDPI and/or the editor(s) disclaim responsibility for any injury to people or property resulting from any ideas, methods, instructions or products referred to in the content. |
© 2024 by the authors. Licensee MDPI, Basel, Switzerland. This article is an open access article distributed under the terms and conditions of the Creative Commons Attribution (CC BY) license (https://creativecommons.org/licenses/by/4.0/).