Article

Contribution to the Net-Zero Emissions Target from the Transport Sector through Electric Mobility—A Case of Kathmandu Valley

by
Salony Rajbhandari
1,
Shubha Laxmi Shrestha
2,*,
Ramchandra Bhandari
3,
Ajay Kumar Jha
4 and
Hari Bahadur Darlami
4
1
National Institute for Environmental Studies, 16-2 Onogawa, Tsukuba 305-8506, Japan
2
Alternative Energy Promotion Centre, Mid Baneshwor, Kathmandu 44600, Nepal
3
Institute for Technology and Resources Management in the Tropics and Subtropics, TH Köln (University of Applied Sciences), Betzdorfer Strasse 2, 50679 Cologne, Germany
4
Institute of Engineering, Pulchowk Campus, Tribhuvan University, Pulchowk, Lalitpur 44600, Nepal
*
Author to whom correspondence should be addressed.
Sustainability 2024, 16(3), 1211; https://doi.org/10.3390/su16031211
Submission received: 12 November 2023 / Revised: 8 January 2024 / Accepted: 12 January 2024 / Published: 31 January 2024

Abstract

:
Globally, the transportation sector stands as the third largest contributor to greenhouse gas (GHG) emissions. Nepal is no exception, relying entirely on imported petroleum products. The capital city of Nepal, Kathmandu Valley, with its unique bowl-shaped topography, faces major urban challenges including inadequate mobility and poor air quality. This paper aims to investigate the magnitude of GHG emissions from conventional vehicles within Kathmandu Valley and analyze the counter-role of electric mobility in creating a more livable city. This study conducted a primary survey to estimate transport energy consumption and mobility characteristics for the base year 2022. The Low Emission Analysis Platform (LEAP) served as the modeling tool to forecast energy consumption and quantify associated GHG emissions in three scenarios: business-as-usual (BAU), sustainable development (SD), and net-zero emission (NZE). Additionally, this study estimated co-benefits, focusing on local pollutant reductions. With the present trend of increasing urbanization, motorization, and development, GHG emissions from the transportation sector are projected to more than triple by 2050 in the BAU scenario. Widespread adoption of electric mobility in the SD scenario would achieve up to a 95% reduction in GHG emissions by 2050. The NZE scenario foresees complete electrification and hydrogen-based vehicles by 2045, achieving complete abatement of both GHG emissions and local pollutants. The SD and NZE scenarios will require, respectively, 64% and 84% less energy than the BAU scenario, along with 74% and 100% reductions in petroleum consumption by 2050. These reductions contribute to enhanced energy security and energy sustainability. Achieving the SD and NZE scenarios will require approximately 1048 GWh and 1390 GWh of additional electricity solely for Kathmandu Valley by 2050. This paper is expected to provide valuable insights for policy implementors, transport planners, and city administrators to develop effective action plans and policies aimed at improving pollution levels and making cities in developing countries more livable and sustainable.

1. Introduction

Greenhouse gases (GHGs) are responsible for global warming on earth. Human-induced activities, primarily fossil fuel burning, increase heat-trapping GHG levels in the earth’s atmosphere and are the dominant cause of the global warming observed since the mid-20th century [1]. Energy is a vital commodity for economic development and a key factor in anthropogenic GHG emissions. Globally, the transport sector is a major contributor to GHG emissions, and this contribution is likely to grow in the future with the rising trend of urbanization and motorization, most particularly in the case of developing economies. Out of 36.80 gigatonnes (Gt) of global energy-related carbon dioxide (CO2) emissions, 7.98 Gt was produced by the transport sector alone, making it the third largest contributor in 2022 [2]. Emissions from this sector have almost tripled due to growing populations and economies since 1970 [3].
Nepal is among the ten least urbanized countries in the world; however, it is among the top ten countries with the highest rates of urbanization [4]. Kathmandu Valley, the capital, and the largest city in the country, is one of the fastest-growing metropolitan areas in the South Asian region [5]. The valley is experiencing rapid and haphazard urbanization with an increasing demand for motorized travel, causing a rise in CO2 emissions, poor urban air quality, and higher concentrations of particulate matter well above the World Health Organization (WHO) guidelines. Figure 1 shows the administrative map of Kathmandu Valley, which consists of three districts, namely, Kathmandu, Bhaktapur, and Lalitpur. It holds 10.4% of the country’s total population and occupies 0.5% of the total area of the country [6].
The unique bowl-shaped topography traps pollutants inside the valley, which is home to more than 3 million people, for longer periods, making them prone to adverse health effects that not only diminish the quality of life but also threaten the prosperity of the urban economy [6,7]. According to WHO, air pollution kills an estimated seven million people worldwide every year, and every nine in ten people breathe air containing high levels of harmful particles [8]. The air pollution levels in Nepal are 4.9 times higher than those recommended by the WHO. Such pollution has been consistently found to be the leading risk factor for death and disability in Nepal [9].
Figure 1. Administrative map of Kathmandu Valley [10].
Sustainability 16 01211 g001
Transportation is a crucial sector, ranking third in terms of energy consumption and contributing a share of 30% to the total energy-related GHG emissions in Nepal [11,12]. The country relies heavily on imported petroleum products to energize its transportation sector. As of 2022, a significant portion, specifically, over 57% of the total imported petroleum fuel, is consumed within the transportation sector in the country [11]. This dependence on fossil fuels has been growing over the years, thereby triggering emissions mainly from the road transportation sector in Nepal, which is the major mode of mobility in the valley. In addition to the rapidly rising GHG emissions, the complete dependency on imported energy makes the country highly vulnerable to fluctuating international market prices. The high import cost of petroleum products has consistently created an economic burden for Nepal. In the fiscal year (FY) 2022/2023, about EUR 2.1 billion was spent on imported petroleum products [13]. This occupied a major share of 19.2% among the top 20 commodities imported to Nepal and equated to a 76% increase compared with the imported commodities in the FY 2020/2021 [13].
Despite being in the early stages of motorization, Nepal has witnessed remarkable vehicular growth, with the number of registered vehicles increasing by 14.6% from 1997 to 2021 and exceeding 17% growth from 2015 to 2021 [14,15,16]. Two-wheelers have shown particularly high growth, accounting for a 16% increase during the 1997–2021 period [14,15,16]. Notably, Bagmati province alone holds a major share (approximately 45%) of all registered vehicles in Nepal, with the majority operating on the roads of Kathmandu Valley [17]. This trend is expected to continue due to factors like expanding road infrastructure, urbanization, and economic progress.
Fortunately, Nepal possesses abundant hydropower resources, offering immense potential for renewable energy generation to support electric vehicle (EV) growth. Recognizing this potential, the Government of Nepal (GoN) has committed to increasing the share of EVs through various policies, including the Second Nationally Determined Contribution (NDC), the Long-term Strategy for Net-zero Emissions, the 15th Periodic Plan, National Transport Policy, and the Environment-Friendly Vehicle and Transport Policy [18,19,20,21,22]. Additionally, the GoN has implemented numerous incentives to promote EVs, such as tax exemptions, preferential registration, and reduced customs duties and excise taxes [23]. Domestic manufacturers of EVs can enjoy a five-year tax holiday accompanied by a substantial 40% reduction in trade tax. Additionally, there is a noteworthy 75% customs duty tax relaxation to import spare parts essential for EVs. Also, GoN has a promotional policy to convert Internal Combustion Engine (ICE) vehicles to EVs. While doing so, it charges only a 1% customs duty to import the needful conversion kit [23]. These policies have made EVs more affordable and accessible for consumers over the years. As a result, there has been a gradual shift toward electric mobility in Nepal, with increasing adoption of electric two-wheelers, buses, and cars [24].
Several fiscal and non-fiscal policies have been put forward to facilitate the adoption of clean mobility in Asia. India has launched a flagship scheme designed to incentivize and promote electric mobility and hydrogen fuel cell vehicles. With a focus on boosting the electrification of public and shared transportation, this flagship initiative aspires to facilitate the adoption of over 1.6 million electric vehicles through strategic subsidies [25,26,27]. India’s state-level policies include financial incentives, waiving road tax and registration fees, establishing a wide network of charging stations and swappable battery stations, setting up of recycling ecosystem for batteries, levying additional taxes and fees on inefficient or polluting vehicles, etc. [28]. Maharashtra State, India, has implemented policies to accelerate the adoption of battery-operated EVs (BEVs) so that they contribute to 10% of new vehicle registrations by 2025 [29]. India is aspiring to establish Delhi as the EV capital of the country by accelerating the pace of EV adoption across vehicle segments, aiming for BEVs to contribute 25% of all new vehicle registrations by 2024 [28].
Bangladesh has proposed a 10-year tax holiday for local EV assembling and manufacturing, along with the establishment of an energy-efficient vehicle manufacturing fund to deposit fines and taxes collected from environment-polluting vehicles. This initiative aims to meet the country’s targets of transforming the majority of passenger cars and public vehicles (mainly buses, trucks, and three-wheelers) to EVs by 2030 [30,31].
Similarly, China, a global leader in EV adoption with a 47% share of the global EV market, has actively supported EV adoption [32]. The impetus behind this push is the urgency to mitigate GHG emissions within the transportation sector, starting with initiatives in some of the most heavily polluted cities such as Beijing, Shanghai, and Shenzhen. A range of monetary incentives such as financial subsidies and tax exemptions for fuel-saving capacity, mileage per charge performance, new vehicle purchase, and exemption/reduction of annual vehicle tax were implemented in China. Non-monetary incentives such as traffic control exemptions, research and development support, license plate/registration privileges, parking fee incentives, and road access privileges with the city’s traffic control during peak hours were exercised [33]. Notably, China also mandated new vehicle manufacturers to include EVs in their production alongside petroleum vehicles [34].
Within the existing literature, limited studies have specifically focused on the energy and emissions from the transportation sector policy perspective within the valley [35,36,37]. Given the substantial contribution of the transportation sector to the country’s overall GHG emissions, a comprehensive study analyzing the energy and environmental implications in the Kathmandu Valley was conducted in 2010 [38]. Few other studies explored the impacts of low-carbon development strategies on energy consumption and GHG emission mitigation within Nepal’s transportation sector [39,40]. There was also a study that focused on assessing the energy and environmental benefits of electrifying the transport sector in Nepal [41]. Furthermore, some studies have even focused on formulating strategies to attain net-zero emissions, aligning with the targets of the Paris Agreement, specifically targeting the context of Nepal [42,43].
A comprehensive analysis that specifically addresses the present and future energy and emissions scenario in the transport sector, following the promulgation of the Sustainable Development Goals (SDGs) and the Long-term Strategy (LTS) for Net-zero Emissions policies, is yet to be conducted from a perspective of the local city level. Several research questions need to be addressed in this respect: In what ways can the adoption of SDGs and the implementation of LTS policies contribute to mitigating GHG emissions in the valley? What level of capacity expansion in hydroelectricity generation would be necessary to align with the envisioned target? What are the co-benefits associated with mitigating GHG emissions, specifically in terms of reducing local air pollutants? What are the key challenges and opportunities involved in the implementation of EVs? How can the results of this study inform and guide policy implementers in developing and implementing clean and efficient transport policies in the valley?
Given the prevailing trend in ICE vehicle usage, the GoN is aspiring to facilitate a potential transition to electric vehicles, aligning with a net-zero emission (NZE) target by 2045 [12]. This strategic initiative is designed to ensure the timely achievement of SDGs. A study in China shows the existence of a significant correlation between GHG and local pollutant emissions in terms of spatial and temporal aspects [44]. Similarly, a study conducted in Bangkok, the capital city of Thailand, which suffers from severe ambient particulate matter (PM) pollution, underscores the potential for robust policies promoting zero-carbon transport. The study also indicates that such policies can constitute a sustainable investment, yielding significant economic impacts of policy implementation that far surpass the associated expenditures. This perspective is especially evident from the viewpoint of public health at the local level, with substantial benefits in terms of emission reduction and climate change mitigation [45].
This paper addresses critical questions that remain unanswered: How can the valley, which serves as Nepal’s central hub for cultural and economic activities, expedite its journey toward net-zero emissions? This analysis is undertaken in the context of policy implementation related to SDGs and LTS, coupled with the development of electric mobility infrastructure. To achieve this, this study quantifies the GHG emissions of the valley over the period of 2022 to 2050, considering a business-as-usual (BAU) scenario and two GHG mitigation scenarios. Further, the co-benefits of GHG emission mitigation, specifically in terms of reducing local air pollutants, with a focus on the counter role of electric mobility are analyzed. The findings aim to provide valuable insights for policy implementers, transport planners, and metro-city administrators, assisting in accelerating the implementation of clean and efficient transportation initiatives.
This paper is divided into five sections. Section 2 provides the methodological overview, detailing the data and assumptions used, along with comprehensive details of the scenario formulation. Section 3 presents the results pertaining to the transportation situation of the valley derived from a primary-level survey. This section further discusses the modeling output of results examining GHG emissions and the counter-role of electric mobility within the projected scenarios. Section 4 discusses the challenges and opportunities surrounding the promotion of electric mobility in the valley, drawing insights from consultations with various stakeholders and reports. The last section outlines the key findings and concludes this paper.

2. Materials and Methods

This study considered the Low Emission Analysis Platform (LEAP) as a tool for forecasting energy consumption and quantifying GHG emissions, as well as selected local pollutants. Both primary and secondary datasets were used for the analysis. The primary data collection involved a structured survey. The survey gathered information on energy consumption, mobility characteristics, socioeconomic information of vehicle users, details of transportation registration, and technical parameters such as mileage, distance covered per day, fuel consumed per day, and load carried. The survey also provided information on barriers and obstacles to a widespread shift toward EVs as well as the preferred mode of EVs. The surveyed respondents included professionals from EV companies, vehicle users, and national experts/policymakers. The collection and analysis of the base year primary dataset served as an important contribution to understanding the existing context and provided knowledge extension for future analyses.
The secondary data for this study were collected with extensive reviews of the literature. The collected data included information on demographics, national and provincial energy consumption, emission factors, and plans and policies related to the transport sector. In addition to the structured surveys, broader consultations with stakeholders were conducted at the Alternative Energy Promotion Centre (AEPC), Kathmandu, in April 2023. Participants in the consultations involved representatives from the National Planning Commission, various ministries, government institutions related to trading/supply/generation of energy, trading/manufacturing of electric vehicles, academia/research institutes, development partners, practitioners, and journalists. The consultation assisted in validating and obtaining further inputs for this study.
The overall methodological framework of this study is presented in Figure 2.

2.1. Sample Size Determination for the Baseline Survey

Sampling is the method used to identify the number of samples and sample units from a population, utilizing statistical methods to ensure that the selected samples possess the characteristics of the entire population. In this study, sampling was conducted to identify the sample size and sample units within the existing transportation sector. The existing number of vehicles in operation is considered as the population, and each individual vehicle serves as a sample unit. Equation (1), based on [46], was used to estimate the sample size:
n = χ 2 × N × p × q / e 2 N 1 + χ 2 × p × q
where
n = required sample size;
χ2 = χ square for specific confidence level of 95% (assumed to be 3.841);
p = probability of success (assumed to be 0.5);
q = 1 − p = probability of no success (assumed to be 0.5);
e = margin of error;
N = population size;
nr = total non-response rate = 5%.
Hence, the total sample size = n + 5% of nr.

2.2. Data and Assumptions

The population of the valley in the base year 2022 was obtained from the Central Bureau of Statistics (CBS) of Nepal [6,47]. As Nepal undertakes population census updates on a decade-long interval, the most recent available population data were from 2011. Due to the COVID pandemic, the scheduled 2021 census survey faced delays and was eventually published in November 2023. However, the population estimates considered in this study were validated thoroughly. Projected population growth for the valley is based on the national estimates projected by the CBS [48] and the United Nations World Population Prospects [49], as detailed in Table 1. According to these projections, the population of the valley is estimated to reach 4.2 million by 2050.
The estimation of the gross domestic product (GDP) and the transport gross value added (GVA) of the valley in 2022 involved the use of proportions of the valley’s GDP with respect to the national GDP, as mentioned in the National Human Development Report [50,51]. Due to a lack of annual updates of the GDP and GVA for the transport sector at the city level, this study used an indirect approach based on the National Human Development Report 2014 [50]. The National Human Development Report published in 2020 was also reviewed, but it lacked updated GDP data at the city level [51].
The future estimated growth rates of transport GVA is presented in Table 1. These growth rates are considered based on various national studies, including the Long-term Strategy for Net-zero Emissions [12], the Sustainable Development Goals [52], the 15th Periodic Plan [20], and the Energy Sector Vision 2050 [53]. The LTS and SDGs assume a GDP growth rate of 7% per annum; the 15th Periodic Plan assumes an average of 9.6%; and the Energy Sector Vision assumes 4.4%, 5.6%, and 6.5% in low, medium, and high economic growth scenarios, respectively. The electricity demand forecast analysis considers a GDP growth rate of 4.5% in low, 7.2% in medium, and 9.2% in high growth scenarios [54]. Based on these considerations, this study used a medium economic growth rate, as presented in Table 1.
Carbon dioxide (CO2), methane (CH4), and nitrous oxide (N2O) were considered GHG emissions in this study. Additionally, to estimate the co-benefits associated with GHG mitigation, only selective air pollutants, namely, carbon monoxide (CO), non-methane volatile organic compounds (NMVOC), nitrogen oxide (NOX), particulate matter-2.5 (PM2.5), black carbon (BC), and organic carbon (OC) emissions, were analyzed. The emission factors considered in this analysis are based on the guidelines outlined in the Intergovernmental Panel on Climate Change (IPCC) 2006 [55] and the Atmospheric Brown Clouds Emission Inventory manual [56].
The estimation of the electric vehicle counts primarily focused on road passenger vehicles. Vehicles categorized as “Crane/Dozer/Roller/Excavator/Loader”, used for construction purposes, were not considered in the estimation of either energy consumption or emissions. The reason behind their exclusion stems from the lack of proven electric technologies capable of replacing these heavy-duty vehicles. Furthermore, their insignificance, both in terms of quantity and usage within the Kathmandu Valley, compared with other common modes of vehicle types, led to their exclusion in the present analysis. Moreover, the rapid decline in the registration rate of vehicles used for agricultural purposes, such as tractors and power tillers, within Bagmati Province, with their numbers diminishing to zero in recent years, further supports their exclusion from this analysis [15].
The primary focus of this study is to analyze the counter role of electric mobility in mitigating GHG emissions, with a specific emphasis on replacing ICE vehicles in the valley. The analysis is focused on tailpipe emissions and does not consider life-cycle assessments, including cradle-to-grave analysis.

2.3. Service Demand Projections

The transport sector GVA and population are the fundamental basis for the estimation of energy service demand projections. In addition to these, numerous other socio-economic factors influence the demand for transport sector services. To comprehensively address these dynamics, this study considered an econometric approach for service demand projections, which is a methodology that has been used in other studies [38,57]. The end-use energy service demand, expressed in terms of passenger-kilometer (passenger-km) for passenger vehicles, was estimated using Equation (2):
S D n = S D 0 × ( G V A n G V A 0 ) α × ( P O P n P O P 0 ) β
where
SDn: energy service demand for passenger transport in year n;
SD0: energy service demand for passenger transport in the base year;
GVAn: gross value added for the transport sector in year n;
GVA0: gross value added for the transport sector in the base year;
POPn: population of Kathmandu Valley in year n;
POP0: population of Kathmandu Valley in the base year;
α: value-added elasticity;
β: elasticity for population.
As GDP is one of the key drivers for changes in freight transport demand, this study used the value added for the transport sector as the basis for projecting energy service demand within this sub-sector. It is important to highlight that the service demand projections for the freight transport sector were also derived using Equation (2). However, it should be noted that the population factor is not taken into consideration for this specific sub-sector. In Equation (2), the assumed elasticity for GVA is 0.6 for freight transport, 0.41 for passenger transport, and a population elasticity of 1.44 for passenger vehicles [38]. The projections for passenger-km and tonne-km are presented in Table 2.

2.4. Overview of the LEAP Modeling Framework

The LEAP modeling framework, originally developed in the early 1990s by the Stockholm Environment Institute (SEI) and the International Institute for Applied Systems Analysis (IIASA), is a highly flexible bottom-up energy–economic–environmental modeling tool specifically designed for energy policy analysis and climate change mitigation assessment. LEAP is an integrated, scenario-driven modeling tool, which is proficient in tracking energy consumption, production, and resource extraction across all sectors of an economy. The model excels in determining GHG emissions from both energy and non-energy sectors. In addition, the model can also analyze emissions related to local and regional air pollutants [58].
LEAP software is widely used across countries for undertaking integrated resource planning, GHG mitigation assessments, and the formulation of Low Emission Development Strategies (LEDSs). Many countries, including Nepal, have considered the LEAP modeling framework to formulate emission commitments to report to the United Nations Framework Convention on Climate Change (UNFCCC) [58]. This model has been widely used at various scales, ranging from cities and states to national, regional, and even global contexts, particularly in the realm of transport sector research [59,60,61,62,63,64,65,66,67,68,69,70].
The analytical results presented in this study are generated with the integration of service demand projections, technical parameters, and environmental factors, alongside the scenario characteristics detailed in Section 2.5, into the LEAP framework. This study uses LEAP Version 2020.1.106 for the analysis.

2.5. Scenario Development

Three scenarios, namely, (i) business-as-usual, (ii) sustainable development, and (iii) net-zero emissions, were developed to evaluate energy growth and emissions in alignment with the GoN’s target for SDGs and LTS policies. Each of these scenarios is described in brief as follows.

2.5.1. Business-as-Usual Scenario

The business-as-usual (BAU) scenario represents the continuation of the existing trend in transport sector energy consumption and vehicle utilization until 2050. This scenario maintains the historical patterns of technology and fuel use within the valley. However, this scenario does not account for the potential impacts of climate policy interventions and a mass shift toward electric vehicles.

2.5.2. Sustainable Development Scenario

The sustainable development (SD) scenario was formulated in alignment with the targets of the second NDC and the SDGs of Nepal. The use of electric vehicles are assumed to be limited to passenger vehicles within this scenario. Based on the targets of the second NDC, the share of electric vehicles is estimated to reach 99.3% of the total passenger vehicles by 2050. As such, the following vehicular shares were considered in this scenario:
  • Sales of private passenger electric vehicles (including two-wheelers) were assumed to be 25% of the total sales in 2025 and 90% of the total sales in 2030.
  • Sales of public passenger electric vehicles (excluding e-rickshaws and electric three-wheelers) were assumed to be 20% of the total sales in 2025 and 60% of the total sales in 2030.
  • No change in the energy consumption pattern of freight vehicles was considered.

2.5.3. Net-Zero Emissions Scenario

The net-zero emissions (NZE) scenario considers the targets set forth in the Long-term Strategy for Net-zero Emissions submitted to the UNFCCC. In this scenario, the road transport sector is envisioned to achieve zero emissions with complete electrification and the adoption of hydrogen-fueled vehicles, contributing to the attainment of net-zero emissions targets. Based on this, the following major considerations were taken into account in this scenario:
  • Full electrification of passenger vehicles by 2045.
  • Complete transition of freight vehicles to green hydrogen-fueled vehicles by 2045.

3. Results

The results section is divided into two sub-sections. The first sub-section provides the analytical findings obtained from the primary baseline survey, offering insights into the energy status and characteristics of the transport sector in the base year. The second sub-section presents a comparative analysis among three different scenarios in terms of the future trajectory of the transport sector energy consumption, GHG emissions, and associated co-benefits for the period spanning 2022 to 2050 generated using the LEAP model.

3.1. The Base Year Survey

This section presents an overview of the analytical findings obtained from the baseline survey conducted in 2022.

3.1.1. Vehicular Situation

Nepal is administratively divided into seven provinces, fourteen zones, and seventy-seven districts. The Department of Transport Management in Nepal provides vehicle registration information categorized either by province or zone. In the absence of district-wise vehicle registration information at present, an estimation of the registered vehicles in the valley, consisting of three districts, namely, Kathmandu, Lalitpur, and Bhaktapur, was derived. This estimation is based on both zone-wise and province-wise vehicle registration data from the Bagmati region [15,16] and the total vehicle registration statistics of Nepal [14], as well as the traffic volume and annual average daily traffic specific to the valley [71]. The estimated vehicle registration up to the FY 2021/2022 are presented in Table 3. The number of vehicles in operating condition by vehicle type is estimated as the product of the total registered vehicles and the corresponding operating factors. These operating factors for different vehicles, as shown in Table 3, are referenced from [39].

3.1.2. Sample Size Determination

The overall sample size was determined using Equation (2), considering a population size of 816,225 at a 95% confidence interval, a probability of success of 0.5, a 5% margin of error, and a non-response rate of 5%. The overall sample size was thus calculated to be 403. This calculated sample size was further disaggregated into different vehicle types. To collect the necessary data, interviews were conducted with the respective vehicle owners. For better consistency, a minimum of three (“3”) vehicles within each category was considered. The detailed breakdown of the sample size for different vehicle types considered for data collection is outlined in Table 4.
Samples were collected from some of the major bus terminals in the valley. As illustrated in Table 4, certain sample sizes were adjusted, and, where necessary, even increased to capture data from different types within each vehicle category. Comparatively, the total number of two-wheelers in the overall vehicle registration significantly surpasses that of other vehicle types in Nepal, resulting in a relatively higher total sample size for two-wheelers compared with the other vehicle types.

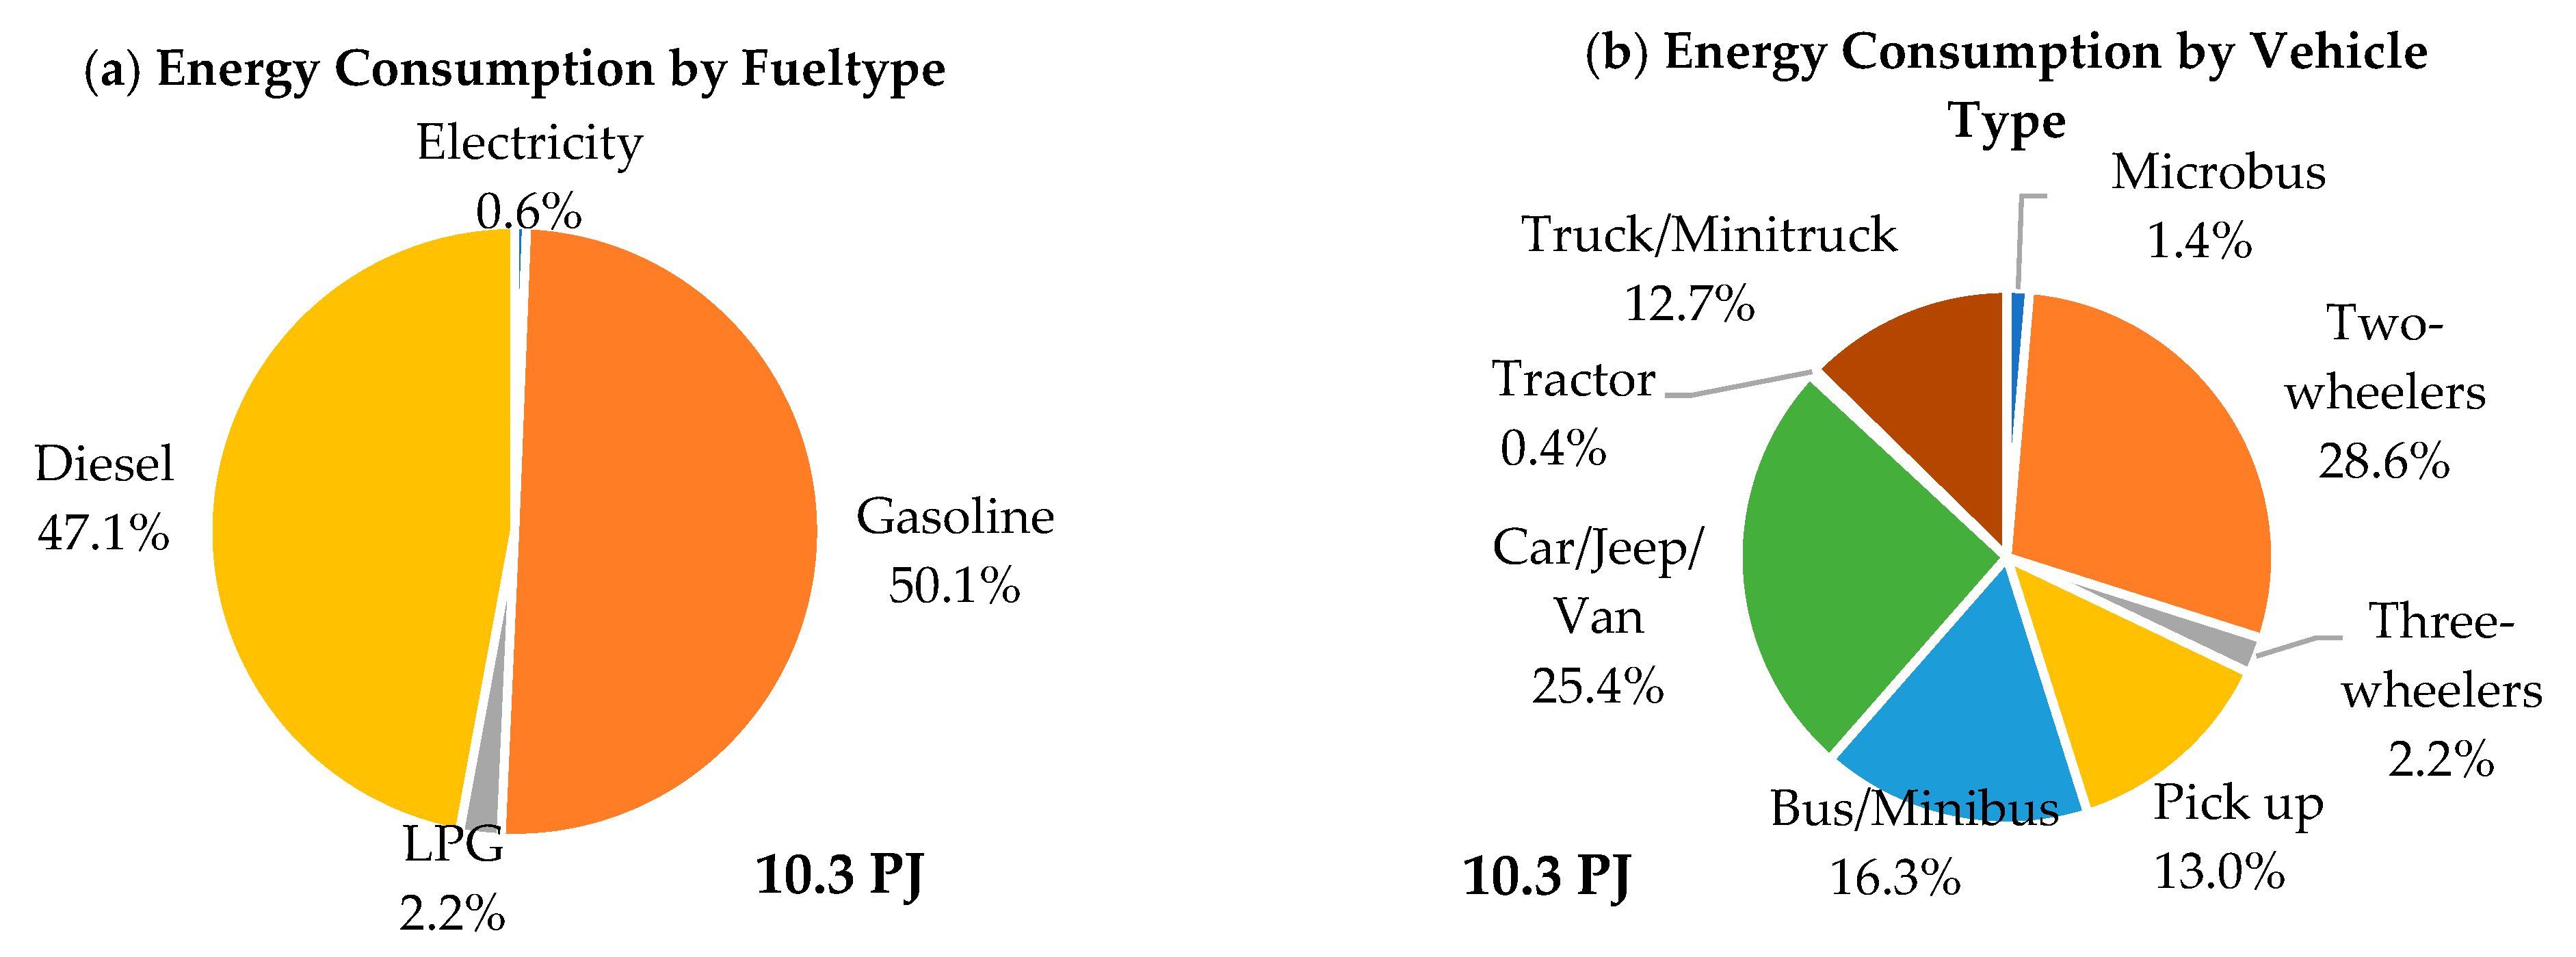
3.1.3. Status of Transport Sector Energy Consumption in 2022

According to the survey findings, the total energy consumption related to the transport sector in the valley is estimated to be 10.3 Petajoule (PJ), which is more than 15% of the national total transport sector energy consumption [11]. Figure 3a shows the overall energy consumption by fuel type, and Figure 3b provides a breakdown by vehicle types for 2022. Gasoline and diesel are the dominant sources of energy for road transportation, collectively making up approximately 97.2% of the share. Comparatively, liquified petroleum gas (LPG) and electricity contribute 2.2% and 0.6%, respectively. Two-wheelers and cars/jeeps/vans collectively occupy more than 50% of the total share in the total transport sector’s energy mix.
In the FY 2021/2022, Bagmati Province accounted for approximately 25% of the total sales of petroleum products, including gasoline, diesel, kerosene, jet fuel, and LPG [17,72]. Within Bagmati Province, the valley alone consumed about 33% of the entire petroleum sales.

3.1.4. Characteristics of Transport Mobility in the Valley

Figure 4a–d presents various parameters of the transport sector categorized by vehicle types for the passenger mode of transportation. The survey results show the highest average occupancy for buses and minibuses (32.3), followed by microbuses (11.2) and other vehicle types. In terms of passenger-km, buses have the highest share (45%), followed by microbuses, indicating a preference for public transport. The energy intensity per passenger-km is highest for three-wheelers at 0.93 megajoule (MJ), while microbuses exhibit the lowest energy intensity. The cause behind the lower energy intensity per passenger-km of microbuses compared with buses/minibuses may be attributed to the presence of old existing buses in the latter category. Additionally, the narrow roads and better performance in intercity traffic congestion make microbuses more efficient than buses.
Similarly, Figure 5a–d demonstrates a comparative analysis of various parameters pertaining to different freight vehicles. The results indicate that the average load carrying capacity is highest for trucks/minitrucks and lowest for tractors. In terms of energy intensity per tonne-km, pickups emerge as the most efficient option. However, in terms of energy intensity per tonne of load carried, trucks/minitrucks exhibit the lowest values. More than 50% of the road freight transport share is dominated by trucks and minitrucks. Trucks and minitrucks are found to be the most fuel-efficient means of transporting goods over long distances.

3.2. Comparative Analysis of Energy and Emissions from the Transportation Sector in the Valley

This section presents a comparative analysis of three scenarios, the BAU and two GHG mitigation scenarios with respect to energy consumption, GHG emissions, and co-benefits obtained from the LEAP modeling analysis specific to the transport sector. Additionally, the comparative analysis of electricity demand and generation requirements in the SD and the NZE scenarios are also discussed. Further, this section also addresses the imperative of hydrogen production in the NZE scenario.

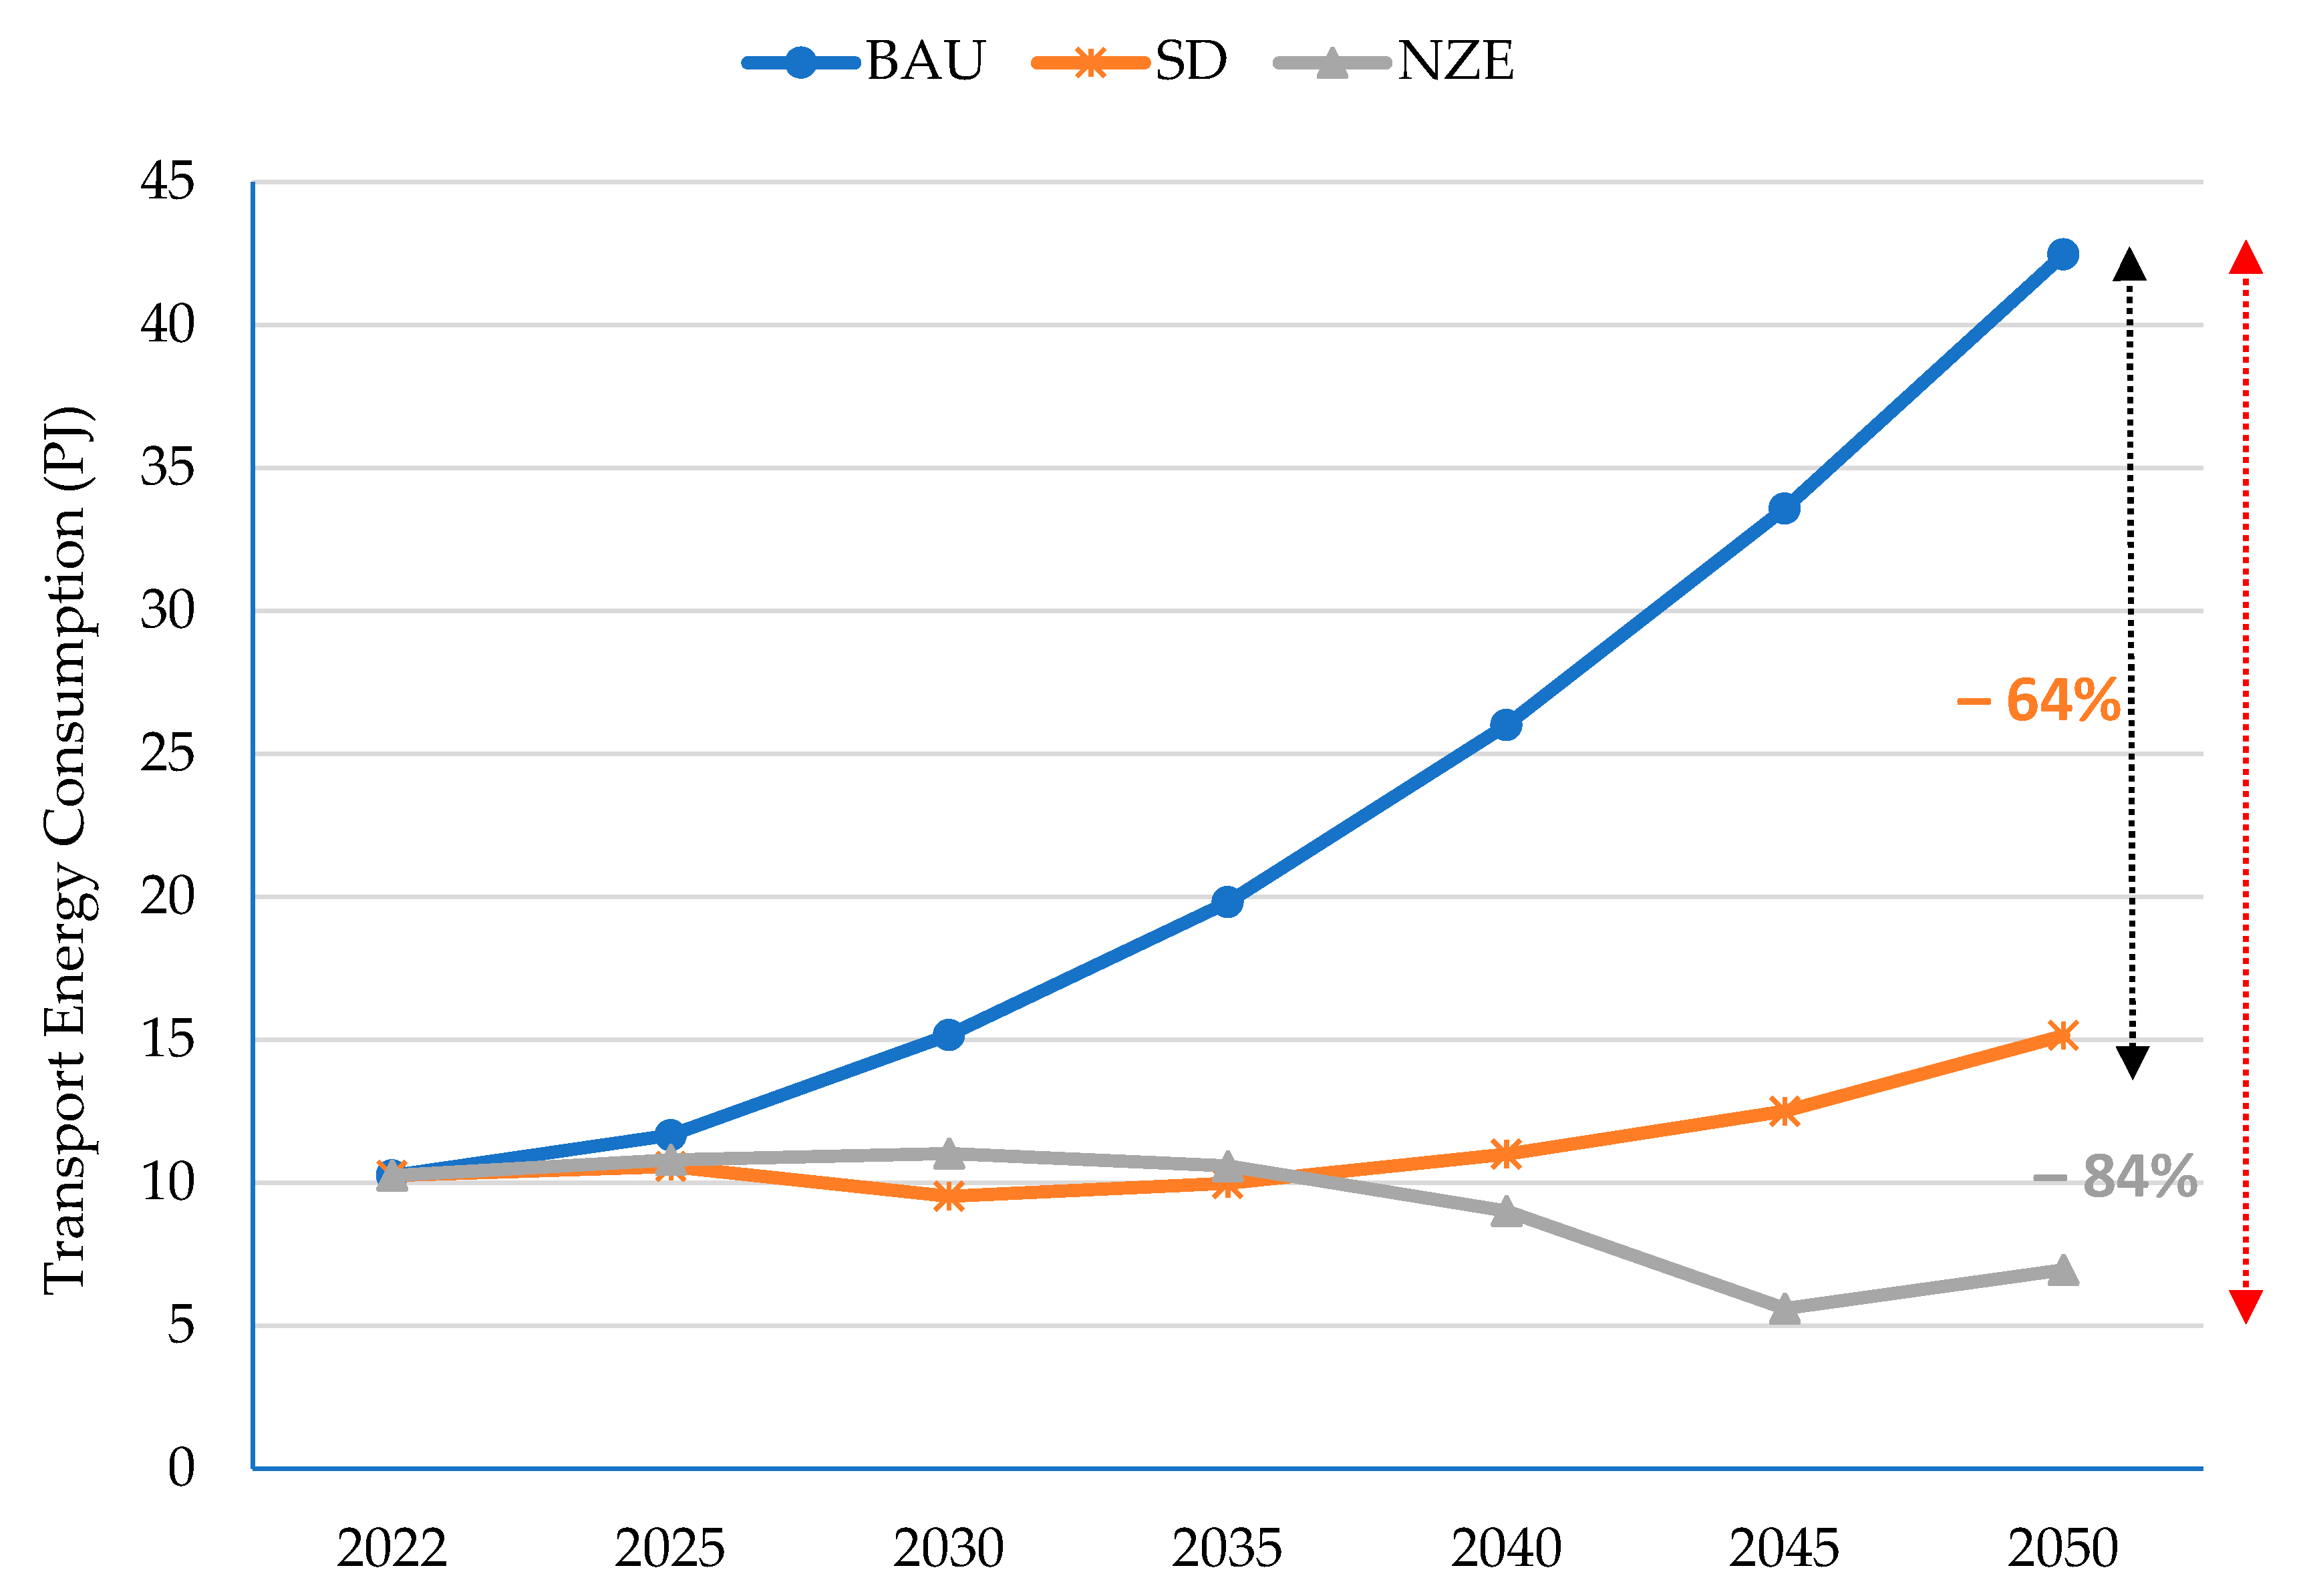
3.2.1. Energy Consumption

The transport energy consumption across the three different scenarios is graphically presented in Figure 6. Incorporating the given transport sector characteristics as outlined in Section 3.1.4 within the LEAP framework, the BAU scenario forecasts a continuous rise in energy consumption, rising at a compound annual growth rate (CAGR) of 5.2% from 2022 to 2050. In contrast, the SD scenario projects a comparatively lower CAGR of 1.4%, resulting in a 64% reduction in energy needs by 2050 compared with the BAU scenario. This reduction is attributed to the introduction of energy-efficient electric passenger vehicles replacing conventional ICE vehicles. In the NZE scenario, a fully electrified along with a hydrogen fuel-based transport system is envisaged, leading to an energy consumption with a negative CAGR of 1.4%. This translates into an 84% decrease in energy needs by 2050 when compared with the BAU scenario. Despite population and vehicular growth, the negative CAGR is mainly attributed to the adoption of highly efficient transportation modes compared with existing ICE vehicles. This will greatly contribute to enhancing energy security and energy sustainability, particularly in the context of a developing country like Nepal, whose economy struggles with import dependence. This information serves as a compelling motivation for policy implementers and city developers to implement efficient modes of transportation, mainly electric and hydrogen-based vehicles. The envisioned energy needs are expected to be fulfilled with indigenous hydroelectricity, further contributing to reducing dependence on external energy sources.
In the NZE scenario, a sudden fall in the graph is observed around 2045 due to the complete electrification of the transport sector and the adoption of green hydrogen vehicles. However, post-2045, a small increment in energy consumption is observed. This incremental growth is due to the sustained growth of electric and hydrogen-based vehicles, as illustrated in Figure 6.

Energy Consumption by Fuel Type

The trend in the transport sector energy consumption by fuel type is demonstrated in Figure 7a–d. The consumption of gasoline undergoes an increase of more than five-fold from 2022 to 2050, while the consumption of diesel almost triples during the same period in the BAU scenario, raising a very alarming signal for the national economy. The consumption of electricity in the transportation sector exhibits a CAGR of 9% from 2022 to 2050 in the BAU scenario. This heightened demand is expected to be met with surplus indigenous hydroelectricity.
By 2050, electricity consumption equates to a significant increase in both the SD and NZE scenarios compared with the BAU scenario. The consumption of electrical energy invariably increases at a CAGR of 16% in the SD scenario and 17% in the NZE scenario over the period from 2022 to 2050. In the NZE scenario, the electricity consumption is anticipated to be 1.3 times higher than that in the SD scenario by 2050. This calls for adequate readiness and strengthening of the electricity infrastructure within the valley.
In the SD scenario, a remarkable shift is anticipated in the consumption of petroleum fuels. Gasoline consumption is expected to witness a substantial decline of 99%, while diesel consumption is expected to experience a modest fall by only 25% in the SD scenario in 2050 when compared with the BAU scenario. The absence of electrification options in road freight transportation accounts for the continuous increase in diesel consumption in the SD scenario, though at a lower CAGR of 2.8% from 2022 to 2050. Here, the substantial declining trend in gasoline provides compelling evidence supporting the potential funds saved with a strategic shift in resource allocation. This redirection aligns with the development of electricity infrastructure, thereby truly driving toward sustainable development objectives.
Furthermore, the increased electrification of the transportation sector and the penetration of green hydrogen fuel freight vehicles, starting from 2030, are poised to completely substitute both gasoline and diesel consumption in the NZE scenario from 2045 onward, providing a promising scenario for the national economy. With this shift in the consumption pattern, the energy mix in the transportation sector is projected to consist of 81.6% electricity and 18.4% hydrogen by 2050 in the NZE scenario. The requirement for green hydrogen fuel is expected to undergo significant growth, increasing by more than tenfold from 2030 to 2050 (Figure 7d). This underscores the urgent need for comprehensive preparation and fortification of national hydrogen infrastructure facilities. However, decarbonizing the transportation sector of the valley by 2045 with the adoption of an electricity and hydrogen technology mix poses a highly challenging task for a developing country like Nepal.

Energy Consumption by Vehicle Type

The energy consumption by vehicle types in both the BAU and alternative scenarios from 2022 to 2050 is presented in Figure 8. In the BAU scenario, two-wheelers remain the predominant energy consumer throughout the study period.
In the SD scenario, pickups are estimated to account for the predominant share of energy consumption in freight transport by 2050. The energy mix within this scenario would have been different if electrification or cleaner fuel alternatives had replaced diesel consumption in road freight transportation. However, the SD scenario witnesses a reduction in energy consumption, primarily from two-wheelers, buses, and microbuses, owing to the escalating electrification targets and the adoption of efficient electric technologies compared with ICEs in road passenger vehicles.
By 2050, cars/jeeps/vans emerge as the highest energy-consuming vehicle in the transport energy mix under the NZE scenario. The complete electrification of passenger vehicles and the transition of conventional fossil-fueled freight vehicles to green hydrogen-fueled alternatives contribute to a rapid decline in energy consumption. There is a notable decline of 6.9 PJ in 2045 and of 8.2 PJ in 2050 when compared with the SD scenario. This equates to a remarkable 54% to 55% reduction in energy consumption in the NZE scenario compared with the SD scenario around the period from 2045 to 2050.
To translate the outcomes of the SD and NZE scenarios into a practical perspective, the adoption of an increasing trend in efficient electric vehicles, along with hydrogen-powered vehicles and the discontinuation of conventional ICE vehicles should be backed up by stable national and municipal fiscal policies.

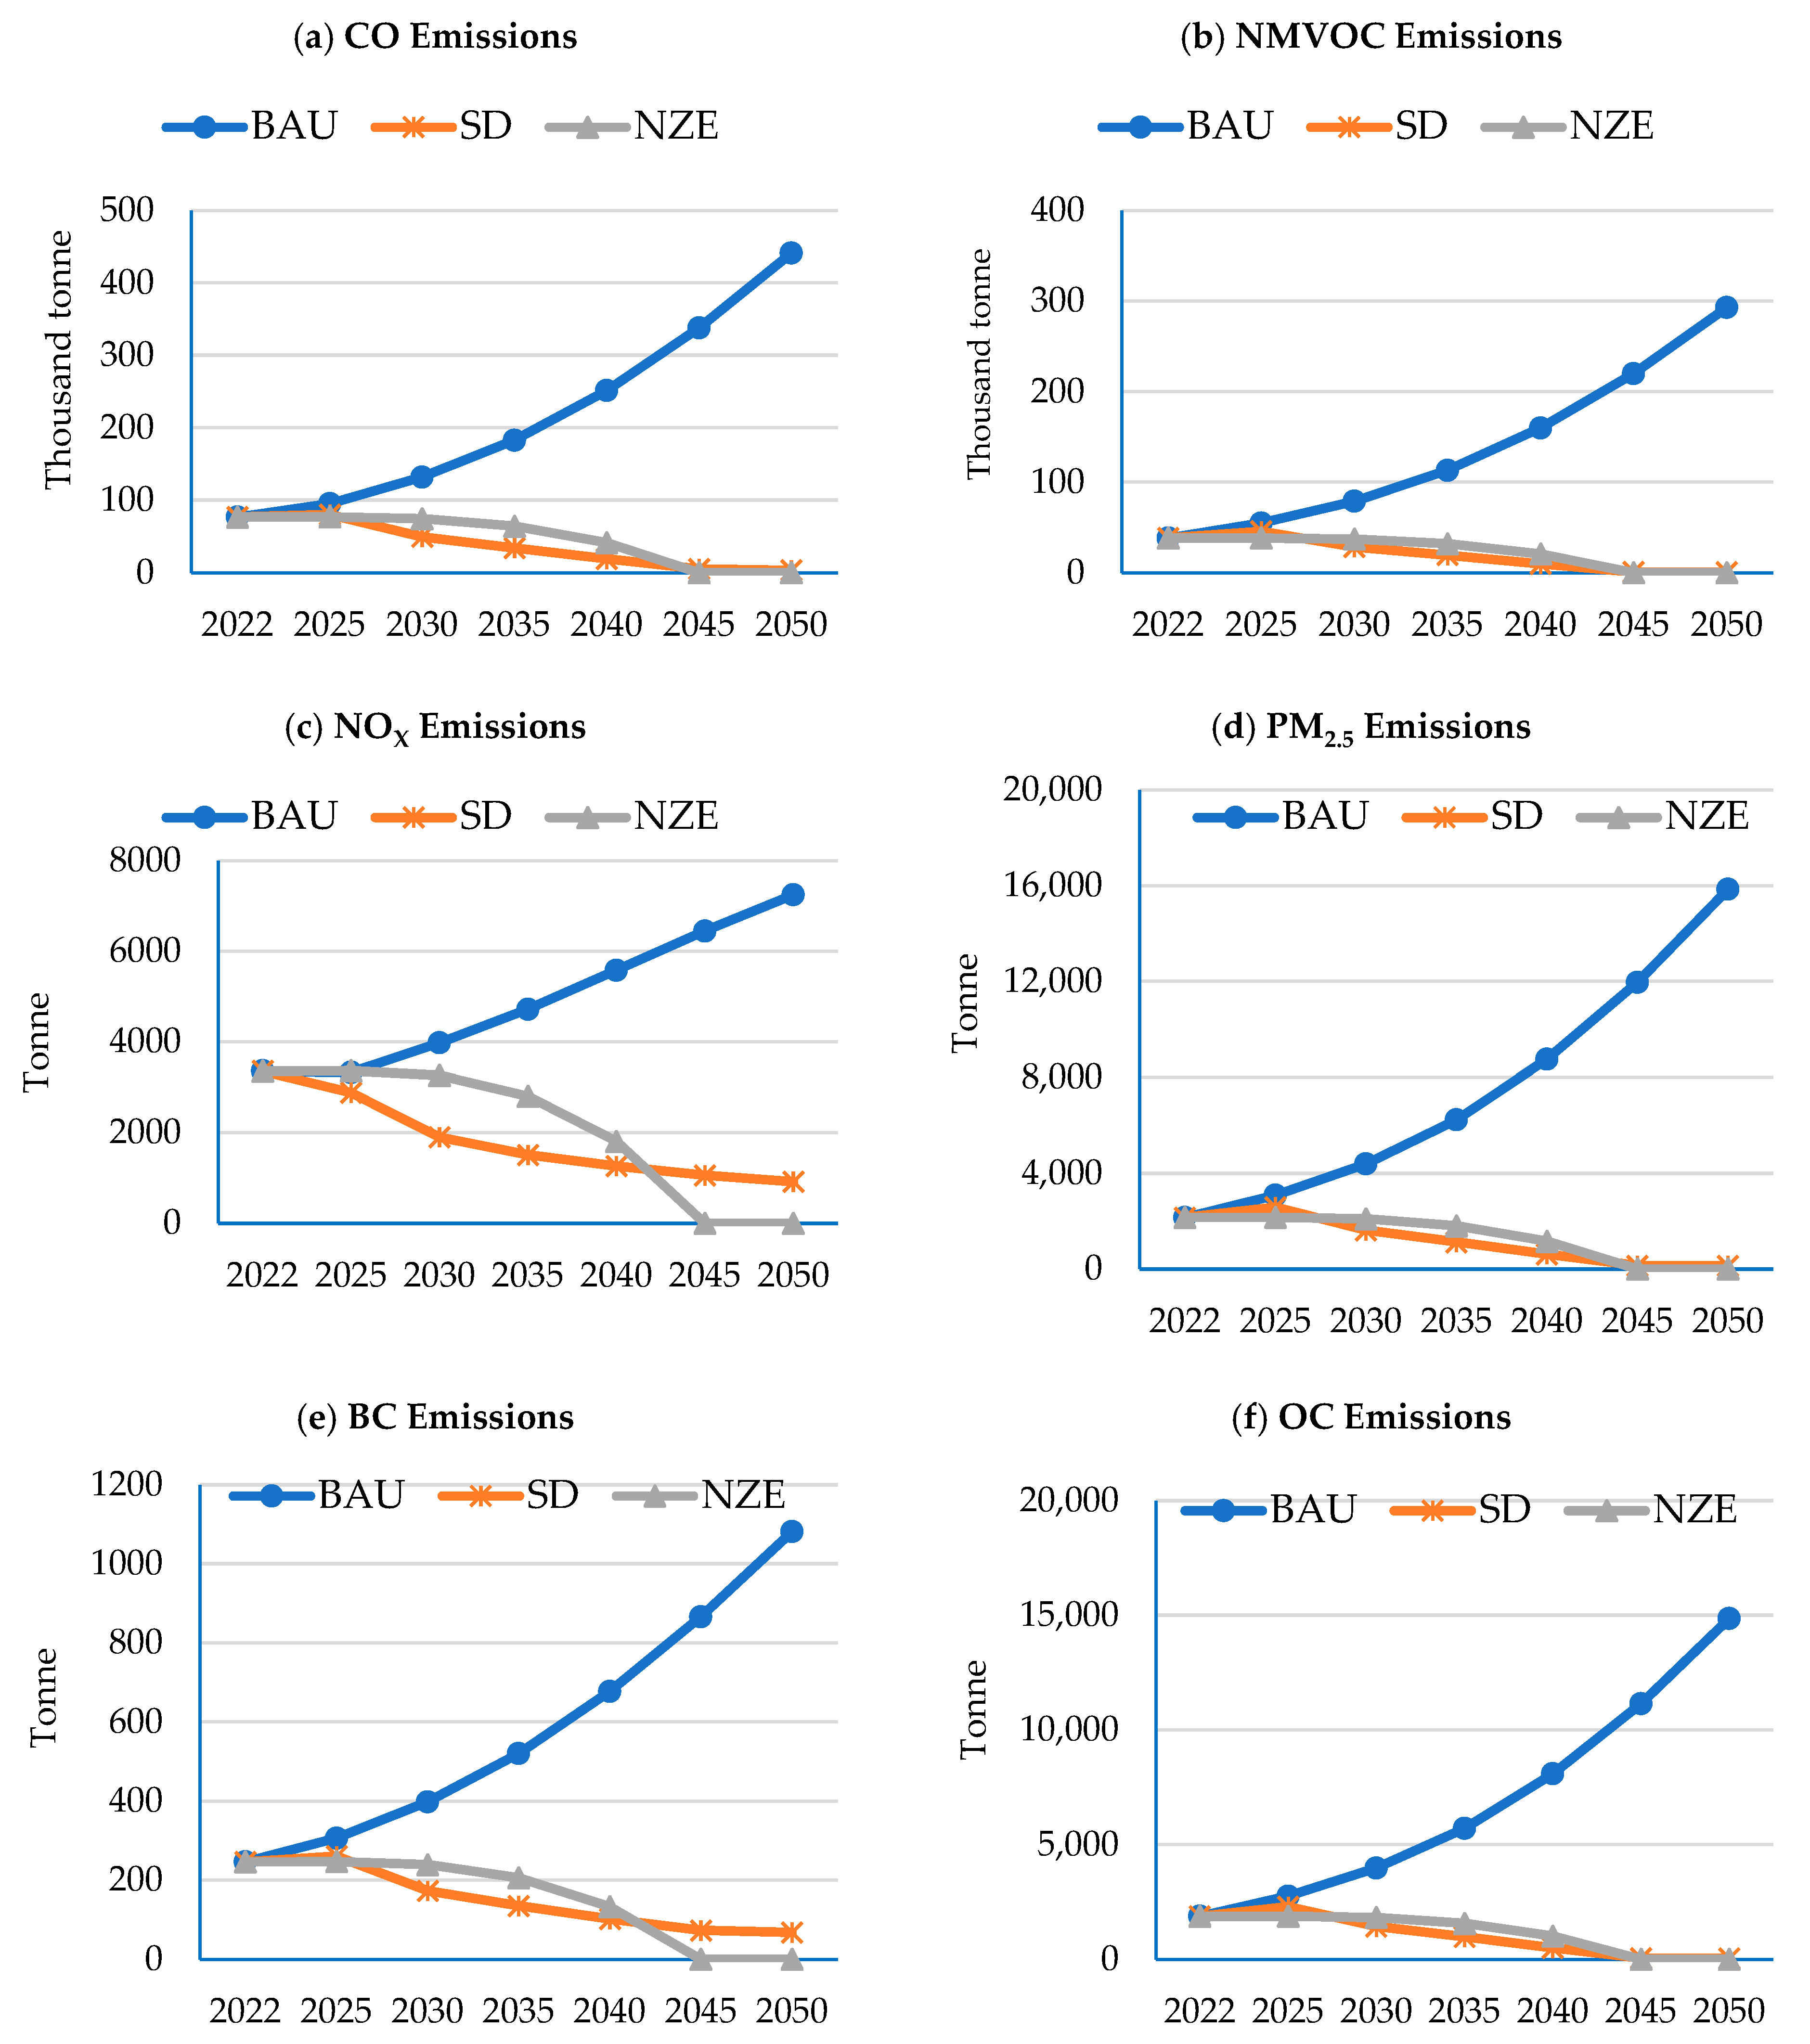
3.2.2. GHG Emissions

GHG emissions from vehicular use would undergo a staggering 3.5-fold increase in the BAU scenario from 2022 to 2050. These emissions would reduce to one-fifth of the base year emissions in 2050 in the SD scenario (Figure 9). The NZE scenario, driven by the complete electrification of passenger vehicles and the transition to green hydrogen-fueled freight vehicles, aims to achieve zero GHG emissions by 2045 in alignment with national net-zero goals. Both the SD and NZE scenarios evidenced significant alleviation of air pollution, offering profound relief from GHG emissions to the residents of the valley.

3.2.3. Co-Benefits of GHG Emission Reductions

The actions aimed at reducing GHG emissions yield valuable co-benefits in terms of local air pollutant reduction within the transport sector. The complete substitution of conventional ICE vehicles with electric and hydrogen-fueled counterparts in the NZE scenario results in a considerable decrease in CO, NMVOC, NOX, PM2.5, BC, and OC emissions (Figure 10a–f). This will be a substantial relief to dwellers of the valley, particularly where local pollutants are retained due to its bowl-shaped topography.
CO emissions from the road transport sector in the valley is estimated to rise by 5.8 times by 2050 under the BAU scenario. However, with increased electrification initiatives, CO emissions are projected to fall by 99% in the SD scenario. NMVOC emissions in the BAU scenario are estimated to increase by over sevenfold. In the SD scenario, these emissions are estimated to be completely eliminated by 2050, and the elimination is expected to start from 2045 onward in the NZE scenario.
There is a significant projected increase in various other local air pollutant emissions in the BAU scenario: nearly eightfold for OC, sevenfold for PM2.5, fourfold for BC, and twofold for NOX emissions. However, in the SD scenario, these local air pollutant emissions would be abated by more than 90% by 2050 compared with the BAU scenario. This valuable insight provides city planners with an informed basis for formulating strategies to transition the city into a more breathable and sustainable environment.

3.2.4. Electricity Demand and Generation Requirements

Table 5 compares the electricity demand and generation requirements for the SD and NZE scenarios against the BAU scenario. The ambitious targets set in both the SD and NZE scenarios expect a substantial increase in the adoption of electric vehicles, consequently driving up the demand for electricity.
More importantly, achieving the NZE scenario requires a substantial increase in the number of electric vehicles, reaching approximately 1.4 million in 2045 and 1.7 million in 2050. As a consequence, there is an additional electricity capacity requirement of 247 MW in the SD scenario and 327 MW in the NZE scenario by 2050. This equates to an additional electricity consumption demand of 1048 GWh in the SD scenario and 1390 GWh in the NZE scenario in 2050. The envisioned capacity addition seems to be achievable within the national existing and future power system expansion plans, complemented by forthcoming pipeline hydropower projects. It should be noted that while the global commitment to the NZE scenario is set for 2050, Nepal has optimistically set its targets for 2045, with conditions outlined in [12].
These figures indicate that both power sector development and the corresponding infrastructure development in the transport sector should be prioritized to facilitate the widespread adoption of electric vehicles in the valley. As such, prioritizing the development of electrical infrastructure for charging stations becomes crucial. The new installation and expansion of charging stations involve substantial investments and require adequate space, thereby imposing significant challenges to the easy implementation of EVs.

4. Discussion of Challenges and Opportunities for Promoting Electric Vehicles

This section summarizes a synthesis of the outcomes derived from comprehensive consultation sessions involving relevant stakeholders, including representatives from various government, non-government, and private institutions. Additionally, insights from the review of various research papers are incorporated into the summary.
Substituting conventional fossil fuel-powered ICE vehicles with electric alternatives would not only mitigate emissions but also lessen the burden on imported commodities, promoting optimal utilization of indigenous hydroelectricity. This, in turn, directly contributes to enhancing the economic condition of the country [73]. In the FY 2021/2022 alone, about 735 MW was added into Nepal’s central grid system out of the total installed electricity generating capacity of 2190 MW [74]. This strategic move has upgraded the nation into an era of surplus electricity, particularly during the wet season. This number has been on a continuous rise, with the capacity reaching 2684 MW in the subsequent FY 2022/2023 [75]. Electricity generation capacity from hydropower and other renewable energy options such as solar power is likely to grow in subsequent years, resulting in surplus electricity throughout the year [54,76]. Proper planning regarding EV charging during off-peak hours not only helps the country in demand management but also contributes to smoothing the load curve and optimizing the utilization of spillage energy.
Similarly, EVs are not just catalysts for creating new job opportunities but they also create avenues for local manufacturing ventures. The increased promotion of EVs can foster technological advancements, reduce import dependence, and aid in job creation across manufacturing, assembly, maintenance, and service sectors.
The expansion of EVs necessitates sufficient electric power infrastructure. Specifically in the valley, the increased penetration of EVs will impose heightened demands on the power network, potentially leading to negative consequences such as increased short-circuit currents, non-standard voltage levels, diminished power quality, and accelerated aging and failure of electrical equipment. Hence, substantial reinforcement and investment in the power network will be required to ensure the attainment of the GoN’s targets. Huge challenges extend beyond the government, requiring collaboration from the private and public sectors in leveraging resources in partnerships with international organizations for investments in charging infrastructure, provision of technical expertise, establishment of repair and maintenance centers on par with ICE vehicles, support for awareness campaigns, development of curriculum for EVs to foster wider acceptance, and cultivation of workforce needed for the near future. Moreover, challenges such as high initial investment, very low-capacity utilization, a limited number of public vehicles, dependence on imported technology, technology transfer challenges at the local level, poor voltage profile, insufficient skilled manpower in the EV industry, issues related to batteries and recycling, and the need for grid infrastructure development are to be addressed at the level possible to promote sustainable EV adoption within the valley.
In recent years, the rapidly decreasing cost of EVs has positioned them as a competitive transportation option for individuals in developing countries. Modern EVs can offer the capability to commute considerable distances, often hundreds of kilometers, along with the possibility of commuting in challenging terrains, making them a practical and versatile choice. The Nepal Electricity Authority (NEA) has taken a significant step in this direction by installing a total of 51 EV charging stations spread across 33 locations all over Nepal. In addition to this, various private companies are also contributing to the cause by installing charging stations across the country [77].
If the BAU scenario persists in Nepal, national GHG emissions are projected to double by 2030 and quintuple by 2050. Of notable concern is the transport sector, which is estimated to nearly double its GHG share by 2050, relative to 2005 levels [78]. Being the nation’s cultural and political hub, the widespread adoption of EVs in the valley would make a substantial contribution toward achieving the nation’s NZE target. The GoN has set ambitious goals, aiming to boost EV sales to 25% for private vehicles and 20% for public passenger vehicles by 2025. Furthermore, there is a more ambitious target to increase these figures to 90% of sales for private vehicles and 60% for public passenger vehicles by 2030. To attain the set target, the GoN has implemented supportive policies and incentives, including lower taxes on EVs in comparison with ICE vehicles and more favorable financing arrangements for EV purchases [14].
Kathmandu Valley, being the capital city, is densely populated, covering a mere 0.5% of the total land area of the country. Therefore, establishing a recycling plant within the valley may not be an appropriate option. The option of establishing recycling plants elsewhere in the country or developing an appropriate end-life vehicle/battery management system, considering potential environmental impacts, could be an area of future research endeavors. The LTS study discussed the investment costs for the power sector to achieve the NZE scenario at the national level. In addition, conducting research to formulate a specific city-wise investment scenario for the overall transport ecosystem could be an avenue of further exploration, ensuring the optimal allocation of resources.
In addition to these limitations, this study extensively advocates for policymakers, particularly in terms of electric power requirements in congested cities like “Kathmandu”, where concerns exist over whether pipeline hydroelectric projects will be able to meet escalating energy needs. Furthermore, this paper provides sufficient evidence of a significant reduction in the reliance on imported petroleum products, specifically for conventional ICE vehicles, directing the nation toward enhanced energy security and prosperity. Currently, Nepal incurs a considerable economic burden as it exclusively fulfills its petroleum fuel needs through imports. Moreover, EVs are comparatively more cost-effective in Nepal compared with their ICE counterparts, thereby increasing public interest in the widespread deployment of EVs. Given Nepal’s huge potential for hydroelectricity development, the country has immense stride to excel in the adoption of EVs.
By addressing the challenges and leveraging the outlined opportunities, Kathmandu Valley has the potential to establish itself as a pivotal hub for electric mobility. This endeavor would not only contribute to sustainable and cleaner transportation within the region but also serve as an example city for other developing countries sharing similar characteristics.

5. Conclusions

The potential role of transport sector electrification and the deployment of green hydrogen-fuel vehicles in GHG mitigation in Kathmandu Valley was assessed from 2022 to 2050. Considering the present trend in development, energy consumption is estimated to quadruple by 2050 in the BAU scenario, with two-wheelers maintaining their position as the most prominent energy consumers. The associated GHG emissions are estimated to undergo more than a threefold increase during this period.
In accordance with the targets outlined in both the NDC and the SDGs, energy consumption is estimated to witness a substantial reduction of 64% in the SD scenario when compared with the BAU scenario. This decline is attributed to the pivotal role played by highly efficient electric vehicles in contrast to petroleum vehicles. However, in the NZE scenario, energy consumption is estimated to experience an even more pronounced decrease, reaching 84% by 2050. There will be a significant reduction in petroleum consumption in 2050, i.e., 74% in the SD scenario, and a complete discontinuation, or a 100% reduction, in the NZE scenario.
Hydroelectricity and green hydrogen are poised to play major roles in the complete decarbonization of the transportation sector within the valley, gradually phasing out petroleum fuels. By 2050, it is expected that electricity will contribute a substantial 82% of the total energy consumption in the valley’s transport sector, with hydrogen fuel accounting for the remaining 18%. In the NZE scenario, GHG emissions are projected to reach 438 thousand tons by 2030 and to achieve zero emissions by 2045. This trajectory aligns with the national goal of achieving net zero emissions. The complete electrification of passenger transport, coupled with the introduction of green hydrogen fuel vehicles, particularly in hard-to-abate heavy-duty vehicles in freight transportation, will play a pivotal role in phasing out petroleum fuels. Hence, establishing readiness for the adoption of green hydrogen fuel in vehicles will be needed well before 2045 for smooth adoption.
Since 2003, Nepal has successfully been utilizing 100% renewable energy for electricity production [79]. Further harnessing the untapped renewable energy potential would support the expansion of electric mobility, paving the way for complete decarbonization. With the capacity to harness 100% renewable energy, Nepal stands as a sustainable solution to replace imported fossil fuels, thereby enhancing energy security and fostering economic prosperity, particularly in the context of an import-driven economy.
This paper serves as compelling evidence, motivating policy implementers and city developers to vigorously promote the widespread implementation of efficient electric as well as hydrogen-based vehicles. Simultaneously, this study paves the way for future research endeavors focusing on potential strategies for phasing out of conventional ICE vehicles. Achieving these goals necessitates the formulation of needful stable national and municipal fiscal policies to align with SD and NZE targets. Exploring the establishment of recycling plants within the country or developing an appropriate end-life vehicle/battery management system, in view of possible environmental impacts, could be a valuable area for further research. Furthermore, investigating a city-specific investment scenario for the total transport ecosystem could also provide valuable insights into the proper allocation of resources.
Effectively mitigating GHG emissions in cities or urban areas is crucial for achieving net-zero emissions and addressing climate change. Cities, given their dense population, substantial energy consumption, and sizeable infrastructure, are significant contributors to global carbon emissions. This study can serve as an inspiring example and can also be replicated in other similar growing cities in developing countries. By implementing similar strategies, urban areas can improve air quality, promote sustainability, and create a more habitable environment.

Author Contributions

Conceptualization, S.L.S.; data curation, S.R., S.L.S. and A.K.J.; formal analysis, S.R. and A.K.J.; methodology, S.R., S.L.S. and A.K.J.; project administration, A.K.J.; resources, S.L.S. and R.B.; supervision, S.L.S.; validation, S.L.S. and R.B.; visualization, R.B.; writing—original draft, S.R.; writing—review and editing, S.L.S., R.B., A.K.J. and H.B.D. All authors have read and agreed to the published version of the manuscript.

Funding

The research described in this paper was financially supported by the AEPC, GoN, during FY 2022/2023 under the Carbon Fund with activity number 14.

Institutional Review Board Statement

Not applicable.

Informed Consent Statement

Not applicable.

Data Availability Statement

Data will be made available upon request.

Acknowledgments

The authors express their sincerest gratitude to the AEPC, GoN, for their valuable guidance and financial support in carrying out this applied research. The authors are grateful to Aavas Pokharel and Siddhartha Shrestha for data collection and Bibek Kafle for assistance while conducting this research. R.B. acknowledges the support from the eREET project funded by DAAD under grant number 57562248.

Conflicts of Interest

The authors declare that they have no conflicts of interest.

References

  1. IPCC. Climate Change 2023: Synthesis Report. Contribution of Working Groups I, II and III to the Sixth Assessment Report of the Intergovernmental Panel on Climate Change; Core Writing Team, Lee, H., Romero, J., Eds.; IPCC: Geneva, Switzerland, 2023. [CrossRef]
  2. IEA. Net Zero by 2050—A Roadmap for the Global Energy Sector. 2021. Available online: https://iea.blob.core.windows.net/assets/deebef5d-0c34-4539-9d0c-10b13d840027/NetZeroby2050-ARoadmapfortheGlobalEnergySector_CORR.pdf (accessed on 11 October 2022).
  3. Tiseo, I. Global Transportation Sector CO2 Emissions 1970–2022. Statista Research Department. Available online: https://www.statista.com/statistics/1291615/carbon-dioxide-emissions-transport-sector-worldwide/ (accessed on 28 September 2023).
  4. Lamichhane, S.; Shakya, N.M. Shallow aquifer groundwater dynamics due to land use/cover change in highly urbanized basin: The case of Kathmandu Valley. J. Hydrol. Reg. Stud. 2020, 30, 100707. [Google Scholar] [CrossRef]
  5. UNEP. Nepal Urban Ecosystem Based Adaptation 2019–2022. 2022. Available online: https://wedocs.unep.org/20.500.11822/39639 (accessed on 10 November 2022).
  6. NSO. National Population and Housing Census 2021. Government of Nepal, 2023. Available online: https://censusnepal.cbs.gov.np/Home/Index/EN (accessed on 1 September 2023).
  7. Islam, R.; Jayarathne, T.; Simpson, I.J.; Werden, B.; Maben, J.; Gilbert, A.; Praveen, P.S.; Adhikari, S.; Panday, A.K.; Rupakheti, M.; et al. Ambient air quality in the Kathmandu Valley, Nepal, during the pre-monsoon: Concentrations and sources of particulate matter and trace gases. Atmos. Chem. Phys. 2020, 20, 2927–2951. [Google Scholar] [CrossRef]
  8. WHO. 9 out of 10 People Worldwide Breathe Polluted Air, but More Countries Are Taking Action. Available online: https://www.who.int/news/item/02-05-2018-9-out-of-10-people-worldwide-breathe-polluted-air-but-more-countries-are-taking-action (accessed on 28 September 2022).
  9. WHO. Urban Health Initiative, Pilot Projects: Accra and Kathmandu; World Health Organization: Geneva, Switzerland, 2023. Available online: https://www.who.int/initiatives/urban-health-initiative/health-impacts (accessed on 28 December 2023).
  10. Colaboratory. Kathmandu Valley Map Download. Available online: https://colab.research.google.com/drive/1gnPHBiolEHYEuJatv9Mn2p4WW9Bvs21S (accessed on 7 November 2022).
  11. WECS. Energy Synopsis Report 2023, FY 2078/79. Kathmandu, 2023. Available online: https://wecs.gov.np/source/Energy%20Synopsis%20Report%2C%202023.pdf (accessed on 7 September 2023).
  12. GoN. Nepal’s Long-Term Strategy for Net-Zero Emissions. 2021. Available online: https://unfccc.int/sites/default/files/resource/NepalLTLEDS.pdf (accessed on 11 September 2022).
  13. NRB. Current Macroeconomic and Financial Situation of Nepal (Based on Annual Data of 2022/23). Kathmandu, 2023. Available online: https://www.nrb.org.np/category/current-macroeconomic-situation/?department=red&fy=2079-80&subcategory=annual (accessed on 20 September 2023).
  14. MoF. Economic Survey 2021/22. 2022. Available online: https://www.mof.gov.np/site/publication-category/21 (accessed on 13 December 2022).
  15. DoTM. Vehicle Registration Details of FY 2074/75; DoTM: Kathmandu, Nepal, 2018. [Google Scholar]
  16. MOPIT. Details of Registration of Transport from Fiscal Year 2046/47 to 2073/74; MOPIT: Kathmandu, Nepal, 2017. [Google Scholar]
  17. WECS. Energy Consumption and Supply Situation in Federal System of Nepal (Bagmati Province). 2022. Available online: https://wecs.gov.np/source/Bagmati%20Province.pdf (accessed on 2 January 2023).
  18. GoN. Second Nationally Determined Contribution. 2020. Available online: https://unfccc.int/sites/default/files/NDC/2022-06/Second%20Nationally%20Determined%20Contribution%20%28NDC%29%20-%202020.pdf (accessed on 1 September 2022).
  19. MoFE. Third National Communication to the United Nations Framework Convention on Climate Change Government of Nepal. 2021. Available online: https://unfccc.int/sites/default/files/resource/TNC%20Nepal_Final_v2.pdf (accessed on 25 December 2022).
  20. NPC. The Fifteenth Plan. 2019. Available online: https://www.npc.gov.np/images/category/15th_plan_English_Version.pdf (accessed on 22 September 2022).
  21. MoPPW. National Transport Policy 2058. 2002. Available online: https://mopit.gov.np/rules/a4ae9eb5-c672-477f-9a75-48718e75533d_1558856397.pdf (accessed on 2 January 2023).
  22. MoPIT. Environment Friendly Vehicle and Transport Policy-2071. 2014. Available online: https://mopit.gov.np/rules/6b62f9c3-ecf1-4ef-86c8-f4c656f2d51e_1558856422.pdf (accessed on 28 December 2022).
  23. MoF. Financial Act 2023. Kathmandu, 2023. Available online: https://www.mof.gov.np/site/publication-detail/3250 (accessed on 27 December 2023).
  24. MoFE. Assessment of Electric Mobility Targets for Nepal’s 2020 Nationally Determined Contributions. 2021. Available online: https://www.mofe.gov.np/uploads/documents/e-mobility-assmnt-ndc-20201623998131pdf-5453-867-1658827895.pdf (accessed on 15 November 2022).
  25. Niti Aayog. National Level Policy. Government of India. Available online: https://e-amrit.niti.gov.in/national-level-policy (accessed on 22 December 2023).
  26. Niti Aayog. Electric Vehicle Incentive. Government of India. Available online: https://e-amrit.niti.gov.in/electric-vehicle-incentives (accessed on 22 December 2023).
  27. Bhardwaj, N. Policies to Facilitate India’s Transition to Clean Mobility. Available online: https://www.india-briefing.com/news/policies-to-facilitate-indias-transition-to-electric-mobility-26100.html/ (accessed on 22 December 2023).
  28. TD. Delhi Electric Vehicle Policy. Delhi, 2020. Available online: https://www.ceew.in/cef/system/policies/policy_pdfs/000/000/074/original/delhi.pdf?1616142085 (accessed on 22 December 2023).
  29. GoM. Maharashtra State Electric Vehicle Policy-2021. Maharashtra, 2021. Available online: https://www.msins.in/guidelines_docs/english/EV_Policy.pdf (accessed on 22 December 2023).
  30. Rahman, A. Electric Mobility and Shift to the Electrification of Paratransit in Bangladesh. 2022. Available online: https://www.unescap.org/sites/default/d8files/event-documents/22%20_Electric%20_mobility%20_%26%20_shift%20_to%20_electrification%2C%20_Bangladesh.pdf (accessed on 22 December 2023).
  31. MoI. Automobile Industry Development Policy. 2021. Available online: https://moind.portal.gov.bd/sites/default/files/files/moind.portal.gov.bd/page/66b4934c_1ad2_4ab3_a9f8_329331d9b054/14.%20Automobile%20Industry%20Development%20Policy%2C%202021.pdf (accessed on 22 December 2023).
  32. IEA. Global EV Outlook 2022. 2022. Available online: https://iea.blob.core.windows.net/assets/ad8fb04c-4f75-42fc-973a-6e54c8a4449a/GlobalElectricVehicleOutlook2022.pdf (accessed on 24 December 2023).
  33. He, H.; Jin, L.; Cui, H.; Zhou, H. Assessment of Electric Car Promotion Policies in Chinese Cities. October 2018. Available online: https://theicct.org/wp-content/uploads/2021/06/China_city_NEV_assessment_20181018.pdf (accessed on 24 December 2023).
  34. Li, W.; Yang, M.; Sandu, S. Electric vehicles in China: A review of current policies. Energy Environ. 2018, 29, 1512–1524. [Google Scholar] [CrossRef]
  35. Shrestha, S.R.; Oanh, N.T.K.; Xu, Q.; Rupakheti, M.; Lawrence, M.G. Analysis of the vehicle fleet in the Kathmandu Valley for estimation of environment and climate co-benefits of technology intrusions. Atmos. Environ. 2013, 81, 579–590. [Google Scholar] [CrossRef]
  36. Ghimire, K.P.; Shrestha, S.R. Estimating Vehicular Emission in Kathmandu Valley, Nepal. Int. J. Environ. 2014, 3, 133–146. [Google Scholar] [CrossRef]
  37. Bajracharya, I.; Bhattarai, N. Road Transportation Energy Demand and Environmental Emission: A Case of Kathmandu Valley. Hydro Nepal J. Water Energy Environ. 2016, 18, 30–40. [Google Scholar] [CrossRef]
  38. Shrestha, R.M.; Rajbhandari, S. Energy and environmental implications of carbon emission reduction targets: Case of Kathmandu Valley, Nepal. Energy Policy 2010, 38, 4818–4827. [Google Scholar] [CrossRef]
  39. Malla, S. Assessment of mobility and its impact on energy use and air pollution in Nepal. Energy 2014, 69, 485–496. [Google Scholar] [CrossRef]
  40. Shakya, S.R.; Kumar, S.; Shrestha, R.M. Co-benefits of a carbon tax in Nepal. Mitig. Adapt. Strateg. Glob. Chang. 2012, 17, 77–101. [Google Scholar] [CrossRef]
  41. Shrestha, R.M.; Shakya, S.R. Benefits of low carbon development in a developing country: Case of Nepal. Energy Econ. 2012, 34, S503–S512. [Google Scholar] [CrossRef]
  42. Pradhan, B.B.; Shrestha, R.M.; Pandey, A.; Limmeechokchai, B. Strategies to Achieve Net Zero Emissions in Nepal. Carbon Manag. 2018, 9, 533–548. [Google Scholar] [CrossRef]
  43. Pradhan, B.B.; Shrestha, R.M.; Limmeechokchai, B. Achieving the Paris Agreement’s 2 degree target in Nepal: The potential role of a carbon tax. Clim. Policy 2020, 20, 387–404. [Google Scholar] [CrossRef]
  44. Lin, X.; Yang, R.; Zhang, W.; Zeng, N.; Zhao, Y.; Wang, G.; Li, T.; Cai, Q. An integrated view of correlated emissions of greenhouse gases and air pollutants in China. Carbon Balance Manag. 2023, 18, 9. [Google Scholar] [CrossRef]
  45. Li, Y.; Crawford-Brown, D.J. Assessing the co-benefits of greenhouse gas reduction: Health benefits of particulate matter related inspection and maintenance programs in Bangkok, Thailand. Sci. Total Environ. 2011, 409, 1774–1785. [Google Scholar] [CrossRef] [PubMed]
  46. Krejcie, R.V.; Morgan, D.W. Determining Sample Size for Research Activities. Educ. Psychol. Meas. 1970, 30, 607–610. [Google Scholar] [CrossRef]
  47. CBS. National Population and Housing Census 2011. Kathmandu, 2014. Available online: https://unstats.un.org/unsd/demographic-social/census/documents/Nepal/Nepal-Census-2011-Vol1.pdf (accessed on 2 November 2022).
  48. CBS. Population Projection 2011–2031. Kathmandu, 2014. Available online: https://nsonepal.gov.np/wp-content/upLoads/2018/12/PopulationProjection2011-2031.pdf (accessed on 14 December 2022).
  49. UN. World Population Prospects 2022. Available online: https://population.un.org/wpp/Download/Standard/MostUsed/ (accessed on 21 September 2022).
  50. NPC. Nepal Human Development Report 2014. 2014. Available online: https://www.npc.gov.np/images/category/NHDR_Report_2014.pdf (accessed on 2 September 2022).
  51. NPC. Nepal: Human Development Report 2020. 2020. Available online: https://www.npc.gov.np/images/category/NHDR_2020.pdf (accessed on 24 October 2022).
  52. NPC. Sustainable Development Goals: Status and Roadmap: 2016–2030. 2017. Available online: https://www.undp.org/nepal/publications/sustainable-development-goals-status-and-roadmap-2016-2030 (accessed on 12 September 2022).
  53. WECS. Nepal’s Energy Sector Vision 2050 A.D. 2013. Available online: http://www.wecs.gov.np/storage/listies/October2020/vision-2050.pdf (accessed on 23 December 2023).
  54. WECS. Electricity Demand Forecast Report. 2017. Available online: https://moewri.gov.np/storage/listies/May2020/electricity-demand-forecast-report-2014-2040.pdf (accessed on 18 September 2022).
  55. IPCC. 2006 IPCC Guidelines for National Greenhouse Gas Inventories. Intergovernmental Panel on Climate Change. Available online: https://www.ipcc-nggip.iges.or.jp/public/2006gl/ (accessed on 11 November 2022).
  56. Shrestha, R.M.; Kim Oanh, N.T.; Shrestha, R.P.; Rupakheti, M.; Rajbhandari, S.; Permadi, D.A.; Kanabkaew, T.; Iyngararasan, M.; Atmospheric Brown Clouds (ABC) Emission Inventory Manual. United Nations Environment Programme, Nairobi, Kenya. Available online: https://wedocs.unep.org/20.500.11822/21482 (accessed on 10 August 2022).
  57. Shakya, S.R.; Shrestha, R.M. Transport sector electrification in a hydropower resource rich developing country: Energy security, environmental and climate change co-benefits. Energy Sustain. Dev. 2011, 15, 147–159. [Google Scholar] [CrossRef]
  58. Heaps, C. The Low Emissions Analysis Platform [Software version: 2020.1.103]. Stockholm Environment Institute. Available online: https://leap.sei.org (accessed on 29 December 2022).
  59. Rith, M.; Fillone, A.M.; Biona, J.B.M.M. Energy and environmental benefits and policy implications for private passenger vehicles in an emerging metropolis of Southeast Asia—A case study of Metro Manila. Appl. Energy 2020, 275, 115240. [Google Scholar] [CrossRef]
  60. Shabbir, R.; Ahmad, S.S. Monitoring urban transport air pollution and energy demand in Rawalpindi and Islamabad using leap model. Energy 2010, 35, 2323–2332. [Google Scholar] [CrossRef]
  61. Nieves, J.A.; Aristizábal, A.J.; Dyner, I.; Báez, O.; Ospina, D.H. Energy demand and greenhouse gas emissions analysis in Colombia: A LEAP model application. Energy 2019, 169, 380–397. [Google Scholar] [CrossRef]
  62. Cai, L.; Luo, J.; Wang, M.; Guo, J.; Duan, J.; Li, J.; Li, S.; Liu, L.; Ren, D. Pathways for municipalities to achieve carbon emission peak and carbon neutrality: A study based on the LEAP model. Energy 2023, 262, 125435. [Google Scholar] [CrossRef]
  63. Sun, W.; Zhao, Y.; Li, Z.; Yin, Y.; Cao, C. Carbon Emission Peak Paths Under Different Scenarios Based on the LEAP Model—A Case Study of Suzhou, China. Front. Environ. Sci. 2022, 10, 905471. [Google Scholar] [CrossRef]
  64. Hernández, K.D.; Fajardo, O.A. Estimation of industrial emissions in a Latin American megacity under power matrix scenarios projected to the year 2050 implementing the LEAP model. J. Clean. Prod. 2021, 303, 126921. [Google Scholar] [CrossRef]
  65. Hong, S.; Chung, Y.; Kim, J.; Chun, D. Analysis on the level of contribution to the national greenhouse gas reduction target in Korean transportation sector using LEAP model. Renew. Sustain. Energy Rev. 2016, 60, 549–559. [Google Scholar] [CrossRef]
  66. Wang, J.; Li, Y.; Zhang, Y. Research on Carbon Emissions of Road Traffic in Chengdu City Based on a LEAP Model. Sustainability 2022, 14, 5625. [Google Scholar] [CrossRef]
  67. Rivera-González, L.; Bolonio, D.; Mazadiego, L.F.; Naranjo-Silva, S.; Escobar-Segovia, K. Long-term forecast of energy and fuels demand towards a sustainable road transport sector in Ecuador (2016–2035): A LEAP model application. Sustainability 2020, 12, 472. [Google Scholar] [CrossRef]
  68. Zou, X.; Wang, R.; Hu, G.; Rong, Z.; Li, J. CO2 Emissions Forecast and Emissions Peak Analysis in Shanxi Province, China: An Application of the LEAP Model. Sustainability 2022, 14, 637. [Google Scholar] [CrossRef]
  69. Maduekwe, M.; Akpan, U.; Isihak, S. Road transport energy consumption and vehicular emissions in Lagos, Nigeria: An application of the LEAP model. Transp. Res. Interdiscip. Perspect. 2020, 6, 100172. [Google Scholar] [CrossRef]
  70. Ouedraogo, N.S. Energy Futures Modelling for African Countries: LEAP Model Application. 2017. Available online: https://policycommons.net/artifacts/1922596/wider-working-paper-201756-energy-futures-modelling-for-african-countries/2674367/ (accessed on 29 November 2022).
  71. ADB. Nepal: Kathmandu Sustainable Urban Transport Project. 2020. Available online: https://www.adb.org/sites/default/files/project-documents/44058/44058-013-smr-en_0.pdf (accessed on 12 September 2022).
  72. Bhattarai, P.; Subedi, B.S.; Shrestha, S.L. Energy Factsheet: Bagmati Province. Copernicus GmbH, Kathmandu, March 2023. Available online: https://prc.org.np/publications (accessed on 21 September 2023).
  73. Krupa, A. Barriers and Opportunities to Electric Vehicle Development in Nepal. 2019. Available online: https://digitalcollections.sit.edu/isp_collection (accessed on 5 January 2023).
  74. NEA. NEA Annual Report 2021–2022. 2022. Available online: https://nea.org.np/annual_report (accessed on 2 January 2023).
  75. NEA. NEA: A Year in Review-FY 2022/2023. 2023. Available online: https://nea.org.np/annual_report (accessed on 23 September 2023).
  76. MoEWRI. Energy, Water Resources and Irrigation White Paper. 2018. Available online: https://www.moewri.gov.np/storage/listies/May2020/white-paper-2075-with-annex02.pdf (accessed on 14 December 2022).
  77. RSS. 51 Charging Stations Installed by NEA Come into Operation. Business360. Available online: https://b360nepal.com/public/51-charging-stations-installed-by-nea-come-into-operation (accessed on 7 September 2023).
  78. GGGI. National Action Plan for Electric Mobility. Kathmandu, 2018. Available online: https://gggi.org/wp-content/uploads/2018/07/GGGI-Nepal_Action-Plan-for-Electric-Mobility.pdf (accessed on 2 January 2023).
  79. GCDL. Share of Electricity Production from Renewables. Available online: https://ourworldindata.org/grapher/share-electricity-renewables?tab=chart&country=~NPL (accessed on 10 November 2022).
Figure 2. Overall methodological framework.
Sustainability 16 01211 g002
Figure 3. Energy consumption in the transport sector in 2022.
Sustainability 16 01211 g003
Figure 4. Characteristics of passenger mobility.
Sustainability 16 01211 g004
Figure 5. Characteristics of freight mobility.
Sustainability 16 01211 g005
Figure 6. Comparative analysis of transport energy consumption in the valley.
Sustainability 16 01211 g006
Figure 7. Comparative analysis of energy consumption by fuel type.
Sustainability 16 01211 g007
Figure 8. Energy consumption by vehicle type in various scenarios.
Sustainability 16 01211 g008
Figure 9. Comparative analysis of GHG emissions from the transport sector.
Sustainability 16 01211 g009
Figure 10. Comparative analysis on co-benefits of GHG mitigation from the transport sector on local air pollutants in the valley.
Sustainability 16 01211 g010
Table 1. Estimated growth rates of socioeconomic parameters during the period 2022–2050.
Population Growth Rates (%)GVA Growth Rates (%)
2022–20251.636.50
2025–20301.517.50
2030–20351.378.00
2035–20401.208.50
2040–20450.998.30
2045–20500.758.00
Table 2. Service demand projections.
Item2022202520302035204020452050
Passenger-km
(in billion)
14.8617.2322.2628.7537.0246.8057.85
Tonne-km
(in billion)
1.231.381.722.172.773.524.44
Table 3. Vehicles in operation in the valley.
S.N.VehicleRegistered up to 2021/2022Operating FactorVehicles in Operation
1Two-wheeler701,502 0.50350,751
2Three-wheeler2453 0.29711
3Car/jeep/van122,287 0.6073,372
4Microbus2061 0.551134
5Minibus9547 0.393723
6Bus10,075 0.454534
7Truck/minitruck18,373 0.386982
8Pickup16,665 0.6811,332
9Tractor2823 0.11311
10Other10,017 0.565609
Table 4. Samples size by type of vehicle.
S. No.VehicleSamples CalculatedSamples Adjusted
1Two-wheeler308308
2Three-wheeler19
3Car/jeep/van6464
4Microbus13
5Minibus35
6Bus46
7Truck/minitruck67
8Pickup1010
9Tractor15
10Other55
Total403422
Table 5. Electricity demand and capacity requirement.
Scenario202520302035204020452050
Electricity Consumption Requirement (GWh)
BAU234267100141188
SD723255287509921236
NZE7822845880012781578
Electricity Capacity Requirement (MW)
BAU51016233344
SD1776124176233291
NZE1854108188300371
Disclaimer/Publisher’s Note: The statements, opinions and data contained in all publications are solely those of the individual author(s) and contributor(s) and not of MDPI and/or the editor(s). MDPI and/or the editor(s) disclaim responsibility for any injury to people or property resulting from any ideas, methods, instructions or products referred to in the content.

