Article

Study on Mechanical Properties and Microscopic Mechanism of PVA-Modified Recycled Brick Aggregate Concrete

School of Architecture and Civil Engineering, Xi’an University of Science and Technology, Xi’an 710054, China
*
Author to whom correspondence should be addressed.
Sustainability 2024, 16(3), 1292; https://doi.org/10.3390/su16031292
Submission received: 18 October 2023 / Revised: 25 January 2024 / Accepted: 29 January 2024 / Published: 2 February 2024

Abstract

:
This paper addresses a range of environmental issues stemming from the improper disposal of construction waste and its low recycling rate by examining the effects and mechanisms of polyvinyl alcohol (PVA) solution in modifying recycled aggregates. Basic physical properties, energy-dispersive spectroscopy (EDS), X-Ray diffraction (XRD), and scanning electron microscopy (SEM) were employed to study these effects and mechanisms. Tests on basic mechanical properties were performed to assess the impact of aggregate modification and the brick-concrete ratio on recycled brick-aggregate concrete’s mechanical characteristics. Nuclear magnetic resonance and microhardness tests were performed to analyze the influence exerted by PVA modification on the interfacial transition zone (ITZ), microstructure, and pore structure, thus exploring the connection between modified recycled-brick-aggregate concrete’s microstructure and its icromechanical properties. The findings show that the water absorption and crushing index of recycled aggregates (RA) immersed in a 10% PVA solution for 24 h decrease significantly, while the apparent density increases most notably. This phenomenon can be ascribed to the development of a PVA coating on the exterior of the reused aggregates. The optimal mechanical properties for recycled brick aggregate concrete (RAC) occur when the replacement rate is 30% and the brick-concrete ratio is 1:1. The compressive strength is 44.2 MPa, the bending strength is 15.6 MPa, and the splitting tensile strength is 3.85 MPa. Additionally, the modification with PVA results in a higher percentage of transition pores, while simultaneously reducing the percentage of macropores. There is an uptick in the frequency of harmless and less harmful pores, and a declining proportion of harmful and more harmful pores. The ITZ’s structural morphology in the RAC is effectively improved by the coating structure formed through the bonding of the polymer with cement hydration products, and PVA modification reduces the thickness of this zone.

1. Introduction

Signficiant amounts of leftover bricks and concrete accompany the processes of large-scale transformation and demolition activities. The presence of this construction waste not only pollutes the environment but also occupies land and results in substantial resource wastage [1,2,3,4,5]. Reprocessing this waste into recycled aggregate for concrete production is one of the key methods for the effective utilization of construction waste materials [6,7,8,9,10]. However, recycled aggregates inherently possess defects. When compared to natural aggregates, RA has high porosity, low apparent density, high water absorption, a large number of internal defects or microcracks, and poor strength [11,12,13], diminishing RAC’s mechanical attributes. Therefore, it is critically important to study modified recycled-brick-aggregate concrete’s mechanical properties and micro-mechanical mechanisms [14,15,16].
Researchers and experts from around the world have recently conducted numerous studies on modified recycled concrete. Physical and chemical methods are the two principal approaches used in both domestic and international research for modifying recycled aggregates. Mechanical strengthening and gradation adjustment are the two main types of physical modification techniques. Particle shaping, thermal grinding, and mechanical grinding are the three primary mechanical strengthening techniques employed globally. Nevertheless, the physical strengthening approach has certain limitations, including the difficulty of completely removing the hardened cement paste adhered to the surface of the aggregates, significant energy consumption, and the wear and tear on mechanical components. Moreover, this process tends to damage the recycled aggregate, introducing a number of microcracks on its surface. The more treatments applied and the greater the mechanical stress, the more damage the recycled aggregate is likely to suffer. Consequently, this paper focuses on using chemical methods to modify recycled aggregate concrete. Extensive studies, both within China and internationally, have been carried out on recycled-aggregate concrete’s chemical modification. Yang et al. [17] mixed a polyvinyl alcohol (PVA) solution with recycled aggregate to form a bonding layer, thereby increasing the strength of the recycled concrete. Kou [18] examined the impacts of various PVA concentrations on enhancing recycled aggregate’s performance. The recycled brick-aggregate concrete (RAC) was immersed in PVA solutions of 6%, 8%, 10%, and 12%, and the findings indicated that the modification effect was optimal at a PVA concentration of 10%. Zhao [19] utilized cement slurry with micro-aggregates and volcanic ash to enhance the pore structure of the old mortar on the surface of recycled aggregate, which led to reduced water absorption. Fan Xiaoping [20] and Du Ting [21] applied different chemical slurries to increase recycled aggregate’s apparent density and to lower its crushing index. Fan et al. [22] immersed recycled aggregate in water glass solutions at concentrations of 3%, 5%, and 7% for one hour and found that a 5% concentration yielded the best modification effect in enhancing the performance of recycled concrete. The aforementioned studies indicate that appropriate modification methods can endow recycled concrete with higher strength and better performance. Currently, the recycled aggregate produced in China predominantly consists of concrete and brick [23], with brick comprising about 30% to 50% of the total. Compared to concrete, brick generally exhibits poorer performance during use. Therefore, it is vital to develop methods to improve its quality. Further research is necessary to comprehend the mechanisms affecting recycled brick-aggregate concrete’s microstructure and morphology, as studies on recycled brick-aggregate modification are still limited at both the domestic and international levels.
This paper utilized a solution of PVA to modify recycled brick aggregate and recycled concrete aggregate. Microscopic analyses, including energy-dispersive X-Ray spectroscopy (EDS), X-Ray diffraction (XRD), and scanning electron microscopy (SEM), were conducted to determine the changes in microstructure before and after modification. The objective was to clarify the mechanism of modification in the aggregates. By conducting both macroscopic (mechanical property tests) and microscopic (SEM, XRD, and EDS) evaluations of the PVA-modified recycled-brick-aggregate concrete, we investigated the impact of varying brick–concrete ratios and PVA modifications on the material’s mechanical properties. Additionally, we examined the influence of PVA modification on the microstructure, the interfacial transition zone (ITZ), and the pore structure, aiming to establish the link between the macroscopic mechanical properties and the microstructure.

2. Modification Effect and Mechanism of Recycled Aggregate

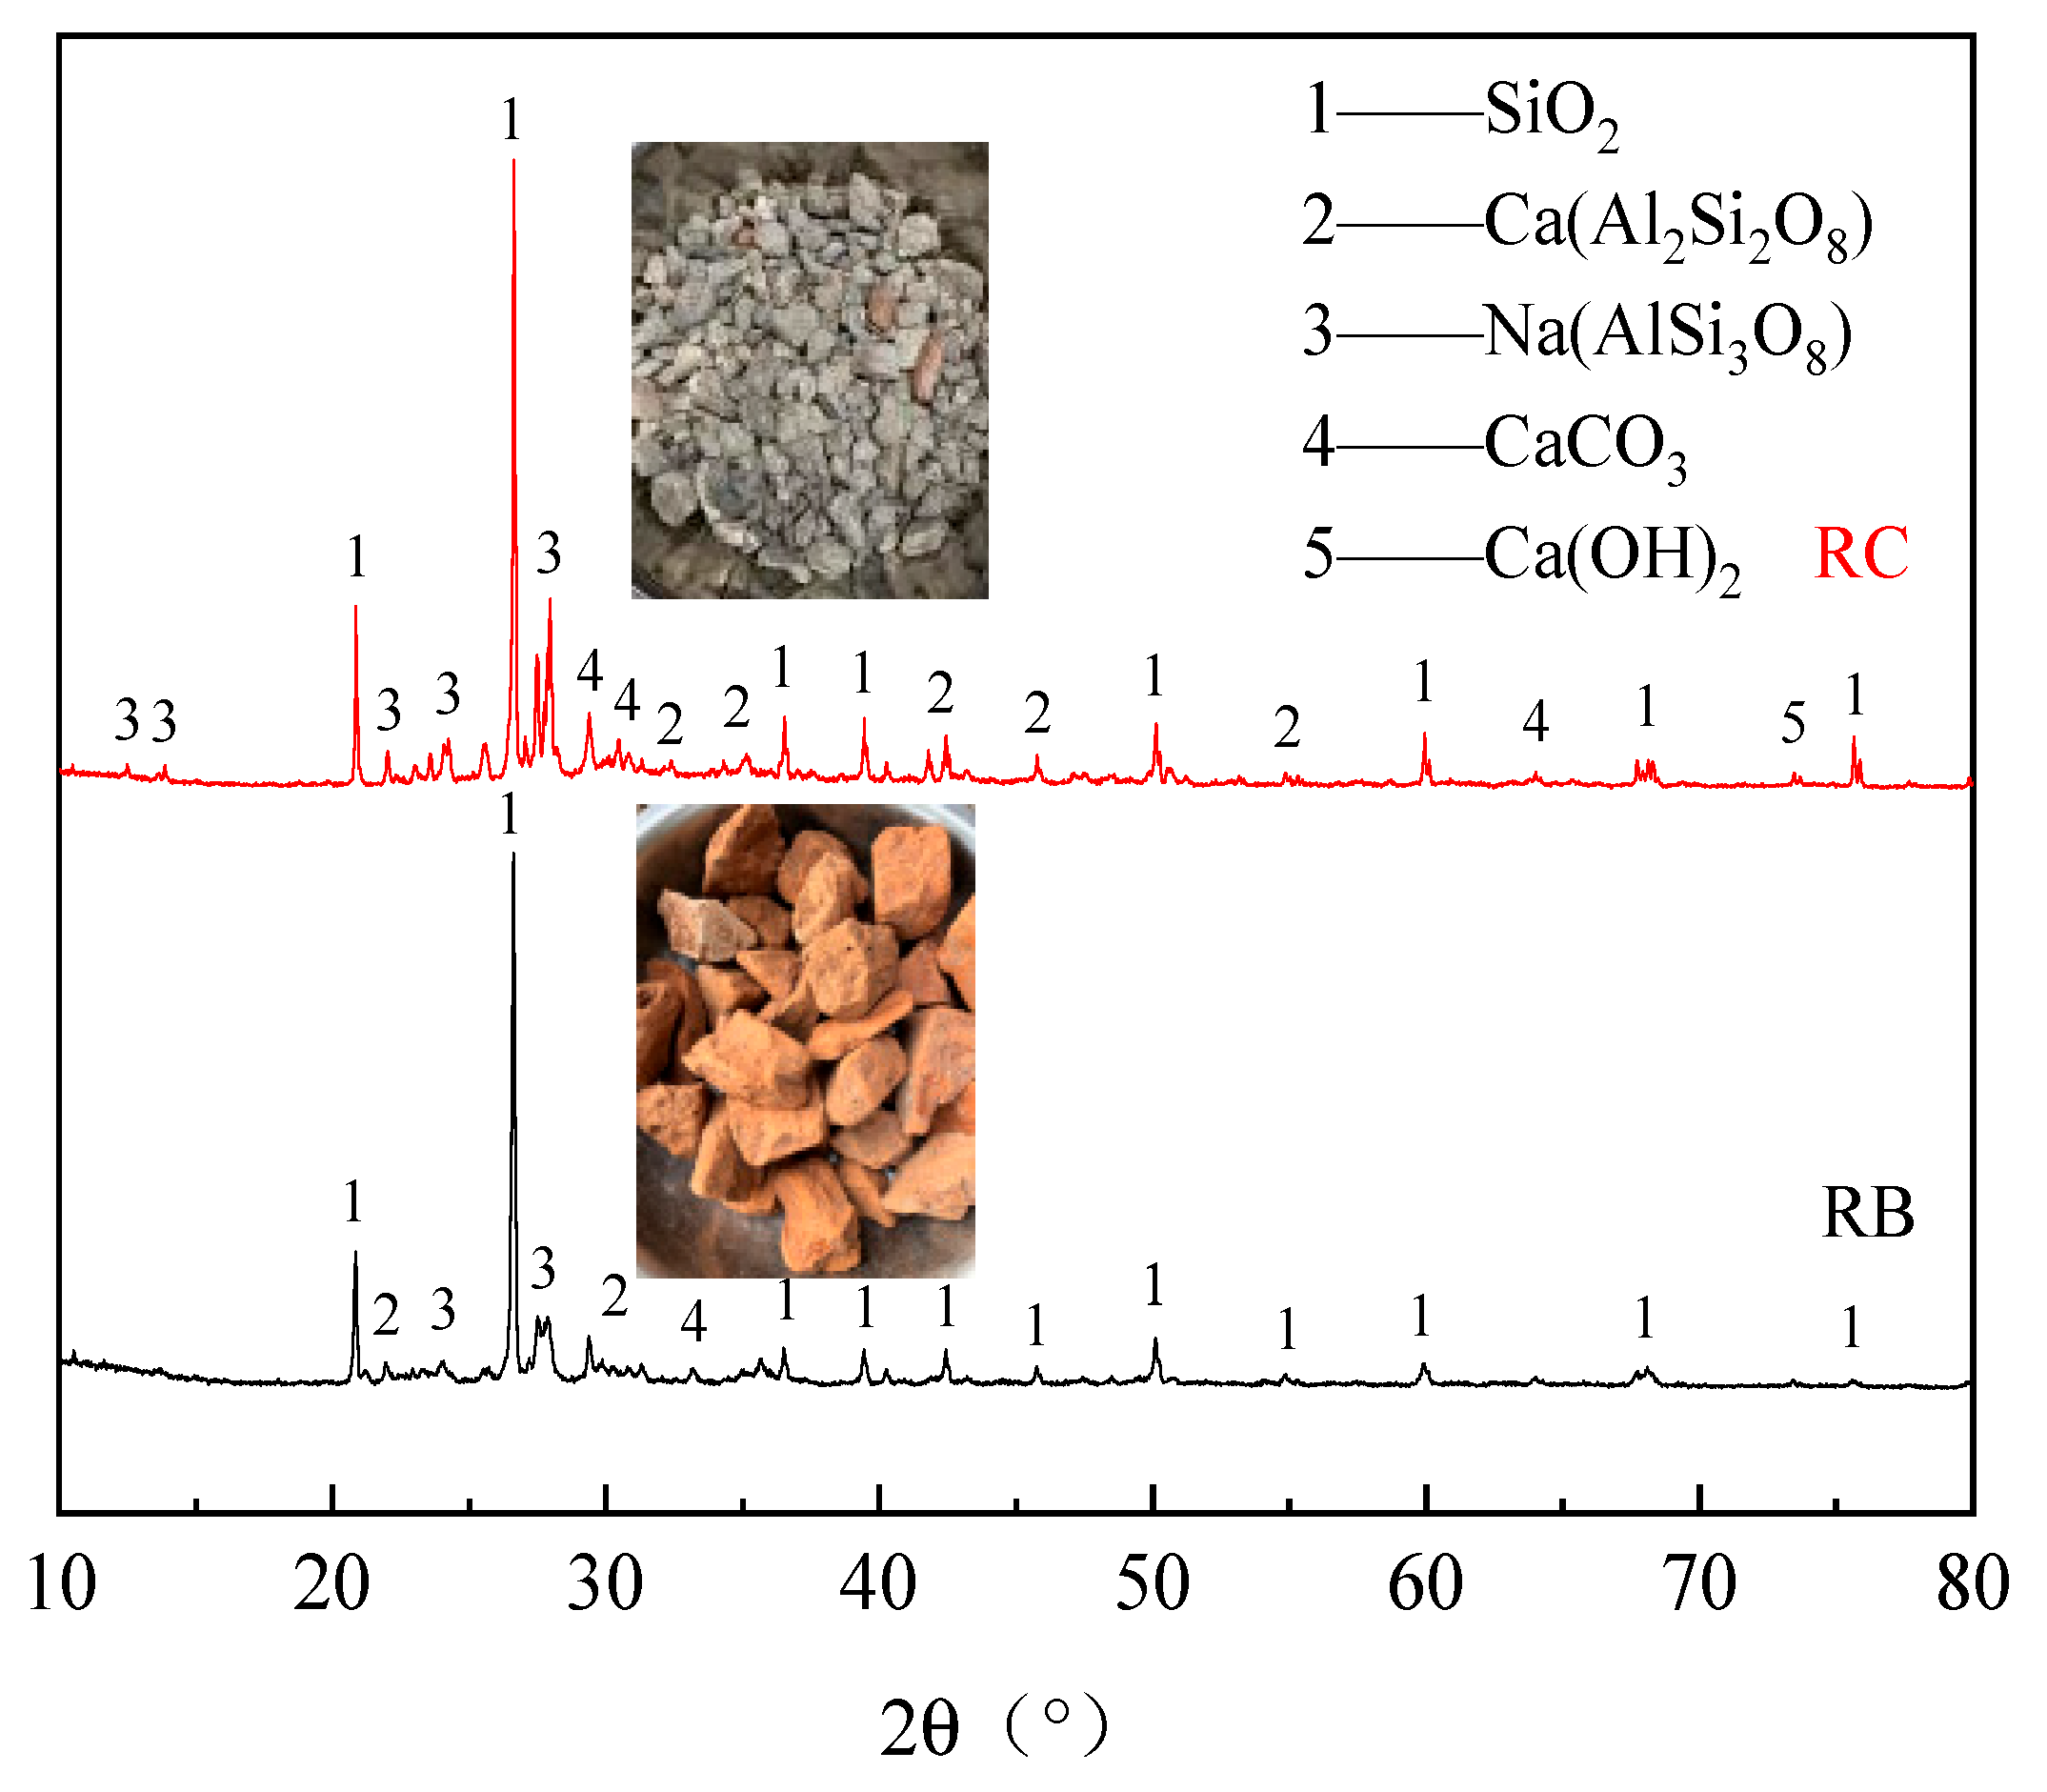
2.1. Raw Materials of Recycled Aggregate

The recycled aggregates used in this paper were sourced from the demolition of waste buildings by Xinxing Lantian Environmental Protection Technology Co., Ltd. in Xi'an City, Shaanxi Province, China. The primary component of the recycled brick aggregate (RB) was ordinary sintered brick. The bricks were processed with an EP-3B jaw crusher and subsequently sieved through an S49-B series rotary vibrating screen. In accordance with the GB/T 25177-2010 “Recycled Coarse Aggregate for Concrete” [24] specification, the aggregates were graded to a continuous size range of 5–25 mm, and the proportion of flaky particles after crushing was maintained below 10%. Concurrently, the recycled concrete aggregate (RC) conformed to a continuous gradation of 5–31.5 mm. The mineral composition of the recycled aggregate was characterized by XRD analysis using an MDI Jade 6 diffractometer, as illustrated in Figure 1. The PVA, supplied by Wuxi Yatai United Chemical Co., Ltd. in Wuxi City, Jiangsu Province, China, is a white or milky-white powder or granule. The quality indicators of the selected polyvinyl alcohol (PVA) are shown in Table 1. Ordinary tap water was used for the procedures.

2.2. Preparation Scheme of Modified Recycled Aggregate

There were a total of 18 experimental groups planned; RB and RC were immersed in 1%, 5%, and 10% concentrations of polyvinyl alcohol (PVA) solution for 6 h, 12 h, and 24 h, respectively.
The preparation steps of the PVA solution are as follows:
(1)
According to the design of the three solution concentrations of 1%, 5%, and 10%, respectively, 300 g, 1500 g, or 3000 g of PVA powder was slowly added to 30 kg of tap water to prepare the corresponding concentrations of the PVA solution standby.
(2)
The concentration was heated and stirred until the water temperature reached 95 °C, and this temperature was maintained for 30~60 min. The cycle of preparation continued until the solution met the test requirements.
(3)
The solution was cooled to room temperature, and the aggregate was soaked with it and stirred every 3 h to ensure even soaking. After the soaking was completed, the PVA waste solution was professionally treated before it was discharged into the natural environment, because it will cause some pollution to the environment, and it must be collected and sent to be professionally treated outside the school by the relevant personnel in charge of the school.
(4)
The surface of the aggregate was rewashed with water to separate the aggregates from each other when the PVA solution initially solidified.
(5)
The aggregate was placed in a well-ventilated and sunny position for complete drying to be used as a backup.

2.3. Test Methods for Basic Physical Properties and Micro-Morphology of Aggregate

2.3.1. Basic Physical Properties Test

  • Test for apparent density
The apparent density of the recycled aggregate was measured using the wide-mouth bottle method, and the apparent density was calculated according to Formula (1).
ρ 0 = ( m h 4 m h 4 + m h 6 m h 5 α t ) × ρ water
where the apparent density of the sample (kg/m3) is denoted as ρ 0 ; m h 4 represents the mass of the sample after drying ( g ); m h 5 is the total mass of the sample, water, bottle, and glass sheet ( g ); m h 6 is the total mass of the water, bottles, and glass flakes ( g ); α t is the correction factor, take 0.004; and ρ water is the density of saturated water.
2.
Test for water absorption
Water absorption was determined by drying in an XBH-RX-1350B hot-air circulation oven, with the water absorption calculated using Formula (2).
Q g = m g 1 m g 2 m g 1 × 100 %
where W is the water absorption (%); m j 1 represents the mass of the saturated-surface dry sample ( g ); and m j 2 expresses the mass of the sample after drying ( g ).
3.
Test for Crushing Index
The crushing index was tested using a TYA-2000 digital display press, and the value was calculated with Formula (3).
Q g = m g 1 m g 2 m g 1 × 100 %
where, Q g is the crushing index; m g 1 denotes the mass of the sample ( g ); and m g 2 represents the mass of the remaining sample after the crushing test ( g ).
According to the relevant provisions of “Pebble and crushed stone for construction (GB/T 14685-2022)” [25], for both the apparent density and water absorption, the final measurement value should be determined by the arithmetic average of two tests. The crushing index should be ascertained by the arithmetic mean of three tests to obtain the final measured value.

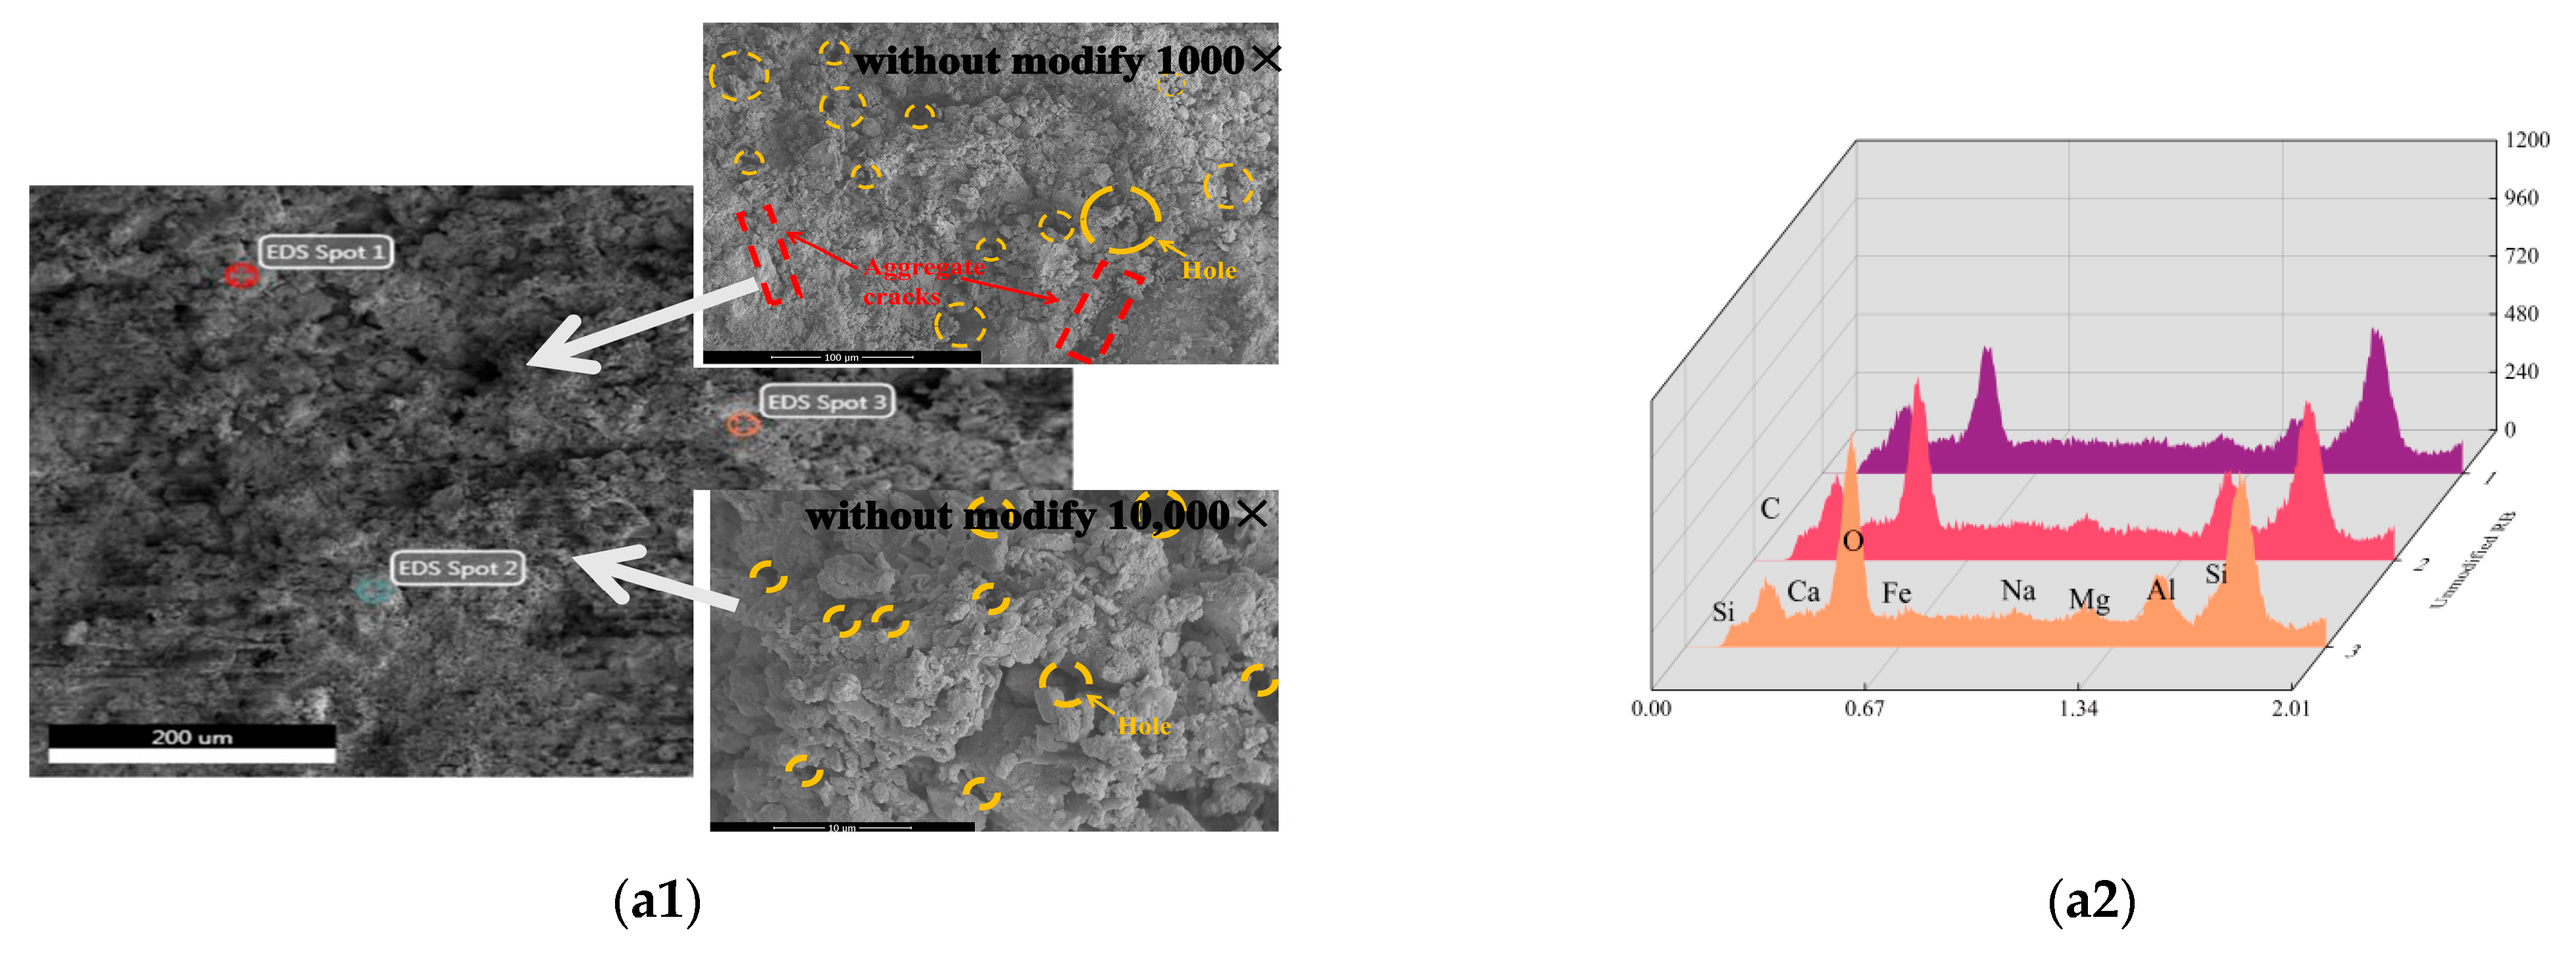
2.3.2. Scanning Electron Microscope

The surface and internal morphology of both the modified and unmodified recycled aggregates were observed through the utilization of a Czech FEI Nova NanoSEM 450 field emission environmental-scanning electron microscope. A small sample of 7–8 mm aggregates and a sectioned piece of the aggregate were placed into a drying oven and treated at 60 °C for 8 h. Afterward, the samples were coated with gold twice and underwent vacuuming to enhance conductivity due to the poor conductivity of the materials (as shown in Figure 2a) [26,27]. The SEM images (as shown in Figure 2b) were captured after the test system was focused and the image adjusted. To perform the energy spectrum test with EDAX Octane Super, the Aztec software 5.0 was opened and the EDS-SM mode was selected to capture the image and the spectrum, after which three test points were selected for each image and the software automatically calculateed the composition after determining the elements through the test.

2.4. Analysis of the Basic Physical Properties of Modified Recycled Aggregate
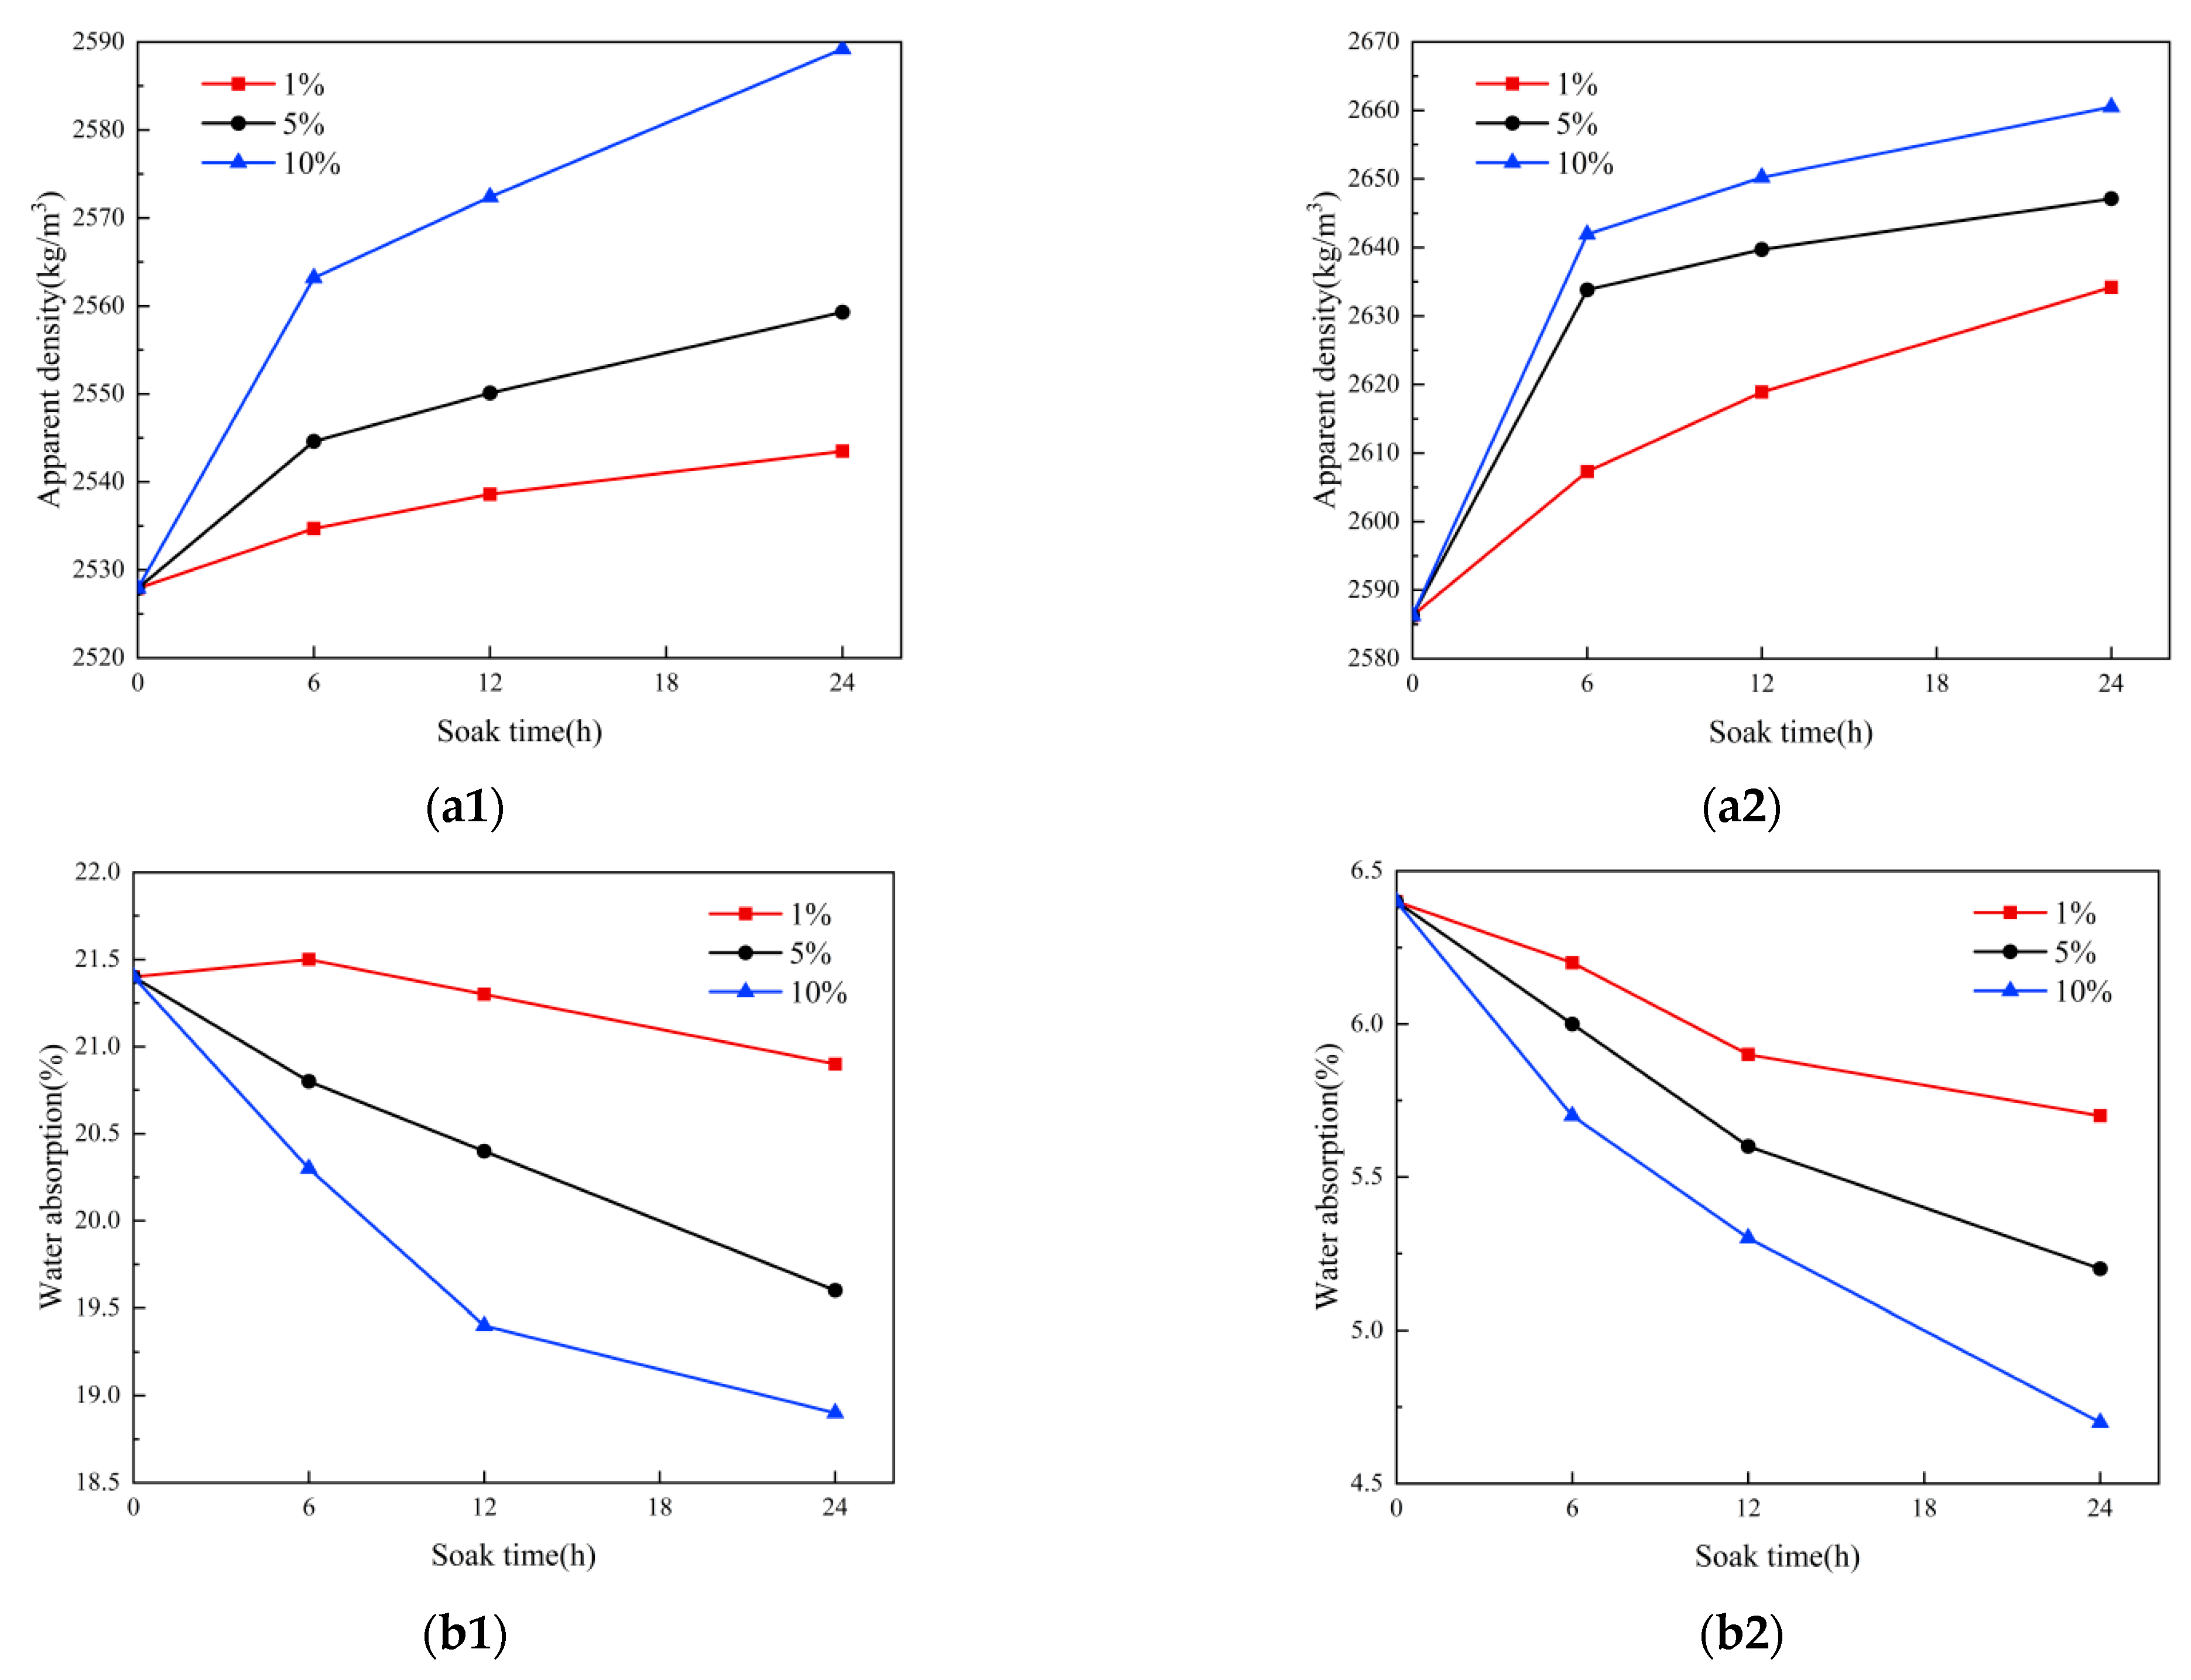
Through the basic mechanical tests, experimental curves were obtained for RB and RC immersed in PVA solutions of 1%, 5%, and 10% concentrations for durations of 6 h, 12 h, and 24 h (as illustrated in Figure 3).
(1)
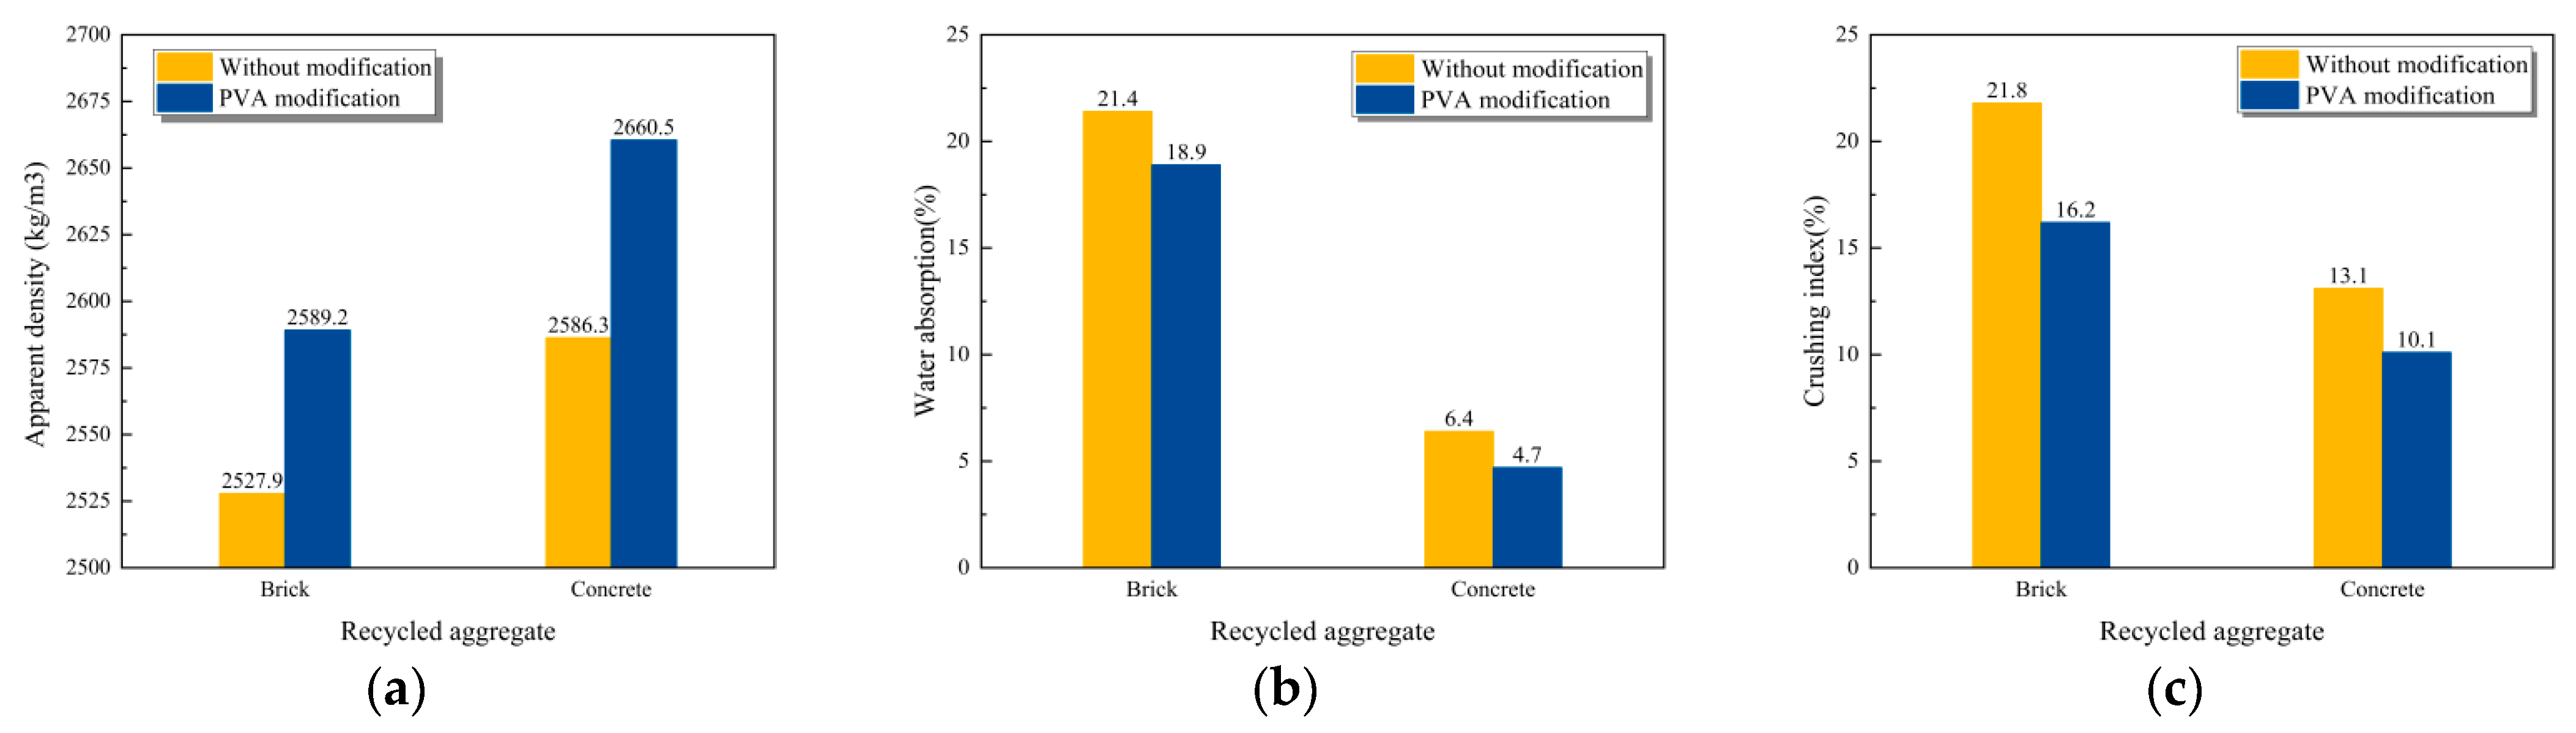
The effect exerted by PVA modification on the apparent density of recycled aggregate (Figure 3(a1,a2)):
The unmodified apparent densities of RB and RC were 2527.9 kg/m3 and 2586.3 kg/m3, respectively. After a 6-h immersion in PVA solutions at concentrations of 1%, 5%, and 10%, the apparent densities of RB increased by 0.27%, 0.66%, and 1.40%, respectively, while those of RC increased by 0.81%, 1.84%, and 2.15%, respectively. After a 12-h immersion in PVA solutions at concentrations of 1%, 5%, and 10%, the apparent densities of RB increased by 0.42%, 0.88%, and 1.76%, respectively, and those of RC increased by 1.26%, 2.06%, and 2.47%, respectively. After a 24-h immersion in PVA solutions at concentrations of 1%, 5%, and 10%, the apparent densities of RB increased by 0.62%, 1.24%, and 2.42%, respectively, and those of RC increased by 1.85%, 2.35%, and 2.87%, respectively.
The apparent density could increase with the concentration of the PVA solution, showing a linear positive correlation when the soaking time is constant, regardless of whether it is RB or RC. Additionally, with a consistent PVA solution concentration, as the soaking duration extends, the apparent densities of both RB and RC could also exhibit a growth trend that is linearly positively correlated. Notably, under the identical conditions of PVA solution concentration and soaking time, the apparent density increase of RC is more pronounced than that of RB before modification.
(2)
The effect exerted by PVA modification on the water absorption of the recycled aggregate (Figure 3(b1,b2)):
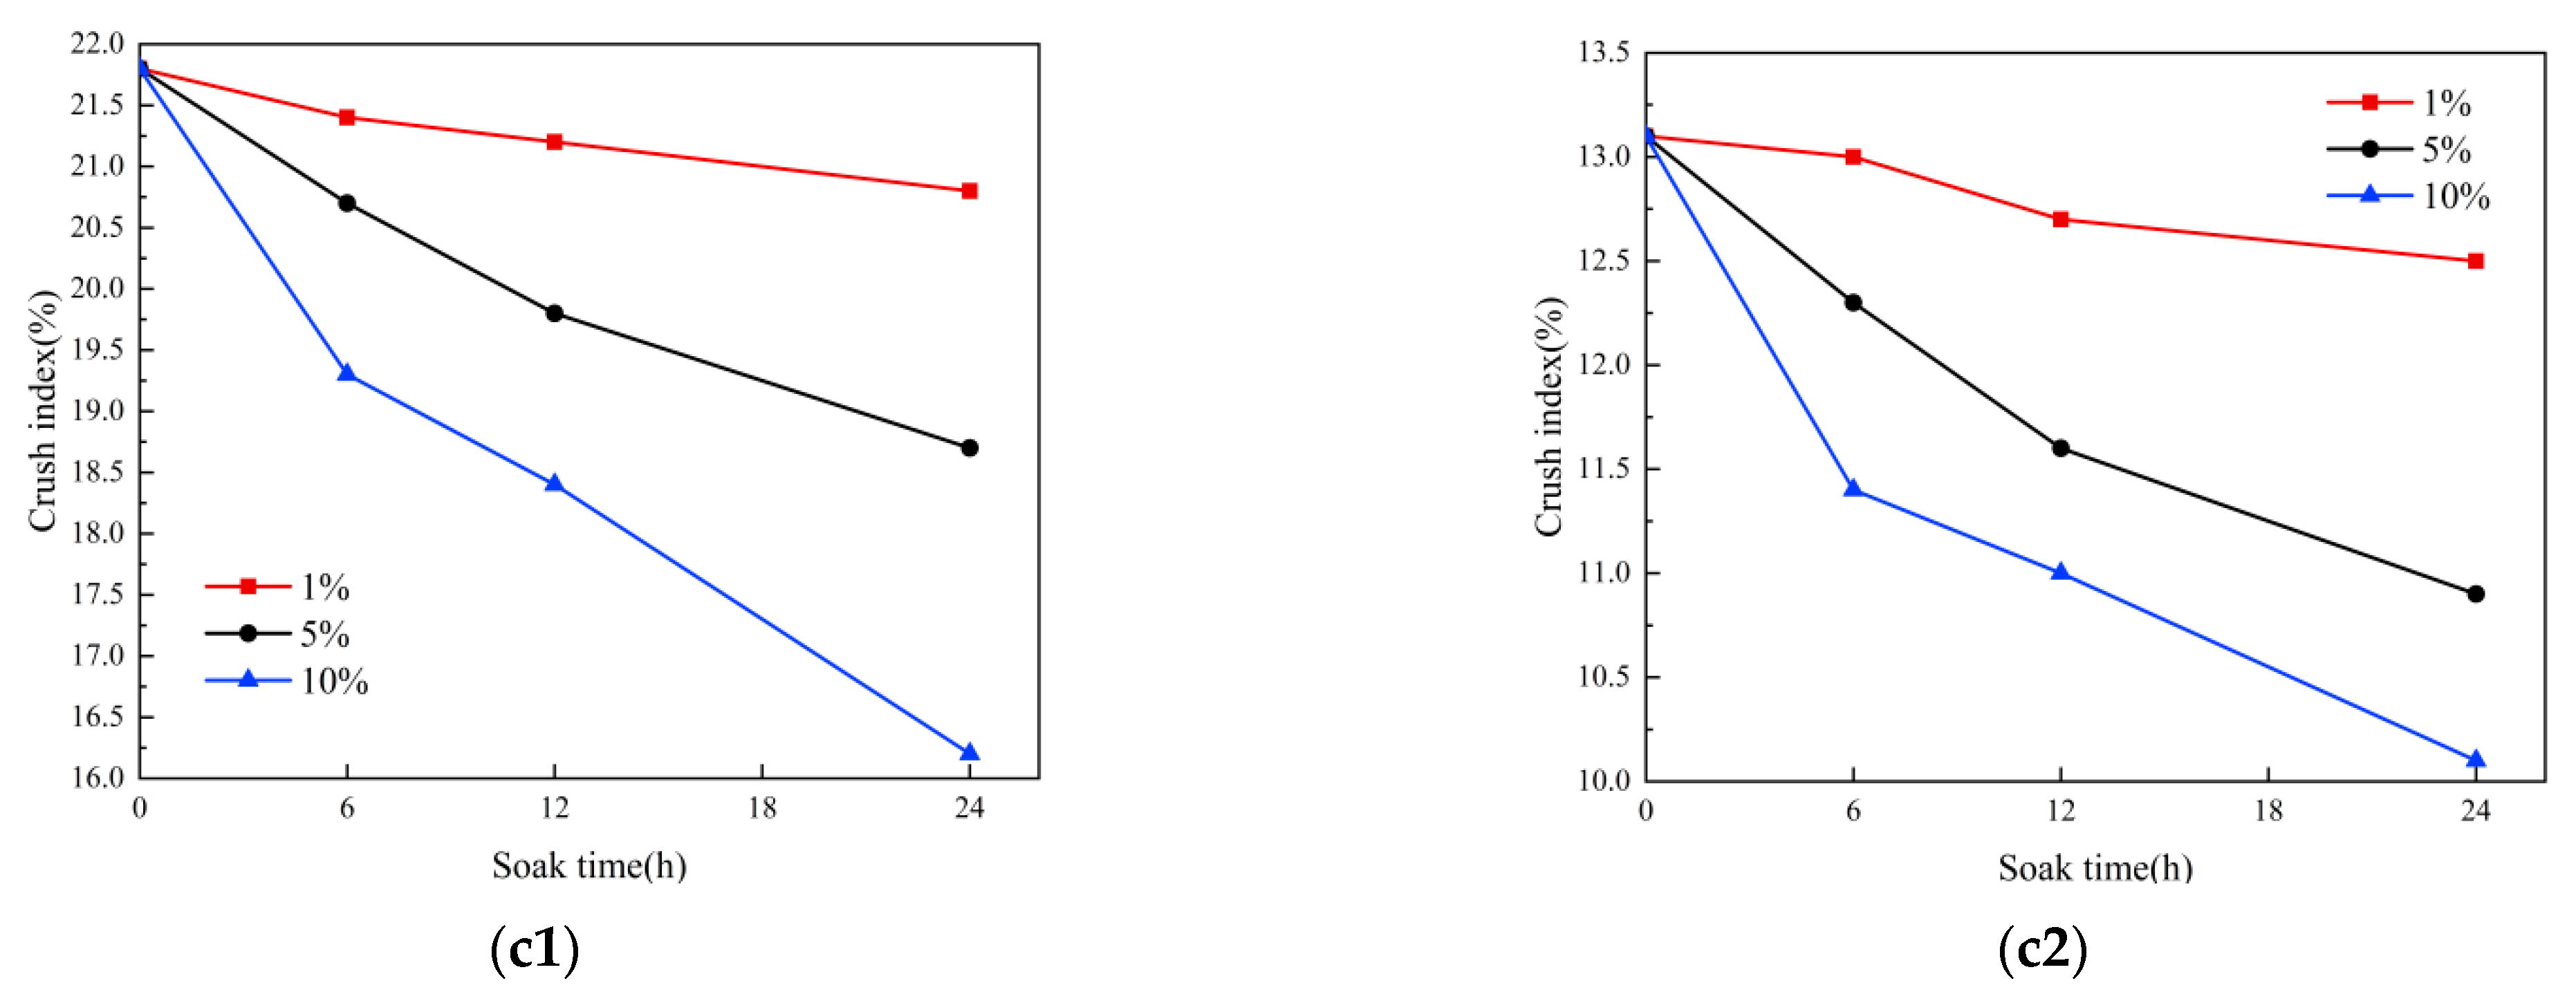
The initial water absorption rates of RB and RC are 21.7% and 6.4%, respectively. After a 6-h immersion in PVA solutions at concentrations of 1%, 5%, and 10%, the water absorption rates of RB decrease to 21.5%, 20.8%, and 20.3%, respectively, which correspond to 99.1%, 95.9%, and 93.5% of their pre-modification values. The water absorption rates of RC decrease to 6.2%, 6.0%, and 5.7%, respectively, which are 96.9%, 93.8%, and 89.1% of the pre-modification values. After a 12-h immersion, the water absorption rates of RB decrease to 21.3%, 20.4%, and 19.4%, representing 98.2%, 94.0%, and 89.4% of the initial values, respectively. For RC, the rates decrease to 5.9%, 5.6%, and 5.3%, which are 92.2%, 87.5%, and 82.8% of the initial values, respectively. Following a 24-h immersion in PVA solutions of 1%, 5%, and 10%, the water absorption rates of RB are 20.9%, 19.6%, and 18.9%, respectively. For RC, the rates are 5.7%, 5.2%, and 4.7%, which are 89.1%, 81.2%, and 73.4% of the pre-modification values, respectively.
As the soaking period extends, the water absorption rates of RB and RC decrease when the solution concentration remains the same. Furthermore, when the immersion time is constant, the water absorption of the recycled aggregates decreases as the soaking period lengthens, showing a linearly negative correlation. It is also evident that, under comparable PVA solution concentrations and soaking durations, RC exhibits better performance than RB in reducing the water absorption of the aggregates before modification.
(3)
The effect of PVA modification on the crushing index of recycled aggregate (Figure 3(c1,c2)):
The crushing indices of unmodified recycled brick aggregate (RB) and recycled concrete (RC) were 21.8% and 13.1%, respectively. After being immersed in PVA solutions at concentrations of 1%, 5%, and 10% for 6 h, the crushing indices of RB decreased to 21.4%, 20.7%, and 19.3%, respectively. These values represent 98.2%, 95.0%, and 88.5% of the original crushing indices. Similarly, the crushing indices of RC reduced to 13.0%, 12.3%, and 11.4%, accounting for 99.2%, 93.9%, and 87.0% of their values before modification. Following a 12-h soaking period in PVA solutions at the same concentrations, the crushing indices of RB were further reduced to 21.2%, 19.8%, and 18.4%, corresponding to 97.2%, 90.8%, and 84.4% of the pre-modification values. For RC, the crushing indices were 12.7%, 11.6%, and 11.0%, accounting for 96.9%, 88.5%, and 84.0% of the initial values, respectively. After a 24-h immersion in 1%, 5%, and 10% PVA solutions, the crushing indices of RB became 20.8%, 18.7%, and 16.2%, respectively, amounting to 95.4%, 85.8%, and 74.3% of the indices prior to modification. For RC, the indices after modification were 12.5%, 10.9%, and 10.1%, accounting for 95.4%, 83.2%, and 77.1% of the pre-modification values, respectively.
The crushing index for both RB and RC decreases as the concentration of the solution increases when the soaking duration is held constant. Conversely, when the solution concentration is constant, the crushing index shows a linear negative correlation with increasing soaking time.
Based on the findings presented in Figure 3 and the discussion above, it can be deduced that the optimal basic physical property indices for recycled aggregates are achieved after a 24-h soak in a 10% PVA solution. Consequently, the RB and RC subjected to this treatment were selected for subsequent experiments. Table 2 illustrates the variations in the physical properties of the aggregates before and after PVA modification. Figure 4 displays the changes in the apparent density, water absorption, and crushing index for both RC and RB after modification with the PVA solution.

2.5. Effect of Chemical Solution on Microstructure of Recycled Aggregate

The mechanism of PVA solution modification of recycled aggregate is shown in Figure 5. Combined with the 1000× and 10,000× local microscopic micrographs in Figure 6, it is clear that the surface of the unmodified RB was uneven, composed of lumps of varying sizes piled atop one another with numerous large pores, and there were also several microcracks. These large pores and cracks were major contributors to the high water absorption and high crushing index of RB. In contrast, the surface of the unmodified RC was relatively smooth compared to RB, with fewer macropores, a distribution of smaller pores, and no obvious microcracks observed. The surface of RC was denser than that of RB, making it more difficult for water to penetrate the interior of the aggregate. From a microstructural standpoint, this explains why the water absorption of the unmodified RC is significantly less than that of RB and why its crushing index is lower than RB’s. The unmodified energy spectrum reveals that the primary elements of RB and RC include C, O, Fe, Na, Mg, Al, Si, and Ca. These are consistent with the mineral composition analysis of recycled aggregate in Section 2.1, confirming that the main mineral components of RB are quartz (SiO2), anorthite (Ca(Al2Si2O8), albite (Na(AlSi3O8)), and calcite (CaCO3). The main mineral composition of RC is essentially the same as RB’s, with the addition of lime (Ca(OH)2), which can support the analysis of the PVA solution’s modification mechanism.
After modification with the PVA solution, the surface of RB remained uneven, with some pores still visible. Compared to its unmodified state, the aggregate’s surface was coated with a film layer although the encapsulation was incomplete, potentially due to the aggregate’s inherent morphology. The surface density of the PVA-modified RC was higher, with the plane essentially covered by the film, yet some pores were present.
Through Figure 7, it can be observed that the internal pores of the unmodified RB and RC were abundant but were significantly reduced after the PVA solution modification. The reason for this is that when RB and RC are immersed in the PVA solution, the solution can enter the aggregates through surface pores and microcracks. Once the PVA solution has penetrated the recycled aggregate, the resultant PVA film can also fill its internal pores. This indicates that the PVA solution modification can fill not only the surface pores and microcracks of the aggregate but also effectively optimize the internal pore structures within both RB and RC.
From Table 3, it can be observed that the mass percentages of the carbon (C) element at EDS1, EDS2, and EDS3 of the unmodified recycled brick aggregate (RB) were 30.20%, 29.02%, and 19.56%, respectively. In contrast, the mass percentages of the C element at EDS1, EDS2, and EDS3 of the RB modified by PVA solution were 65.32%, 60.30%, and 41.31%, respectively. It is evident that the content of the C element after modification was significantly higher than before modification, given that the chemical formula of PVA is [C2H4O]n. The analysis above demonstrates that PVA forms a film on the surface of RB, which not only repairs the microcracks in RB but also fills some pores, effectively improving the quality of RB. Table 3 and Figure 6 clearly show that the mass percentages of the C element at EDS1, EDS2, and EDS3 of the PVA solution-modified recycled concrete aggregate (RC) were 29.57%, 48.58%, and 52.33%, respectively, while the mass percentages of the C element at EDS1, EDS2, and EDS3 of the unmodified RC were 12.47%, 15.02%, and 13.91%, respectively. The increase in the mass percentage of the C element after modification is substantial. The modification mechanism of PVA on RC is similar to that on RB: it creates a layer of PVA film on the exterior of the aggregate to fill the pores and microcracks. The PVA film effectively wraps around RC, thereby improving the fundamental physical properties of the recycled aggregate enhanced by the PVA solution. After the PVA solution penetrates the recycled aggregate, the resulting PVA film also fills its internal pores. This indicates that after modification with the PVA solutions, not only are the pores and microcracks on the surface of the aggregate filled, but the internal pore structures within RB and RC are also effectively optimized.

3. Analysis of Basic Mechanical Properties of Modified Recycled Brick Aggregate Concrete

3.1. Raw Materials

The test selected PO42.5R ordinary Portland cement produced by Shaanxi Qinling Cement Co., Ltd. in Xi'an City, Shaanxi Province, China. The density is 3.15 g/cm3, and its physical performance index is shown in Table 4. The fine aggregate used in this experiment is river sand. According to GB/T14684-2011 «Sand for building» [28], the particle classification of river sand was detected as shown in Figure 8. The material test found that the fine aggregate selected for the test is Ⅱ zone sand, and its quality basically meets the specification requirements; the fineness modulus of river sand is 2.8, and the apparent density is 2610 kg/m3. The particle size of ordinary gravel is 5~25 mm, mixed gradation; the apparent density is 2870 kg/m3 and the crushing index is 6%. According to GB/T 14685-2022 «Pebble and crushed stone for construction» [25], the coarse aggregate is natural gravel and recycled aggregate. The water used is ordinary tap water. The polycarboxylate liquid high-performance water reducer with a water reduction rate of 25% was produced by Shanxi Qinfen Building Materials Co., Ltd. in Xi'an City, Shaanxi Province, China.

3.2. Mixing Proportion Design

To acquire more information about the influence of brick–concrete ratio on the mechanical properties of recycled brick aggregate concrete, this experiment selected the unmodified recycled aggregate RB and RC, and the RB and RC were immersed in 10% PVA solution for 24 h to prepare the concrete. According to the previous research results of the research group, the mass substitution rate of recycled aggregate was determined to be 30%, in which the brick-concrete ratios were 0:1, 3:7, 1:1, 7:3, 1:0; the water-cement ratio was 0.45; and the sand ratio was 0.35. Five groups of mix ratios in all were created, and the mix proportion design was carried out with C30 ordinary concrete as the strength benchmark. RAC and P-RAC represent the concrete prepared by the untreated and PVA-modified recycled aggregate, respectively. Recipes of the concrete are displayed in Table 5.

3.3. Specimen Preparation

We conducted compressive strength testing and splitting tensile strength tests using concrete specimens measuring 100 mm × 100 mm × 100 mm. Concrete specimens measuring 100 × 100 × 400 mm were used for the bending strength test. For every mix proportion, nine specimens were created, including three 100 × 100 × 400 mm specimens and six 100 mm × 100 mm × 100 mm specimens. A total of 90 specimens were made and cured for a 28-day period based on the GB/T50081-2002 “Ordinary concrete mechanical performance test method standard” [29] and JGJ/T443-2018 “Recycled concrete structure technical standard” [30].

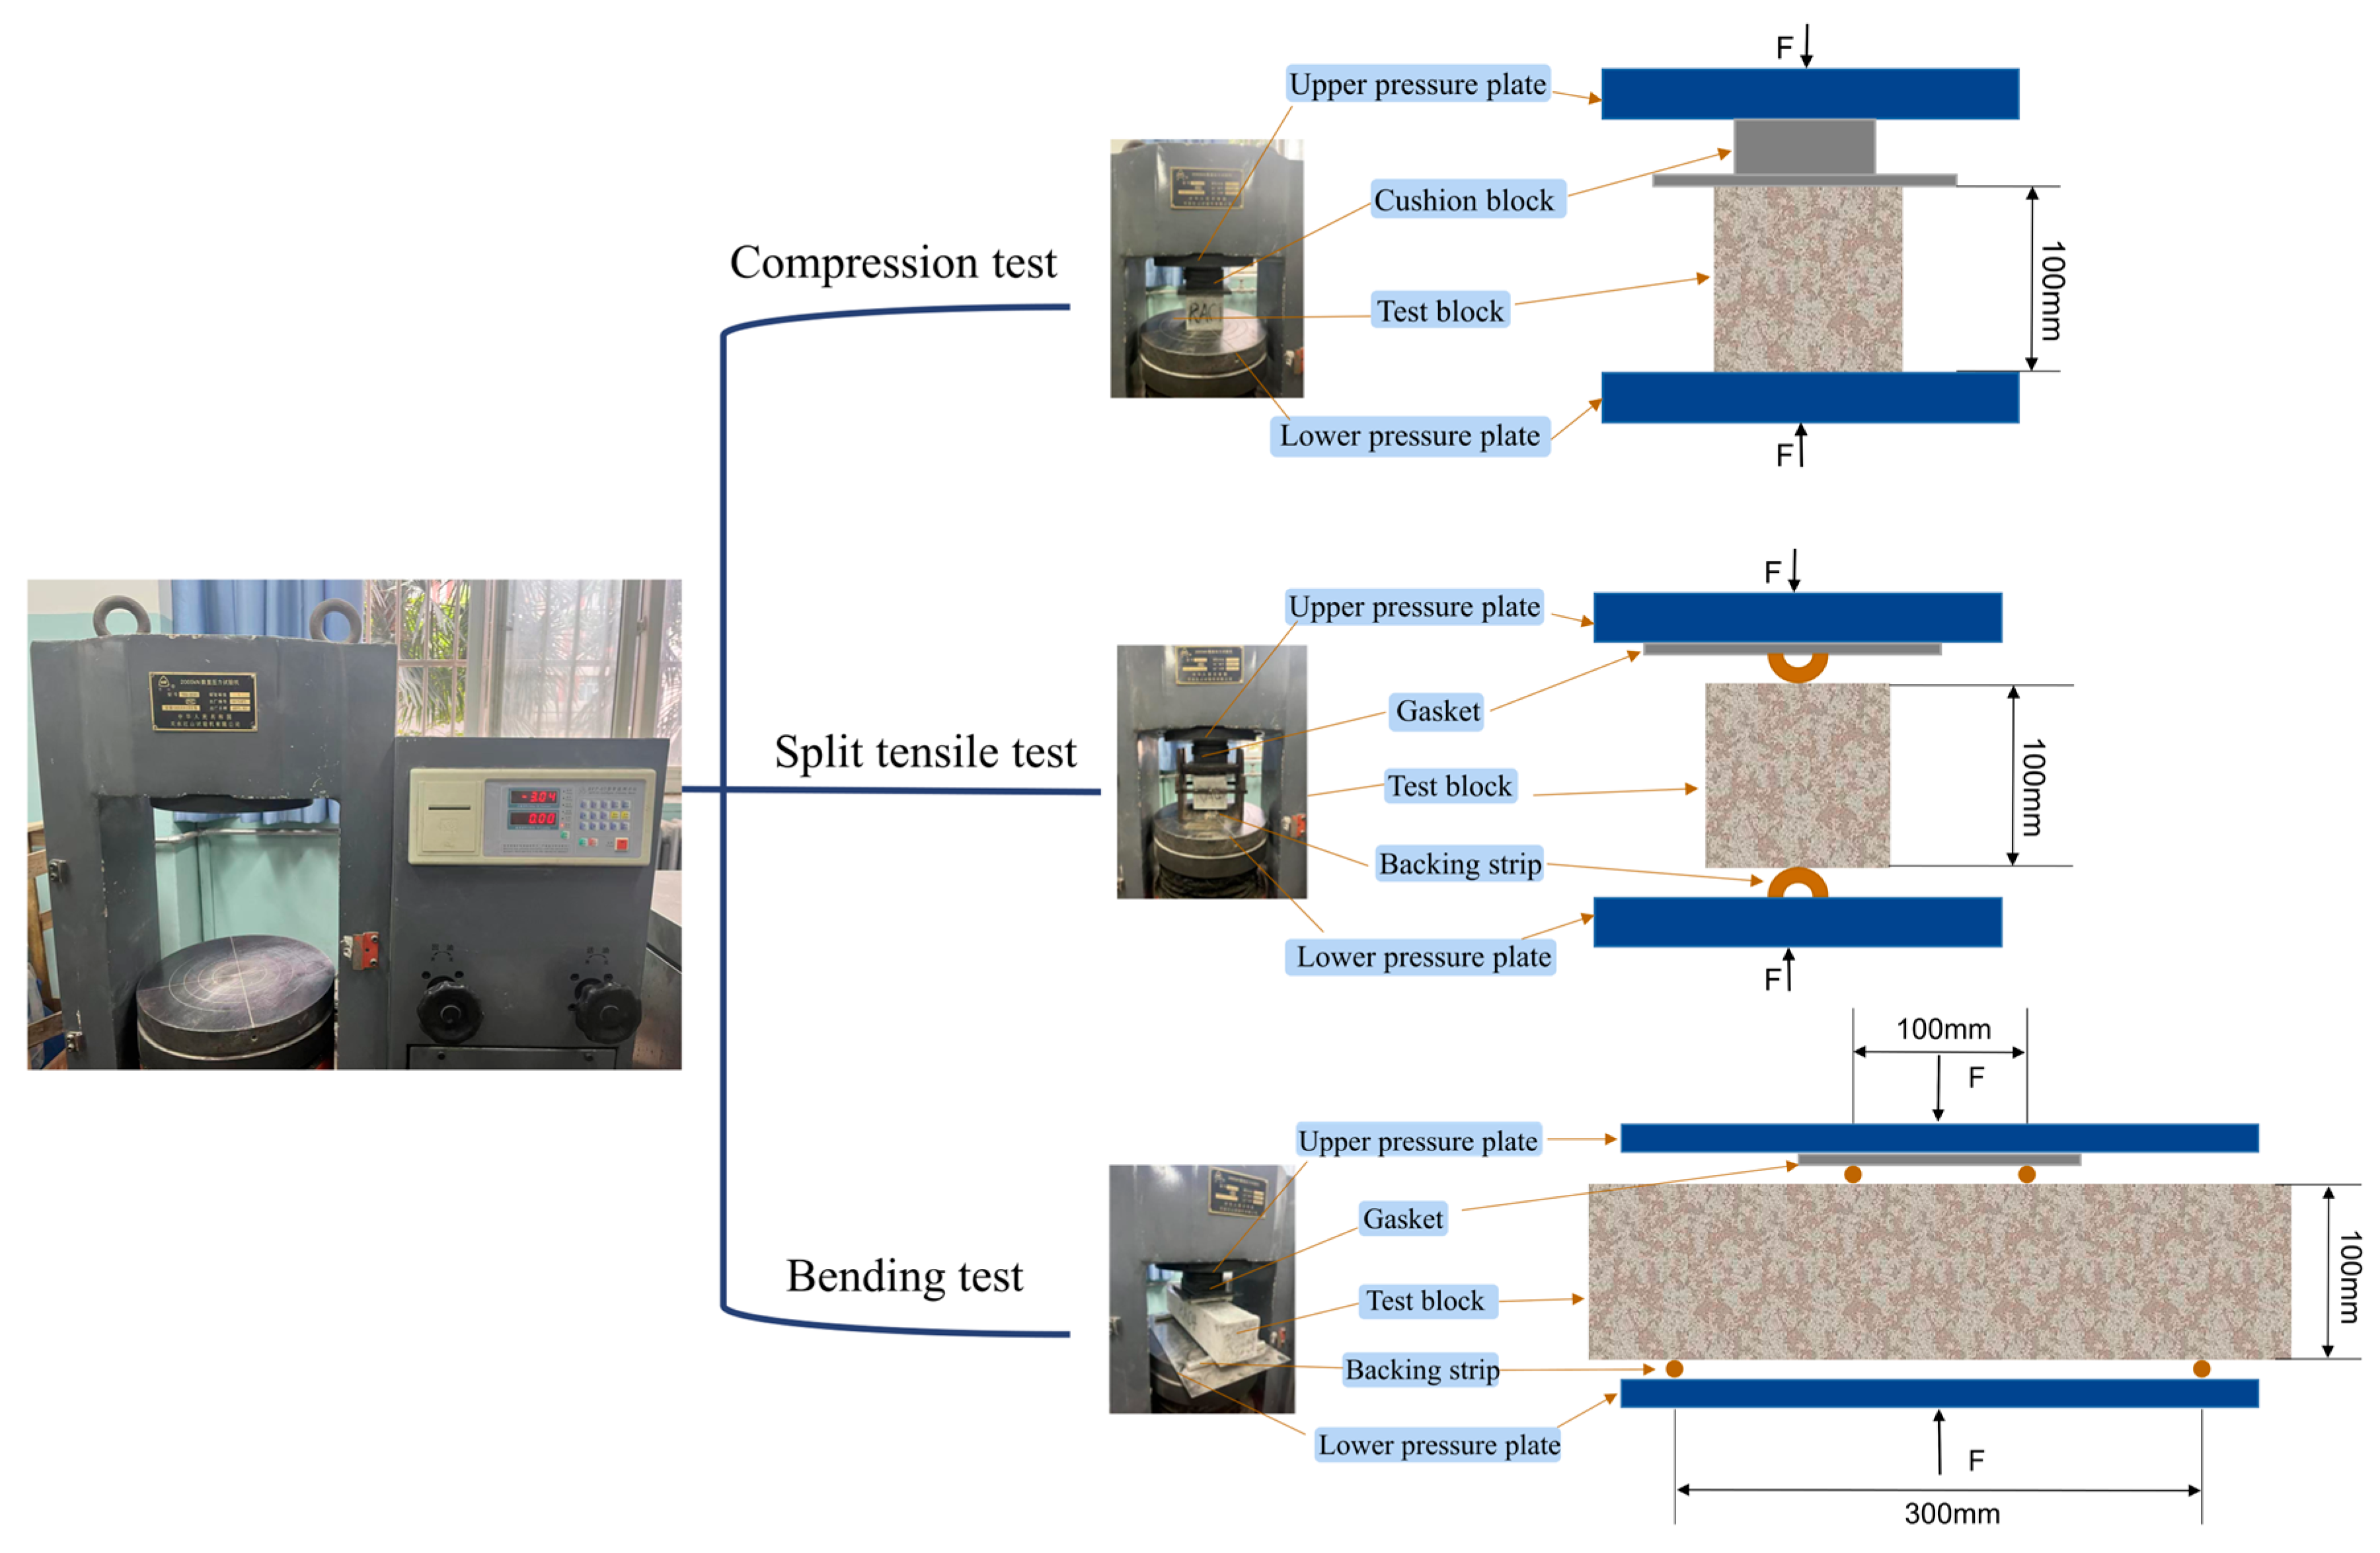
3.4. Mechanical Strength Test

According to the GB/T50081-2019 “Standard for Testing Methods of Physical and Mechanical Properties of Concrete” [31], the TYA-2000 digital display press was used to test the mechanical strength specimens’ bending strength, splitting tensile strength and compressive strength according to the schematic diagram in Figure 9 devices; the loading rate of the compressive strength test is 0.5–0.8 MPa/s, the loading rate of the bending strength test is 0.05–0.08 MPa/s, and the loading rate of the splitting tensile strength test is 0.05–0.08 MPa/s.

3.4.1. Compression Test

From Figure 10, it is readily apparent that the cube compressive strength of both the unmodified and the PVA solution-modified RAC initially increased and then decreased as the brick-concrete ratio increased. At a brick-concrete aggregate ratio of 1:1, the compressive strength reaches its peak, recording 39.3 MPa for unmodified and 44.2 MPa for PVA solution-modified samples, respectively. The compressive strength at the brick-concrete ratio of 0:1 was lower than that at the ratio of 1:0 when both the RB and RC were unmodified, for the following reasons: Both RB and RC contained microcracks and pores internally, and the RB used in this test was graded continuously from 5 to 25 mm, while the RC was graded from 5 to 31.5 mm, indicating that the grain size of RC is more substantial. Generally, the larger the aggregate grain size, the more likely it is to cause defects. During the concrete mixing process, the aggregate with the larger particle size tends to sink faster due to its greater weight, which leads to reduced homogeneity of the concrete and thus affects its strength performance. PVA, a water-soluble polymer, when integrated into the recycled aggregate, fills the pores and micro-cracks and forms a water-repellent film within it. The test results and analysis show that the PVA solution has a more significant modifying effect on RC than on RB. After modification with the PVA solution, the compressive strength of RAC improves significantly compared to its unmodified state. Across different brick-concrete ratios, the compressive strength of the PVA-modified concrete increased by 11.2%, 10.4%, 12.5%, 6.0%, and 1.0%, respectively. This indicates that the quality of the aggregate significantly affects the concrete’s compressive strength. The modification treatment effectively enhanced RAC’s compressive strength, and the PVA solution method demonstrated a notable improvement effect. The most considerable increase was observed at a brick–concrete ratio of 1:1, which was 12.5%, and the smallest at a ratio of 1:0, which was 1.0%.

3.4.2. Bending Test

As can be observed from Figure 11, as the brick-concrete ratio increased, the bending strength of both the unmodified and the PVA solution-modified RAC rose at first but then declined. At a brick-concrete aggregate ratio of 1:1, the bending strength reached its maximum, which was 5.2 MPa for the unmodified and 5.6 MPa for the PVA solution-modified samples, respectively. The bending strength at a brick-concrete ratio of 0:1 was lower than that at a ratio of 1:0 both before and after modification, and before and after the modification, the former is lower than the latter by 0.6 MPa. This is attributed to the lower density of RB compared to RC, which results in a looser structure in RB. During the bending test, the internal pores of RB provided a certain space for deformation. Compared with the unmodified RAC, the bending strength of the PVA-solution-modified RAC increased by 4.8%, 8.3%, 7.7%, 10.2%, and 4.2%, respectively, as the brick–concrete ratio increased. The RAC treated with the PVA solution exhibited better bending strength than its unmodified counterpart. The most substantial increase was observed at a brick–concrete ratio of 7:3, which was 10.2%. At a brick-concrete ratio of 1:0, the increase was, at the least, at 4.2%.

3.4.3. Splitting Tensile Test

As seen in Figure 12, the splitting tensile strength of both the unmodified and the PVA-modified RAC initially increased and then decreased as the brick-concrete ratio rose. When the brick–concrete aggregate ratio was 1:1, the splitting tensile strength reached its maximum values of 3.24 MPa and 3.85 MPa, respectively. Before modification, the splitting tensile strength at a brick–concrete ratio of 0:1 was 0.49 MPa lower than at a ratio of 1:0. After modification with the PVA solution, the difference between the two narrowed to within 0.2 MPa. In comparison to the unmodified RAC, the splitting tensile strength of the RAC modified with the PVA solution increased by 49.0%, 7.6%, 18.8%, 25.3%, and 16.6%, respectively, as the brick–concrete ratio increased. It is evident that RAC treated with the PVA solution exhibited a stronger splitting tensile strength than the unmodified RAC. With a brick-concrete ratio of 0:1, an increase of 49.0% was observed compared to the other ratios, and with a ratio of 3:7, an increase of 7.6% was noted. With the exception of the 3:7 ratio, the other ratios demonstrated more substantial modification effects.

4. Analysis of Modification Mechanism of Recycled Brick-Concrete Aggregate Concrete

4.1. Test Method

4.1.1. Nuclear Magnetic Test

The primary steps of a NMR test are as follows:
(1)
Cylindrical specimens with a diameter of 100 mm and a height of 50 mm are prepared by sampling from the cured test blocks using a core drilling tool (see Figure 13a).
(2)
The specimens are placed in a concrete vacuum water retention machine for 8 h of vacuum water retention. Typically, the vacuum pressure is set to 0.1 MPa. Subsequently, the test block is immersed in distilled water for 24 h to ensure complete saturation.
(3)
Prior to the NMR analysis test (Figure 13b), the surface water on the test block is wiped off, and the specimen is covered with cling film to prevent water loss, which could affect the accuracy of the test signal. The specimen is then positioned in the NMR radio frequency detection signal coil, and the NMR relaxation measurement is carried out using the MacroMR12-150H-I NMR analysis system.
(4)
The software of the analytical instrument inverts the NMR data, and post-processing is conducted to obtain relevant data such as the T2 relaxation time to analyze the pore structure properties of the aggregate concrete made from recycled bricks.

4.1.2. Scanning Electron Microscope Test

In this experiment, the FEI Nova NanoSEM 450 field emission environmental scanning electron microscope is utilized to observe the morphological characteristics of the hydration products in concrete after 28 days. Following the compressive strength test, the test blocks were broken into small pieces. Flake specimens with diameters of 5–10 mm and thicknesses of 1–2 mm were selected for analysis, using the same processing and testing methods described in Section 2.3.2.

4.1.3. Microhardness Test

Microhardness reveals the resistance of a material to local plastic deformation from external forces. The Vickers hardness of the multiple ITZ of recycled brick-aggregate concrete before and after modification was tested using a microhardness tester. The mechanical properties of different interfaces and the width of the ITZ were quantitatively analyzed based on the Vickers hardness values. Figure 14 illustrates the distribution of the microhardness measurement points.

4.2. Analysis of Pore Structure of Recycled Brick Aggregate Concrete

4.2.1. The Principle of Nuclear Magnetic Resonance Testing Pore Structure

A magnetic field produced by the spin of a positively charged atomic nucleus is known as nuclear magnetism. Measureable signals can be produced by the interaction of the magnetic field generated by spin nuclear magnetism with the applied magnetic field [32,33,34]. A magnetic field can be produced by the hydrogen proton spin. The orientation of the proton’s magnetic axis is arbitrary in the absence of an external magnetic field. The hydrogen proton is brought back to its initial random state after the application of the external magnetic field. The T2 relaxation time can be calculated based on this method. It is evident that the quantity of 1H protons in the sample water molecules correlates with the overall T2 signal strength [35].
According to the principle of NMR, the relationship between the transverse relaxation time T2 and the pore state satisfies:
1 T 2 = 1 T 2 z + ρ 2 S V + D r G T E 2 12
where T 2 denotes the transverse relaxation time ( ms ); T 2 z is the free relaxation time of fluid ( ms ); ρ 2 is the transverse surface relaxation strength ( μ m / ms ); S is the pore surface area ( μ m 2 ); ( V ) denotes the pore volume ( μ m 3 ); D represents the diffusion coefficient; γ is the gyromagnetic ratio ( rad / ( S T ) ); G is the magnetic field strength ( G s / cm ); and T E is the echo time ( ms ).
For porous materials such as concrete, Formula (4) is simplified to Formula (5).
1 T 2 1 T 2 z = ρ 2 S V
It can be seen from Formula (5) that T 2 is related to the transverse surface relaxation strength ρ 2 and the surface volume ratio ( S / V ) of the hole, and S / V is related to the shape of the hole, so Formula (5) can be simulated as
r = ρ 2 F s T 2
The spherical pore is assigned a value of three and the columnar pore is assigned a value of two. In this paper, most of the concrete pores were spheres. Therefore, ρ 2 F s = 0.015   μ m / ms was used to establish the relationship between T 2 and r .

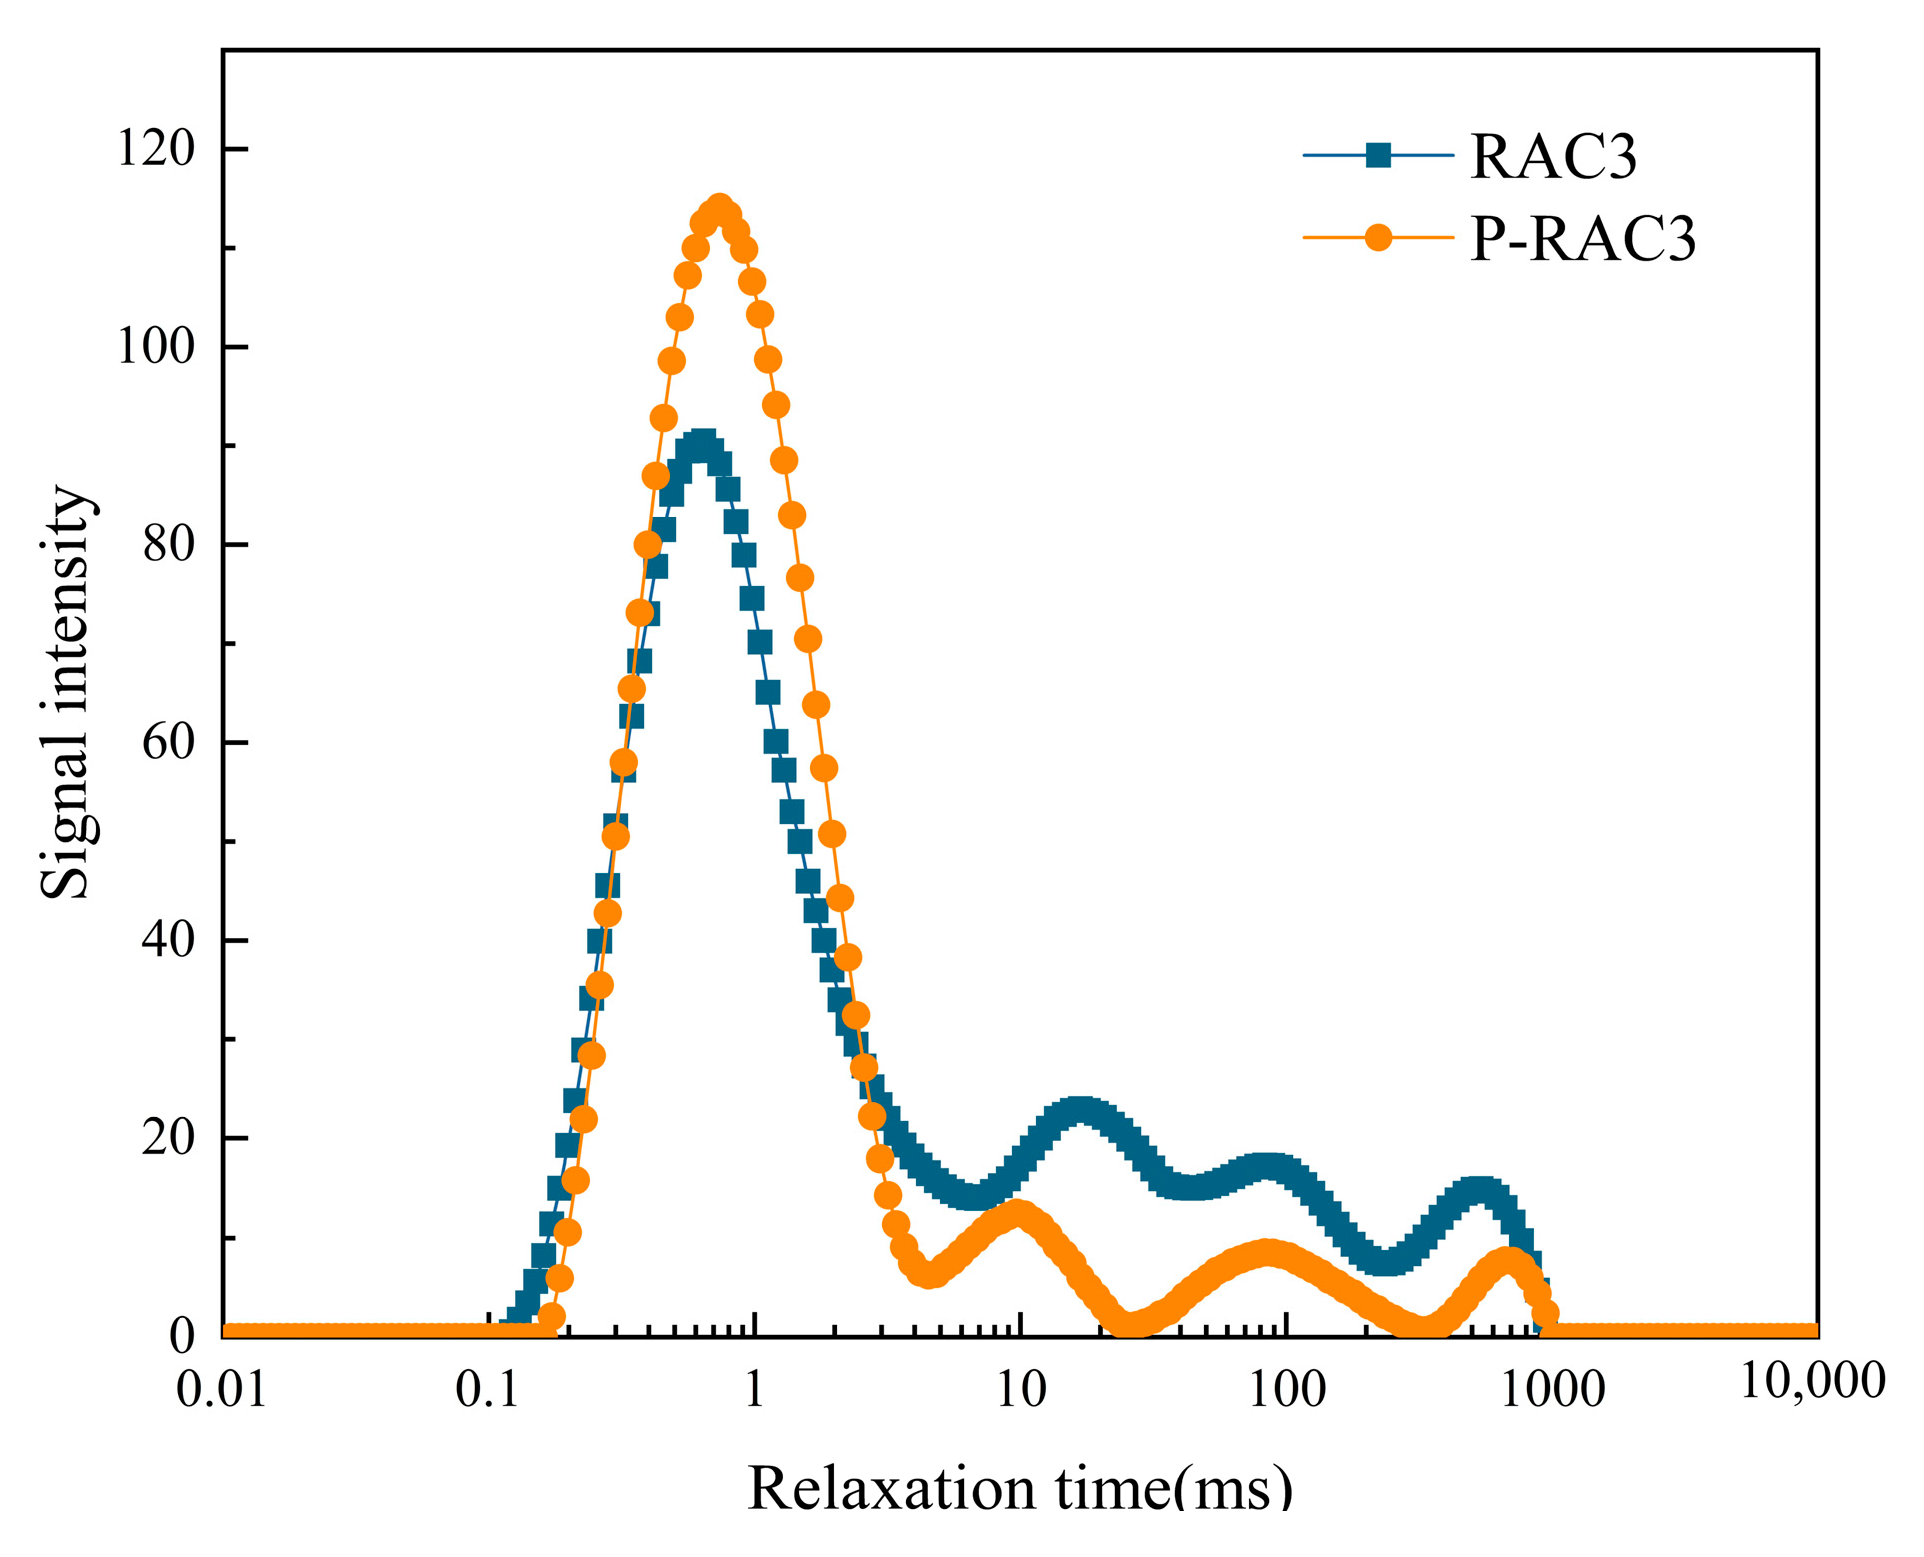
4.2.2. T2 Relaxation Spectrum

The internal pore structure properties of concrete, a typically porous material, depend on a variety of factors including porosity, pore size distribution, pore grade proportion, and spatial distribution [36,37,38]. The aforementioned variables significantly influence the performance of concrete at the macroscopic level. To investigate the modification mechanism of the recycled brick-aggregate concrete, the pore structure characteristics of RAC3 and P-RAC3 were examined, comparing and analyzing the effects of various modification methods on pore size distribution and pore grade proportion.
Based on the test principle of nuclear magnetic resonance, it is known that the relaxation time T2 is proportional to the pore size; that is, the smaller the T2, the smaller the pore [39]. Additionally, by measuring the area of the signal peak, the level of the corresponding pore size can be quantitatively characterized. Nuclear magnetic resonance testing reveals the correlation between T2 relaxation time and signal intensity for specimens modified using various aggregate techniques (Figure 15). Table 6 displays the peak area of the T2 relaxation spectrum. From the chart, it is evident that the peak area of P-RAC3 was smaller than that of RAC3, and the first peak value was higher than that of RAC3. Each group of specimens showed four relaxation peaks, with the proportion of the first peak to the fourth peak gradually decreasing. The proportion of the first peak of P-RAC3 was higher than that of RAC3, and compared to RAC3, the proportions of the second, third, and fourth peaks were smaller. This indicates that the two aggregate modification techniques can effectively improve the material’s pore structure, which is one of the primary factors contributing to the material’s improved mechanical properties after modification.

4.2.3. Pore Size Distribution and Pore Level Ratio

Pores in concrete can be divided into four categories according to their sizes: gel pores (<0.01 μm), transition pores (0.01–0.1 μm), capillary pores (0.1–1 μm), and macropores (>1 μm) [40]. The mechanical properties of concrete are significantly influenced by the concrete’s pore gradation. Therefore, achieving an optimal pore gradation in concrete is essential to ensure its good mechanical properties.
The distribution of pore sizes in RAC modified by PVA solution is illustrated in Figure 16, reflecting the proportionate relationship between pore radius and T2. The diagram shows that the unmodified group’s pores ranged in size from 0.003 to 18.4 μm; 9.629% were gel pores, the proportion of transition pores was 56.125%, capillary pores made up 16.920%, and macropores constituted 17.326%. In the PVA solution-modified group, the pore size distribution was between 0.005–28.4 μm; the proportion of gel pores was 8.114%, transition pores accounted for 77.163%, capillary pores constituted 7.372%, and macropores accounted for 7.352%. The proportions of gel pores, capillary pores, and macropores decreased compared to those before modification, with a slight decrease in gel pores and a significant increase in transition pores. This indicates that the PVA solution modification primarily enhances the mechanical properties of the recycled brick-aggregate concrete (RAC) by increasing the proportion of transition pores and decreasing the proportion of macropores. The larger proportion of transition pores and the smaller proportion of macropores in the PVA solution-modified group result in better mechanical properties of RAC.
To further investigate the impact of different pore sizes on the mechanical properties of RAC before and after modification and to classify the pore structure, academician Zhongwei Wu [41] proposed a classification method for different pore size classes in concrete. This method is based on the effects of different pore sizes on the concrete’s properties, classifying them into harmless pores (pore size < 20 nm), less harmful pores (pore size between 20 and 50 nm), harmful pores (pore size between 50–200 nm), and very harmful pores (pore size > 200 nm). According to this classification, the pore levels of specimens with different aggregate modifications are illustrated in Figure 17.
As shown in Figure 17, the proportion of harmless and less harmful pores in the unmodified group was relatively low, at 32.02% and 25.03%, respectively. Harmful and very harmful pores accounted for a larger proportion, at 13.31% and 29.04%, respectively. In contrast, the PVA solution-modified group possessed a higher percentage of harmless and less harmful pores, at 35.89% and 38.37%, respectively, while the proportion of harmful and very harmful pores was relatively smaller, at 13.40% and 12.34%, respectively. Compared to the unmodified group, the proportion of harmless pores in the PVA solution-modified group increased by 3.87%, and the proportion of less harmful pores increased by 13.34%. The percentage of very harmful pores decreased by 17.30%. The percentage of harmful pores in both the PVA solution-modified group, and the unmodified group was nearly the same. This demonstrates that the pore gradation of RAC modified with the PVA solution is superior to that of the unmodified group, confirming the effectiveness of the modification.

4.3. Micro-Morphology Analysis of Recycled Brick-Concrete Aggregate Concrete

The cement mortar and aggregate in concrete possess distinct physical and chemical properties, which, during the concrete preparation process, lead to a pronounced interface effect at their junction. This creates an area known as the ITZ. The strength of the ITZ is typically much lower as compared to the strength of the aggregate and the cement mortar itself, making it a weak link in concrete. Figure 18 presents the SEM image of the ITZ between RB and cement mortar, while Figure 19 shows the ITZ between RC and cement mortar.
Figure 18a and Figure 19a show that the ITZ formed by the unmodified RB, RC, and cement mortar contained continuous cracks that were relatively wide. Moreover, the crack width at the ITZ formed by RB and cement mortar was larger than that formed by RC and cement mortar. Additionally, very noticeable cracks were present on the edge of RC.
Figure 18b,c and Figure 19b,c reveal that the ITZ formed by RB, RC, and cement mortar, when modified by the PVA solution, showed hardly any cracks or pores, with the entire ITZ filled and encapsulated. This is attributed to the aggregates being coated with a PVA film after modification. When these aggregates were used to prepare the test blocks, the cement’s hydration process gradually consumes water, while the polymer forms a continuous network structure. The polymer’s unique adhesive properties enable this network to bond with the cement hydration products, creating a solid coating structure. Additionally, the interpenetration of the cement hydration products and the polymer films enhances the structural morphology of the ITZ in recycled brick aggregate concrete. Consequently, the modification with the PVA solution leads to improved mechanical properties of the concrete.

4.4. Microhardness Analysis of Interfacial Transition Zone of Recycled Brick-Concrete Aggregate Concrete

The thickness of the ITZ is a crucial index for evaluating the performance of cement-based composites. To accurately characterize the microscopic features of the ITZ, precise measurement of its thickness is necessary. However, factors such as the flatness of the sample surface, cement mortar particles, and micro-surface defects may impact the test results. Therefore, 50 random points were labelled in both the new and old mortar matrix areas to evaluate their microhardness values, and the box statistical diagram method was utilized to calculate the standard area value of the mortar matrix’s microhardness. This value helps in determining the interface between the ITZ and the mortar matrix.
During hydration, cement gradually consumes water, while the polymer forms a continuous network structure. The unique adhesion of the polymer allows it to bond with the cement hydration products, forming a hard coating structure. Simultaneously, the interpenetration between the cement hydration products and polymer films enhances the structural morphology of the ITZ in recycled brick-aggregate concrete. Figure 20 displays the box statistics of the microhardness values for the mortar matrix area of both the unmodified and the PVA solution-modified specimens. Two samples were taken from each specimen. The first sample included the RC wrapped with old mortar. Here, 50 random points were labelled in the new and old mortar matrix areas to determine the standard area values, and the variation in microhardness values between RC and old mortar, as well as between RC and new mortar and between old and new mortar areas, was analyzed. The second sample contained RB. In the new mortar matrix area, 50 random points were labelled to determine the standard area values, and the variation in microhardness values between RB and new mortar areas was studied.
Before and after modification, the microhardness value of RC and the old mortar area is shown in Figure 21, the microhardness value of RC and the new mortar area is shown in Figure 22, the microhardness value of old mortar and the new mortar area is shown in Figure 23, and the microhardness value of RB and the new mortar area is shown in Figure 24.
Figure 21 shows the microhardness values from the edge of RC to the old mortar matrix, indicating a decrease followed by an increase. The thickness of the ITZ remains relatively unchanged after modification, likely because the old mortar’s thickness is significant, and the PVA solution does not penetrate the junction between RC and the old mortar effectively.
Figure 22 reveals that the microhardness value from the edge of RC to the new mortar matrix also showed an initial decrease followed by an increase. The highest microhardness value was found at −40 μm to 0, corresponding to the edge of RC. The PVA solution-modified specimen’s microhardness value at −40 μm to 0 was slightly higher than that of the unmodified specimen. The ITZ thickness between RC and the new mortar was 71.3 μm, which reduced to 54.2 μm after modification with the PVA solution.
According to Figure 23, the microhardness values of the old and new mortar matrices were relatively similar. When measured from −40 μm to −10 μm, the microhardness value of the old mortar modified by the PVA solution was higher than that of the unmodified mortar. Within the range of −40 μm to 120 mm, the microhardness value decreased initially and then increased. The ITZ thickness between the old and new mortar was 85.7 μm when unmodified. After modification with the PVA solution, this thickness reduced to 72.7 μm.
Figure 24 indicates that the microhardness at the edge of the brick aggregate before and after modification was lower than the microhardness of the mortar matrix area. When unmodified, the ITZ thickness between RB and the new mortar was 72.7 μm. After modification with a PVA solution, the ITZ thickness was reduced to 59.3 μm.
Upon analysis, the microhardness values for the RC and the old mortar area, RC and the new mortar area, and the old mortar and new mortar area all showed a trend of decreasing first and then increasing throughout the entire test range. Modification with a PVA solution can effectively reduce the ITZ thickness between RC and the new mortar, the old mortar and new mortar, and RB and the new mortar. The PVA solution modification successfully achieves the effect of reducing the ITZ thickness.

5. Conclusions

(1)
This method is most effective for modifying recycled brick aggregate and recycled concrete aggregate when the recycled aggregate is submerged in a 10% PVA solution for 24 h. This improves the quality of the aggregate and amends the aggregate’s inherent defects. It particularly reduces the rate at which the recycled aggregate significantly absorbs water. The water absorption rate of recycled brick aggregate is reduced by 12%, and the water absorption rate of recycled concrete aggregate is reduced by 27%.
(2)
The modification mechanism of the PVA solution on recycled brick aggregate and recycled concrete aggregate involves the formation of a PVA film on the surface of the recycled aggregate. This film not only repairs the microcracks of the recycled aggregate but also fills its pores. Furthermore, the PVA solution can penetrate the aggregate during soaking, effectively improving the internal pore structure of the recycled aggregate.
(3)
With an increase in the brick-concrete ratio, the compressive strength, bending strength, and splitting tensile strength of unmodified and PVA solution-modified RAC initially increase and then decrease, peaking when the brick–concrete ratio is 1:1. The compressive strength increases most notably at a brick–concrete ratio of 1:1, the bending strength increases most at a 7:3 ratio, and the splitting tensile strength improves the most at a brick–concrete ratio of 0:1.
(4)
The goal of modification is to improve the mechanical properties of RAC by increasing the number of transition holes and decreasing the proportion of macropores. When the aggregate was modified with a PVA solution, the proportion of harmless and less harmful pores increased, while the proportion of harmful and very harmful pores decreased. This demonstrates that the PVA-solution modification process can effectively enhance the material’s pore structure.
(5)
Due to the unique adhesive properties of the polymer in PVA, the polymer network structure can bond with the cement hydration products to form a hard coating structure. Simultaneously, the mutual penetration between cement hydration products and polymer films enhances the structural morphology of the ITZ in recycled brick aggregate concrete.
(6)
PVA solution modification can effectively reduce the ITZ thickness between RC and new mortar, old mortar and new mortar, and RB and new mortar.

Author Contributions

Conceptualization, J.Q. and Y.Z.; methodology, Y.Z., Q.Q. and Z.X.; software, T.L. and Z.X.; validation, L.L., Y.Z. and J.Q.; formal analysis, Q.Q.; investigation, J.Q.; resources, J.Q.; data curation, Z.X.; writing—original draft preparation, Y.Z.; writing—review and editing, J.Q.; visualization, T.L.; supervision, L.L.; project administration, Q.Q.; funding acquisition, J.Q. All authors have read and agreed to the published version of the manuscript.

Funding

This research was funded by the Top Project of National Natural Science Foundation of China (No.42071100), Intermittent Failure Behavior of Strength of Frozen Soil-Stone Mixture Induced by Thermal Melting and Deterioration Mechanism of Pile Bearing Capacity, 2021/01-2024/12, National Natural Science Foundation of China and the Shaanxi Provincial Natural Science Foundation, Youth Project, 2018JQ5215, Study on the Microstructure and Performance Degradation of Recycled Concrete under Freeze-thaw Environment.

Institutional Review Board Statement

Not applicable.

Informed Consent Statement

Not applicable.

Data Availability Statement

The original contributions presented in the study are included in the article; further inquiries can be directed to the corresponding author.

Conflicts of Interest

The authors declare that they have no known competing financial interests or personal relationships that could have appeared to influence the work reported in this paper.

References

  1. Weizhong, F.; Yu, P.; Dan, W. Quantitative research on the policy of construction waste recycling under the background of “double carbon”. Constr. Econ. 2022, 43 (Suppl. S1), 562–565. [Google Scholar]
  2. Wang, Y.; Li, H.; Gou, W.; Shi, S. Research on the willingness to use construction waste recycling products in the context of non-waste cities. J. Arid. Land Resour. Environ. 2020, 34, 86–90. [Google Scholar]
  3. He, J.; Zhong, W.; Zhang, Y.; Zhang, S.; Ji, X. China’s Construction Waste Recycling Analysis Based on Material Flow and Whole Process Management. Environ. Eng. 2018, 36, 102–107. [Google Scholar]
  4. Gyurkó, Z.; Jankus, B.; Fenyvesi, O.; Nemes, R. Sustainable applications for utilization the construction waste of aerated concrete. J. Clean. Prod. 2019, 230, 430–444. [Google Scholar] [CrossRef]
  5. Xu, Z. Research on the current situation and countermeasures of construction waste resource management. Constr. Mater. Decor. 2018, 182. [Google Scholar] [CrossRef]
  6. Yao, W. Preparation and Properties of Recycled Concrete from Construction Waste. Master’s Thesis, Jilin University, Changchun, China, 2016. [Google Scholar]
  7. Li, Y. Experimental study on the preparation of high performance recycled concrete from construction waste. Fly Ash Compr. Util. 2013, 17–20. [Google Scholar] [CrossRef]
  8. Bai, B. Research and Application of Key Technologies of Construction Waste Recycled Concrete Structure System. Shanxi Province, Xi’an University of Architecture and Technology, Xi’an, China, 2012. Available online: https://kns.cnki.net/kcms2/article/abstract?v=4j1cDaxzFAl0ta73HHdhIrRL51z1uYeZiwkwbKE_ry6375yM2U_yV9dvxzY5NYAj4NvVWS-nmoeZTOzyc4dsPm1vDq5VaFd1oPewgStJd0is_tE5p3e7rjNTAW3MYnDR866SSShkOwrhqBhoKuj38A==&uniplatform=NZKPT&language=CHS (accessed on 17 October 2023).
  9. González, M.D.; Plaza Caballero, P.; Fernández, D.B.; Jordán Vidal, M.M.; Del Bosque, I.F.S.; Medina Martínez, C. The Design and Development of Recycled Concretes in a Circular Economy Using Mixed Construction and Demolition Waste. Materials 2021, 14, 4762. [Google Scholar] [CrossRef]
  10. Medina, C.; Zhu, W.; Howind, T.; Frías, M.; De Rojas, M.S. Effect of the constituents (asphalt, clay materials, floating particles and fines) of construction and demolition waste on the properties of recycled concretes. Constr. Build. Mater. 2015, 79, 22–23. [Google Scholar] [CrossRef]
  11. Xiao, J.; Li, J.; Lan, Y. The latest progress and review of recycled concrete technology. Concrete 2003, 10, 17–20. [Google Scholar]
  12. Chen, Y.; Cao, B. Development of recycled concrete at home and abroad. Foreign Build. Mater. Sci. Technol. 2004, 25, 4–6. [Google Scholar]
  13. Zhu, P.; Wang, X.; Zhou, J.; He, X. Green high performance recycled concrete research main progress and development trend. In Proceedings of the First National Recycled Concrete Research and Application of Academic Exchange, Shanghai, China, July 2008; pp. 106–116. [Google Scholar]
  14. Zhu, C.; Zhao, W.; Yu, W.; Liu, C. Basic mechanical properties and constitutive model of recycled brick-concrete aggregate concrete. Acta Mater. Compos. Sin. 2024, 41, 899–911. [Google Scholar] [CrossRef]
  15. Liu, C.; Yu, W.; Liu, H.; Hu, T.F.; Hu, H.M. Study on mechanical properties and failure mechanism of recycled brick aggregate concrete. Mater. Rep. 2021, 35, 13025–13031. [Google Scholar]
  16. Ye, W. Research and application prospects of recycled brick aggregate concrete. Brick Tile 2018, 35–36. [Google Scholar] [CrossRef]
  17. Yang, N.; Wang, C.; Zhao, M. Recycled aggregate strengthening technology research. New Build. Mater. 2011, 38, 45–47. [Google Scholar]
  18. Kou, S.C.; Poon, C.S. Properties of concrete prepared with PVA-impregnated recycled concrete aggregates. Cem. Concr. Compos. 2010, 32, 649–654. [Google Scholar] [CrossRef]
  19. Zhao, Z. Study on the Modification of Recycled Aggregate and the Preparation Process of Concrete; Jinan University: Jinan, China, 2013. [Google Scholar]
  20. Fan, X.; Xu, Y. Reinforcement test of recycled aggregate. Shanghai Build. Mater. 2005, 22–23. [Google Scholar] [CrossRef]
  21. Du, T.; Li, H.; Wu, X. Experimental study on strengthening recycled aggregate concrete. New Build. Mater. 2002, 6–8. [Google Scholar] [CrossRef]
  22. Fan, Y.; Niu, H.; Zhang, X. Experimental study on nano-SiO2 modified recycled concrete. Concrete 2017, 92–95. [Google Scholar] [CrossRef]
  23. Zhang, J.; Chen, P.; Xu, H.; Ma, M.; Tao, H. Experimental study on strengthening recycled aggregate based on microbial mineralization deposition. J. Zhejiang Sci. Tech Univ. Nat. Sci. 2020, 43, 122–129. [Google Scholar]
  24. GB/T 25177-2010; Recycled Coarse Aggregate for Concrete. National Standards of People's Republic of China: Beijing, China, 2011.
  25. GB/T 14685-2022; Pebble and Crushed Stone for Construction. National Standards of People's Republic of China: Beijing, China, 2022.
  26. Qiu, J.; Zhou, Y.; Guan, X.; Zhu, M. The influence of fly ash content on ITZ microstructure of coal gangue concrete. Constr. Build. Mater. 2021, 298, 123562. [Google Scholar] [CrossRef]
  27. Zhu, M.; Qiu, J.; Chen, J. Effect and mechanism of coal gangue concrete modification by basalt fiber. Constr. Build. Mater. 2022, 328, 126601. [Google Scholar] [CrossRef]
  28. GB/T 14684-2001; Sand for Building. China Construction Industry Press: Beijing, China, 2011.
  29. GB/T 50081-2002; Standard for Test Methods of Mechanical Properties of Ordinary Concrete. China Academy of Building Research: Beijing, China, 2003.
  30. JGJ/T 443-2018; Technical Standard for Recycled Concrete Structures. Beijing University of Technology: Beijing, China, 2018.
  31. GB/T 50081-2019; Standard for Test Methods of Concrete Physical and Mechanical Properties. National Standards of People's Republic of China: Beijing, China, 2019.
  32. Liu, T.; Wang, Y.; Zhou, K.; Gao, F.; Xie, S. Research on the mechanical properties and NMR characteristics of cement mortar during freeze-thaw cycles. Adv. Civ. Eng. 2019, 2019, 1–7. [Google Scholar] [CrossRef]
  33. Heijden, G.; Pel, L.; Adan, O. Fire spalling of concrete, as studied by NMR. Cem. Concr. Res. 2012, 42, 265–271. [Google Scholar] [CrossRef]
  34. Pop, A.; Badea, C.; Ardelean, I. The effects of different superplasticizers and water-to-cement ratios on the hydration of gray cement using T2-NMR. Appl. Magn. Reson. 2013, 44, 1223–1234. [Google Scholar] [CrossRef]
  35. Shen, Y.; Wang, Y.; Wei, X.; Jia, H.; Yan, R. Investigation on meso-debonding process of the sandstone–concrete interface induced by freeze–thaw cycles using NMR technology. Constr. Build. Mater. 2020, 252, 118962. [Google Scholar] [CrossRef]
  36. Zhou, Y.; Li, W.; Peng, Y.; Tang, S.; Wang, L.; Shi, Y.; Li, Y.; Wang, Y.; Geng, Z.; Wu, K. Hydration and fractal analysis on Low-heat Portland cement pastes by thermodynamic-based methods. Fractal Fract. 2023, 7, 606–633. [Google Scholar] [CrossRef]
  37. Peng, Y.; Tang, S.; Huang, J.; Tang, C.; Wang, L.; Liu, Y. Fractal analysis on pore structure and modeling of hydration of magnesium phosphate cement paste. Fractal Fract. 2022, 6, 337–355. [Google Scholar] [CrossRef]
  38. Li, Y.; Zhang, H.; Huang, M.; Yin, H.; Jiang, K.; Xiao, K.; Tang, S. Influence of different alkali sulfates on the shrinkage, hydration, pore structure, fractal dimension and microstructure of low-heat Portland cement, medium-heat Portland cement and ordinary Portland cement. Fractal Fract. 2021, 5, 79–106. [Google Scholar] [CrossRef]
  39. Xiong, H.; Yuan, K.; Wen, M.; Yu, A.; Xu, J. Influence of pore structure on the moisture transport property of external thermal insulation composite system as studied by NMR. Constr. Build. Mater. 2019, 228, 116815. [Google Scholar] [CrossRef]
  40. Lu, Y. Effect of Ultra-Fine Fly Ash on Mechanical Properties and Microstructure of Cement-Based Materials. Master's Thesis, Chang’an University, Xi’an, China, 2022. [Google Scholar]
  41. Wu, Z. Discussion on the recent development direction of concrete science and technology. J. Chin. Ceram. Soc. 1979, 3, 262–270. [Google Scholar]
Figure 1. XRD diffraction pattern of recycled aggregate.
Sustainability 16 01292 g001
Figure 2. Scanning electron microscope test.
Sustainability 16 01292 g002
Figure 3. Comparison of the basic physical property indexes of recycled aggregate after PVA modification: (a1) Modified-RB apparent density; (a2) Modified-RC apparent density; (b1) Water absorption of the modified RB; (b2) Water absorption of the modified RC; (c1) Modified-RB crushing index; (c2) Modified-RC crushing index.
Sustainability 16 01292 g003aSustainability 16 01292 g003b
Figure 4. Changes in basic physical property indexes of the recycled aggregate before and after modification: (a) Apparent density; (b) water absorption; (c) crushing index.
Sustainability 16 01292 g004
Figure 5. Schematic diagram of the mechanism of the PVA solution modification of the recycled aggregate.
Sustainability 16 01292 g005
Figure 6. Surface microstructure and EDS energy spectrum of the recycled aggregate: (a1) RB microstructure: (a2) RB energy spectrum; (b1) RB-PVA microstructure; (b2) RB-PVA energy spectrum; (c1) RC microstructure; (c2) RC energy spectrum; (d1) RC-PVA microstructure; (d2) RC-PVA energy spectrum.
Sustainability 16 01292 g006aSustainability 16 01292 g006b
Figure 7. Internal microstructure of the PVA-modified recycled aggregate: (a) RB internal microstructure; (b) RC internal microstructure.
Sustainability 16 01292 g007
Figure 8. Fine aggregate particle gradation curve.
Sustainability 16 01292 g008
Figure 9. Mechanical strength test.
Sustainability 16 01292 g009
Figure 10. Compressive strength.
Sustainability 16 01292 g010
Figure 11. Bending strength.
Sustainability 16 01292 g011
Figure 12. Splitting tensile strength.
Sustainability 16 01292 g012
Figure 13. Nuclear magnetic resonance sample preparation and test process: (a) NMR samples; (b) NMR test.
Sustainability 16 01292 g013
Figure 14. Distribution of the microhardness measuring points (1–5 indicates microhardness measurement area).
Sustainability 16 01292 g014
Figure 15. T2 relaxation spectrum.
Sustainability 16 01292 g015
Figure 16. Aperture distribution diagram.
Sustainability 16 01292 g016
Figure 17. Hole level ratio diagram.
Sustainability 16 01292 g017
Figure 18. SEM image of the interfacial transition zone between RB and cement mortar: (a) unmodified (500×); (b) PVA solution modification (500×); (c) PVA solution modification (5000×).
Sustainability 16 01292 g018
Figure 19. SEM image of the interfacial transition zone between RC and cement mortar: (a) unmodified (500×); (b) PVA solution modification (500×); (c) PVA solution modification (5000×).
Sustainability 16 01292 g019
Figure 20. Microhardness box statistics of the mortar area: (a) RAC3; (b) P-RAC3.
Sustainability 16 01292 g020
Figure 21. Microhardness values of RC and the old mortar area: (a) RAC3; (b) P−RAC3.
Sustainability 16 01292 g021
Figure 22. The microhardness value of RC and the new mortar area: (a) RAC3; (b) P−RAC3.
Sustainability 16 01292 g022
Figure 23. Microhardness value of old mortar and the new mortar area: (a) RAC3; (b) P−RAC3.
Sustainability 16 01292 g023
Figure 24. Microhardness values of RB and the new mortar area: (a) RAC3; (b) P−RAC3.
Sustainability 16 01292 g024
Table 1. Polyvinyl alcohol (PVA) quality indicators.
Name of IndicatorAverage Degree of PolymerizationAlcoholysis DegreeSodium OxideChlorideSulfate
Name of Sample
Polyvinyl alcohol (PVA)1750 ± 50≥87.0%19.3–22.8%≤0.01%≤0.01%
Table 2. Basic physical properties of the recycled aggregates before and after modification by PVA solution.
TypeApparent Density
(kg/m3)
Water Absorption (%)Crushing Index (%)
RB2527.921.421.8
Modified RB2589.218.916.2
RC2586.36.413.1
Modified RC2660.54.710.1
Table 3. Percentage by the mass of each element (%).
Groups.COFeNaMgAlSiCa
RB130.2026.680.140.741.616.1130.793.73
229.0229.450.072.090.799.7626.802.02
319.5633.710.761.092.047.1927.108.55
Modified RB165.3216.610.441.151.013.2811.041.16
260.3016.960.040.731.297.3013.060.31
341.3124.920.421.651.856.1421.721.99
RC112.4727.860.090.301.9717.3831.698.24
215.0224.420.040.751.8420.1132.205.62
313.9124.090.001.950.0518.2434.617.16
Modified RC129.5724.950.131.931.087.8127.736.80
248.5815.160.111.863.006.8219.694.78
352.3323.551.031.841.053.4311.505.25
Table 4. Physical and mechanical properties of the cement (%).
CementSpecific Surface Area/m2·kg−1Setting Time/minStabilityBurning Vector/%3d Strength/MPa28d Strength/MPa
Initial SettingFinal SettingBendingCompressiveBendingCompressive
P·O42.5365186235Qualified3.225.823.18.245.7
Table 5. Recipes of concrete (kg/m3).
GroupsWaterCementSandStoneRBRCWater Reducing Admixture
RAC1, P-RAC115434266686703721.71
RAC2, P-RAC21543426668671122601.71
RAC3, P-RAC31543426668671861861.71
GroupsWaterCementSandStoneRBRCWater Reducing Admixture
RAC4, P-RAC41543426668672601121.71
RAC5, P-RAC515434266686737201.71
Table 6. Peak areas of the T2 relaxation spectrum.
GroupsPeak AreaPeak Ratio/%
The First PeakThe Second PeakThe Third PeakThe Fourth Peak
RAC33598.18770.75414.0529.2195.975
P-RAC33346.58986.4976.0185.3582.127
Disclaimer/Publisher’s Note: The statements, opinions and data contained in all publications are solely those of the individual author(s) and contributor(s) and not of MDPI and/or the editor(s). MDPI and/or the editor(s) disclaim responsibility for any injury to people or property resulting from any ideas, methods, instructions or products referred to in the content.

