Abstract
The “x-minute city” concept gained attention within the global urban discourse on post-pandemic cities. Recently, numerous cities have shifted their attention from considering the x-minute city merely as a theoretical concept to one with practical applicability, rediscovering the proximity dimension to be integrated into urban policies and plans. Consequently, a requirement emerged to develop comprehensive approaches for monitoring and assessing this proximity. In this perspective, this article seeks to answer two main questions: What are approaches utilized in the literature to measure proximity within the context of “x-minute cities”? How could these measurement models accurately reflect real-world scenarios? The aim is to identify the models and variables required for measuring proximity within the framework of x-minute cities. A review of 38 peer-reviewed articles following the PRISMA statement was performed by searching the Web of Science database for publications from 2020 to 2023. Our results clarified the essential components of the measurement models and presented recommendations for more comprehensive assessments. The findings highlight the variable deficiencies that affect proximity measurement approaches. The recommendations hold the potential to enhance measurement models, contributing to the development of urban communities that are more accessible and interconnected.
1. Introduction
The rapid urbanization of the 21st century guided a transformation in the development of cities [1]. This wave of urbanization has brought both opportunities and challenges [2]. One of the significant challenges of some of today’s cities is car-oriented development [3]. A car-oriented approach has resulted in critical issues, such as air pollution, traffic congestion, sedentary lifestyles, longer commute times, and the fragmentation of communities [4,5]. These problems affect the environment and the quality of life for city residents [6]. The COVID-19 pandemic has highlighted the difficulties that cities may encounter in terms of the overcrowding of public transport and the need for reduced carbon emissions, similar to the case during lockdowns [7,8,9]. These challenges underscore the importance of walkable cities and services within walking distance [10,11,12].
In response to these challenges, decision-makers are reimagining urban spaces, focusing on sustainability, accessibility, and inclusivity by departing from the car-centric model [13]. In the face of these multifaceted urban challenges, along with the emergence of the COVID-19 pandemic, the “20-minute city”, “15-minute city”, 10-minute city”, or “5-minute city” concepts have emerged as a promising vision for the future of urban living [14,15,16]. The idea of planning cities according to the proximity of services advocates for urban environments. In this context, residents can access essential services, work, education, healthcare, shopping, and recreational activities within walking or biking distance from their homes [17]. This concept represents a shift in emphasizing proximity, accessibility, and connectivity, crucial for planning more resilient, sustainable, and inclusive cities, as described in the United Nations’ Sustainable Development Goals (UN-SDGs) [1,18]. Additionally, the target UN-SDG 11, “provide access to safe and inclusive green and public spaces,” needs proximity of services within walking distance.
This article discusses the concept of “chrono-urbanism” and how it is close to x-minute cities. The literature describes this term as an approach that focuses on understanding and analyzing the temporal aspects of urban processes, daily rhythmical patterns, and the relationship between time and places of urban life [19,20]. Proximity (or geographic nearness) represents an ongoing—or estimated—shift in urban planning approaches away from transport-dominated urban development. Urban policies have shifted from viewing car transport as the ultimate mode by which citizens reach daily activities to emphasizing reducing travel distance and promoting active mobility such as walking and cycling [21]. Proximity is believed to enhance individuals’ quality of life and encourage neighborhood sustainability. The concept is central to the discourse on regenerating and making cities attractive via densification, land-use mixing and filling, and the co-location of various activities and facilities.
Scholars have debated through the years about the preference for the centrality of services compared to the distribution of services towards dispersed neighborhood units. Recently, a need for a more comprehensive, minimum set of services accessible to most citizens has filled scholars’ agendas to improve urban performance [22]. The x-minute city adopts this space-time perspective of chrono-urbanism. It applies in the distribution of services to guarantee accessibility to essential services and activities [23].
Many cities worldwide are currently adopting the ideas of proximity and the x-minute city as a framework for more inclusive and resilient communities. However, several cities developed only theoretical frameworks and models [23]. One of the reasons is that implementing this proximity or “chrono-urbanism” logic efficiently requires exploring complex spatial and temporal urban features, such as the location of existing services and amenities, the socioeconomic characteristics of the population, and the street network configuration [17]. These features require managing different datasets and considering many aspects [24,25].
Consequently, as cities undergo this transformative journey, they confront the critical need for comprehensive measuring and evaluation methodologies to accurately evaluate their progress toward becoming x-minute cities. Therefore, the trigger for this systematic review arises from a series of theoretical and methodological considerations. These inquiries revolve around the concept of x-minute cities and their adaptability to the specific characteristics of individual cities. This research was guided by two central research questions: What approaches are employed to measure proximity within the context of 15-minute cities? How can these measurement models accurately reflect the complexities of real-world urban environments and the diverse needs of urban populations?
This article broadly synthesizes measurement models related to the x-minute city concept by focusing on the following analytical categories: (i) geographic location, (ii) the employed approach, (iii) the scale of addressed case studies, (iv) the variables employed in the models, and (v) limitations and future research. Our research objective is to investigate the approaches published in the literature during 2020–2023 that measure the proximity of 15-minute cities. Data mining using the PRISMA protocol aims to explain the complexities of measurement models, seeking to uncover their strengths and limitations in reflecting real-world urban scenarios.
After this introduction, this study is structured in three sections. Section 2 illustrates the methods and techniques adopted in data mining. Section 3 and Section 4 displays the results and discussion from the reviewed documents. Finally, Section 5 concludes the review by proposing future studies and strategies.
2. Data Mining
The primary purpose of this study is to investigate how proximity is measured in the context of the x-minute city and how SDGs can contribute to this context. To conceptualize and provide a comprehensive understanding, this study represents a systematic literature review since it is considered the most efficient method for assessing and classifying wide-ranging literature [26]. The data mining employed for this review adhered to the Preferred Reporting Items for Systematic Reviews and Meta-Analyses (PRISMA) protocol [18,27,28]. We searched the Web of Science (WOS) database to answer the research questions and investigate the gap in the literature regarding x-minute city measuring approaches.
The systematic review employed a multi-step process for records selection. It started with an initial review to identify all potentially relevant studies in the literature that discussed 10-minute, 15-minute, and 20-minute cities and how they contribute to the SDGs discourse. Afterward, relevant sources were collected from the Web of Science database for a more comprehensive evaluation, including examining their title, abstracts, and full text. Finally, certain studies were excluded from the systematic review based on predetermined inclusion and exclusion criteria.
2.1. Search Strategy
The search for related articles in literature was based on keywords through online databases for academic literature. In this review, the WOS database was used primarily to conduct a literature search considering peer-reviewed articles published from 2020 to 2023. The initial queries were performed on 13 July and revisited on 10 October 2023. The searching phase was performed using the following search string: (ALL = (x-minutes city) OR ALL = (20-minute city) OR ALL = (15-minute city) OR ALL = (10-minute city) OR ALL = (5-minute city) AND ALL= (city) OR ALL (Sustainability)). Regarding eligibility criteria, all papers (n = 3583) that emerged as hits in response to the search string were initially included for further consideration. After that, the included articles were evaluated based on exclusion criteria determined according to the scope of the research.
2.2. Eligibility and Exclusion Criteria
Well-defined eligibility and exclusion criteria guided the inclusion of articles in this review. These criteria were established to ensure that the selected articles aligned with the scope and objectives of our research. The initial refining criteria were keywords, research area, language, and publication date. In Figure 1, the PRISMA protocol represents the selection and exclusion process in this review:
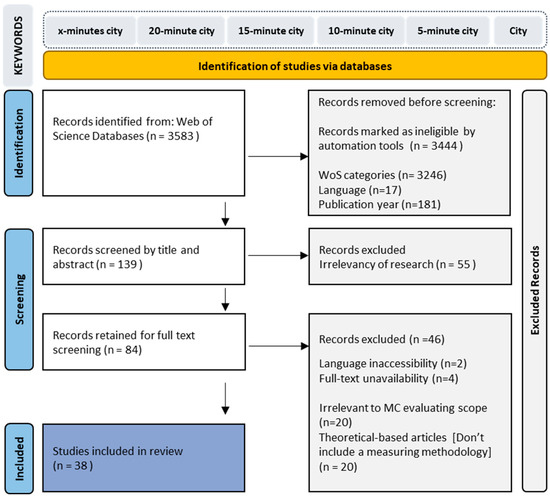
Figure 1.
PRISMA flowchart—study methodology of excluded and included documents. Source: the authors.
- First, 3583 records were identified on the Web of Science database by using the keywords. Records (n = 3444) were excluded by the automation tools (WOS categories, language, publication years).
- In this step, the retrieved documents (n = 139) were screened through the analysis of titles and abstracts, leading to the exclusion of 55 records that were associated with other topics and irrelevant to the focus of the research.
- A Microsoft Excel spreadsheet was created to compile a list of the remaining 84 articles for full-text screening. This allowed us to methodically categorize the articles based on their titles, abstracts, problem statements, and research objectives. Any documents unavailable in full text or not presented in English were removed from consideration (n = 6).
- Upon reviewing the full text of these articles, several manuscripts had a theoretical base (n = 20). Some other articles addressed topics like measuring walkability or evaluating accessibility but did not relate to the concept of x-minute cities. Meanwhile, some articles examined factors within pre-defined minute cities (MCs) (n = 20). Therefore, these were primarily excluded due to the absence of an analytical approach in the context of the x-minute city.
- Consequently, once the screening process was carried out according to the exclusion criteria, a final database of 38 documents remained eligible to be included in this study.
2.3. Reviewing and Analysis Process
Once the 38 articles were selected for inclusion in the study, the selected papers were documented and organized in a spreadsheet (refer to the Appendices link in the Supplementary Materials). The reviewing and analysis process involved a systematic approach to extract and organize data from each document according to geographic location, the adapted approach, the selected scale, the variables employed, and the study limitations:
- Geographic location: Different countries worldwide have started to discuss and adopt the MC concept as an emerging trend, integrating it within their urban policies and plans. This review pinpointed countries that began to initiate new tools and methods to measure proximity and evaluate their performance as a minute city.
- The approach: The documents were classified based on whether the method used was grid-based, point of interest (POI) catchment area, building catchment area, indicator, index-based, or graph representation.
- Study area scale: It is essential to note that the choice of research objectives directly influenced how case studies were defined in terms of their scale. The reviewed documents were classified into various scales, including project, local, and regional.
- Variables used: After reviewing articles, variables were listed and organized. Variables with similar meanings were grouped under joint names. Three variable sets were generated through the reviewing process: physical, socioeconomic, and environmental-related variables. Some variables were excluded from further analysis as they were mentioned in only one document.
The Discussion section of this study provides reflections on SDGs. This study also considered the contributions of the approaches of x-minute cities and identified areas for potential future research that can support the SDG targets.
3. Four Results of X-Minute City in Urban Planning and Design Research
3.1. Results on Geographic Location
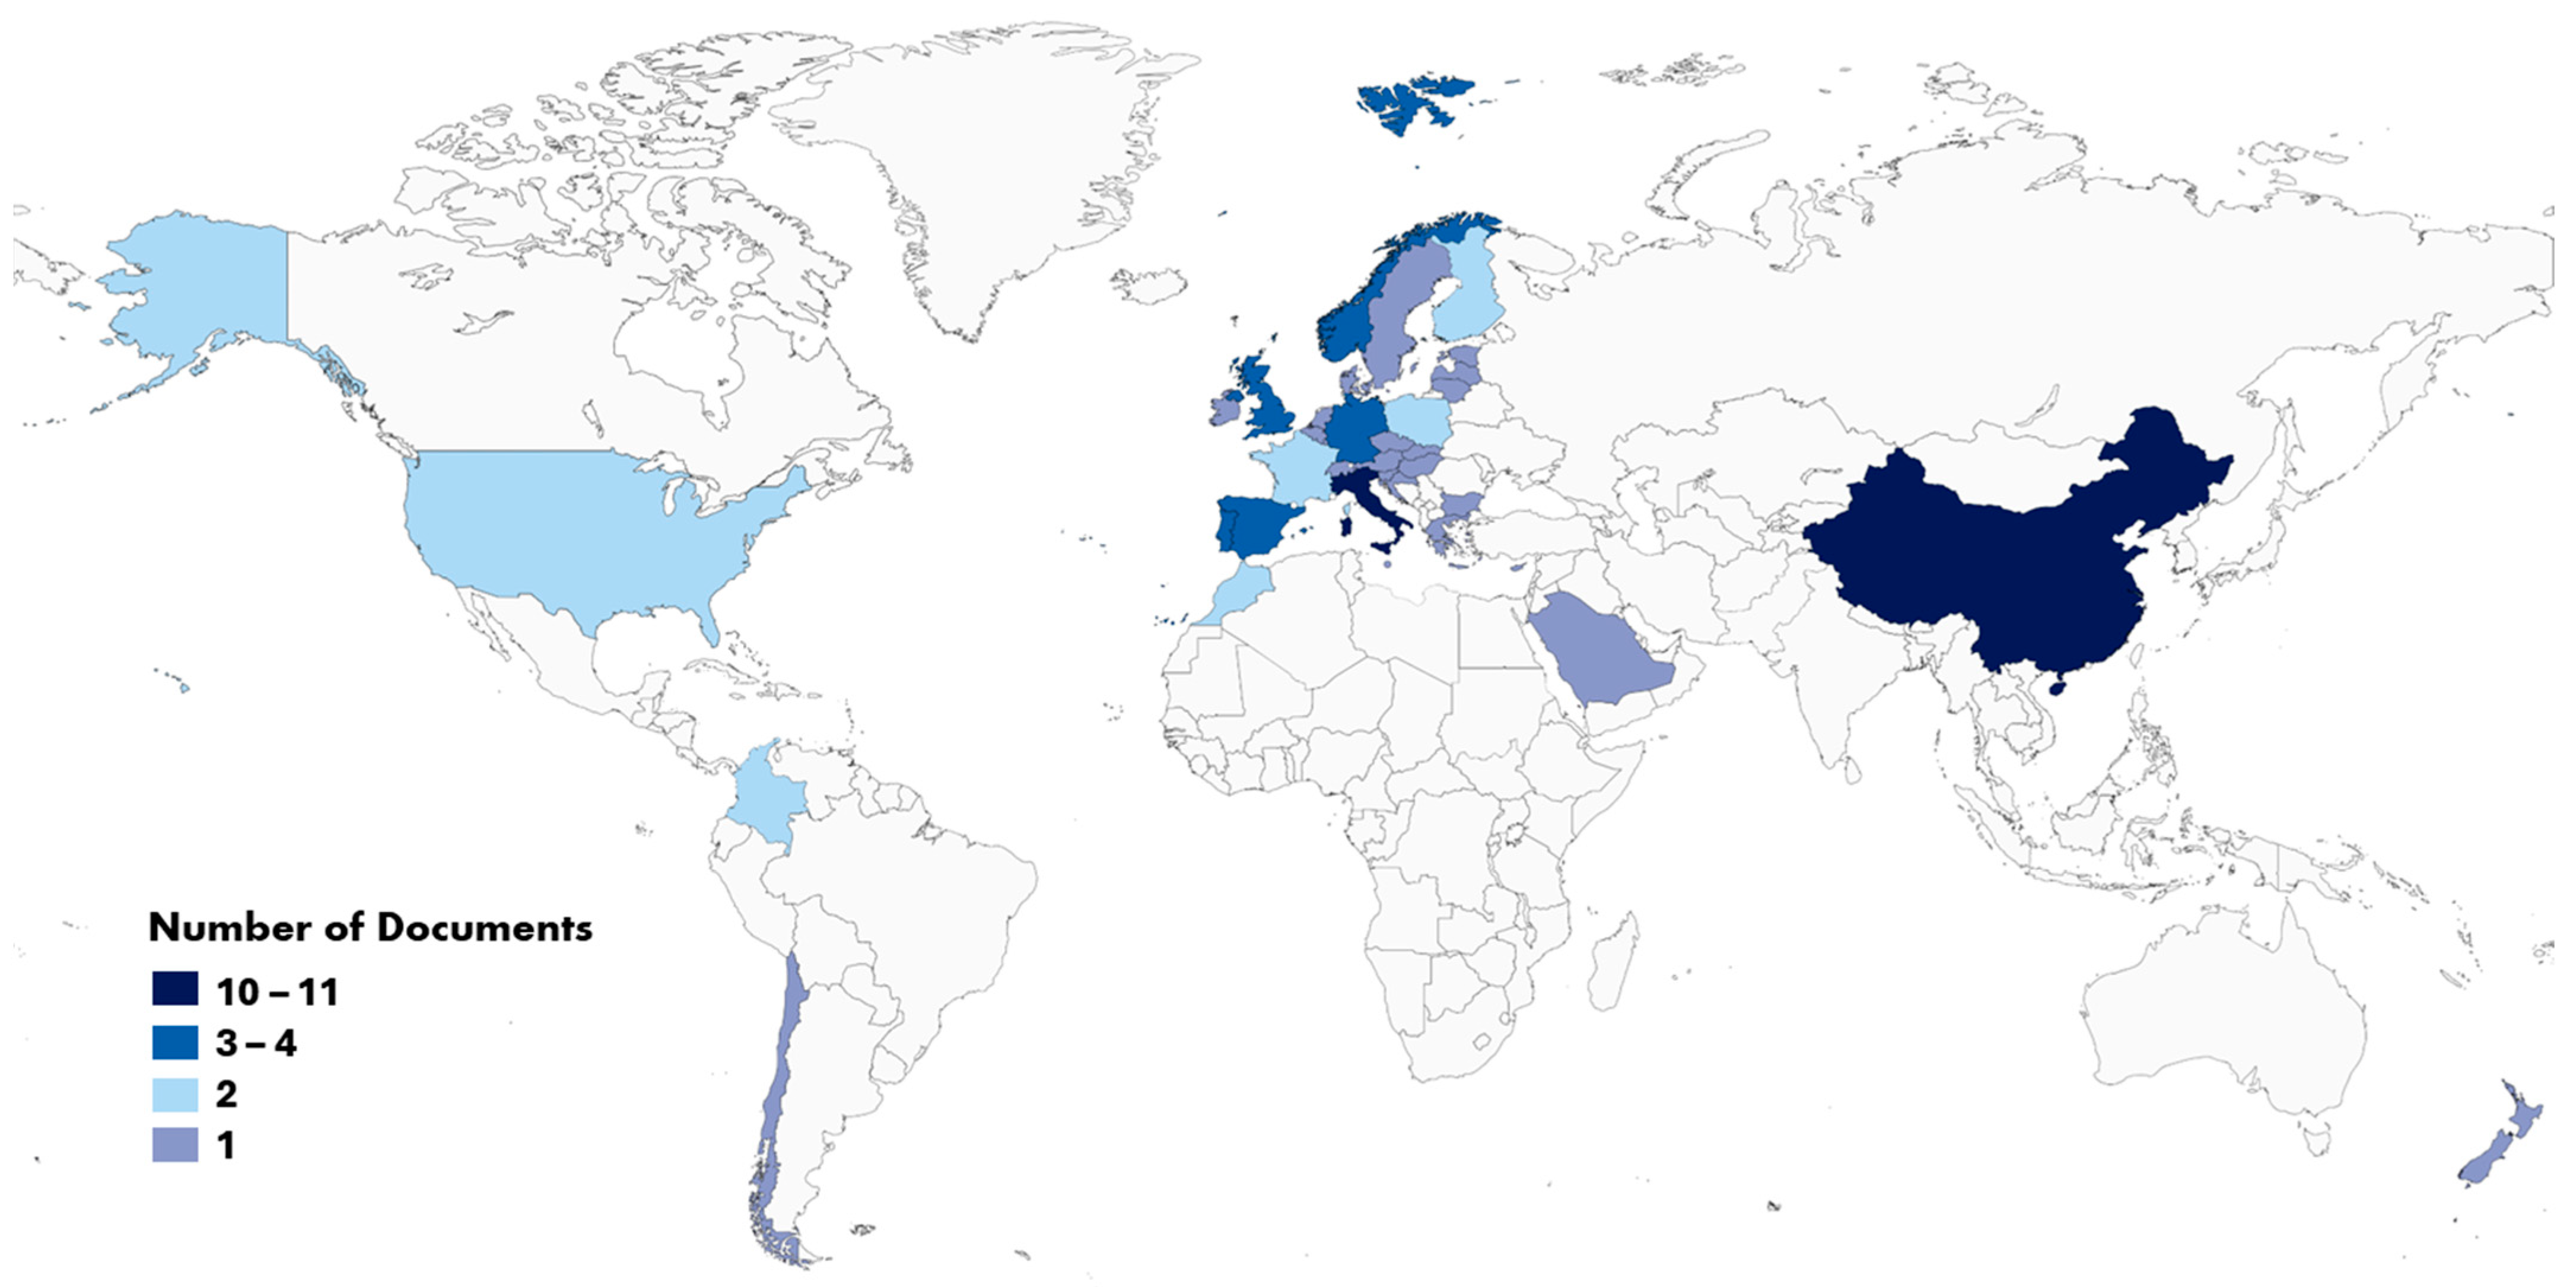
Of the 38 reviewed documents, 11 were related to interventions in Italy, followed by China with 10 papers. At the same time, the United Kingdom and Portuguese cities were the areas of study in four manuscripts each. Spain, Germany, and Norway each were covered in three documents. Meanwhile, only two papers considered Poland, Morocco, France, Finland, and Colombia. Moreover, 24 countries came last with only one reviewed document for each. Out of the 38 papers identified, all the case studies were in 37 countries, meaning empirical methodologies on minute cities are highly concentrated around a limited number of countries. The dominance of these models within a limited number of countries, despite the evident demand for such models in numerous other regions, can be attributed to the lack of accessible data in those other regions, limiting the widespread adoption of these models [23].
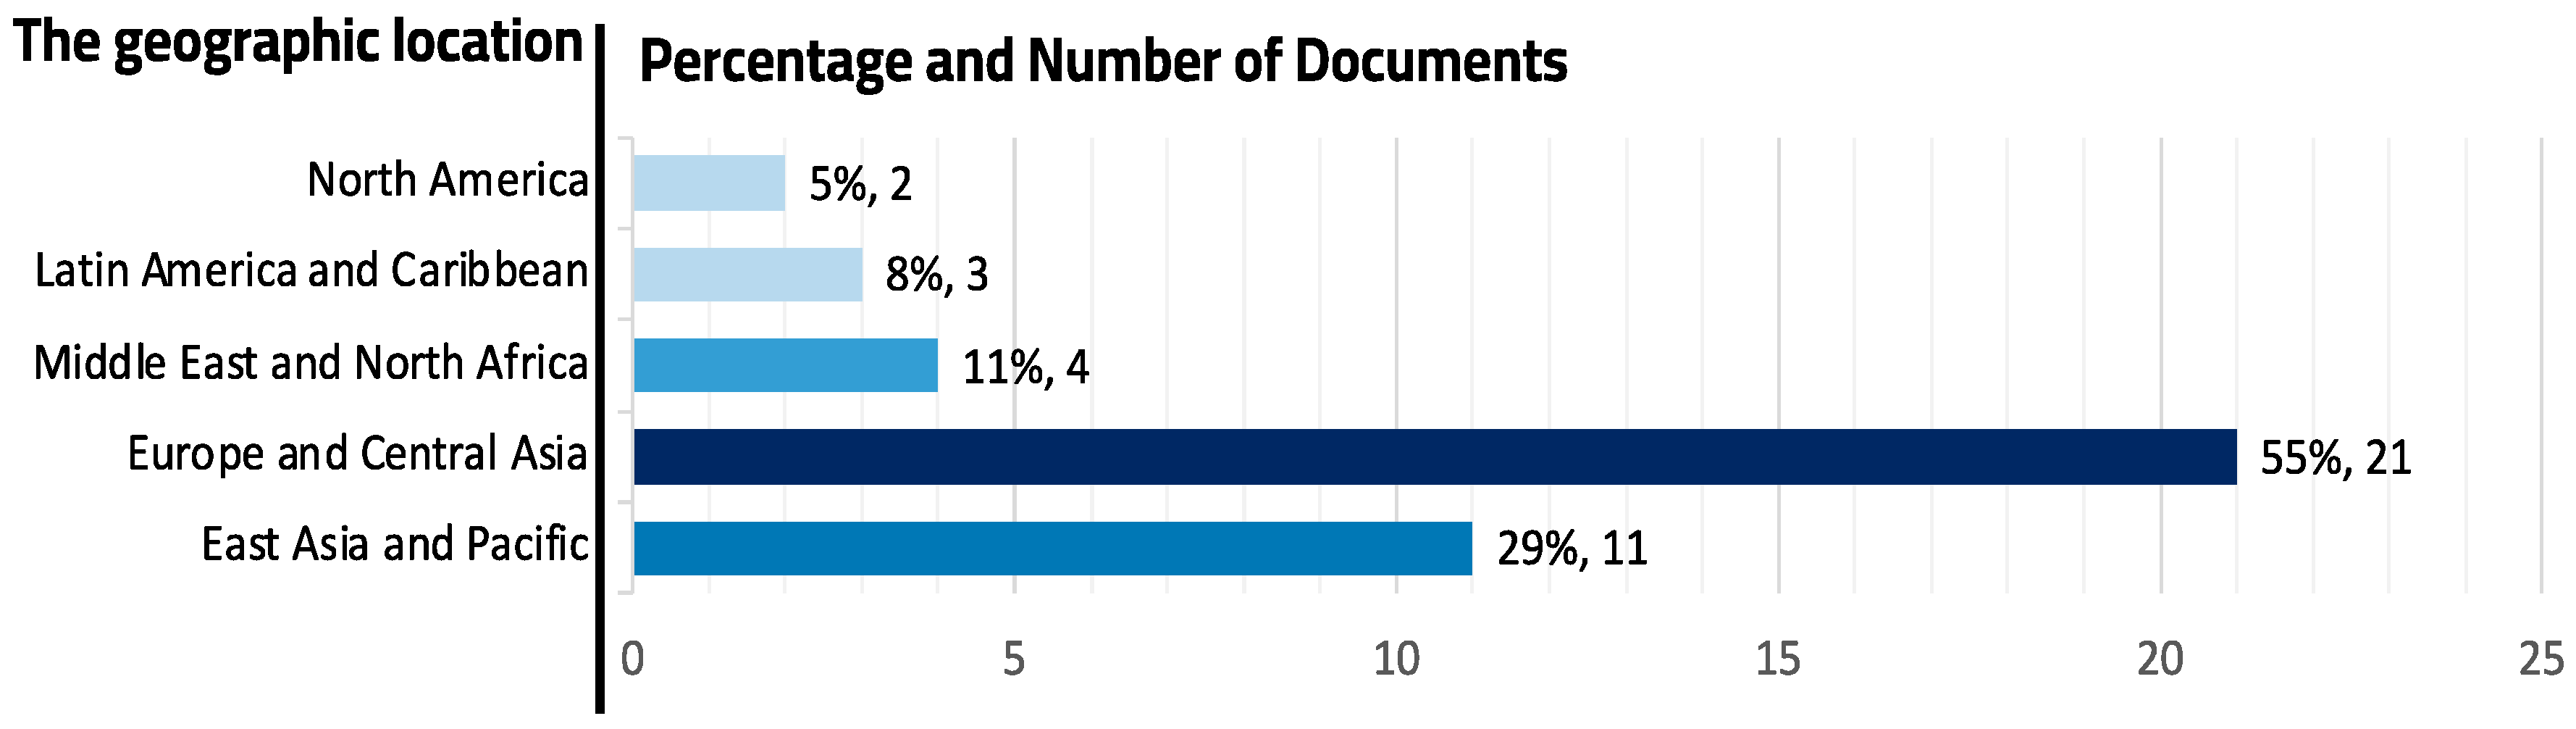
Figure 2 and Figure 3 clearly show that only a region, specifically Europe and central Asia, hosted many publications with 55%. At the same time, East Asia and the Pacific come in second place, with 29% of the documents focusing on one country, China. Few publications were noted in parts of the Middle East and North Africa, with 11%, while Latin America and the Caribbean had 8%. However, it is surprising that the North American region, which has had a rich history in mobility studies, reported few publications, with only 5%.

Figure 2.
Geographic distribution of the case studies included in the reviewed articles. Source: the authors.

Figure 3.
The number of documents hosted in different regions. The regions are classified according to the World Bank analytical grouping. Source: the authors.
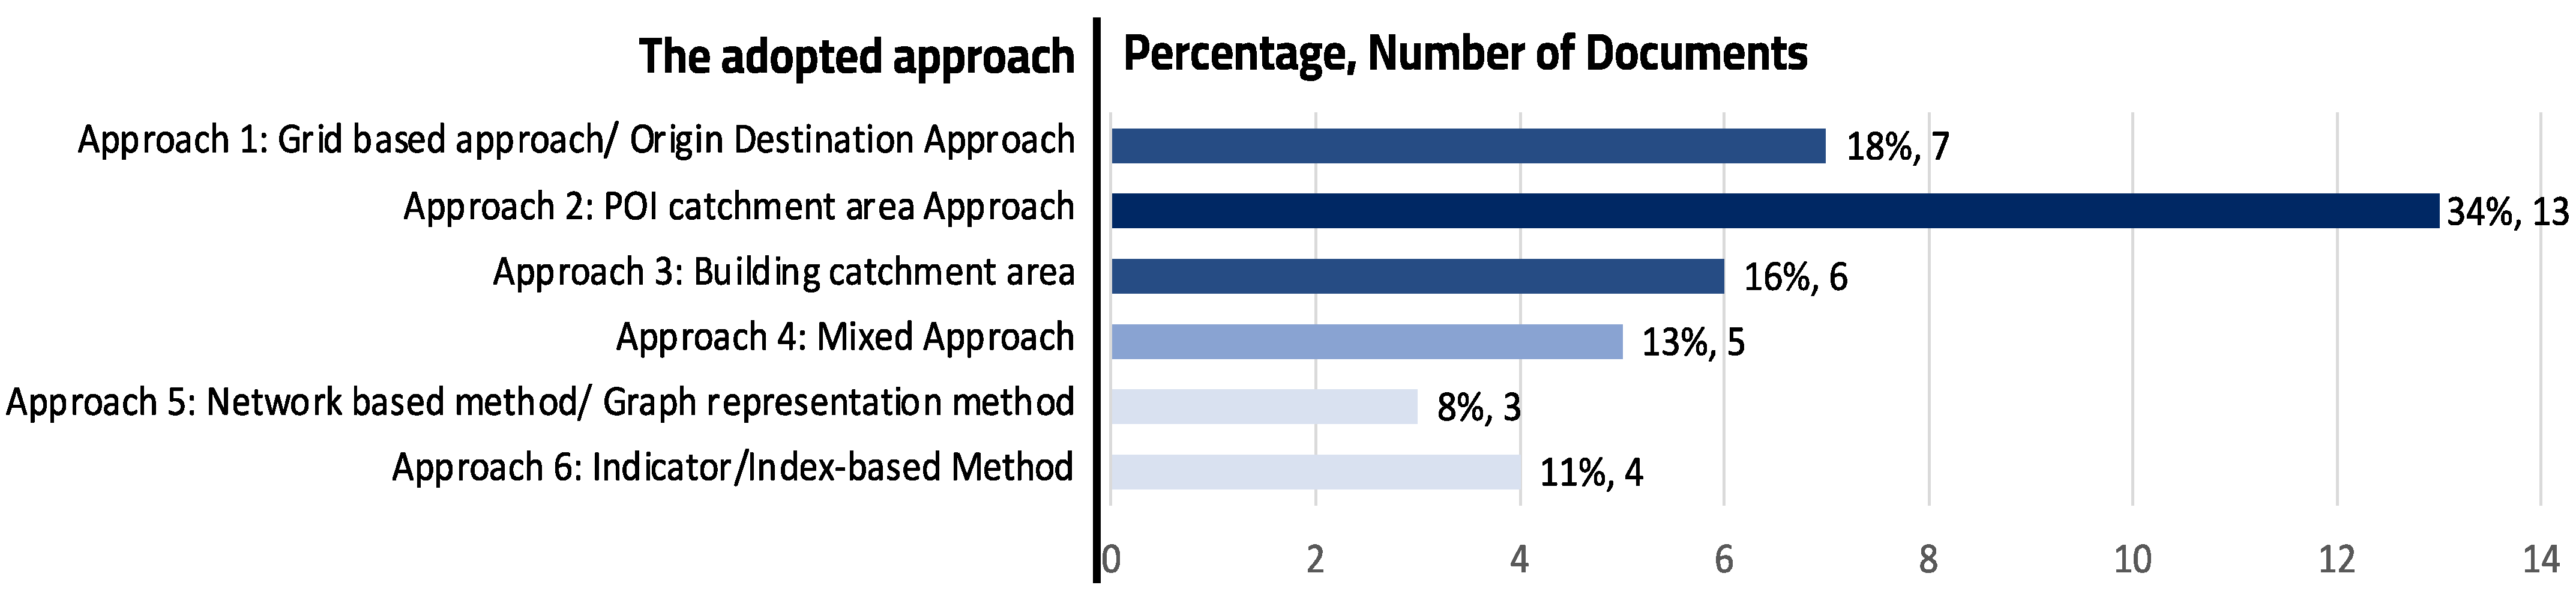
3.2. Results on Adopted Assessment Approaches
This review presented different methodologies employed in the reviewed documents to assess proximity as one of the main targets of SDG11.7 by providing access to urban places within the context of an x-minute city (Figure 4 and Table 1). Approach 2 (POI catchment area approach) was presented in 34% of the documents (n = 13). Approach 1 (grid-based approach/origin–destination approach), in turn, was found in 18% of the papers (n = 7). At the same time, Approach 3 (building catchment approach) and Approach 4 (mixed approach) were employed in 16% and 13% of the documents, respectively. Finally, Approach 5 (graph representation approach) and Approach 6 (indicator/index-based method) were found in three and four manuscripts, respectively. As can be seen, Approach 2 (POI catchment area approach) was the most followed approach.
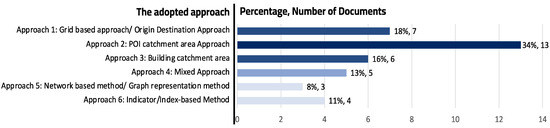
Figure 4.
The number of documents using each measuring approach. Source: Authors.

Table 1.
The approaches adopted. Source: the authors.
- Approach 1. Origin–destination OD approach/grid-based approach
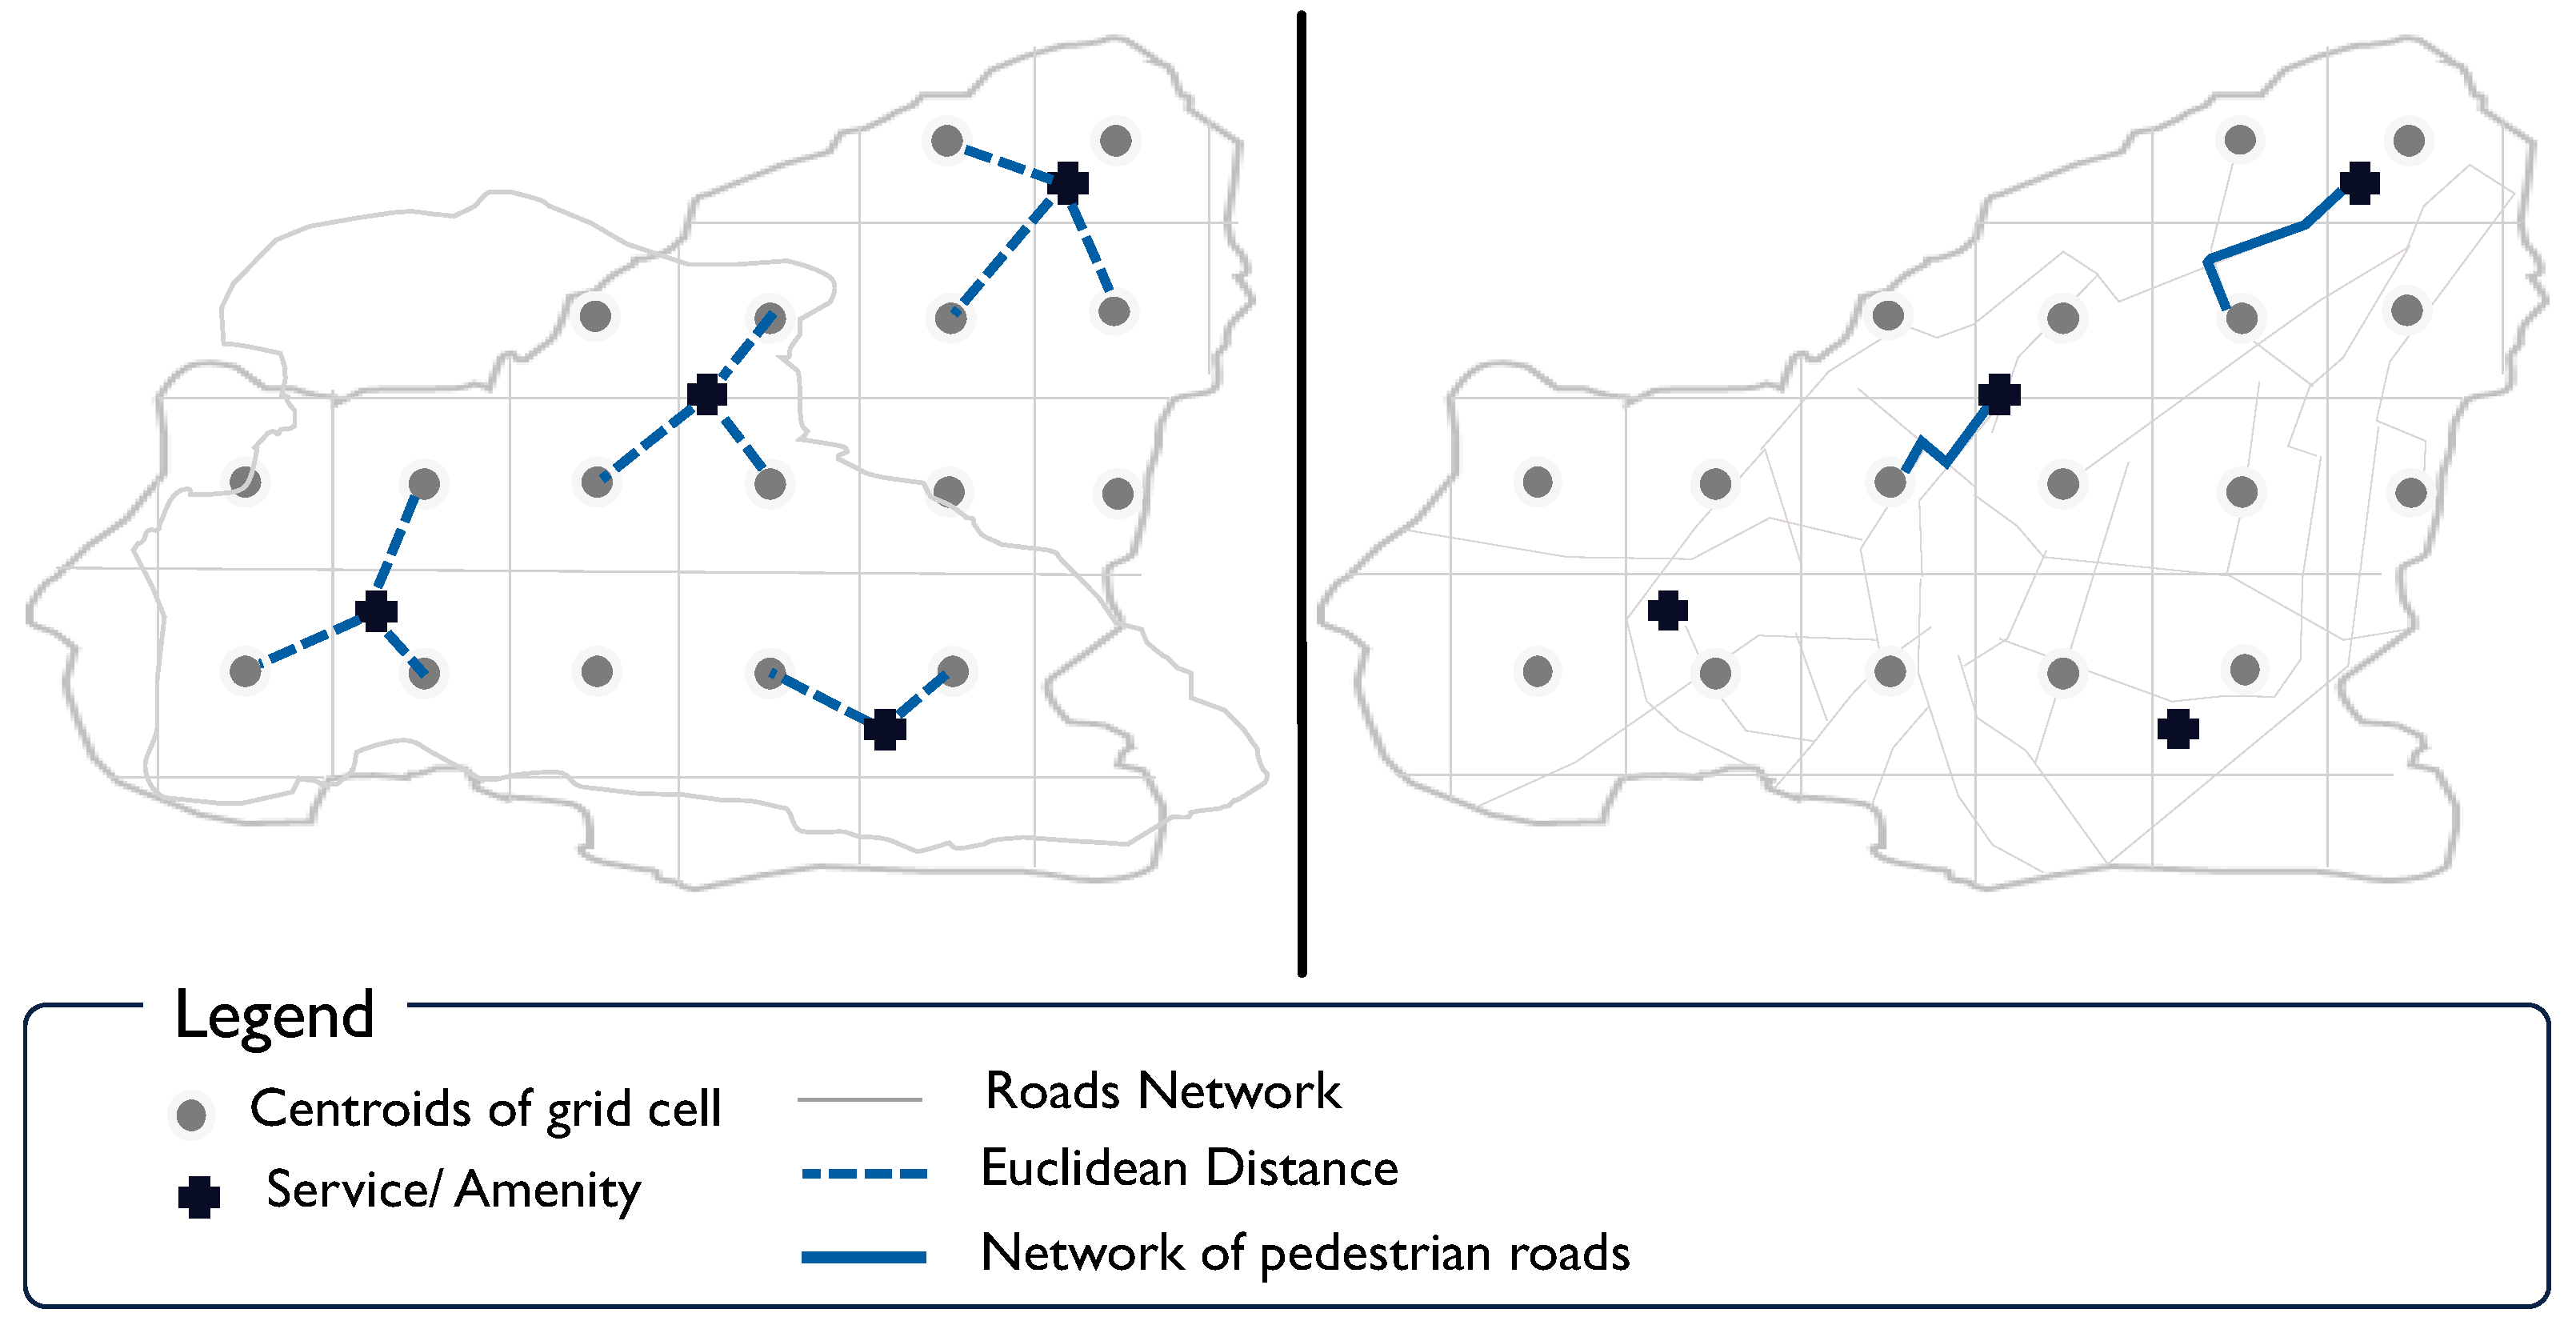
Our results yielded seven manuscripts in this review that adopted the origin–destination/grid-based approach. In most cases, this approach divided the study area into a grid using geographic information systems, determining the location of residences in each grid cell and classifying these residences according to their proximity to service locations [29]. First, the polygon representing the study area boundaries is divided into grid cells (Figure 5).

Figure 5.
The concept behind the OD/grid-based approach. Source: the authors.
Second, the geographical centroid for each cell is identified. Third, the distance between the cell centroid (origin) and the selected services or amenities (destination) is calculated for each grid cell. Fourth, whether the residential centroid (origin) is located within a 15-minute walking distance from the service is assigned to each grid cell. Finally, each cell is graded based on the proportion of services or amenities that residents within that cell can access within a 15-minute walking distance. This grading provides a quantitative measure of proximity for different areas within the study region. It is worth mentioning that this method assumes that the measured distance between the cell centroid and a service location represents the distance between any point within that cell and the selected service.
In their study, Wang et al. [29] employed the cumulative opportunity method, a widely recognized method [58], to assess the accessibility of PCR test sites within a specified walkable travel time in two major Chinese cities, Beijing and Guangzhou. To conduct this analysis, they adopted a grid-based approach, dividing the urban areas into 500 × 500 m grids as the primary analytical unit. They calculated the travel distance based on the median value of the travel distance between road intersections within each grid.
Willberg, Fink, and Toivonen [30] assessed proximity in the Helsinki Metropolitan Area, Finland. The centroids of 250 × 250 m statistical grid database cells were used for the origin points. Pandana and NetworkX computed the shortest routes between the origin points and destinations. Logan et al. [31] calculated the walking time from the centroid of the neighborhood block to all amenities of interest. Then, they determined the walking time for each block to each nearest amenity. The network walking time from the block centroids to the destination was measured using an open street map and an open-source routing machine.
Yang et al. [32], Song et al. [58], and Leon et al. [59] developed an OD matrix analysis using the Network Analyst module of ArcGIS software (ArcGIS versions 10.2 and ArcGIS 10.7), measuring the distance from the census blocks through the road networks to a set of selected facilities. At the same time, Calafiore et al. [16] examined the concept of the 20 min city in the context of the Liverpool City Region. The core of their methodology involved computing the walking time required to reach the five closest destinations from each postcode for every service category, determined based on Euclidean distance.
- Approach 2: Point of interest catchment area approach
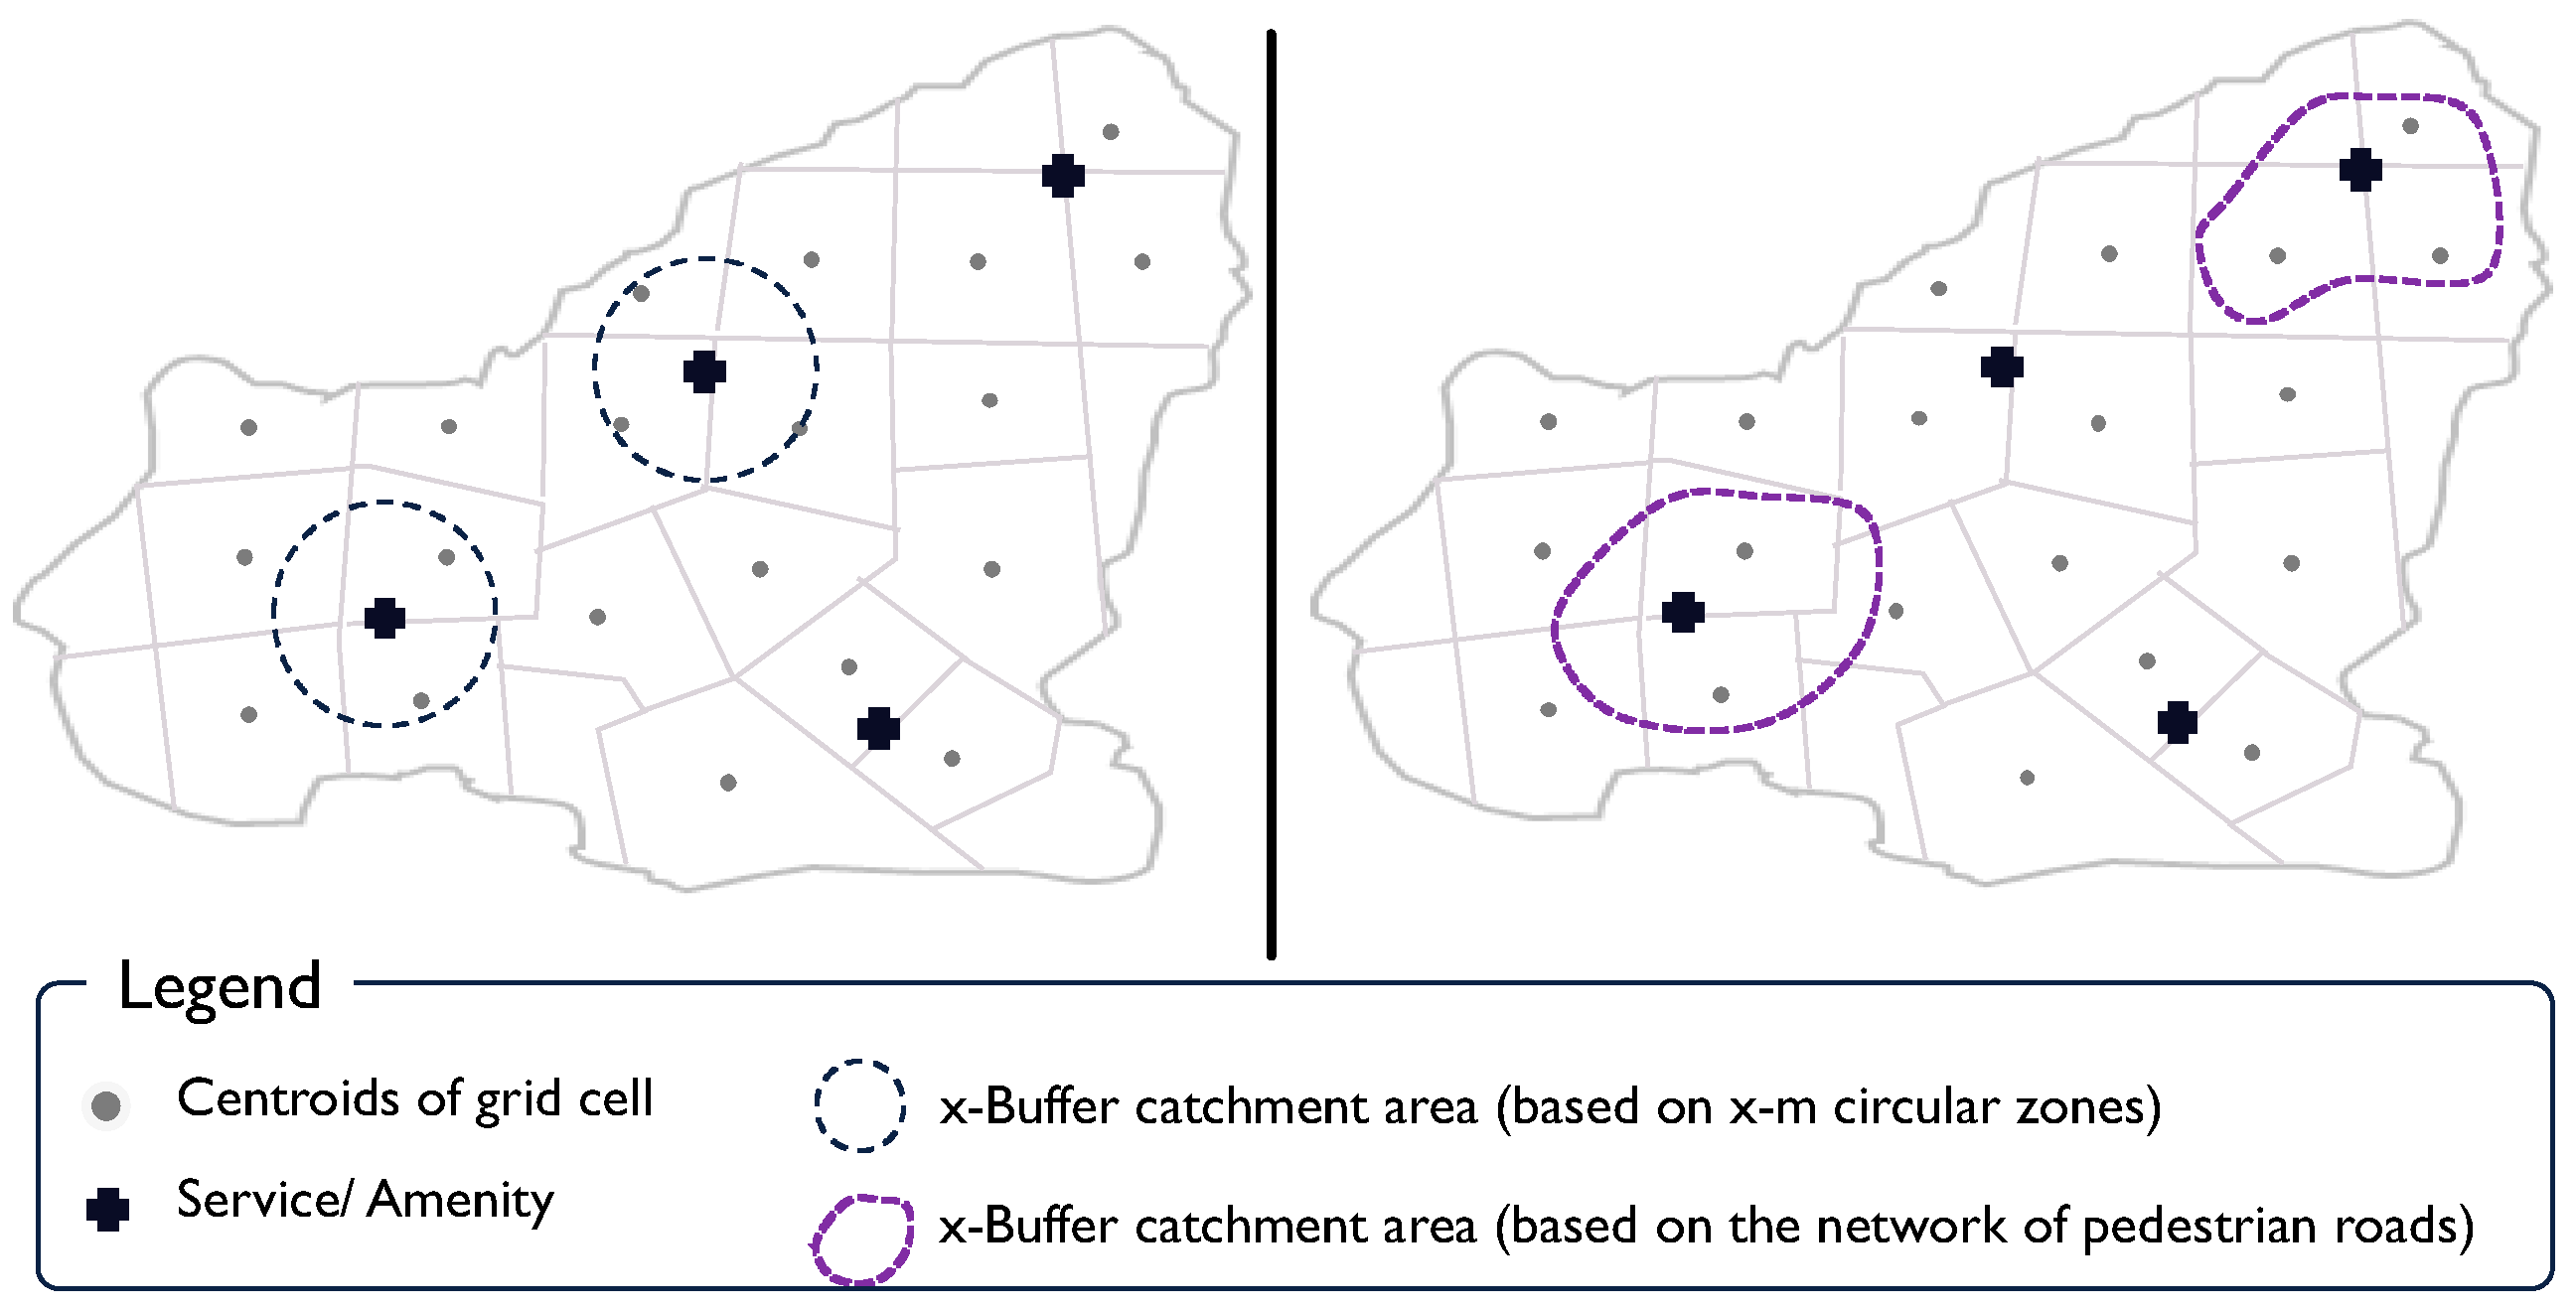
The point of interest (POI) catchment area approach considers the location of buildings in the study area as a georeferenced cadastral parcel using geographic information systems (GIS) (Figure 6). POI focuses on classifying the coverage area of services by calculating walking distances from these services to all buildings within the selected study area [56].
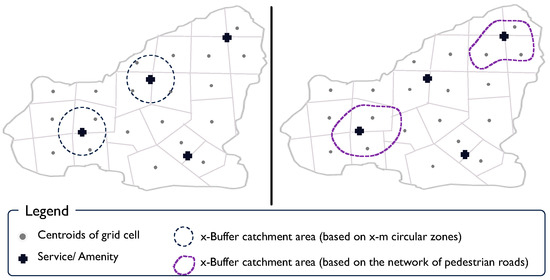
Figure 6.
The concept of POI catchment area approach. Source: the authors.
In this approach, the service locations are first entered as points into the geographic information system and are defined as origin points. Second, centroids for all cadastral parcels (building locations) are generated and characterized as destination points. Third, a pedestrian road network is built in which the travel cost and walking speed are assigned. Fourth, buffers or service areas around each origin point represent different cut-off values for walking distances (e.g., 10, 15, or 20 min). Fifth, for each parcel (building), it is determined whether it falls within the limits of the different buffers created for the various selected amenities. Finally, each building parcel’s proportion of services within x-minute walking distance is summarized.
This comprehensive analysis not only identifies areas within the city with limited access to categories of POIs but also involves the calculation of the population residing within the regions covered by these buffers. By employing this method, urban planners and policymakers can acquire valuable insights into the distribution of services, disparities in accessibility, and areas in need of enhanced amenities.
Mariotti et al. [34] applied this approach to determine the catchment areas for coworking spaces in Milan. However, the methodology used to measure the walkable distance was unclear. Caselli et al. [35] assessed accessibility in the case study of the Cittadella district by determining the catchment areas of selected facilities, identifying kindergartens and neighborhood cores as prominent locations in the neighborhood through service area analysis by using the ArcGIS Network Analyst tool to compute the “cost” value per each link in the pedestrian network. Abdelfattah, Deponte, and Fossa [10] employed a purely isometric approach, considering three walking buffers: 300 m, 600 m, and 900 m, representing walking times of 5, 10, and 15 min, respectively.
Kesarovski and Hernández-Palacio [36] and Ferrer-Ortiz et al. [23] ran Network Analyst to estimate service areas around the selected POIs within x-minute isochrones. Abd El Karim and Awawdeh [37] and Da Silva, King, and Lemar [38] were involved in a service analysis in which certain services were evaluated. They integrated the road network layer and related layers to determine service areas. Facilities were linked to service points, and the service area layer was set up. Finally, the network was solved based on these predefined time limits. Harroucha and Chaouni [39,42] used QGIS software Interface Catchment (IC) plugin to build the service network from a starting point within a specified walking distance. Noworól et al. [40] and Balletto et al. [43] delineated the catchment areas for each service category by the distances covered by pedestrians in a straight line.
Three documents adopted the two-step floating catchment area (2SFCA) approach through this review. Liu et al. [44] and Zhang et al. [41] clarify the current state of 15-minute access to specific facilities using the improved two-step floating catchment area (2SFCA) approach. The outcomes of this approach could assist in uncovering neighborhoods facing challenges in accessing these facilities, providing valuable insights for policymakers to create strategies to mitigate these gaps.
- Approach 3: Building catchment area
Building a catchment area typically refers to defining and establishing a geographical area from which a particular organization, facility, or service draws its customers, clients, or users. Catchment areas are commonly used in various fields, such as healthcare, education, business, and public services. This approach considers generating a buffer area around the residential buildings or working spaces based on the specified walking distances. Using ArcGIS Network Analyst tools, Zhang et al. [45] established a street-based network buffer centered on each residence. Hölzel, Kolsch, and de Vries [46] assigned POIs to respective coworking spaces based on 500 m circular zones around the coworking spaces, while Marino et al. [20] examined the surrounding areas of the coworking spaces considering traveling through the street network (instead of Euclidean distance).
Guzman et al. [47] and Luo et al. [48] computed radius isochrones from household locations, varying the walking time threshold. Balletto et al. [22] adopted a novel approach to enhance pedestrians’ accessibility in urban central locations. A set of indexes was developed that were then combined with the concept of centrality, which considers both the quantity and quality of a set of essential services and activities located near a selected subset of buildings. The 15-minute isochrones were calculated for the subgroup of abandoned public buildings in the historic center of Cagliari in Sardinia, Italy.
The process of building a catchment area involves several steps:
- -
- Defining the purpose and objectives: Clearly outline the purpose and objectives of establishing a catchment area. For example, a hospital might define its catchment area to ensure that it serves a specific population, or a business might want to target a particular demographic [60].
- -
- Research and analysis: Conduct thorough research and analysis to understand the demographics, population density, and other relevant factors in the potential catchment area. Utilize demographic data, market research, and geographic information systems (GIS) to gather relevant information [17].
- -
- Identify key factors that influence the catchment area, such as transportation infrastructure, competitor locations, the socio-economic status of residents, and potential demand for the services or products [48].
- -
- Consider accessibility and evaluate the accessibility of the catchment area for the target population. Consider transportation options, proximity to major roads, public transportation, and other factors affecting how easily people can reach the location [47].
As such, building a catchment area is an iterative process that requires ongoing attention to changing circumstances and a commitment to meeting the needs of the target population.
- Approach 4: Mixed approach
Pajares et al. [46] employed a mixed approach to create an interactive accessibility tool called Geo Open Accessibility Tool (GOAT). This tool found utility in over 20 German municipalities, the City of Bogota in Colombia, and Matosinhos in Portugal. In the context of GOAT, contour-based accessibility measures were implemented in two distinct ways: single travel time isochrones (Approach 3) and multi-isochrones (Approach 2).
Carraa et al. [50] conducted a comparative analysis between the ex-post and the ex-ante assessments of an urban regeneration project. Their goal was to assess the project’s impact on walkability and provide scenarios illustrating how much improvement or worsening the project generated. First, they considered pedestrian isochrones originating from specific POIs (Approach 2). Second, they considered pedestrian isochrones originating from the entrances of residences (Approach 3). Balletto et al. [50] compare two case studies in Brescia and Cagliari in Italy by employing two approaches (Approach 2 and Approach 3).
Gaglione et al. [61] used two approaches to conduct two spatial analyses in a GIS environment to detect the demand (Approach 1) and supply (Approach 2) ratio. Meanwhile, Tang et al. [51] compared the results of four conventional methods. Method 1 (Buffer Analysis) identifies all the residential buildings that can reach a POS within 500 m of its buffer zone. Method 2 (2D Network Analysis) defines the buildings as accessible when the walking distance from the buildings to POS is within 500 m of the network distance. Method 3 (3D Network Analysis) is the same as Method 2, except that a 3D instead of a 2D network distance is used in the analysis. Finally, Method 4 involves time-based factors and direction-specific movement of pedestrians over a 5-minute walk.
- Approach 5: Network-based method/graph representation method
A planar graph, often employed to model urban environments, consists of vertices representing road intersections and edges representing road segments (Figure 7). The lengths of these edges are proportional to the travel time with a coefficient, which is the speed of the pedestrians. It is worth noting that in this way, the 15-MC was calculated starting from services and not from residences.
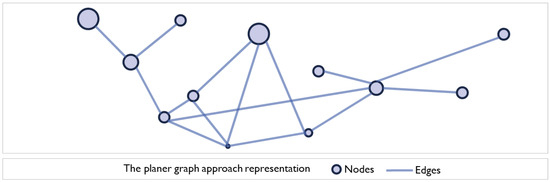
Figure 7.
The concept of network-based method/graph representation method. Source: The authors based on Barbier et al. [53] and Pinedo, Moreno, and Daudén [55].
Three reviewed articles employed this method. Barbier et al. [53] and Pinedo et al. [55] developed a methodology to calculate pedestrian travel time to reach selected services across all the potential paths on urban graphs. Zhang et al. [54] proposed a network-based evaluation framework. Using a planar graph, they estimated the optimal mobility network by considering the spatial arrangement of urban amenities and the population.
In recent years, representation by urban graphs has been used to refine the concept of the 15-minute city [53,62]; however, it is worth noting that the extensive computational time required to find all the shortest paths within these graphs has occasionally led to the use of Euclidean measures instead of graph-based distances [54].
- Approach 6: Indicator and index-based method
Urbanization has been explored in great detail in recent years, with researchers and professionals seeking ways to make cities more livable, accessible, and efficient. One concept that has gained traction is a “15-minute city,” which refers to a city where all essential amenities can be reached within a 15-minute walk or bike ride. Several reviewed articles have proposed indicator- and index-based methods to measure this concept’s effectiveness.
One article by Badii et al. [24] and Liu et al. [44,57] proposes a 15-minute city index model and its computability approach. This model aims to measure the degree to which a city can be considered a 15-minute city, based on factors such as distance to amenities, mode of transportation, and population density.
Meanwhile, Monteiro et al. [56] have adopted the “15-minute city” indicator in combination with three additional indicators to assess the potential benefits of urbanizing vacant spaces within a city. Their approach is quantitative, using GIS to analyze and visualize the data.
Another study by Bartzokas-Tsiompras and Bakogiannis [6] developed a “15-minute walking city” index to evaluate the walkability of 121 European metropolitan areas across seven different amenity types. They combined the data equally using the PROMETHEE II multicriteria approach to determine the final score and create a ranking of these 15-minute cities. Overall, these studies provide valuable insights into the concept of a 15-minute city and offer practical tools for assessing its feasibility and effectiveness.
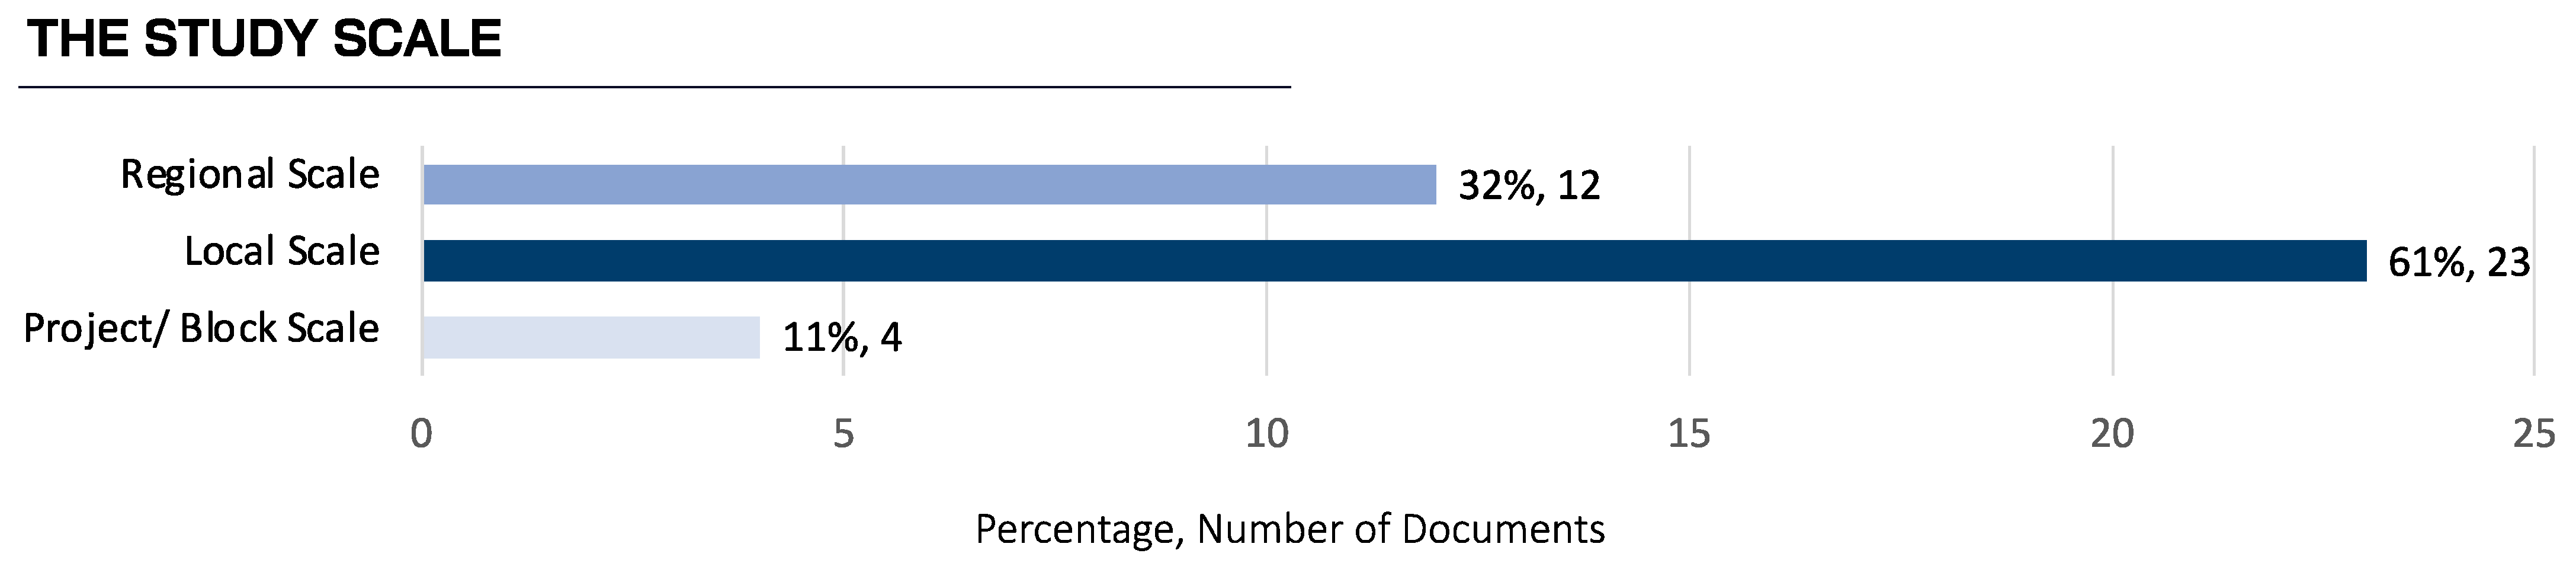
3.3. Results on the Scale of the Study Area
In this review, the case studies from the reviewed articles were organized into three categories: the regional scale, the local scale, and the project/block scale [14] (Figure 8). Through this review, the scale was decided based on the specific units of analysis in each part of the analyzed cities across time. The regional-scale perspective primarily addressed comprehensive urban planning and larger urban contexts. Its main objective was to address issues related to sustainable urban development, the strategic placement of services and activities, and disparities in the supply and demand of services, particularly in areas where service deficiencies were identified [40].
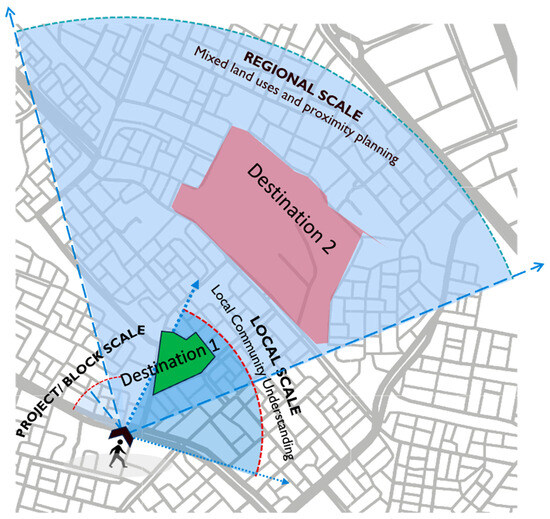
Figure 8.
The different scales were adopted in the reviewed articles—source: authors based on [19].
On the other hand, the local-scale perspective focused on the interactions and activities of residents within their neighborhoods in their day-to-day lives. This scale primarily tackled issues related to public health, the well-being of elderly residents [41], and social services considerations [35]. One of the aims here was to equip policymakers with the most current insights into disadvantaged neighborhoods [41]. Finally, the project/block-scale case studies considered the details of specific levels of analysis. These studies looked more closely at individual projects or city blocks, providing in-depth examinations and insights into specific urban regeneration projects [22,52]. Most of the articles, 61% (n = 23), investigated the proximity measuring methods at the local scale (Figure 9). A regional scale was presented in 32% of the papers (n = 12). Meanwhile, the project/block scale was the less commonly addressed scale, with a percentage of 11% (n = 4).
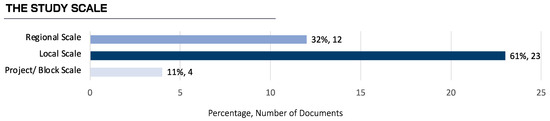
Figure 9.
The number of documents adopted different spatial scales. Source: the authors.
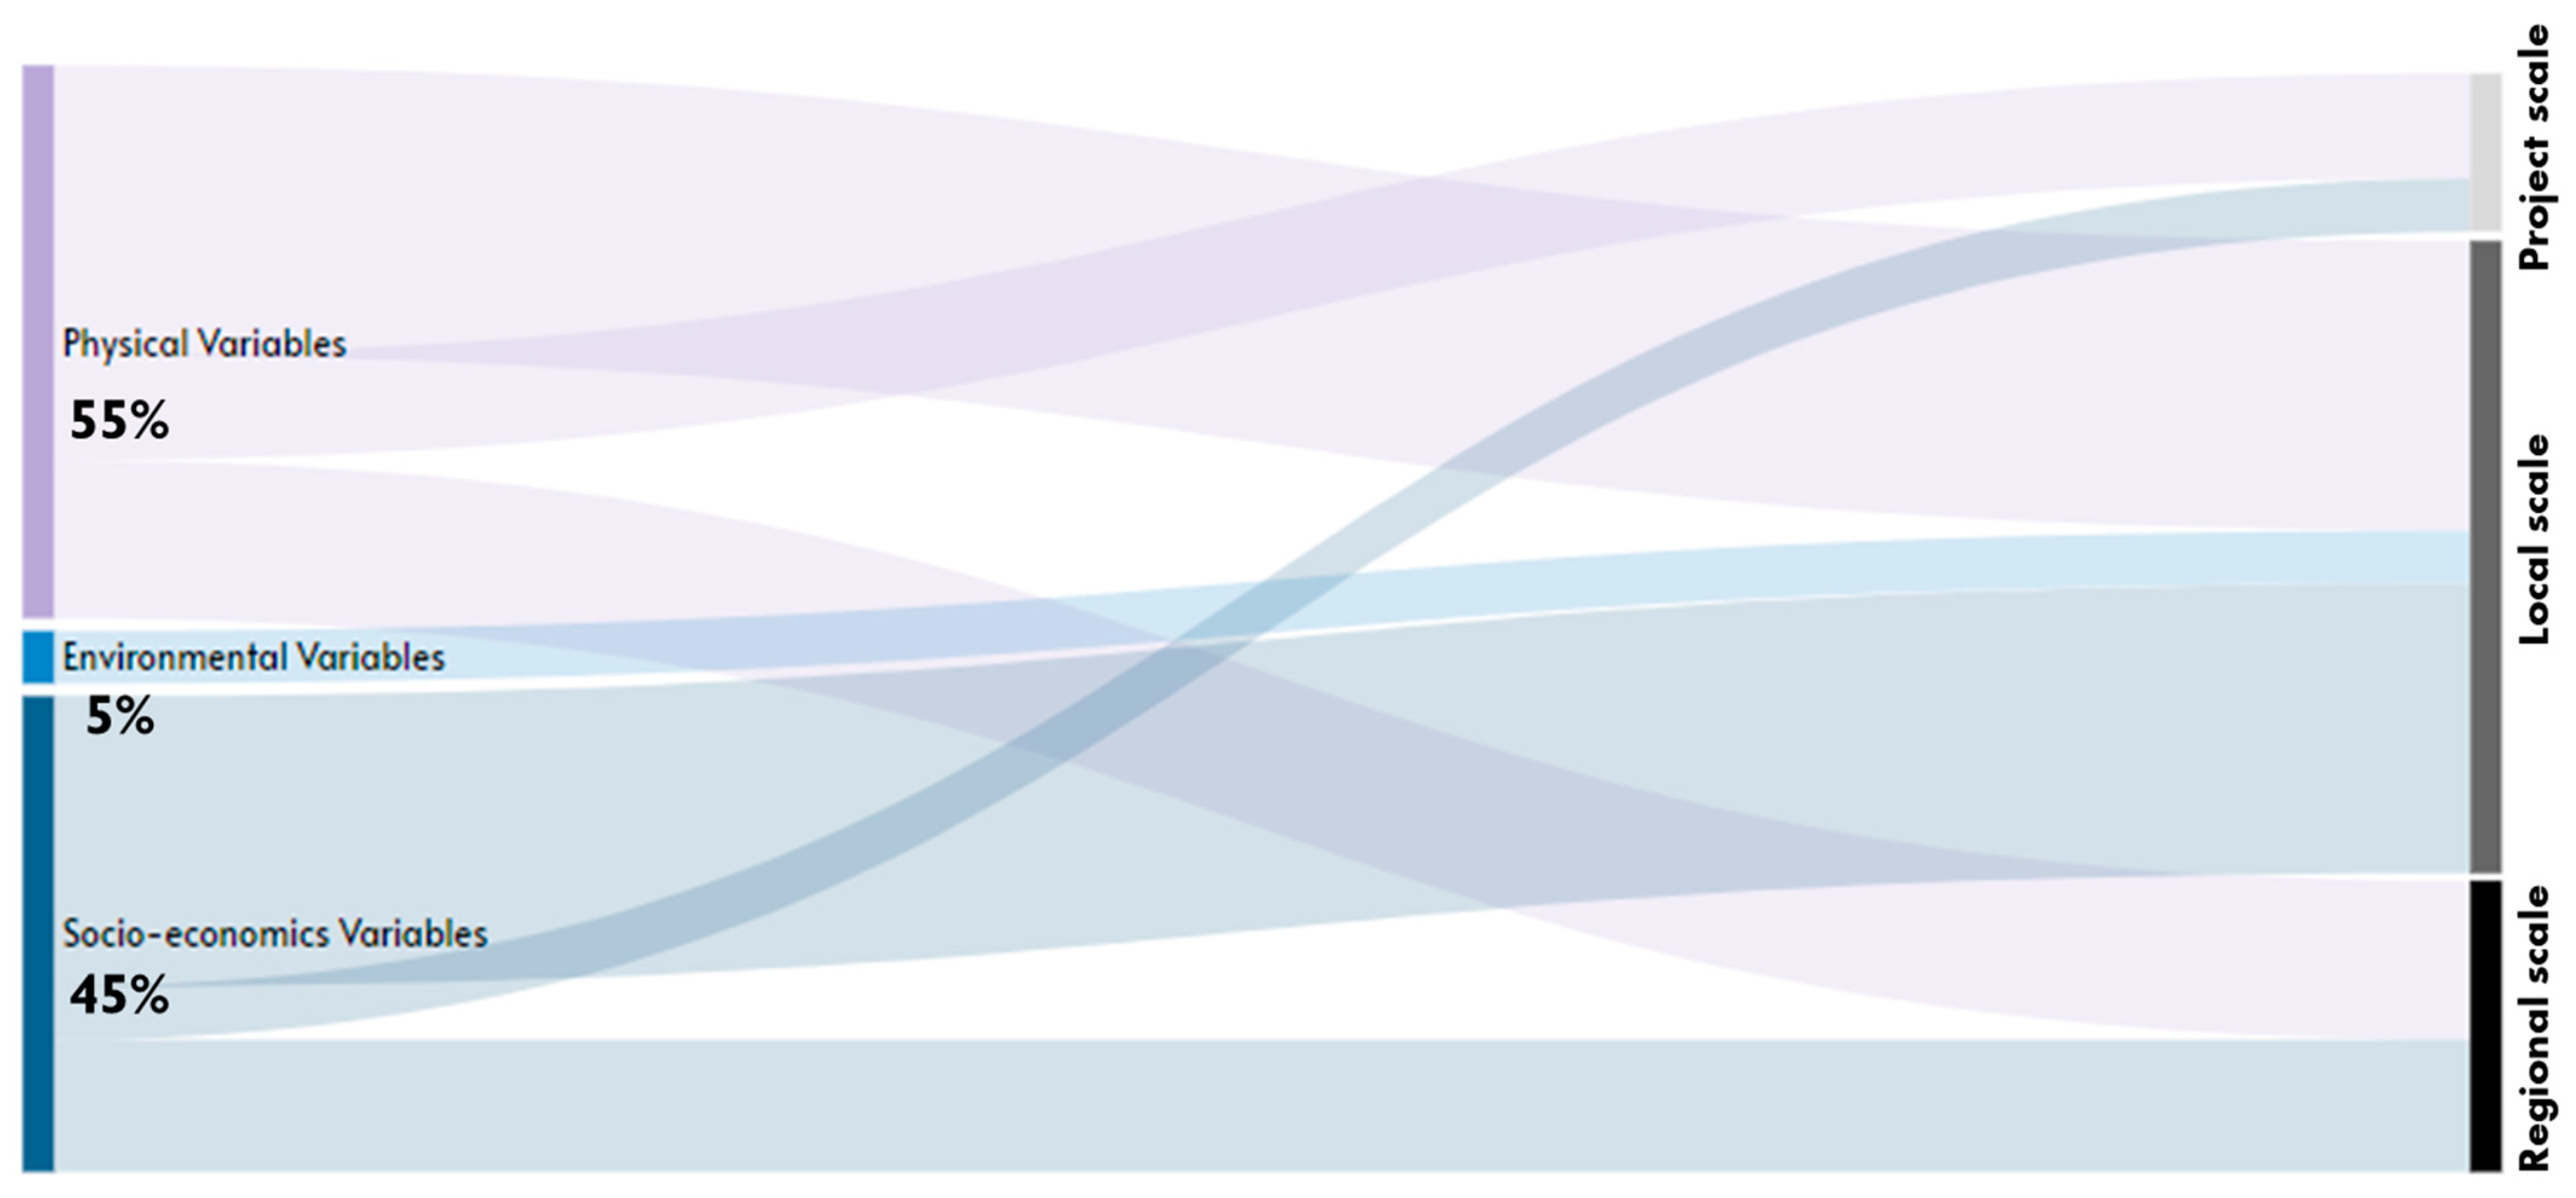
3.4. Results on the Variables Used
Calculating and assessing different variables is fundamental in reflecting the situation [55]. This analysis identifies all the variables considered in the reviewed documents, classifying them into three main groups. These groups include physical factors, such as building density, road slope, and road conditions; socioeconomic factors, encompassing variables like age and income; and environmental factors, with examples like climate.
As shown in Figure 10, physical factors are the most frequently employed, accounting for 55% of the cases, followed by socioeconomic factors at 45%. Environmental factors are the least commonly employed, at only 5%.
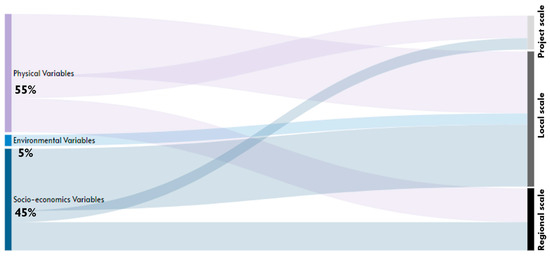
Figure 10.
The percentage of variables employed on different scales. Source: the authors.
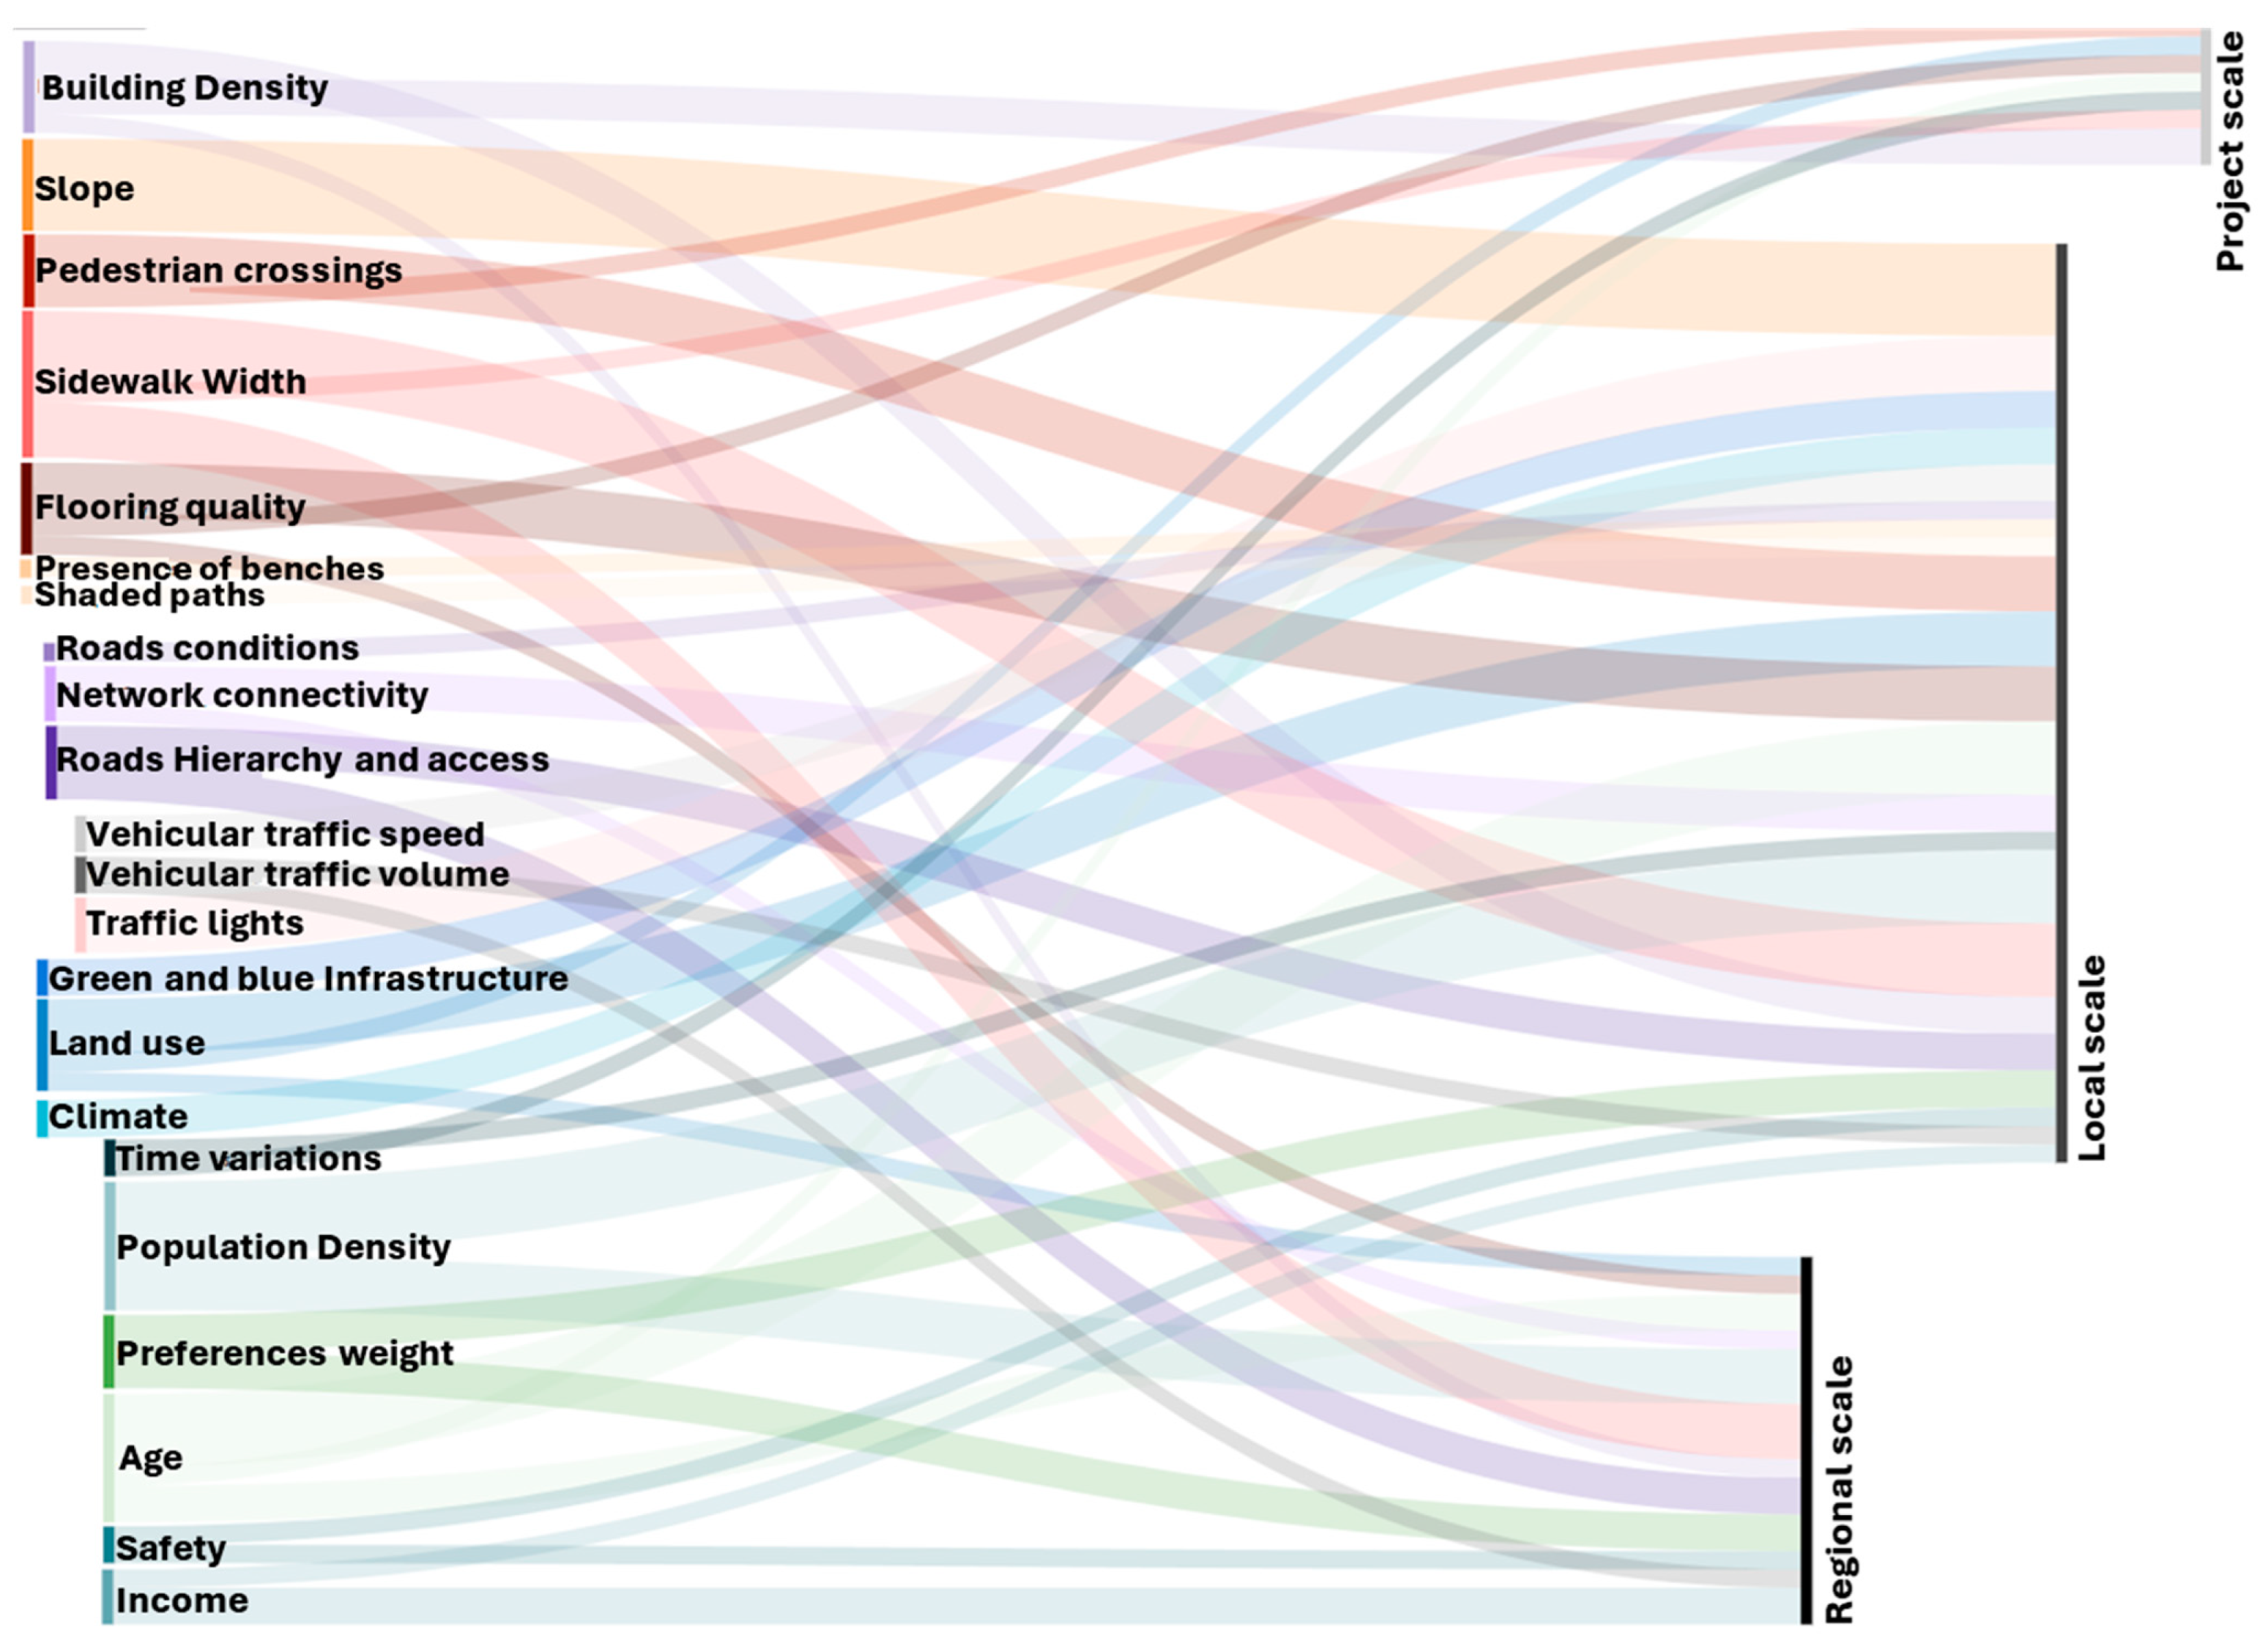
It is important to note that all categories of factors are primarily used locally. However, road-related and socioeconomic factors are more associated with regional than project scales. Building-related factors are mainly included in documents focused on local and project scales. Figure 11 displays the frequency of sub-categories of variables mentioned in the reviewed documents and their associated scale. Population density and sidewalk variables are the most frequently used, followed by the age variable. On the other hand, variables related to road conditions and landscape, such as shaded paths, green and blue infrastructure, and benches, are used less frequently.
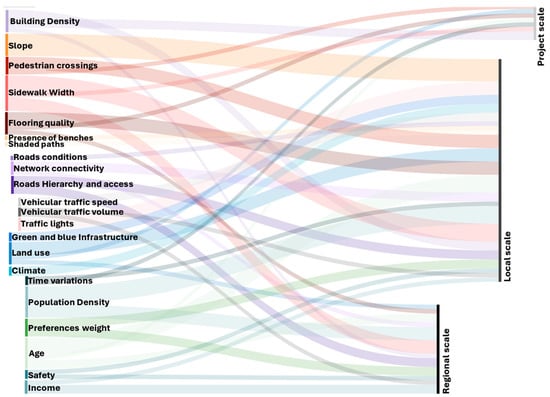
Figure 11.
The frequency distribution of variables on different scales. Source: the authors.
The local scale exclusively employs road slopes, traffic lights, shaded paths, benches, climate, road conditions, and vehicular traffic speed. In contrast, green and blue infrastructure are only utilized on the project scale. Age, sidewalks, flooring quality, land use, and building density variables are employed across all three scales: local, regional, and project.
4. Discussion: Finding the Deficiencies and Outlook
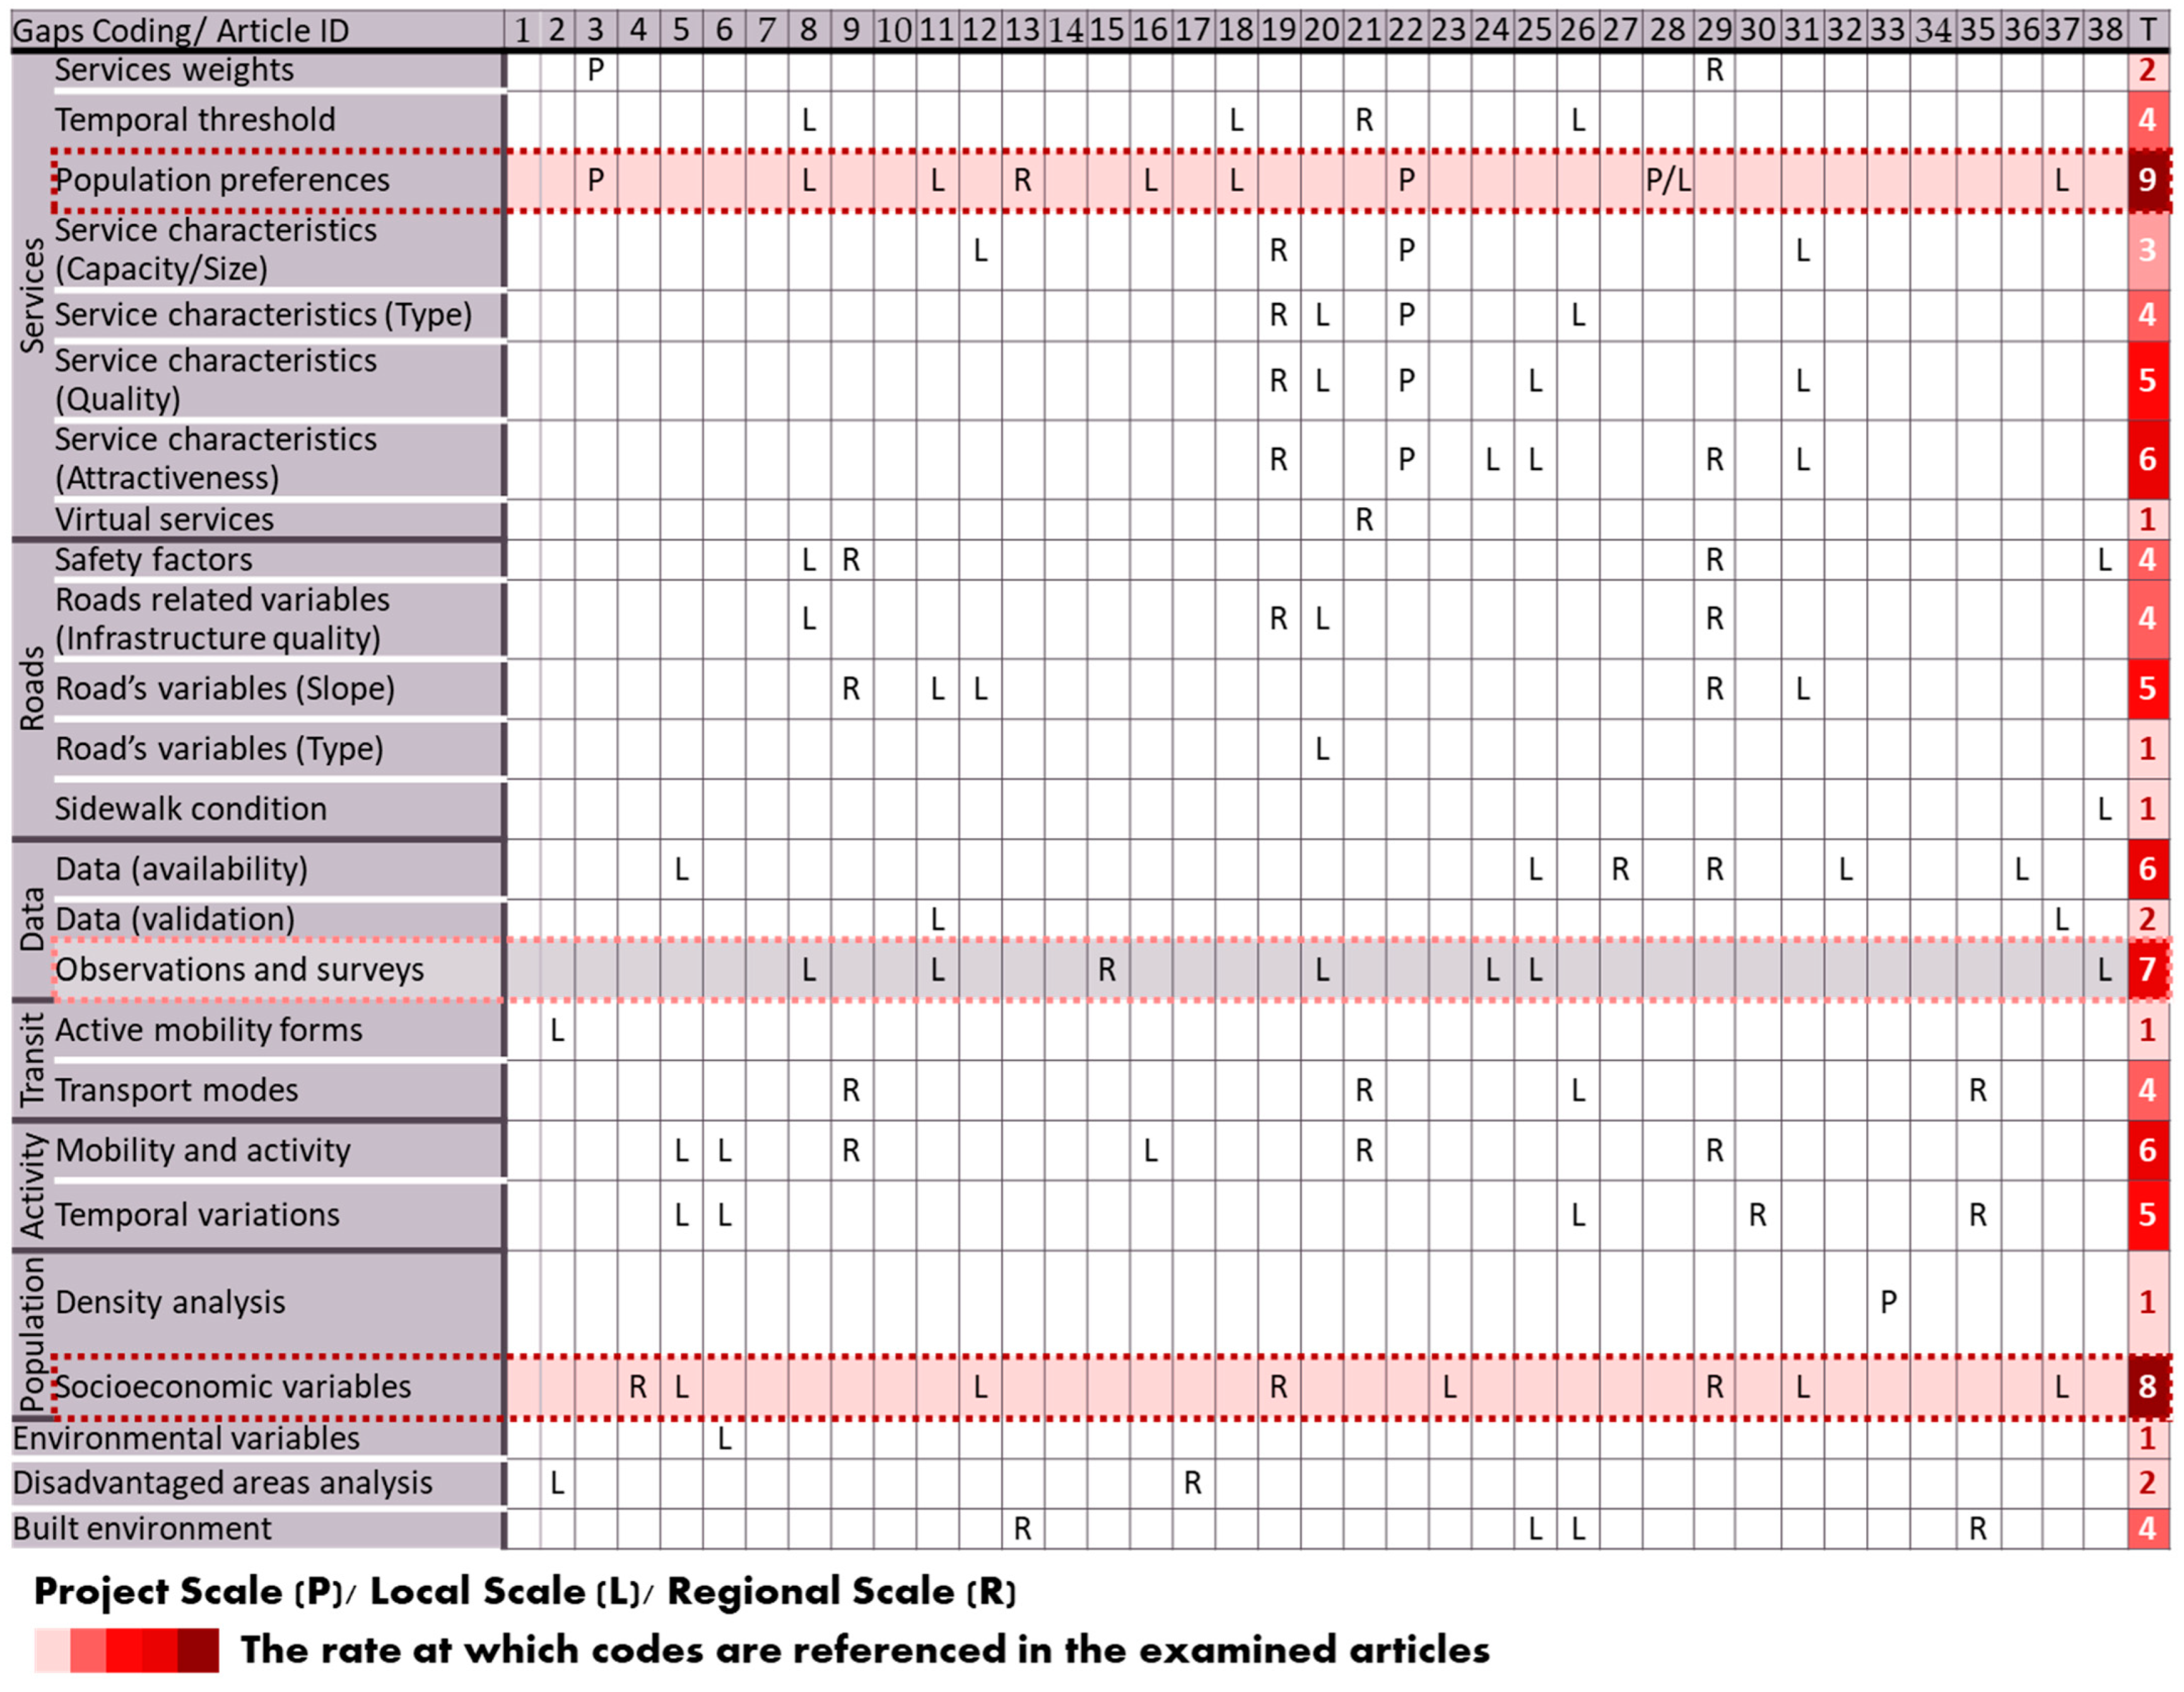
The limitations and future research tracks were extracted from all the reviewed documents. These segments were further categorized into specific codes to represent the following aspects: services, roads, data, transit, activity, population, environmental variables, disadvantaged areas, and the built environment.
Figure 12 shows this gap heatmap, which was created to illustrate the frequency of these codes mentioned within the reviewed documents. The heatmap visually represents the distribution of documents across different scales: project (P), local (L), and regional (R). A higher total presence number across these scales emphasizes the need to include and integrate this code into measurement models for x-minute cities. This integration is deemed crucial for achieving a more accurate representation of real-world situations, given the significance of considering the project, local, and regional dimensions when developing measurement models for x-minute cities. This comprehensive approach ensures that the models capture urban planning and development’s diverse and interconnected aspects, contributing to a more nuanced understanding of the challenges and opportunities associated with achieving x-minute city goals.
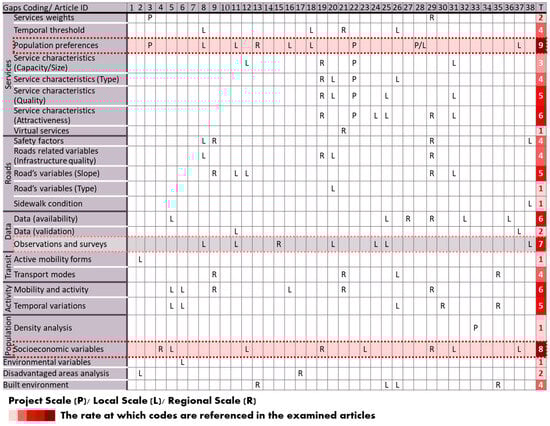
Figure 12.
Gap heatmap (the red dotted lines indicate the necessity of including and integrating P, L, and/or R codes into measurement models for x-minute cities). Source: the authors.
By incorporating this code across various scales, planners and policymakers can enhance the effectiveness of their strategies, addressing the unique needs and characteristics of different contexts. This holistic integration ultimately paves the way for more robust and adaptable urban planning initiatives that align with the complex dynamics of contemporary urban environments. It was observed in this study that population preferences and socioeconomic variables were the most frequently mentioned codes in the documents, with the population preferences code appearing nine times and the socioeconomic variables code mentioned eight times. The “observations and surveys” code was also mentioned seven times.
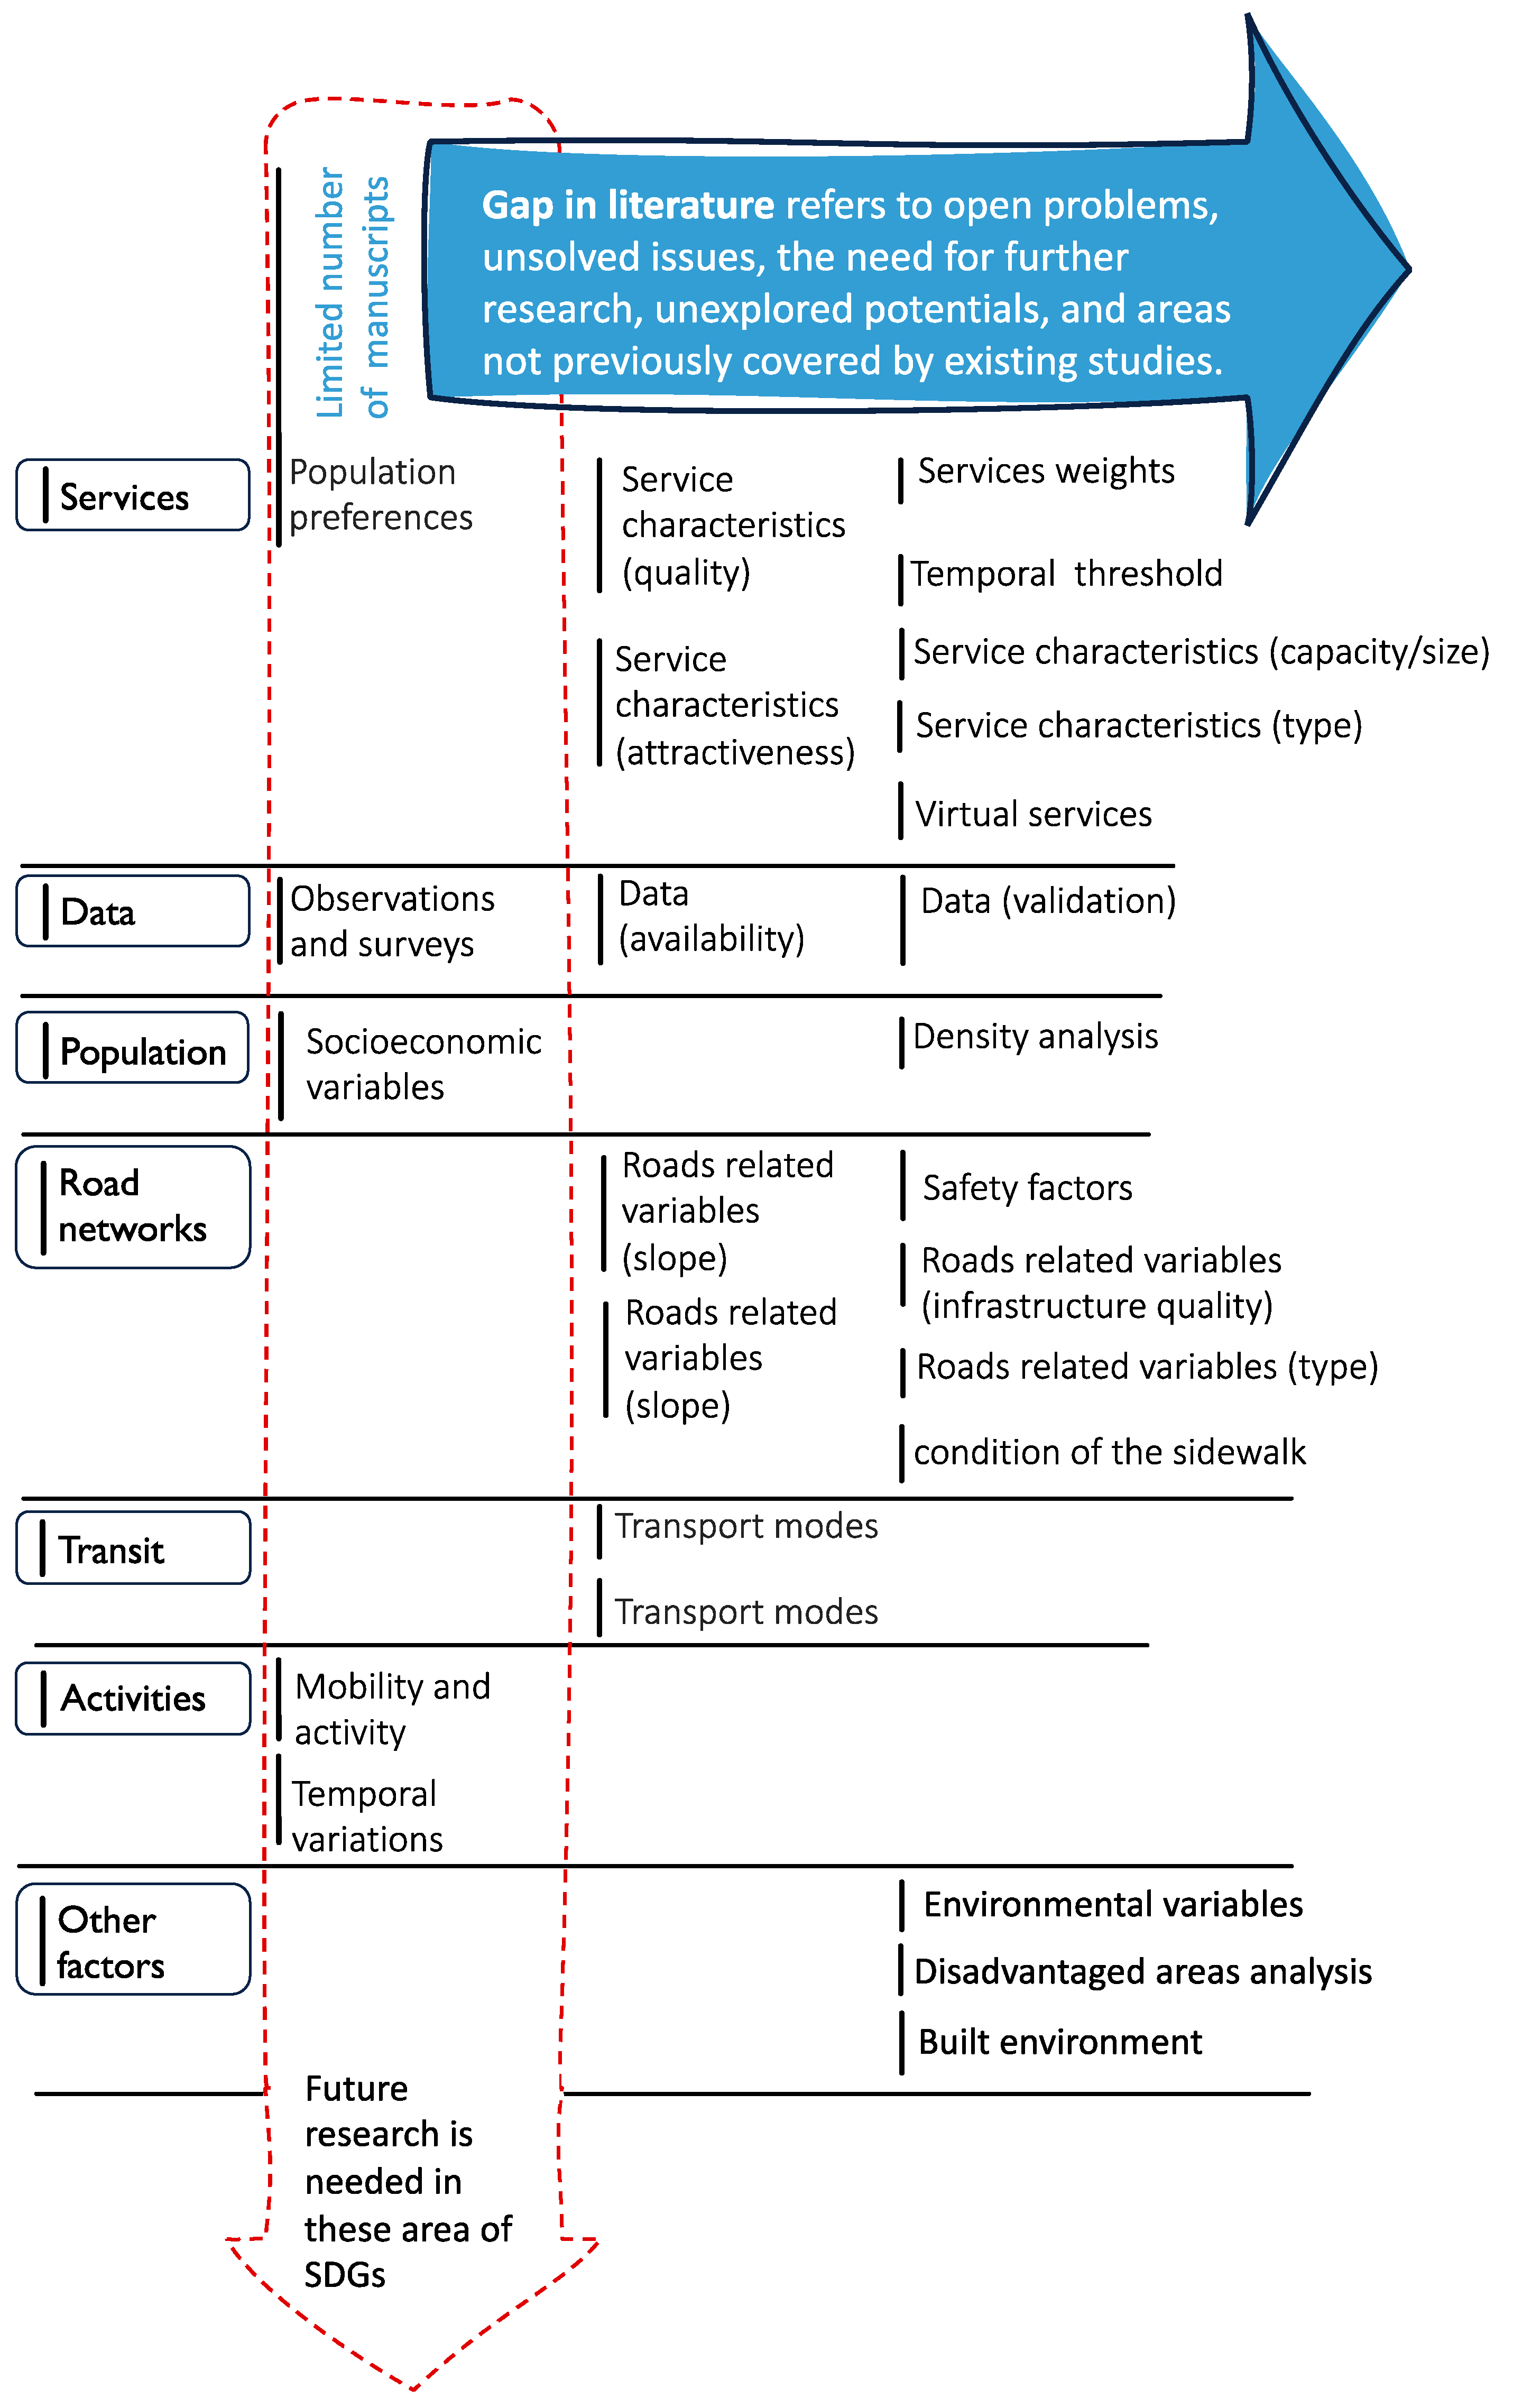
The population preferences code refers to the consideration of what should be the overall set of activities and services that represent potential destinations capable of satisfying the pedestrian accessibility temporal objective. Secondly, what is the more appropriate temporal threshold for different services from a population perspective besides the facilities the pedestrians chose? Although the reviewed models have already integrated several socioeconomic factors like population density, age, and income, the gap map reveals a need for the inclusion of additional socioeconomic variables, such as gender and educational attainment, in future models to capture the variations in human mobility [5], occupational characteristics, and activity plans. Figure 13 shows the gap in the literature that requires future research in x-minute cities.
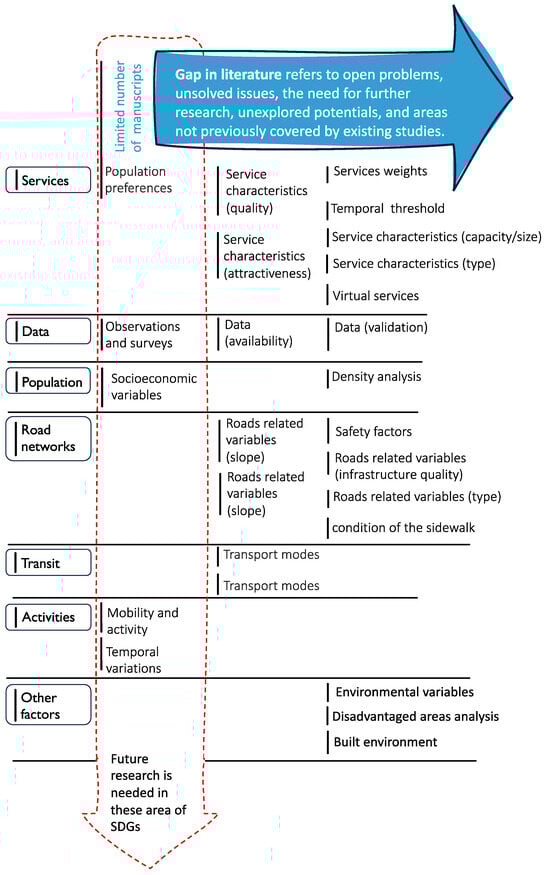
Figure 13.
The gap in the literature about the factors affecting x-minute cities requires future research directions. Source: the authors.
Regarding the observations and survey code, it is suggested that these models should be combined with direct observations, surveys, and investigations of pedestrian behavior and mobility habits. These surveys may include using GPS devices to track actual routes or adopting simulation models for behavior-based mobility schemes [31]. This integration of real-world data and observations can provide valuable insights into pedestrian behavior and improve the accuracy of models.
Our investigated literature describes the position of determining the various levels of proximity to services [31,38]. Creating walkable cities where residents can easily access their daily needs within a short distance from their homes may seem like a simple task, but measuring the level of accessibility presents challenges that can hinder the achievement of this goal [15]. Our research has yielded equivalent results, highlighting the need to bridge the gap in approaches that can effectively measure this goal. As such, our research provides future research directions based on the literature shortage regarding 10-, 15-, or 20-minute cities. This shortage has guided our research to highlight the need for implementation in distributing services regarding population preferences and socioeconomic variables. Using surveys and spatial observations as data collection methods, the selected literature sample illustrates the open problem of data collection. Regarding the proximity of land use and activities, our study can guide decision-makers and policymakers in considering urban planning and design that supports mobility. Research in urban design can guide socio-spatial studies for temporal variation in Global South cities.
Previous studies suggest linking the SDGs to x-minute cities can be achieved through hierarchical networks, simple neighborhood models based on physical parameters, and improving urban areas for walking and cycling. The link between the “x-minute city” concept and the United Nations Sustainable Development Goals (SDGs) lies in their shared commitment to creating more sustainable, inclusive, and resilient urban environments [16,34,61]. Several SDGs directly align with the principles of the x-minute city, and achieving the goals can be facilitated by implementing the key ideas behind this urban planning concept. Our results confirmed some connections between the x-minute city and SDGs:
- Goal 3—Good Health and Well-being: The x-minute city seeks to enhance the well-being of residents by reducing the need for long commutes, promoting physical activity through walkable neighborhoods, and improving air quality. These aspects contribute to achieving the health-related targets outlined in Goal 3 [40].
- Goal 8—Decent Work and Economic Growth: By creating mixed-use urban spaces that bring together living, working, and recreational activities, the x-minute city can support local economies and contribute to the goals of sustainable economic growth and decent work opportunities (SDG 8) [30,63].
- Goal 10—Reduced Inequality: Creating neighborhoods where essential services are accessible within short distances can contribute to reducing spatial inequalities and improving access to resources for all residents, aligning with the objectives of Goal 10 [41].
- Goal 11—Sustainable Cities and Communities: SDG 11 specifically focuses on making cities inclusive, safe, resilient, and sustainable. The x-minute city concept emphasizes reducing commuting times, promoting mixed-use development, and creating walkable neighborhoods, which aligns closely with the objectives of Goal 11 [30,40,64].
- Goal 13—Climate Action: The x-minute city’s emphasis on reducing car dependency, promoting walking, biking, and efficient public transportation helps address climate-related challenges by decreasing greenhouse gas emissions associated with commuting [30,40].
The concept of the “x-minute city” offers a comprehensive approach to urban development that promotes the achievement of multiple Sustainable Development Goals (SDGs), thereby contributing to the broader global agenda for sustainable development. It considers social, economic, and environmental factors to create more livable and resilient cities, making urban planning more holistic.
In addition, achieving the UN-SDG 11.7 target of “providing access to safe and inclusive green and public spaces” necessitates the proximity of services within walking distance. The connection between this goal and service proximity underscores the importance of strategic urban planning, ensuring that essential services are conveniently accessible to residents on foot.
Reviewing our articles indicated that by integrating services within walking distance of green and public spaces, communities can enhance both the safety and inclusivity of these areas. As such, the x-minute cities approach promotes a sense of community, encourages physical activity, and facilitates social interaction. It aligns with the broader objective of creating sustainable and people-centered urban environments. Furthermore, the emphasis on walking distances as a measure of proximity aligns with the principles of promoting pedestrian-friendly cities. This contributes to residents’ well-being and addresses environmental concerns by reducing reliance on motorized transportation.
Our results also align with previous studies that discuss the essential role of people’s preferences in choosing a mode of transportation that can ease city commutes [60,65]. Additionally, it is vital to raise university students in urban planning and design programs with skills to design walkable places [66,67]. In summary, combining safe and inclusive green and public spaces with the proximity of essential services within walking distance represents a holistic approach to urban development, fostering healthier, more connected, and sustainable communities.
5. Conclusions, Limitations, and Future Research
This study reviewed 38 documents related to x-minute city evaluation models using the PRISMA approach. This article addressed two main queries about the approaches employed to measure proximity within the context of x-minute cities and variables integrated into these measurement models to reflect real-world scenarios accurately. The review was organized into the geographic location, assessment approach, scale, variables used, and limitations review. The review revealed that these models were predominantly concentrated in a few countries despite the potential need for such models in other regions. This concentration might be attributed to the scarcity of data in these other regions. The evaluation of x-minute cities relied on several datasets from various sources, which were essential for a city to qualify as an x-minute city. These datasets included residential parcel data, network data, points of interest, and socio-economic datasets. The choice of specific data for analysis considered the priorities outlined by city residents and data accessibility.
Based on the PRISMA protocol, our findings conclude that the POI catchment area approach emerged as the predominant method, closely followed by the grid-based approach. These findings underscore the importance of considering critical variables related to the population, such as preferences, socio-economic factors, and survey data, in future assessments. Notably, the reviewed studies emphasized the need for future research to prioritize disadvantaged areas and delve into specific service characteristics. This focus reflects a growing awareness of the importance of equitable urban planning and ensuring accessibility for all residents.
The analytical approach in these studies highlights the crucial role of localizing neighborhood services and facilities in planning x-minute cities or neighborhoods. The results suggest that achieving x-minute city goals can be attained through traditional methods supported by territorial information systems, considering both urban morphological and functional characteristics and socio-economic variables. However, this study advocates for an integrated approach that combines these traditional methods with direct observations and surveys to capture real-world scenarios comprehensively. This holistic methodology is essential for obtaining a more nuanced and accurate understanding of the complex interplay of factors influencing urban accessibility and service provision.
This study conducted a bibliometric investigation using the Web of Science (WOS) database and adhered to the PRISMA statement. The bibliometric analysis’s primary outcomes facilitated identifying gaps in the literature concerning x-minute cities. The researchers of this study aimed to explore the methodologies employed in the development of 10-, 15-, and 20-minute cities.
However, it is essential to note some limitations in the study. Firstly, due to the scope of the research, the findings may not encompass the entirety of the subject matter. Additionally, the study faced constraints in the number of articles available for the PRISMA protocol, thereby influencing the comprehensiveness of the results. Despite these limitations, the present study contributes valuable insights into the existing literature on x-minute cities. Further research with an expanded scope and a broader dataset may provide a more comprehensive understanding of the topic. A notable limitation identified in the study is the oversight of additional proximity considerations, specifically building configuration and permeability. Neglecting these factors may hinder smooth accessibility to services, highlighting the need for future investigations into the various elements influencing proximity.
Therefore, in future research, we may need to expand our study by including other databases, such as Scopus. Additionally, urban planners and designers need to thoroughly evaluate the quality of the studies included in our analysis. Finally, we should undertake a more extensive field analysis to understand the research better.
Supplementary Materials
The following supporting information can be downloaded at: https://drive.google.com/drive/folders/1gtfawKEYnBQhdlbSRPW1RdKb9zojE4xF (accessed on 1 January 2024).
Author Contributions
Conceptualization, G.M.; methodology, G.M., A.E. and S.A.; software, G.M. and S.A.; validation, A.E. and M.A.E.; formal analysis, G.M.; investigation, M.A.E., A.E. and S.A.; resources, G.M., A.E., S.A. and M.A.E.; data curation, G.M. and S.A.; writing—original draft preparation, G.M. and A.E.; writing—review and editing, G.M., A.E., S.A. and M.A.E.; visualization, G.M. and A.E.; supervision, M.A.E. All authors have read and agreed to the published version of the manuscript.
Funding
This research received no external funding.
Institutional Review Board Statement
Not applicable.
Informed Consent Statement
Not applicable.
Data Availability Statement
Data is contained within the article and supplementary materials.
Acknowledgments
The authors express their gratitude to the guest editors and reviewers for their dedication to reading and reviewing this study.
Conflicts of Interest
The authors declare no conflicts of interest.
References
- Allam, Z.; Bibri, S.E.; Chabaud, D.; Moreno, C. The theoretical, practical, and technological foundations of the 15-minute city model: Proximity and its environmental, social and economic benefits for sustainability. Energies 2022, 15, 6042. [Google Scholar] [CrossRef]
- Tran, M.-C. Healthy cities—walkability as a component of health-promoting urban planning and design. J. Sustain. Urban. Plan. Prog. 2016, 1, 11–21. [Google Scholar] [CrossRef]
- Gerten, C.; Fina, S. Scrutinizing the buzzwords in the mobility transition: The 15-minute-city, the one-hour metropolis, and the vicious cycle of car dependency. Projections 2022, 16, 1–41. [Google Scholar]
- Lima, F.T.; Costa, F. The quest for proximity: A systematic review of computational approaches towards 15-minute cities. Architecture 2023, 3, 393–409. [Google Scholar] [CrossRef]
- Abusaada, H. Strengthening the affectivity of atmospheres in urban environments: The toolkit of multi-sensory experience. Int. J. Arch. Res. Archnet-IJAR 2020, 14, 379–392. [Google Scholar] [CrossRef]
- Bartzokas-Tsiompras, A.; Bakogiannis, E. Quantifying and visualizing the 15-Minute walkable city concept across Europe: A multicriteria approach. J. Maps 2023, 19, 2141143. [Google Scholar] [CrossRef]
- Abusaada, H.; Elshater, A. Effects of urban atmospheres on changing attitudes of crowded public places: An action plan. Int. J. Community Well-Being 2020, 3, 109–159. [Google Scholar] [CrossRef]
- Elshater, A.; Abusaada, H. People’s absence from public places: Academic research in the post-COVID-19 era. Urban Geogr. 2022, 43, 1268–1275. [Google Scholar] [CrossRef]
- Elshater, A.; Abusaada, H. Exploring the types of blogs cited in urban planning research. Plan. Pract. Res. 2022, 38, 62–80. [Google Scholar] [CrossRef]
- Ghanem, S.; Ahmad, A.F.; Aboualy, S. COVID-19 bringing cairenes back to their streets. J. Urban Manag. 2021, 10, 393–408. [Google Scholar] [CrossRef]
- El-Bardisy, N.; Elshater, A.; Afifi, S.; Alfiky, A. Predicting traffic sound levels in Cairo before, during, and after the COVID-19 lockdown using Predictor-LimA software. Ain Shams Eng. J. 2023, 14, 1–11. [Google Scholar] [CrossRef]
- Abusaada, H.; Elshater, A. COVID-19 and “the trinity of boredom” in public spaces: Urban form, social distancing and digital transformation. Int. J. Arch. Res. Archnet-IJAR 2022, 16, 172–183. [Google Scholar] [CrossRef]
- Schraven, D.; Joss, S.; de Jong, M. Past, present, future: Engagement with sustainable urban development through 35 city labels in the scientific literature 1990–2019. J. Clean. Prod. 2021, 292, 125924. [Google Scholar] [CrossRef]
- Elshater, A. The ten-minute neighborhood is [not] a basic planning unit for happiness in Egypt. Int. J. Arch. Res. Archnet-IJAR 2016, 10, 344–357. [Google Scholar] [CrossRef]
- Abdelfattah, L.; Deponte, D.; Fossa, G. The 15-minute city as a hybrid model for Milan. J. Land Use Mobil. Environ. 2022, 17, 71–86. [Google Scholar]
- Calafiore, A.; Dunning, R.; Nurse, A.; Singleton, A. The 20-minute city: An equity analysis of Liverpool City Region. Transp. Res. Part D Transp. Environ. 2022, 102, 103111. [Google Scholar] [CrossRef]
- Elshater, A.; Abusaada, H.; Tarek, M.; Afifi, S. Designing the socio-spatial context urban infill, liveability, and conviviality. Built Environ. 2022, 48, 341–363. [Google Scholar] [CrossRef]
- Asaad, M.; Hassan, G.F.; Elshater, A.; Afifi, S. Global South research priorities for neighbourhood sustainability assessment tools. Open House Int. 2024, 49, 45–62. [Google Scholar] [CrossRef]
- Osman, R.; Mulíček, O. Urban chronopolis: Ensemble of rhythmized dislocated places. Geoforum 2017, 85, 46–57. [Google Scholar] [CrossRef]
- Di Marino, M.; Tomaz, E.; Henriques, C.; Chavoshi, S.H. The 15-minute city concept and new working spaces: A planning perspective from Oslo and Lisbon. Eur. Plan. Stud. 2023, 31, 598–620. [Google Scholar] [CrossRef]
- Solá, A.G.; Vilhelmson, B. Negotiating proximity in sustainable urban planning: A Swedish case. Sustainability 2018, 11, 31. [Google Scholar] [CrossRef]
- Balletto, G.; Ladu, M.; Milesi, A.; Borruso, G. A methodological approach on disused public properties in the 15-minute city perspective. Sustainability 2021, 13, 593. [Google Scholar] [CrossRef]
- Ferrer-Ortiz, C.; Marquet, O.; Mojica, L.; Vich, G. Barcelona under the 15-minute city Lens: Mapping the accessibility and proximity potential based on pedestrian travel times. Smart Cities 2022, 5, 146–161. [Google Scholar] [CrossRef]
- Badii, C.; Bellini, P.; Cenni, D.; Chiordi, S.; Mitolo, N.; Nesi, P.; Paolucci, M. Computing 15MinCityIndexes on the basis of open data and services. In Computational Science and Its Applications—ICCSA; Springer: Cham, Switzerland, 2021. [Google Scholar]
- van Eck, R.; de Jong, T. Accessibility analysis and spatial competition effects in the context of GIS-supported service location planning. Comput. Environ. Urban Syst. 1999, 23, 75–89. [Google Scholar] [CrossRef]
- Ataman, C.; Tuncer, B. Urban interventions and participation tools in urban design processes: A systematic review and thematic analysis (1995–2021). Sustain. Cities Soc. 2021, 76, 103462. [Google Scholar] [CrossRef]
- Abusaada, H.; Elshater, A. Notes on developing research review in urban planning and urban design based on PRISMA statement. Soc. Sci. 2022, 11, 391. [Google Scholar] [CrossRef]
- Elshater, A.; Abusaada, H. Developing process for selecting research techniques in urban planning and urban design with a PRISMA-compliant review. Soc. Sci. 2022, 11, 471. [Google Scholar] [CrossRef]
- Wang, J.; Kwan, M.-P.; Liu, D.; Peng, X. Assessing the spatial distribution of and inequality in 15-minute PCR test site accessibility in Beijing and Guangzhou, China. Appl. Geogr. 2023, 154, 102925. [Google Scholar] [CrossRef] [PubMed]
- Willberg, E.; Fink, C.; Toivonen, T. The 15-minute city for all?—Measuring individual and temporal variations in walking accessibility. J. Transp. Geogr. 2023, 106, 103521. [Google Scholar] [CrossRef]
- Logan, T.; Hobbs, M.; Conrow, L.; Reid, N.; Young, R.; Anderson, M. The x-minute city: Measuring the 10, 15, 20-minute city and an evaluation of its use for sustainable urban design. Cities 2022, 131, 103924. [Google Scholar] [CrossRef]
- Yang, Y.; Qian, Y.; Zeng, J.; Wei, X.; Yang, M. Walkability measurement of 15-minute community life circle in Shanghai. Land 2023, 12, 153. [Google Scholar] [CrossRef]
- Page, M.J. PRISMA 2020 explanation and elaboration: Updated guidance and exemplars for reporting systematic reviews. BMJ 2021, 372, n160. [Google Scholar] [CrossRef] [PubMed]
- Mariotti, I.; Giavarini, V.; Rossi, F.; Akhavan, M. Exploring the “15-minute city” and near working in Milan using mobile phone data. J. Land Use Mobil. Environ. 2022, 2, 39–56. [Google Scholar]
- Caselli, B.; Carra, M.; Rossetti, S.; Zazz, M. From urban planning techniques to 15-minute neighbourhoods. A theoretical framework and GIS-based analysis of pedestrian accessibility to public services. Eur. Transp. 2021, 85, 1–15. [Google Scholar] [CrossRef]
- Kesarovski, T.; Hernández-Palacio, F. Time, the other dimension of urban form: Measuring the relationship between urban density and accessibility to grocery shops in the 10-minute city. Environ. Plan. B Urban Anal. City Sci. 2023, 50, 44–59. [Google Scholar] [CrossRef]
- El Karim, A.A.; Awawdeh, M.M. Integrating GIS accessibility and location-allocation models with multicriteria decision analysis for evaluating quality of life in Buraidah City, KSA. Sustainability 2020, 12, 1412. [Google Scholar] [CrossRef]
- Da Silva, D.C.; King, D.A.; Lemar, S. Accessibility in practice: 20-minute city as a sustainability planning goal. Sustainability 2019, 12, 129. [Google Scholar] [CrossRef]
- Harroucha, R.; Chaouni, A.-A. Mosques pedestrian accessibility analysis under the 15 min cities concept. GeoJournal 2023, 88, 3575–3594. [Google Scholar] [CrossRef]
- Noworól, A.; Kopyciński, P.; Hałat, P.; Salamon, J.; Hołuj, A. The 15-minute city—The geographical proximity of services in Krakow. Sustainability 2022, 14, 7103. [Google Scholar] [CrossRef]
- Zhang, D.; Ma, S.; Fan, J.; Xie, D.; Jiang, H.; Wang, G. Assessing spatial equity in urban park accessibility: An improve two-step catchment area method from the perspective of 15-minute city concept. Sustain. Cities Soc. 2023, 98, 104824. [Google Scholar] [CrossRef]
- Harroucha, R.; Chaouni, A.-A. GIS-based approach evaluating sustainable spatio-functional accessibility to mosques. Ann. GIS 2023, 29, 429–439. [Google Scholar] [CrossRef]
- Balletto, G.; Sechi, F.; Borruso, G.; Sinatra, M.; Meloni, I.; Fancello, G. Mobility and land-use system in the sport mega-events. The case of the Cagliari stadium (Sardinia, Italy). Eur. Transp./Trasp. Eur. 2023, 93, 1–16. [Google Scholar] [CrossRef]
- Liu, D.; Kwan, M.-P.; Kan, Z.; Wang, J. Toward a healthy urban living environment: Assessing 15-minute green-blue space accessibility. Sustainability 2022, 14, 16914. [Google Scholar] [CrossRef]
- Zhang, S.; Wu, W.; Xiao, Z.; Wu, S.; Zhao, Q.; Ding, D.; Wang, L. Creating livable cities for healthy aging: Cognitive health in older adults and their 15-minute walkable neighbourhoods. Cities 2023, 137, 104312. [Google Scholar] [CrossRef]
- Hölzel, M.; Kolsch, K.-H.; de Vries, W.T. Location of coworking spaces (CWSs) regarding vicinity, land use and points of interest (POIs). Land 2022, 11, 354. [Google Scholar] [CrossRef]
- Guzman, L.A.; Arellana, J.; Oviedo, D.; Aristizabal, C.A.M. COVID-19, activity and mobility patterns in Bogotá. Are we ready for a ‘15-minute city’? Travel Behav. Soc. 2021, 24, 245–256. [Google Scholar] [CrossRef]
- Luo, J.; Zha, S.; Song, G.; He, X.; Song, H.; Chen, J.; Liu, H.; Feng, Y. Assessing inequity in green space exposure toward a “15-minute city” in Zhengzhou, China: Using deep learning and urban big data. Int. J. Environ. Res. Public Health 2022, 19, 5798. [Google Scholar] [CrossRef]
- Pajares, E.; Büttner, B.; Jehle, U.; Nichols, A.; Wulfhorst, G. Accessibility by proximity: Addressing the lack of interactive accessibility instruments for active mobility. J. Transp. Geogr. 2021, 93, 103080. [Google Scholar] [CrossRef]
- Carraa, M.; Rossett, S.; Tiboni, M.; Vetturi, D. Urban regeneration effects on walkability scenarios. TeMA 2022, 1, 101–114. [Google Scholar]
- Tang, B.-S.; Wong, K.K.; Tang, K.S.; Wong, S.W. Walking accessibility to neighbourhood open space in a multi-level urban environment of Hong Kong. Environ. Plan. B: Urban Anal. City Sci. 2021, 48, 1340–1356. [Google Scholar] [CrossRef]
- Balletto, G.; Pezzagno, M.; Richiede, A. 15-minute city in urban regeneration perspective: Two methodological approaches compared to support decisions. In Computational Science and Its Applications—ICCSA 2021; Springer: Cham, Switzerland, 2021. [Google Scholar]
- Barbier, L.; D’Autilia, R.; Marrone, P.; Montella, I. Graph representation of the 15-minute city: A comparison between Rome, London, and Paris. Sustainability 2023, 15, 3772. [Google Scholar] [CrossRef]
- Zhang, S.; Zhen, F.; Kong, Y.; Lobsang, T.; Zou, S. Towards a 15-minute city: A network-based evaluation framework. Urban Anal. City Sci. 2022, 50, 500–514. [Google Scholar] [CrossRef]
- Pinedo, J.C.; Moreno, M.B.; Daudén, P.J.L. Beyond land use mix, walkable trips. An approach based on parcel-level land use data and network analysis. J. Maps 2021, 17, 23–30. [Google Scholar] [CrossRef]
- Monteiro, J.; Para, M.; Sousa, N.; Natividade-Jesus, E.; Ostorero, C.; Coutinho-Rodrigues, J. Filling in the spaces: Compactifying cities towards accessibility and active transport. ISPRS Int. J. Geo-Inf. 2023, 12, 120. [Google Scholar] [CrossRef]
- Liu, D.; Kwan, M.-P.; Wang, J. Developing the 15-minute city: A comprehensive assessment of the status in Hong Kong. Travel Behav. Soc. 2024, 34, 100666. [Google Scholar] [CrossRef]
- Song, G.; He, X.; Kong, Y.; Li, K.; Song, H.; Zhai, S.; Luo, J. Improving the spatial accessibility of community-level healthcare service toward the ‘15-minute city’ goal in China. ISPRS Int. J. Geo-Inf. 2022, 11, 436. [Google Scholar] [CrossRef]
- Leon, F.U.; Parra, J.C.; Perucich, F.V.; Contreras, F.C.; Nuñez, C.A. “15-minute city” and elderly people: Thinking about healthy cities. Smart Cities 2023, 6, 1043–1058. [Google Scholar] [CrossRef]
- Abusaada, H.; Elshater, A. Improving visitor satisfaction in Egypt’s Heliopolis historical district. J. Eng. Appl. Sci. 2021, 68, 19. [Google Scholar] [CrossRef]
- Gaglione, F.; Gargiulo, C.; Zucaro, F.; Cottrill, C. 15-minute neighbourhood accessibility: A comparison between Naples and London. Eur. Transp. 2021, 85, 1–16. [Google Scholar] [CrossRef]
- Vich, G.; Gomez-Varo, I.; Marquet, O. Measuring the 15-minute city in Barcelona. A geospatial three-method comparison. In Resilient and Sustainable Cities Research, Policy and Practice; Elsevier: Amesterdam, The Netherlands, 2023; pp. 39–60. [Google Scholar]
- Elshater, A.; Abusaada, H.; Alfiky, A.; El-Bardisy, N.; Elmarakby, E.; Grant, S. Workers’ satisfaction vis-à-vis environmental and socio-morphological aspects for sustainability and decent work. Sustainability 2022, 14, 1699. [Google Scholar] [CrossRef]
- Moreno, C.; Allam, Z.; Chabaud, D.; Gall, C.; Pratlong, F. Introducing the “15-minute city”: Sustainability, resilience and place identity in future post-pandemic cities. Smart Cities 2021, 4, 93–111. [Google Scholar] [CrossRef]
- Wael, S.; Elshater, A.; Afifi, S. Mapping user experiences around transit stops using computer vision technology: Action priorities from Cairo. Sustainability 2022, 14, 11008. [Google Scholar] [CrossRef]
- Megahed, G.; Elshater, A.; Afifi, S.M. Competencies urban planning students need to succeed in professional practices: Lessons learned from Egypt. Int. J. Arch. Res. Archnet-IJAR 2018, 14, 267–287. [Google Scholar] [CrossRef]
- Burton, L.O.; Salama, A.M. Sustainable development goals and the future of architectural education—Cultivating SDGs-centred architectural pedagogies. Int. J. Arch. Res. Archnet-IJAR 2023, 17, 421–442. [Google Scholar] [CrossRef]


Disclaimer/Publisher’s Note: The statements, opinions and data contained in all publications are solely those of the individual author(s) and contributor(s) and not of MDPI and/or the editor(s). MDPI and/or the editor(s) disclaim responsibility for any injury to people or property resulting from any ideas, methods, instructions or products referred to in the content. |
© 2024 by the authors. Licensee MDPI, Basel, Switzerland. This article is an open access article distributed under the terms and conditions of the Creative Commons Attribution (CC BY) license (https://creativecommons.org/licenses/by/4.0/).