Abstract
The global population’s growth and increased energy consumption have driven greenhouse gas (GHG) emissions. In Canada, the residential sector accounts for 17% of secondary energy use and 13% of GHG emissions. To mitigate GHG emissions, promoting renewable energy and efficient heating systems is crucial, especially in cold climates like Canada, where there is a heavy dependency on fossil fuels for space heating applications. A viable solution is hybrid fuel heating systems that combine electric-driven air-source heat pumps (ASHPs) with natural gas tankless water heaters (TWHs). This system can alternate its operation between the ASHP and TWH based on efficiency and real-time energy costs, reducing grid peak demand and enhancing resilience during power outages. Although lab experiments have shown its benefits, in situ performance lacks evaluation. This study analyzes the in situ energy performance of a net-zero ready house and its hybrid fuel heating system, assessing energy consumption, hourly space heating output, and system heating performance. HOT2000 is a robust simulation software designed for assessing energy consumption, space heating, cooling, and domestic hot water systems in residential buildings. An artificial neural network model was developed to predict the energy performance of the hybrid fuel system, which was used as a substitute for monitored data for evaluating the HOT2000’s simulation results under the same weather conditions. Therefore, this study proposes a comprehensive framework for the in situ performance analysis of hybrid fuel heating systems. This study then, using HOT2000 energy consumption results, evaluates the life cycle costs of the hybrid fuel system against conventional heating systems. Furthermore, this study proposes an economical control strategy using in situ data or manufacturer specifications.
1. Introduction
As the global population has grown and energy usage increased, the growing consumption of fossil fuels has led to a corresponding increase in greenhouse gas (GHG) emissions. This has contributed to both the global energy crisis and climate change, prompting researchers to explore alternative energy sources. In Canada, the residential sector in 2018 was responsible for approximately 17% of the country’s total secondary energy consumption, compared to 39% in the industrial sector and 29% in the transportation industry [1]. Additionally, the residential sector accounts for 13% of GHG emissions [1], with household water and space heating representing a significant portion of total housing energy consumption [2]. In order to reduce energy consumption and curb GHG emissions, it is essential to promote the use of clean energy (e.g., electricity produced from renewable sources) and energy-efficient heating systems while remaining economical.
Conventional electric heat pumps are widely used due to their energy efficiency, but their performance can be adversely affected by low ambient temperatures. A hybrid fuel heating system that incorporates an air-source heat pump (ASHP) and a natural gas boiler is a potential solution for increasing the efficiency of heating systems in cold climates. When the heating efficiency of the electric heat pump and a natural gas tankless water heater (TWH) are equivalent, the cost of operating the TWH for space heating is significantly lower than that of the heat pump. The advantages of this hybrid energy heating system have inspired the collaborative builder to incorporate this system into actual residential buildings, recognizing its potential for enhanced efficiency and effectiveness. The benefits of this hybrid energy source system include the following: (1) the ability to install a smaller and more cost-effective heat pump due to the gas boiler’s ability to handle cold peaks; (2) a reduction in peak demand on the grid compared to heat pump-only installations; (3) improved resilience over heat pump-only systems during power outages, as the gas boiler can supply heat with only fan power if the home is equipped with a small battery backup; and (4) easy retrofitting in conjunction with existing natural gas furnace or boiler systems.
Many studies have explored the advantages of the hybrid heat pump and natural gas heating system in energy and cost savings. In the existing literature, Park, Nam [3] introduced a hybrid heating system capable of performing space heating combined with domestic hot water heating. Their analysis showed a 2% to 30% higher efficiency than conventional water heaters and an annual savings cost of 8.9% if applied in the US, although energy savings were highly dependent on the operational method and ambient temperature. An alternative hybrid heat pump system investigated by Klein, Huchtemann [4] comprising an electrically driven air-to-water heat pump and a condensing gas boiler in full-year numerical simulations showed 12–26% primary energy savings compared to conventional boiler systems. Wang et al. [5] concluded that a hybrid gas boiler and electric heating system, which contains air conditioners and a water tank, was able to provide a more economical heating solution for smart homes, leading to about 22.6% and 21.9% operating energy cost savings compared to pure electricity and pure gas solutions, respectively. Alternatively, a simulation study conducted in Ireland by Saffari et al. [6], validated with physical house data, investigated retrofit options for a single detached house constructed in 1999 that had an existing hydronic natural gas heating system. All retrofit options utilizing electric heat pumps resulted in negative net present values, even after considering government rebates. There have also been studies investigating control systems for hybrid heating systems, for example, by Li, Zheng [7], who modeled an operational strategy of a hybrid gas boiler and heat pump heating system and suggested constant water flow rate in the system resulted in much less energy consumption than the conventional coal-fired boiler heating system. In the United Kingdom, a massive field test conducted by Sun et al. [8] collected data from 75 households with hybrid space heating systems. These systems consisted of small-scale ASHPs and natural gas boilers, and a control algorithm was used to maximize savings. It was found that the control algorithm preferred to take advantage of low electricity prices during the night to preheat homes using the heat pump where possible; however, the heat pumps alone were not capable of providing all space heating toward the studied homes given local climatic conditions.
In cold climates, the space heating demand during cooler months often exceeds the year-round levels in moderate climates, highlighting the importance of prioritizing efficient heating solutions to reduce energy consumption. In the United States, from the US EIA [9], 71.7% of energy consumed toward space heating in 2020 was natural gas. In the colder regions of the US, this number increased to 73.6%, with propane and other types of fuels also contributing to 18.7% of the total. In terms of adopting electrical heating solutions in cold climates such as Canada, one of the biggest barriers to implementation is cost [10,11,12,13]. Udovichenko and Zhong [11] conducted a feasibility study in Canada where they used support vector regression models to determine the necessary heating load in various Canadian cities. The simulation results showed hybrid systems were feasible in some parts of Canada, but there was variation across the cold climate of Canada, where a hybrid system was less feasible in the city of Edmonton. Another study in Ontario, Canada, by Demirezen et al. [12] involved equipping a house with both a natural gas furnace and an electric ASHP, implementing a newly designed controller to optimize the hybrid heating system. Their findings, which were based on a comparison of experimental, catalogue, and simulated data, showed encouraging improvements in indoor air quality over conventional space heating systems. In Latvia, an experimental study was conducted by Tihana et al. [13] with a hybrid space heating system in a single detached house, consisting of an electric ASHP and a natural gas boiler. The experiment found for the system in question that electricity price was not the only limiting factor, but the heating capability of the heat pump resulted in a cut-off temperature of −7 °C, which played a large role as well for the given climate. In terms of water heating, a study by Li and Du [14] entailed a heat pump gas water heater and space heating hybrid system under two control strategies with different operational modes, with the results showing that the hybrid system could save about 20% to 65% of the energy cost of the gas water heater at −5 °C to 20 °C ambient temperatures. It also could save about 6% to 70% of hourly energy costs compared to the gas heaters from −15 °C to 20 °C ambient temperatures in space heating applications. Li [15] introduced a loop configuration for the hybrid heating system, incorporating an economically focused control strategy. This innovative approach yielded operational cost savings of 10% to 60%, effectively optimizing system efficiency across a range of ambient temperatures from −12 °C to 20 °C.
Considering the energy performance of net-zero houses, Thomas and Duffy [16] conducted a monitoring study on approximately 15 different net-zero and nearly net-zero houses in New England. The results indicated an average energy intensity of 0.49 kWh/m2/person/month. AlFaris, Juaidi, and Manzano-Agugliaro [17] explored a fully net-zero home in Saudi Arabia, establishing a benchmark for net-zero energy performance in a global climate. Their study also provided a breakdown of energy consumption within the home. Li et al. [18] conducted a monitoring study on residential units in Edmonton, Canada. The results revealed that the annual energy consumption of a single detached house was 16,381 kWh, with 57% of energy consumption attributed to space heating and cooling.
The evaluation of in situ performance is vital to bridging the gap between simulated results and actual energy performance. Accurately predicting building energy performance is essential for improving energy efficiency and reducing environmental impact. Comparing in situ performance with simulated values is imperative, allowing for the validation of simulations and providing insights into real-world system efficiency, particularly in cold climates. These comparisons help fine-tune simulation models and ensure predictions align with actual energy performance, thus contributing to more effective energy-efficient solutions. However, predicting building energy performance can be difficult due to the numerous factors that can affect energy consumption. Several methods have been suggested to estimate how well a building will use energy. These can be roughly put into three groups: first principles methods that use specialized software and thermal dynamic functions; statistical methods that use regression models to find links between different factors and energy use; and artificial intelligence methods like support vector machines (SVMs) or artificial neural networks (ANNs) [19]. Natural Resources Canada has developed and widely used the popular energy simulation modeling software HOT2000 in Canada [20]. However, the use of HOT2000 for energy prediction requires numerous inputs, and the calculations may rely on default software values, such as climatic conditions and system operational methods. As a result, the simulation results may be relatively imprecise and incomparable with the monitored results. Therefore, it is necessary to investigate methods for precisely comparing software-modeled results with monitoring results.
Compared to software tools, artificial intelligence methods have become popular in predicting energy consumption due to their effectiveness in solving non-linear problems [21]. Among various artificial intelligence methods, the ANN-based model has become one of the most commonly used models. The ANN was first proposed by McCulloch and Pitts [22], as a computational technique inspired by biological neural networks. ANNs are composed of interconnected layers of neurons that employ various functions. Li, Han [23] reviewed twelve methods for benchmarking building energy consumption and suggested that ANNs are well suited for predicting space heating load and total energy consumption. Bagnasco, Fresi [24] applied a backpropagation algorithm-based multi-layer perceptron ANN to forecast day-ahead load consumption for a large facility, yielding satisfactory results with reasonable error. Esen, Esen [25] developed an ANN model to assess the performance of a solar ground-source heat pump, which produced a successful forecast with an R-squared value of 0.9627. González and Zamarreño [26] proposed a novel approach to predicting short-term building load using a feedback neural network trained with a hybrid algorithm. Their method showed precise predictions with only atmospheric temperature and electric power measurements as inputs. Hou, Lian [27] integrated rough sets and ANN algorithms using a data fusion technique to forecast the cooling load of an air conditioning system. Kwok, Yuen [28] investigated the modeling of a building cooling load using an MLP-based ANN that considered the building’s occupancy rate. By training a neural network with high-quality data, an ANN model can potentially yield accurate predictions that reflect in situ performance. This approach enables a more realistic demonstration of actual energy consumption within the HOT2000 simulation environment.
Although laboratory experiments and simulations have shown the benefits of hybrid heat pump and natural gas boiler systems, and some research has explored their in situ performance, there remains a gap in evaluating these hybrid fuel heating systems specifically for residential buildings in cold climates using simulation tools. Hence, the aim of this study is to evaluate the in situ performance of a hybrid energy heating system situated in a cold climate, while identifying the differences between the actual performance and mainstream energy modeling results by implementing an ANN model and comparing the performance and cost of the hybrid energy system with other residential energy systems. Additionally, an economical control strategy is proposed for the hybrid heating system. This study will provide valuable insights into the in situ performance of hybrid energy heating systems in cold climates, as well as contribute to improvement in energy modeling results.
2. System Description and In Situ Energy Performance
This section details the in situ hybrid space heating system. This includes a description of the duplex that was selected for analysis, a description of the energy monitoring system used to collect performance data, and full details of the ASHP and tankless water heater hybrid system. A framework is then laid out for how to assess the efficiencies and performances of the hybrid heating system and discusses the locations of the sensors that were installed in the case building. With all the collected data, a performance assessment of the unit was conducted, and the energy consumption trends of the studied unit were investigated and benchmarked compared to Alberta’s average values. Relations and conclusions regarding performance were then drawn based on the experimental data.
2.1. Description of the Hybrid Fuel Heating System
The hybrid fuel heating system under study was installed in the right unit of a residential duplex house situated in Edmonton, Canada. This duplex house was designed to be energy-efficient and net-zero ready. The studied unit of the duplex house serves as a show house and has a main floor area of 1898 sq. ft. The floor plan of the duplex house can be found in Appendix A.
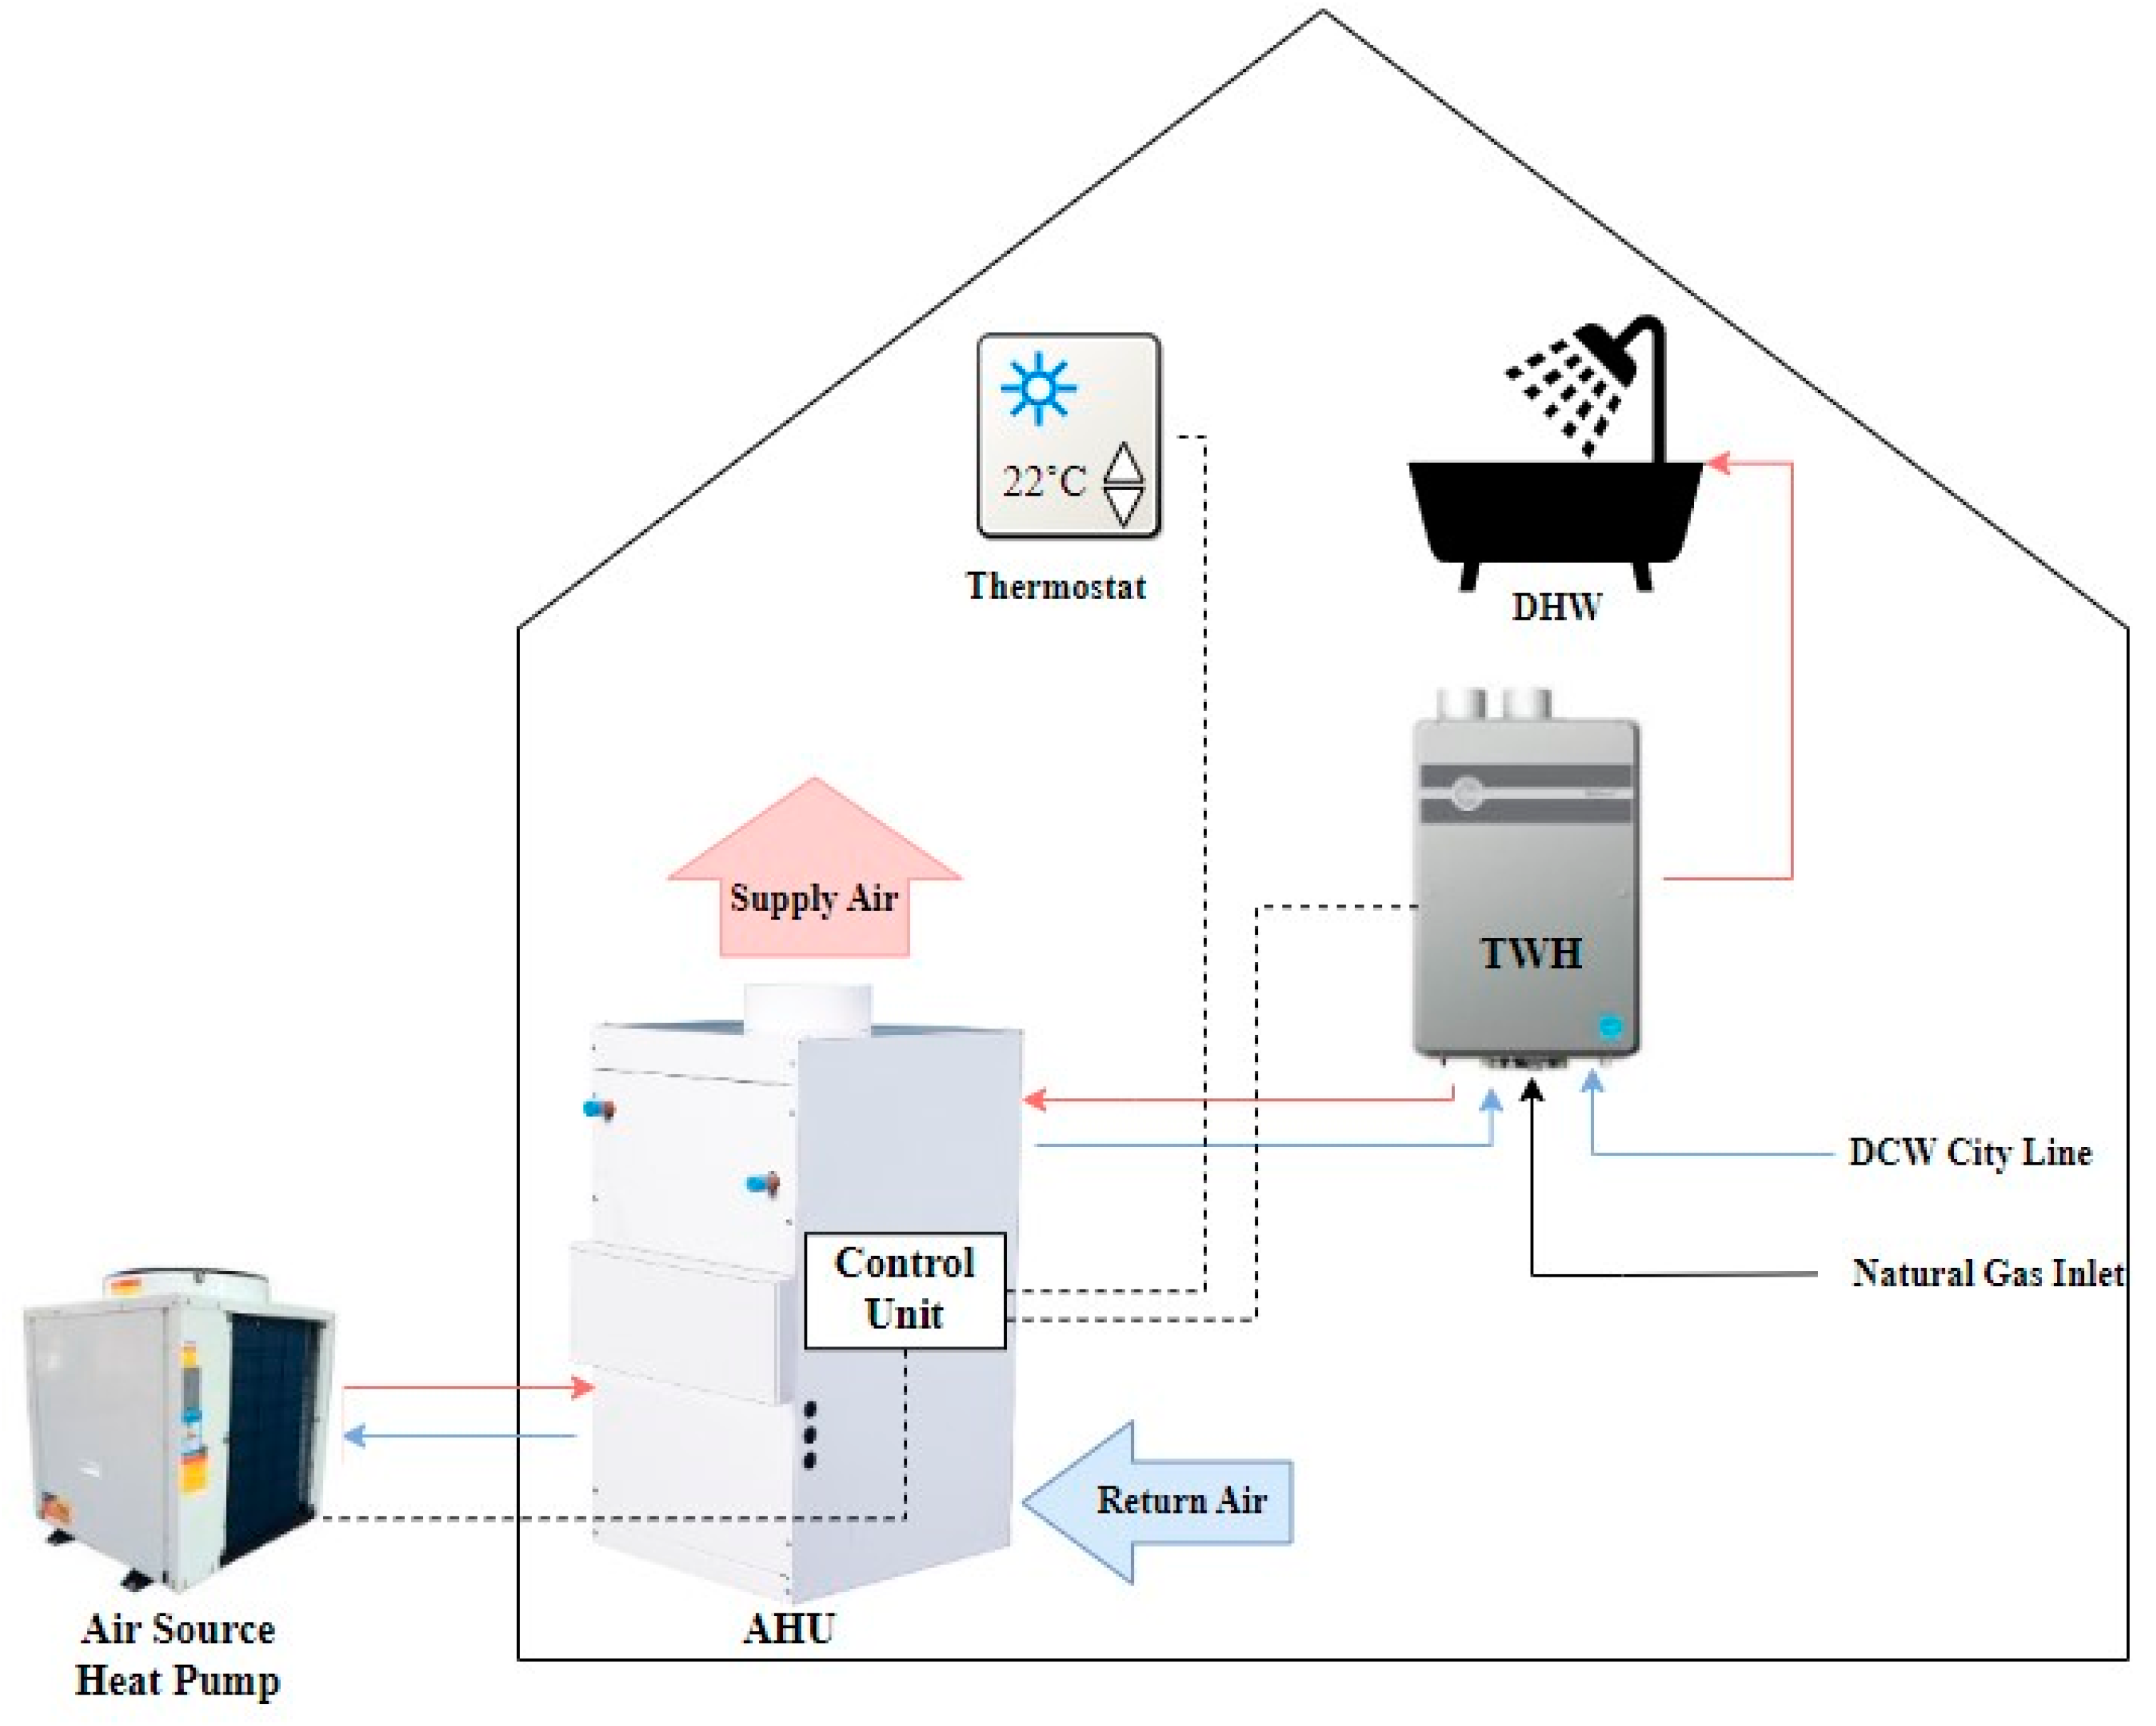
The hybrid fuel heating system is composed of an electric ASHP and a natural gas combination TWH, as shown in Figure 1. Either the heat pump or the natural gas TWH in the house heats the return air that the air handling unit (AHU) receives from the home. The heat pump has a heating capacity of 11.2 kW, while the TWH has 32.8 kW of space heating capacity. The system was designed to ensure that both the heat pump and TWH could independently meet the space heating demands of the house.
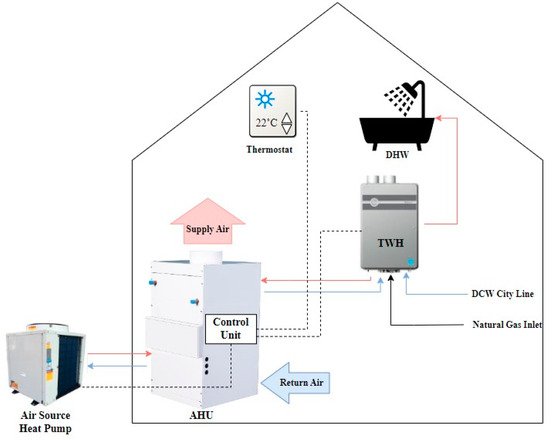
Figure 1.
Schematics of the hybrid energy heating system.
The current control strategy of the heating system employs a time delay mechanism to regulate the operation of the heat pump and TWH. Specifically, the system initiates the heat pump for space heating. If the target temperature is not achieved within seven minutes, the system infers that the capacity of the heat pump is insufficient and shifts to the TWH to ensure the set point can be reached in a timely manner. A control method that can reduce operational costs is presented in a later section.
2.2. Description of the Monitoring System
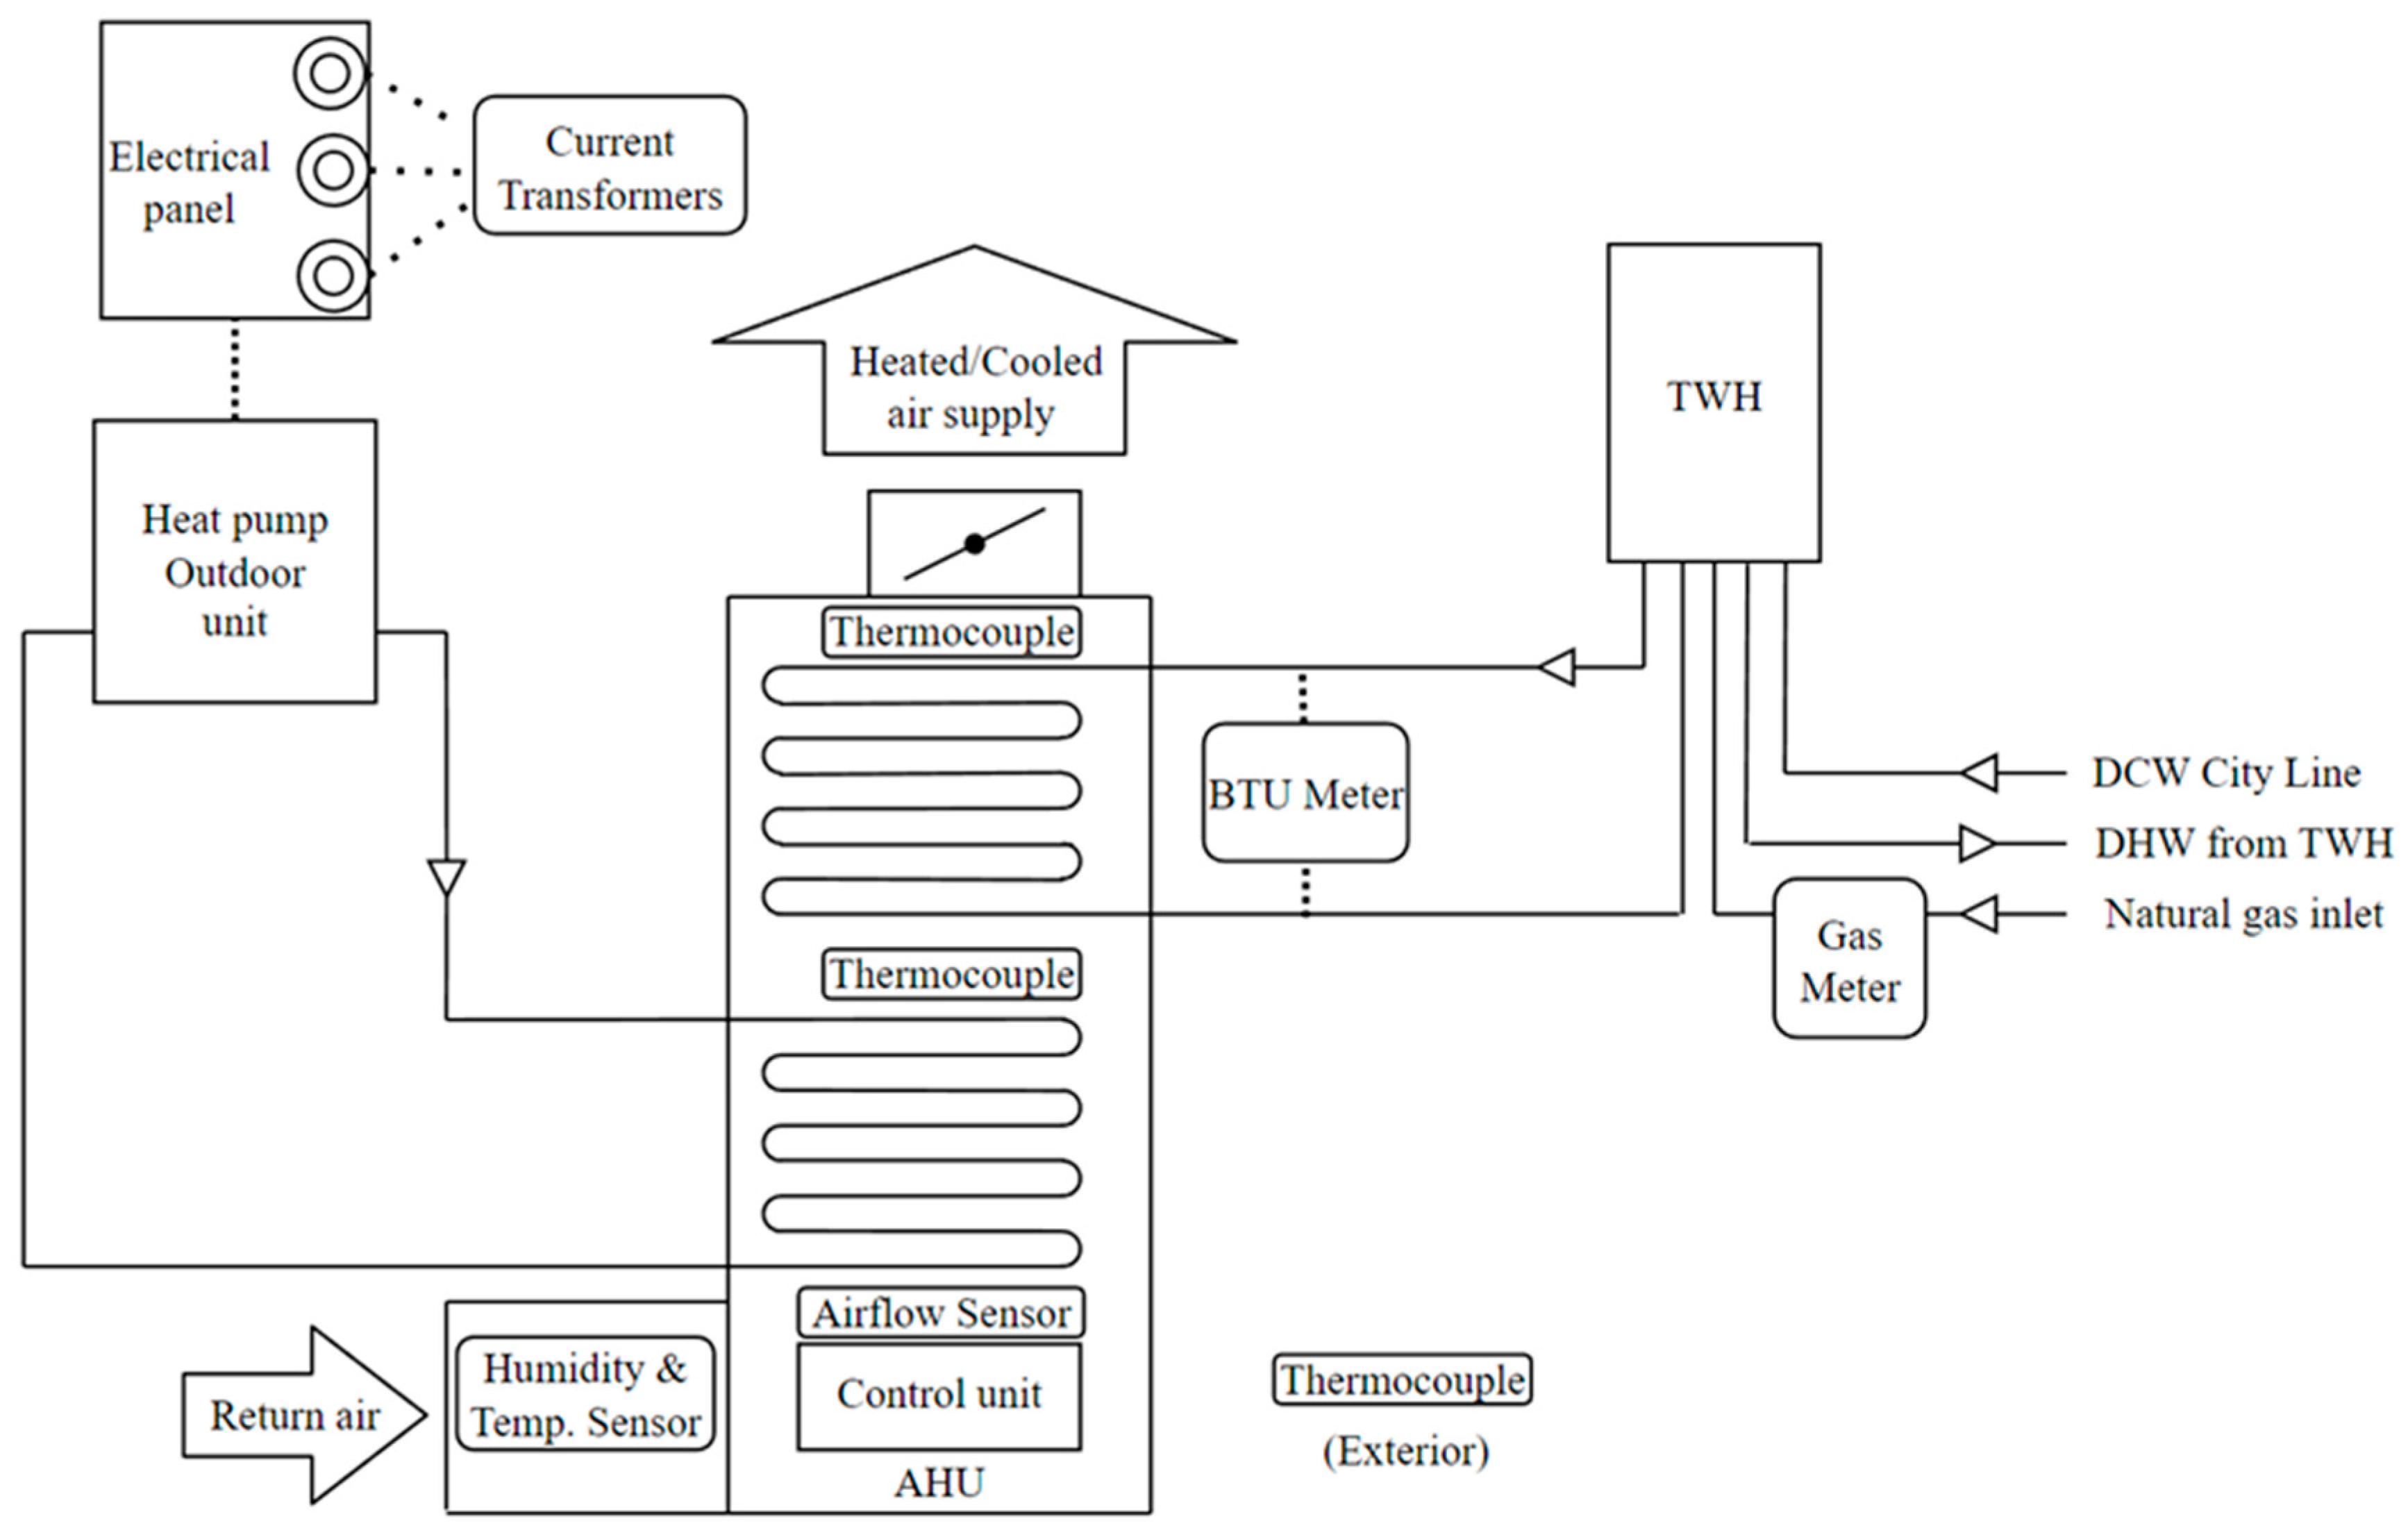
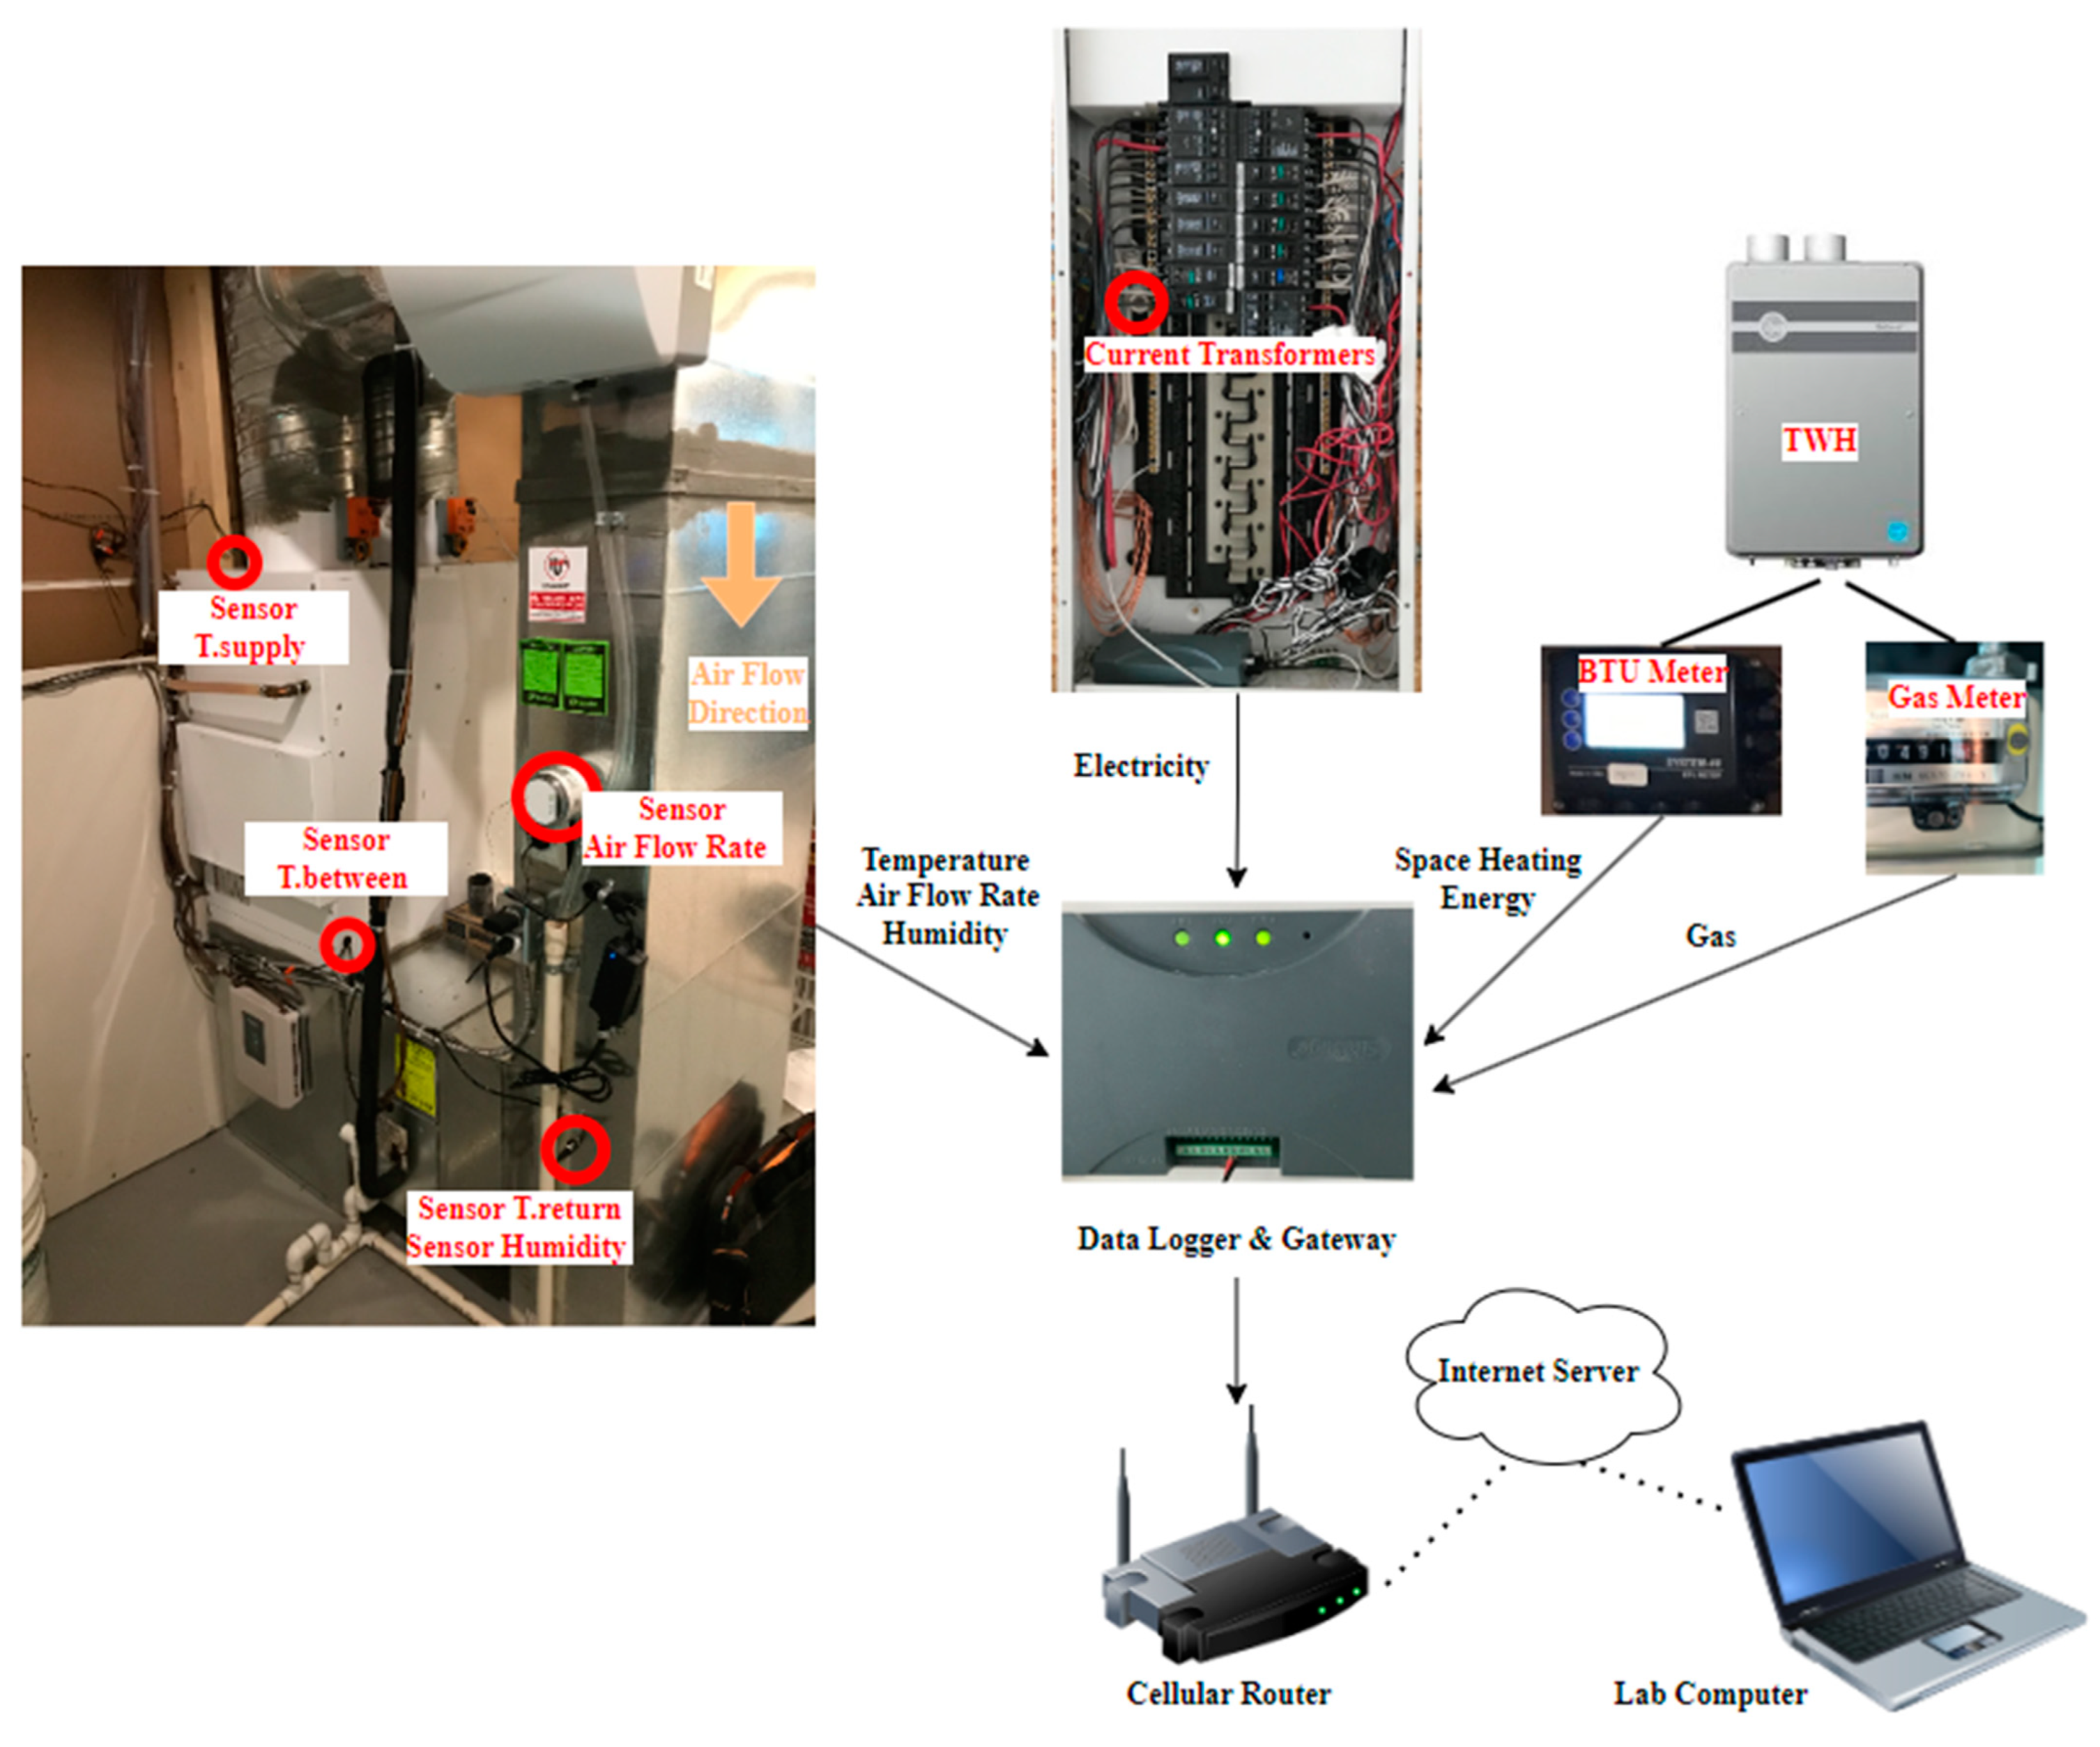
A commercial monitoring system was deployed to measure the relevant parameters. The measured parameters of the hybrid energy system are presented in Table 1, while the location of the sensors and the connections between the monitoring devices are depicted in Figure 2 and Figure 3, respectively.

Table 1.
Monitoring system measurement.
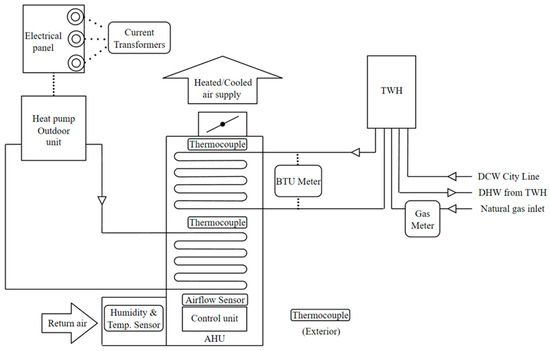
Figure 2.
Location of the monitoring sensors.
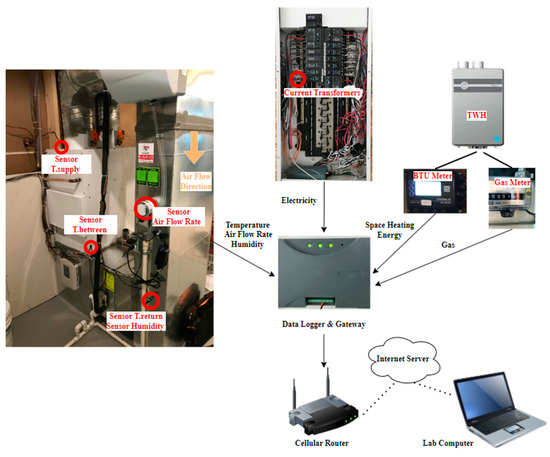
Figure 3.
Monitoring system devices and connection.
To measure the electricity consumption of the house, AHU, mechanical room, and heat pump unit, current transformers in the panel circuits were utilized. The natural gas consumption of the TWH was collected using a natural gas meter, while the return air’s relative humidity and temperature, the temperature of the air across the heat pump coil and the TWH coil, and the temperature of the supply air were used to determine the amount of heating energy required. A BTU meter was installed to differentiate between domestic hot water consumption and space heating consumption, thus allowing for a more accurate determination of the amount of space heating energy provided by the TWH. Climate data of the exterior air temperature, retrieved every hour from nearby meteorological stations, was also included in the dataset. The data were collected in minute intervals and stored in the gateway, which then uploaded the data packages to the cloud server every five minutes through the cellular network. The raw monitoring data could then be downloaded to the laboratory computer for further analysis.
2.3. Evaluation of In Situ Energy Performance
This study focused on investigating the space heating performance of the hybrid energy system, as it was designed to address cold weather conditions. Therefore, the space cooling function of the heat pump, which is similar to a conventional air conditioning system, was not analyzed. The performance of the system was evaluated by developing a hybrid energy system on site and subjecting it to various exterior air temperature conditions. The heating coefficient of performance (COP) was used to measure the efficiency of the system when running the heat pump, while the efficiency of the natural gas TWH operation was also evaluated to determine its ability to convert natural gas into useful heat.
The heating load of the house, , is expressed as the following:
where is the corresponding time of the required heating load, is the return air flow rate in , is the cross-sectional area of the return air duct in , is the density of air in , is the specific heat of air in , is the supply air temperature in , and is the return air temperature in .
The system performance while using the electric driven heat pump for space heating, , was calculated by the following:
where is the work input to the heat pump in and is the heating energy provided by the system while operating the heat pump in , which can be determined by
where is the temperature of air between the heat pump coil and TWH coil in .
The system efficiency while using the natural gas TWH for space heating, , was defined as the following:
where is the amount of energy consumed through natural gas consumption in kJ and is the heating energy provided by the system while operating the TWH in kJ, which was estimated using the BTU meter.
The base load was determined for all other electricity usages (e.g., lighting, electric appliances) except the HVAC system electricity consumption and was estimated as
where is the base load electricity consumption, is the whole-house electricity consumption, is the ASHP electricity consumption, is the air handling unit electricity consumption, and is the electricity consumption of all other HVAC components in the mechanical room.
2.4. In Situ Energy Performance
2.4.1. House Energy Consumption Assessment
The data that were monitored on a daily and minute-by-minute basis were utilized to conduct a comprehensive analysis of the energy performance of the studied unit and the hybrid energy heating system. This analysis involved an examination of the monthly total energy consumption as well as a fuel-type energy consumption breakdown. A thorough understanding of the energy performance of the units will assist in the development of building energy models and simulations in both the present study and future studies.
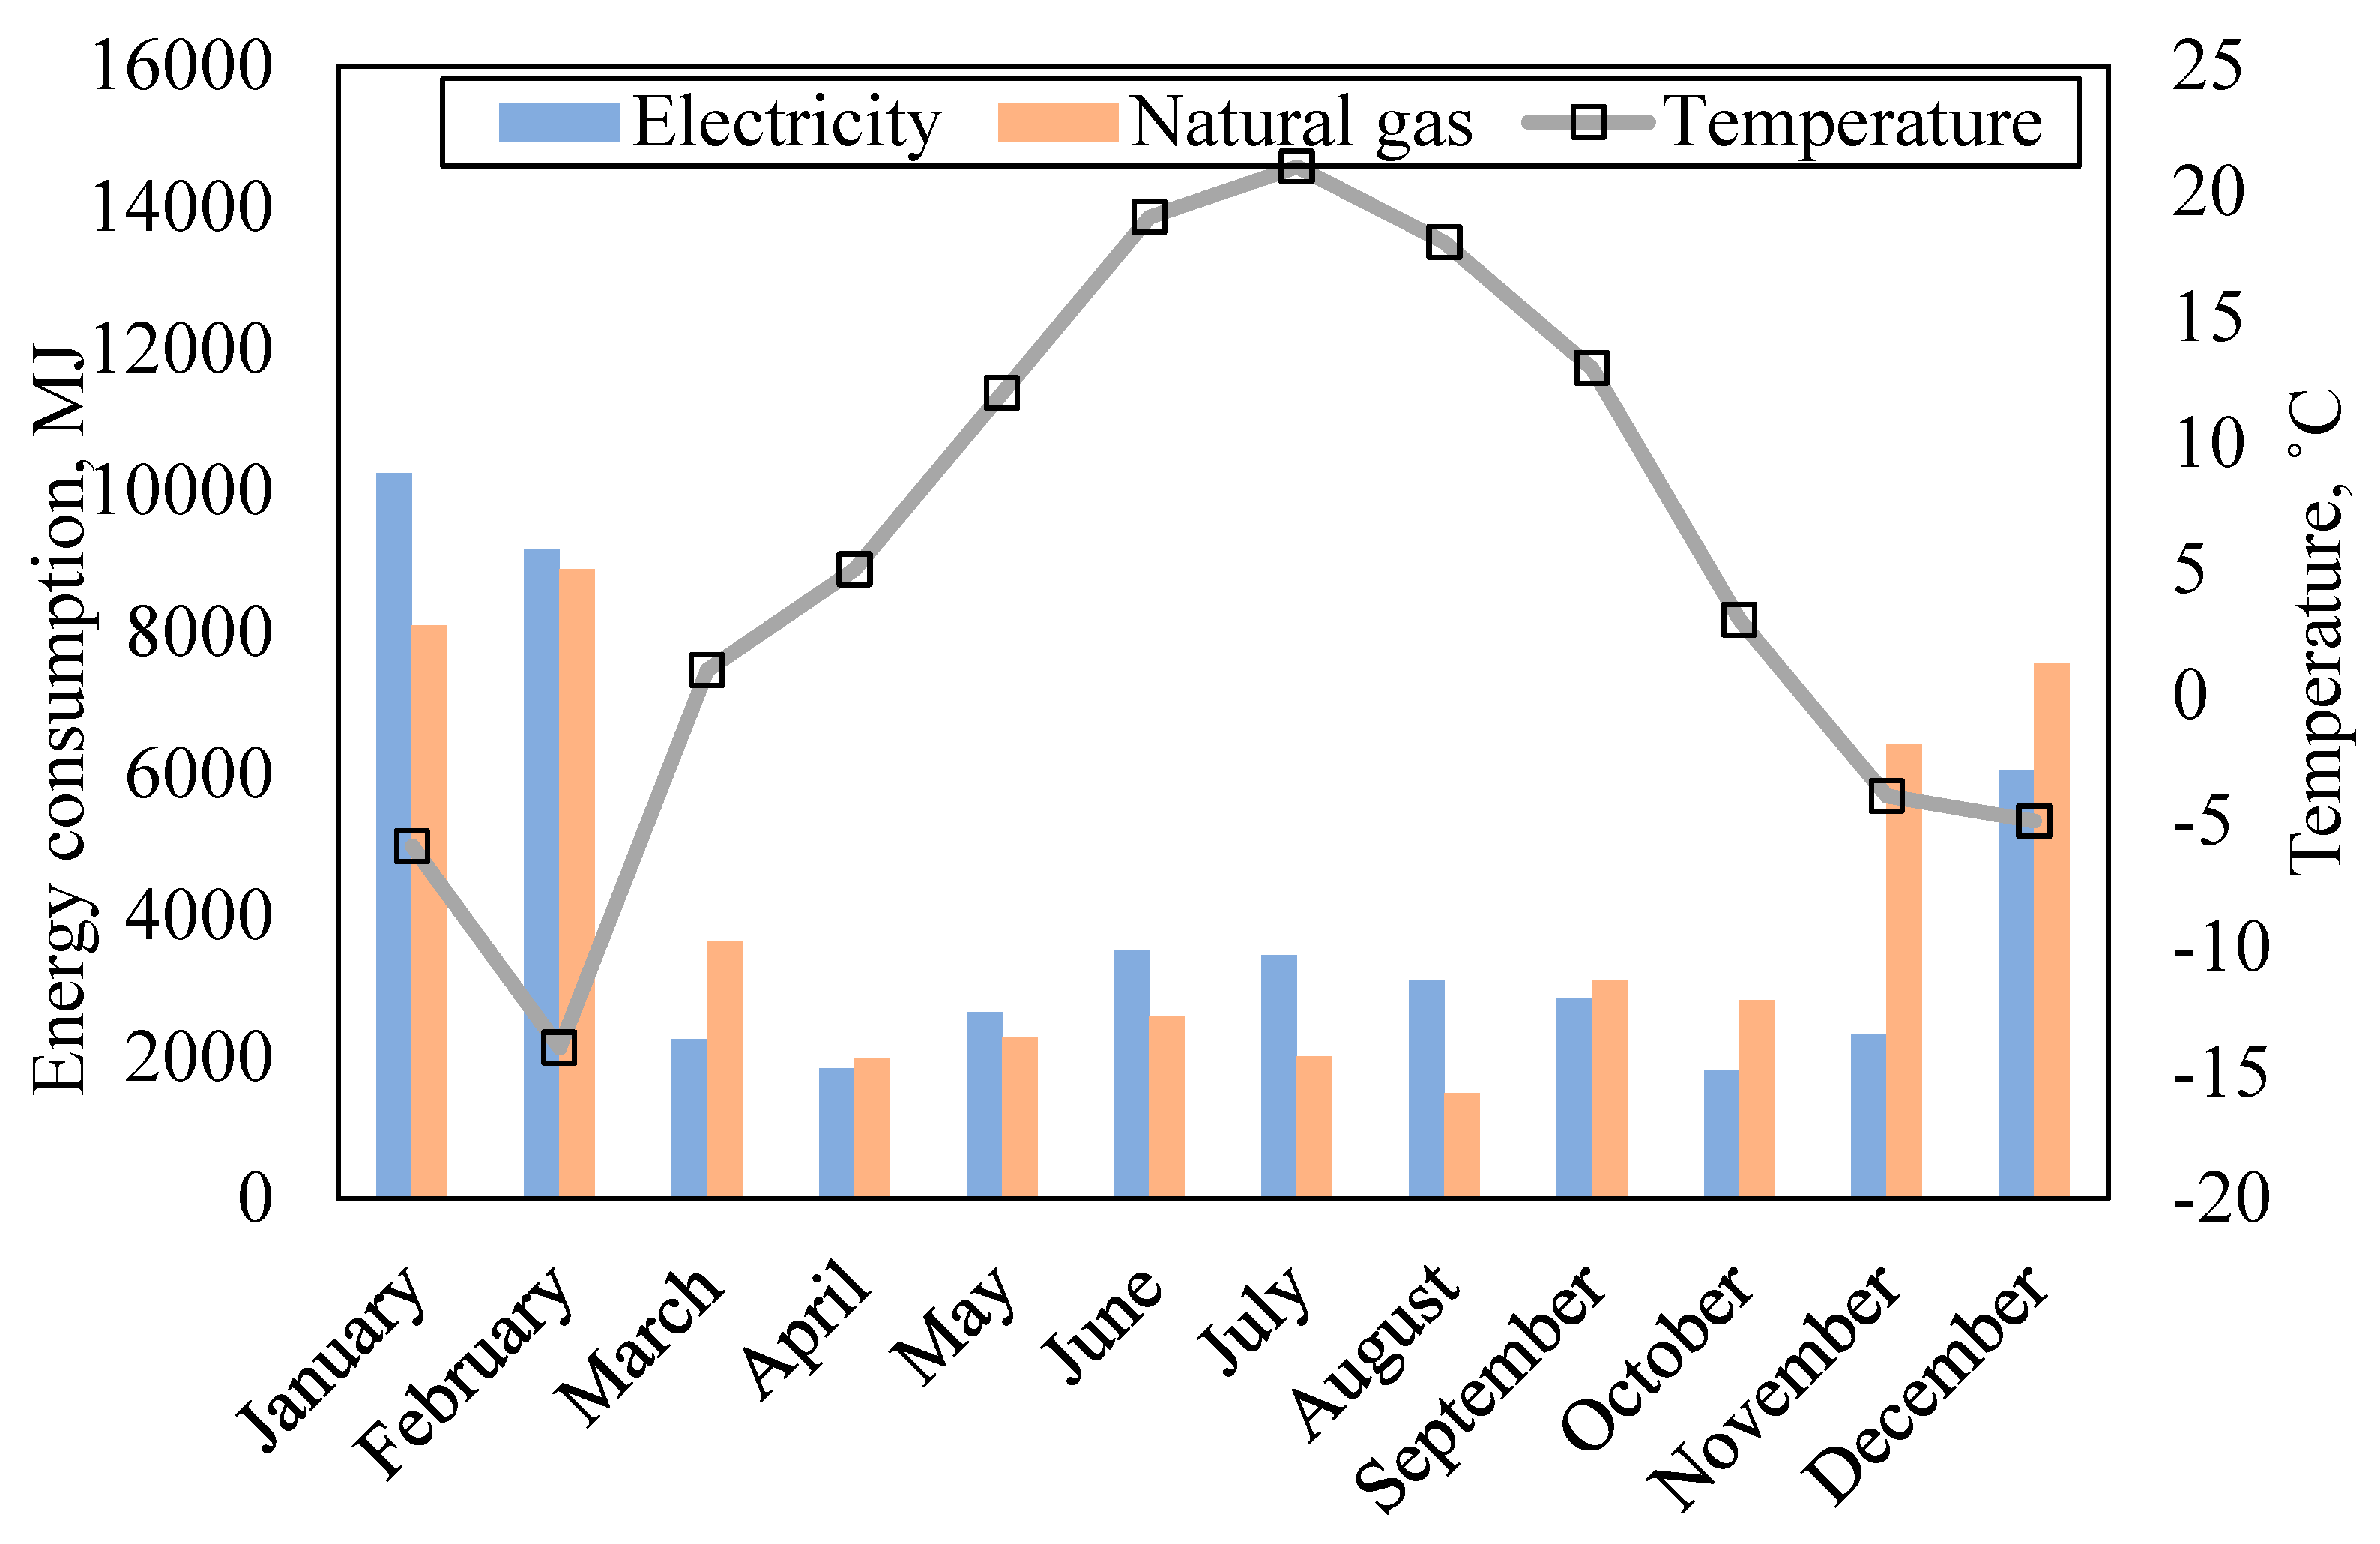
Figure 4 shows the monthly total energy consumption of the studied unit over a period spanning from October 2020 to September 2021. Based on this figure and the following, a decrease in the average exterior air temperature correlates with an increase in natural gas consumption, suggesting that the heating system is functioning as intended. In periods of low exterior air temperatures, natural gas is primarily utilized for space heating. Furthermore, electricity consumption is significantly higher during the cold winter season compared to other seasons. It is important to note that, as a show house, the studied unit consumed significantly more electricity for lighting and electric appliances due to the occupants’ preferences.
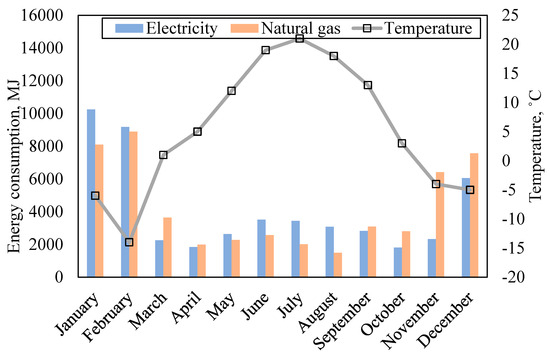
Figure 4.
Monthly energy consumption of the studied unit.
Table 2 displays the annual energy consumption of the studied unit under investigation, alongside the average annual energy consumption of duplex households in Alberta [29]. As observed in the table, the studied unit with the hybrid energy heating system consumes more electricity and less natural gas compared to the Alberta average. With regard to total energy consumption, there is a notable discrepancy between the studied unit and the average household. Given that the majority of Albertans rely on natural gas for space heating, the utilization of a hybrid heating system incorporating an electric heat pump to supplement conventional natural gas space heating has the potential to yield considerable energy savings.

Table 2.
Annual energy consumption (MJ).
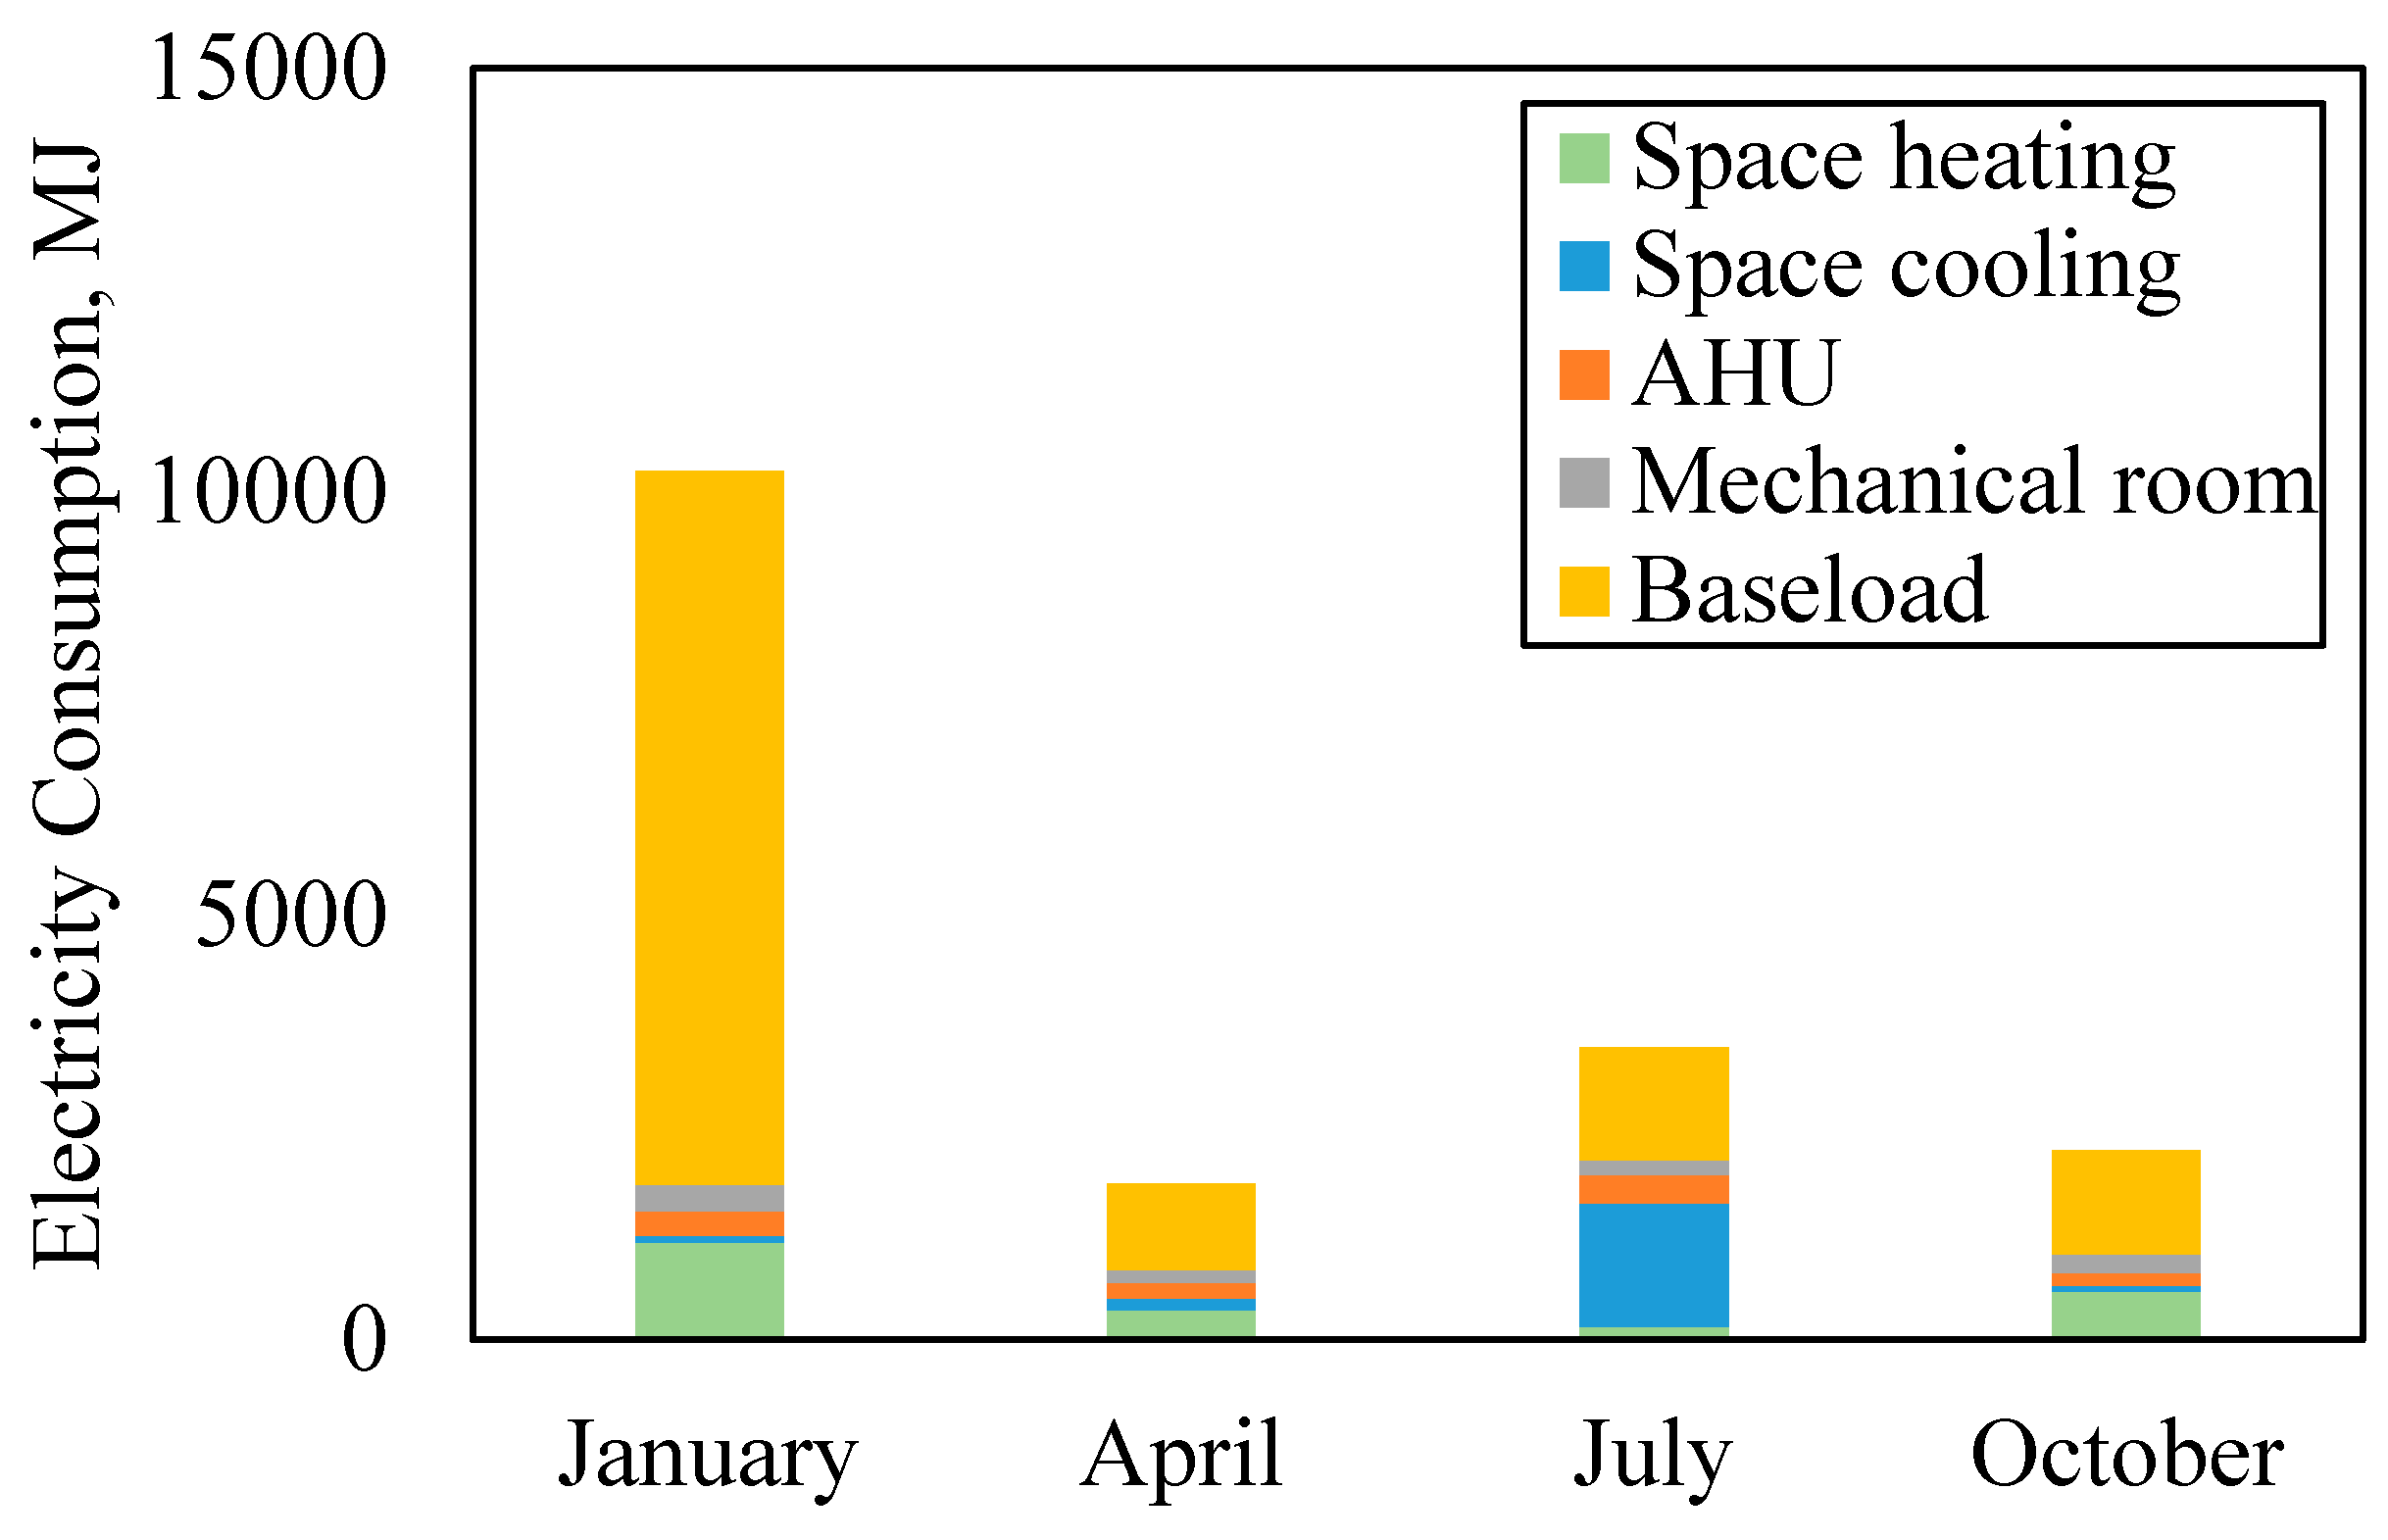
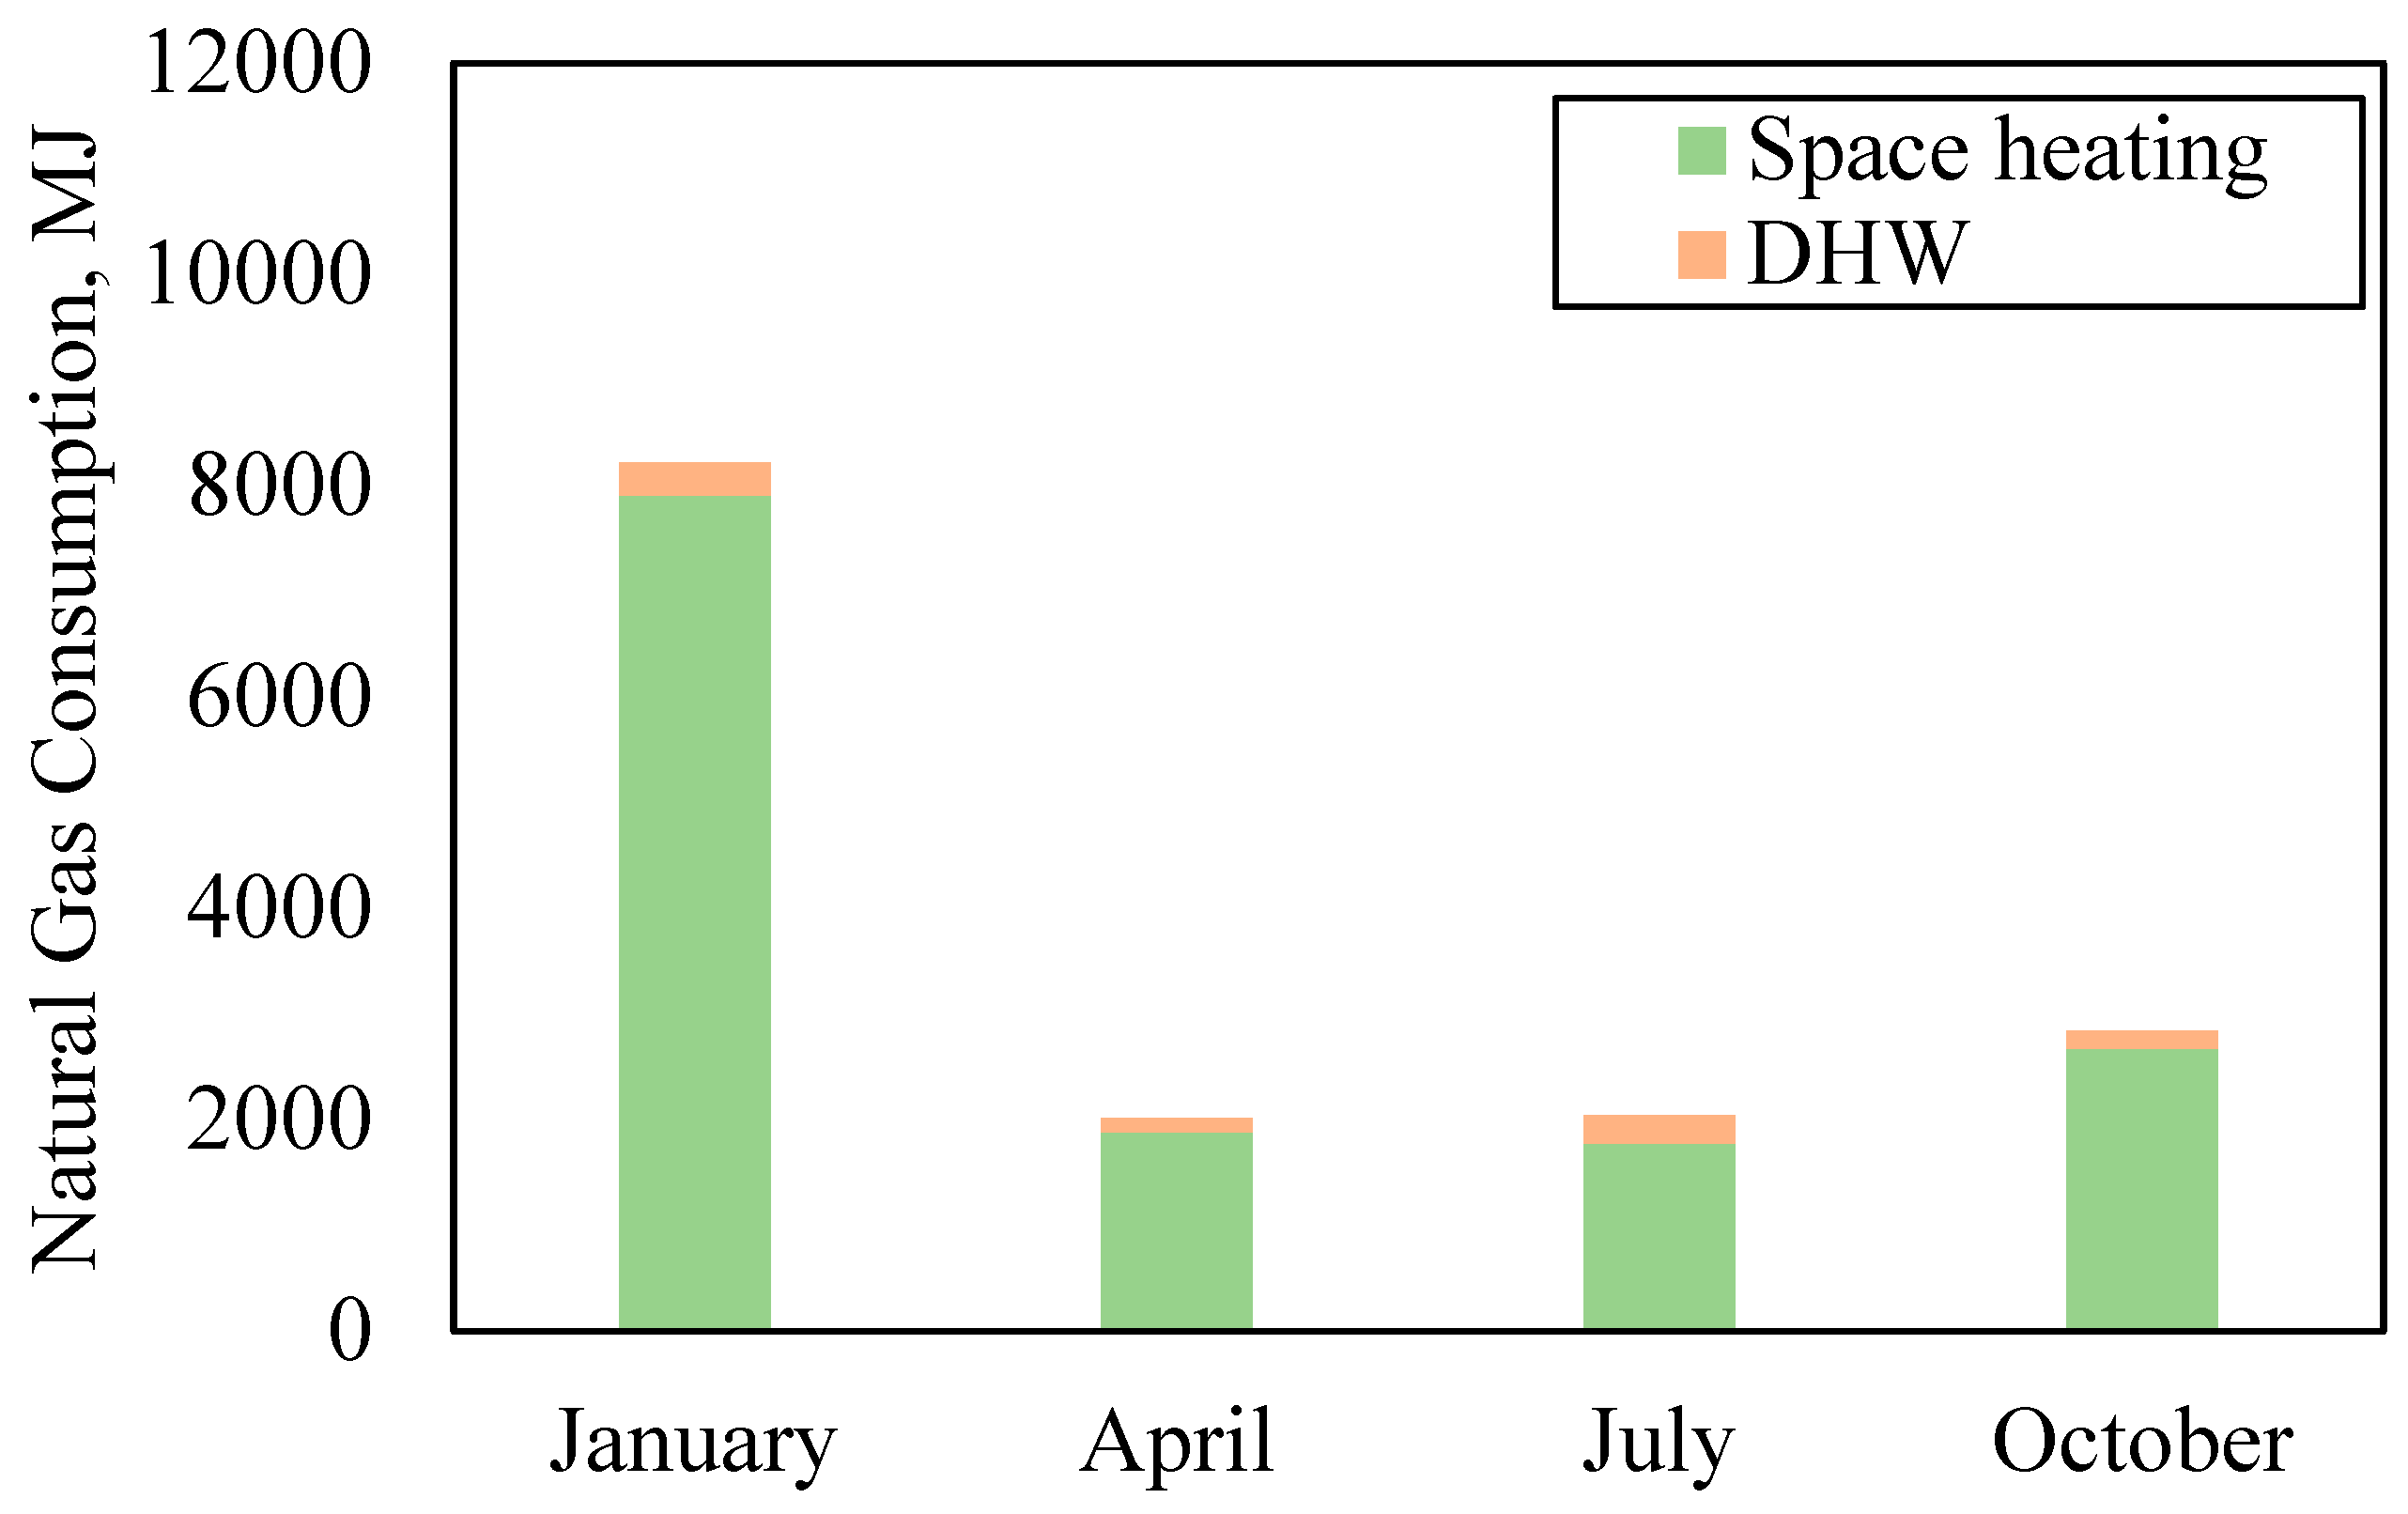
Table 3 displays the total monthly energy consumption and heating energy consumption for representative months of the studied unit, while the corresponding breakdown of energy usage can be found in Figure 5 and Figure 6. This section of the results is based on available datasets from 2021, with four typical months selected to represent the four seasons. Figure 5 breaks down the electricity consumption into space heating, space cooling, AHU, mechanical room, and baseload (i.e., the residual electricity consumption). The unit exhibited significant baseload usage during January, which was attributed to occupancy behavior. From Figure 6, the majority of natural gas consumption was used toward space heating, with only a small portion used for domestic hot water (DHW). January was the month with the highest natural gas consumption, as it was comparatively colder than other months, which caused the heat pump to be less effective in assisting space heating within certain temperature ranges, leading to a higher overall space heating demand. It should be noted that the natural gas TWH performed a self-test for space heating every day, resulting in a small amount of TWH space heating consumption during the summer months.

Table 3.
The monthly heating energy consumption for typical months (MJ).
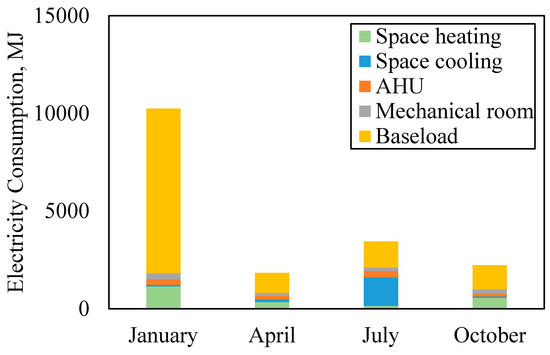
Figure 5.
Electricity consumption breakdown of the studied unit.
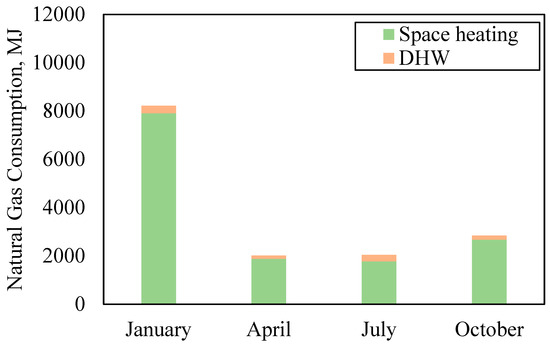
Figure 6.
Natural gas consumption breakdown of the studied unit.
In general, the hybrid heating system exhibited higher energy consumption for heating during the cold winter months, such as January, and lower energy consumption for heating during the summer months, such as July. The heating energy consumption for April and October fell in between these two extremes.
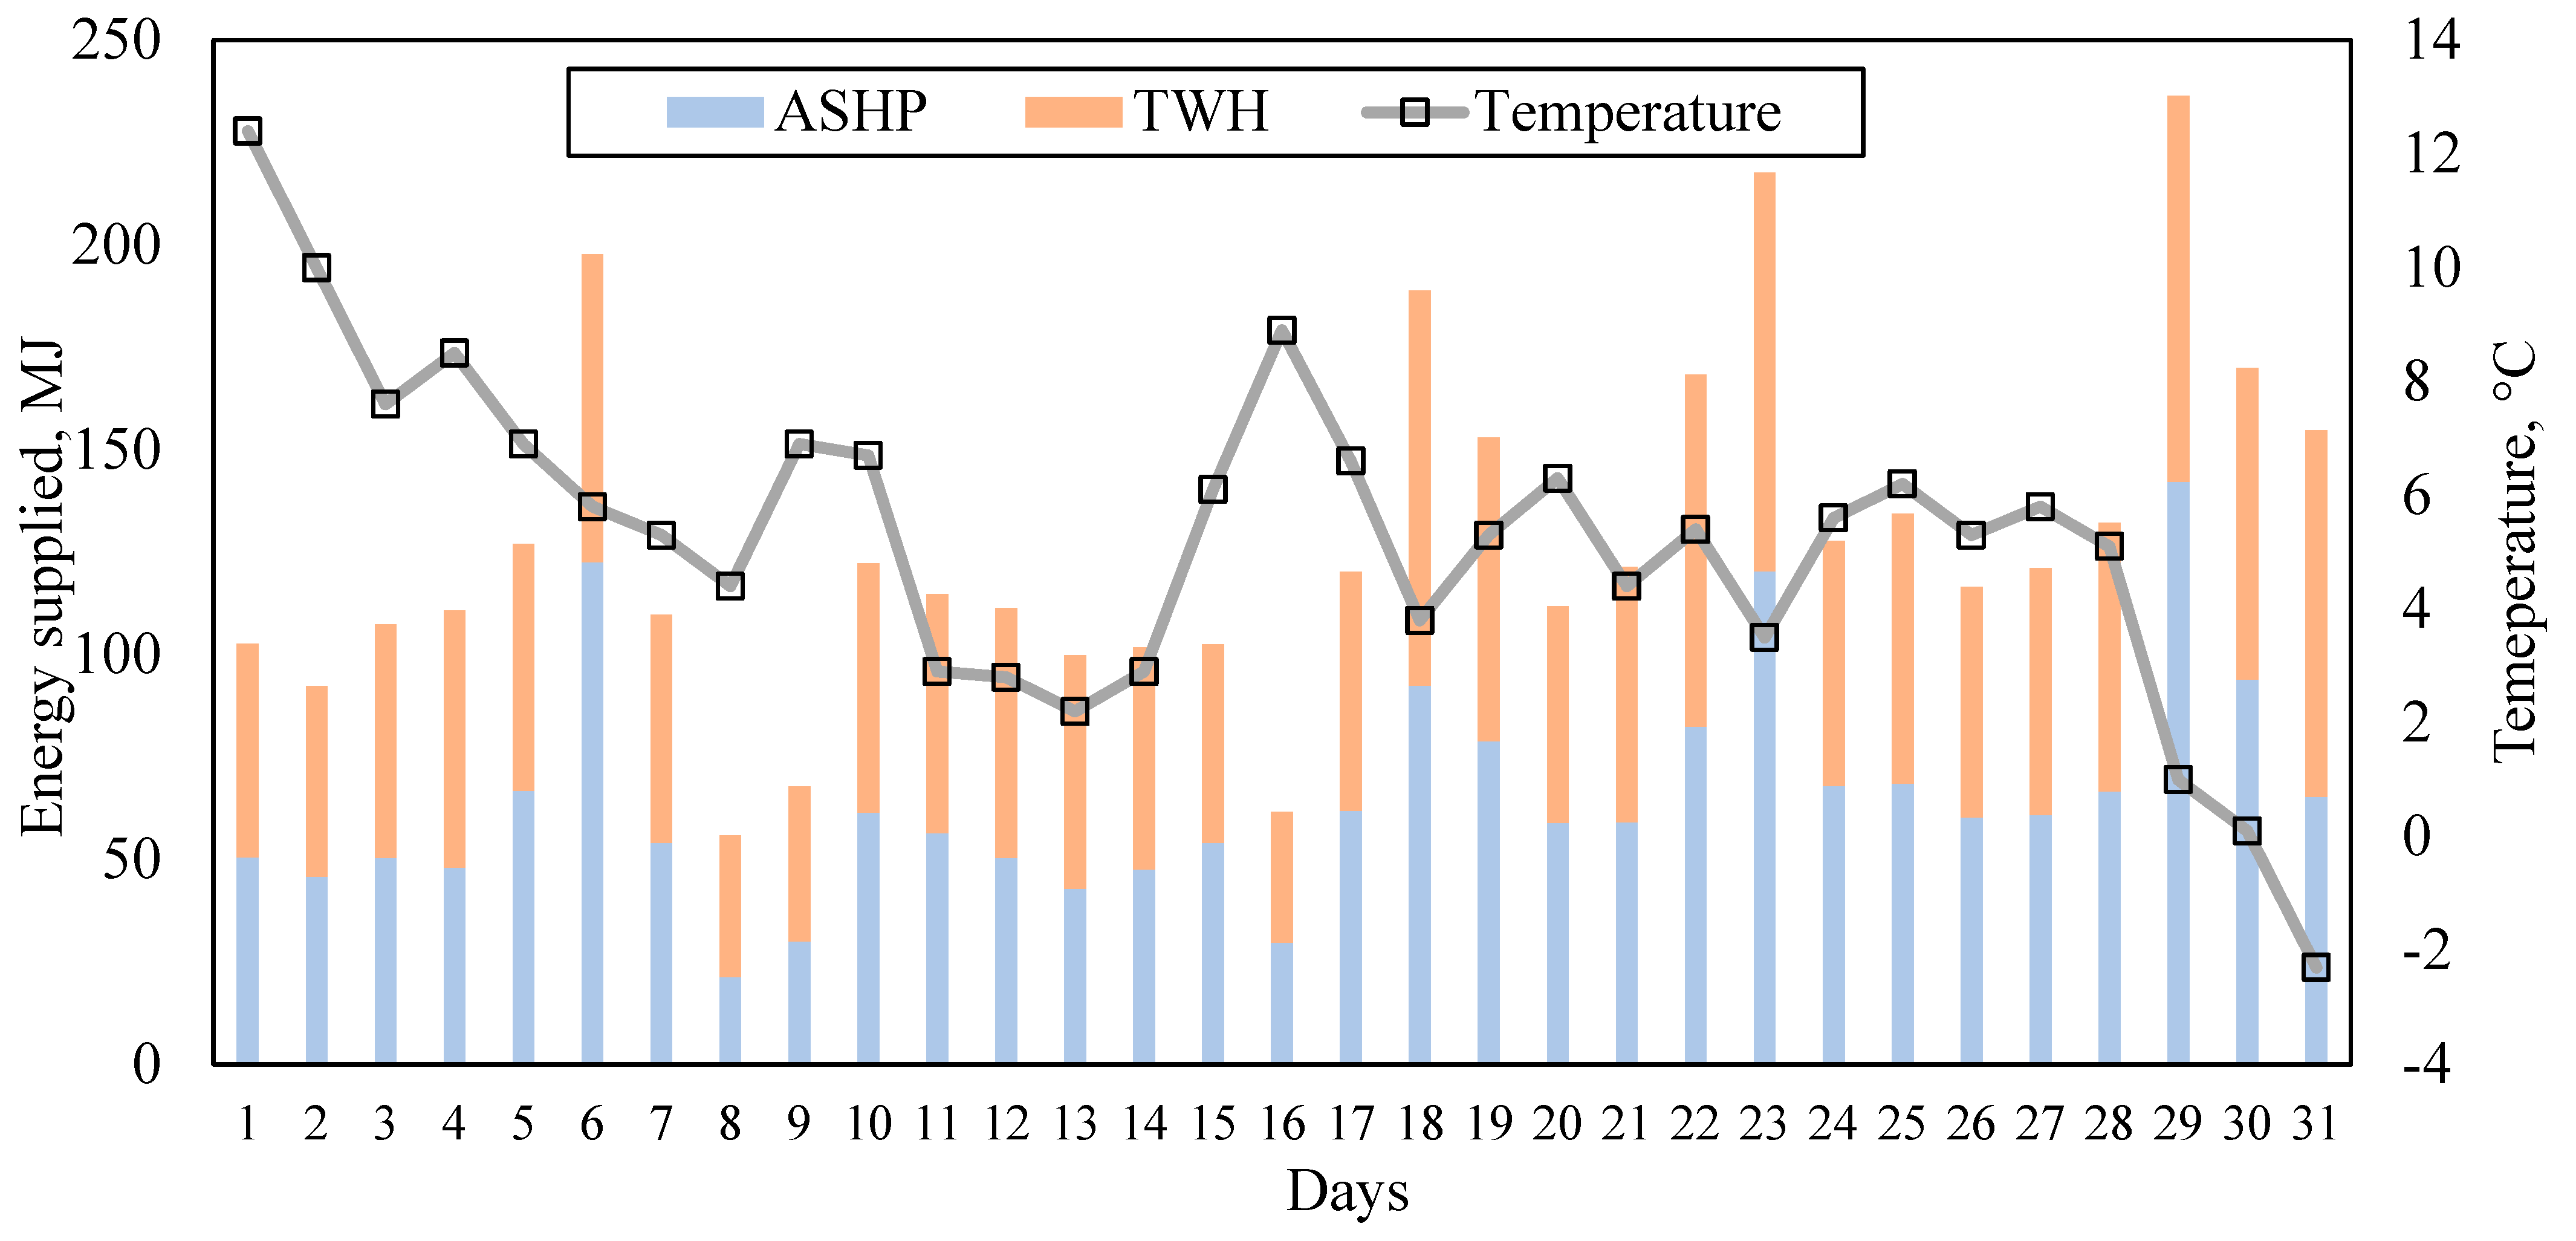
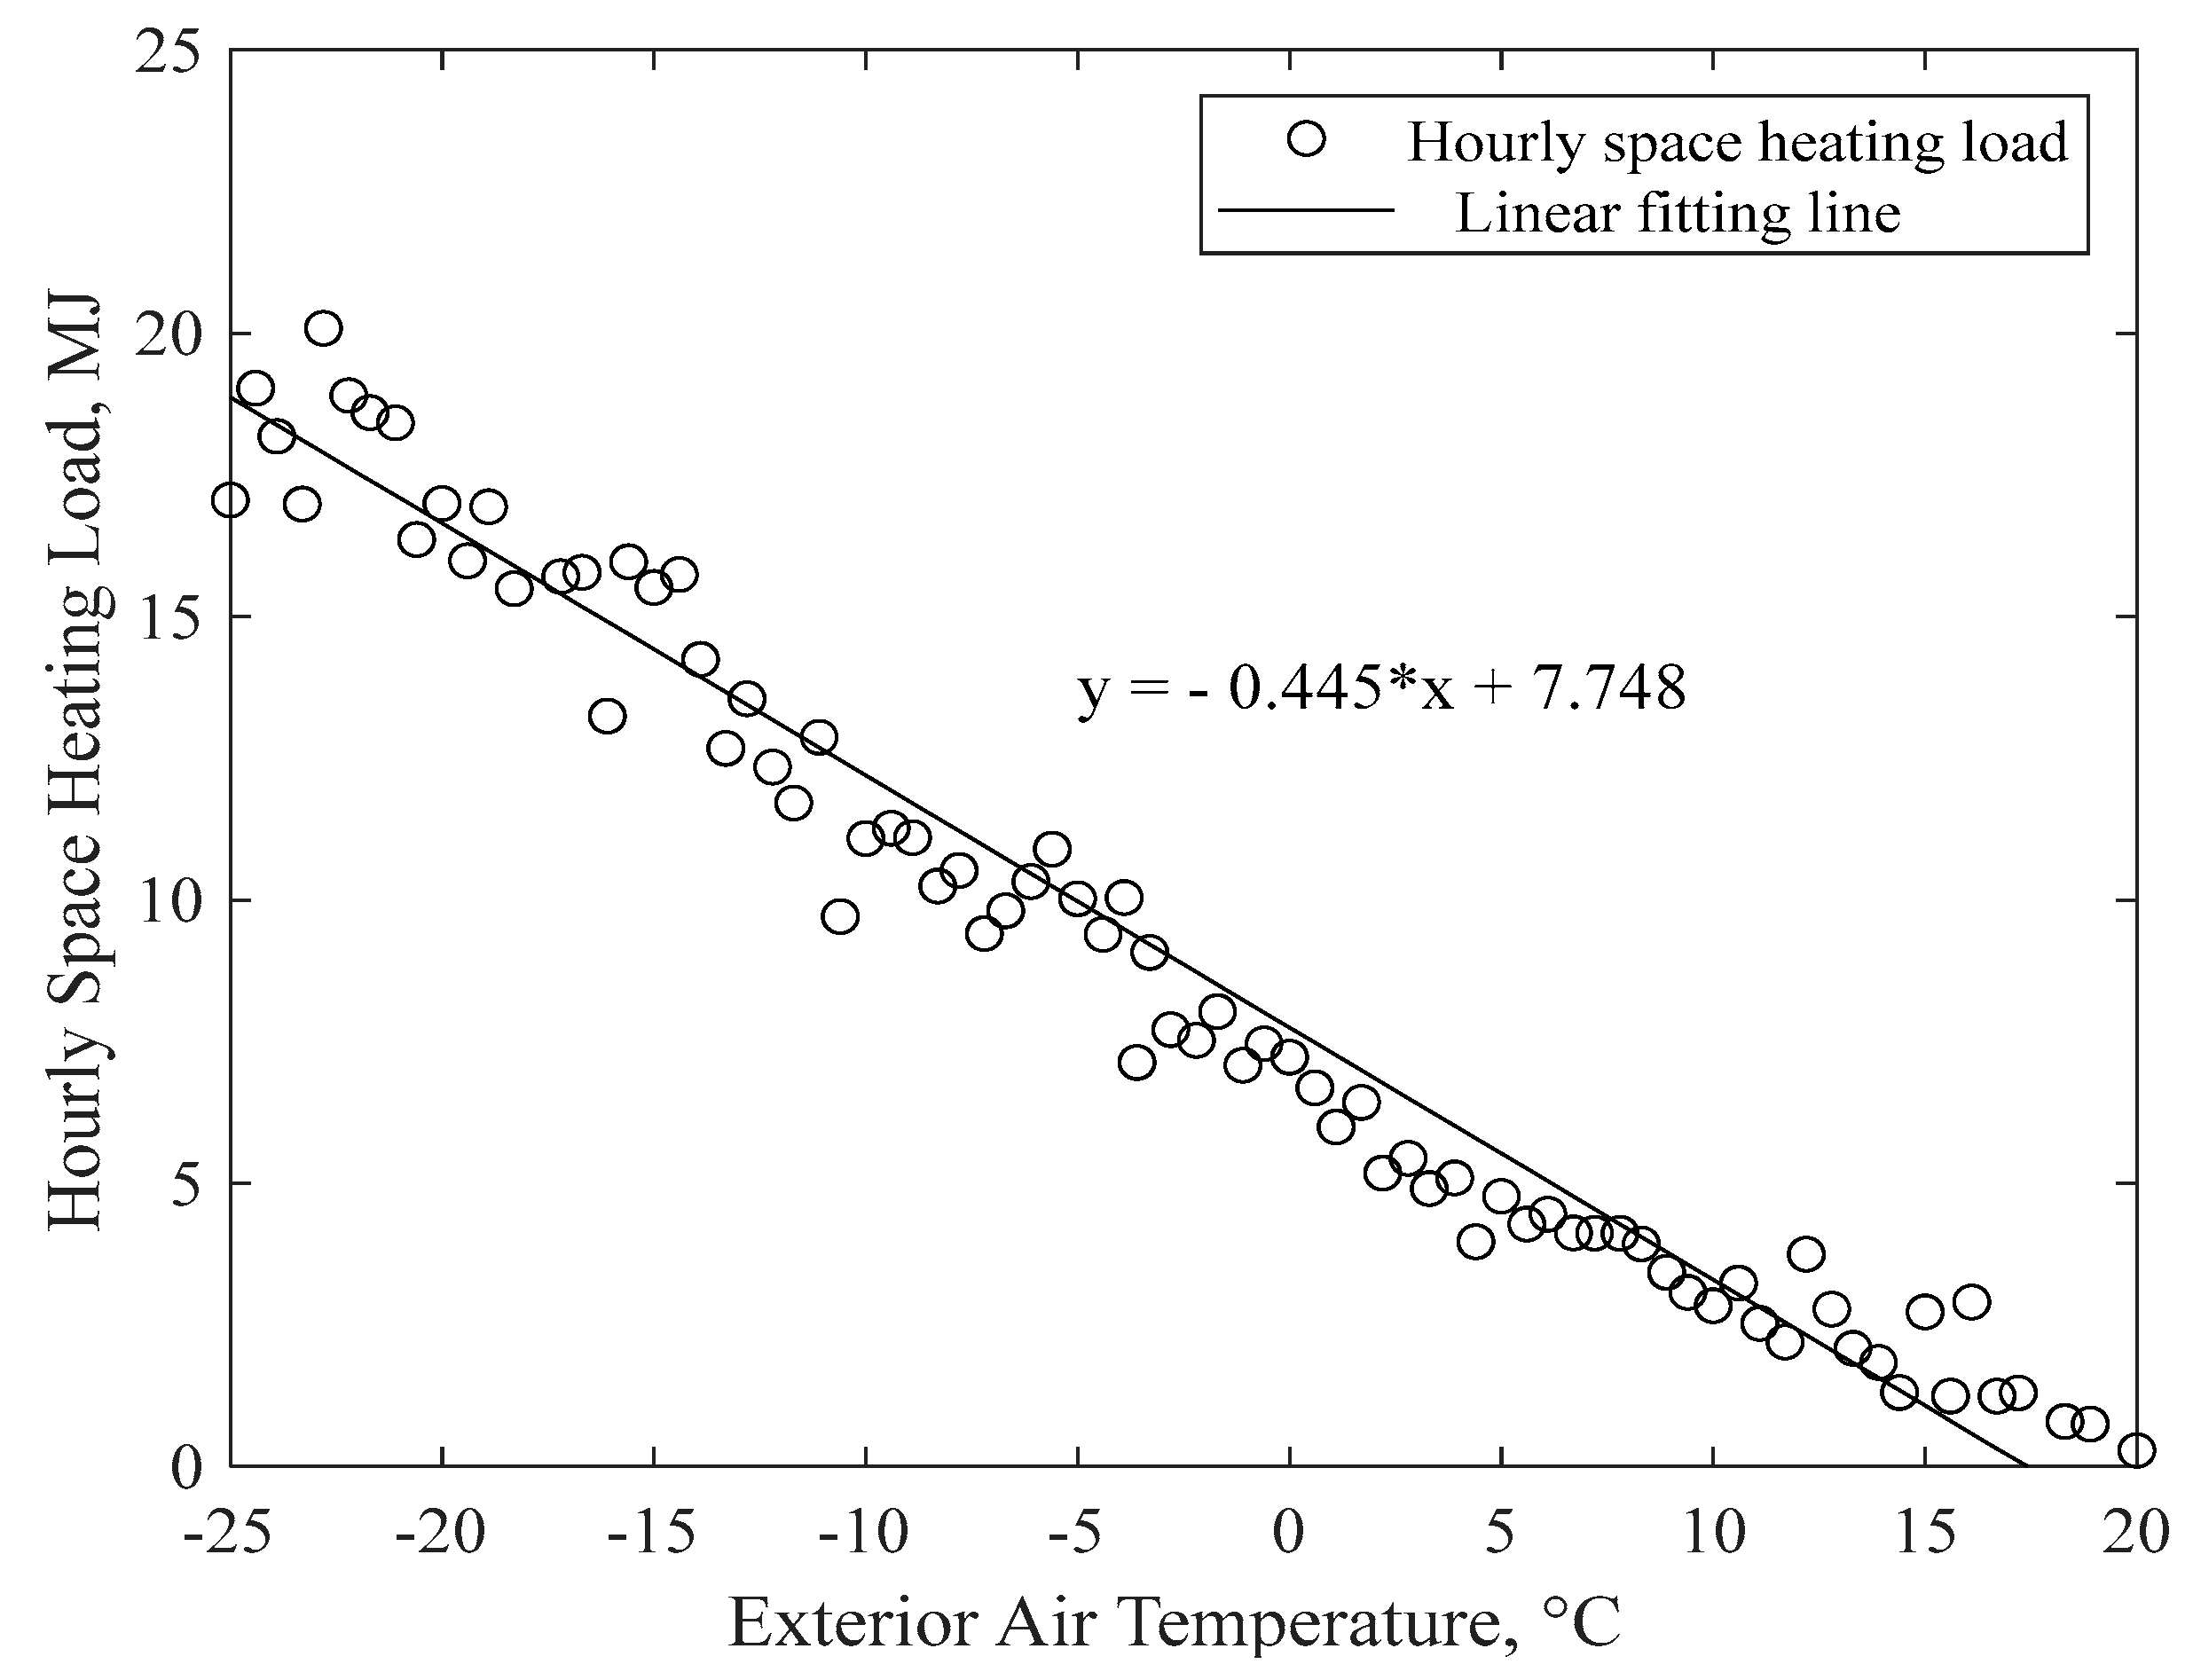
Figure 7 illustrates the daily heating energy provided by the hybrid energy heating system based on data from October 2021. Energy consumption for the ASHP and TWH can be observed in Figure 5 and Figure 6, respectively. The total energy supplied by the hybrid system was higher as the temperature dropped and lower as the temperature rose. Both the ASHP and TWH operated for space heating within the temperature range shown for October. The ASHP provided slightly more heating energy than the TWH. However, as the temperature dropped to −2 °C, the TWH supplied more energy than the ASHP, indicating that it operated more efficiently as the temperature decreased. The hourly space heating load of the studied unit is presented in Figure 8. The result was achieved by adding the space heating energy supplied by the hybrid energy system over hourly intervals at the same exterior air temperature and computing the average hourly heating energy provided by the system for the corresponding exterior air temperature. The space heating output of the hybrid energy system was assumed to be the same as the heating load of the house on an hourly basis (the output is higher than the load when a heating system is in operation). The result was based on minutely monitored data from September to December 2021. The figures illustrate that the studied unit requires space heating when the exterior air temperature drops below 20 °C, and a linear relationship exists between the hybrid energy heating system’s hourly heating output and the outside air temperature. When the exterior air temperature drops to −25 °C, the space heating load of the studied unit is approximately 20 MJ per hour.
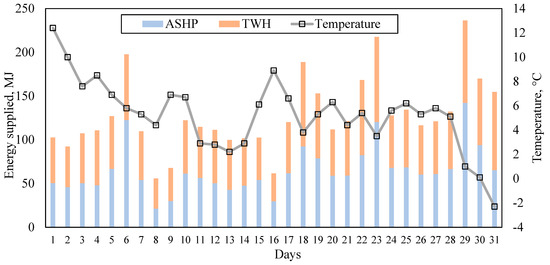
Figure 7.
October energy supply from the hybrid energy heating system.
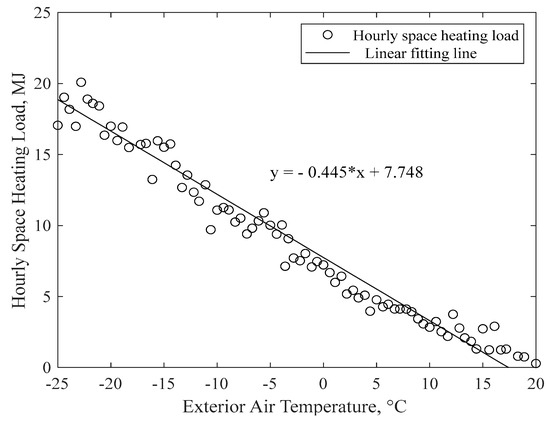
Figure 8.
Hourly space heating load of the studied unit.
2.4.2. Hybrid System Energy Performance
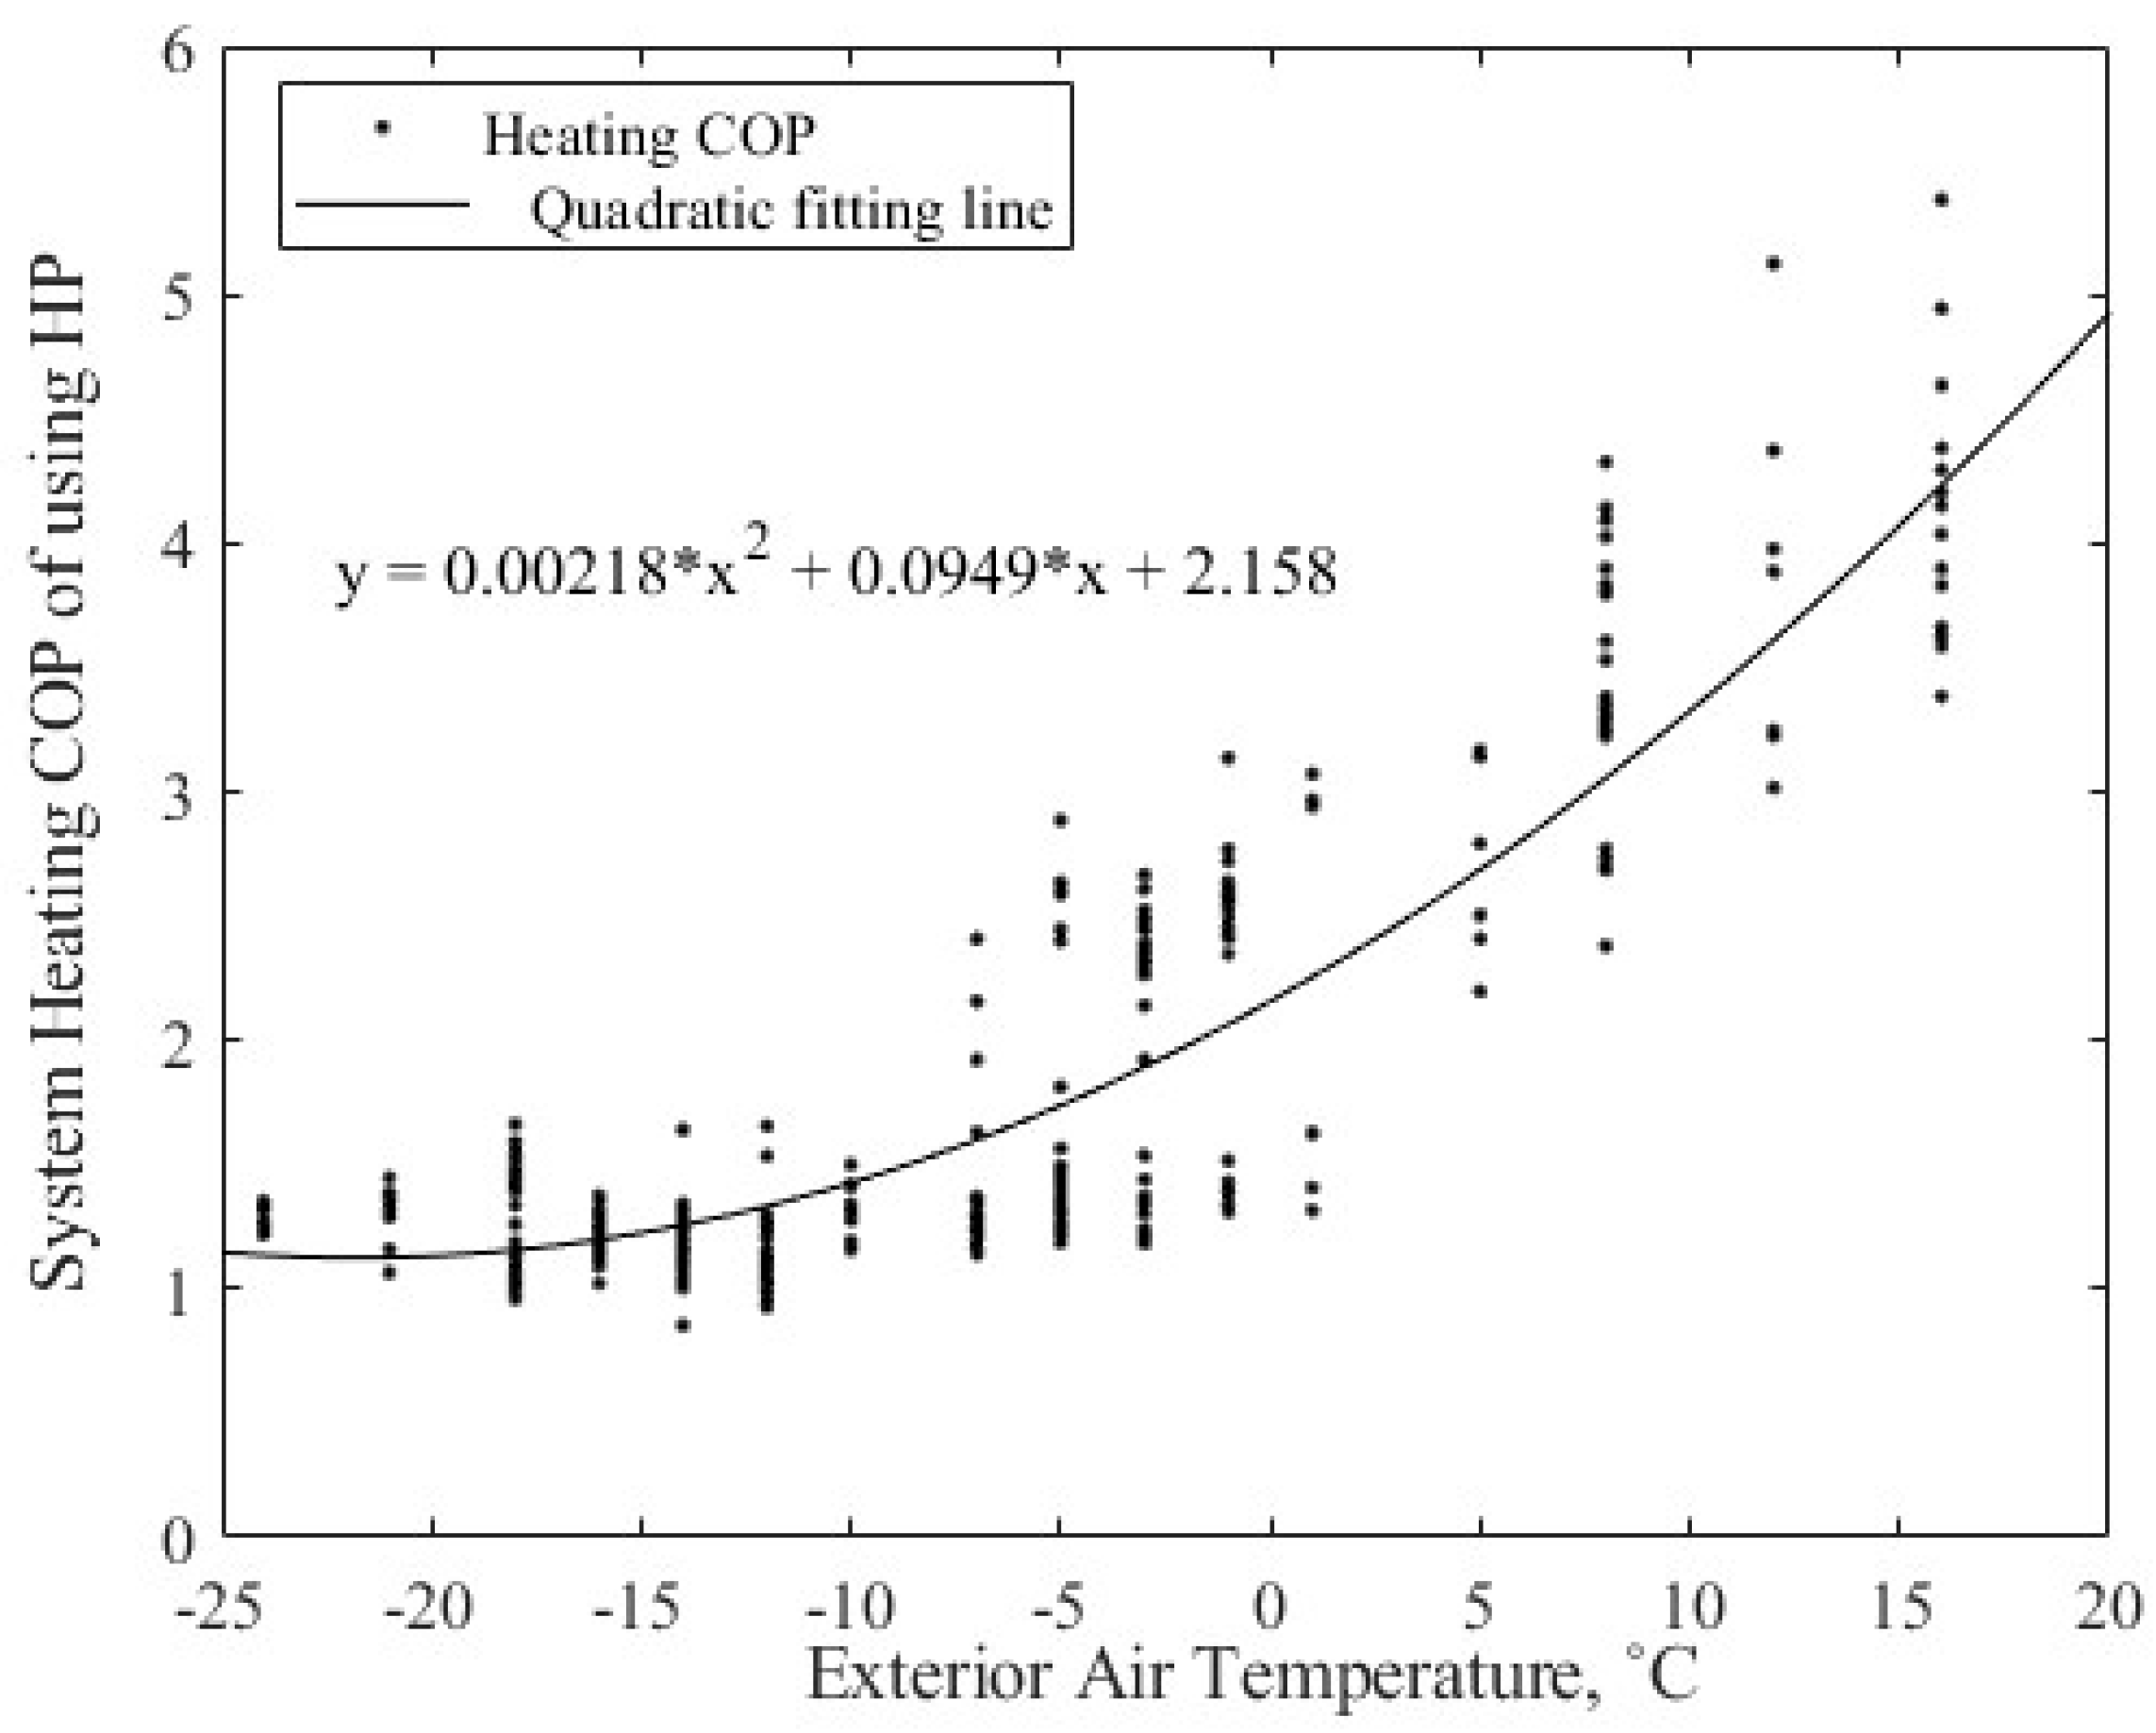
The heating performance of the hybrid energy system was determined using the monitored data from June to December 2021. As shown in Figure 9, the available exterior air temperature ranged from −25 °C to 20 °C. The coefficient of performance (COP) of the system while operating the heat pump can be expressed as a function of exterior air temperature which is
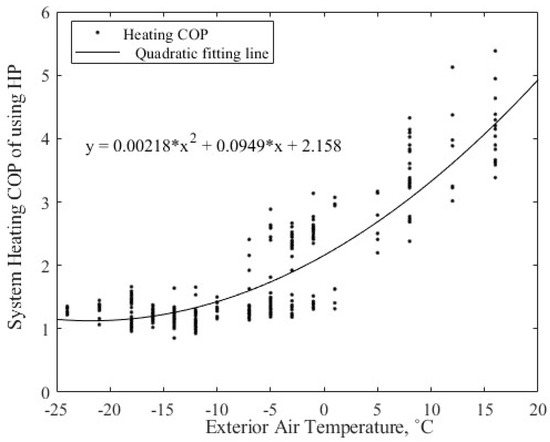
Figure 9.
System heating coefficient of performance of the operating heat pump.
The residual R-squared value between the observed and predicted values of the study is 0.848, and the uncertainties are mainly based on the following:
- The measurement resolutions of the sensors used in this study are shown in Appendix B, and these resolutions contribute to the overall uncertainty as uncertainties in the independent variables.
- There are multiple supply air speeds that vary depending on the heating and cooling requirements and the specific zone within the house. These speeds may fluctuate over time, and occupants may frequently adjust the set point temperature. The target temperature and supply air flow rate can also significantly impact the system’s performance. In the upcoming Section 4, a control method for the hybrid energy system will be introduced. Incorporating only the exterior air temperature into the regression model enhances the simplicity of the control method.
The space heating performance of operating the TWH was recorded by the BTU meter and natural gas meter and estimated on a monthly basis from May to November 2021. The system space heating performance varied from 0.6917 to 0.7569, with an average of 0.7305.
Within the available monitoring data for the regression model, the minimum heating performance of the hybrid energy system while operating the heating pump is 1.1558, which is above the average heating performance of the system operating the boiler. So, considering only energy efficiency, the studied system should always operate the ASHP for space heating.
3. Performance Simulation and Comparison
This section presents an analysis of the disparities between the observed energy performance and prevailing energy modeling outcomes. The results can be used to assess the differences between actual performance and mainstream energy modeling results. To achieve this goal, this section suggests employing the ANN model as a tool in assisting the comparison of HOT2000 results with the actual performance. An ANN model of a hybrid energy heating system was formulated by using monitoring data to forecast the energy performance under different operational conditions (e.g., weather) and examines the hybrid energy system performance by contrasting the results generated by HOT2000 with the practical outcomes predicted by the ANN model. Moreover, a comparative analysis was performed on the monthly energy consumption and the 30-year life cycle cost of a hybrid energy system and two distinct residential energy systems.
3.1. Energy Performance
3.1.1. Data-Driven Heating Energy Consumption Modeling
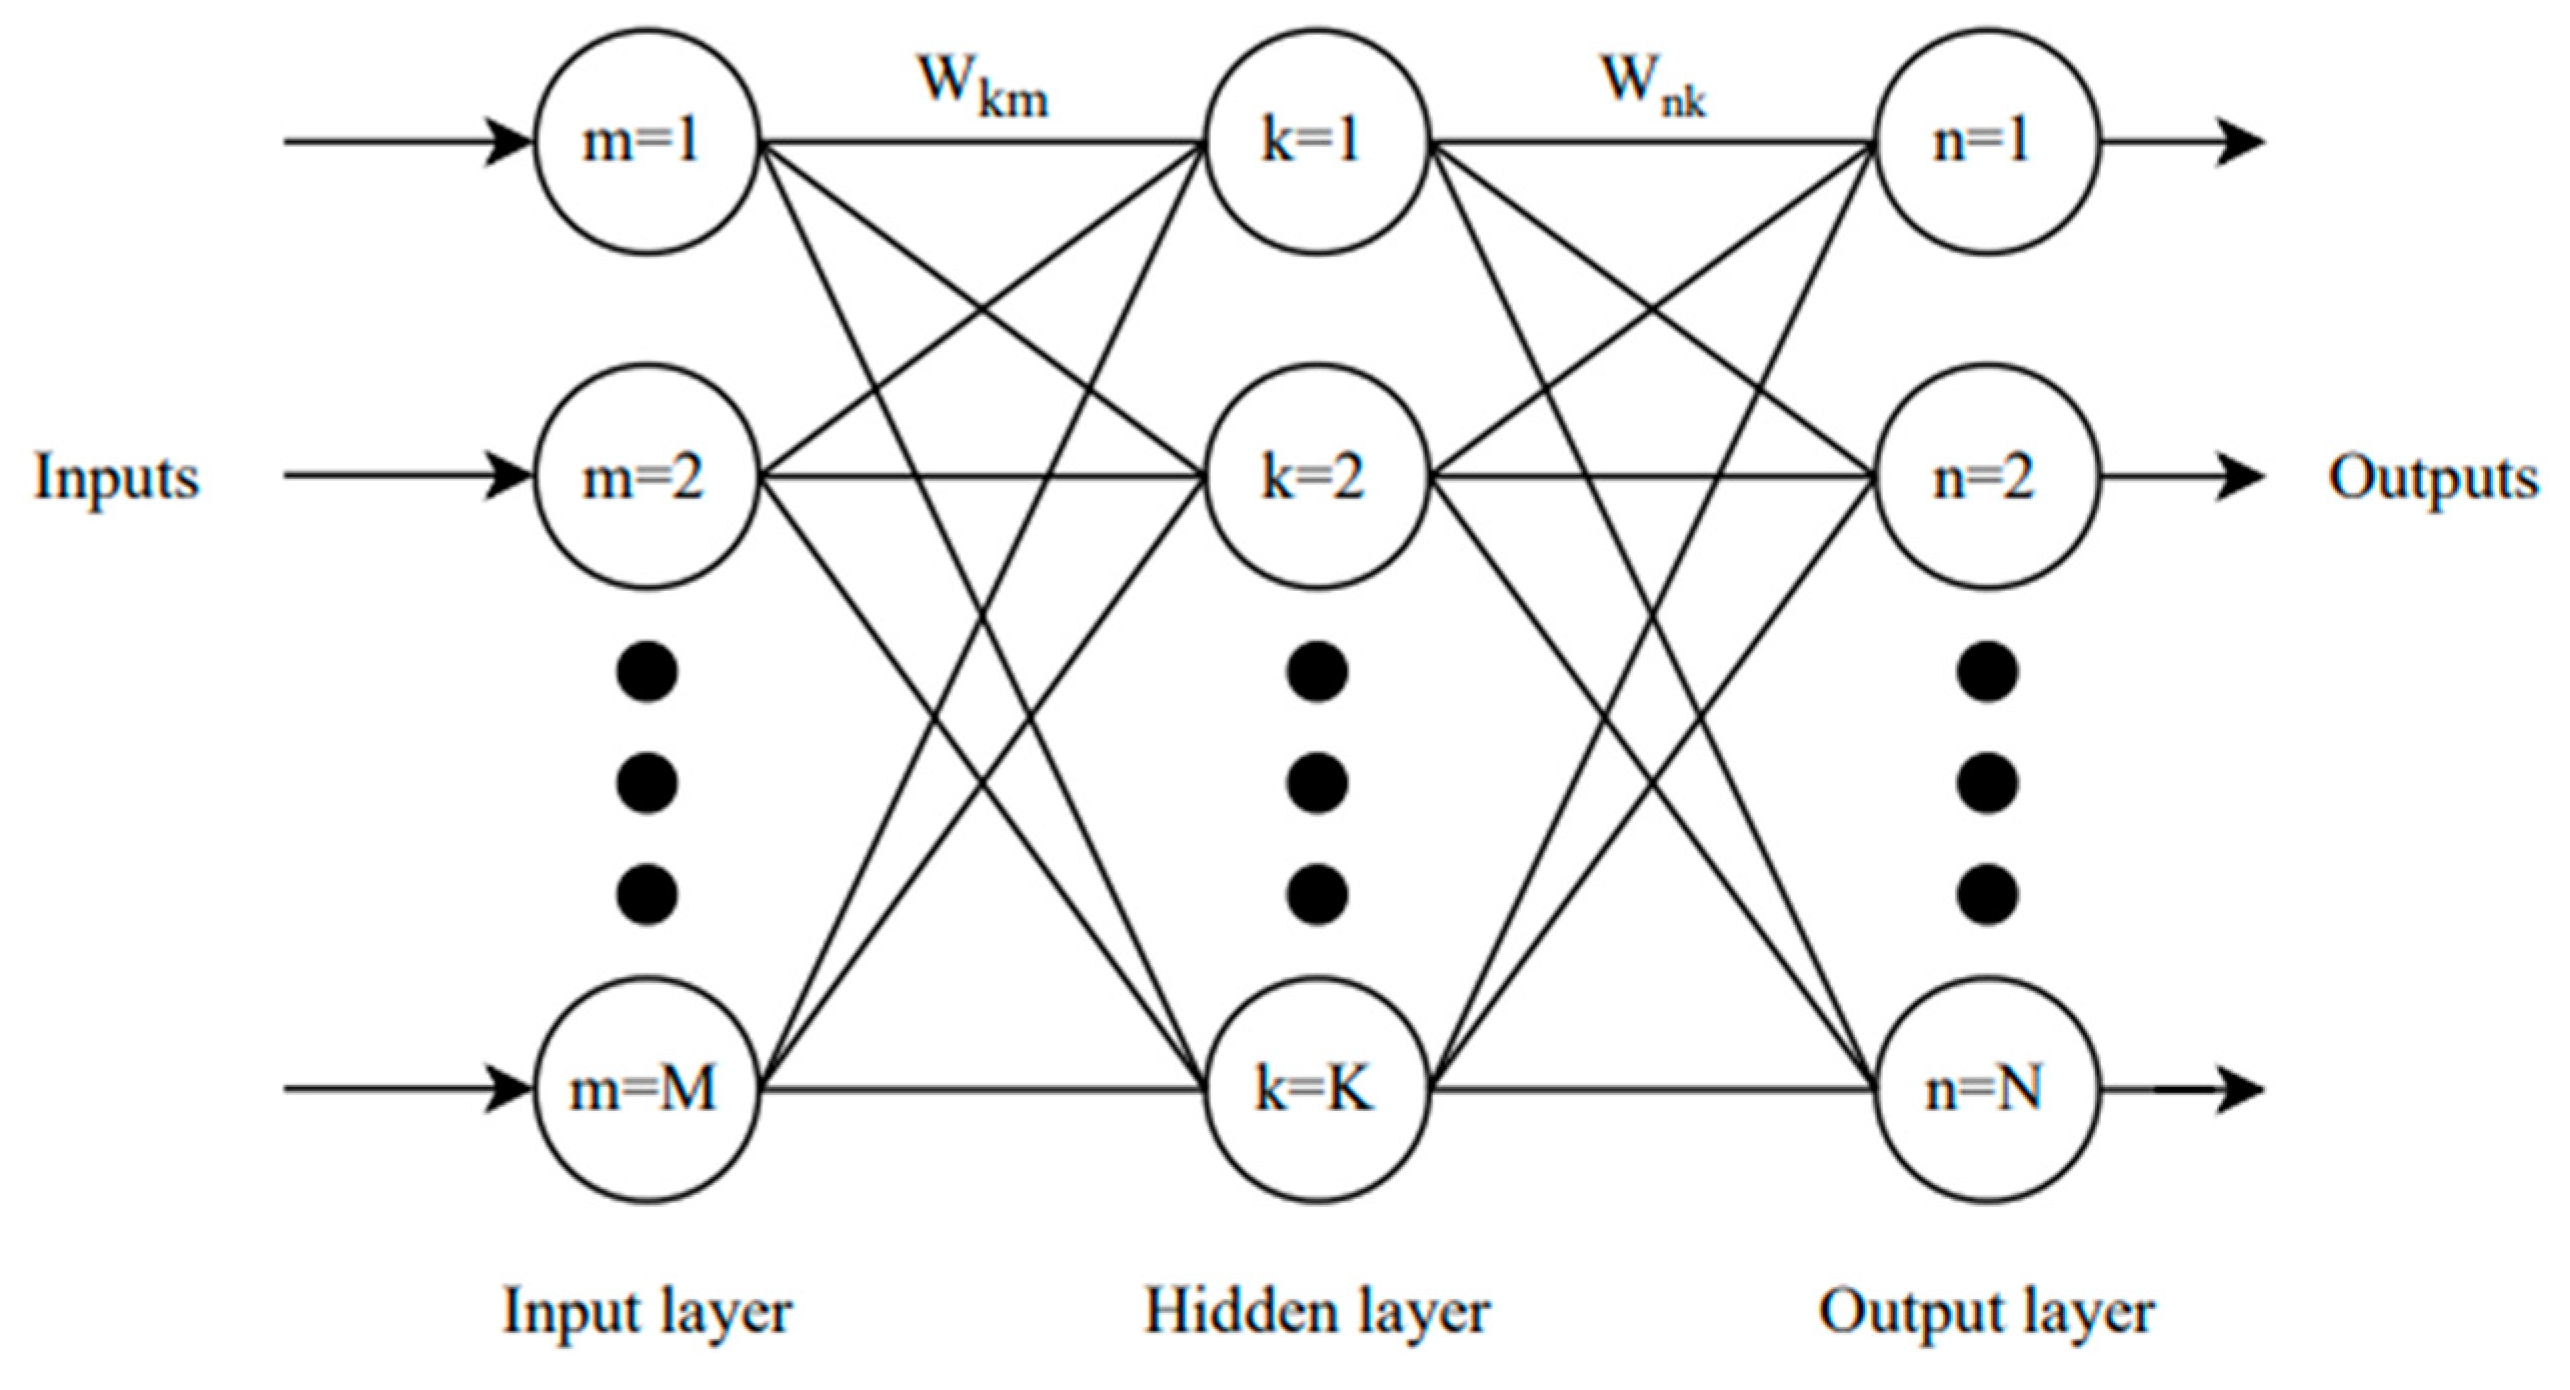
The general structure of the fully connected, feedforward network is shown in Figure 10. The network is composed of an input layer, a hidden layer, and an output layer, where each layer contains a number of neurons. In this study, the model is composed of three input neurons, two output neurons, and six hidden neurons. A more detailed description of the structure of the model can be found in the following context. During the training process of the neural network, the synaptic weights and biases were adjusted to generalize the targeting outputs [30]. The relationship between the input and output k-th neurons are the following:
where is the output of the k-th neuron, is the activation function, is the input of the m-th neuron, is the weight of the connection between the m-th neuron of the input layer and k-th neuron of the hidden layer, and is the bias for the k-th neuron of the hidden layer.
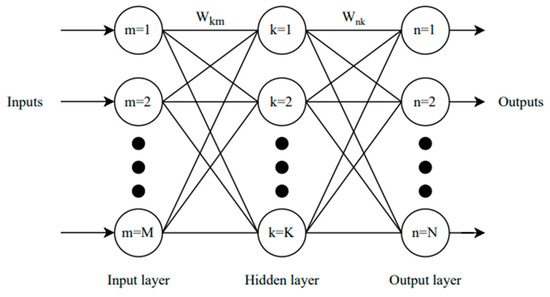
Figure 10.
The structure of the artificial neural network.
The activation function, , was selected as the tangent sigmoid, which is a commonly used activation function:
ANN models work better when an activation function is present because it adds non-linearity to the network’s decision-making process. This lets the network solve more complicated problems. The tangent sigmoid function is often utilized as it confines any input values within the range of −1 to 1. The training algorithm utilized in this study was the Levenberg–Marquardt algorithm, which has been demonstrated to be the most efficient technique for training feedforward networks [31].
The baseline model for the studied unit was developed using minutely collected data during November 2021 to March 2022. The dataset was selected based on the availability of space heating data and its coverage of exterior air temperature ranges as extensively as possible. The original dataset was subjected to cleaning and then converted into hourly intervals to facilitate training of the ANN model, since hourly predictions are more computationally efficient than minute-by-minute predictions, while providing sufficient granularity and accuracy. The dataset prepared for training comprised the hourly space heating load, space heating electricity consumption (of the ASHP), space heating natural gas consumption (of the TWH), exterior air temperature, and volumetric air flow rate. The return air temperature sensor was located downstream of the heat recovery ventilator, where the return air was already mixed with fresh air from the exterior. As a result, the return air temperature in this study was not included as a significant input variable for the energy consumption prediction models. Statistical information regarding the dataset is presented in Table 4, with the total number of hourly interval data points available for training being 2316.

Table 4.
Data statistics of the studied unit.
By using the equation below, the collected data of the space heating load, exterior air temperature, and air flow rate were normalized within the range of 0–1.
where the is the current value, and and are the minimum and maximum values of the entire dataset.
Natural gas and electricity consumption for space heating were normalized to have the data distributed normally using the following logarithmic function:
The ANN model was constructed using a built-in neural network toolbox in MATLAB R2020b. The supply air flow rate, exterior air temperature, and space heating load were selected as inputs. Natural gas consumption of the TWH and electricity consumption of the ASHP for space heating were set as outputs. Thus, the model contains three input neurons and two output neurons. The ANN model was designed with six hidden neurons, which were defined by the sensitivity analysis; additionally, the model was trained with 0 to 30 hidden neurons and selected the network structure with the least coefficient of variation in the root mean square error (CVRMSE). Within the collected dataset, 70% of randomly selected data points were used for training the baseline ANN model and the remaining 30% of data were used to validate the accuracy of the model.
The selected ANN models were trained 10 times, and the best-trained model was chosen for comparison with the HOT2000 model, which will be discussed in the next section. To evaluate the performance of the model, the CVRMSE was used. This measure is widely used to evaluate energy prediction models, as it indicates the relative variability in the model’s error compared to the mean of the measured data. The CVRMSE can be calculated using the following formula:
where is the predicted energy consumption value of the model, is the measured energy consumption value, is the average energy consumption value, and is the total number of observations.
3.1.2. Prediction Model Performance
The findings of the ANN modeling are presented in Table 5, after conducting 10 training runs with the optimal number of hidden neurons. The tables also include the CVRMSE value for the best-performing model out of the 10 runs, which indicates the accuracy of the networks. Comparing the results to prior research in ANN models for building energy prediction, Edwards, New [32] achieved a CVRMSE of 24.32–37.15% on heating energy consumption using hourly real data for model training, while Yun, Luck [33] achieved a CVRMSE of 23.0–23.3% in modeling heating energy consumption for a residential building based on hourly data. Hence, the ANN models in this study reveal a satisfactory prediction.

Table 5.
Results of the artificial neural networks.
3.1.3. Building Energy Simulation with HOT200
HOT2000 is an energy simulation modeling software that has been widely used in Canada for various programs, such as the Home Energy Rating system, Energy Star program, and the R-2000 residential energy efficiency program [20]. The simulation of building energy consumption in this study was performed using HOT2000 version 11.10b19. The software simulates energy requirements based on the building envelope information, indoor set point temperature, baseloads, air change rate, ventilation, heating and cooling system, and domestic hot water. Details of the building envelope for the studied unit are presented in Table 6, where the floor plan of the duplex house can be found in Appendix A.

Table 6.
Building envelope information.
Table 7 provides the input for the building’s mechanical system. The indoor thermostat set point temperature was assumed to be constant and was retrieved from the occupants of the house. The baseload was estimated using the monitored data and Equation (5). The air change rate was based on the measured value. The whole-house ventilation and heating system information were obtained from the homeowner information sheet and mechanical system specifications, respectively.

Table 7.
Building mechanical system information.
3.1.4. Predicting Hybrid System Energy Consumption with HOT2000 Weather Conditions
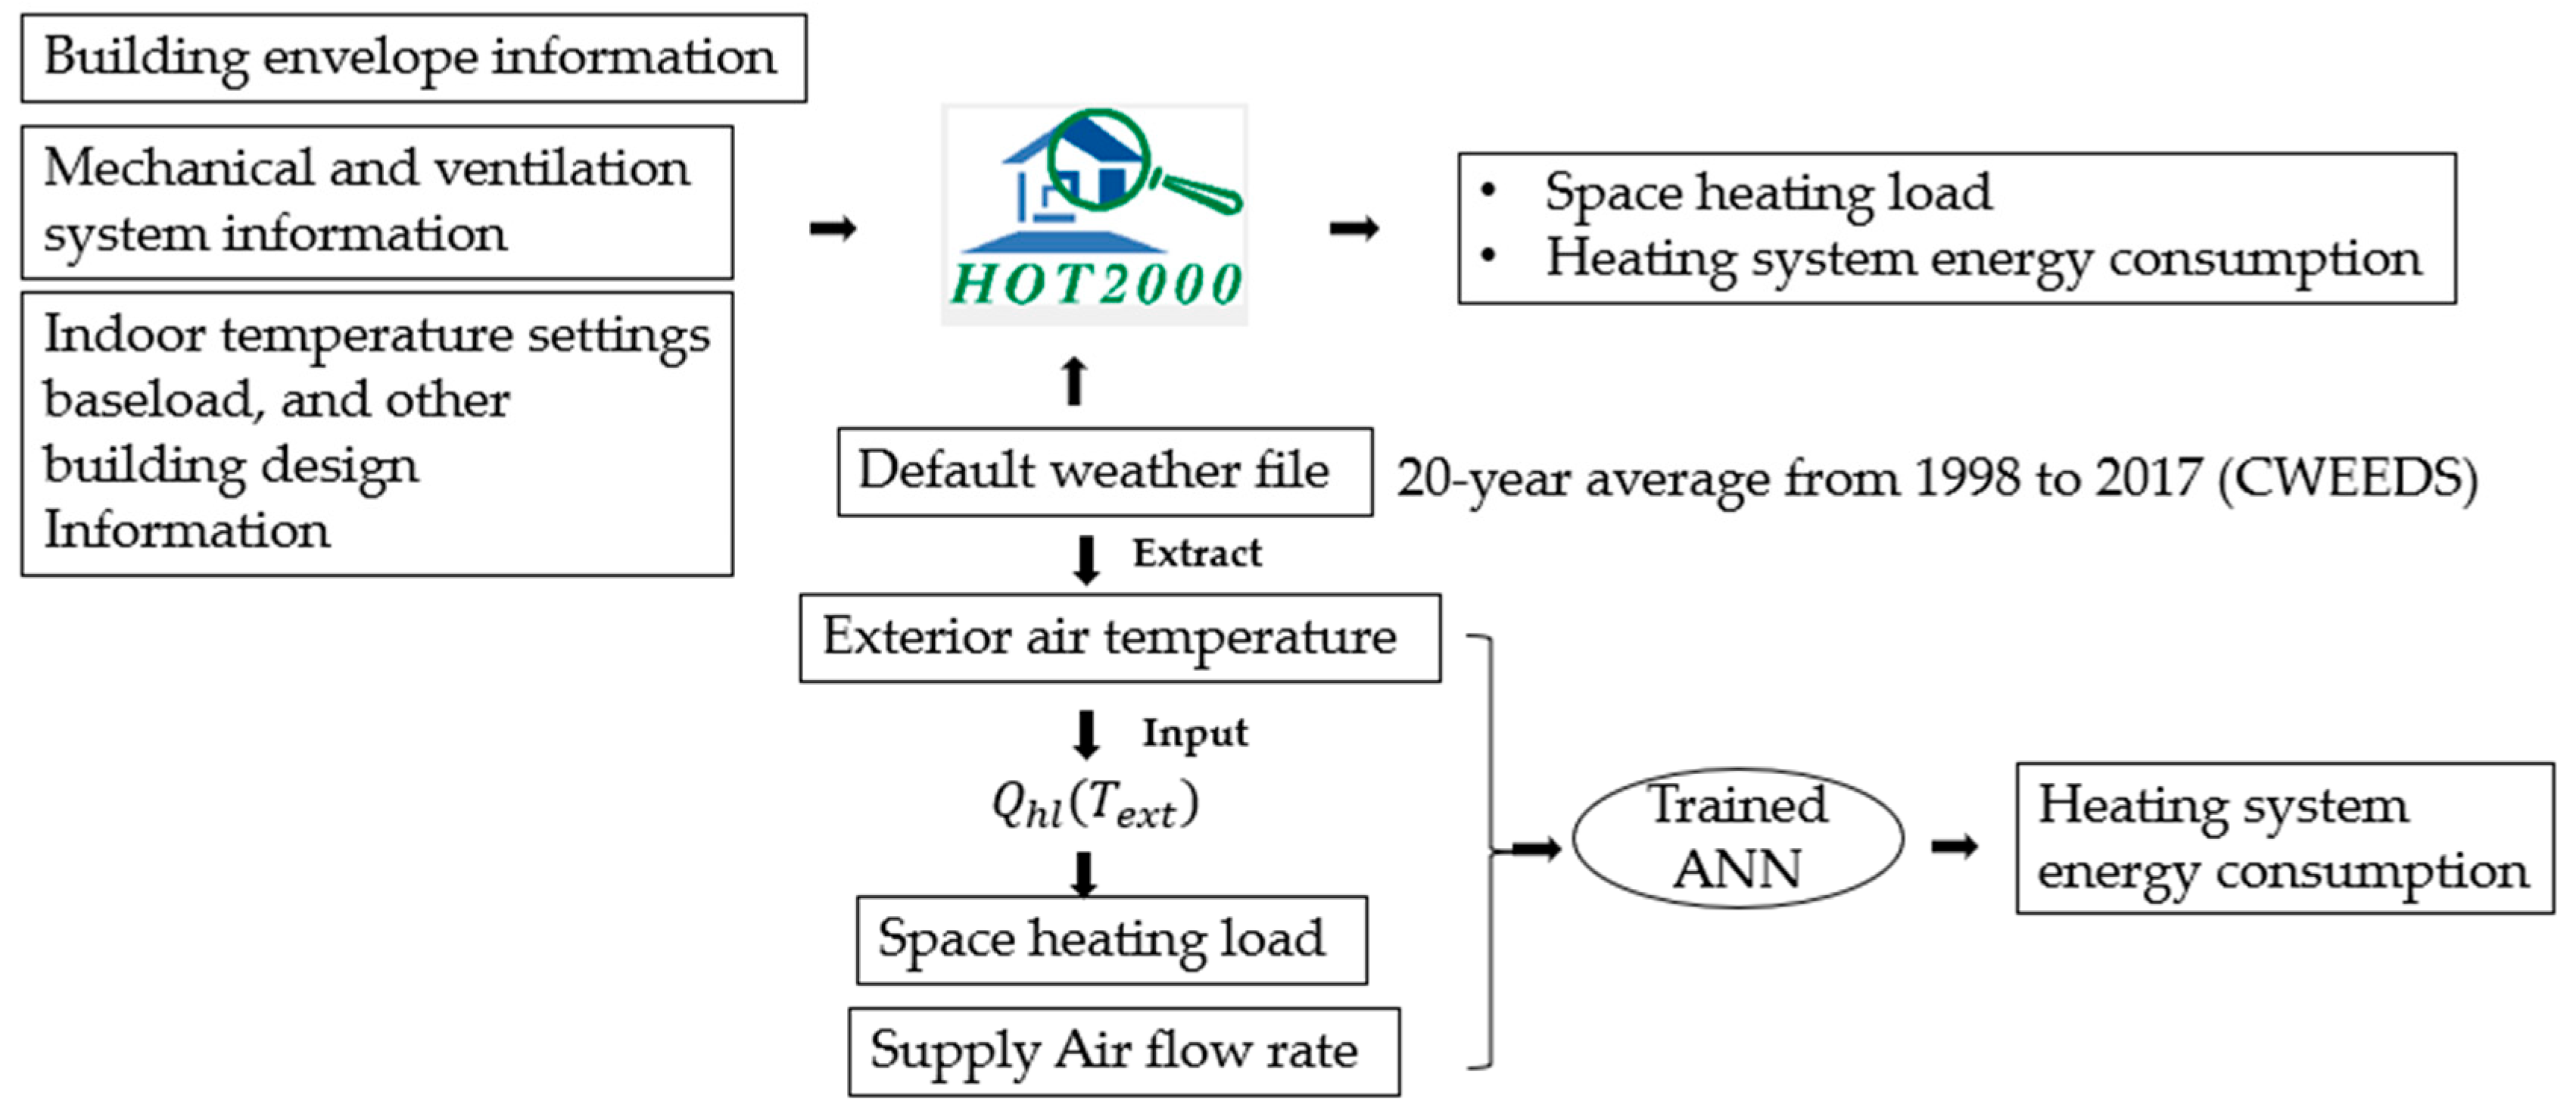
The HOT2000 utilizes climate data from its weather file and user-defined building envelope thermal insulation and ventilation information to approximate the building’s space heating loads. Based on mechanical system performance, the software then estimates the space heating energy consumption based on thermodynamic functions. As shown in Figure 11, to compare the HOT2000 simulated performance results with the in situ results on the same basis (i.e., same operational conditions), three parameters were input into the best-performing ANN model that was trained in the previous section: (1) Weather data was used from the default files; HOT2000 software uses 20-year average climate data from 1998 to 2017 for simulations of houses situated in Edmonton, based on Canadian Weather Energy and Engineering Datasets (CWEEDS) [34]. Thus, the above 20-year average hourly exterior air temperature of November was used as one input to the ANN model. (2) Corresponding space heating loads of the exterior weather conditions were used, with the hourly space heating load calculated using the regression model estimated in Figure 8 of Section 2.4.1., as the following:
where is the space heating load of the studied unit in MJ and is the 20-year hourly exterior air temperature of corresponding months in . (3) The supply air flow rate that was set up in the mechanical and ventilation system section of HOT2000 was used. As the ANN model was trained using real monitored data, it will produce outputs that reflect the in situ performance, including space heating electricity and natural gas consumption for the heating system, while taking into account the simulation environment.
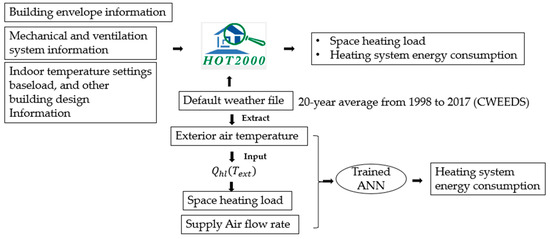
Figure 11.
Concept of the comparison between the HOT2000 and ANN.
3.1.5. Comparison between the ANN and HOT2000 Results
The HOT2000 weather file recorded the temperature of the air outside, and the linear regression model (Equation (13)) found the hourly space heating load. These were then fed into the best ANN model to estimate how much heating energy would be used in the HOT2000 environment. It was also possible to compare the energy used for space heating that was tracked with that predicted by HOT2000 (called “HOT2000” results in the figures below) and with that predicted by the ANN model (called “ANN” results in the figures below).
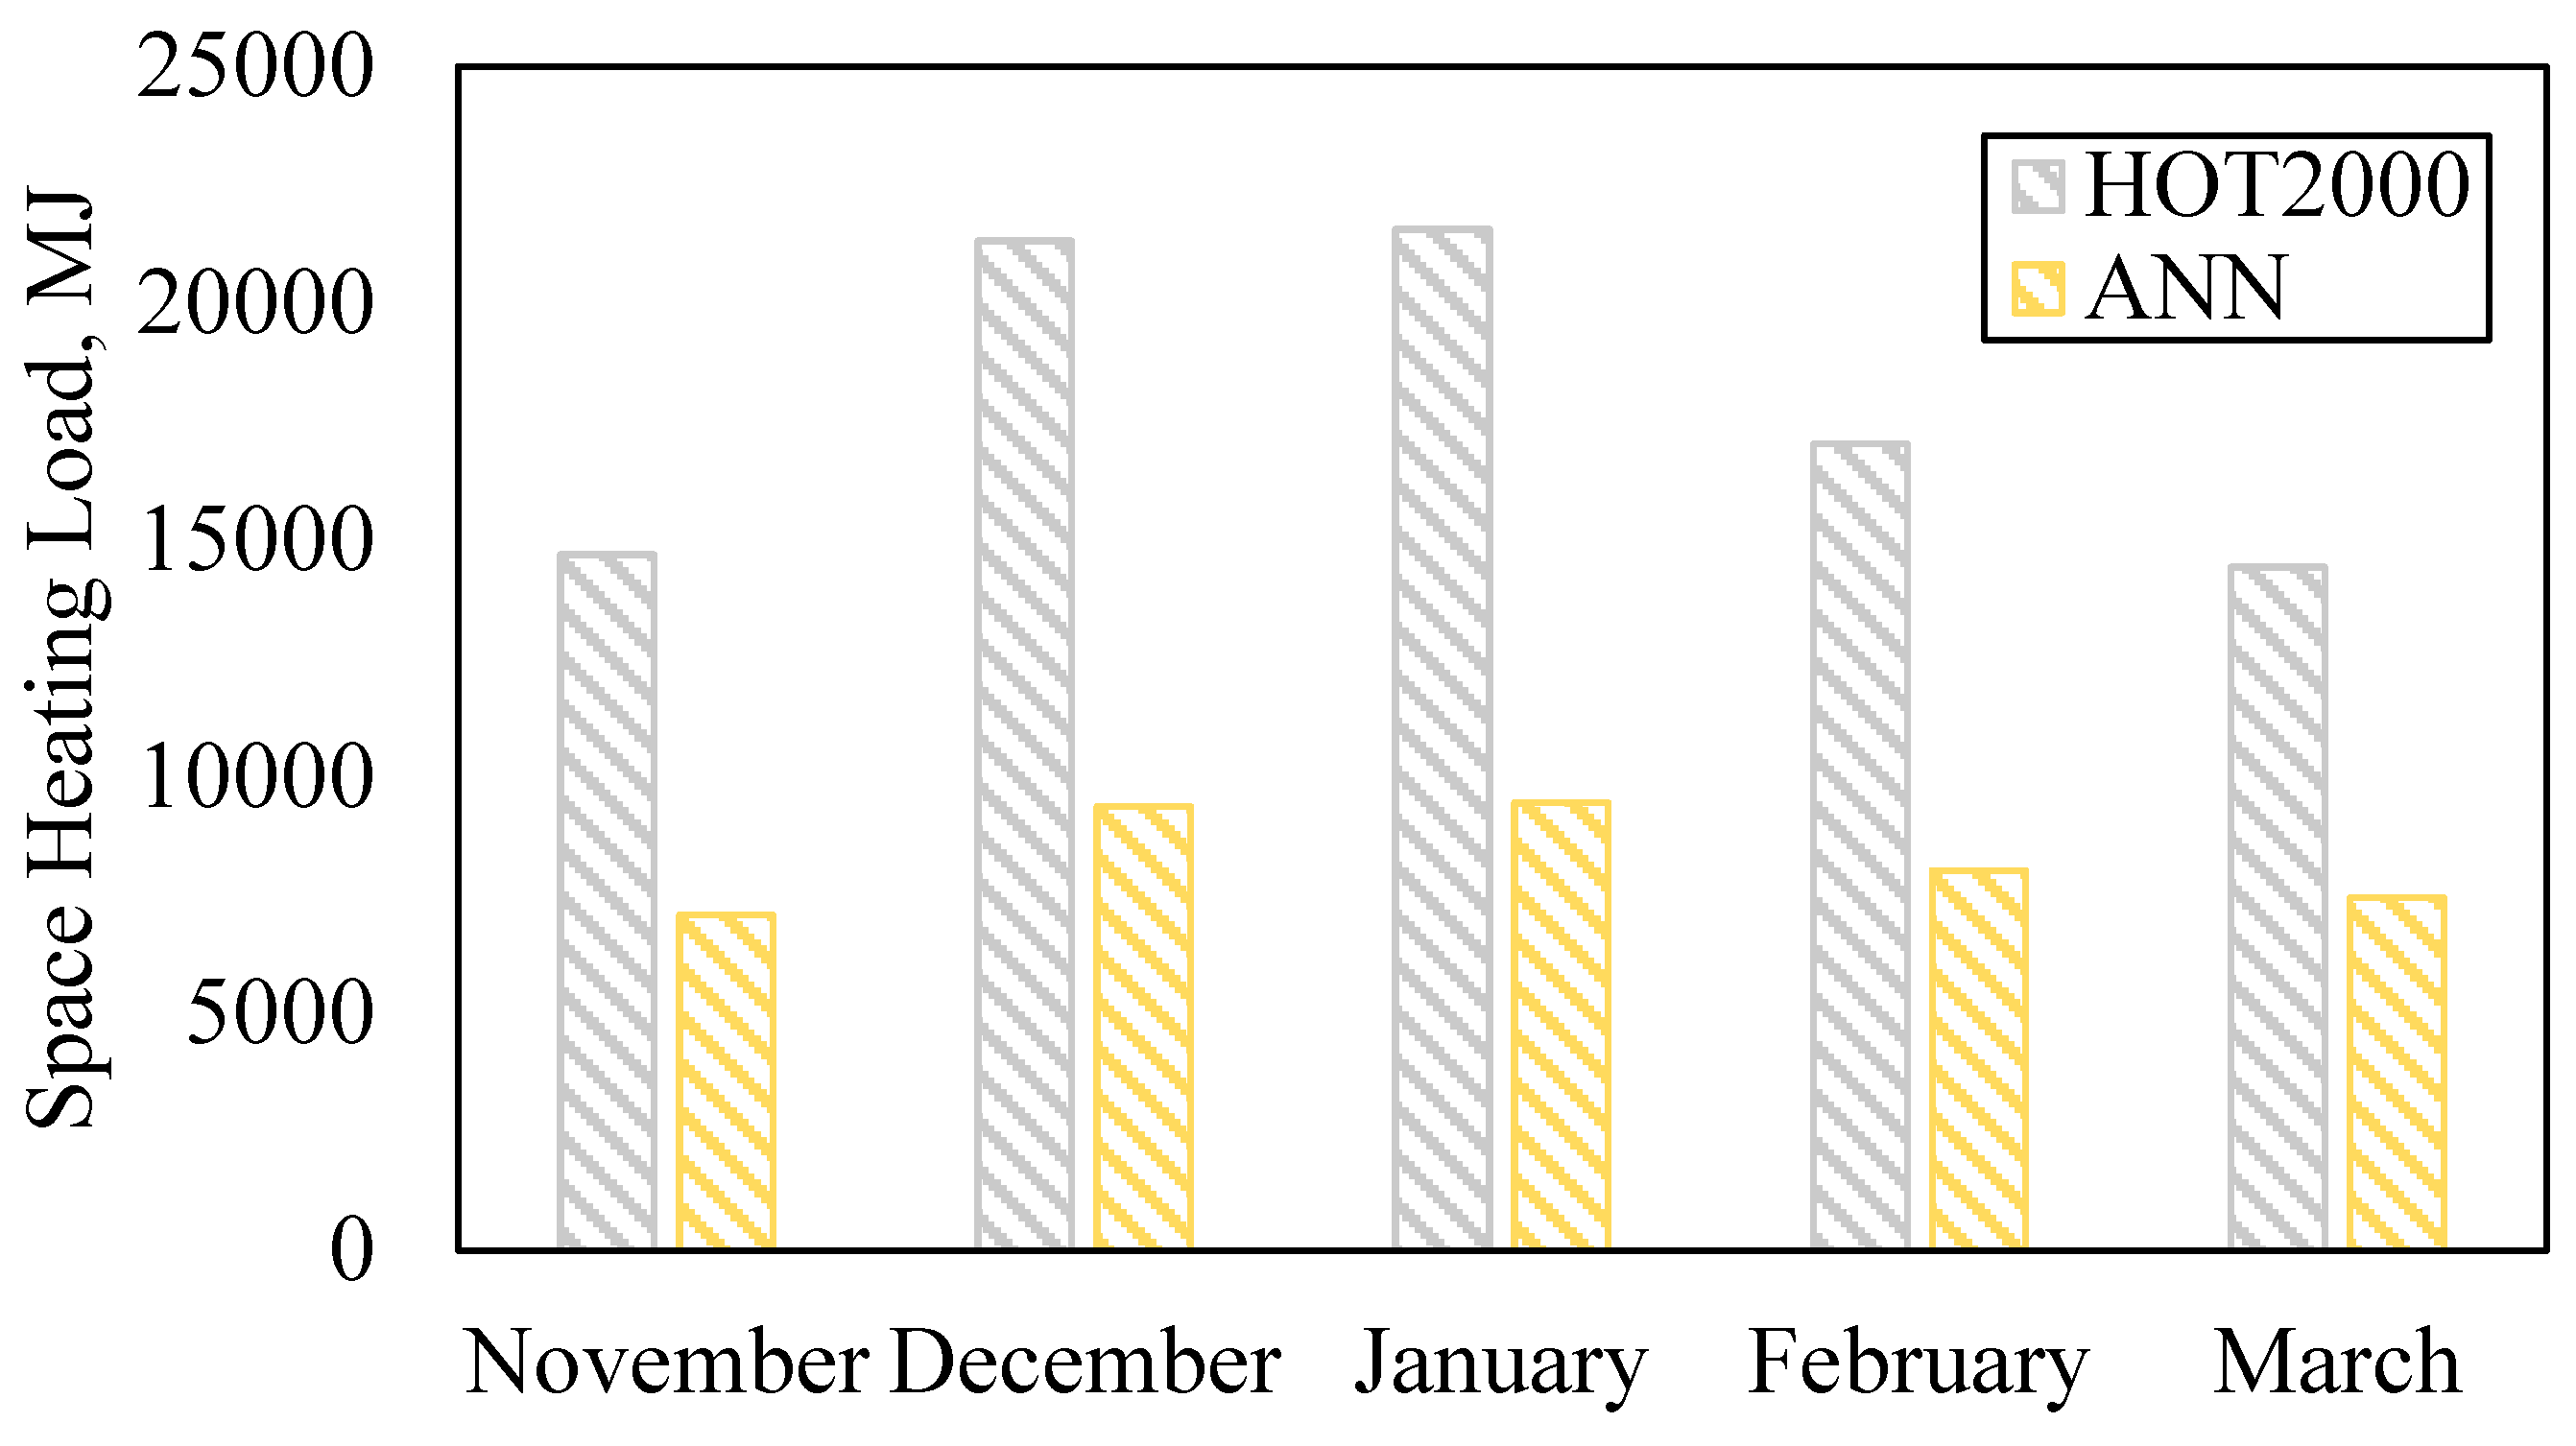
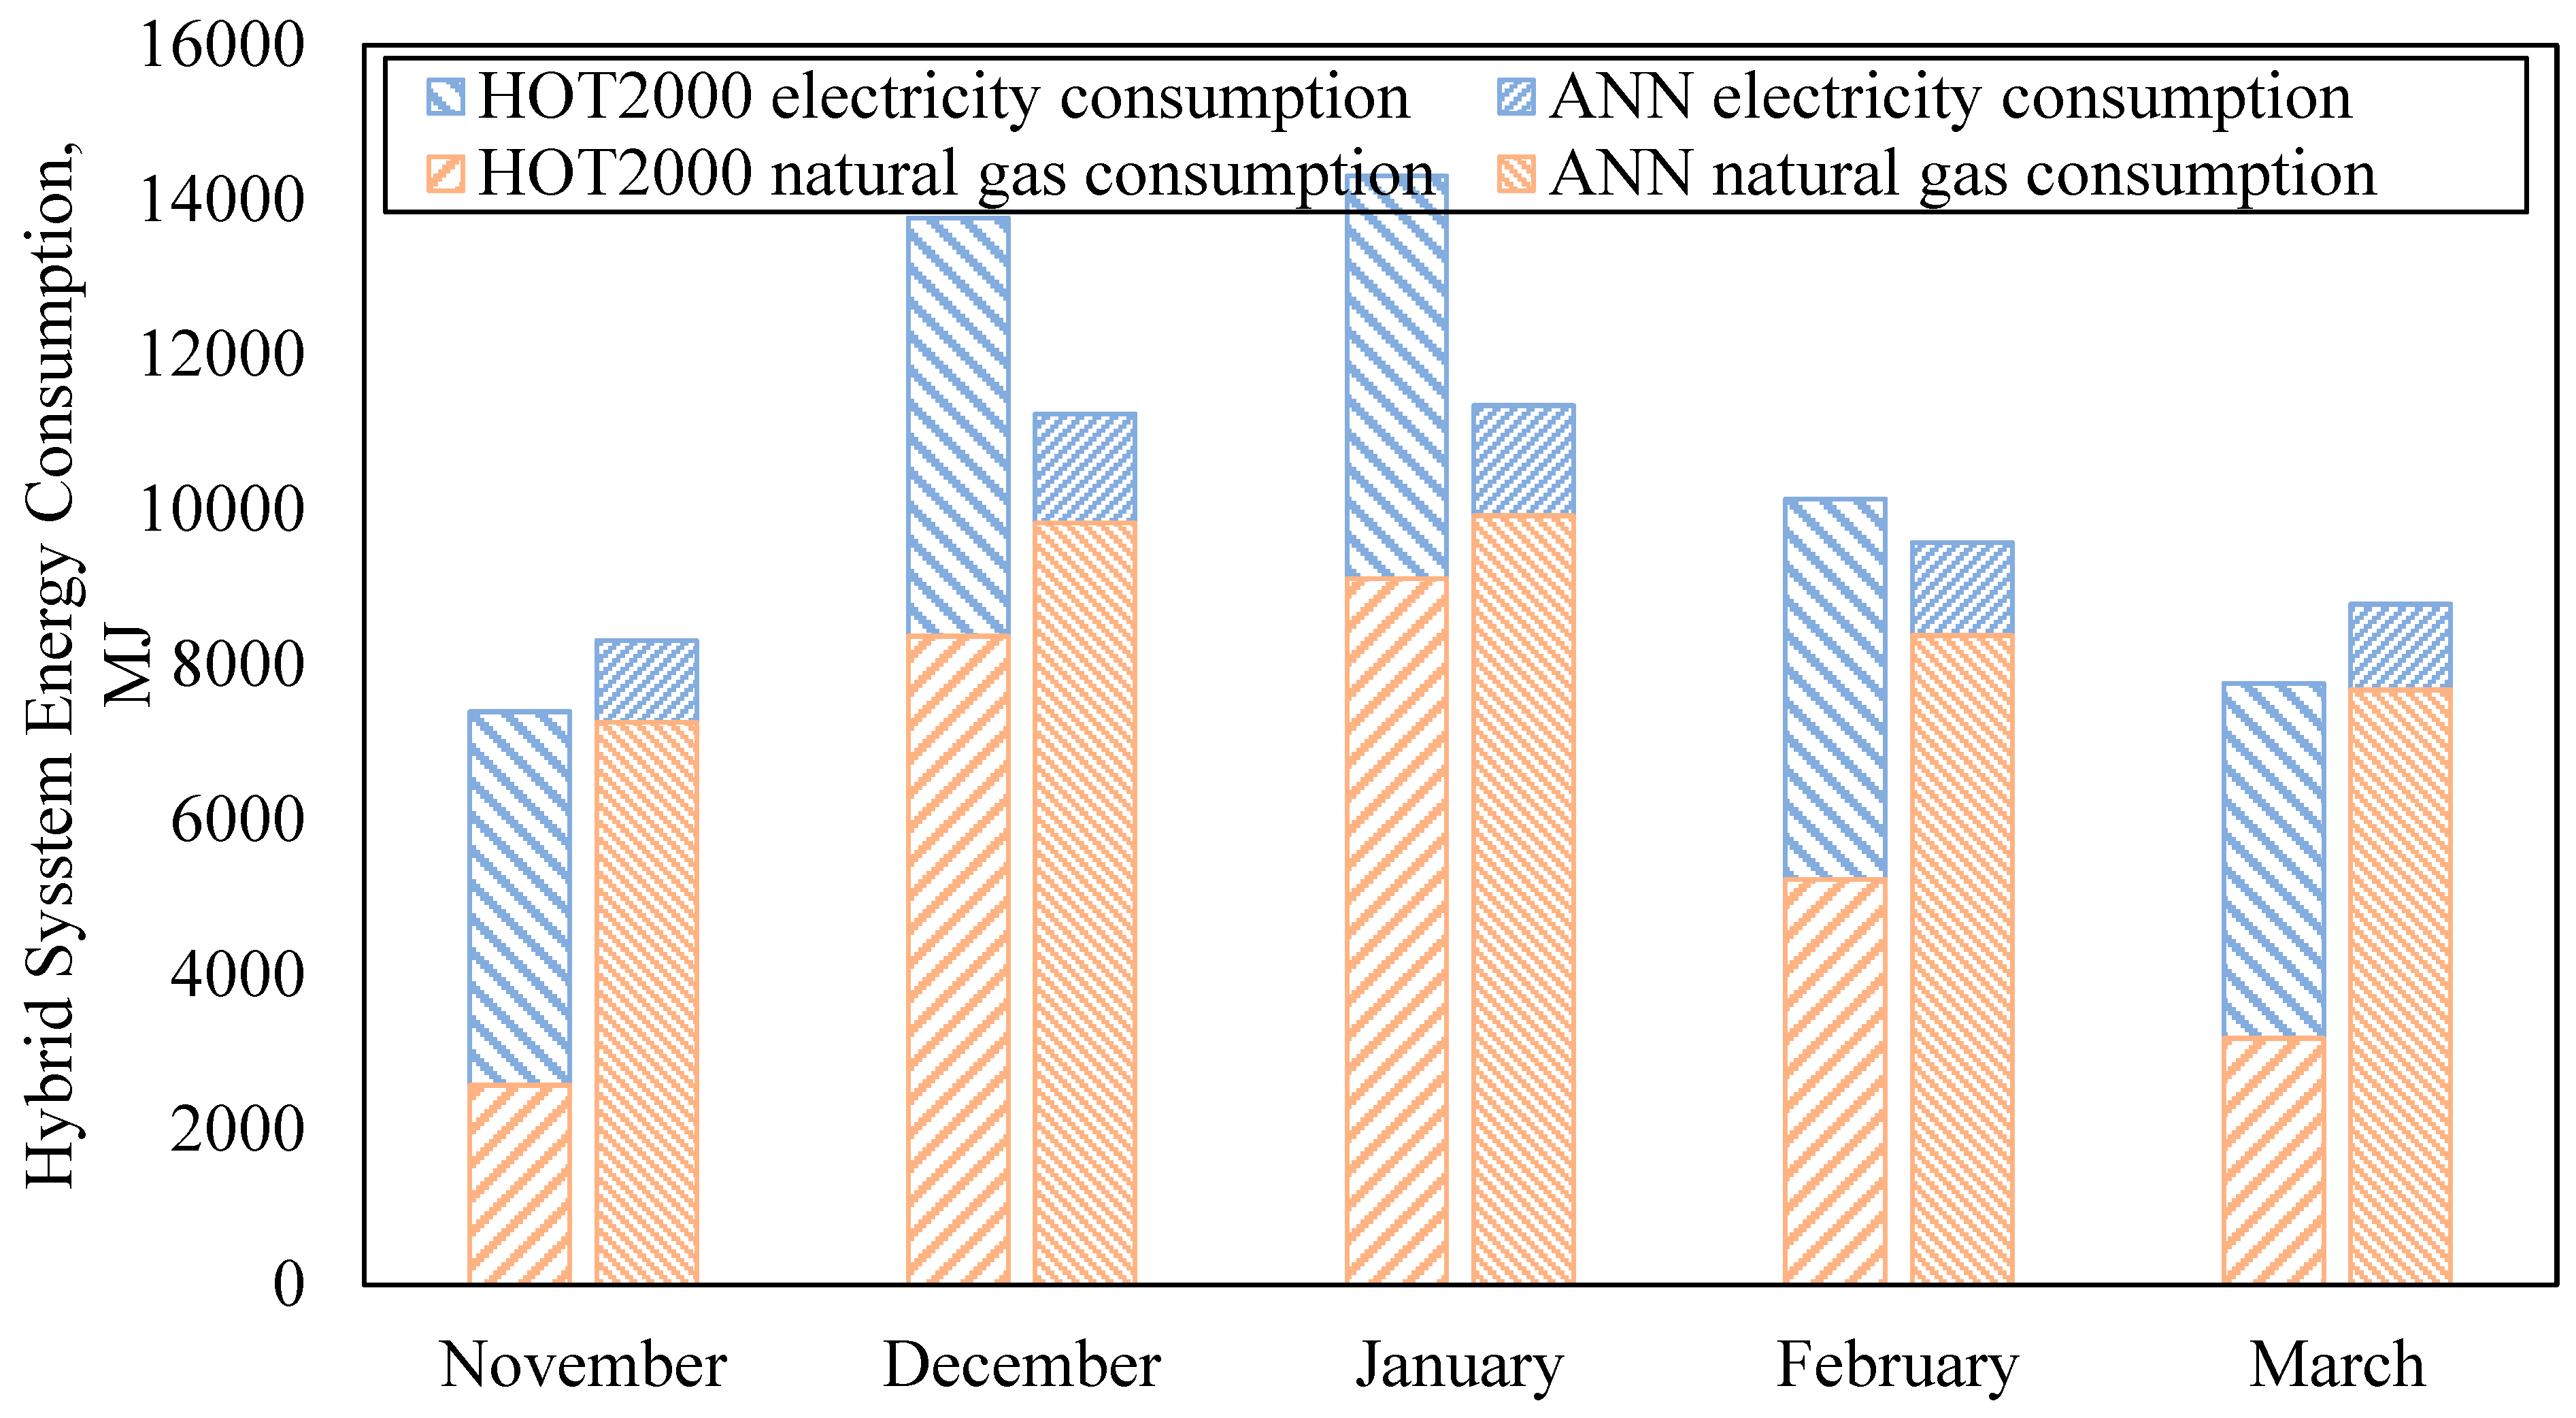
Figure 12 and Figure 13 display a comparison of the HOT2000 and ANN results in terms of the space heating load and space heating energy consumption, respectively. The default weather file in HOT2000 does not accurately reflect the actual weather conditions. Therefore, by training the ANN with real-time weather data and then extracting this data to further train the ANN model, it was ensured that the ANN’s predicted energy consumption figures could serve as a reliable benchmark (i.e., represent the actual performance of the system) to evaluate the results simulated by HOT2000.
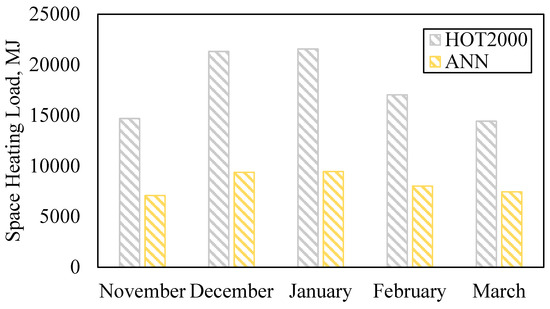
Figure 12.
Comparison of the space heating loads between the HOT2000 and ANN of the studied unit.
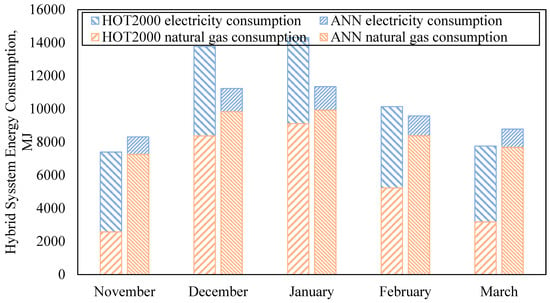
Figure 13.
Comparison of the space heating energy consumption between the HOT2000 and ANN of the studied unit.
The ANN’s prediction for the space heating load was derived from machine learning, and the HOT2000’s simulated space heating load was estimated using first principles and user input information. From Figure 12, it can be observed that the system space heating load predicted by the ANN model is almost half of the HOT2000 simulated result consistently across each month. The HOT2000 simulated heating load of the house is significantly higher than the actual value, which could be attributed to uncertainties during monitoring and differences between the actual setting and HOT2000 input parameters. Furthermore, the monitoring system measures the temperature of the return and supply air to obtain the space heating output, while the heat loss from the mechanical room during fluid transfer can provide additional warmth to the house and cannot be measured. Moreover, the thermal settings may frequently change due to the occupants, and their schedules may differ from the HOT2000 input parameters.
It can be seen from Figure 13 that the HTWHOT2000 simulated heating system consumes more electricity and less natural gas than the ANN predicted result. This result implies that the HOT2000 model used the heat pump more for space heating compared to the ANN model based on the physical world data. Although the heating loads predicted by the HOT2000 simulation were twice as large compared to the ANN model, the overall energy consumption between results is relatively consistent when compared for each month. This is because although the heating load is much larger for the HOT2000 simulation when using the heat pump more, the corresponding energy is less due to the higher efficiency (COP) of the heat pump compared to the TWH. From previous sections, the COP of the heat pump was determined to be a function of exterior temperature (Equation (6)), where the minimum COP for operating the heat pump was 1.2 and the average efficiency of the TWH was 0.70. This reveals a large discrepancy in both the determined heating load and the behavior of the hybrid system when comparing the simulated model to the ANN predictions, which may be a result of the following:
- The HOT2000 simulated results indicate better system performance for the hybrid energy heating system, which diverges from the actual system. This is because the HOT2000 software uses the input manufacturer’s specifications for heating system components (ASHP and TWH) to calculate the energy consumption of the corresponding heating load, which performs better than the in situ system performance.
- The HOT2000 manages the operation between the heat pump and the TWH based on the heating capacity of the system. The heat pump is primarily responsible for providing space heating, and the TWH acts as a backup heating system to assist the heat pump when it is unable to meet the space heating load. However, this mode of operation is not the same as the actual system, where the TWH will be started if the heat pump alone cannot bring the room temperature up to set point in less than 7 min time.
3.2. Monthly Energy and Life Cycle Cost Analysis
This section presents a comparative analysis of three residential building energy systems modeled using the HOT2000 based on their energy consumption and cost over the course of one year. The analysis took into account both initial and operational costs and includes the monitored outcomes of the hybrid energy system. The results demonstrate the superior energy efficiency of the hybrid system and provide cost comparisons with other energy systems, guiding optimal energy system selection for achieving both energy efficiency and cost savings.
Three types of HVAC systems were simulated in HOT2000. The first system was the hybrid energy system studied in this research, which consisted of a TWH for space heating and DHW and an ASHP for both space heating and cooling. The second system was a conventional energy system, consisting of a boiler for DHW, a natural gas furnace for space heating, and an AC for space cooling. The third system was a combi-boiler system, which used a combi-boiler for both space heating and DHW and an AC for space cooling. The building characteristics for the simulations were based on the studied right unit of the duplex house, with the same indoor HVAC settings (set point temperature, baseload, air change rate, and whole-house ventilation), as provided in Table 6. Additionally, the building envelope was identical to that shown in Table 7. The input parameters for the three different HVAC systems can be found in Table 8.

Table 8.
HOT2000 HVAC system inputs of different types of energy systems.
Table 9 shows the estimated costs of three different energy systems for residential buildings, which were provided by Landmark Homes, the builder of the duplex house examined in this study. The hybrid energy system includes both a TWH and an ASHP, which can provide both space heating, and DHW and space cooling, respectively. In contrast, the conventional energy system consists of a TWH for DHW, a natural gas furnace for space heating, and an AC for space cooling. The combi-boiler system utilizes a combi-boiler for space heating and DHW and AC for space cooling, and the installation cost includes the cost of an AHU. The combi-boiler system and the conventional system are the next two on the table in order of estimated initial cost, which is CAD 19,840.00 for the installation of the hybrid energy system.

Table 9.
Initial costs of different types of energy systems.
Table 10 displays the electricity and natural gas rates in Alberta [35]. The table indicates that the electricity rates range from 29.811 CAD/GJ in March to 67.244 CAD/GJ in December, with lower rates in the spring and higher rates in the winter months. On the other hand, natural gas prices are lower during the winter and higher during the summer, showing an opposite trend to electricity rates. It is important to note that electricity prices are generally higher than natural gas prices, and both are subject to seasonal fluctuations, which can significantly impact the energy costs incurred by end-users.

Table 10.
Electricity and natural gas rates of Alberta [35].
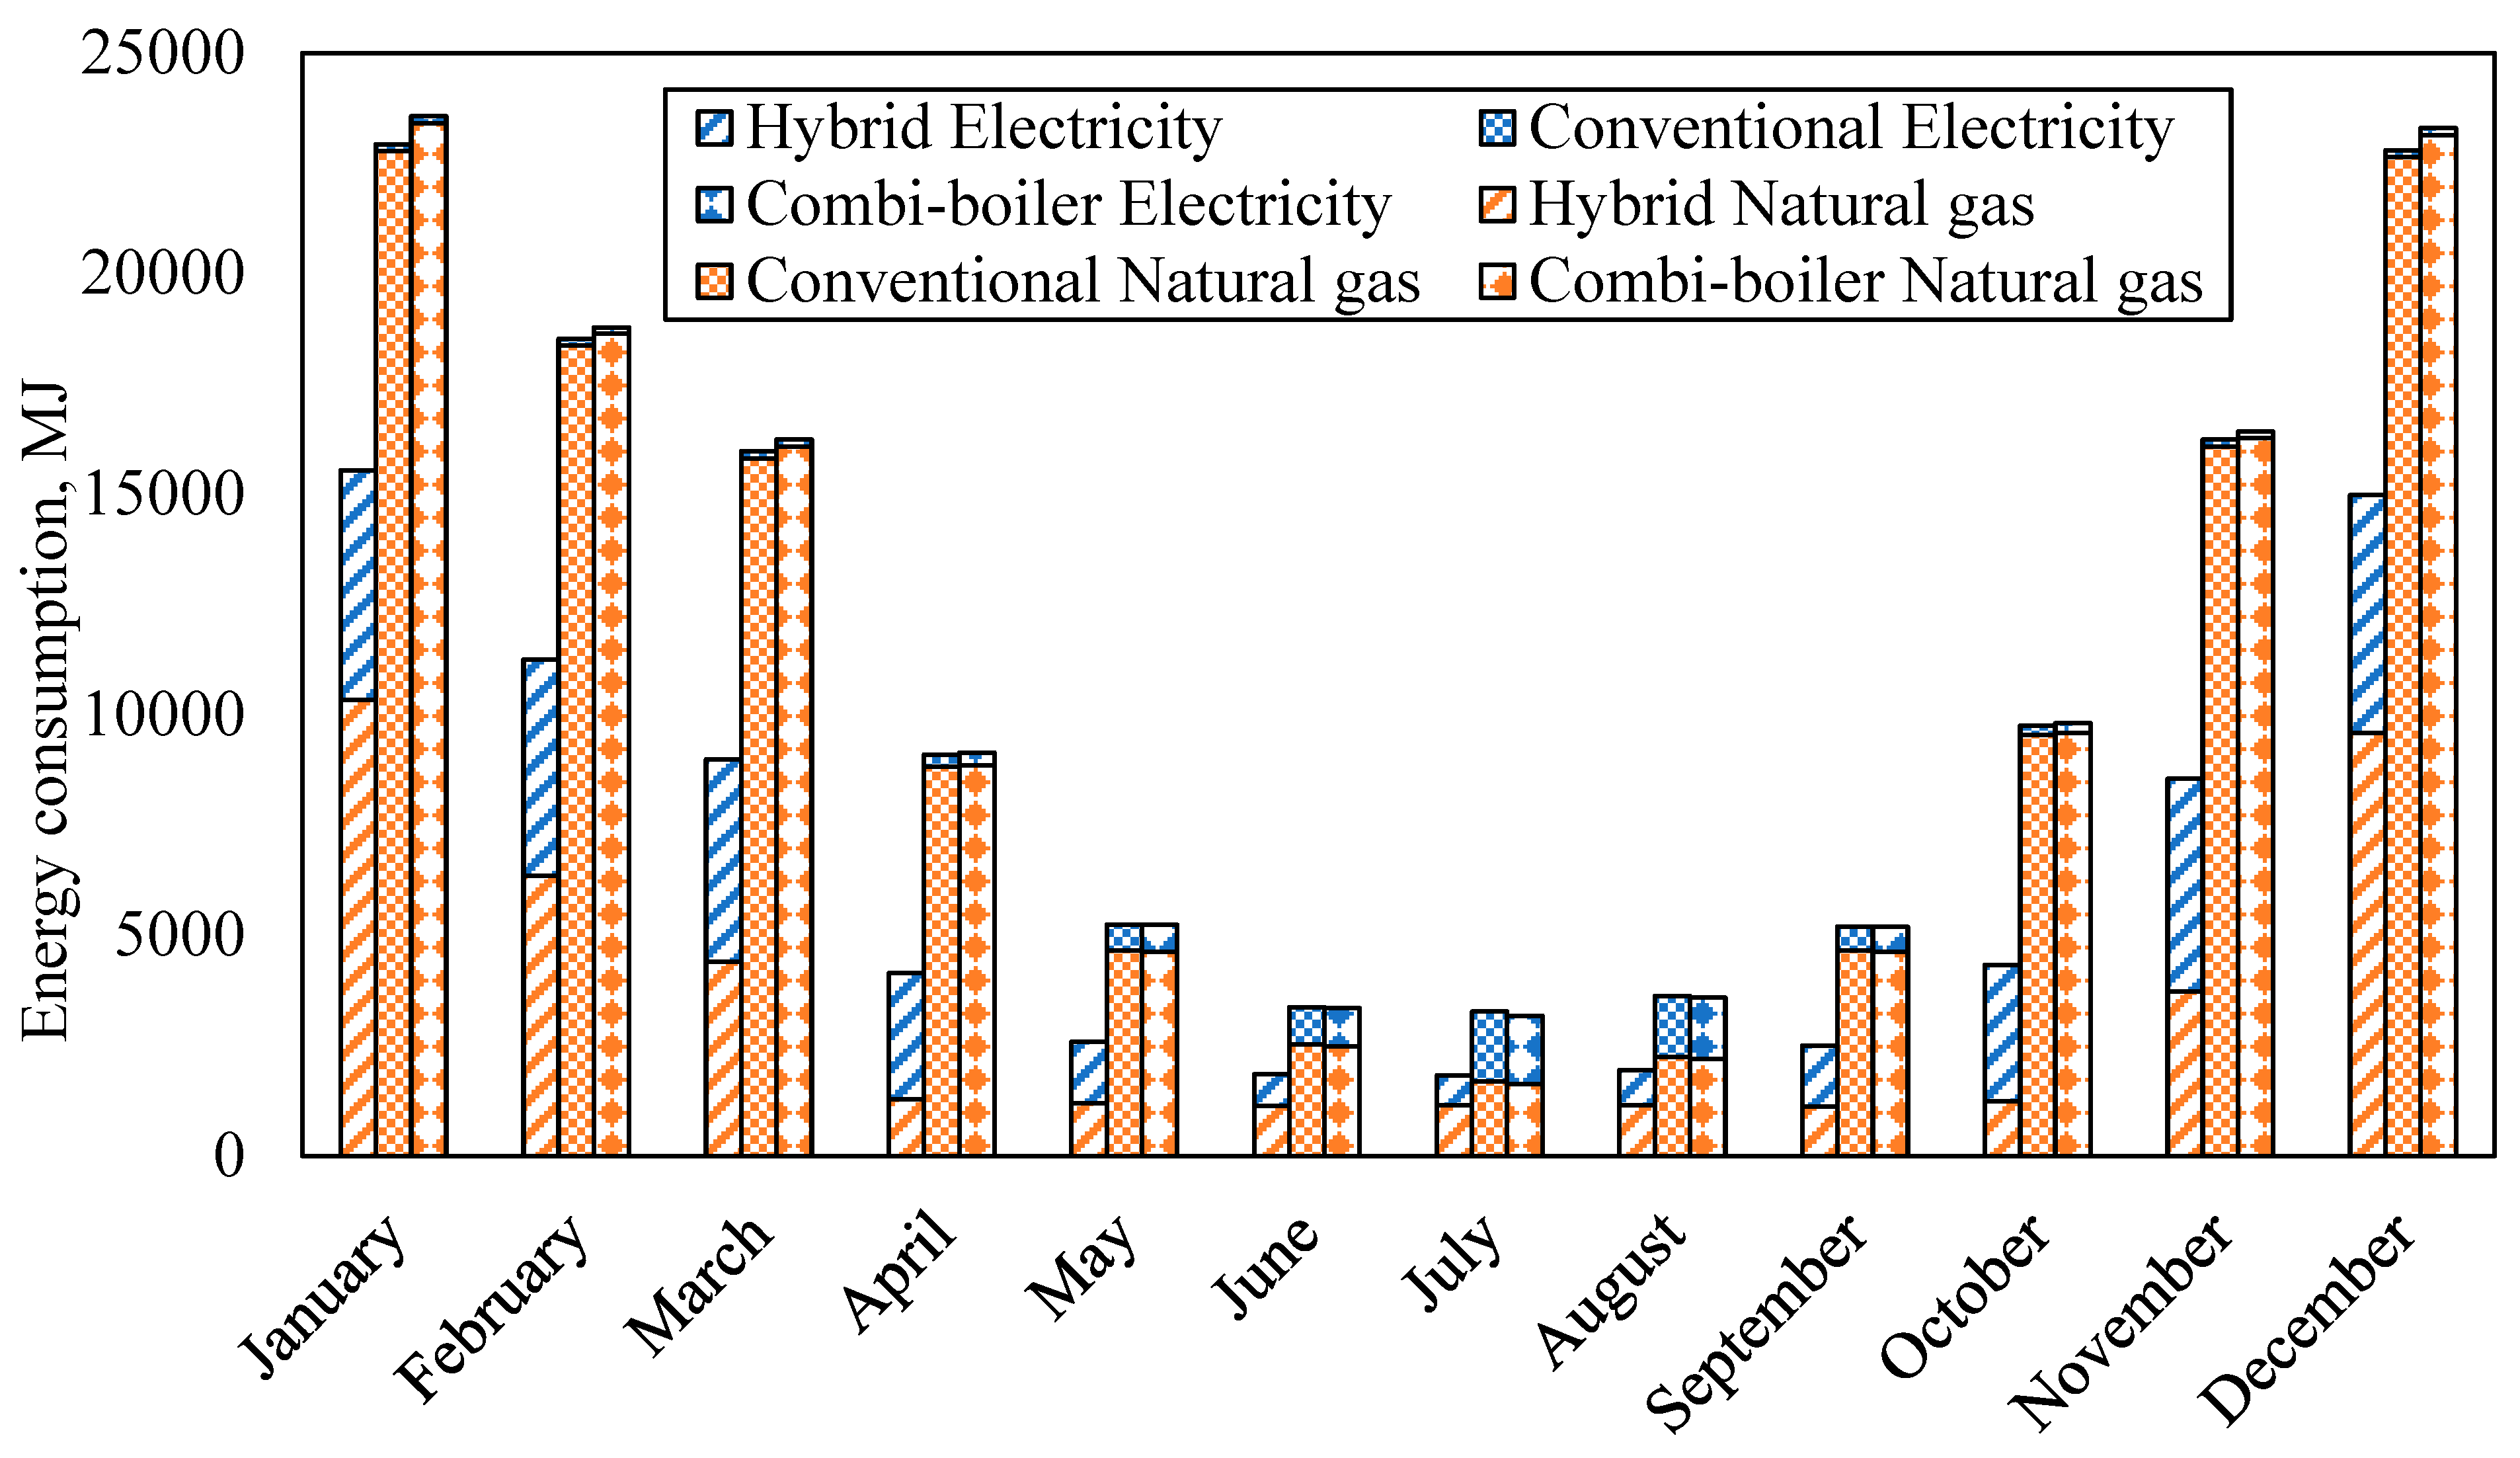
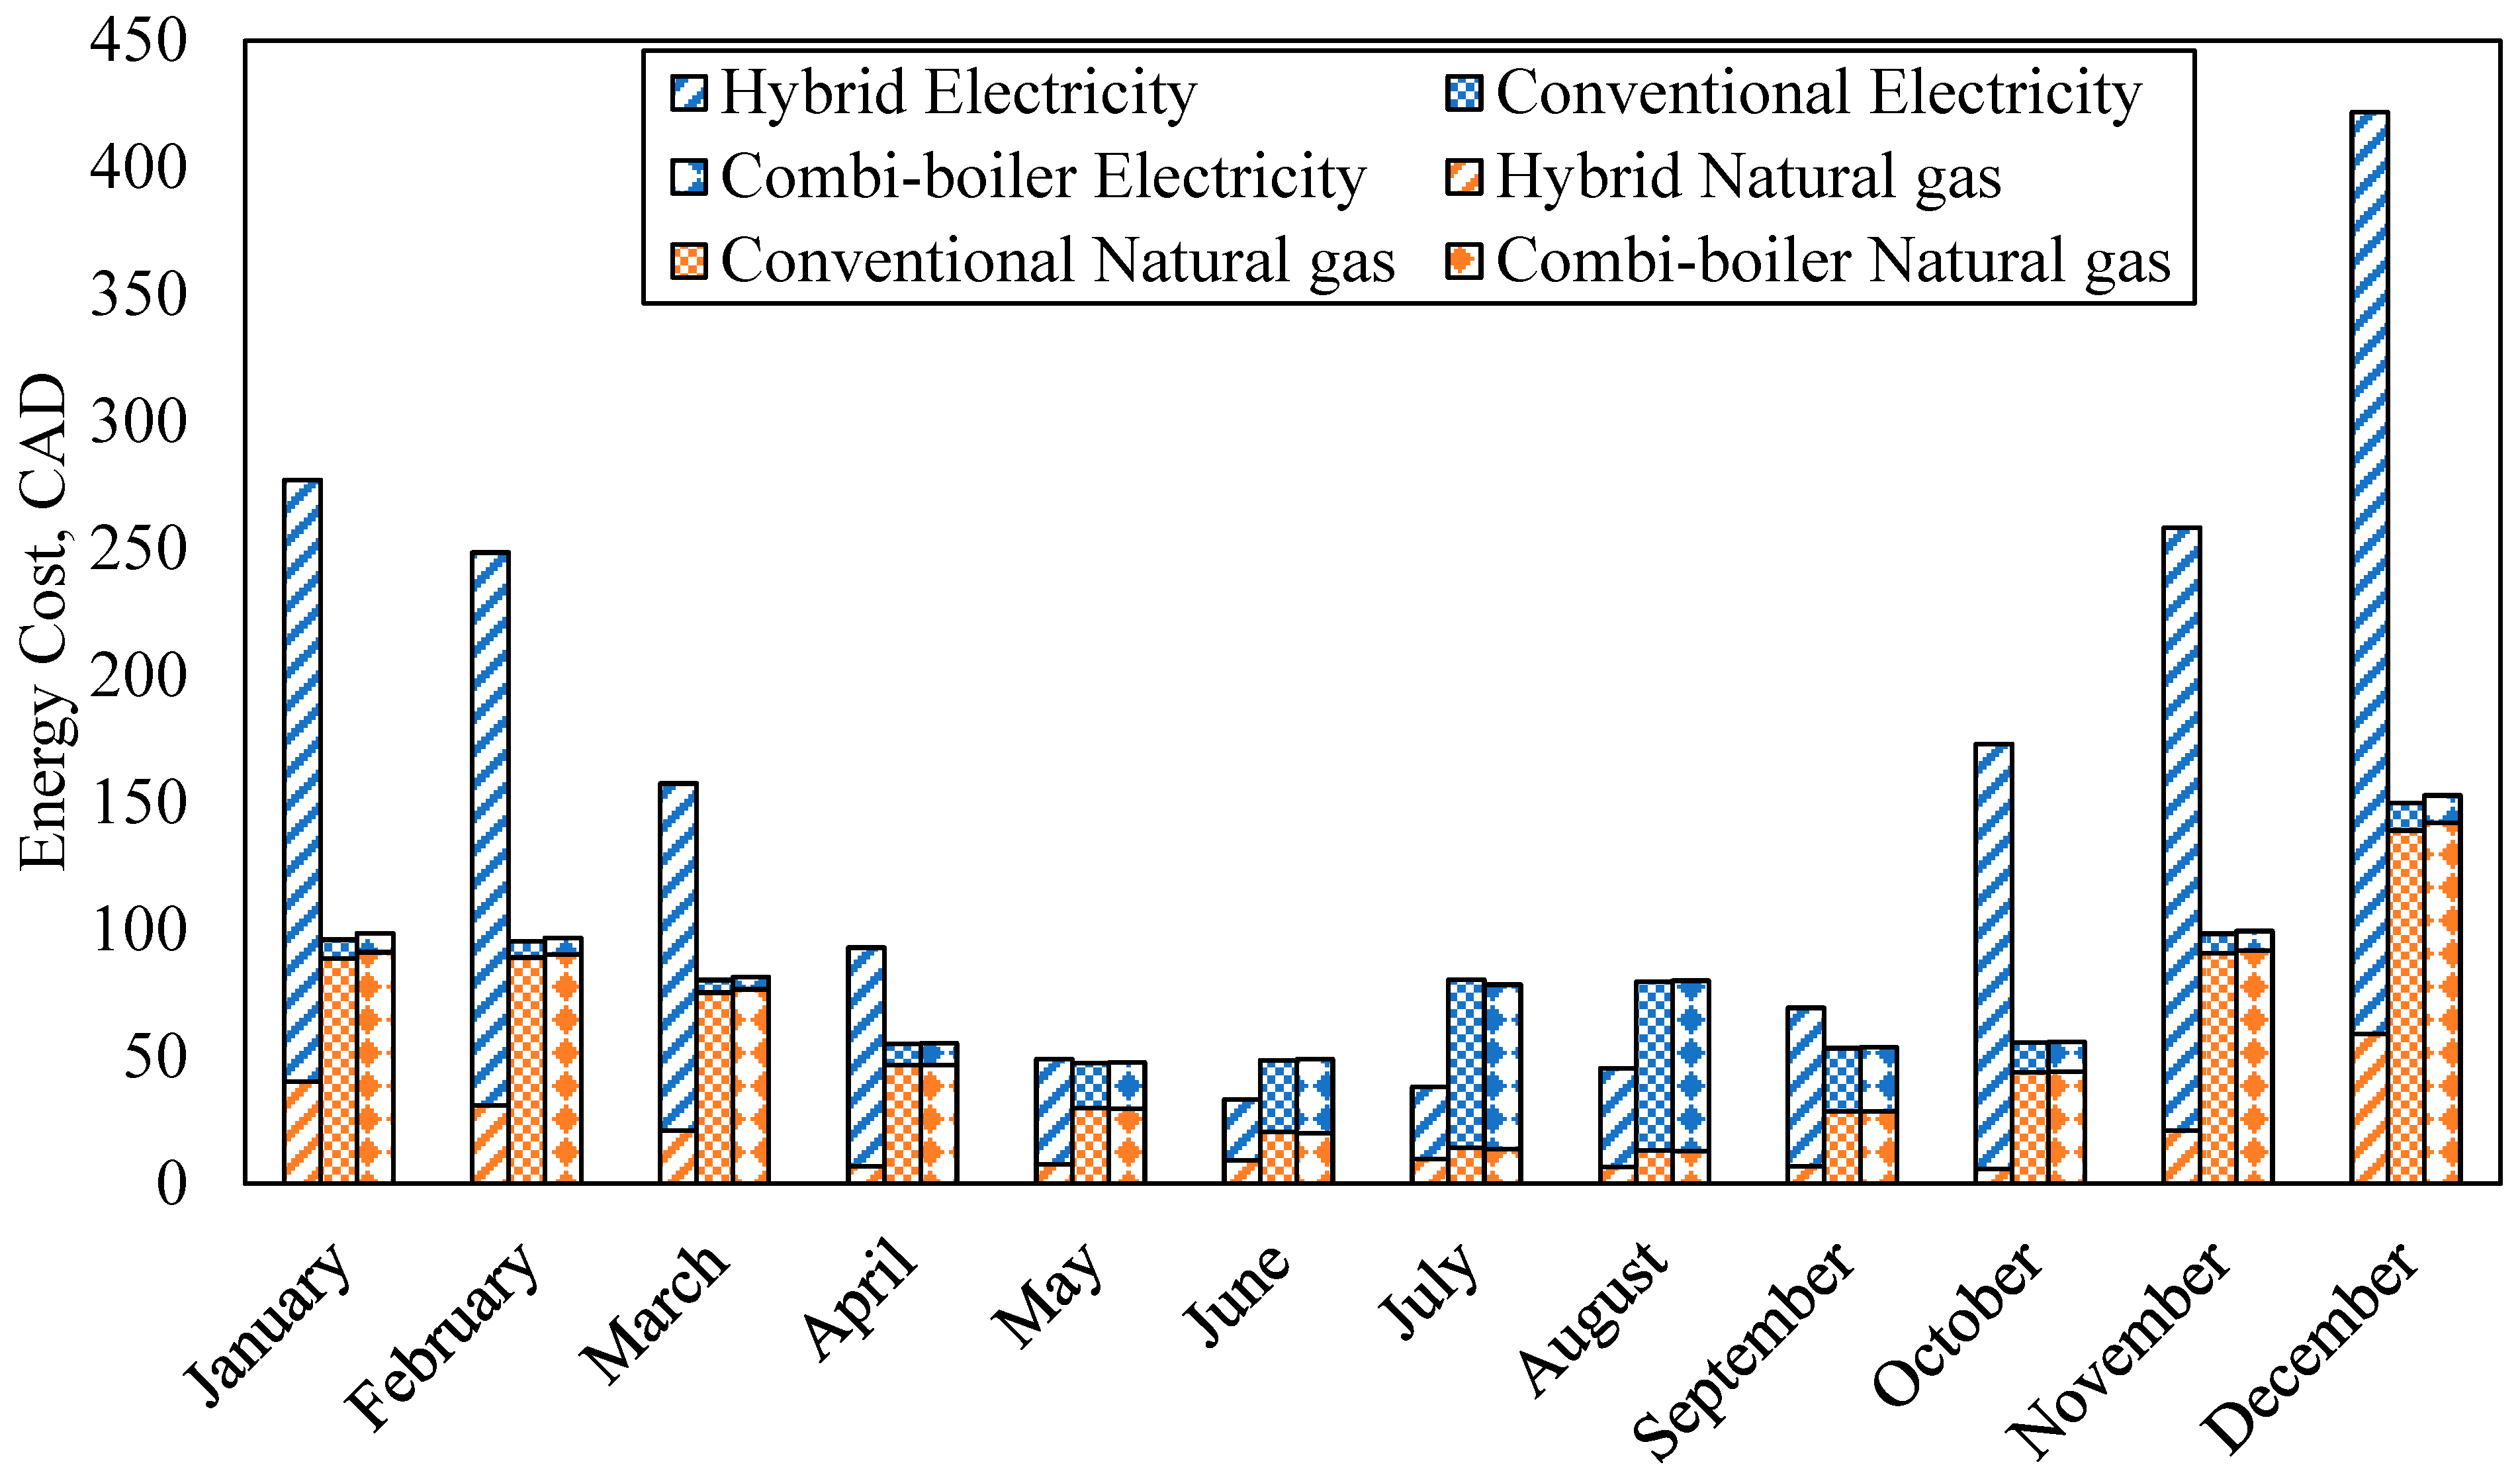
Figure 14 illustrates a comparison of the monthly electricity and natural gas consumption for space heating, space cooling, and DHW, along with their operating costs for the three simulated energy systems. The results indicate that the hybrid energy system exhibits a significant advantage in terms of total energy consumption during the colder months compared to the conventional and combi-boiler systems. However, during the warmer months from June to September, the energy consumption of all three systems becomes comparable. The combi-boiler system has a slightly higher total energy consumption than the conventional system. In terms of energy costs, the simulated hybrid energy system incurs relatively higher energy costs as per the HOT2000 simulation and only demonstrates benefits during the hottest months of June, July, and August, due to lower energy usage and relatively lower electricity prices. The total energy consumption and cost of the three different types of systems over one year are presented in Table 11.
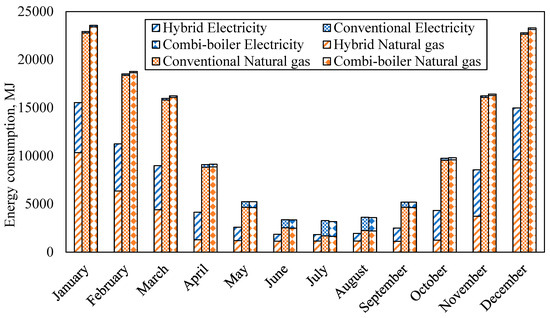
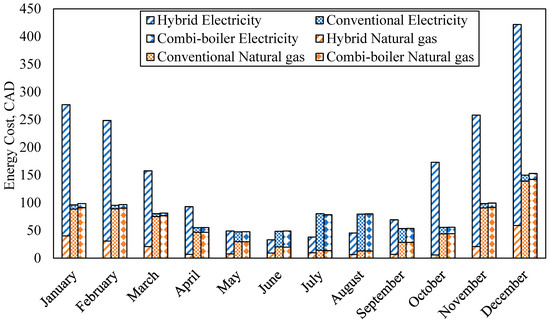
Figure 14.
Energy consumption (top) and cost (bottom) comparison of different systems across various months.

Table 11.
Energy consumption and cost of different types of systems over one year.
The findings show that the hybrid energy system is more energy-efficient compared to the conventional and combi-boiler systems. However, the hybrid system requires a higher initial investment, and its operational costs may not be significantly lower due to the relatively high electricity rates and low natural gas rates in Alberta, Canada. As discussed in Section 2.4.2, the hybrid energy system’s performance was tracked, and it seems that the ASHP’s coefficient of performance (COP) will always be higher than the TWH’s until the temperature outside drops below −25 °C. Therefore, the system can be primarily operated using the ASHP to achieve energy savings when the outdoor temperature is above −25 °C. Conversely, if cost savings are the priority, the system can be operated mainly using the TWH.
Table 12 provides a list of cost parameters for each component of the system that was used in the life cycle cost analysis of this study. The analysis considered a 30-year period based on the period of the residential house mortgage. The initial cost of each component was determined from Table 9 and includes equipment and labor costs. It was assumed that the replacement cost of each component was the same as the initial cost. The operational energy cost for each year was simulated previously by the HOT2000 and includes both electricity and natural gas costs. Since it was impossible to predict the cost of repairs for each component, the maintenance cost includes the yearly averaged repair, inspection, filter cleaning, or boiler flushing costs. It was also assumed that the maintenance of the system components includes the maintenance of ductwork. For ease of calculation, it was assumed that the inflation rate was the same as the interest rate. To determine the life cycle cost, , of each system, the formula applied was the following:
where is the initial cost, is the operational cost, is the maintenance cost, is the replacement cost, and are the residual values. The residual values of components were determined as

Table 12.
Cost parameters for each component of the system.
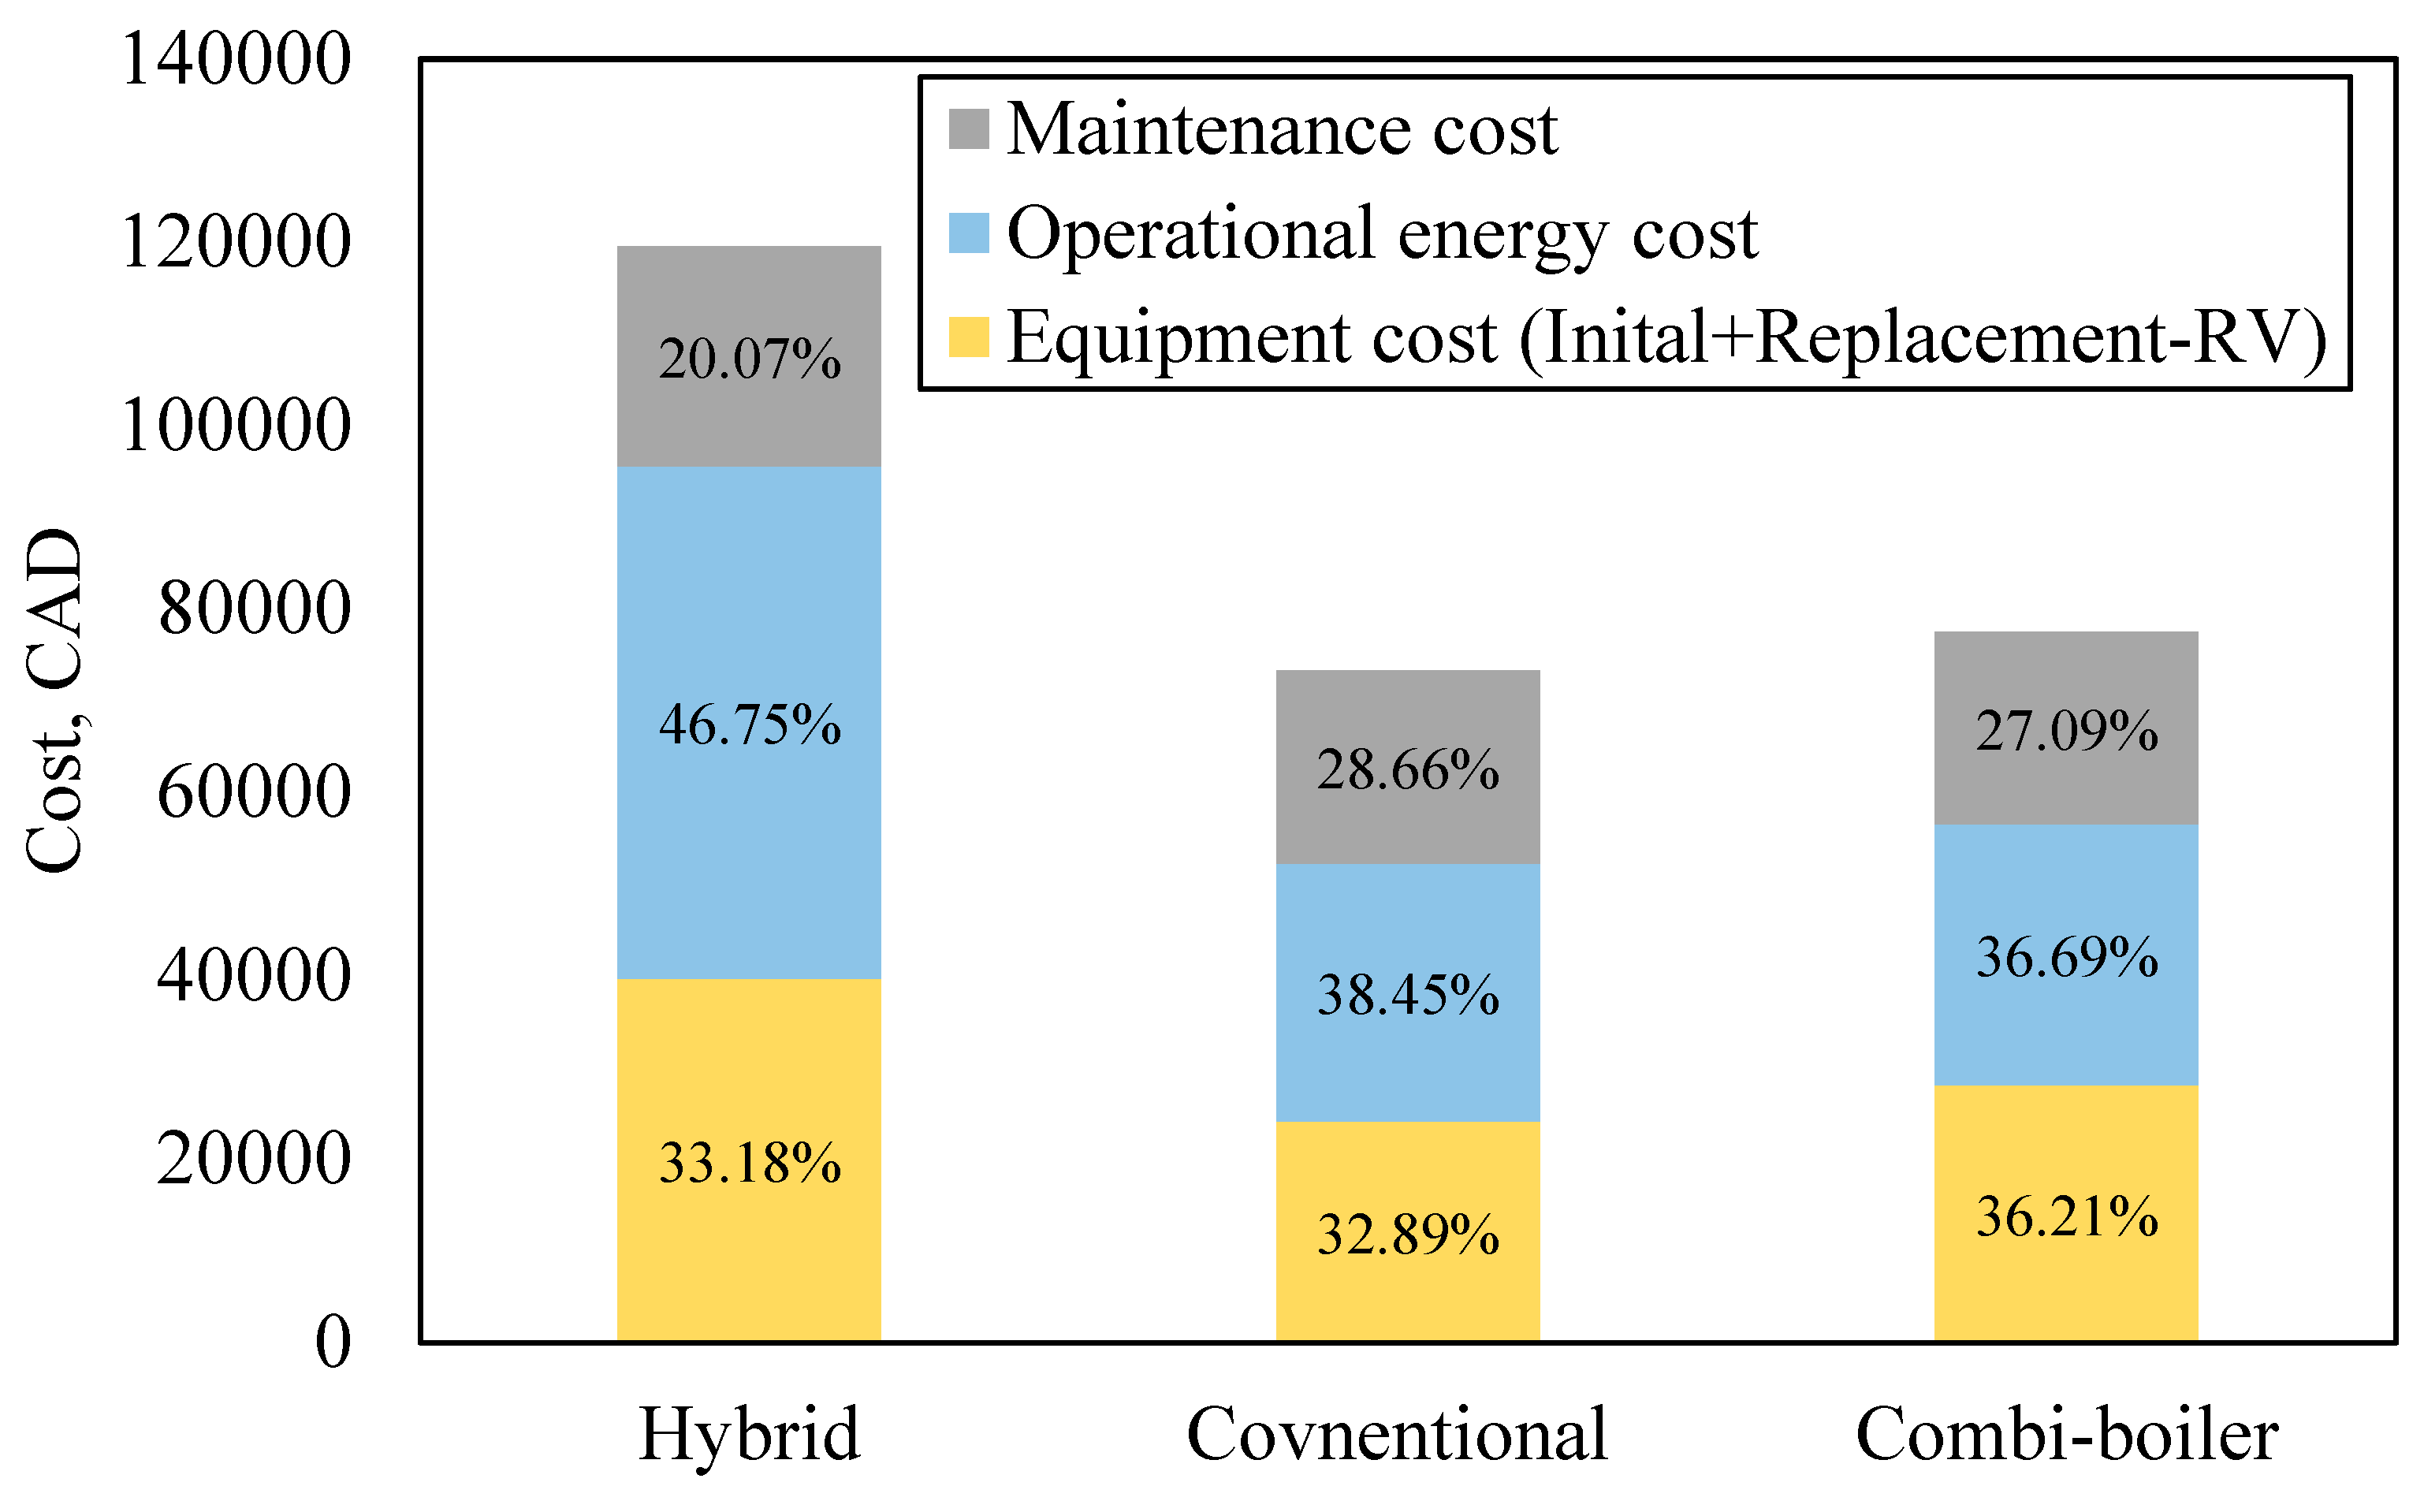
Figure 15 shows the 30-year life cycle costs of the three different energy systems. The total life cycle cost was analyzed in terms of the equipment cost (including initial and replacement costs), operational energy cost (electricity and natural gas), and maintenance cost. The results show that the hybrid system has the highest life cycle cost at 119,583.21 CAD, followed by the conventional system at 73,261.31 CAD and the combi-boiler system at 77,505.11 CAD. Operational energy cost is the highest cost for all three systems, with the highest cost being for the hybrid system due to the relatively expensive electricity rates. The maintenance cost is the lowest portion of the total cost for all three systems, but the hybrid energy system still has a maintenance cost of 20.07% of the total life cycle cost, which is less than the conventional (28.66%) and combi-boiler (27.09%) systems. However, the hybrid energy system’s equipment cost is distinct from the conventional and combi-boiler systems, and the total life cycle cost of the hybrid system is considerably higher than that of the conventional and combi-boiler systems, mainly due to operational energy and equipment cost factors.
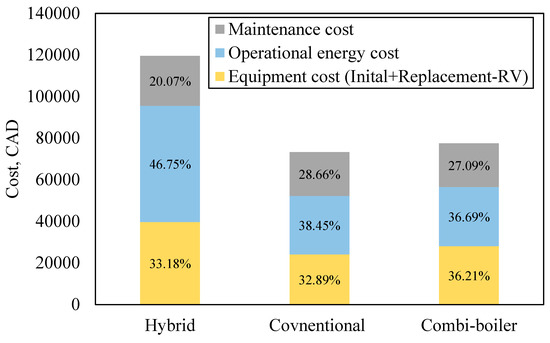
Figure 15.
The 30-year life cycle cost of the three different energy systems.
In the comparative analysis for the three residential building energy systems, three HVAC systems were simulated as the following: a hybrid energy system, a conventional system, and a combi-boiler system. The hybrid system, featuring a TWH and ASHP, exhibited superior energy efficiency. Initial costs ranked the hybrid system as the most expensive, with subsequent systems being the conventional and combi-boiler setups. The monthly consumption and costs illustrate the hybrid system’s energy efficiency advantage during colder months. However, it incurs higher costs during warmer months due to increased electricity prices. This comprehensive review of energy consumption and costs over one year highlights the hybrid system’s efficiency. Nevertheless, operational costs indicate that the hybrid system may not be significantly more economical.
A 30-year life cycle cost analysis portrays the hybrid system with the highest life cycle cost due to operational energy costs and equipment expenses. Operational energy costs, driven by relatively expensive electricity rates, dominate the hybrid system’s expenses.
In conclusion, while the hybrid energy system proves more energy efficiency, its higher initial investment and operational costs, influenced by electricity prices, impact its overall economic feasibility.
4. Control Method
This section proposes an effective control strategy to minimize operational costs. This control strategy manages the hybrid energy system for when to switch between the ASHP and TWH whenever the cost of operating the corresponding component is lower than the other.
4.1. Operational Switching Temperature
A correlation between the space heating load and exterior air temperature, , can be found in Section 2.4.2, Equation (6). And a correlation between the COP of the ASHP and the exterior air temperature, , was also obtained, where details can be found in Section 2.4.1.
The cost of operating the ASHP, , and the cost of operating the TWH, , could then be calculated using Equations (16) and (17), respectively, as the following:
where is the electricity price, is the natural gas price, and is the exterior air temperature in .
Hence, with the known exterior air temperature, to ensure the system operates with lower operational costs, if , then the system operates with the TWH only; otherwise, if , the system operates with the heat pump only.
From the above, when the cost of operating the ASHP and the TWH are about the same, meaning , a relationship between the energy prices and the system performances can be determined as the following:
Since the exterior air temperature and the heating load of the house, , are the same at both sides of Equation (18), and letting the denote the cost ratio between /, the above equation can be simplified to
By using this relationship with the known energy prices, the corresponding exterior air temperature at which the operational cost for the ASHP and TWH are equal can be solved. Similarly, based on the exterior air temperature, the cost ratio between electricity and natural gas prices can be calculated, which results in equivalent operational costs for the ASHP and TWH. This exterior air temperature will be referred to as the “switching temperature” in the next section.
4.2. Economical Control Strategy
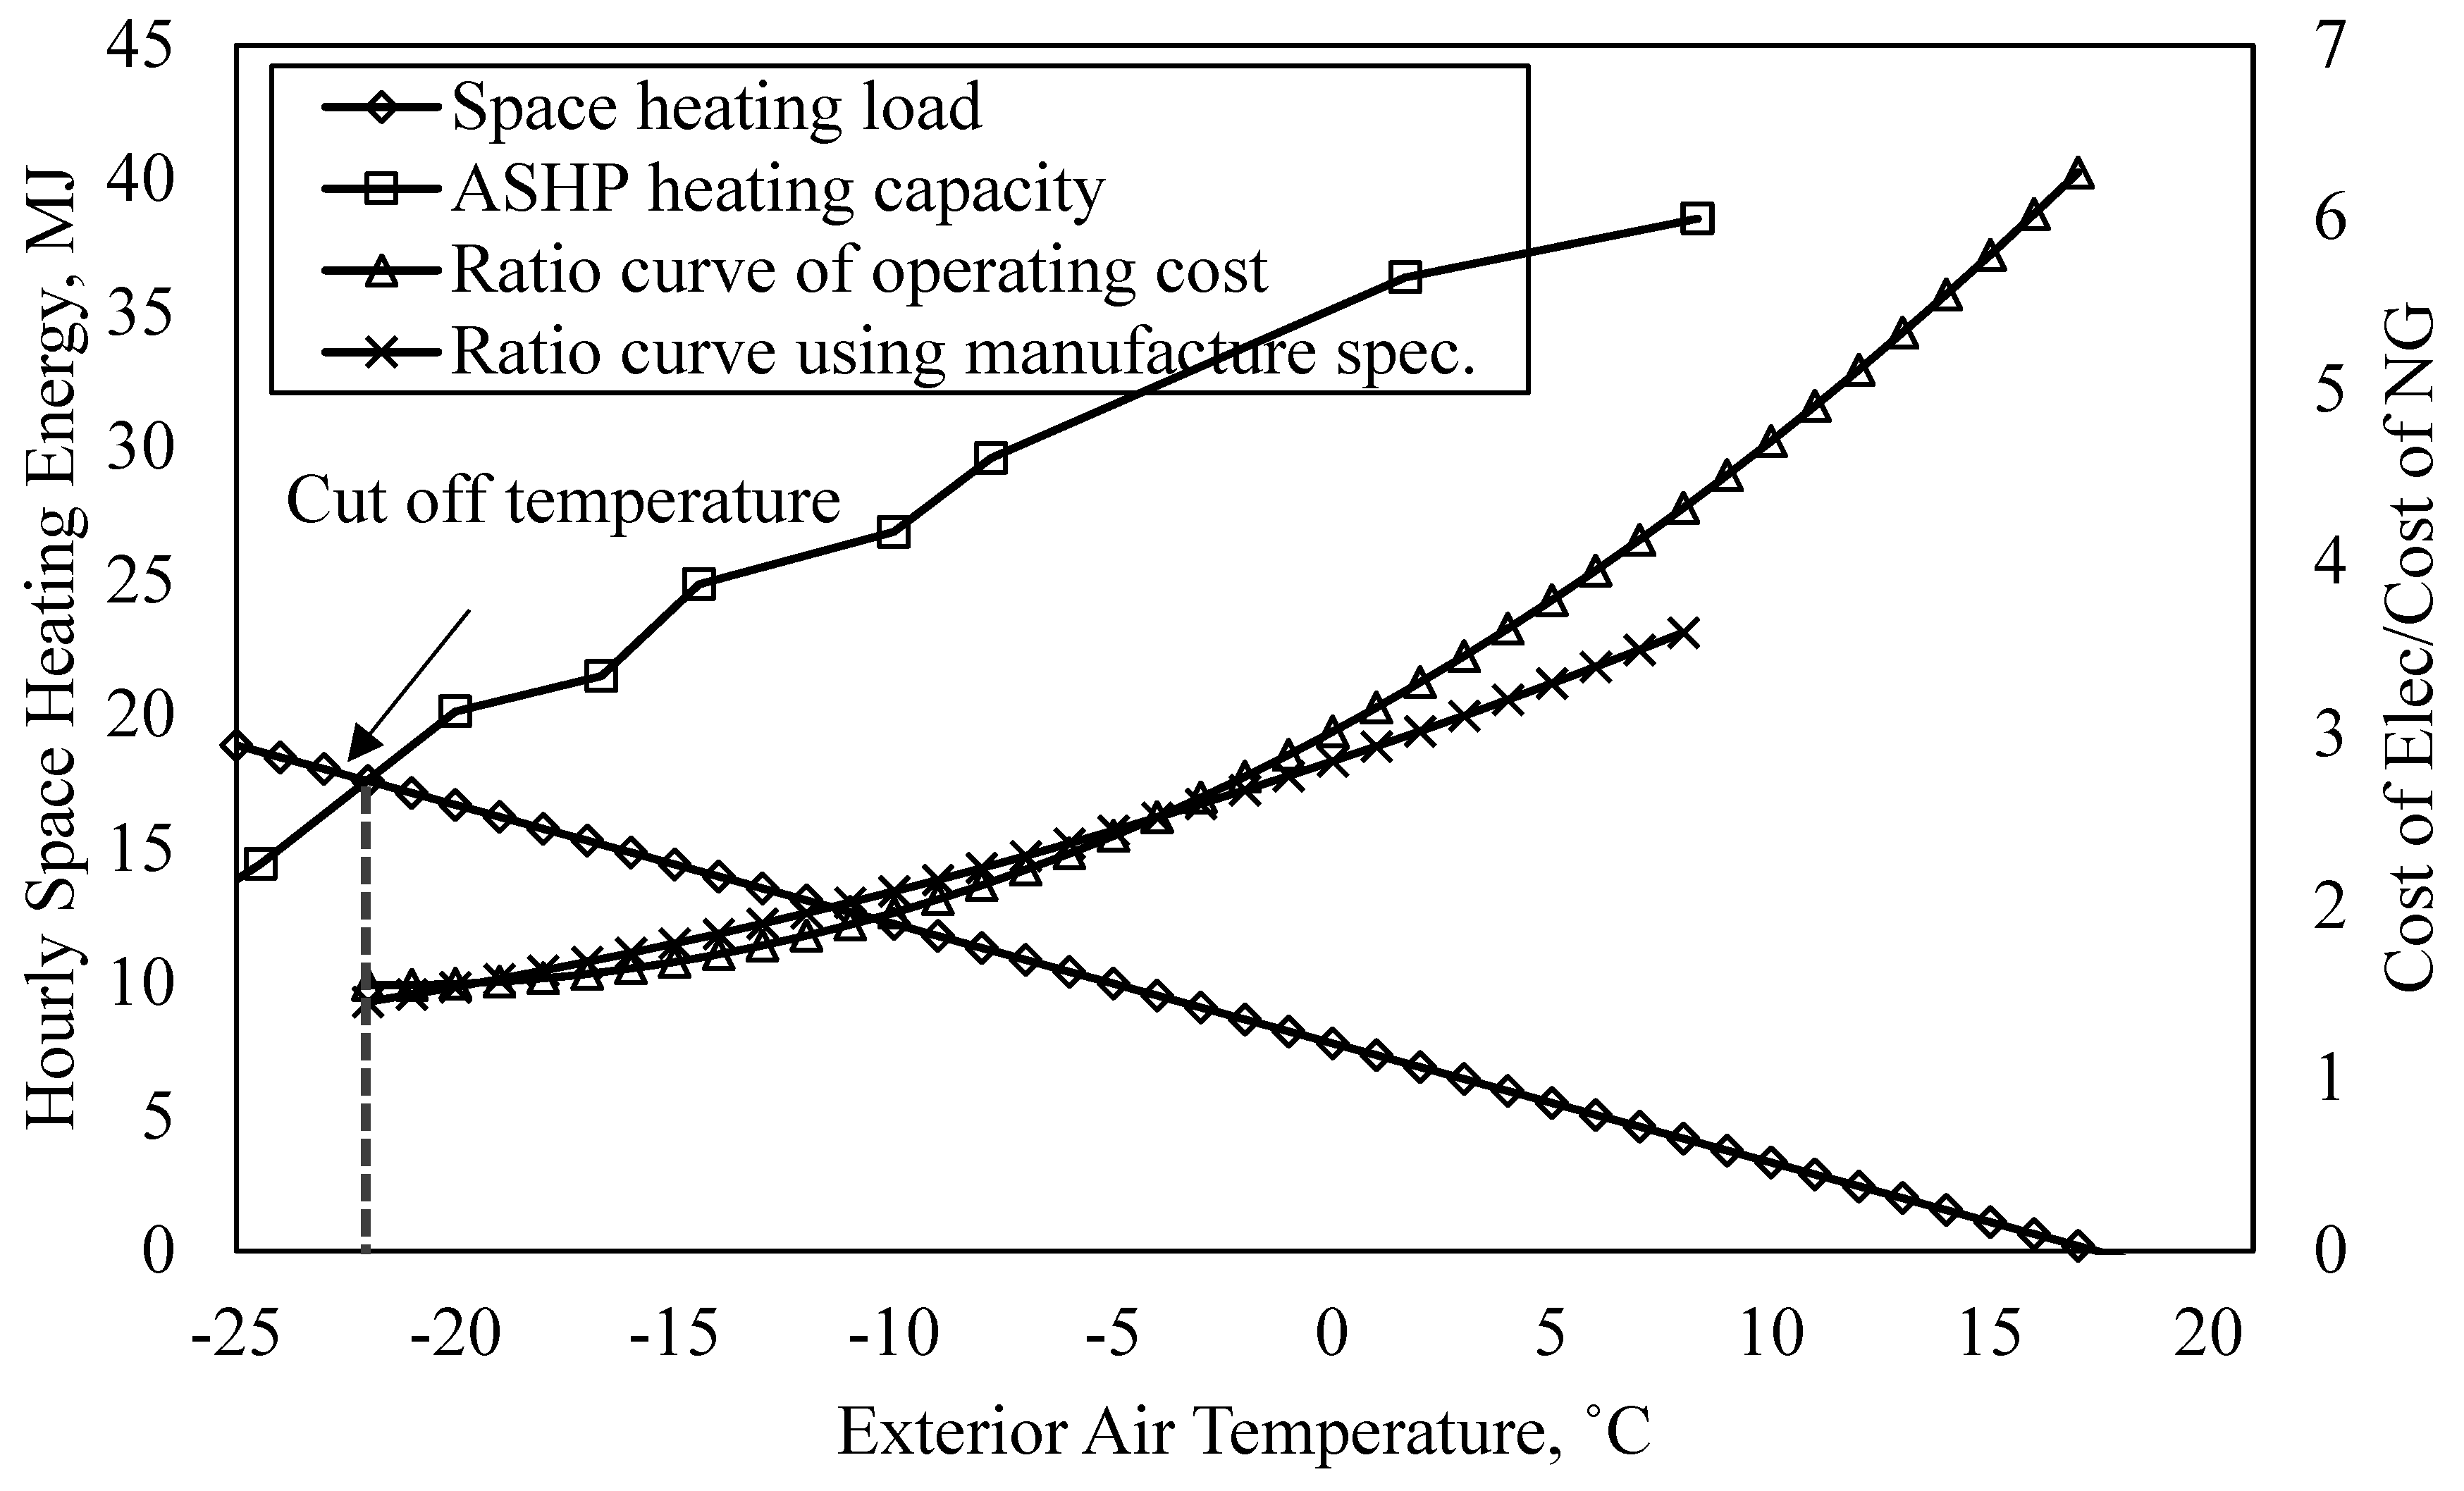
Figure 16 illustrates the switching temperature selection chart of the hybrid energy system. The manufacturer’s specifications provided the heating capacity of the ASHP, while Figure 8 determined the space heating load for the unit under investigation. At the intersection of the space heating load and the heating capacity of the ASHP, the cut-off temperature was determined. When the exterior air temperature falls below this point, the ASHP cannot provide enough heat to the house, and an additional heating source (TWH) is required. In this case, the cut-off temperature was observed at −22 °C.
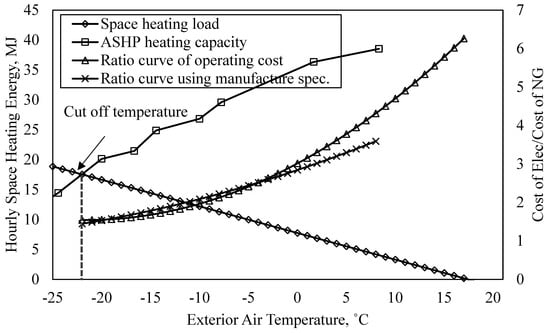
Figure 16.
Switching temperature of the hybrid energy system.
By considering the heating performances of the system and using Equation (19), the relationship between the cost ratio of energy prices, /, and the switching exterior air temperature can be derived as follows, as shown in Figure 13:
The cost ratio curve obtained using the manufacturer’s specifications is also shown in Figure 16. The coefficient of determination, , between these two cost ratio curves is 0.9754 within the exterior air temperature range of −22 °C to 8 °C, indicating a significant similarity between two curves. Therefore, in the absence of comprehensive system monitoring and performance analysis, the switching temperature can be reasonably approximated using the manufacturer’s specifications.
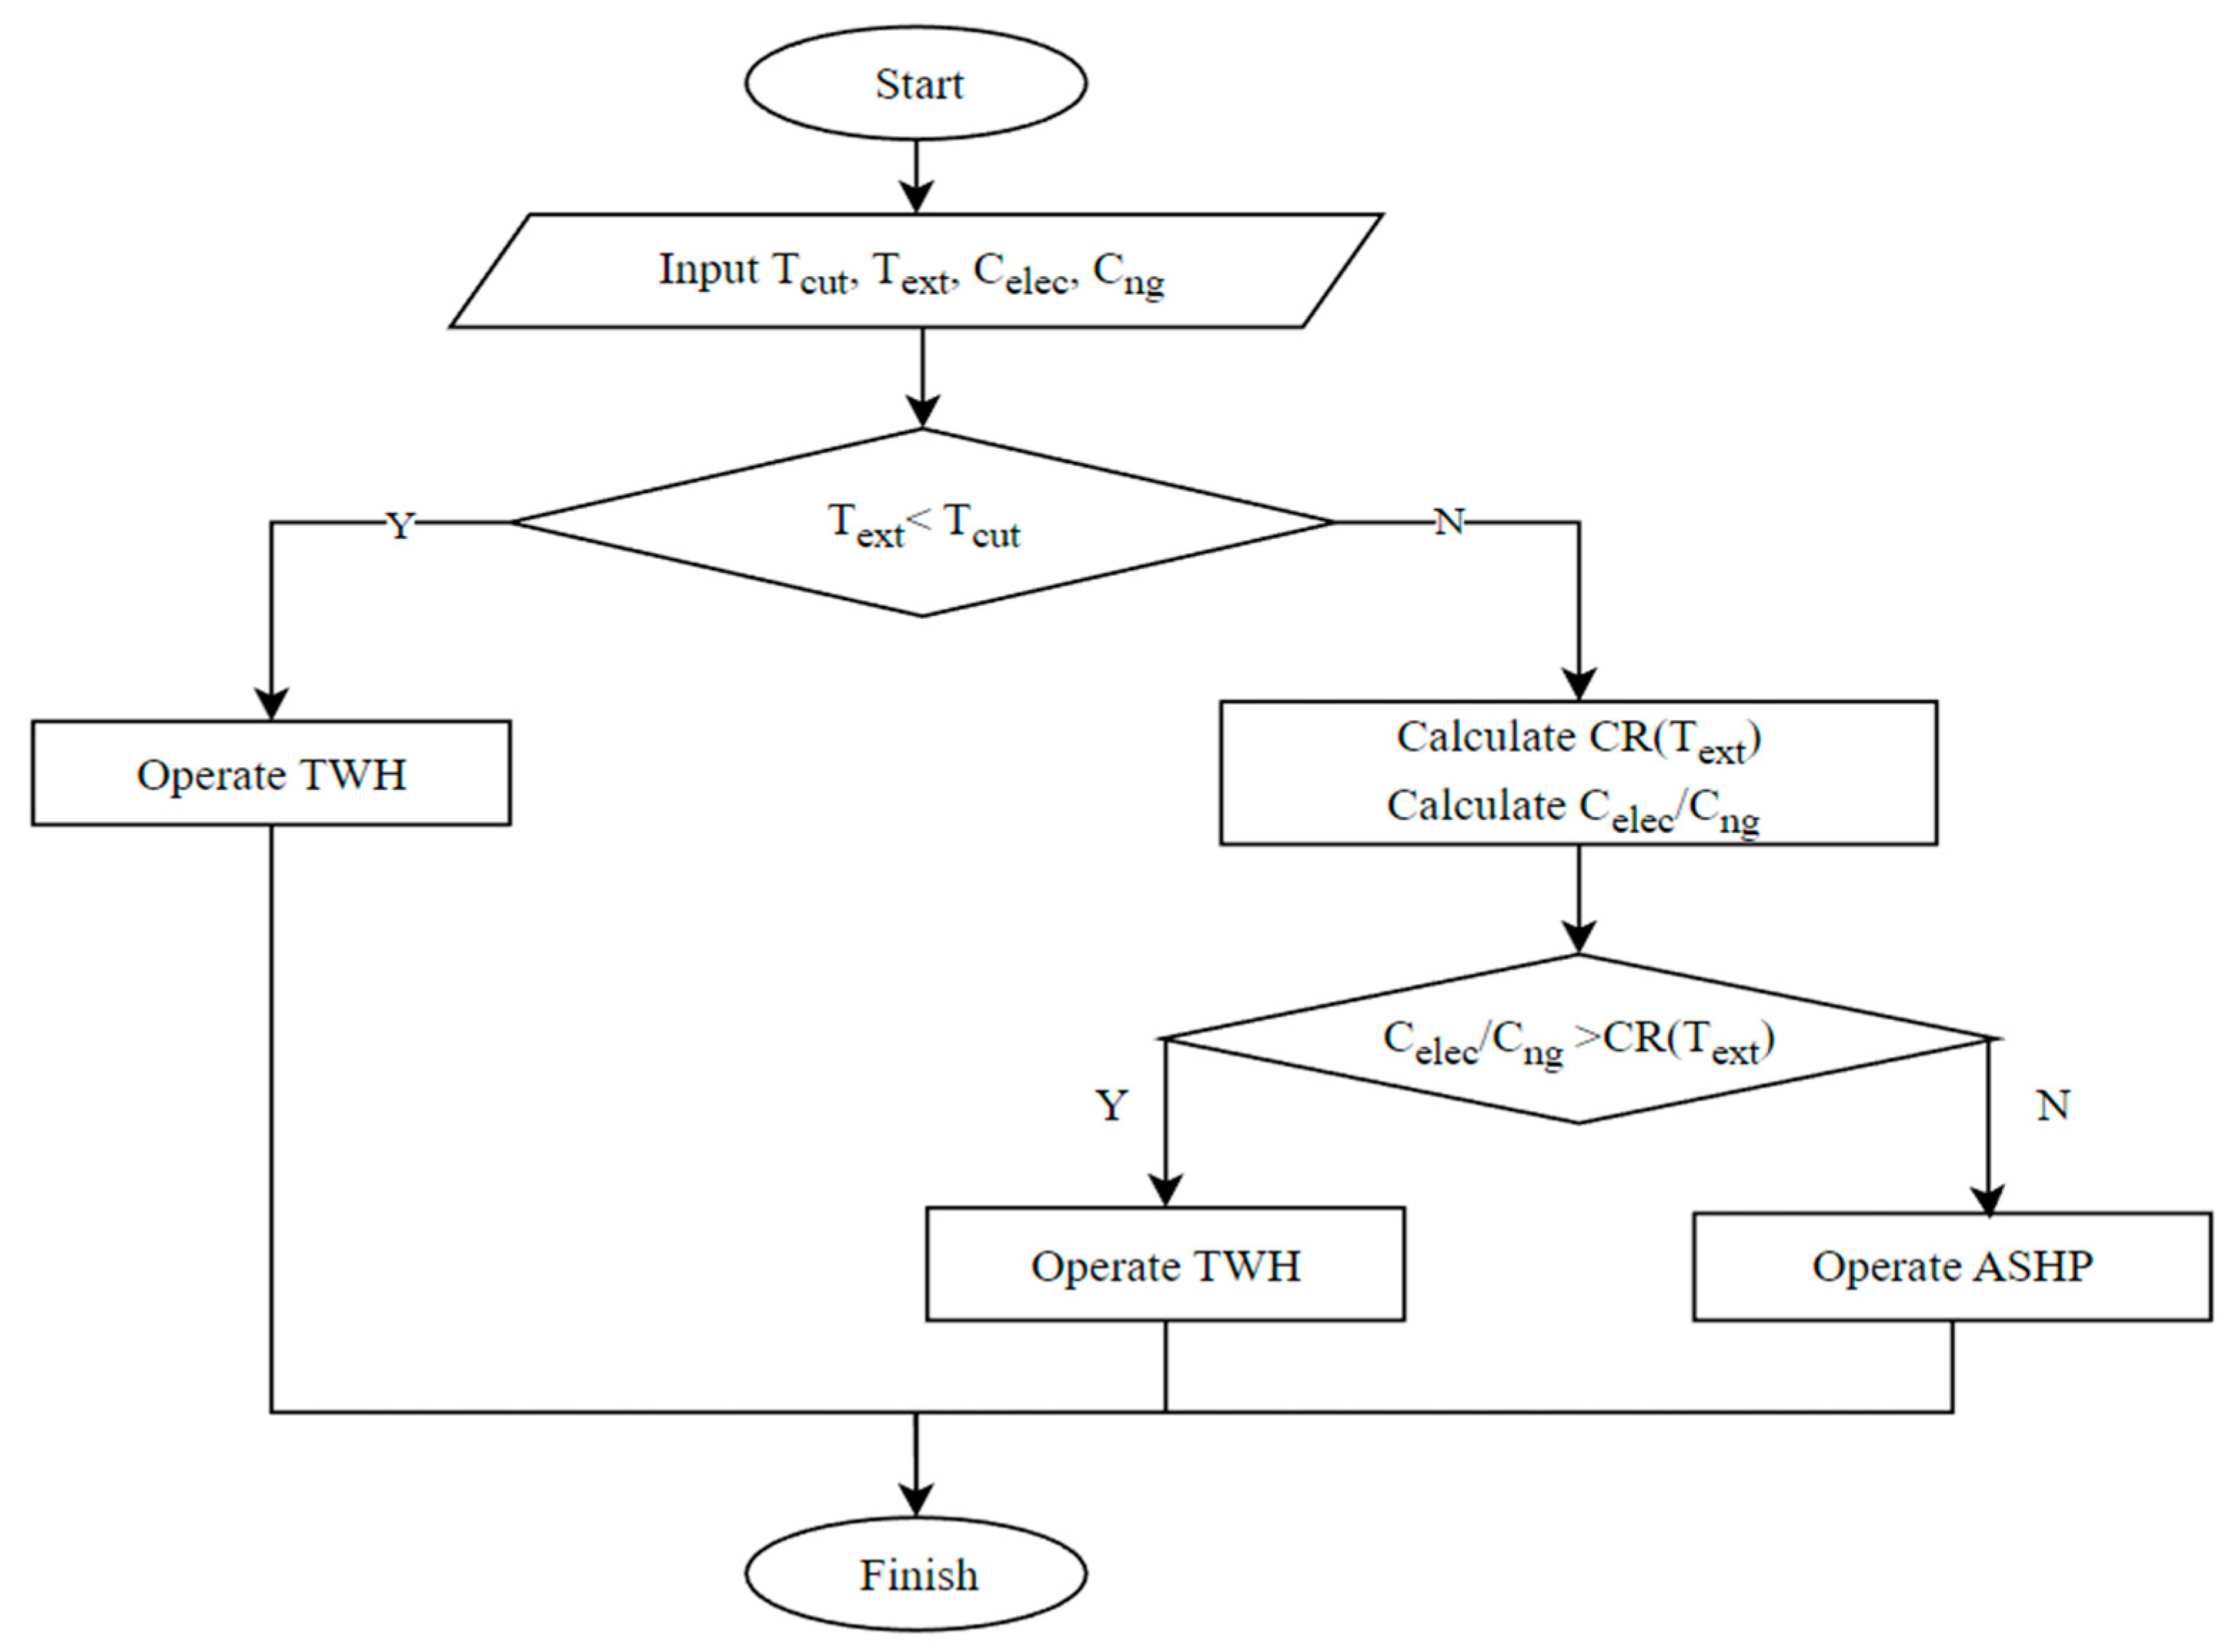
Figure 17 presents the flow chart outlining the proposed economically efficient control strategy of the hybrid heating system. Initially, the cut-off temperature () is identified, and the exterior air temperature (), current electricity, and natural gas prices (, ) are provided. The exterior air temperature should then be compared with the cut-off temperatures using the following condition. If
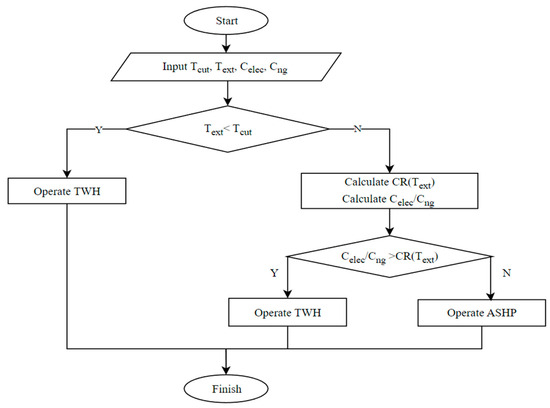
Figure 17.
Flow chart of the economic efficient control strategy.
This condition signifies that the ASHP cannot generate sufficient heat to meet the heating requirements of the house during this period. Consequently, the system should operate using the TWH for space heating.
Otherwise, if the condition is not met, the cost ratio corresponding to the current exterior air temperature should be determined using Equation (20). The calculated represents the desired energy cost ratio that should be achieved if the heating system switches between the ASHP and TWH at the given exterior air temperature, . Then, this desired switching temperature cost ratio should be compared with the current operating cost ratio, /, as the following:
This indicates that the current cost ratio is higher than the switching cost ratio. In other words, electricity prices are considerably higher compared to natural gas prices. As a result, the heating system should operate the TWH for space heating. Otherwise, when the current cost ratio is less than or equal to the switching cost ratio, the system should operate the ASHP for space heating.
The suggested cost-effective control strategy can guarantee that the system operates at the most favorable energy cost. In summary: (1) When the ASHP’s heating capacity is insufficient to meet the space heating load of the house, the system seamlessly switches to the TWH for space heating, ensuring optimal system efficiency. (2) When the ASHP’s heating capacity exceeds the space heating load of the house, the system performs a comparative analysis of the operational costs between the ASHP and TWH. This assessment is based on real-time energy prices and the exterior air temperature. A cost ratio curve, developed in this study, illustrates the relationship between energy prices and the corresponding switching temperature between the ASHP and TWH. If the operational cost of the TWH is more economical, the system operates the TWH for space heating; otherwise, the system opts for the ASHP. This dynamic decision-making process enhances overall energy cost-effectiveness. It is worth noting that the supply air flow rate does exhibit significance when predicting the system’s performance. Therefore, this approach may be more practical for a residential house with a single heating zone and a consistent air flow rate.
5. Conclusions
This study aimed to analyze the in situ performance of a hybrid energy heating system, comprising an ASHP and TWH, installed in a net-zero duplex house located in Alberta, Canada—a region characterized by a cold climate. This included an assessment of the energy consumption, space heating output, and heating performance of the hybrid system. The system exhibited the expected behavior, with lower energy consumption in the summer and higher consumption in the winter. This study introduced a novel approach by comparing in situ performance with simulations from HOT2000 building energy software, utilizing an artificial neural network (ANN) model to estimate actual energy consumption within the simulation environment. Results revealed significant disparities between simulations and in situ performance. Variations in space heating loads and the behavior of the hybrid system were noted, with HOT2000 indicating higher heating loads and increased heat pump usage compared to the in situ-based ANN model. A comparative analysis of three residential building energy systems, considering energy consumption and a 30-year life cycle cost, demonstrated that the hybrid system is more energy-efficient but incurs higher operational costs, resulting in an elevated life cycle cost. To address this, an economic control strategy was proposed based on the electricity and natural gas cost ratio. This strategy aims to optimize energy costs during system operation, ensuring the most favorable economic performance over time. Implementing this economic control strategy is crucial to achieving a balanced compromise between energy efficiency and operational costs in the hybrid energy system.
This study was subjected to several limitations, primarily centered around data availability. The insufficiency of data hindered a comprehensive analysis of the hybrid heating system’s performance and constrained the training data for the ANN model, limiting its representation of the space heating system. Furthermore, the study’s reliance on data from a single unit and the use of a show home introduced constraints on result generalization to diverse housing types. Non-typical occupant behavior in the show home might have influenced results in ways unaccounted for in the data collection scheme. Other sources of data would have also been beneficial for this study, including more data on the indoor set point temperature. While the collected data were of high quality, the complexity of the data collection system created room for sensor errors, and discrepancies in experimental values may have arisen during data cleaning. There were also inaccuracies in the methods used in this study, where both the HOT2000 and ANN models are not perfect, and there was an error introduced when constructing both models that was minimized but could not be entirely eliminated.
To address these limitations in future research, improvements could be made to the monitoring system by employing high-quality sensors to minimize instrument error. Where possible, sensors that can detect multiple sources of data should be used. Streamlining the number of sensors is crucial to minimizing malfunctions and reducing the complexity of the performance monitoring system. Collecting more comprehensive indoor data, including thermostat set point temperatures and occupancy schedules, can provide a richer dataset. Extending the data collection period to cover an entire year and incorporating a more extensive range of houses for analysis would enhance the study’s robustness. Examining various types and styles of homes would facilitate generalizability to a broader spectrum of households. A more detailed exploration of physical properties and indoor settings, such as hot water temperatures, would refine the accuracy of the HOT2000 model. Adjusting input parameters and refining data processing methods could improve the precision of the ANN model. Furthermore, increasing the volume of training and validation data would ensure the quality and reliability of the ANN model. These proposed enhancements collectively contribute to a more nuanced and comprehensive understanding of hybrid heating systems in future research.
Author Contributions
W.Q., conceptualization, methodology, software, validation, formal analysis, data curation, writing, review, and editing; A.J., review and writing; B.Y., review, writing, and editing; Y.C., conceptualization, methodology, validation, review, supervision, project administration, and funding acquisition. All authors have read and agreed to the published version of the manuscript.
Funding
Natural Sciences and Engineering Research Council of Canada (NSERC) Collaborative Research and Development Grants, CRDPJ 530932-18, entitled “Intelligent net-zero energy (ready) modular homes for cold regions”.
Institutional Review Board Statement
Not applicable.
Informed Consent Statement
Not applicable.
Data Availability Statement
The data presented in this study are available upon request from the corresponding author. The data are not publicly available due to privacy requirements.
Acknowledgments
The authors would like to express appreciation to Landmark Homes, who provided the research fields, resources, and financial support for this work; without their sponsorship, this project would not be possible.
Conflicts of Interest
The authors declare no conflicts of interest.
Appendix A. Floor Plans of the Studied House
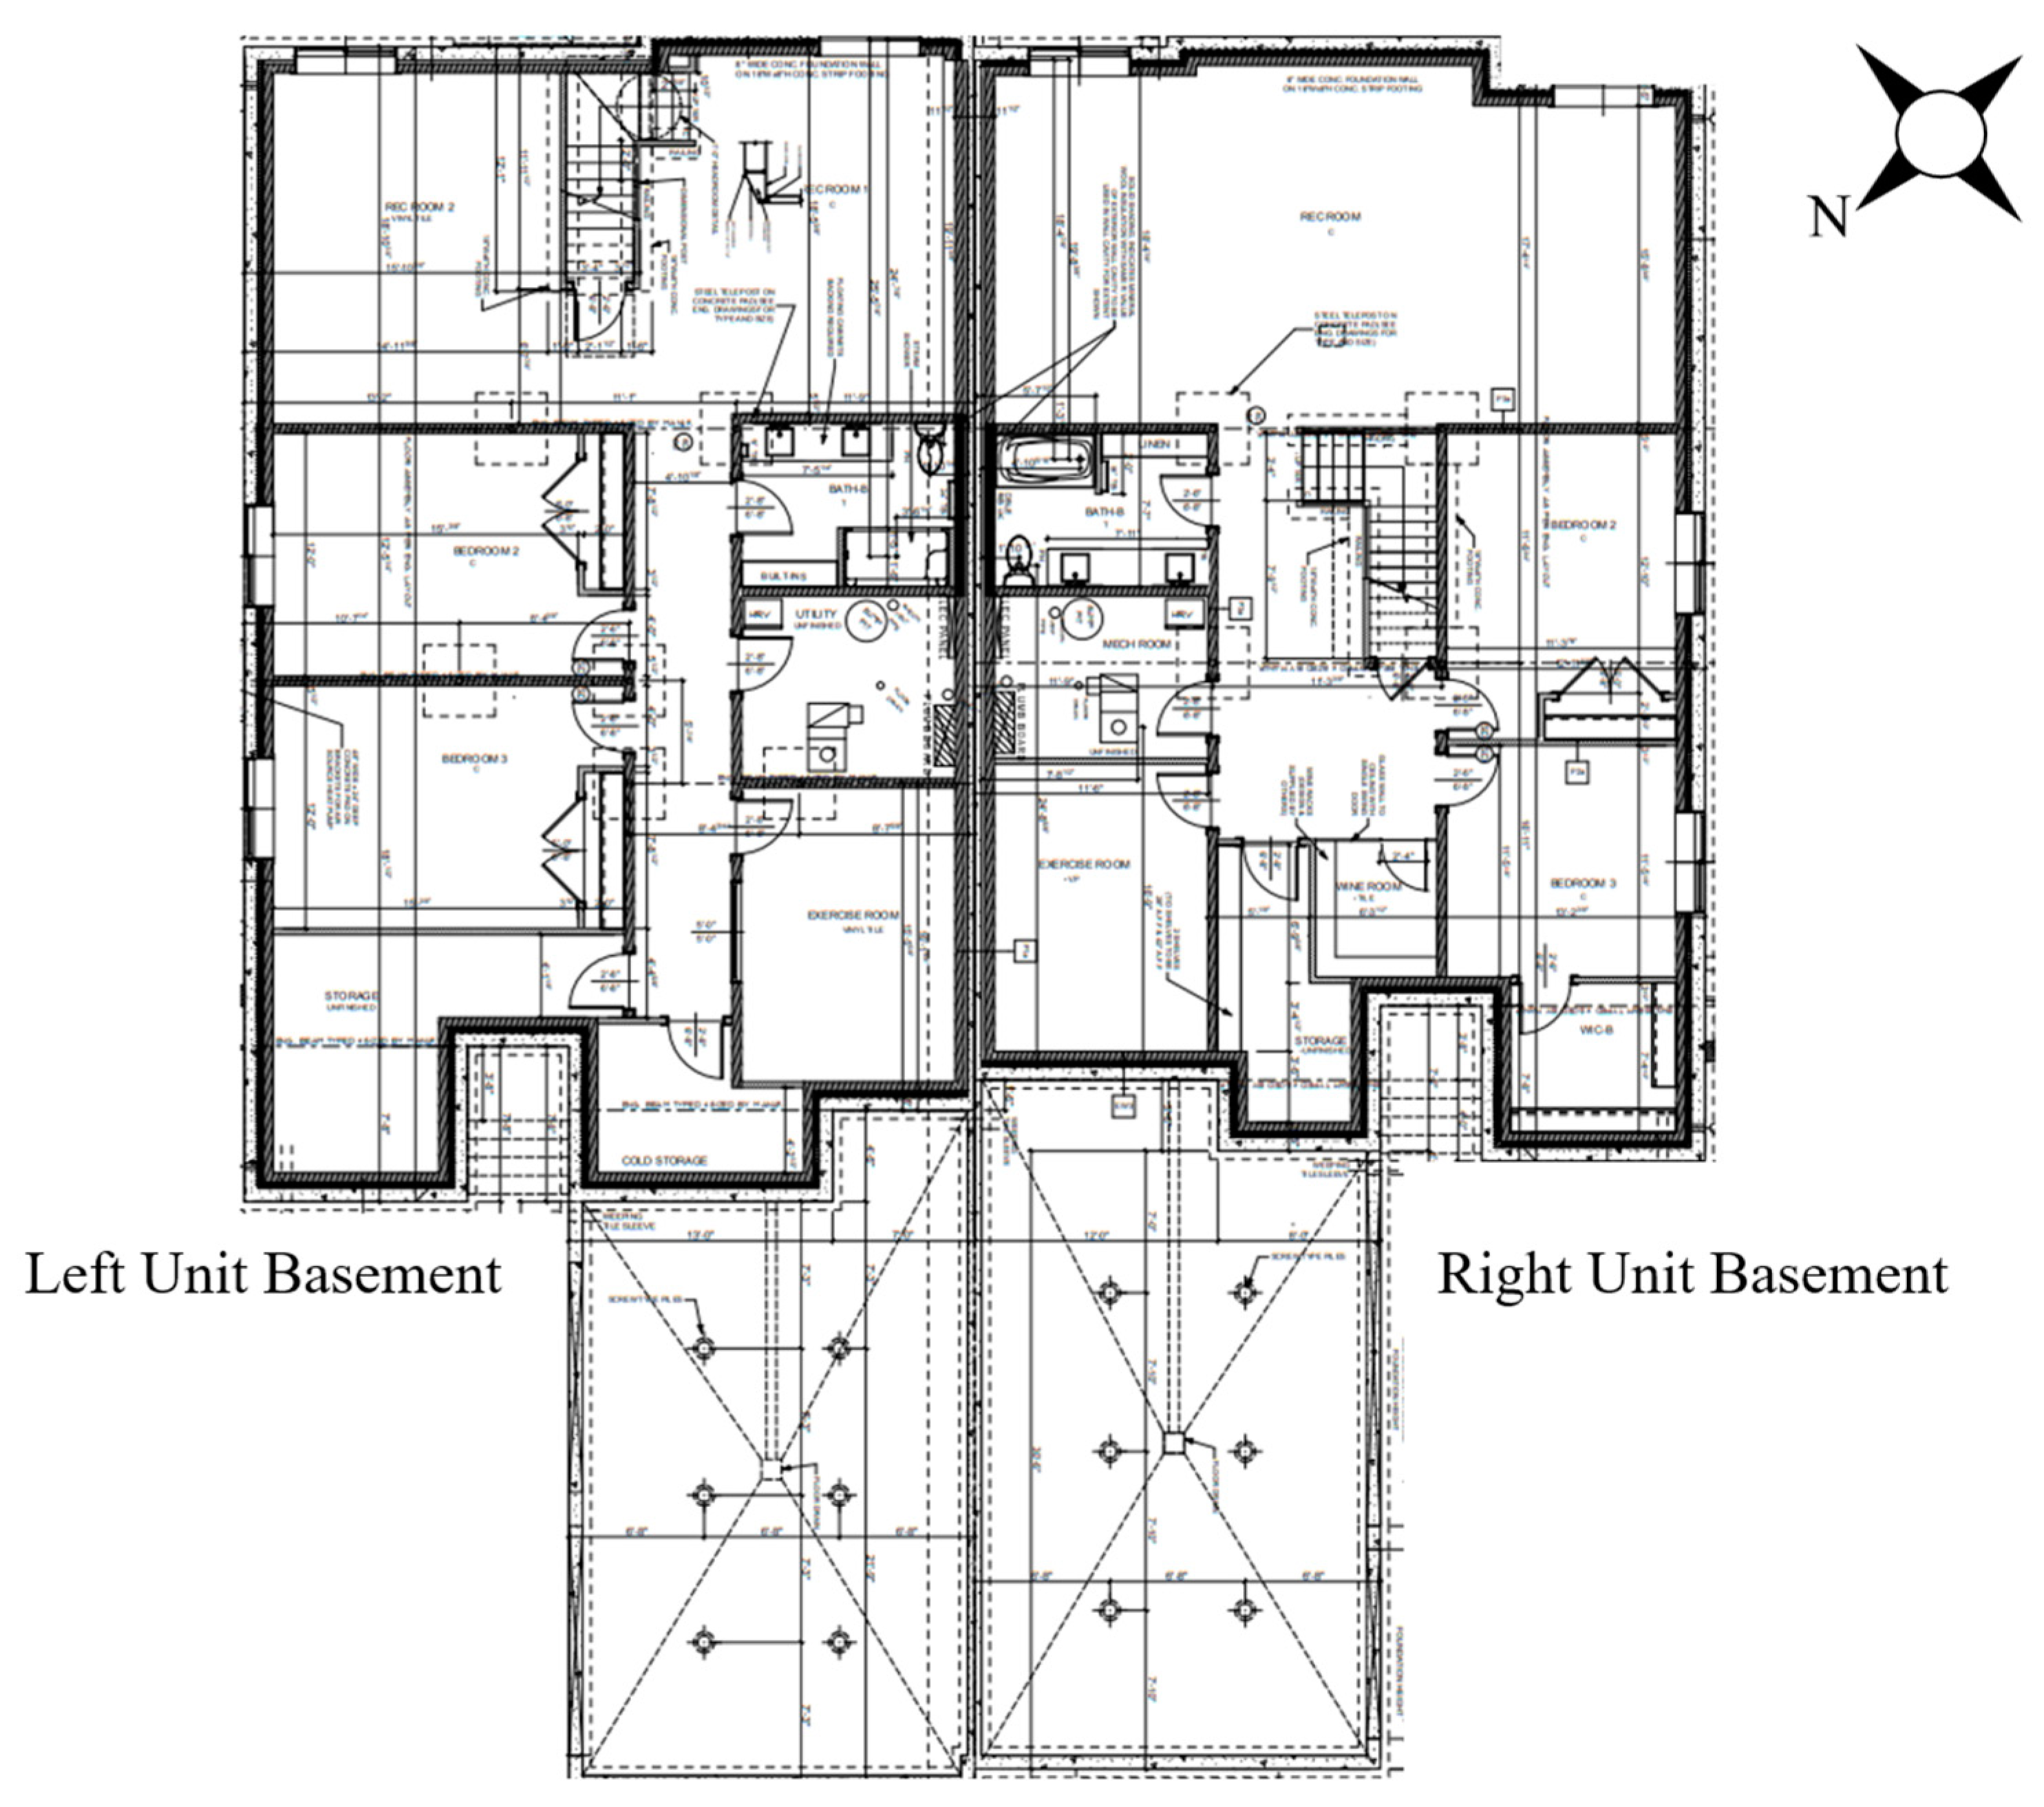
This appendix section shows the construction drawing of the studied duplex house. In this paper, only the right unit was considered. The floor plan of the main floor can be found in Figure A1 and the floor plan of the basement can be found in Figure A2. The house faces northwest and has a double car garage attached in the front for each unit, while the basement is a daylight basement, fully underground, with window wells. Each unit contains three bedrooms, one den, two living rooms, one kitchen, and three bathrooms.
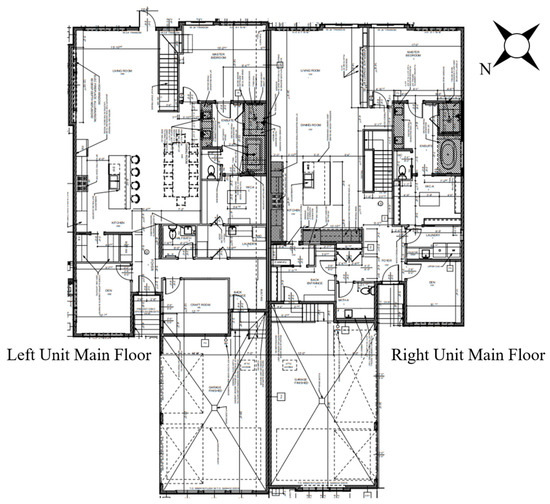
Figure A1.
Floor plan of the studied house (main floor).
Figure A1.
Floor plan of the studied house (main floor).
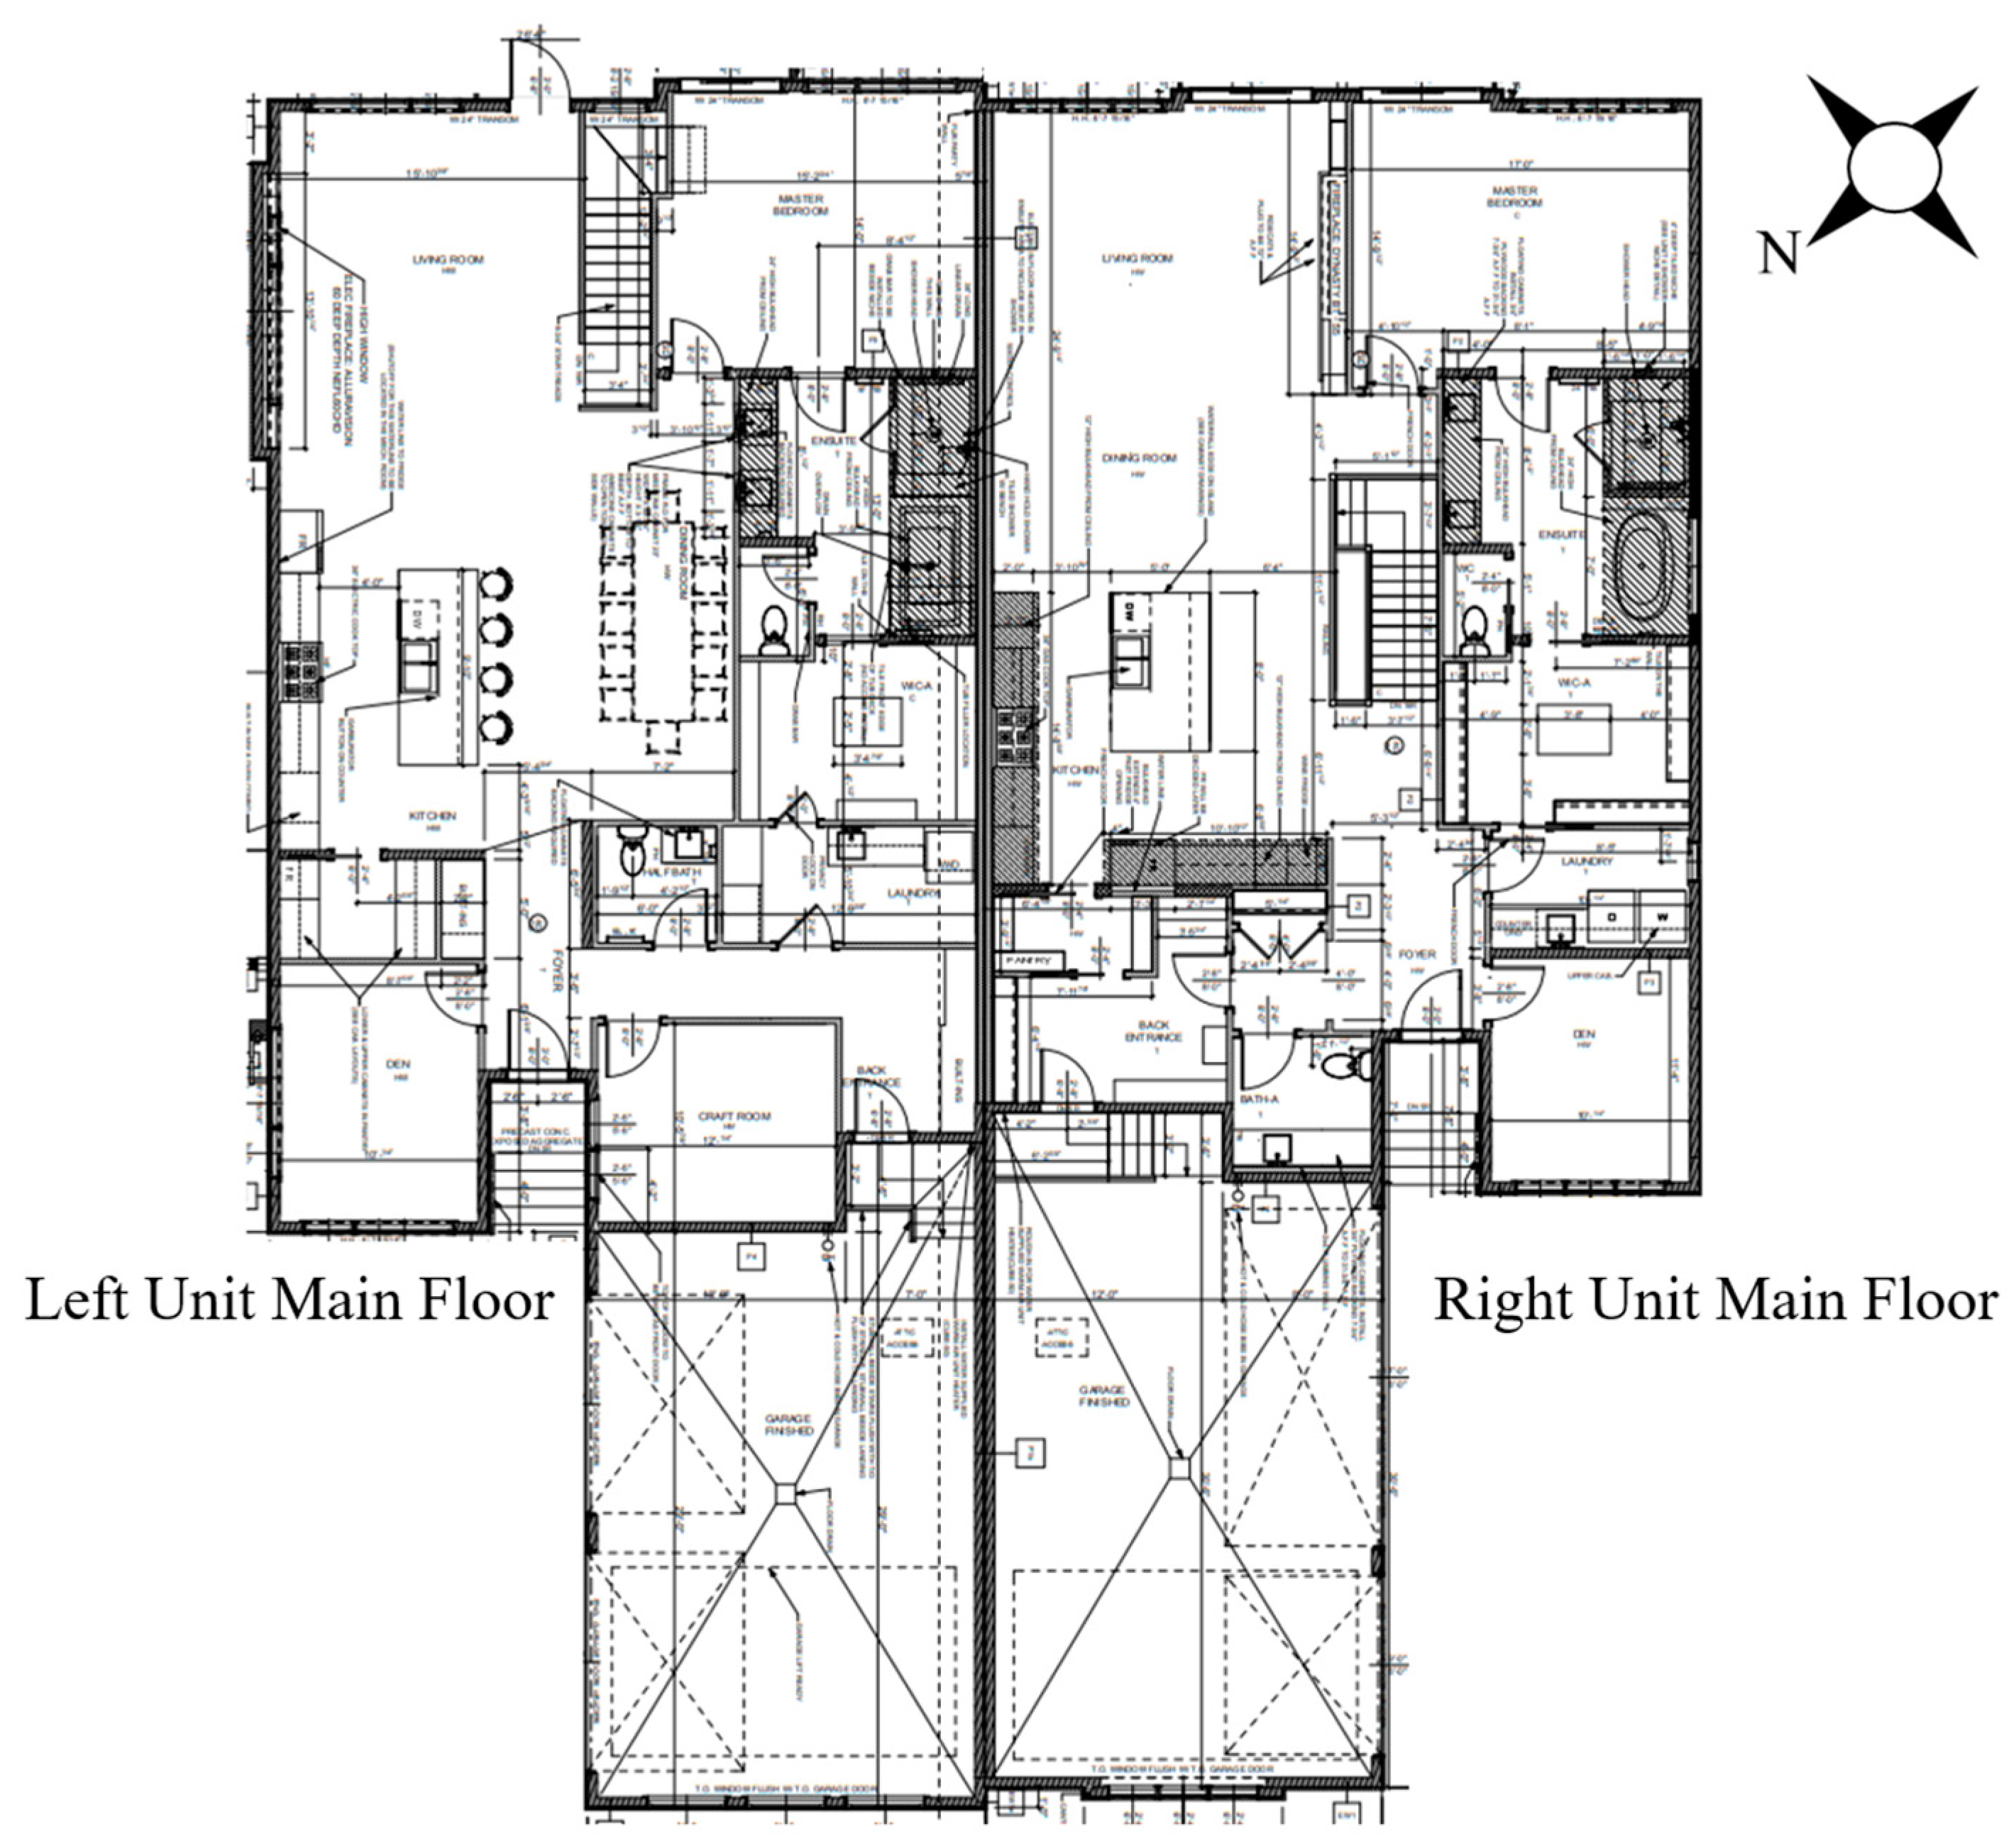
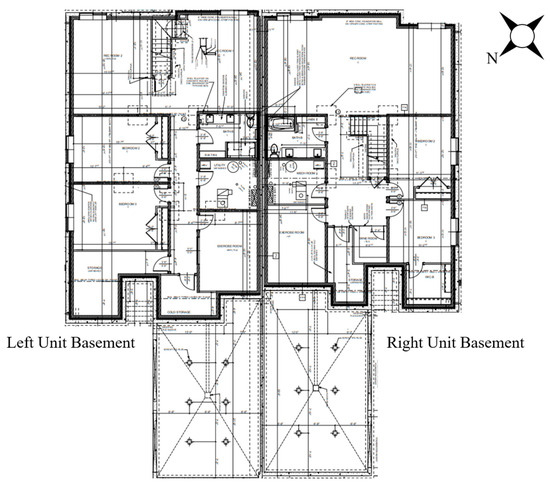
Figure A2.
Floor plan of the studied house (basement).
Figure A2.
Floor plan of the studied house (basement).
Appendix B

Table A1.
Information on the monitoring devices.
Table A1.
Information on the monitoring devices.
| Device | Purpose | Number of Devices | Measurement Resolution |
|---|---|---|---|
| Current transformer | Electricity consumption | 3 | 1 A |
| Gas meter | Natural gas consumption | 1 | 1 CF |
| Humidity and temperature sensor | Air humidity and temperature | 1 | 1%, 1 F |
| Thermocouple | Air temperature | 3 | 1 F/1 °C |
| Airflow sensor | Return air flow rate | 1 | 0.01 FPM |
| BTU meter | Energy consumption | 1 | 0.1 kW |
| sPod | Integration of Modbus sensors with the gateway | 1 | N/A |
| Gateway | Collection, storage, and uploading of data | 1 | N/A |
References
- Natural Resources Canada. Energy Efficiency Trends in Canada; Natural Resources Canada: Gatineau, QC, Canada, 2018. Available online: https://oee.nrcan.gc.ca/publications/statistics/trends/2018/residential.cfm (accessed on 5 November 2023).
- Natural Resources Canada. Energy Use in the Residential Sector; Natural Resources Canada: Gatineau, QC, Canada, 2017.
- Park, H.; Nam, K.H.; Jang, G.H.; Kim, M.S. Performance investigation of heat pump–gas fired water heater hybrid system and its economic feasibility study. Energy Build. 2014, 80, 480–489. [Google Scholar] [CrossRef]
- Klein, K.; Huchtemann, K.; Müller, D. Numerical study on hybrid heat pump systems in existing buildings. Energy Build. 2014, 69, 193–201. [Google Scholar] [CrossRef]
- Wang, J.; Liu, J.; Li, C.; Zhou, Y.; Wu, J. Optimal scheduling of gas and electricity consumption in a smart home with a hybrid gas boiler and electric heating system. Energy 2020, 204, 117951. [Google Scholar] [CrossRef]
- Saffari, M.; Keogh, D.; De Rosa, M.; Finn, D.P. Technical and economic assessment of a hybrid heat pump system as an energy retrofit measure in a residential building. Energy Build. 2023, 295, 113256. [Google Scholar] [CrossRef]
- Li, F.; Zheng, G.; Tian, Z. Optimal operation strategy of the hybrid heating system composed of centrifugal heat pumps and gas boilers. Energy Build. 2013, 58, 27–36. [Google Scholar] [CrossRef]
- Sun, M.; Djapic, P.; Aunedi, M.; Pudjianto, D.; Strbac, G. Benefits of smart control of hybrid heat pumps: An analysis of field trial data. Appl. Energy 2019, 247, 525–536. [Google Scholar] [CrossRef]
- U.S. Energy Information Agency. 2020 Residential Energy Consumption Survey—CE4.1. 2023. Available online: https://www.eia.gov/consumption/residential/data/2020 (accessed on 6 June 2023).
- Padovani, F.; Sommerfeldt, N.; Longobardi, F.; Pearce, J.M. Decarbonizing rural residential buildings in cold climates: A techno-economic analysis of heating electrification. Energy Build. 2021, 250, 111284. [Google Scholar] [CrossRef]
- Artur Udovichenko, L.Z. Techno-economic analysis of air-source heat pump (ASHP) technology for single-detached home heating applications in Canada. Sci. Technol. Built Environ. 2020, 26, 1352–1370. [Google Scholar] [CrossRef]
- Demirezen, G.; Ekrami, N.; Fung, A.S. Monitoring and Evaluation of Nearly-Zero Energy House (NZEH) with Hybrid HVAC for Cold Climate-Canada; Institute of Physics Publishing: Bristol, UK, 2019. [Google Scholar]
- Tihana, J.; Ali, H.; Apse, J.; Jekabsons, J.; Ivancovs, D.; Gaujena, B.; Dedov, A. Hybrid Heat Pump Performance Evaluation in Different Operation Modes for Single-Family House. Energies 2023, 16, 7018. [Google Scholar] [CrossRef]
- Li, G.; Du, Y. Performance investigation and economic benefits of new control strategies for heat pump-gas fired water heater hybrid system. Appl. Energy 2018, 232, 101–118. [Google Scholar] [CrossRef]
- Li, G. Parallel loop configuration for hybrid heat pump—Gas fired water heater system with smart control strategy. Appl. Therm. Eng. 2018, 138, 807–818. [Google Scholar] [CrossRef]
- Thomas, W.D.; Duffy, J.J. Energy performance of net-zero and near net-zero energy homes in New England. Energy Build. 2013, 67, 551–558. [Google Scholar] [CrossRef]
- AlFaris, F.; Juaidi, A.; Manzano-Agugliaro, F. Intelligent homes’ technologies to optimize the energy performance for the net zero energy home. Energy Build. 2017, 153, 262–274. [Google Scholar] [CrossRef]
- Li, H.X.; Chen, Y.; Gül, M.; Yu, H.; Al-Hussein, M. Energy performance and the discrepancy of multiple NetZero Energy Homes (NZEHs) in cold regions. J. Clean. Prod. 2018, 172, 106–118. [Google Scholar] [CrossRef]
- Zhao, H.-X.; Magoulès, F. A review on the prediction of building energy consumption. Renew. Sustain. Energy Rev. 2012, 16, 3586–3592. [Google Scholar] [CrossRef]
- Government of Canada. Tools for Industry Professionals. 2021. Available online: https://www.nrcan.gc.ca/energy-efficiency/homes/professional-opportunities/tools-industry-professionals/20596 (accessed on 6 June 2023).
- Amasyali, K.; El-Gohary, N.M. A review of data-driven building energy consumption prediction studies. Renew. Sustain. Energy Rev. 2018, 81, 1192–1205. [Google Scholar] [CrossRef]
- McCulloch, W.S.; Pitts, W. A logical calculus of the ideas immanent in nervous activity. Bull. Math. Biophys. 1943, 5, 115–133. [Google Scholar] [CrossRef]
- Li, Z.; Han, Y.; Xu, P. Methods for benchmarking building energy consumption against its past or intended performance: An overview. Appl. Energy 2014, 124, 325–334. [Google Scholar] [CrossRef]
- Bagnasco, A.; Fresi, F.; Saviozzi, M.; Silvestro, F.; Vinci, A. Electrical consumption forecasting in hospital facilities: An application case. Energy Build. 2015, 103, 261–270. [Google Scholar] [CrossRef]
- Esen, H.; Esen, M.; Ozsolak, O. Modelling and experimental performance analysis of solar-assisted ground source heat pump system. J. Exp. Theor. Artif. Intell. 2015, 29, 1–17. [Google Scholar] [CrossRef]
- González, P.A.; Zamarreño, J.M. Prediction of hourly energy consumption in buildings based on a feedback artificial neural network. Energy Build. 2005, 37, 595–601. [Google Scholar] [CrossRef]
- Hou, Z.; Lian, Z.; Yao, Y.; Yuan, X. Cooling-load prediction by the combination of rough set theory and an artificial neural-network based on data-fusion technique. Appl. Energy 2006, 83, 1033–1046. [Google Scholar] [CrossRef]
- Kwok, S.S.K.; Yuen, R.K.K.; Lee, E.W.M. An intelligent approach to assessing the effect of building occupancy on building cooling load prediction. Build. Environ. 2011, 46, 1681–1690. [Google Scholar] [CrossRef]
- Statistics Canada. Household Energy Consumption, by Type of Dwelling, Canada and Provinces; Statistics Canada: Ottawa, ON, Canada, 2022.
- da Silva, I.N.; Spatti, D.H.; Flauzino, R.A.; Liboni, L.H.B.; Alves, S.F.D.R. Artificial Neural Networks; Springer International Publishing: Cham, Switzerlands, 2017; Volume 39. [Google Scholar]
- Hagan, M.T.; Menhaj, M.B. Training feedforward networks with the Marquardt algorithm. IEEE Trans. Neural Netw. 1994, 5, 989–993. [Google Scholar] [CrossRef]
- Edwards, R.E.; New, J.; Parker, L.E. Predicting future hourly residential electrical consumption: A machine learning case study. Energy Build. 2012, 49, 591–603. [Google Scholar] [CrossRef]
- Yun, K.; Kuck, R.; Mago, P.J.; Cho, H. Building hourly thermal load prediction using an indexed ARX model. Energy Build. 2012, 54, 225–233. [Google Scholar] [CrossRef]
- Natural Resources Canada. HOT2000 Climate Map. 2020. Available online: https://open.canada.ca/data/en/dataset/4672733b-bbb6-4299-a57f-f19ab475ac11 (accessed on 6 June 2023).
- Government of Alberta. Regulated Rates-Year at a Glance. 2023. Available online: https://ucahelps.alberta.ca/regulated-rates.aspx (accessed on 1 February 2023).
Disclaimer/Publisher’s Note: The statements, opinions and data contained in all publications are solely those of the individual author(s) and contributor(s) and not of MDPI and/or the editor(s). MDPI and/or the editor(s) disclaim responsibility for any injury to people or property resulting from any ideas, methods, instructions or products referred to in the content. |
© 2024 by the authors. Licensee MDPI, Basel, Switzerland. This article is an open access article distributed under the terms and conditions of the Creative Commons Attribution (CC BY) license (https://creativecommons.org/licenses/by/4.0/).

