Article

Technical, Economic, and Environmental Investigation of Pumped Hydroelectric Energy Storage Integrated with Photovoltaic Systems in Jordan

Department of Mechanical and Maintenance Engineering, German Jordanian University, Madaba Street, P.O. Box 35247, Amman 11180, Jordan
*
Authors to whom correspondence should be addressed.
Sustainability 2024, 16(4), 1357; https://doi.org/10.3390/su16041357
Submission received: 29 November 2023 / Revised: 29 January 2024 / Accepted: 31 January 2024 / Published: 6 February 2024
(This article belongs to the Section Energy Sustainability)

Abstract

:
In this study, the technical and economic feasibility of employing pumped hydroelectric energy storage (PHES) systems at potential locations in Jordan is investigated. In each location, a 1 MWp off-grid photovoltaic (PV) system was installed near the dam reservoir to drive pumps that transfer water up to an upper reservoir at a certain distance and elevation. PVsyst (Version 7.3.4) is implemented to simulate the water flow rate pumped to the upper reservoir at each location. The water in the upper reservoir is presumed to flow back into the dam reservoir through a turbine during peak hours at night to power a 1 MW load. Based on the water volume in the upper reservoir, the power generated through the turbine was estimated using HOMER Pro® (Version 3.15.3), and the power exported to the grid (when the power generated from the turbine is more than the power required by the driven load) was also determined. It is worth mentioning that scaling up the size of PV and hydropower systems is a straightforward approach considering the modular nature of such systems. However, the quantity of water in the dam reservoir that is allowed to be pumped is the main determinant for the size of a PHES system. The technical and economic results show that the potential of employing these locations to implement PHES systems is great. In addition, a study was conducted to estimate how much CO2 emissions were reduced by generating renewable energy compared to generating the same amount of energy from fossil fuels. These systems increase renewable energy in the energy mix in Jordan, stabilize the grid, and balance the loads, especially during peak periods. More importantly, PHES systems contribute to making the energy sector in Jordan more sustainable.

1. Introduction

1.1. Energy in the World and Jordan

Energy is a necessary component of contemporary life, powering everything from homes and companies to transportation and industry. Throughout the last several decades, the world’s energy consumption has continuously increased as the global population has grown, economies have developed, and people’s quality of living has improved. The major sources of energy in the world are fossil fuels, which include oil, coal, and natural gas. Fossil fuels accounted for around 78.5% of estimated shares of final energy consumption based on statistics from 2020 [1]. In 2022, China consumed the most energy worldwide (159.39 EJ), followed by the United States (95.91 EJ) and India (36.44 EJ) [2]. Reducing energy-related carbon dioxide emissions is a top concern for many countries because they are a major cause of global warming. For example, the EU has established a goal to be climate-neutral before 2050, while China has committed to achieving the uttermost carbon emission reduction before 2030 and becoming carbon-neutral before 2060 [3].
Jordan is a country that relies heavily on imported energy to meet its needs. The country has limited domestic sources of energy, with only small reserves of oil shale and renewable energy resources. Jordan’s energy demands have been rising at a rate of 5% every year, and oil and natural gas accounted for about 94% of the country’s primary energy consumption in 2020 [4]. Electricity production in Jordan is largely based on imported oil and natural gas. After the disruption of the Egyptian gas supply, Jordan has faced significant economic strain. Therefore, reassessing policies towards more secure energy has become one of the main political issues in Jordan. In order to make sure that the transition to sustainable energy is reliable, affordable, and realistic, there is a need to focus on its diversification and import reduction, as well as increased dependence on renewable energy sources [5,6,7,8,9,10,11,12]. Jordan started looking for options and working on investment in oil shale, which positions Jordan fifth in the world in oil shale reserves. In addition to investing in oil shale, a transition toward renewable energy sources such as solar, wind, and others has started. Moreover, Jordan is exploring the potential of nuclear energy to help meet its energy needs. The country has signed agreements with several countries to explore the possibility of building a nuclear power plant [13].
Overall, the high cost of imported energy is a major challenge for Jordan, and the government has implemented several measures to improve energy efficiency and decrease energy consumption. These measures include the promotion of energy-efficient building designs and appliances, as well as the implementation of energy pricing reforms to encourage the efficient use of energy.

1.2. Renewable Energy (RE) in the World and Jordan

As countries throughout the globe work to decrease their dependence on fossil fuels and respond to the problem of climate change, RE is becoming an increasingly vital source of energy. RE sources (solar, wind, hydropower, and others) are rapidly expanding, accounting for almost 95% of the increase in global power capacity through 2026 [14]. The following are a few examples of countries that depend on RE sources (the numbers in parentheses represent RE dependence percentage in these countries): Iceland (100%), Norway (97%), Germany and Denmark (50%), China (29%), Japan (19%), and the United States (13%). These countries generate their electricity from renewable sources, such as wind, solar, geothermal, hydropower, and biomass [15]. Wind and solar are the fastest-developing RE resources, with global capacity increasing by more than 20% per year in recent years [16]. RE is becoming more competitive with fossil fuels and is now the most cost-effective option for new power generation [17].
In recent years, Jordan has taken significant action to develop its RE sector. Between 2014 and 2020, the country’s ability to generate electricity from wind and solar increased by more than 10 times compared to 2014 due to the high intensity of solar radiation and the consistently strong winds that can be found across much of Jordan [18]. Although natural gas continues to be the main source of electricity production in Jordan, the country has ambitious goals to boost the portion of RE in its electricity production mixture to 31% by 2030. Additionally, the country is making significant investments in the development of its RE sector [19].

1.3. Pumped Hydroelectric Energy Storage (PHES)

With the increased production of energy from renewable resources, such as wind and solar, into many countries’ electric grids, the overall need for cost- and energy-efficient storage capacity increases. Many plants that use RE resources rely on the normal availability of solar radiation, wind, or water. As a result, temporary energy storage can provide adequate grid stability. As a result, storage solutions must store excess capacity when the power demand is low and release it when the power demand is high. Several energy storage technologies have been developed, such as mechanical storage systems, with various kinds of gravitational storage and chemical energy storage using different battery technologies or hydrogen storage. But pumped hydroelectric energy storage (PHES) realizes the utmost power rating to date [20], with a new pumped storage capacity of 1.5 GW installed in 2020, reaching a capacity of 159.5 GW [21].
PHES is a type of energy storage system in which excess power is used to pump water from a reservoir at a lower position up to a reservoir at a higher position, and thus, energy is stored as a gravitational potential energy source. The water is then released through a turbine to generate electricity when there is a demand for energy. In other words, this potential energy is converted back into electrical energy whenever it is required [22]. PHES has been utilized for utility-scale power storage since the 1890s and is a well-established and economically accepted technology. In the 1890s, the first recognized uses of PHES were identified in Italy and Switzerland, and in 1930, PHES was introduced in the United States. This concept resurfaced in the early 2000s as an economically and technologically viable solution for peak load, wind, and solar energy storage for power quality assurance [23]. Now, PHES facilities are accessible anywhere in the globe. Currently, PHES represents 93% of all utility-scale energy storage in the United States. Currently, there are 43 PHES plants in the United States, and the country has the ability to develop additional plants to more than double its present capacity [24].
The upper reservoir in a PHES system is an essential component that stores potential energy in the form of water at an elevated height. It can be situated on a hill or mountain or constructed as an artificial lake or basin. The capacity of the upper reservoir is determined by the volume of water it can hold. Upper reservoirs can be constructed using various materials such as concrete, rock, or earthfill. The construction method depends on several factors, such as the local topography, the availability of materials, and the environmental impact. The construction of the reservoir may require the relocation of people or wildlife, the clearing of forests or other natural habitats, and the alteration of waterways. On the other hand, the lower reservoir is typically located at a lower elevation than the upper reservoir, allowing gravity to create the necessary pressure to drive the turbines that generate electricity. The lower reservoir can be situated on a river, constructed as an artificial basin, or presented as a dam. Water can be raised from the lower reservoir to the upper reservoir at off-peak hours by electricity and/or RE resources [25,26,27,28,29,30,31] such as wind energy [32], PV [33,34,35,36,37], or a PV and biogas generator [38,39].

1.4. Literature Review

1.4.1. PV–Wind Integrated with PHES

Alnaqbi et al. [25] reviewed the technological viability of hydropower production and PHES and its geographical distribution worldwide, focusing on the MENA region. The discussion covered a project constructed in the UAE. The project expects a significant penetration of about 25% of RE resources into the energy mix in the UAE by 2030. The authors stressed that PHES systems integrated with RE resources, such as wind turbines, photovoltaics, or solar thermal power plants, will play a vital part in stabilizing the power supply. In another study conducted by Shi et al. [26], the authors proposed a model of PHES and electrochemical energy storage (EES) for ultimately improving the accommodation of the PV and wind energy production in the grid. Their results show that the required energy curtailment rate of the grid can be attained. Examining different scenarios for substituting light fuel oil thermal power plants located in the northern side of Cameroon with RE resources was carried out in [27]. The combinations of PV–PHES, wind–PHES, and PV–wind–PHES were studied and evaluated using the non-dominated sorting whale optimization algorithm (NSWOA) and non-dominated sorting genetic algorithm-ii (NSGA-II) metaheuristics algorithms. The results showed that the three investigated scenarios mentioned above are profitable, with the total price for the PV–wind–PHSS scenario at a loss-of-load probability of 0% being 4.6% and 17% less than the wind–PHES and PV–PHES scenarios, respectively. A hybrid system consisting of wind (4–5 MW) and PV (0.54–1.60 MW) energy sources combined with PHES schemes was defined and analyzed in [28] by considering various pump/turbine capacities (2 MW, 4 MW, and 6 MW) and reservoir volume capacities. The results showed that integrating a 4 MW hydropower plant, a 5 MW wind farm, 0.54 MW PV, and an integrated PHES with a reservoir volume of 378,000 m3 achieves the best technical alternative, with 72% annual consumption satisfaction.
A feasibility study regarding the replacement of the traditional grid-connected system with an RE system using a PHES system in combination with PV–wind is shown in [31]. Such a system has the potential to be used as an alternative to supply power to the Vellore Institute of Technology (VIT) located in Chennai, India. The goal of this project is to make power supply satisfy the needed VIT load through the installation of roof-mounted solar panels and small-scale domestic wind turbines using components that have the lowest possible price. The integration of this hybrid system into the existing campus provides cost savings of USD 359,087 in net present cost and USD 28,442 in operating costs when compared to the cost of the grid, as shown by the results of HOMER software. Another feasibility study for the residential energy demand of a fictional island in Hong Kong, using a hybrid PV–wind combined with PHES facility, is assessed in [29]. A mathematical model to mimic hundreds of instances, each with a unique capacity for the component, was derived. The authors focused on a theoretically viable scenario that included PV arrays of 110 kWp, two wind turbines with 10.4 kW each, and a PHES with an upper reservoir of 5106 m3. In conclusion, it was realized that PHES is the most effective energy storage solution for islanded communities to achieve complete energy independence. The design and optimization of an off-grid PV–wind system for a remote island in South Korea was presented in [30]. In order to deal with the excess and shortfall of electricity, two various types of power storage systems were modeled: pumped hydro storage and batteries. The system in this study was optimized using HOMER Pro®. There was a total of half a million systems simulated by HOMER Pro®. However, the number of viable results was narrowed to a quarter of a million. Their results showed that pumped hydro storage is a cheaper choice in terms of the initial investment compared to batteries. In [38], Yimen et al. conducted techno-economic analysis and optimization using HOMER Pro® for a PV–wind–biogas generator integrated with PHES for electricity production in Djoundé on the northern side of Cameroon. The results showed that a combination of a 15 kW biogas generator and 81.8 kW PV system is optimal, with a cost of energy (COE) of 0.256 EUR/kWh and a net present cost (NPC) of EUR 370,426.

1.4.2. Wind Integrated with PHES

A technical and economic study of a hybrid wind–hydroelectric system integrated with water-pumping storage was investigated by Al-Addous et al. [32]. A 10 MW wind park with a 5.2 MW PHES system was considered and investigated for King Talal Dam, with an estimated annual energy generation of 26.7 GWh and projected annual emissions reduction of 15 mega tons of CO2 equivalent. In addition, a feasibility analysis reported that for a discount rate of 6%, the payback period is 8.59 years, and the internal rate of return (IRR) is 9.79%. The authors proved that water-pumped hydro storage in this proposed design could regulate the demand/supply to balance and mitigate the difference between off-peak and peak intervals, playing a significant part in stabilizing the grid and enhancing the penetration of RE systems in Jordan. Al-Masri et al. [40] proposed a wind–hydro on-grid system for the Jordanian utility grid. The proposed system was technically, economically, and environmentally optimized using three optimizers in MATLAB, i.e., genetic algorithm (GA), simulated annealing (SA), and pattern search (PS). The results showed that joining hydro storage with wind power is a more efficient option than conventional power production. The results showed that the GA provides the most economical solution of 0.096 USD/kWh, with a payback period of 10.271 years and reductions of 24.69% and 24.68% for carbon dioxide emissions and traditional grid energy consumptions, respectively.
Singh et al. conducted a meta-heuristic-based economic risk analysis of hybrid wind and PHES power systems [41]. Specifically, three meta-heuristic techniques were employed to identify the optimal employment of the wind park and PHES systems that minimized the system’s risk and generation cost. The results showed that the proposed system, which used one of the newly investigated optimization algorithms in the field (i.e., moth flame optimization (MFO)), effectively minimized the system’s risk and generation cost for the standard IEEE 30-bus system. In terms of electric losses, voltage profiles, production costs, and system feasibility, Basu et al. examined the effect of wind speed variability on a hybrid system of wind turbines and PHES in regulated/deregulated environments with the help of different heuristic algorithms (artificial bee colony algorithm and moth–flame optimization algorithm) [42]. The results showed that as the wind augmented by three times, there was an increase of 1% in the risk coefficients.

1.4.3. PV Integrated with PHES

In [33], Lugauer et al. established boundary conditions for the economic function of a micro-pump storage (MPS) system and proposed a roadmap towards its profitability. The technical and economic characteristics of an MPS system were evaluated using 11 pumps as turbines, regulated by a frequency converter for different production and load situations. For validation purposes, the electricity consumption of a dairy farmer was reduced by storing the PV’s electricity production in MPS. It was found that a nominal output of more than 22 kW (approximately) with heads higher than approximately 70 m was the most feasible practical solution, with a levelized cost of electricity (LCOE) and a total storage efficiency of 0.292 EUR/kWh and 42.0%, respectively. In [34], Al-Masri et al. described the realistic management and sizing of a PV system that is coupled with a PHES system at King Talal Dam (in Northern Jordan), which was suggested to act as the upper reservoir of the PHES. The suggested system was tested against two different scenarios to determine its size and its level of reliability. In the first scenario, the recombination loss in the PV system and the head loss in the turbine simulation were ignored. In the second possible scenario, these two losses were counted. In the first scenario, the needed number of PV modules and the size of the lower reservoir were 44,063 panels and 69.348 M.m3, respectively. In the second scenario, the values of these choice variables were reduced by 14.33% and 5.39%, respectively. A study on the feasibility of an off-grid hybrid energy system that utilizes solar energy, PHES, and battery storage is presented in [35]. The study compares the feasibility of the system with and without a solar tracker and analyzes its performance under various situations. The results indicate that the hybrid energy system with a solar tracker has a lower LCOE and a higher renewable fraction compared to the system without a solar tracker. The study also evaluates the environmental impact of the hybrid system and concludes that it can significantly reduce greenhouse gas emissions when contrasted with a diesel generator-based system. The authors conclude that the hybrid energy system with PHES and battery storage is a feasible and sustainable solution for off-grid systems in remote areas, particularly in regions with high solar potential.
In order to provide 3.032 kWh of electricity per day to a housing unit, a hybrid PV–battery–PHES system was proposed to make use of rainwater collection [36]. The oversizing of components and the management of a secure and dependable power supply were optimized, assessed, and compared for the purpose of reducing LCOE, with a loss of power supply probability of 0.0 for four various scenarios. Scenario One was a conventional PV–battery system; Scenario Two was a PV–battery integrated with hydro system that employs direct rainfall only; Scenario Three was a PV–battery integrated with PHES system, with a battery bank as the main energy backup; and Scenario Four was a PV–battery integrated with PHES system, with the hydro system as the main energy backup. Scenario Four was noted to have the largest percentage of hydropower share and also produced the lowest LCOE, which was estimated as 0.443 USD/kWh.
Different PV models for solar and PHES systems were examined in [37] for Al-Wehdeh dam, Jordan. Two-diode (TD), single-diode (SD), and ideal single-diode (ISD) models were tested for solar system size, reliability, and ecological implications. The study analyzed a 250 W PV module for performance at different temperatures. The optimal values of the index of reliability (IR) are 98.553%, 98.527%, and 98.558% for the ISD, SD, and TD models, respectively; this was calculated using the particle swarm optimization algorithm. However, IR optimal values of 98.557%, 98.524%, and 98.565% for the ISD, SD, and TD models, respectively, were estimated using the whale optimization algorithm. As can be seen, the results for IR are almost the same for the two algorithms. The TD model reduced annual emissions by 21.5198 Gg, making it the greenest option. A total number of 44,840 solar modules and a lower reservoir size of 65.052 M.m3 were optimized. ISD reduces PV panels by 16.67% and SD by 7.93% compared to TD. In [39], Agajie et al. proposed a hybrid system of PV and biogas generator integrated with energy storage (including superconducting magnetic energy storage and PHES) modeled and controlled by a recent controller for minimizing frequency and power oscillation. The results of the frequency deviation acquired by employing fractional order calculus for proportional–integral–derivative (PID) and fuzzy controllers with the opposition-based whale optimization algorithm were 1.05%, 2.01%, and 2.73% lower compared to different metaheuristic optimization techniques, specifically, QOHSA, TBLOA, and PSO, respectively, which were utilized to tweak the system.

1.5. Comments on the Objectives and Novelty of This Study

Before wrapping up this section, the following comments help readers explore the objectives and novelty of this work:
-
In previous research work [43], the location of an upper reservoir for 10 dams in Jordan was surveyed. Based on several of the criteria discussed thoroughly in that work, six locations passed the criteria and have the potential for implementing PHES. The location of the upper reservoir was determined in terms of height and distance from the dam. As a continuation of that previous work [43], the obtained results were adopted and considered as the starting point in this current work. The six locations determined in that work were employed to simulate the performance of PHES systems integrated with a renewable energy resource (i.e., PV system in this work).
-
Currently, in Jordan, there is a new direction regarding energy policy that is represented in terms of diversifying the renewable energy resources, increasing renewable energy share, and utilizing energy storage to solve the problems of stabilizing the grid and balancing loads, especially in peak periods, eventually leading to the sustainability of the energy sector in Jordan. Energy storage is a very contemporary concept in the energy sector in Jordan. This paper sends a clear message to governmental agencies, policy-makers, and investors about the viability of PHES integrated with PV systems in Jordan by taking into account the fact that Jordan is among the sunbelt countries. This paper encourages building such systems to achieve sustainability goals in Jordan.
-
When inspecting the literature, less than a handful of research papers that discuss the technical and economic feasibility of such PHES systems integrated with renewable energy resources in Jordan were found. The approach in this paper (as shown later) is totally different from the approach in the other works in the world (in general) and the Jordan/MENA region area specifically. Two works on PHES integrated with wind farms [32,40] and two papers on PHES with PV systems [34,37] in Jordan have been conducted. Both pieces of work on PHES with PVs consider the case of one location. In [34], the authors took the dam as the upper reservoir for a PHES system with a PV station (whereas, currently, dams are considered as lower reservoirs). In [37], the authors analyzed different models of PV systems with PHES. In this work, all the potential dams in Jordan were investigated, making this study the largest in terms of the number of dams.
-
This paper introduces the idea of modularity in building PHES systems integrated with PV systems. The approach utilizes a 1 MWp PV system, but the results can be scaled up based on the volume of water that circulates in the PHES system that is allowed by the authority.
-
This paper estimates the energy generated after discharging water in the upper reservoir through turbines and investigates the match between the generated energy and load.
-
This paper integrates two software packages (as shown later in the methodology) to predict the performance of PHES systems integrated with PV systems.
-
In order to increase confidence in our conclusions, this paper describes five financial metrics that are used to estimate the feasibility of PHES integrated with PV systems.
-
Finally, the approach and the results can be generalized and applied to similar situations in Jordan and the MENA region specifically.
These potential locations for PHES systems in Jordan, in addition to technical, economic, and environmental principles, are presented in Section 2. In Section 3, the results for a representative case (King Talal Dam) are presented and discussed thoroughly, followed by a summary of the results for all other dams in this work with an overview discussion. Section 4 concludes this paper with the most important findings and directions for future work.

2. Methodology

2.1. Potential Locations for PHES in Jordan

According to the study conducted by the authors of [43], 10 dams located in Jordan were surveyed to determine potential sites for PHES. The dams are considered as the lower storage basins without influencing their functionality, while the upper storage basins are determined based on meeting specific criteria. Potential sites for constructing PHES systems should be located on unique topography, such as a hill or mountain, and near water supplies. The selection criteria in [43] can be summarized as follows:
-
The height between the higher and lower reservoirs should be high to enable building of PHES;
-
The distance of water pipes should be as short as possible;
-
The length-to-height (L/H) ratio should be within acceptable values;
-
The minimum water capacity should be above 1 million cubic meters at least;
-
Potential upper reservoirs should be natural or semi-natural basins;
-
The properties of the location need to be able to prevent water loss;
-
The potential sites should be near the electricity grid.
Out of the 10 dams surveyed in [43], only six sites met the basic requirements that were mentioned above, including geographical natural terrain and water availability. Table 1 lists these six successful sites, the heights of the upper and lower reservoirs, and the distance between them. In addition, the maximum capacity of each dam (lower reservoir), the water storage at the end of the year 2022 for each dam (considering water inflow and outflow in 2022), and their purposes/original uses are included in Table 1.

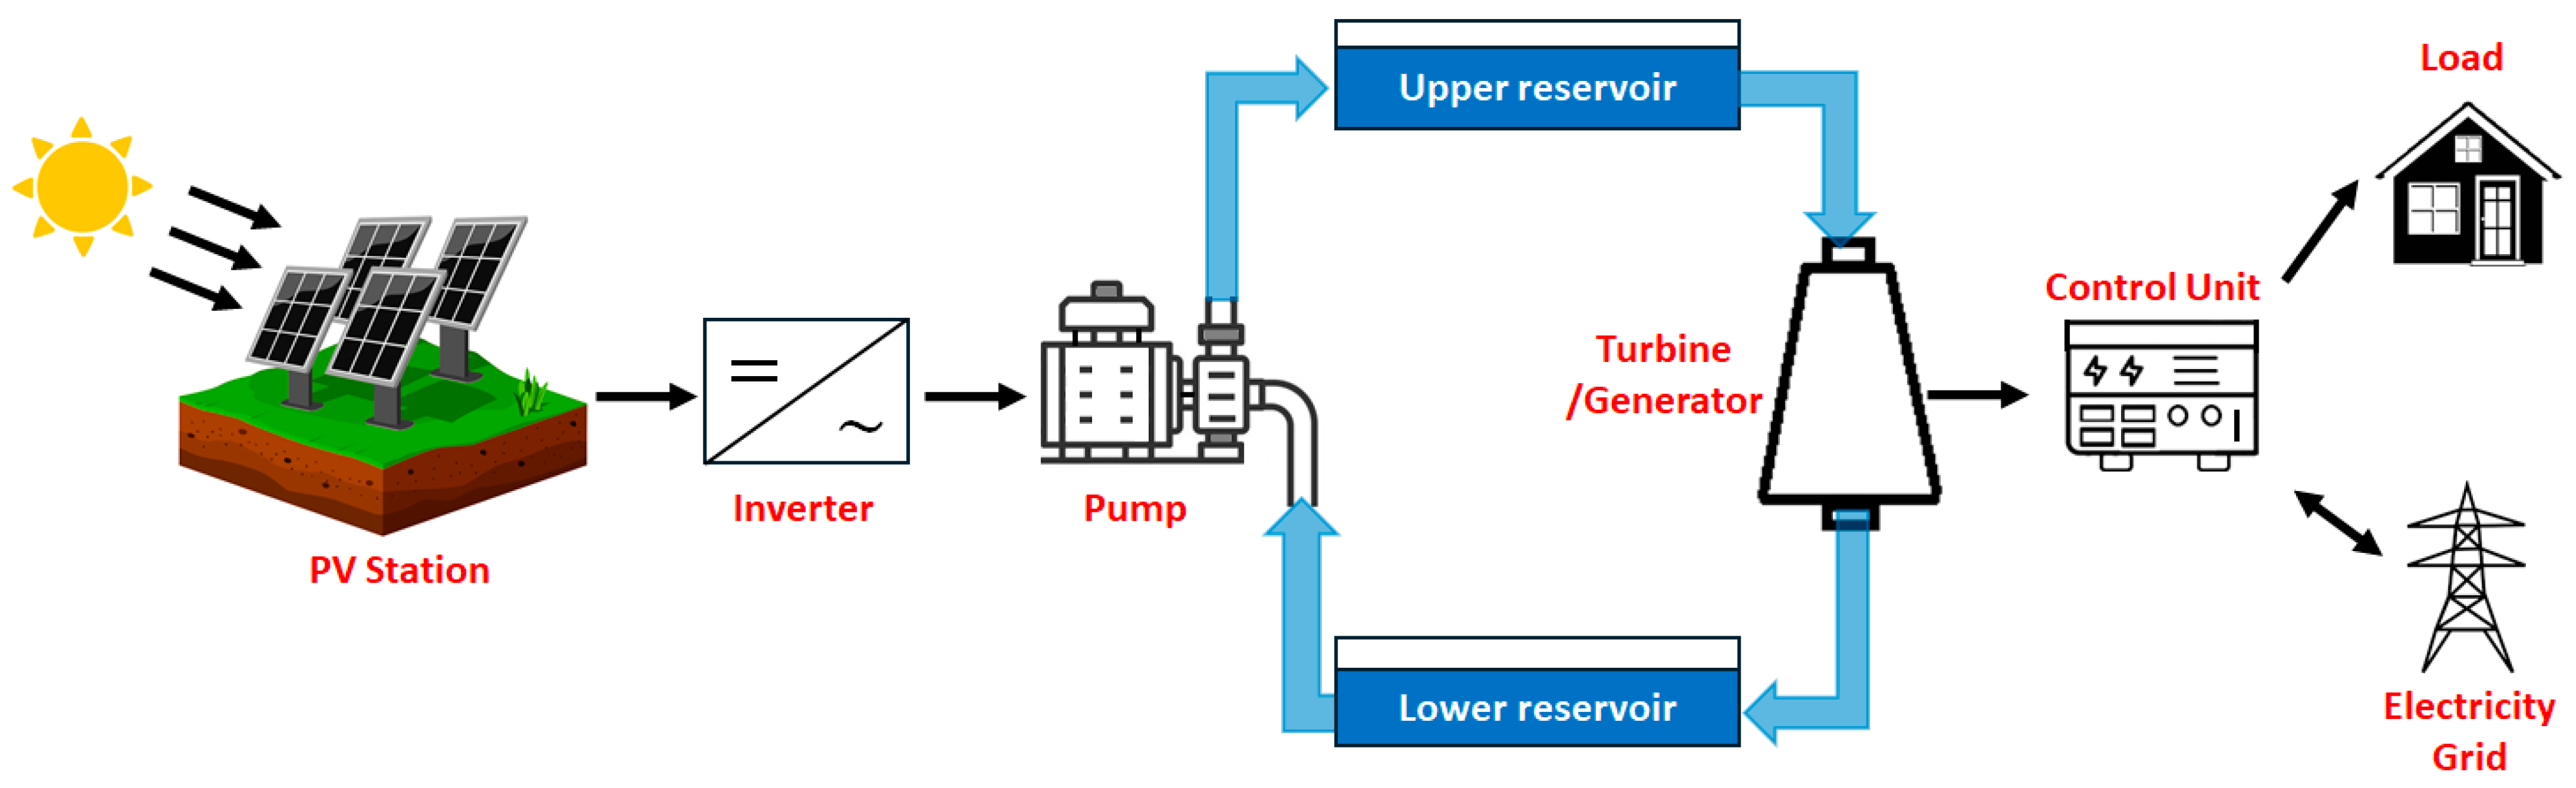
2.2. Proposed Operation of PHES Integrated with a Photovoltaic (PV) Station for Electrical Load

In this research, the six sites that passed the selection criteria discussed in the previous section (King Talal Dam, Al-Wahdah Dam, Wadi Al-Arab Dam, Al-Mujib Dam, Al-Walah Dam, and Al-Tannur Dam) were proposed for integration with a 1 MWp off-grid PV station installed near the lower reservoir to pump water to the upper reservoir. In addition, it is proposed that the water in the upper reservoir is discharged within 3 h during the night through a turbine to drive an electrical load of 1 MW. If the amount of water stored in the upper reservoir is not enough to power the 1 MW load, power is imported from the grid to the load. On the other hand, if the power generated from the turbine is more than that required by the load, then the excess power is exported to the grid. Figure 1 summarizes the idea proposed in this research.
It is worth mentioning that the selection of a three-hour period during the night to empty the upper reservoir depends on Jordan’s electric demand. There are several studies showing that the electric demand is a complex phenomenon in Jordan [5,46]. The electric demand depends on the season (summer, winter, spring, or autumn). Moreover, it depends on the days of the week (weekdays are different from weekends). However, these studies agree that there is an evening electric demand that expands for almost 3 h for all seasons and all days regardless of the type of electricity consumer.

2.3. Calculation of Water Pumped to the Upper Reservoir at Each Potential Site

In order to calculate the water pumped to the upper reservoir for each site, PVsyst (Version 7.3.4) was employed in this research. The current version of PVsyst uses meteorological data for the locations of PV stations provided by Meteonorm software (Version 8.1). The following are the main input parameters into PVsyst (Version 7.3.4) for each case:
  • The geographical location (latitude, longitude, and altitude) of each PV station near the dam (lower reservoir);
  • The size of the PV station is 1 MWp;
  • PV panel orientation (tilt angle = 30° and azimuth angle = 0°);
  • Elevation difference between the lower and upper reservoirs (as calculated from Table 1);
  • The type and size of the pipes (the pipe is assumed to be made from polyethylene 50 (PE) with a diameter of 500 mm and five elbows. The factor of other losses from the valves is considered to be 10);
  • The type and number of pumps equipped with AC motors.
For each site, the size of the upper reservoir is varied until the missing water and unused fraction percentages become zero. The main output parameter from PVsyst (Version 7.3.4) is the average daily pumped water for every month of the year for every site. Due to the variability in solar irradiation depending on the climate and weather season, the water pumped in the winter season is lower than the water pumped in the summer season. This is due to the fact that less radiation means less power delivered from the off-grid PV station to the pumps, which would result in less water pumped to the upper reservoir.

2.4. Calculation of the Power Generated from the Turbine at Each Potential Site

Based on the output results from PVsyst (Version 7.3.4), it is assumed that the water pumped to the upper reservoir during the day as a result of running the pumps using the off-grid PV station is discharged from the upper reservoir to the lower reservoir (dam) through a turbine to power a 1 MW load at night for three hours (from 8:00 PM to 11:00 PM, for instance). In this case, it is assumed that the upper reservoir (higher tank) becomes empty during 3 h at night. The three-hour demand period is not fixed (it shifts to earlier hours in winter and to later hours in summer due to the length of the day and social activities [5,46]). However, from a simulation point of view, continuously changing the three-hour demand period has no effect on the simulation results as long as the length of the demand period is the same. In order to calculate the energy generated in each site, HOMER Pro® (Version 3.15.3) was employed to handle this task. Figure 2 shows the HOMER Pro® (Version 3.15.3) model of the turbine and electrical grid connected to the load. The following are the main input parameters into HOMER Pro® (Version 3.15.3) for each site:
  • The available head for the turbine: It is the difference in height between the lower and upper reservoirs;
  • Designed water flow rate of the turbine: It is calculated based on the output from PVsyst (Version 7.3.4) for the average daily pumped water through the year for every site;
  • Minimum flow ratio of the turbine: It is determined as a percentage of its design flow rate. The turbine will not generate any electricity below this rate;
  • Maximum flow ratio of the turbine: It is entered as a percentage of its design flow rate. Up to this flow, the turbine produces electricity at the required efficiency. The output of the turbine does not grow with more flow over this point;
  • Efficiency of the turbine: It is a value at which the turbine converts the energy in water to electricity;
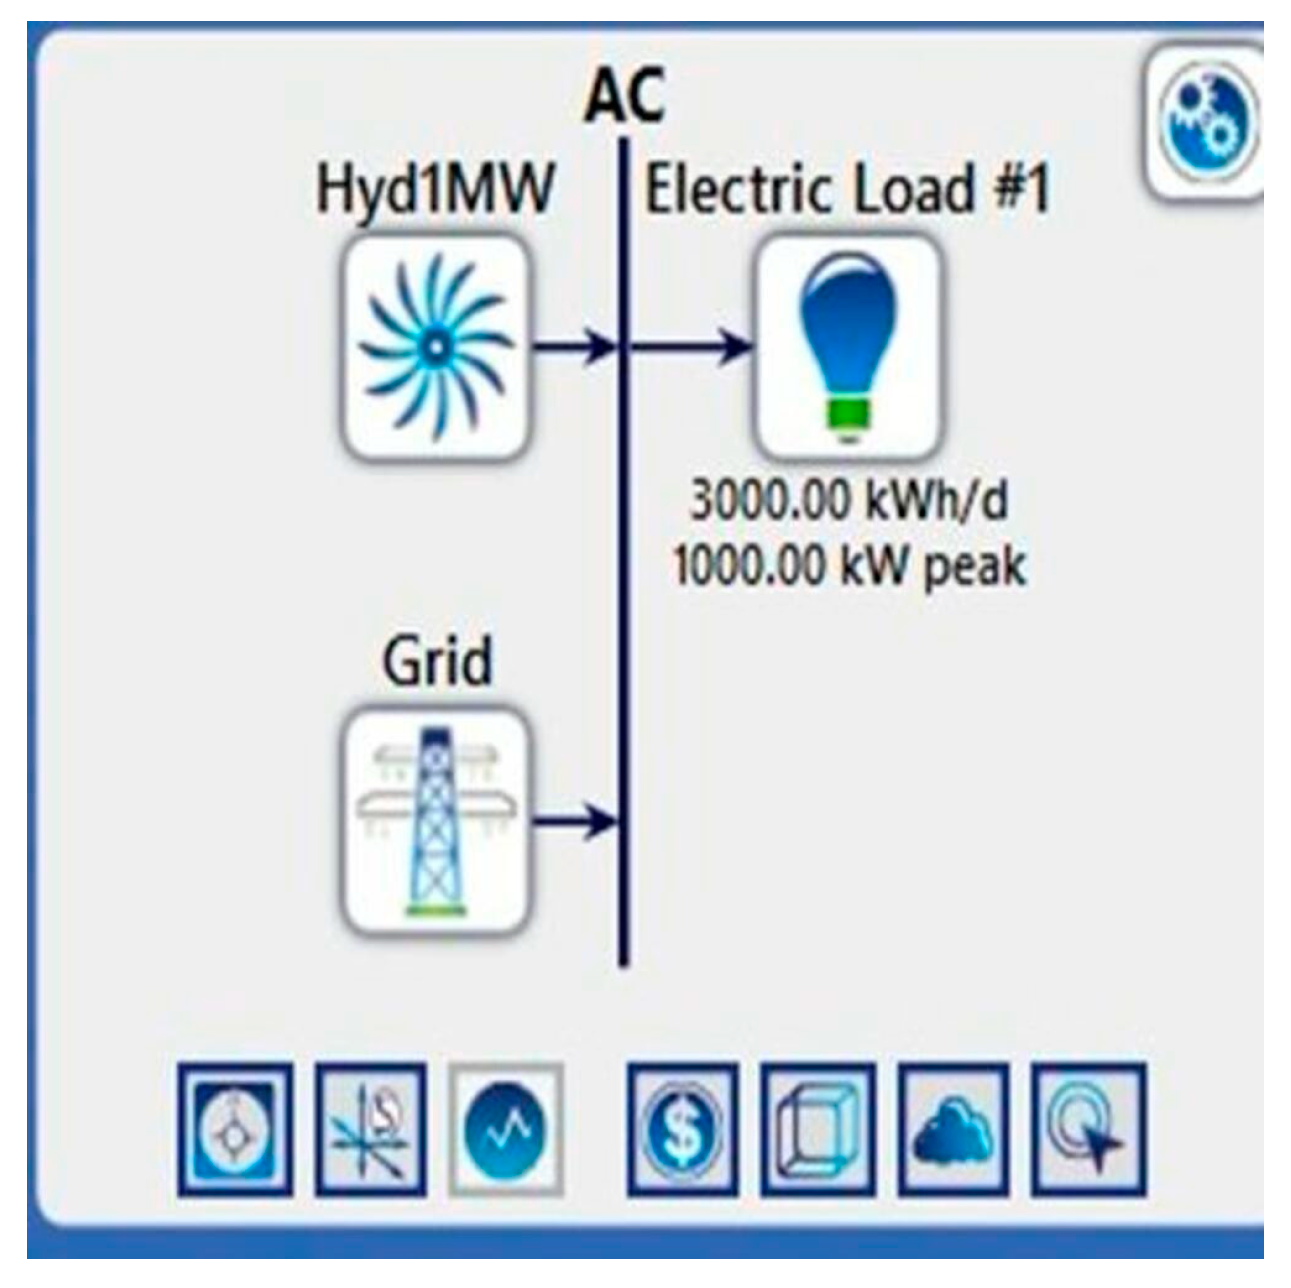
  • Load: It is assumed in this work that an electrical load of 1 MW is driven by the turbine, and this load is required for three hours at night;
  • Hourly water flow rate: A data file with 8760 lines representing the hours in a year is created as an input file in HOMER Pro® (Version 3.15.3). Each line is calculated by allowing water in the upper reservoir to follow through the turbine over 3 h at night to ensure it becomes empty. This is repeated for every month of the year.
Based on the above inputs for each of the six potential sites, the total energy generated through the year is estimated in addition to the percentage that the turbine covers the required load. Moreover, the energy sold to or purchased from the grid is determined for every month of the year. In general, it is expected that energy is purchased from the grid during the winter months, while there is a surplus in energy production during the summer months.

2.5. Selection of the Turbine Type and Size

An automated tool called HPP-design was utilized in this research to provide all information needed for the preliminary design of hydro power plants [47]. By providing the available head and the nominal expected flow rate of the turbine, HPP-design is able to find a range of suitable turbines (Pelton, Francis, Kaplan, Archimedes screw, cross-flow) and to direct the user to the best solution according to the specific framework of the plant.

2.6. Economic Analysis and Feasibility Study

The following economic assessment criteria were employed in this research:

2.6.1. Net Present Value (NPV)

It calculates the present value of all expected annual balances (cash flows) associated with an investment and compares it to the initial investment cost [48]. The formula to calculate NPV is as follows:
N P V = A B 1 1 + r 1 + A B 2 1 + r 2 + + A B n 1 + r n  
where A B 1 , A B 2 , …, A B n are the annual balances (AB can be positive (inflows) or negative (outflows)); r is the discount rate, which is the rate of return employed to discount future annual balances back to their present value; and n represents the lifetime of the project or investment.

2.6.2. Internal Rate of Return (IRR)

It is a financial metric utilized to estimate the feasibility/profitability of a project. It denotes the discount rate at which the NPV of the project’s expected cash flows equal zero [48]. If the IRR of a project exceeds a discount rate that is equal to the bank interest rate, the investment is attractive. But if the IRR falls below that rate, the investment is undesirable. In order to calculate the IRR, the expected positive and negative annual balances of the project throughout its lifetime are required in addition to the initial investment required to start the project. Mathematically, IRR is calculated from the following equation:
0 = I C + t = 1 n ( A B t 1 + I R R t )
where I C is the initial cost, A B t is the annual balance in year t , t is the time period (usually measured in years), and n represents the lifetime of the project or investment.

2.6.3. Simple Payback Period (SPP)

It is a financial metric employed to evaluate the time needed for an investment to generate cash inflows that equal or exceed the initial investment cost [49], and it is given by
S P P = I C A E P × T  
where I C is the initial cost, A E P is the total annual energy production (in kWh), and T is the price for the energy generated (in USD/kWh).

2.6.4. Complex Payback Period (CPP)

It is also known as the discounted payback period. It is a financial metric that measures the duration of time needed for an investment to generate cash inflows that equal or exceed the initial investment cost, considering the time value of money, which means that a dollar obtained in the future is valued less than a dollar obtained today [49]:
C P P = I C A E P × T I C × F C R A O M  
where I C , A E P , and T are as defined for S P P above; F C R is a fixed charge rate per year, and it could be the interest rate paid on a loan according to the World Bank data; and A O M is the annual operating and maintenance cost.

2.6.5. The Electricity Cost

Supposing the initial cost ( I C ) is financed by a bank loan; then, the annual uniform payment ( A U P ) for y years at interest rate r to repay the loan of this I C is expressed as [50]
A U P = I C × r 1 + r y 1 + r y 1
The electricity cost is the ratio of the expenses (that include A U P and A O M ) to A E P for each year and is given by
E l e c t r i c i t y   C o s t = A U P + A O M A E P  

2.7. CO2 Emission Reduction

When looking at any energy-producing system, greenhouse gas emissions are always considered because they play a major role in climate change and global warming and affect the planet’s ecosystem. This PHES system integrated with a PV station is no exception to that statement. A CO2 emission reduction study is conducted to estimate how much CO2 emissions are reduced to generate energy for the 30 years during the duration of the project compared to generating the same quantity of energy from fossil fuels. This study focuses only on energy production without taking into consideration the construction of different components of the system. For every year, the energy production from a PV station and turbine is found by taking into consideration the fact that the PV panels and turbines have degradation rates of 0.4% and 0.3%, respectively, per year. Eventually, to calculate CO2 emission reduction, the total energy production (from PV station and turbine) is multiplied by the electricity grid emission factor, which is 0.4585 kg CO2/kWh [51].

3. Results and Discussion

In this section, the methodology explained in the previous section is applied to the six potential sites in Jordan for PHES implementation. The approach followed in this section considers the results in great detail for a specific site, which is King Talal Dam. Then, the results for the other sites are summarized and discussed.

3.1. King Tala Dam

3.1.1. Pumped Water and PVsyst (Version 7.3.4) Results

The distance between the upper and lower reservoirs of the King Talal site and their heights (listed in Table 1 in Section 2.1), as well as the input parameters (summarized in Section 2.3), were inserted into PVsyst (Version 7.3.4). Then, the size of the upper reservoir was varied to 52,000 m3 until the missing water and unused fraction percentages became zero. The average daily pumped water to the upper reservoir for each month for the King Talal site is the main output parameter in this stage and is shown in Table 2. Inspecting this table shows that the water pumped in the summer months is almost double when compared to the water pumped in the winter months. For the PV station proposed for installation at the King Talal site, the performance ratio (PR) was checked to make sure it was within acceptable operation conditions. It was found that PR for year-round operation is 79.1%, which indicates that the system functions under very good conditions. In addition to PR, Table 3 summarizes the other output parameters obtained from PVsyst (Version 7.3.4) for the King Talal site.

3.1.2. Energy Generated from the Turbine and the Homer Pro® (Version 3.15.3) Results

The following parameters are the most important inputs to Homer Pro® (Version 3.15.3) that are used to calculate the energy generated by the turbine at the King Talal site:
  • The available head: It is the difference in heights between the lower and upper reservoirs, which is 205 m, as shown in Table 1;
  • Design flow rate: It is the water flow rate that is discharged to the turbine. However, because it is assumed in this work that the upper reservoir becomes empty over three hours during the night, the average daily water pumped to the upper reservoir (6486 m3, as shown in Table 2) is divided by three hours. Therefore, the water flow rate becomes 2162 m3/hour, which is equal to 600.6 L/s;
  • Minimum flow ratio of the turbine: It is taken as 50% of the design flow rate;
  • Maximum flow ratio of the turbine: It is expressed as 150% of the design flow rate;
  • Efficiency of the turbine: It is considered as 90%;
  • Load: It is assumed as 1 MW, and it is required for three hours at night from 8:00 PM to 11:00 PM;
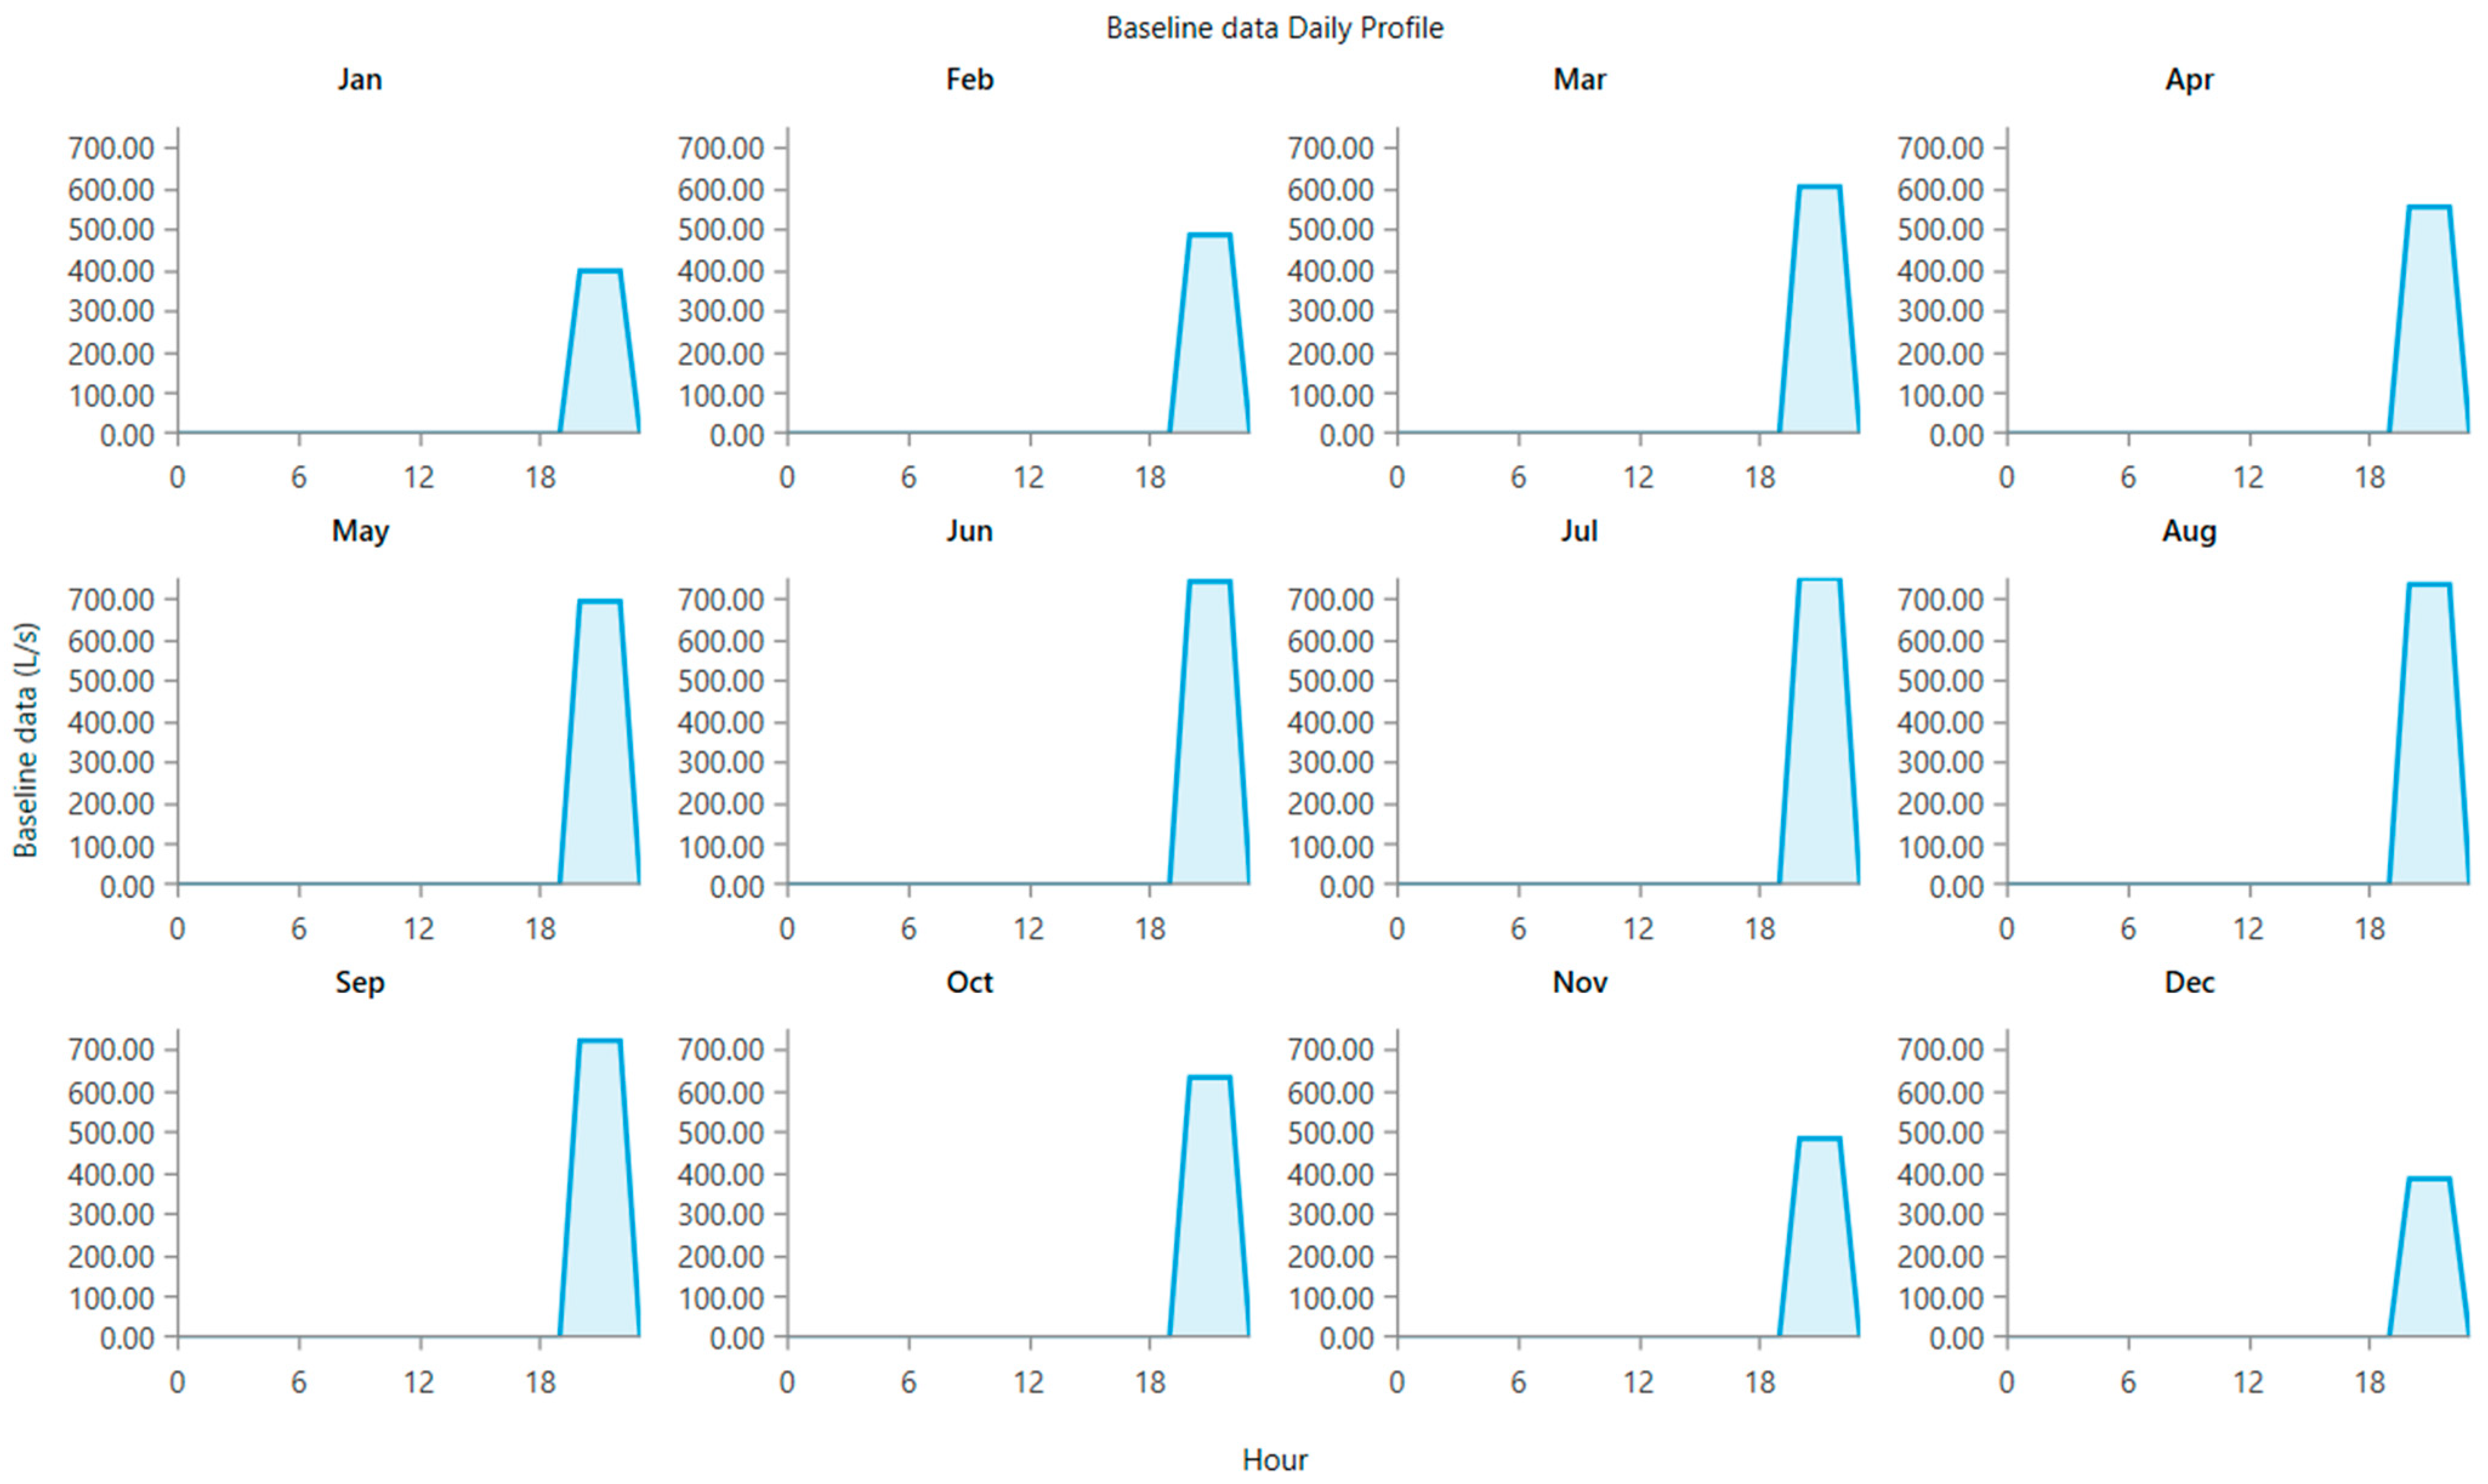
  • Hourly water flow rate: A data file with 8760 lines is created and inputted into HOMER Pro® (Version 3.15.3). The value for each line representing the hours from 8:00 PM to 11:00 PM is calculated based on the average daily water flow pumped to the upper reservoir shown in Table 2. Each value in Table 2 is divided by three hours (and converted into liter per second). The values for lines other than the required time for electrical load are taken as zeros. This is repeated for every month of the year. A graphical representation of this input data file is taken from Homer Pro® (Version 3.15.3) and shown in Figure 3, where the water flow rate from 8:00 PM to 11:00 PM is calculated as explained above and is zero for hours outside this time interval.
Based on the input parameters and data file in Homer Pro® (Version 3.15.3) discussed in the above paragraph, the total energy production from the turbine and total energy imported from the electricity grid or exported to it for the King Talal site are summarized in Table 4. Based on this table, it is found that the energy generated by the turbine covers 97.8% of the total energy required by the load. In addition, based on the energy imported from or exported to the electricity grid (depicted in Figure 4), it is found that the maximum power is 1223 kW, and this is produced in July. However, during May, June, July, August, September, and October, there is a surplus in energy production. Therefore, the energy in these months is sold to the grid. But in January, February, March, April, November, and December, there is a shortage in the production of the energy needed to cover the assumed load.

3.1.3. Turbine Selection and HPP-Design Results

In order to select the turbine and obtain information about its performance and specifications, HPP-design is used. For the King Talal site, a head pressure of 205 m (it represents the difference between the height of the upper reservoir and height of the lower reservoir as shown in Table 1) and a flow rate of 751.2 L/s (average daily water raised to the upper reservoir in July, as seen in Table 2) are entered as inputs in HPP-design. The output from HPP-design is shown in Figure 5. The red dot in this figure shows the operating point of the turbine. Based on the location of this point, the most suitable type and size for turbines for the King Talal site are determined, which are Pelton and Francis in this case.

3.1.4. Economic Analysis of the PHES System at the King Talal Site

It is essential to assess the PHES system at the King Talal site from an economic perspective to decide if this system is viable for Jordan’s conditions while emphasizing the fact that any PHES system has a certain level of performance for various locations. Table 5 displays the itemized and initial (capital) costs for this PHES system at the King Talal site in USD. The cost of the PV station includes PV modules, inverters, structure, accessories, and installation. The civil and labor costs involve excavation, leveling, upper reservoir construction, pump foundation, control room construction, and pipe foundations, while the project management cost includes supervision and reporting [32]. Moreover, the following assumptions are taken into account when economic analysis is performed:
  • According to World Bank statistics, Jordan’s average inflation rate in 2022 was 4.229% [52]. For the following 30 years, this rate was utilized as the interest rate, electricity tariff increase, and yearly inflation rate;
  • The cost of the PHES system is supposed to be financed by a bank loan with an interest rate of 4.229% for the next 30 years. As this cost is supposed to be funded by bank loans, the discount rate, r, is assumed to be equal to the bank interest rate, which is 4.229%;
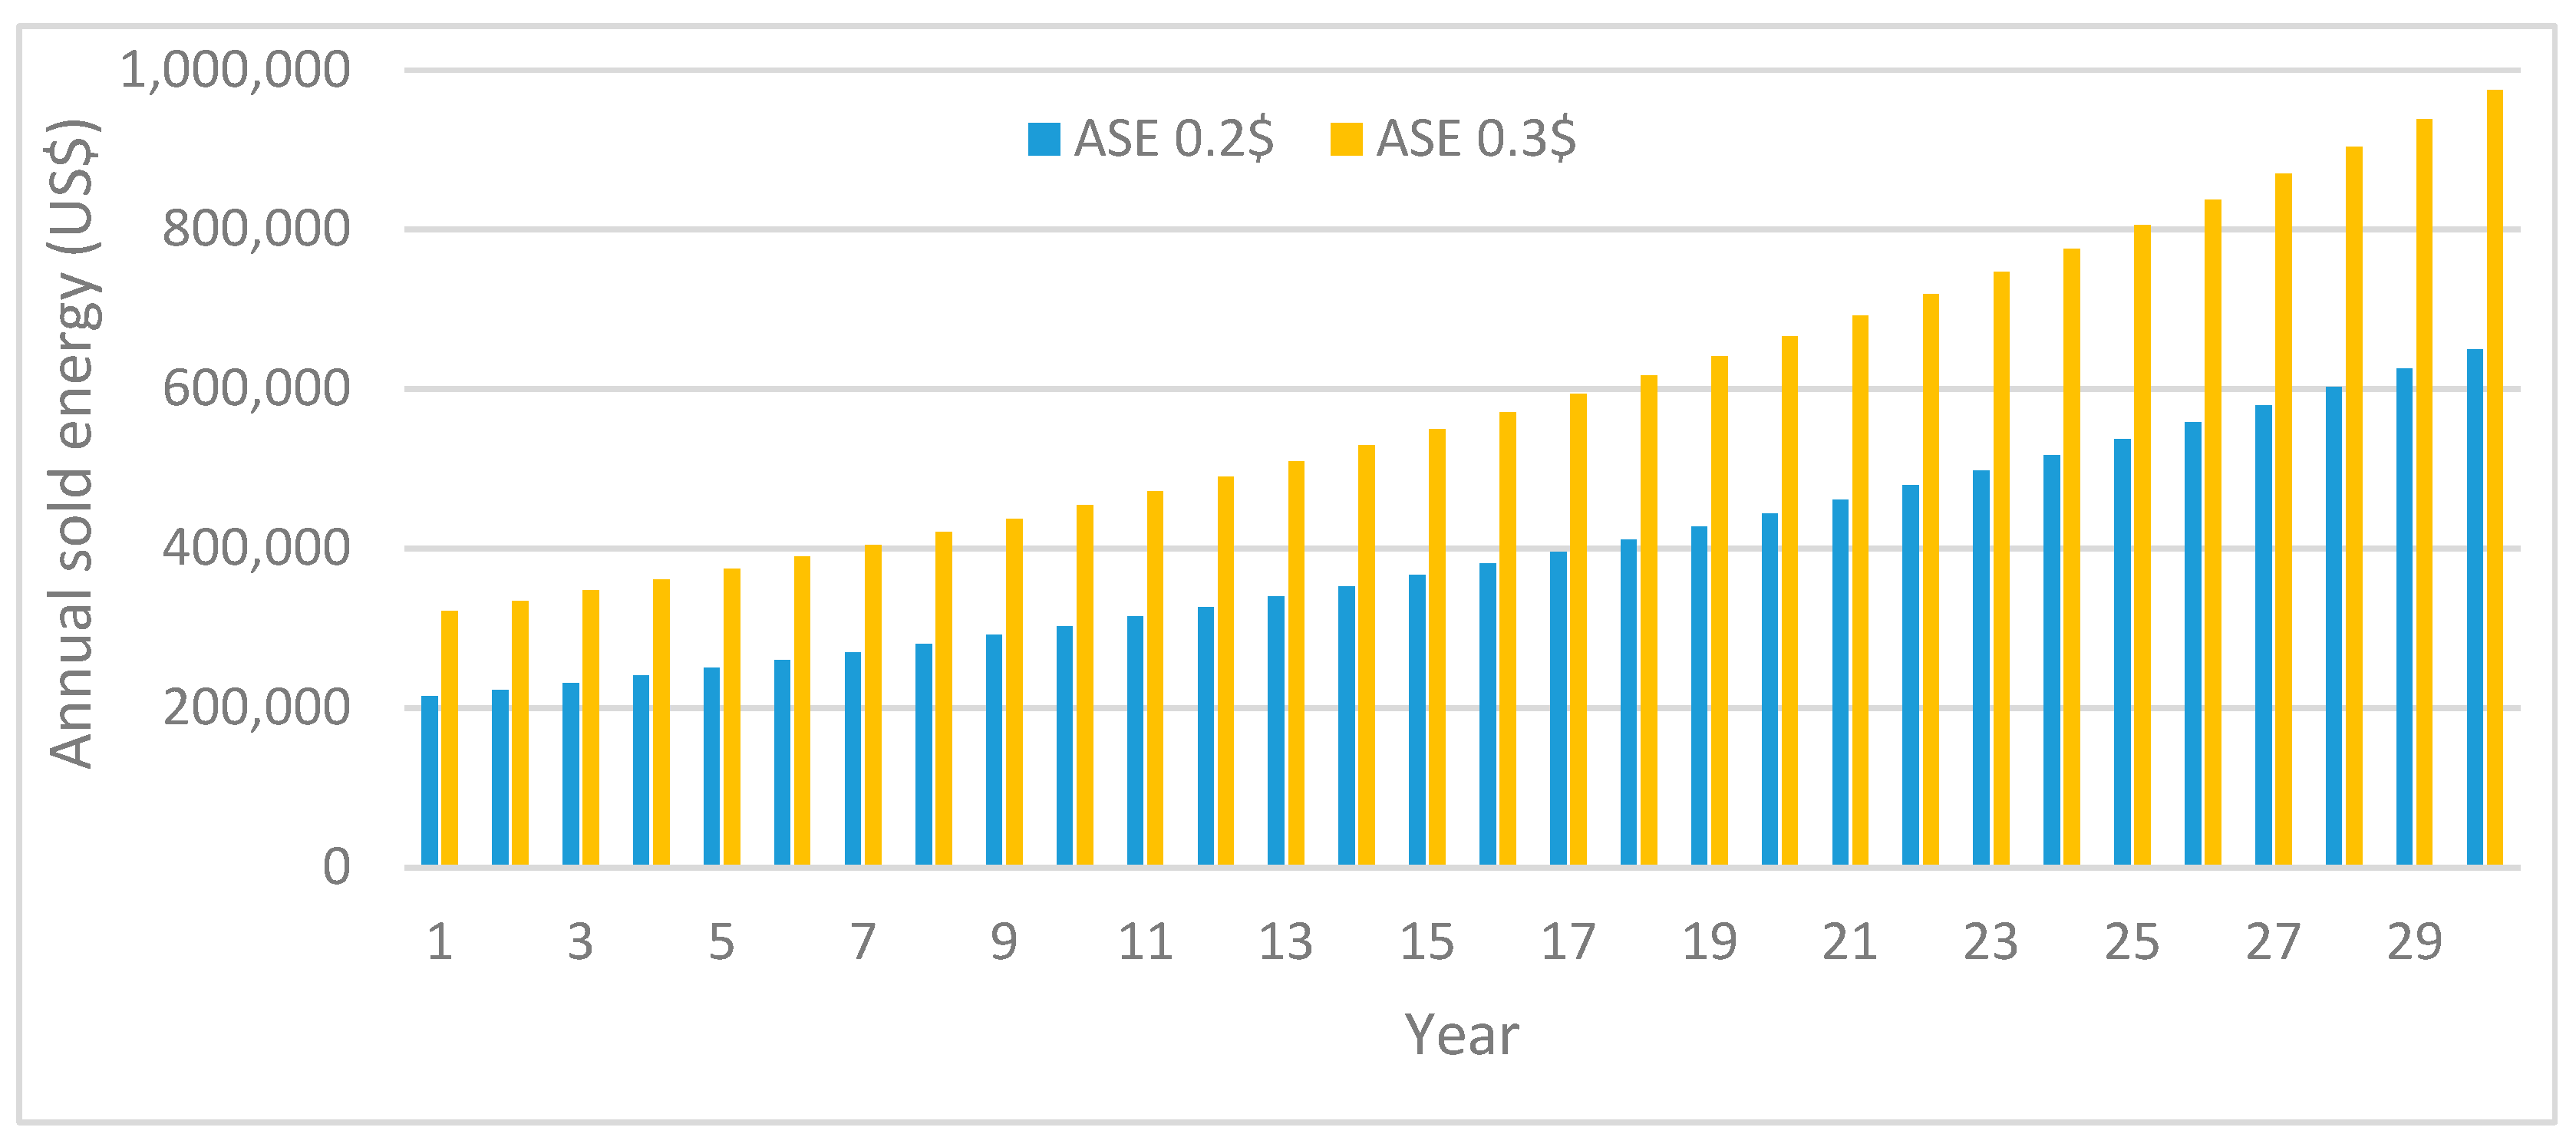
  • Two scenarios for the electricity tariff were considered in this work for comparison purposes: 0.20 USD/kWh and 0.30 USD/kWh;
  • The annual operation and maintenance (AOM) cost is supposed to be 1.0% of the initial project cost, and the annual inflation rate is increasing by 4.229%;
  • The yearly output production drop for the turbine is 0.3%/year [53].
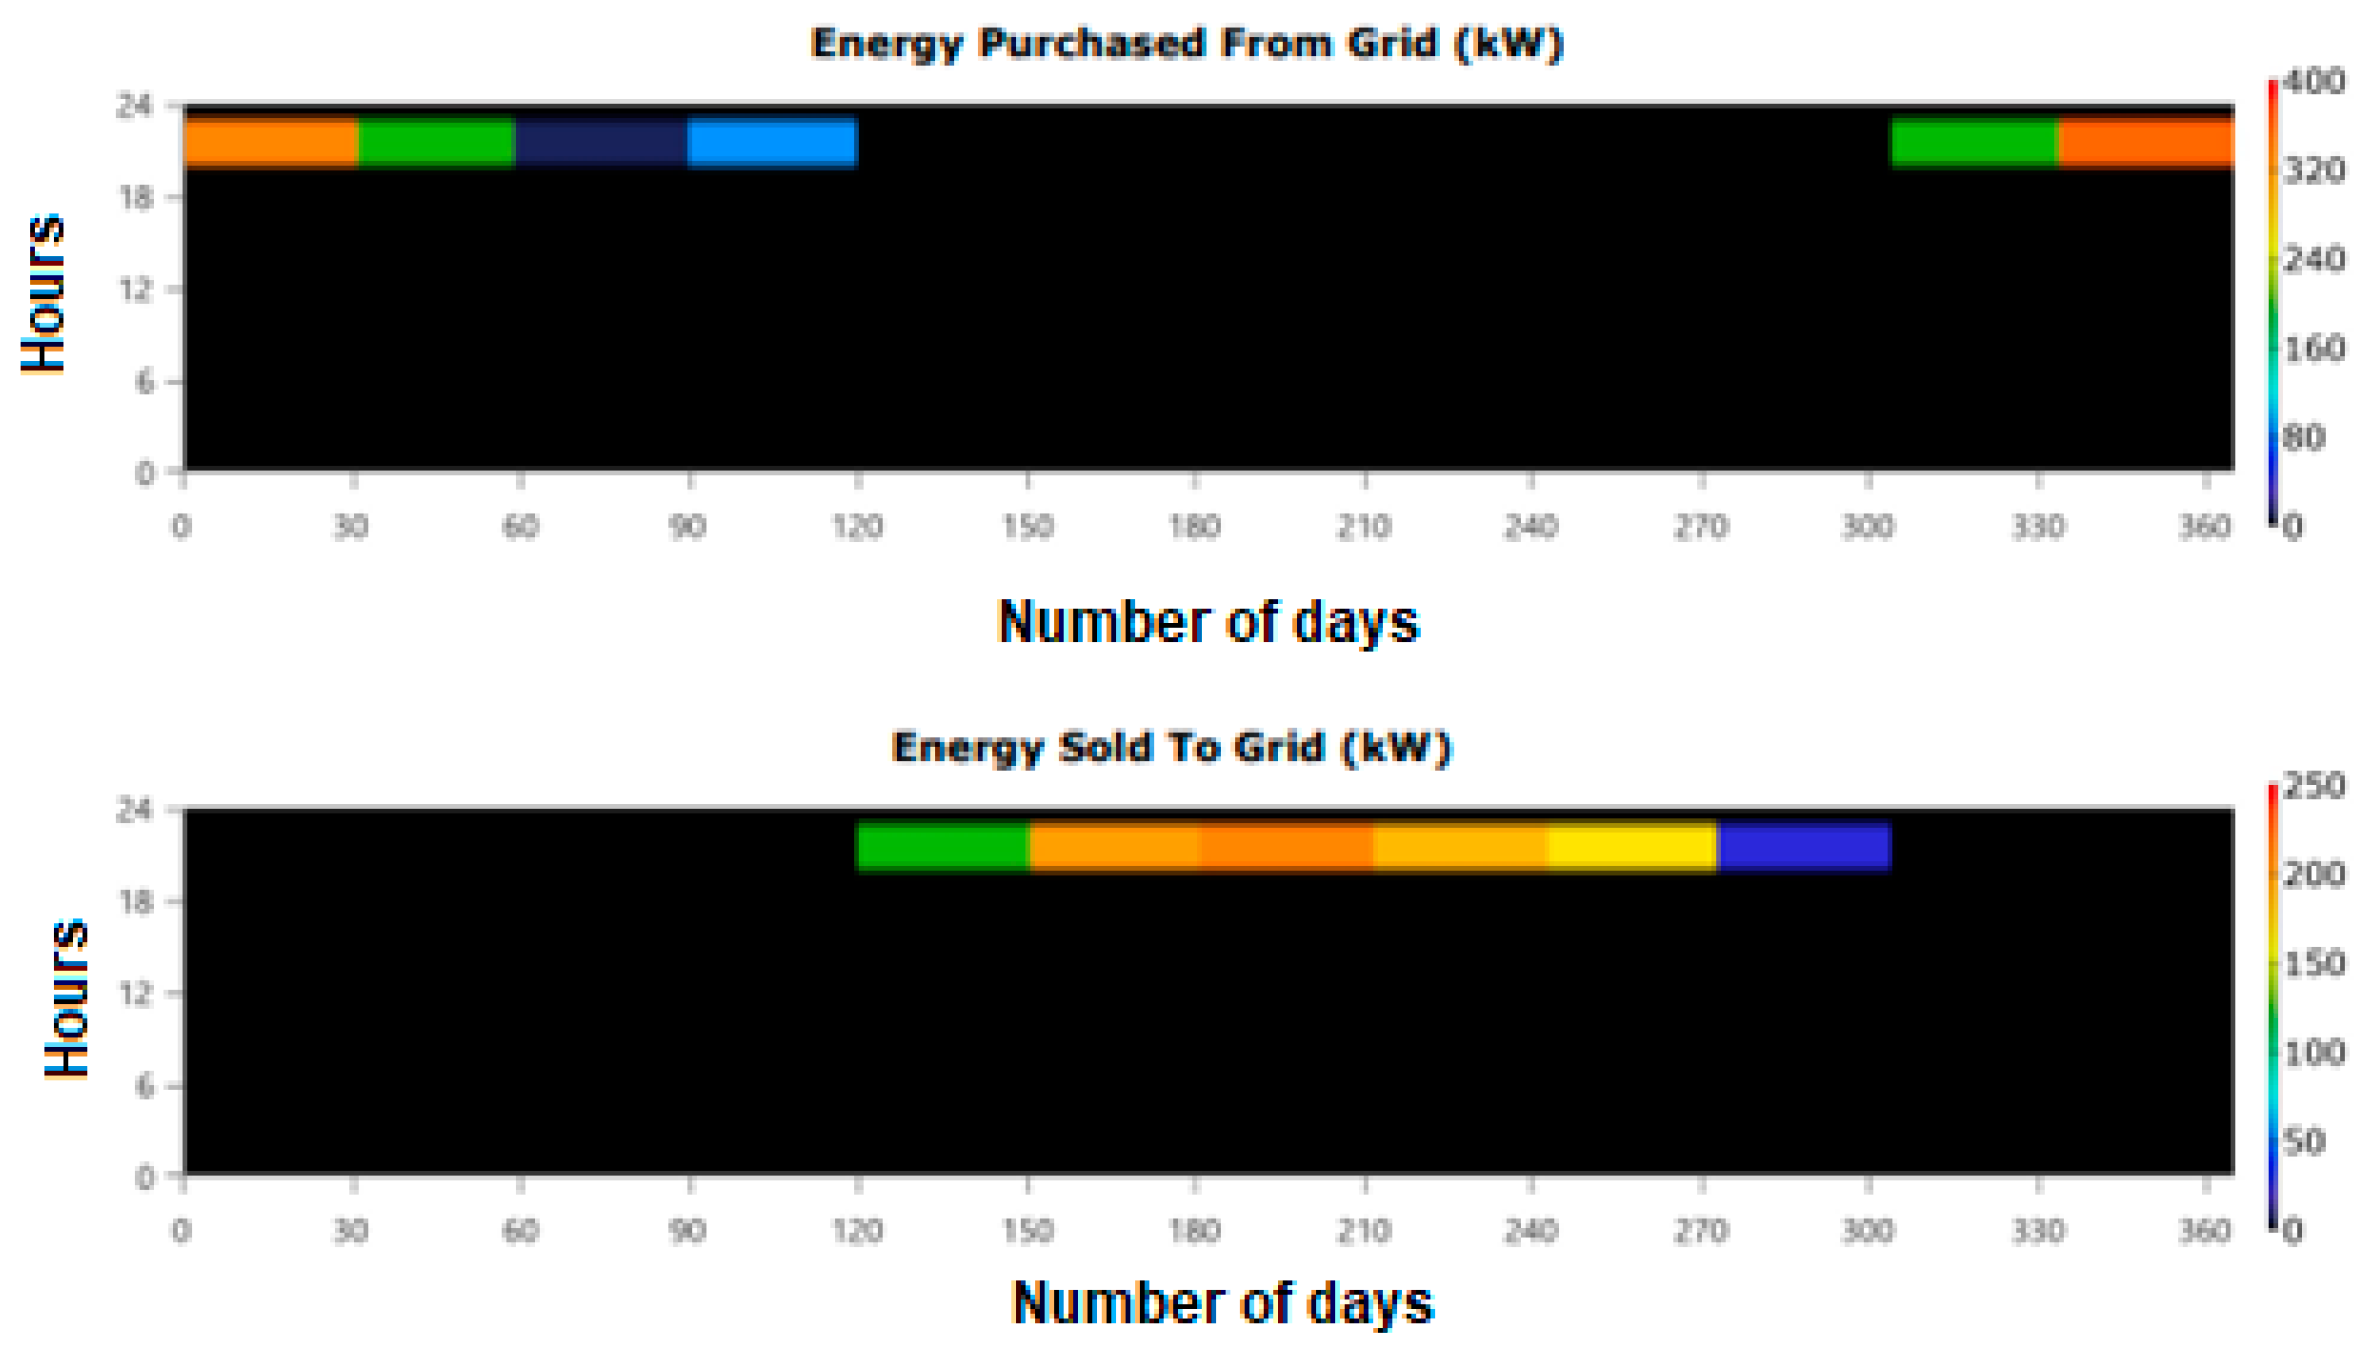
It is worth mentioning that the electricity tariff in Jordan is a dynamic matter that is determined based on political, economic, and social issues [54]. A scaled tariff or tiered (steps or layers) rate is implemented in Jordan now. The rate increases when the electrical energy consumed increases. There are seven tiers (or layers) in Jordan’s electricity tariff system, with different percentages of consumers in each tier [55]. In this work, the two scenarios considered above for electricity tariffs cover almost all of the possible range of tariffs for the current consumers in Jordan and the possible increase in the future due to several factors.

Annual Balance

The annual balance ( A B ) is calculated using the following equation [50]:
A B = A S E + A O M  
The A S E is the annual sold energy and is given as
A S E = A E P × T  
where A E P is the annual energy production and T is the electricity tariff. A E P is expected to decrease linearly at a constant rate by 0.3% every year. The A E P for the King Talal site in the first year is 1,070,460 kWh. In order to determine the A E P over the subsequent 30 years, the following equation is used:
A E P = 1 , 070 , 460   k W h ( 1 ( 0.003 ( y 1 ) ) )
The parameter y is the number of the year. The yearly electricity tariff T , based on the compound annual inflation rate of 4.229%, is determined using the following equation:
T = T 1 1 + 0.04229 y 1
where T 1 is the electricity tariff in the first year. Two scenarios for T 1 are employed, as mentioned in the assumptions above (0.20 and 0.30 USD/kWh). Multiplying A E P (from Equation (9)) by T (from Equation (10)) for every year yields the A S E (Equation (8)) over the lifetime of the project (30 years), which is demonstrated in Figure 6.
The A O M is found by utilizing the following equation:
A O M = A O M 1 1 + 0.04229 y 1  
where A O M 1   is the operation and maintenance cost in the first year, which is 1.0% of the initial cost for the King Talal site, as calculated in Table 5. This A O M is increasing by a rate of 4.229%, as mentioned in the above assumption. Figure 7 shows the A O M of the PHES system at the King Talal site, where the negative values means that the A O M is outflow or expenditure. Based on Equation (7) for AB, adding the A S E (from Equation (8) and Figure 6) to the A O M (from Equation (11) and Figure 7) results in the A B over the lifespan of PHES system for the King Talal site; this is displayed in Figure 8 for the two electricity tariff scenarios.

Financial Metrics for the PHES System at the King Talal Site

In order to obtain the N P V for the PHES system at the King Talal site, the values for AB obtained from Equation (7) over the lifespan of the project demonstrated in the previous section are substituted in Equation (1) with the discount rate, r , as specified in the above assumption. Similarly, to obtain the I R R for the system at the King Talal site, the values of A B are substituted in Equation (2) with I C (initial cost), as calculated in Table 5. The estimates for the N P V and I R R are tabulated in Table 6. In order to calculate the S P P and C P P for this system, Equations (3) and (4) (discussed in Section 2.6.3 and 2.6.4) are utilized, where the I C is taken from Table 5, and the A E P , T , and A O M are calculated using Equations (9), (10), and (11), respectively; the F C R is assumed to be 4.229%. Carrying out the calculations reveals that the S P P and C P P for the PHES system at the King Talal site are as tabulated in Table 6.

Electricity Cost

In order to calculate the electricity cost for the PHES system at the King Talal site, Equation (6) is employed. But first, the A U P (annual uniform payment) from Equation (5) has to be computed. From Equation (5), by using the I C from Table 5, a discount rate of r = 4.229%, and y = 30 years (lifespan of the project), the value for A U P becomes
A U P = 1 , 529 , 092 0.04229 1 + 0.04229 30 1 + 0.04229 30 1 = U S D   90 , 903
In addition to the above value for A U P , the A O M (computed from Equation (11)) and A E P (determined from Equation (9)) are used to estimate the electricity cost from Equation (6) over the lifespan of the project and the results are shown in Figure 9. The electricity cost for the first year of the lifespan of the project is 0.099 USD/kWh.

3.1.5. CO2 Emission Reduction from the PHES System at the King Talal Site

For the first year of the project lifespan, the PV station produces 1,775,800 kWh at the pump input (Table 3), and the turbine generates 1,070,460 kWh (Table 4). When considering the electricity grid emission factor (which is 0.4585 kg CO2/kWh [51]), then a total of 1305 metric tons of CO2 emissions would be reduced. This amount would have been emitted into the atmosphere if fossil fuels were used instead of a PV station and turbine. However, this amount decreases annually with the overall decrease in the energy generated from this system due to degradation over the span of this project. In the case where the PV panels have a degradation rate of 0.4% per year and the turbine has a degradation of 0.3%, then the total emission reduction over the lifespan of the project becomes 37,162 metric tons, as shown in Figure 10.

3.2. Pumping Systems and PVsyst (Version 7.3.4) Results for All Sites

In this section, the procedure followed in Section 3.1.1 for the King Talal site is implemented for other potential sites in this study (Table 1). However, due to the large difference between the height of the upper reservoir and the height of the lower reservoir (511 m) and the long distance between them (2550 m) at the Al-Mujib site, no pumps are available in the PVsyst (Version 7.3.4) database to satisfy these requirements. Therefore, this site is excluded from the simulation, and no more results are generated for this site.
Based on the data listed in Table 1, the input parameters for PVsyst (Version 7.3.4) discussed in Section 2.3, and the varying size of the upper reservoir until the missing water and unused fraction percentages become zero, the main operating and output parameters from PVsyst (Version 7.3.4) are summarized in Table 7 for the five potential sites in this study.
As can be concluded from Table 7, the relationship between the head (difference between the height of the upper reservoir and the height of the lower reservoir) and daily average pumped water (and consequently the yearly water raised) to the upper reservoir is inversely proportional. Therefore, the relationship between the head and the volume of the upper reservoir is also an inverse relationship. As the head increases, the upper reservoir size decreases, and vice versa. The nature of these inverse relationships (the relationship between head and reservoir size and the relationship between the head and daily pumped water) is almost linear within the range of the head investigated in this study. From another perspective, it is noticed that there is a direct relationship between reservoir size and daily average pumped water, and this relationship is almost linear within the head range considered in this work. From Table 7, the Al-Walah site has the smallest head and, consequently, it has the largest upper reservoir size and highest daily average water raised to the upper reservoir (keeping in mind that the size of the PV station at all sites is 1 MWp). Moreover, it is noted that the energy production from all PV stations is almost the same (around 2 GWh) with less than 5% variability. This is not surprising because the location of these sites is within a small area. The difference in latitude between the Al-Wehdah site (northernmost location in this study; 32.72° N) and the Al-Tannur site (southernmost location; 30.97° N) is less than 2°, and the five sites are almost on the same longitude. Finally, after checking the PV system efficiency, performance ratio (PR), and pump efficiency values for all sites, it was found that these values are within the acceptable operating ranges, indicating that the off-grid PV pumping systems at all sites run effectively.
In addition, as noted in Table 1, the water storage in each site at the end of 2022 is considerably larger than the daily average pumped water (shown in Table 7) required to run the PHES system proposed at all sites. This implies that these dams can be utilized as PHES systems in addition to their original purposes/uses indicated in Table 1. More importantly, based on the water quantity in the dam reservoir that is allowed to pump from technical and/or legislative points of view, scaling up the size of the PV and hydropower systems can be carried out easily by taking into consideration the modular nature of such systems.

3.3. Turbine Hydroelectric Energy and Homer Pro® (Version 3.15.3) Results for All Sites

Based on the input parameters discussed in Section 2.4 and following the same approach implemented for the King Talal site discussed in detail in Section 3.1.2, the design flow rate is calculated for each site using daily average pumped water (presented in Table 7), and the results are shown in Table 8. In addition, an input file for each site was created based on the daily pumped water to the upper reservoir for each month. By taking into consideration the fact that the operating hours for the turbine is 1095 h (three hours a night multiplied by 365 days a year) and the required electrical energy (by load) is 1,095,000 kWh (load of 1 MW multiplied by 3 h a day multiplied by 365 days a year), the results of the Homer Pro® (Version 3.15.3) simulation are tabulated in Table 8. It is noted that energy is imported from the electricity grid in the winter months, but energy is exported to the grid in the summer months for all sites except for the Al-Tannur site. Moreover, the energy exported to the electricity grid is more than the energy imported from the grid for the two sites (Al-Walah and Al-Wehdah), as is clear from the hydro penetration percentage. The two sites have a hydro penetration percentage close to 100% (King Talal and Wadi Al-Arab). HPP-design was used to select the turbine based on head pressures and maximum flow rate, as shown in Table 8. It was found that the best turbine type is Pelton and/or Francis.

3.4. Economic Feasibility Analysis for All Sites

The first step in carrying out the feasibility analysis is to find the initial cost of the PHES system at each site, which is similar to what was carried out in Table 5 for the King Talal site. The initial cost is estimated based on the prices of the PV station, pumps, turbine, generator, pipes for pumping, turbine systems, civil and labor time, and project management costs. Table 9 shows the initial costs for all sites considered in this study.
By employing Equations (7)–(11), the annual balance ( A B ) is calculated for each site depending on the A S E (annual sold energy), A E P (annual energy production) (from Table 8), A O M (annual operation and maintenance), and T (electricity tariff). Then, by using Equation (1) and the assumptions listed in Section 3.1.4, the N P V (net present value) is calculated for each potential site in this study, and the results are tabulated in Table 9 for the two scenarios of electricity tariff assumed in this work. It is simply noted that the N P V for all potential sites is larger than the I C , indicating that the investment in these PHES systems in all sites is attractive from this perspective. Based on the A B calculated previously (in addition to I C (Table 9) and the use of Equation (2)), the I R R was calculated for all potential sites for the two electricity tariff scenarios. The results for the I R R are presented in Table 9. It was found that the I R R for all cases is larger than the discount rate ( r ) or the bank interest rate (4.229%), revealing that the investment in PHES systems is financially attractive from this point of view.
The S P P (simple payback period) and C P P (complex payback period) were then determined based on the assumptions discussed in Section 3.1.4, employing Equations (3) and (4), depending on the I C , A E P , T , A O M , and F C R . The values for S P P and C P P for all sites for the two scenarios of electricity tariffs are recorded in Table 9. These values for S P P and C P P for the PHES systems are relatively short compared to projects of the same nature. The A U P (annual uniform payment) from Equation (5) for all sites has to be computed based on the I C from Table 9, a discount rate of r = 4.229%, and y = 30 years. It is noticed that the A U P has a direct relationship with I C . Therefore, it was found that the Al-Wehdah site has the lowest A U P and Al-Tannur has the highest A U P . In order to calculate the electricity cost for the PHES system at all sites, Equation (6) is employed based on the A U P found in the previous step (Table 9); the A O M cost, which is taken as 1% of the I C for the 1st year, with an annual inflation of 4.229% (Table 9); and the A E P (Table 8), with a constant degradation rate of 0.3% every year. The electricity cost results are tabulated in Table 9. The electricity cost of the Al-Wehdah site is the cheapest, and the electricity cost for the Al-Tannur site is the most expensive.
When inspecting the results for both scenarios, as shown in Table 9, it turns out that the second scenario (an electricity tariff of 0.30 USD/kWh) is better than the first scenario (an electricity tariff of 0.20 USD/kWh) for all of the financial metrics for PHES systems at all sites. It is noted that the N P V increases by 54%, the I R R increases by 44%, the S P P decreases by 31%, and the C P P decreases by 38% for the second scenario compared to the first. Moreover, it was found that the initial cost is the most sensitive factor of all the financial metrics. As the initial cost decreases, the N P V and I E E increase, and the S P P and C P P decrease. The initial cost of the Al-Wehdah site is the smallest, the N P V and I R R are the highest, and the S P P and C P P are the shortest.

3.5. CO2 Emissions for All Sites

The total energy generated by the PHES system consists of two parts: the energy delivered from the PV station to the pump and the energy produced from the turbines. This total energy generated from RE resources would reduce CO2 emissions. Table 10 summarizes these values for the energy generated in the first year and for the assumed lifespan of the project (30 years) after considering that the PV panels and turbines have yearly degradation rates of 0.4% and 0.3%, respectively. By using the electricity grid emission factor (0.4585 kg CO2/kWh [51]), the CO2 emission reduction was estimated and is listed in Table 10. Based on CO2 emissions in Jordan for 2021 (which is 24,296.7844 kilotons [56]), the contribution of CO2 emission reduction for a 1 MW PHES system at any site in this study in the first year is almost 0.005%. Therefore, by considering all sites and scaling up the size of the PHES systems based on the water availability in the dams (lower reservoirs), the CO2 emission reduction due to electricity generation in these sites in Jordan would be a significant percentage.

4. Conclusions and Future Work

Nowadays, energy storage is attracting researchers across the world in general and to Jordan specifically. One of the main fields that has high potential for implementing such systems is pumped hydroelectric energy storage (PHES) systems. Even though an enormous number of PHES systems have been built and operate across the world, they have not been implemented in Jordan. The main reason can be attributed to the scarcity of water in Jordan, which led to the water in the dams principally being used for drinking and irrigation purposes. However, this paper can attract the attention of research and energy policy-makers in Jordan regarding the significance of such energy storage systems and how they can be implemented to solve energy problems and increase the percentage of renewable energy in the energy mix.
Based on a previous survey conducted on 10 dams in Jordan, it was found that six sites have great potential for implementing PHES systems based on meeting specific criteria. Some of these criteria include the possibility of constructing a natural or semi-natural upper reservoir and an upper reservoir location such that the difference in height and distance between the upper and lower reservoirs is practical. In this study, we carried out a technical, economic, and environmental investigation of those six sites. In order to increase the attractiveness of such PHES systems, a renewable energy resource was considered for system integration to pump water to the upper reservoirs (instead of using electricity) during off-peak hours. For every site in this study, a 1 MWp off-grid photovoltaic (PV) system was built near the lower reservoir (which is the original dam in these cases) to pump water to an upper reservoir that was placed at practical distance and elevation. In order to simulate the water flow rate for pumping to the upper reservoir, a software package named PVsyst (Version 7.3.4) was used. The water stored in the upper reservoir was assumed to flow back into the lower reservoir (dam) through a turbine for three hours at night (the peak hours) to power a 1 MW load. The power generated through the turbine was estimated using another software package called HOMER Pro® (Version 3.15.3).
Based on the results from PVsyst (Version 7.3.4), it was found that the Al-Walah site had the largest quantity of water raised to the upper reservoir (per 1 MWp PV station), hence the largest upper reservoir size due to the smallest height difference and the shortest distance between the upper and lower reservoirs. Within the head range in this study, it is noticed that the relationship between the water pumped and the height difference is inversely linear. Based on Jordan’s conditions, it was found that each 1 MWp PV station yields almost 2 GWh annually. In addition, the performance ratio (PR) for each PV system in this study is within acceptable values; it is around 80%, except for Al-Tannur site, which has a lower PR due to the long distance and large difference between the heights of the upper and lower reservoirs.
The results from HOMER Pro® (Version 3.15.3) show the energy generated for every month of the year in addition to the energy exported to the electricity grid in summer months, as well as the energy imported from the grid during winter months. It is noted that those sites with a low difference in height between the upper and lower reservoirs have high amounts of water in the upper tank and vice versa. Therefore, a high amount of water has a positive effect on the generated energy, but a low difference in heights has a negative effect on the generated energy. Because these two factors (height and water amount) have an inverse relationship for all sites, it was noticed that the energy generated is almost the same for all sites. It was found that the energy generated from turbines is almost 1.1 GWh (except for the Al-Tannur site, which is almost 0.9 GWh), with a hydro penetration value close to 100% (except for the Al-Tannur, where it is 84%).
In addition to the technical study carried out for all sites, an economic feasibility investigation was carried out. The net present value (NPV), internal rate of return (IRR), simple and complex payback periods (SPP and CPP), and cost of electricity were estimated for all sites. The results are encouraging from a financial point of view; the NPV is larger than the initial cost, the IRR is larger than the discount rate, the SPP and CPP are relatively short, and the electricity cost is cheaper than the electricity tariff. These findings are applicable to all sites in this study. From an environmental point of view, PHES integrated with PV systems would greatly reduce CO2 emissions in Jordan. It is estimated that for a PHES system with a 1 MW PV station under Jordan’s conditions, almost 1300 metric tons of CO2 would be reduced annually. This is a very small fraction when compared to global emissions, but it is an action in the correct direction.
In this study, PHES using a 1 MWp PV system is considered. However, based on the quantity of water in the dam reservoir that is allowed to be pumped from a technical and/or legislative point of view, scaling up the size of the PV and hydropower systems can be carried out easily by taking into consideration the modular nature of such systems. Implementing such systems in Jordan would surely make the energy sector sustainable, increase renewable energy in the energy mix, stabilize the grid, and balance the loads, especially during peak periods. In order to make the PHES systems more attractive financially, in the near future, it is planned to investigate the effect of employing pumps and turbines as a single unit (the same device can work as a pump (to raise water up to the upper reservoir) and a turbine (to produce power from the discharged water from the upper reservoir)). This would greatly reduce the initial cost because the combined pump/turbine is cheaper than the individual cost for pumps and turbines. In addition, using the combined pump/turbine units would reduce the length of pipes to half, which positively affects economic feasibility. For the Al-Tannur and Al-Mujib sites, re-examining the location of the upper reservoir relative to the lower reservoir to allow for a smaller height difference, and a shorter distance would enhance the technical performance of these sites, resulting in an increase in their feasibility.

Author Contributions

Conceptualization, B.H. and S.A.-D.; methodology, B.H., S.A.-D., Y.A., D.M. and S.A.-R.; software, Y.A., D.M. and S.A.-R.; validation, B.H., S.A.-D., Y.A., D.M. and S.A.-R.; formal analysis, B.H., S.A.-D., Y.A., D.M. and S.A.-R.; investigation, B.H., S.A.-D., Y.A., D.M. and S.A.-R.; resources, Y.A., D.M. and S.A.-R.; data curation, Y.A., D.M. and S.A.-R.; writing—original draft preparation, B.H., S.A.-D., Y.A., D.M. and S.A.-R.; writing—review and editing, B.H. and S.A.-D.; visualization, Y.A., D.M. and S.A-R.; supervision, B.H.; project administration, B.H. All authors have read and agreed to the published version of the manuscript.

Funding

This research received no external funding.

Institutional Review Board Statement

Not applicable.

Informed Consent Statement

Not applicable.

Data Availability Statement

Data will be made available upon request.

Acknowledgments

The authors kindly thank Omar Alsotary for his valuable time in helping with the PVsyst (Version 7.3.4) and HOMER Pro® (Version 3.15.3) simulations.

Conflicts of Interest

The authors declare no conflicts of interest.

References

  1. REN21. Renewables 2022 Global Status Report; Paris, France, 2022. Available online: https://www.ren21.net/wp-content/uploads/2019/05/GSR2022_Full_Report.pdf (accessed on 17 November 2023).
  2. Energy Institute. Statistical Review of World Energy, 72nd ed.; 2023. Available online: https://www.connaissancedesenergies.org/sites/default/files/pdf-actualites/Statistical%20Review%20of%20World%20Energy.pdf (accessed on 17 November 2023).
  3. International Energy Agency (IEA). World Energy Outlook 2023; 2023. Available online: https://iea.blob.core.windows.net/assets/86ede39e-4436-42d7-ba2a-edf61467e070/WorldEnergyOutlook2023.pdf (accessed on 30 November 2023).
  4. Alrwashdeh, S.S. Energy Sources Assessment in Jordan. Results Eng. 2022, 13, 100329. [Google Scholar] [CrossRef]
  5. Almuhtady, A.; Alshwawra, A.; Alfaouri, M.; Al-Kouz, W.; Al-Hinti, I. Investigation of the Trends of Electricity Demands in Jordan and Its Susceptibility to the Ambient Air Temperature towards Sustainable Electricity Generation. Energy Sustain. Soc. 2019, 9, 39. [Google Scholar] [CrossRef]
  6. Sandri, S.; Hussein, H.; Alshyab, N. Sustainability of the Energy Sector in Jordan: Challenges and Opportunities. Sustainability 2020, 12, 10465. [Google Scholar] [CrossRef]
  7. Azzuni, A.; Aghahosseini, A.; Ram, M.; Bogdanov, D.; Caldera, U.; Breyer, C. Energy Security Analysis for a 100% Renewable Energy Transition in Jordan by 2050. Sustainability 2020, 12, 4921. [Google Scholar] [CrossRef]
  8. Monna, S.; Abdallah, R.; Juaidi, A.; Albatayneh, A.; Zapata-Sierra, A.J.; Manzano-Agugliaro, F. Potential Electricity Production by Installing Photovoltaic Systems on the Rooftops of Residential Buildings in Jordan: An Approach to Climate Change Mitigation. Energies 2022, 15, 496. [Google Scholar] [CrossRef]
  9. Dar-Mousa, R.N.; Makhamreh, Z. Analysis of the Pattern of Energy Consumptions and Its Impact on Urban Environmental Sustainability in Jordan: Amman City as a Case Study. Energy Sustain. Soc. 2019, 9, 15. [Google Scholar] [CrossRef]
  10. Fraihat, B.A.M.; Ahmad, A.Y.A.B.; Alaa, A.A.; Alhawamdeh, A.M.; Soumadi, M.M.; Aln’emi, E.A.S.; Alkhawaldeh, B.Y.S. Evaluating Technology Improvement in Sustainable Development Goals by Analysing Financial Development and Energy Consumption in Jordan. Int. J. Energy Econ. Policy 2023, 13, 348–355. [Google Scholar] [CrossRef]
  11. Qasaimeh, A.; Qasaimeh, M.; Abu-Salem, Z.; Momani, M. Solar Energy Sustainability in Jordan. Comput. Water Energy Environ. Eng. 2014, 3, 41–47. [Google Scholar] [CrossRef]
  12. Abu-Rumman, G.; Khdair, A.I.; Khdair, S.I. Current Status and Future Investment Potential in Renewable Energy in Jordan: An Overview. Heliyon 2020, 6, e03346. [Google Scholar] [CrossRef]
  13. Jordan Atomic Energy Commission. Available online: https://www.jaec.gov.jo/ (accessed on 17 November 2023).
  14. Abdelilah, Y.; Bahar, H.; Criswell, T.; Bojek, P.; Briens, F.; Moorhouse, J.; Jiménez, G.R. Renewables 2021: Analysis and Forecast to 2026; 2021; Volume 74. Available online: https://iea.blob.core.windows.net/assets/5ae32253-7409-4f9a-a91d-1493ffb9777a/Renewables2021-Analysisandforecastto2026.pdf (accessed on 22 December 2023).
  15. World Bank Website. Available online: https://www.worldbank.org/en/home (accessed on 17 November 2023).
  16. Eurostat. Renewable Energy Statistics 2021; Eurostat: Luxemburg, 2023. [Google Scholar]
  17. IRENA Renewable Cost Database. Renewable Power Generation Costs in 2020; 2020. Available online: https://www.irena.org/-/media/Files/IRENA/Agency/Publication/2021/Jun/IRENA_Power_Generation_Costs_2020_Summary.pdf?rev=99943124d5804ae38da7a7a6661f2cc7 (accessed on 22 December 2023).
  18. Ferroukhi, R.; Khalid, A.; Diala, H.; Divyam, N.; El-Katiri, L.; Fthenakis, V.; Al-Fara, A. Renewable Energy Market Analysis The GCC Region. Irena 2016. Available online: https://www.irena.org/-/media/Files/IRENA/Agency/Publication/2016/IRENA_Market_GCC_2016.pdf (accessed on 22 December 2023).
  19. Ministry of Energy & Mineral Resources. Summary of Jordan Energy Strategy 2020–2030. Available online: https://www.memr.gov.jo/EBV4.0/Root_Storage/EN/EB_Info_Page/StrategyEN2020.pdf (accessed on 21 December 2023).
  20. Görtz, J.; Aouad, M.; Wieprecht, S.; Terheiden, K. Assessment of Pumped Hydropower Energy Storage Potential along Rivers and Shorelines. Renew. Sustain. Energy Rev. 2022, 165, 112027. [Google Scholar] [CrossRef]
  21. IHA. 2021 Hydropower Status Report: Sector Trends and Insights; Volume Report; 2021. Available online: https://assets-global.website-files.com/5f749e4b9399c80b5e421384/60c37321987070812596e26a_IHA20212405-status-report-02_LR.pdf (accessed on 22 December 2023).
  22. Kocaman, A.S.; Modi, V. Value of Pumped Hydro Storage in a Hybrid Energy Generation and Allocation System. Appl. Energy 2017, 205, 1202–1215. [Google Scholar] [CrossRef]
  23. Rehman, S.; Al-Hadhrami, L.M.; Alam, M.M. Pumped Hydro Energy Storage System: A Technological Review. Renew. Sustain. Energy Rev. 2015, 44, 586–598. [Google Scholar] [CrossRef]
  24. Pumped Storage Hydropower. Available online: https://www.energy.gov/eere/water/pumped-storage-hydropower (accessed on 17 November 2023).
  25. Alnaqbi, S.A.; Alasad, S.; Aljaghoub, H.; Alami, A.H.; Abdelkareem, M.A.; Olabi, A.G. Applicability of Hydropower Generation and Pumped Hydro Energy Storage in the Middle East and North Africa. Energies 2022, 15, 2412. [Google Scholar] [CrossRef]
  26. Shi, L.; Yang, F.; Li, Y.; Zheng, T.; Wu, F.; Lee, K.Y. Optimal Configuration of Electrochemical Energy Storage for Renewable Energy Accommodation Based on Operation Strategy of Pumped Storage Hydro. Sustainability 2022, 14, 9713. [Google Scholar] [CrossRef]
  27. Amoussou, I.; Tanyi, E.; Ali, A.; Agajie, T.F.; Khan, B.; Ballester, J.B.; Nsanyuy, W.B. Optimal Modeling and Feasibility Analysis of Grid-Interfaced Solar PV/Wind/Pumped Hydro Energy Storage Based Hybrid System. Sustainability 2023, 15, 1222. [Google Scholar] [CrossRef]
  28. Simão, M.; Ramos, H.M. Hybrid Pumped Hydro Storage Energy Solutions towards Wind and PV Integration: Improvement on Flexibility, Reliability and Energy Costs. Water 2020, 12, 2457. [Google Scholar] [CrossRef]
  29. Ma, T.; Yang, H.; Lu, L.; Peng, J. Technical Feasibility Study on a Standalone Hybrid Solar-Wind System with Pumped Hydro Storage for a Remote Island in Hong Kong. Renew. Energy 2014, 69, 7–15. [Google Scholar] [CrossRef]
  30. Ali, S.; Jang, C.M. Optimum Design of Hybrid Renewable Energy System for Sustainable Energy Supply to a Remote Island. Sustainability 2020, 12, 1280. [Google Scholar] [CrossRef]
  31. Koli, H.; Chawla, M.P.S. Design Analysis of PV-Wind Energy System with Pumped Hydro Storage Using HOMER Pro. Int. J. Recent Technol. Eng. 2020, 9, 502–505. [Google Scholar] [CrossRef]
  32. Al-Addous, M.; Al Hmidan, S.; Jaradat, M.; Alasis, E.; Barbana, N. Potential and Feasibility Study of Hybrid Wind-Hydroelectric Power System with Water-Pumping Storage: Jordan as a Case Study. Appl. Sci. 2020, 10, 3332. [Google Scholar] [CrossRef]
  33. Lugauer, F.J.; Kainz, J.; Gehlich, E.; Gaderer, M. Roadmap to Profitability for a Speed-Controlled Micro-Hydro Storage System Using Pumps as Turbines. Sustainability 2022, 1, 653. [Google Scholar] [CrossRef]
  34. Al-Masri, H.M.K.; Magableh, S.K.; Abuelrub, A.; Alzaareer, K. Realistic Coordination and Sizing of a Solar Array Combined with Pumped Hydro Storage System. J. Energy Storage 2021, 41, 102915. [Google Scholar] [CrossRef]
  35. Makhdoomi, S.; Askarzadeh, A. Techno-Enviro-Economic Feasibility Assessment of an off-Grid Hybrid Energy System with/without Solar Tracker Considering Pumped Hydro Storage and Battery. IET Renew. Power Gener. 2023, 17, 1194–1211. [Google Scholar] [CrossRef]
  36. Bhayo, B.A.; Al-Kayiem, H.H.; Gilani, S.I.U.; Ismail, F.B. Power Management Optimization of Hybrid Solar Photovoltaic-Battery Integrated with Pumped-Hydro-Storage System for Standalone Electricity Generation. Energy Convers. Manag. 2020, 215, 112942. [Google Scholar] [CrossRef]
  37. Al-Masri, H.M.K.; Magableh, S.K.; Abuelrub, A.; Saadeh, O.; Ehsani, M. Impact of Different Photovoltaic Models on the Design of a Combined Solar Array and Pumped Hydro Storage System. Appl. Sci. 2020, 10, 3650. [Google Scholar] [CrossRef]
  38. Yimen, N.; Hamandjoda, O.; Meva’a, L.; Ndzana, B.; Nganhou, J. Analyzing of a Photovoltaic/Wind/Biogas/Pumped-Hydro off-Grid Hybrid System for Rural Electrification in Sub-Saharan Africa—Case Study of Djoundé in Northern Cameroon. Energies 2018, 11, 2644. [Google Scholar] [CrossRef]
  39. Agajie, T.F.; Fopah-Lele, A.; Ali, A.; Amoussou, I.; Khan, B.; Elsisi, M.; Mahela, O.P.; Álvarez, R.M.; Tanyi, E. Optimal Sizing and Power System Control of Hybrid Solar PV-Biogas Generator with Energy Storage System Power Plant. Sustainability 2023, 15, 5739. [Google Scholar] [CrossRef]
  40. Al-Masri, H.M.K.; Al-Quraan, A.; AbuElrub, A.; Ehsani, M. Optimal Coordination of Wind Power and Pumped Hydro Energy Storage. Energies 2019, 12, 4387. [Google Scholar] [CrossRef]
  41. Singh, N.K.; Koley, C.; Gope, S.; Dawn, S.; Ustun, T.S. An Economic Risk Analysis in Wind and Pumped Hydro Energy Storage Integrated Power System Using Meta-Heuristic Algorithm. Sustainability 2021, 13, 13542. [Google Scholar] [CrossRef]
  42. Basu, J.B.; Dawn, S.; Saha, P.K.; Chakraborty, M.R.; Ustun, T.S. Economic Enhancement of Wind-Thermal-Hydro System Considering Imbalance Cost in Deregulated Power Market. Sustainability 2022, 14, 15604. [Google Scholar] [CrossRef]
  43. Akour, S.N.; Al-Garalleh, A.A. Candidate Sites for Pumped Hydroelectric Energy Storage System in Jordan. Mod. Appl. Sci. 2019, 13, 116–131. [Google Scholar] [CrossRef]
  44. Jordan Valley Authority (JVA). Annual Report; 2022. Available online: https://mwi.gov.jo/ebv4.0/root_storage/ar/eb_list_page/%D8%A7%D9%84%D8%AA%D9%82%D8%B1%D9%8A%D8%B1_%D8%A7%D9%84%D8%B3%D9%86%D9%88%D9%8A_%D9%84%D8%B9%D8%A7%D9%85_2022_-_%D8%B3%D9%84%D8%B7%D8%A9_%D9%88%D8%A7%D8%AF%D9%8A_%D8%A7%D9%84%D8%A7%D8%B1%D8%AF%D9%86 (accessed on 14 January 2024).
  45. Ministry of Water and Irrigation. Available online: https://mwi.gov.jo/Default/Ar (accessed on 14 January 2024).
  46. Shaqour, A.; Farzaneh, H.; Almogdady, H. Day-ahead Residential Electricity Demand Response Model Based on Deep Neural Networks for Peak Demand Reduction in the Jordanian Power Sector. Appl. Sci. 2021, 11, 6626. [Google Scholar] [CrossRef]
  47. HPP-Design. Available online: https://hpp-design.com/ (accessed on 17 November 2023).
  48. Blank, L.; Tarquin, A. Engineering Economy, 7th ed.; McGraw-Hill: New York, NY, USA, 2017. [Google Scholar]
  49. Nelson, V.C.; Starcher, K. Introduction to Renewable Energy, 7th ed.; CRC Press: Boca Raton, FL, USA, 2015. [Google Scholar]
  50. Hammad, B.; Al-Sardeah, A.; Al-Abed, M.; Nijmeh, S.; Al-Ghandoor, A. Performance and Economic Comparison of Fixed and Tracking Photovoltaic Systems in Jordan. Renew. Sustain. Energy Rev. 2017, 80, 827–839. [Google Scholar] [CrossRef]
  51. Ministry of Environment and the United Nations Development Programme. Jordan’s Second Biennial Update Report (SBUR) Under The United Nations Framework Convention on Climate Change. Available online: https://unfccc.int/sites/default/files/resource/Jordan%E2%80%99s%20Second%20Biennial%20Update%20Report%20for%20web%2010-5.pdf (accessed on 15 December 2023).
  52. World Bank Jordan Data. Available online: https://data.worldbank.org/country/jordan?view=chart (accessed on 17 November 2023).
  53. Abgottspon, A.; Staubli, T.; Felix, D. Erosion of Pelton Buckets and Changes in Turbine Efficiency Measured in the HPP Fieschertal. IOP Conf. Ser. Earth Environ. Sci. 2016, 49, 122008. [Google Scholar] [CrossRef]
  54. Albatayneh, A.; Juaidi, A.; Abdallah, R.; Peña-Fernández, A.; Manzano-Agugliaro, F. Effect of the Subsidised Electrical Energy Tariff on the Residential Energy Consumption in Jordan. Energy Rep. 2022, 8, 893–903. [Google Scholar] [CrossRef]
  55. Albatayneh, A.; Juaidi, A.; Manzano-Agugliaro, F. The Negative Impact of Electrical Energy Subsidies on the Energy Consumption—Case Study from Jordan. Energies 2023, 16, 981. [Google Scholar] [CrossRef]
  56. CO2 Emission in Jordan. Available online: https://tradingeconomics.com/jordan/co2-emissions (accessed on 18 November 2023).
Figure 1. Schematic diagram of PHES proposed in this work. Water is pumped up by the off-grid PV station, and the load is driven by the turbine–generator–grid arrangement.
Sustainability 16 01357 g001
Figure 2. Schematic diagram of turbine–load–grid model in HOMER Pro® (Version 3.15.3).
Sustainability 16 01357 g002
Figure 3. Hourly water flow rate for each month, as taken from the input file in Homer Pro® (Version 3.15.3).
Sustainability 16 01357 g003
Figure 4. Energy imported from or exported to the electricity grid is taken from Homer Pro® (Version 3.15.3) when a 1 MW load is driven by the turbine for the King Talal site. The horizontal axis is the number of days in a year; the vertical axis is the number of hours in a day (it is noted that the turbine produced power between 8:00 PM and 11:00 PM only).
Sustainability 16 01357 g004
Figure 5. Type and size of turbines for the King Talal site obtained from HPP-design.
Sustainability 16 01357 g005
Figure 6. Annual sold energy ( A S E ) for the two scenarios of electricity tariff.
Sustainability 16 01357 g006
Figure 7. Annual operation and maintenance ( A O M ) cost throughout the lifespan of the investment.
Sustainability 16 01357 g007
Figure 8. Annual balance ( A B ) over the lifespan of the PHES system at the King Talal site for the two electricity tariff scenarios.
Sustainability 16 01357 g008
Figure 9. Electricity cost for the PHES system at the King Talal site over the lifespan of the project.
Sustainability 16 01357 g009
Figure 10. Annual CO2 emissions reduction over 30 years for the PHES system at the King Talal site.
Sustainability 16 01357 g010
Table 1. Dams in Jordan that passed selection criteria for potential PHES sites [43,44,45].
Dam
Name
Upper
Reservoir
Height
(m) [43]
Lower
Reservoir Height
(m) [43]
Distance between
Upper and Lower
Reservoirs
(m) [43]
Lower Reservoir Maximum
Capacity
(MCM *) [45]
Storage at the End of 2022 (MCM *) [44]Purpose [43,44,45]
Al-Walah645515550250.170Irrigation, drinking,
recharging ground water, industrial uses
King Talal38417913307521.546Irrigation, power generation
Al-Wehdah349846121105.534Irrigation, drinking
Wadi Al-Arab170−10090916.84.898Irrigation, drinking
Al-Tannur739390167014.73.381Irrigation,
recharging ground water, industrial uses
Al-Mujib707196255029.83.650Irrigation,
drinking, industrial uses
* MCM is million cubic meter.
Table 2. Average daily pumped water to the upper reservoir from PVsyst (Version 7.3.4) for the King Talal site.
MonthAverage Pumped Water (m3/day)
January4311
February5264
March6539
April6001
May7500
June8015
July8113
August7945
September7816
October6845
November5229
December4175
Average daily for all days in a year6486
Table 3. Annual output parameters obtained from PVsyst (Version 7.3.4) for the King Talal site.
ParameterValue
Energy at the output of the PV array1971 MWh
Energy at the input of the pump1776 MWh
Pump operating energy1347 MWh
PV system efficiency (DC at the array to AC at the pump)89.9%
Performance ratio (PR)79.1%
Pump efficiency75.9%
Water pumped to the upper reservoir2,367,309 m3
Table 4. Annual operating and output parameters obtained from Homer Pro® (Version 3.15.3) for the King Talal site.
ParameterValue
Operating hours of the turbine1095 h
Total energy required by the load1,095,000 kWh
Total energy production from the turbine1,070,460 kWh
Hydro penetration percentage97.8%
Total energy imported from the electricity grid113,465 kWh
Total energy exported to the electricity grid88,925 kWh
Net energy imported from the electricity grid24,540 kWh
Table 5. Itemized and initial costs for PHES at the King Talal site.
ComponentCost (USD)
PV station494,350 USD/MW
Pumps219,122
Turbine and generator167,000
Pipes for pumping and turbine systems430,920
Civil and labor210,000 USD/MW
Project management cost7700 USD/MW
Total initial cost1,529,092
Table 6. Financial metrics for the PHES system at the King Talal site.
Financial MetricValue for 1st Scenario *Value for 2nd Scenario *
NPVUSD 5,453,993 USD 8,401,047
IRR16.5%23.8%
SPP6.35 years4.40 years
CPP9.10 years5.61 years
*: The electricity tariff for the 1st scenario is 0.20 USD/kWh and 0.30 USD/kWh for the 2nd scenario.
Table 7. Main operating and output parameters from PVsyst (Version 7.3.4) for the potential sites.
ParameterAl-WalahKing TalalAl-WehdahWadi Al-ArabAl-Tannur
Head (m)130205265270349
Daily average pumped water (m3/day)10,5946486523349513282
Yearly water pumped (m3)3,866,6572,367,3091,909,8431,807,1031,197,778
Upper reservoir size (m3)83,00052,00034,00031,00020,000
Energy at PV array output (kWh)2,056,5851,975,9052,024,3421,971,6662,025,516
Energy at the pump input (kWh)1,907,5011,775,8001,839,9211,784,4851,723,284
Pump operating energy (kWh)1,413,0431,347,2131,386,4641,338,0681,144,085
PV system efficiency (%)92.889.990.990.585.1
Performance Ratio (PR) (%)81.879.179.979.573.8
Pump efficiency (%)74.175.975.475.066.4
Table 8. Main operating and output parameters from Homer Pro® (Version 3.15.3) and HPP-design for potential sites.
ParameterAl-WalahKing TalalAl-WehdahWadi Al-ArabAl-Tannur
Head (m)130205265270349
Design flow rate (L/s)980.9600.6484.5458.4303.9
Maximum flow rate * (L/s)1149.8751.2580.8562.5352.7
Energy production from turbine (kWh/yr)1,108,8021,070,4601,115,8871,075,371920,701
Energy imported from grid (kWh/yr)76,632113,46575,412109,621174,299
Energy exported to grid (kWh/yr)90,43588,92596,29989,9920
Hydro penetration (%)101.397.8101.998.284.1
Best turbine typePelton/FrancisPelton/FrancisPeltonPeltonPelton
* Maximum flow rate occurs in July for all sites.
Table 9. Financial metrics for PHES systems at all sites (*: electricity cost for the 1st year of the project’s lifespan. In the 1st and 2nd scenarios, the electricity tariff is 0.20 and 0.30 USD/kWh, respectively).
Parameter Al-WalahKing TalalAl-WehdahWadi Al-ArabAl-Tannur
Initial Cost (USD) 1,368,6441,529,0921,286,7771,369,4871,552,869
NPV (USD)1st scenario5,711,2915,453,9935,773,8665,526,9734,622,555
2nd scenario8,763,9038,401,0478,845,9848,487,5477,157,311
IRR (%)1st scenario18.816.520.018.314.1
2nd scenario27.123.828.926.420.5
SPP (years)1st scenario5.596.355.225.777.34
2nd scenario3.884.403.624.005.10
CPP (years)1st scenario7.579.107.077.9111.11
2nd scenario4.775.614.384.966.82
AUP (USD) 81,36490,90376,49781,41492,316
Electricity cost * (USD/kWh) 0.0860.0990.0800.0880.117
Table 10. CO2 emissions reduction for all potential sites in this study.
ParameterAl-WalahKing TalalAl-WehdahWadi Al-ArabAl-Tannur
1st yearEnergy from PV panels (kWh)1,907,5011,775,8001,839,9211,784,4851,723,284
Energy from turbines (kWh)1,108,8021,070,4601,115,8871,075,371920,701
Total energy generated (kWh)3,016,3032,846,2602,955,8082,859,8562,643,985
Total CO2 emissions (metric tons)13831305135513111212
30 yearsEnergy from PV panels (kWh)54,026,61250,296,41352,112,52850,542,40048,808,990
Energy from turbines (kWh)31,856,78130,755,18432,060,33930,896,28126,452,487
Total energy generated (kWh)85,883,39381,051,59784,172,86781,438,68175,261,477
Total CO2 emissions (metric tons)39,37837,16238,59337,34034,507
Disclaimer/Publisher’s Note: The statements, opinions and data contained in all publications are solely those of the individual author(s) and contributor(s) and not of MDPI and/or the editor(s). MDPI and/or the editor(s) disclaim responsibility for any injury to people or property resulting from any ideas, methods, instructions or products referred to in the content.

