Abstract
The integration of the digital economy with the real economy has facilitated the application of a variety of digital methods in agriculture, resulting in significant reductions in its carbon intensity. This study employs a spatial Durbin model to analyze the spatiotemporal effects of digital economic growth on agricultural carbon emissions, using Chinese inter-provincial panel data spanning from 2011 to 2020. The empirical results indicate a substantial decline in agricultural carbon emissions associated with the evolution of the digital economy. Additionally, a discernible spatial spillover effect is identified. The suppressive impact of the digital economy on agricultural carbon emission intensity exhibits clear heterogeneity, with more pronounced effects observed in the main grain-producing regions and western regions. Based on these findings, recommendations are proposed to accelerate the development of digital economy infrastructure tailored to local conditions, promote the integration of digital technology and agriculture, stimulate innovation in agricultural science and technology, and advocate for the adoption of energy-efficient and environmentally sustainable agricultural practices.
1. Introduction
Agriculture in China originated during the Neolithic period and evolved in the Yellow River and Yangtze River basins. China is recognized as the world’s largest agricultural country. Agriculture holds a pivotal role in its national economy, serving as its foundation. However, it is important to note that this sector also contributes significantly to greenhouse gas emissions. Roughly 16% of China’s total greenhouse gas emissions are believed to be associated with carbon emissions from agricultural production activities [1]. Addressing the regulation of carbon emissions in agriculture has become an urgent matter. In June 2022, the Ministry of Agriculture and Rural Affairs and the National Development and Reform Commission launched the “Implementation Program for Emission Reduction and Carbon Sequestration in Agriculture and Rural Areas”, which aims to reduce the intensity of greenhouse gas emissions. Unlike the secondary and tertiary industries, agricultural production is inherently dual-faceted, as it emits high levels of carbon while also possessing a significant carbon absorption capacity [2]. This indicates that agricultural production has the potential to become a vital driver in achieving the objectives of “carbon peaking and carbon neutrality”.
Presently, amid the ongoing scientific and technological revolution driven by digital technology, the continuous integration of digital elements into agriculture has emerged as a pivotal direction for advancing agricultural greening. By 2022, China’s agricultural digital economy penetration rate reached 10.5 percent, reflecting a year-on-year increase of 0.4 percentage points [3]. Through the continuous enhancement of digital infrastructure, agricultural production and operational methods have undergone a transformation facilitated by the integration of data elements [4], resulting in improved agricultural production efficiency. The application of digital technology in agricultural production and management has significantly empowered the advancement of agricultural production technology, resulting in a multiplier effect on the original production factor inputs [5], reducing the usage of chemical fertilizers, pesticides, and other production factors, and promoting green and low-carbon developments in agriculture [6]. Through initiatives such as “Broadband China” and “Digital Countryside”, data obtained through decentralized operations, integration, and sharing of digital information has become crucial for producers and farmers, impacting access to information, efficiency, and external sales in modern agricultural practices. Ultimately, the integration of data into agricultural production has demonstrated remarkable growth [7]. Undoubtedly, the integration of the digital economy into the production and management processes of the agricultural sector can drive significant industrial upgrades and foster technological innovation, enhancing the sophistication and intelligence of agricultural production. However, the primary focus of this paper is to examine whether the agricultural industry’s upgrading—driven by the digital economy—can yield a “green effect”, facilitating the realization of sustainable, environmentally friendly, and low-carbon emission agricultural practices.
The main contribution of this paper is to construct an analytical framework for examining the impact of the digital economy on the green and low-carbon development of agriculture, and to investigate the inhibitory effect of digital economic development on carbon emissions in the agricultural industry. In the empirical analysis, we implement the following strategies: (1) Constructing an evaluation system to assess the development status of the digital economy, comprehensively evaluating China’s digital economy development, and calculating agricultural carbon emission intensity. (2) Employing the spatial Durbin model to investigate the spatio-temporal impact of digital economic development on agricultural carbon emission intensity, and empirically validating its potential to foster environmentally friendly agriculture.
2. Literature Review
Tapscott introduced the concept of the “digital economy” in 1996, which has subsequently ignited substantial scholarly interest. Extensive research in this field has encompassed the connotation of the digital economy, measurement methodologies, the evolution of legal frameworks, and the wide-ranging impacts it has generated. On the mainstream front, the definition of the digital economy can be broadly classified into two primary directions. One perspective posits that the essence of the digital economy is rooted in e-commerce, encompassing digital services and goods [8]. Conversely, the alternative viewpoint asserts that the digital economy should not be confined solely to digital services and goods, but should encompass all types of digitized information, including services and products beyond e-commerce [9]. In summary, the digital economy embodies an innovative economic model that leverages digital technology to drive economic growth, enhance the efficiency of various sectors, and utilizes digital data as a foundational element for bolstering productivity and fueling overall economic advancement [10].
In 2008, Wang Yun [11] proposed the concept of the low-carbon agricultural economy and constructed a prototype of low-carbon agriculture characterized by “low emissions and high returns”. Luo [12] further expanded upon this concept, emphasizing the importance of minimizing agricultural production consumption and achieving low carbon emissions across all dimensions of the agricultural economy. During the process of elucidating the concept of low-carbon agriculture, scholars have undertaken scientific and rigorous research on the measurement of carbon emissions in agriculture. This research encompasses various factors, including agricultural land use, crop cultivation, animal husbandry, poultry farming, and carbon emissions from fishing activities [13,14,15,16]. Importantly, different variables and policies have distinct effects on mitigating agricultural carbon emissions, and the implementation of green agricultural practices [17] and carbon trading mechanisms [18] holds significant potential in curtailing such emissions.
The correlation between the digital economy and agricultural development has been extensively examined in scholarly works. Certain scholars have conducted thorough analyses of the potential for the development of the rural digital economy. They have delved into how the digital economy can empower high-quality agriculture and scrutinized its driving mechanisms [19,20]. Digital rural construction can significantly enhance economies of scale, transform the crude operational mode, address issues related to operational decentralization, and serve as a catalyst for advancing the overall factor productivity of agricultural sustainability [21]. Currently, the level of co-ordination between digital village construction and agricultural green development is progressing steadily, exhibiting pronounced spatial heterogeneity and following the developmental trend of “east high and west low” [22]. The development of the digital economy has led to the widespread adoption of digital technology in agricultural production. The application of digital technology can reshape the conceptual framework and developmental approach of agriculture. It facilitates the judicious use of chemical fertilizers and pesticides, prevents land resource pollution [23], enhances the utilization rate and quality of resource elements in agricultural development [24], fortifies the digital skills and cultural literacy of farmers, bolsters the resilience of agricultural development, and improves risk mitigation capabilities [25]. In essence, the development of the digital economy, through the integration of big data into agricultural resources and the environment, brings about these transformative effects. In the utilization of agricultural resources and the environment, big data technology achieves precise control, quality assurance, and safety traceability in the utilization of crop land resources. Leveraging its technological advancement, extensive application, and environmental friendliness, big data has fundamentally reshaped the energy utilization pattern, heightened overall energy efficiency, and catalyzed the establishment of a green and low-carbon agricultural industry chain [26].
Since its inception, the digital economy has garnered significant attention, with research encompassing its essence, measurement methods, legal frameworks, and the broad impacts it generates. Alongside the promotion of the green and low-carbon concept, low-carbon agriculture has entered the scholars’ field of vision. In essence, low-carbon agriculture advocates for achieving low-carbon production in all dimensions of agricultural production, consumption, and agricultural economics, based on the comprehensive calculation of agricultural carbon emissions. Faced with the requirements of carbon reduction across the entire industry chain, the development of the digital economy has provided opportunities for digital technology penetration in low-carbon agriculture. The integration of big data with agriculture has become a transformative force within the digital economy, reshaping the conceptual framework and development mode of agriculture. This integration helps in the wise use of resources, pollution prevention, and the enhancement of farmers’ digital skills. The technological advancements in big data fundamentally reshape the patterns of energy utilization, improve overall efficiency, and catalyze the establishment of a green and low-carbon agricultural industry chain. In conclusion, the development of the digital economy presents opportunities for the green development of agriculture.
3. Research Hypothesis
3.1. The Impact of the Development of the Digital Economy on the Carbon Emissions of Agriculture
There are two main ways to achieve carbon emission reductions in the agricultural sector. One is to optimize the ratio of input factors and the other is to improve the efficiency of factory utilization. Both methods rely on technological innovation [27]. The development of the digital economy stems from the rapid development of the internet. It regards data as a production factor and uses big data technology to construct digital models to optimize existing industries. Data are characterized by replicability, shareability, unlimited growth and supply, and high permeability. These characteristics enable data to break through geographical restrictions and penetrate all stages and aspects of agricultural production, giving rise to the emergence of “smart agriculture” and “digital agriculture”. This has greatly facilitated the allocation of resources in all aspects of agricultural production, processing, and marketing, thereby maximizing the utilization of factors of production. The digital economy has empowered the agricultural sector to harness the potential of blockchain, drones, smart networks, and other underlying technologies. By integrating data elements with traditional factors of production, it enables precise control of agricultural resource allocation in the process of agricultural industry management. This will promote the high-quality development of agriculture, reduce the input of agricultural factors per unit of arable land, and realize the goal of emission reduction and carbon reduction. In addition, the “high permeability” of the digital economy promotes the enhanced inter-regional mobility of agricultural production factors, thus promoting the construction of rural infrastructure and the integrated development of urban and rural areas.
Hypothesis 1 (H1).
The digital economy can effectively curb the intensity of agricultural carbon emissions and has spatial spillover effects.
3.2. Heterogeneity of the Digital Economy on Carbon Emissions in Agriculture
In recent years, the outbreak of pandemics and the rise of anti-globalization sentiments have brought renewed attention to the issues of “arable land red lines” and “food security”. Major food-producing regions have to make substantial investments in agricultural machinery and agrochemicals to meet the high demand for food, which may exacerbate agricultural carbon emissions. Furthermore, the functioning and development of the agricultural economy is severely constrained by geographical and natural factors. Agricultural industries in major food-producing regions are more concentrated than those in non-food-producing regions, resulting in higher levels of carbon emissions per unit of agricultural area [28]. Moreover, the progress of the digital economy is closely related to regional economic development. Regions with higher levels of economic development tend to have a more comprehensive integration of the digital economy with local industries, while regions with weaker economic development struggle to fully integrate the digital economy, leading to a less effective integration. Consequently, the differences between provinces in terms of geographic location, resource endowment, and economic environment significantly constrain the impact of digital economy development on agricultural carbon emissions.
Hypothesis 2 (H2).
The impact of digital economy development on agricultural carbon emissions varies across provinces due to variations in resource endowments.
4. Research Methods and Models
4.1. Variable Description
4.1.1. Explained Variable
The Index of Agricultural Carbon Emissions Intensity. The agricultural carbon emission intensity index was chosen as an explanatory variable due to its lack of correlation with economic growth, in accordance with Yan [29] perspective. The calculation formula for this index is as follows:
where is the total carbon emissions from agriculture, while denotes the gross agricultural product calculated based on the value added of the primary industry.
This study utilizes the methodology recommended by the United Nations Intergovernmental Panel on Climate Change (IPCC) Guidelines for National Greenhouse Gas Inventories 2006 to calculate agricultural carbon emissions resulting from the use of agricultural materials in agricultural production, with a primary focus on plantation farming. Drawing on the study conducted by Ding [30], carbon emissions were measured from six aspects: agricultural diesel, fertilizers, pesticides, agricultural films, irrigation, and tilling. The carbon emission estimation formula is:
The specific emission factors are as follows Table 1 shown:

Table 1.
Carbon sources and coefficients of agricultural carbon emissions.
4.1.2. Core Explanatory Variable
The entropy method, as described by Wang [34], and Wei [35], was employed to measure the development of the digital economy in 31 provinces, municipalities, and autonomous regions in China, excluding Taiwan, Hong Kong, and Macao. The data in this study were calculated using the calculation method proposed by Guo et al., 2022 [36]. All indicators selected in this paper are positive, and the formula for standardizing these positive indicators is as follows:
Compute the weight of indicator in year using the formula:
Calculate the entropy of the indicator as follows:
Then, compute the redundancy of the information entropy as follows:
Determine the weights of the indicators using the following formula:
After obtaining the weight of the indicator in the system, the score of the indicator in year is:
Comprehensive level score for year :
where represents the value of the evaluation indicator in the i year, and Formula (3) denotes the maximum and minimum values of the evaluation indicator system across all years, respectively. Here, stands for the number of evaluation years, and denotes the number of indicators.
The established index system and its corresponding weights for the digital economy are presented in Table 2.
Table 2.
Evaluation index system of comprehensive development level of the digital economy.
4.1.3. Control Variable
Considering that agricultural carbon emissions are influenced by a variety of factors, the study selected Industrial structure [37], Intensity of financial support to agriculture [4], Input intensity of agrochemicals [38], and Water reservoir capacity [39] as control variables. These selected indicators specifically aim to reflect agricultural development and economic and social conditions.
Table 3 shows the results of the descriptive statistical analysis of specific variables.
Table 3.
Descriptive statistics of variables.
4.2. Data Source
The data used in this paper cover a time span from 2011 to 2020 and encompass 31 provinces (autonomous regions, and municipalities) across mainland China, excluding Tibet, Taiwan, Hong Kong, and Macao. The data sources include the China Statistical Yearbook, China Agricultural Statistical Yearbook, National Bureau of Statistics, provincial statistical yearbooks, EPS data platform, Ali Research Institute report, and Peking University Digital Inclusive Finance Index. Missing data points were interpolated using a linear interpolation method.
4.3. Model Design and Spatial Correlation Test
4.3.1. Model Setup
To address the research question, a two-way fixed-effect model is constructed to investigate the impact of digital economic development on the intensity of agricultural carbon emissions. The following baseline model is specified as follows:
Among them, is the explained variable representing the intensity of agricultural carbon emissions, while represents the core explanatory variable for the level of development of the digital economy; refers to the set of control variables; denotes the individual fixed effect of the province that remains constant over time; controls for the time fixed effect; and represents the randomized disturbance term.
Construction of a spatial measurement model based on the baseline model.
To quantitatively examine the spatial effect of digital economic development on agricultural carbon emissions and address the bias in traditional non-spatial models, an econometric model is adopted from a spatial perspective to empirically investigate the impact of digital economic development on the intensity of agricultural carbon emissions. Additionally, a logarithmic transformation is applied to certain variables to eliminate any potential connotation differences between indicators. The construction of the spatial panel model is undertaken as follows:
There are three main forms of spatial panel modeling [40]:
Spatial error modeling:
Spatial lag modeling:
The Spatial Durbin Model:
Given that the cross-sectional dimension of each province and city is denoted as , and the time dimension is denoted as . represents the spatial autoregressive coefficients, represents the spatial weight matrix, while and denote the province effect and time effect, respectively. Additionally, represents the random perturbation term.
To ascertain the appropriateness of utilizing the model in the subsequent empirical study, additional tests will be conducted.
4.3.2. Spatial Correlation Test
To evaluate the suitability of employing the spatial measurement model, this study utilized the global autocorrelation coefficient known as Moran’s I to demonstrate the spatial correlation of agricultural carbon emissions intensity among provinces and cities. The range of Moran’s I index is from −1 to 1, and the closer the value is to 1, the stronger the spatial correlation becomes. The calculation formula is as follows:
The variable represents the total number of provinces, while and denote the agricultural carbon intensity of province and province , correspondingly. Additionally, indicates the economic distance weighting matrix.
5. Results and Discussion
5.1. Advancements in the Digital Economy and Spatiotemporal Patterns of Carbon Emission Intensity in Agriculture
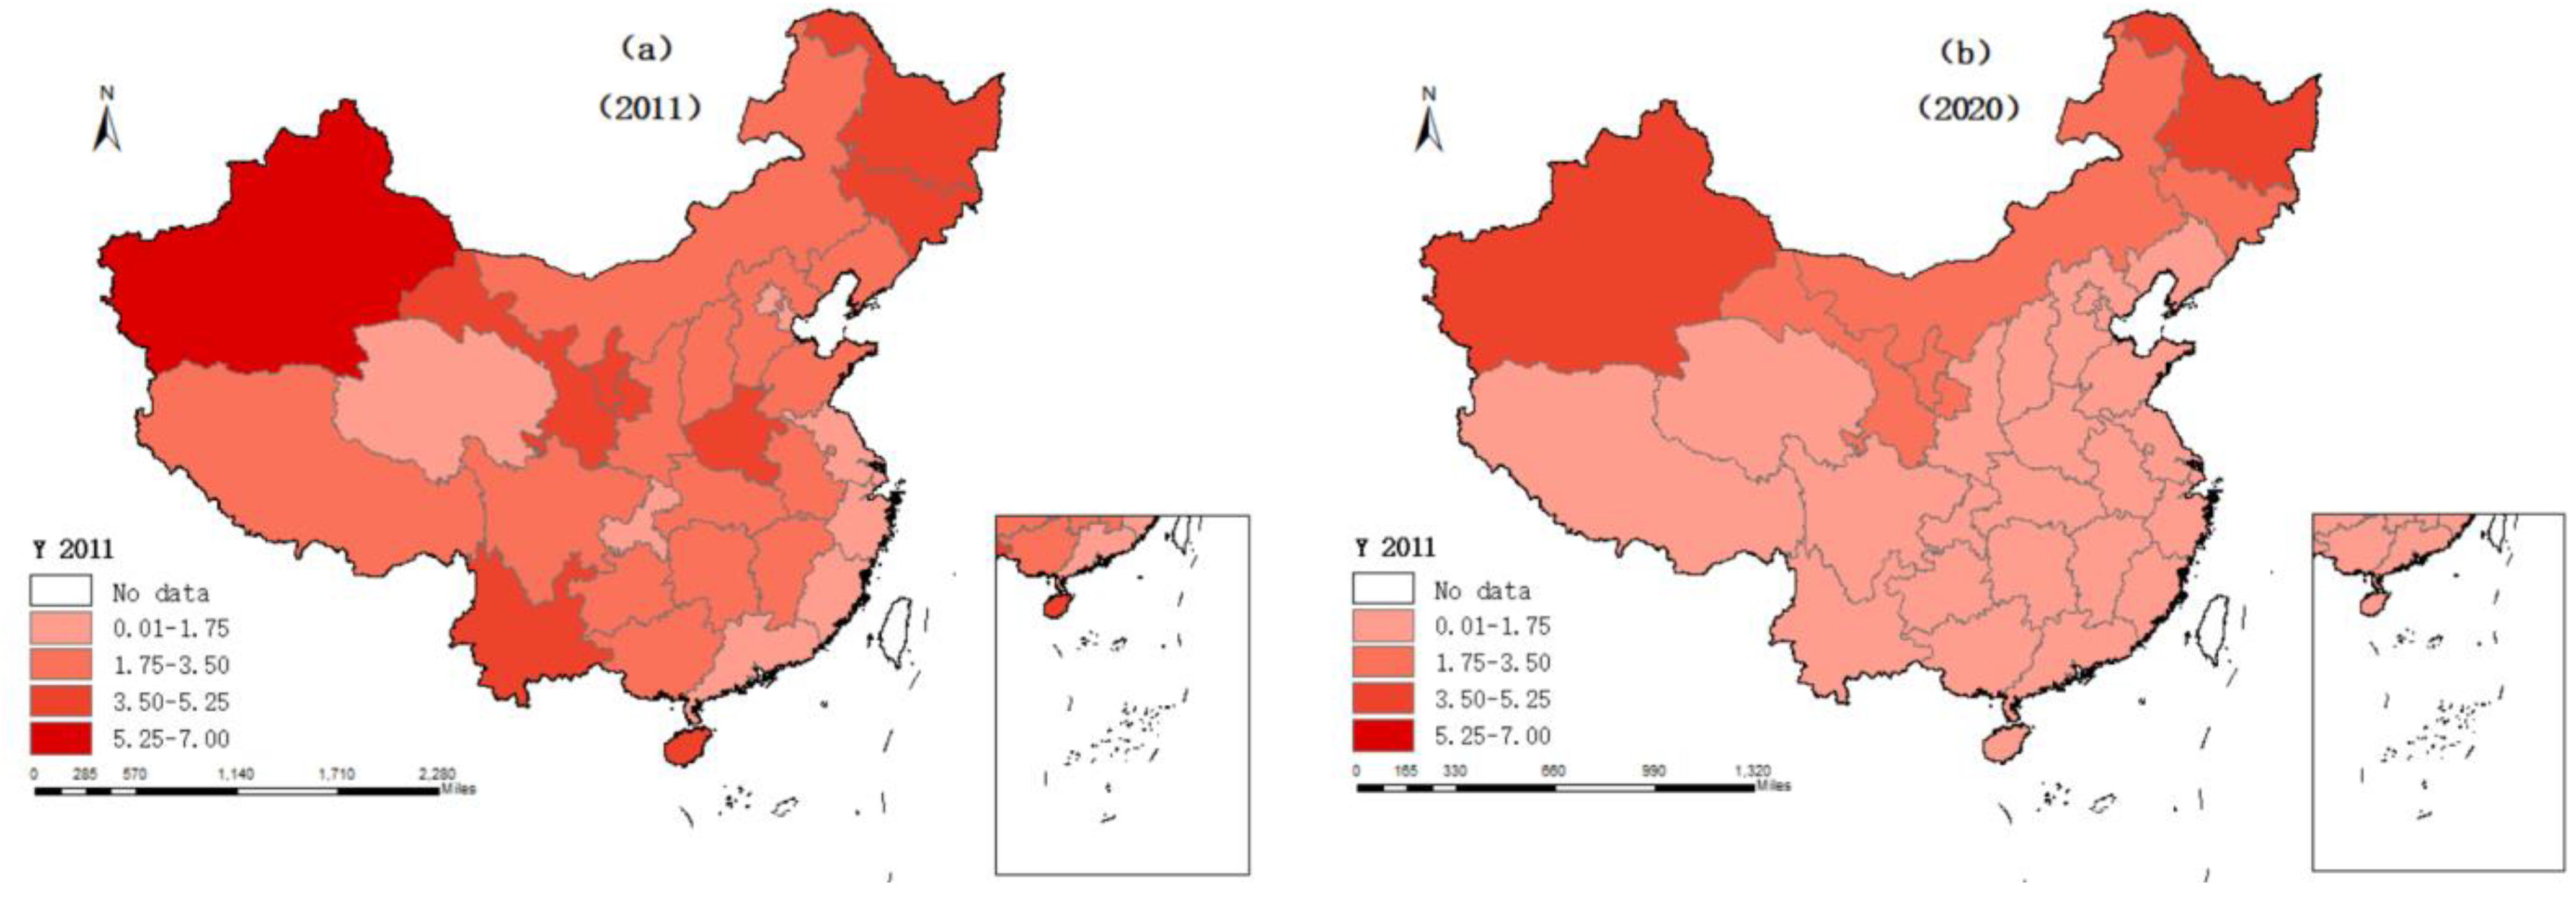
To more intuitively capture the spatial and temporal evolution characteristics of agricultural carbon emission intensity, this study employs the collected data and designates two temporal benchmarks, 2011 and 2020. Based on the agricultural carbon emission intensity values in each province and city (autonomous region), the intensity is stratified into four distinct tiers using the natural breakpoint method. The resultant spatial and temporal distribution of agricultural carbon intensity is depicted in Figure 1.

Figure 1.
Temporal and spatial evolution pattern of CE intensity in 2011 (a), 2020 (b).
As depicted in Figure 1, there has been a substantial decrease in China’s agricultural carbon intensity over the past decade. By 2020, the intensity of agricultural carbon emissions in the majority of regions is expected to dip below the 1.75 threshold.
From the Moran’s I index in Table 4, it is evident that the Moran’s I index for the intensity of agricultural carbon emissions in all provinces and cities during the sample year is significantly positive at the 1% significance level. This finding suggests a robust spatial correlation in the intensity of agricultural carbon emissions across all provinces throughout the observation period.
Table 4.
Moran’s index value of CE intensity of Chinese cities.
Generating the localized Moran scatterplot helps to visualize the spatial distribution of agricultural carbon intensity in 2020. As depicted in Figure 2, the Moran index values for agricultural carbon emission intensity in each province and city predominantly cluster in quadrants 1 and 3, indicating the presence of high–high and low–low aggregation patterns. This suggests that China’s agricultural carbon emissions demonstrate pronounced local spatial clustering characteristics within the economic realm.
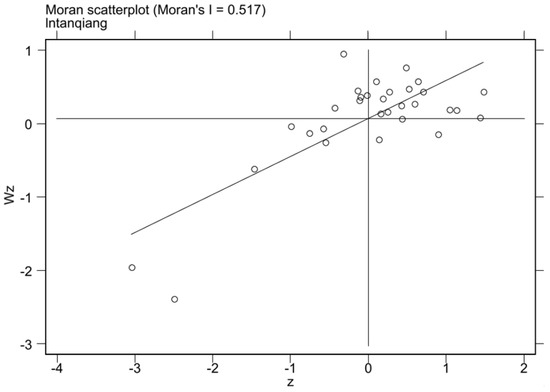
Figure 2.
Scatterplot of Moran’s Index of Carbon Emission Intensity in 2020.
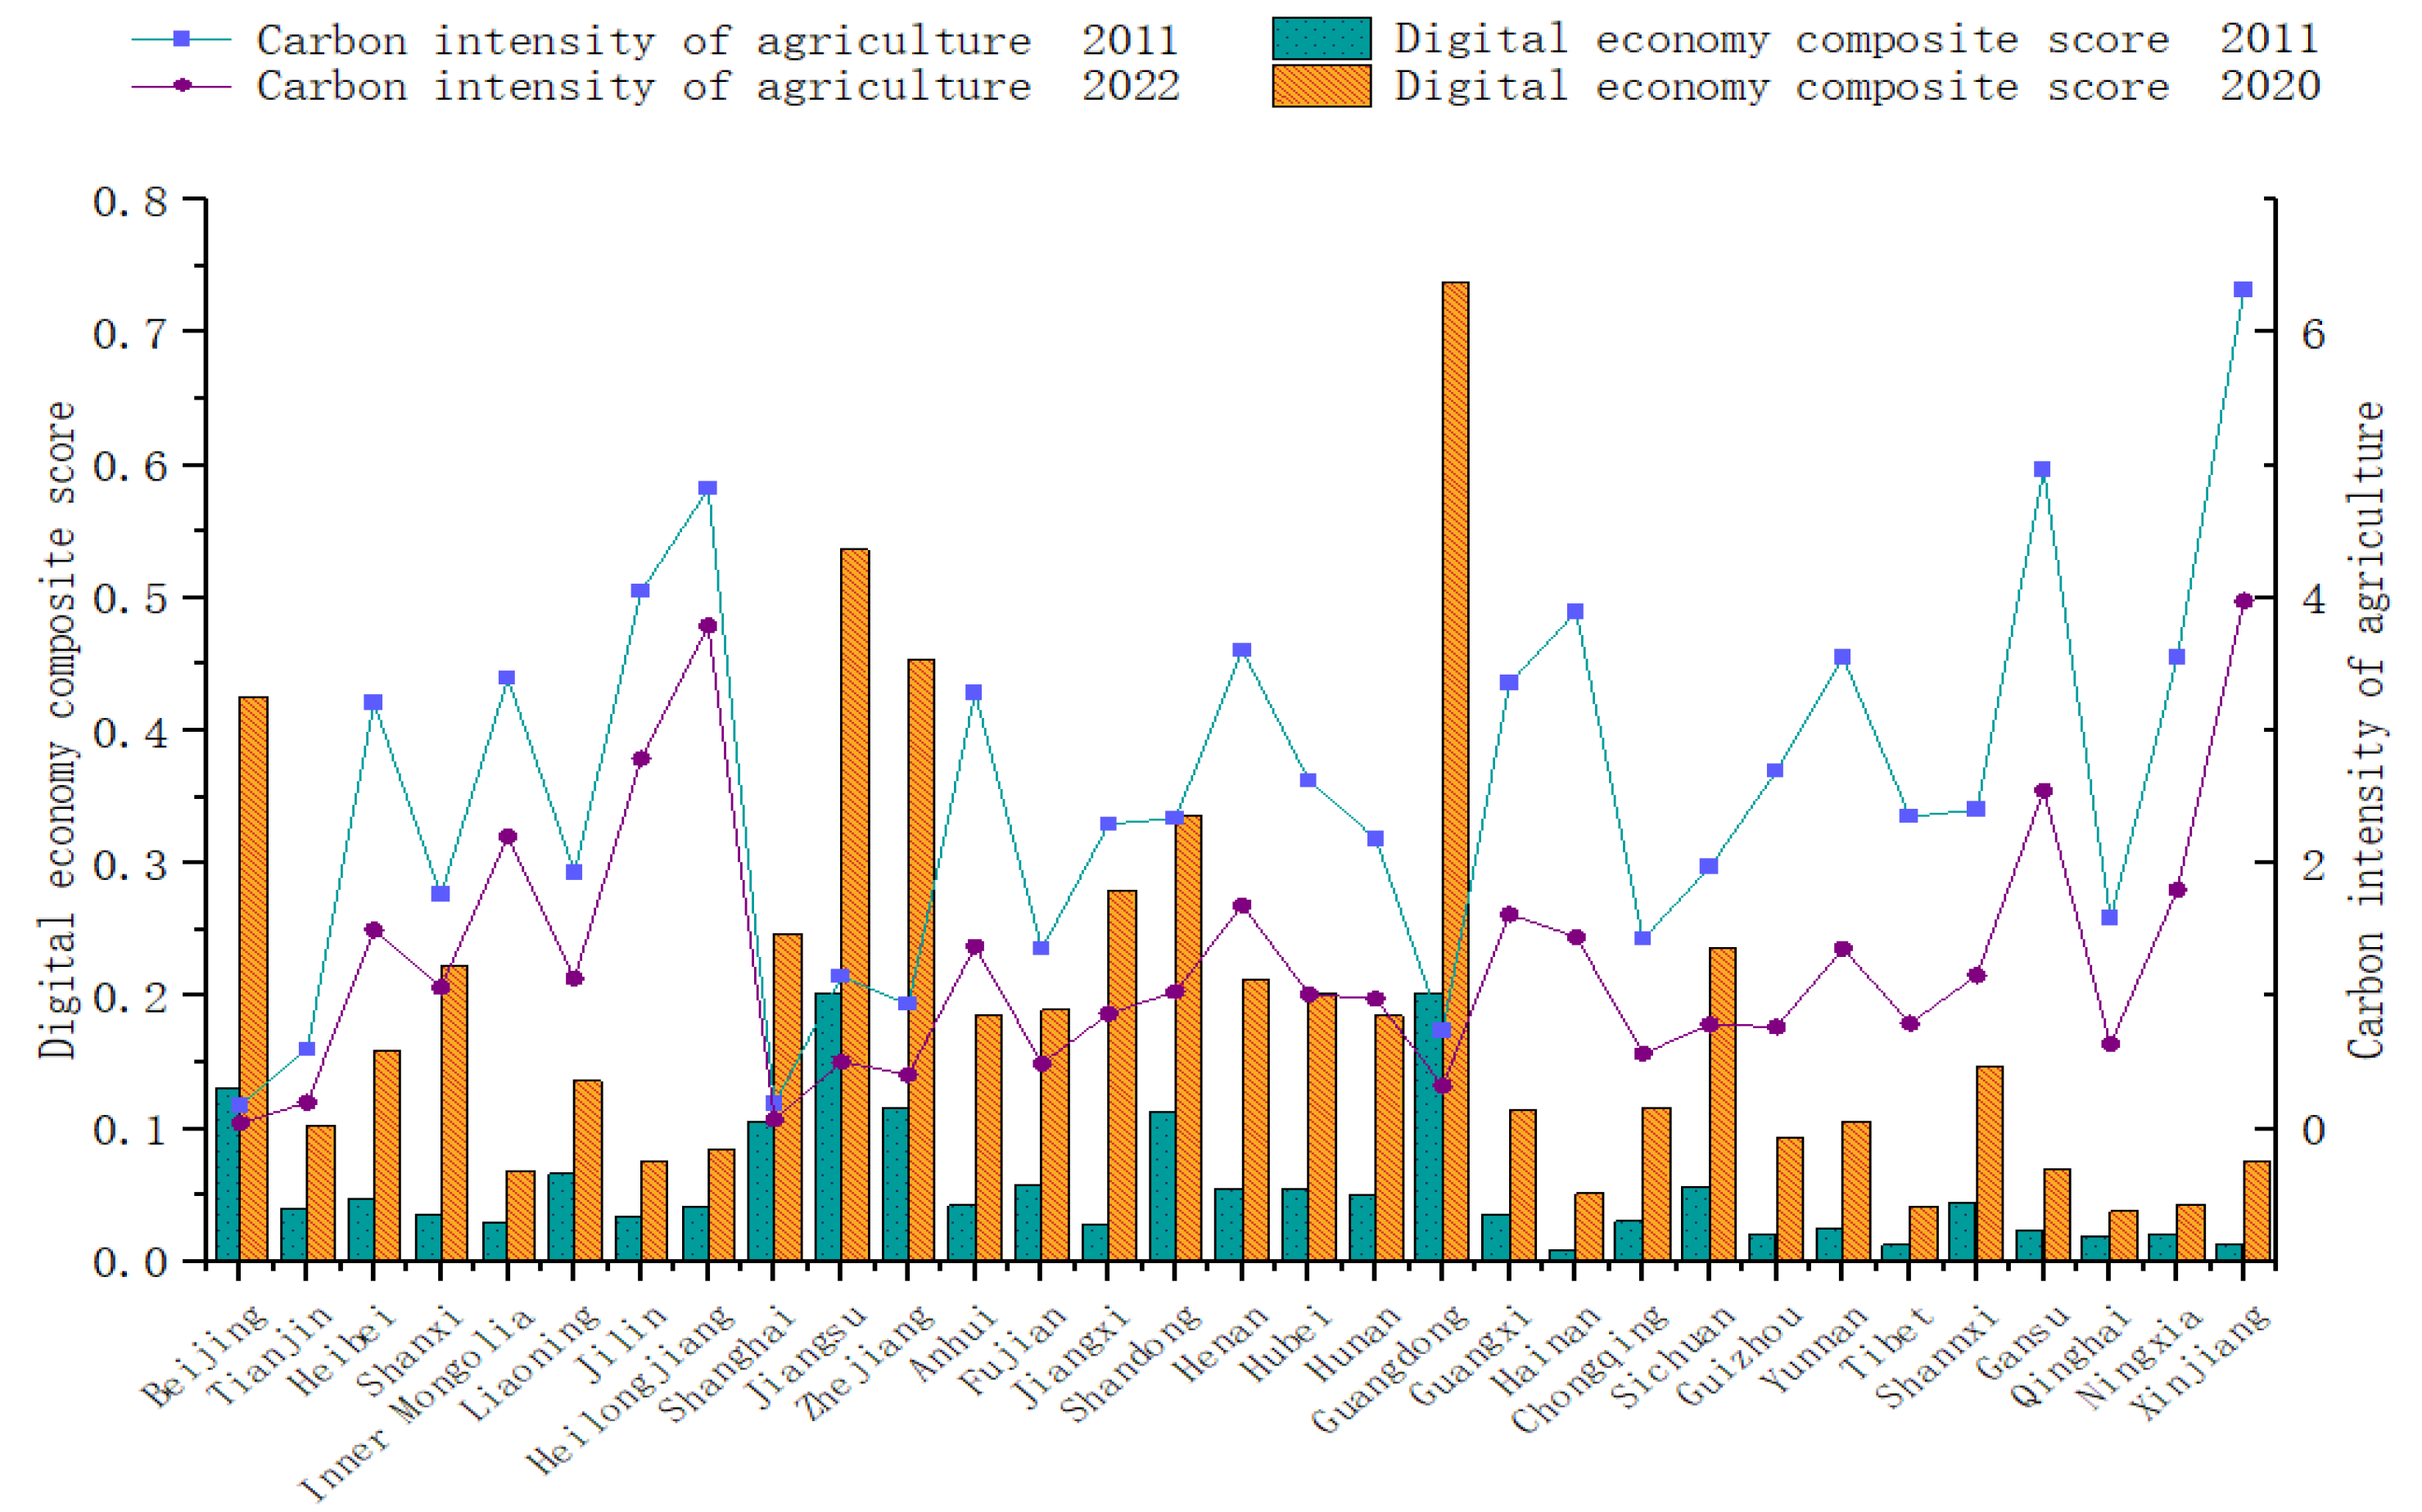
Utilizing the aforementioned constructed digital economy indicator system, the comprehensive digital economy score for each province and city (autonomous region) is computed. The development level of the digital economy in provinces, autonomous regions, and municipalities from 2011 to 2020 is depicted in Figure 3. It can be observed that the development level shows significant variations across different regions and years, but it demonstrates an overall upward trend.

Figure 3.
Digital economy composite score and agricultural carbon intensity.
5.2. Influence of Digital Economy Development on Carbon Intensity in Agriculture
5.2.1. Spatial Measurement Model Selection
In this paper, Stata 15.1 software is used to conduct various tests, including the Hausman test, LM test, and LR test, to identify the most appropriate model among the three spatial econometric models formulated. The results of these tests are presented in Table 5, which indicates that the spatial lag model surpasses the 1% significance threshold, indicating its superiority. Additionally, the Hausman test produces a p-value of 0.000, supporting the adoption of the fixed-effect model. Since there is a possibility of the spatial Durbin model deteriorating into either a spatial error model or a spatial lag model, both the LR test and the Wald test are utilized to evaluate the model. The outcomes demonstrate that the spatial Durbin model is superior, with significance at the 1% level, leading to the selection of the fixed-effect spatial Durbin model for regression analysis.
Table 5.
Model selection correlation test.
5.2.2. Analysis of Regression Results
The results of the basic and spatial econometric regressions are shown in Table 6. The regression analysis shows that in the basic regression, the estimated coefficient of the digital economy on agricultural carbon emissions is −0.328, with a statistical significance level of 1%. These results indicate that the development of the digital economy has a substantial impact on reducing the intensity of agricultural carbon emissions. In the spatial Durbin model, the spatial autocorrelation coefficient is estimated to be 0.635 at a significance level of 1%. This indicates that there is a significant positive spatial correlation between provinces regarding agricultural carbon emission intensity. In terms of spatial dimension, the digital economy shows a reverse spatial transmission effect on agricultural carbon emission intensity. More specifically, the regression analysis demonstrates a significant negative relationship between the digital economy (DIG) and agricultural carbon emission intensity, with a regression coefficient of −1.073. As an emerging production factor, the digital economy optimizes the allocation of agricultural production resources and promotes the upgrading of the agricultural industrial structure on the production side; on the sales side, it builds a digital platform for the sale of agricultural products, stimulates the endogenous dynamics of the agricultural economy, significantly improves the utilization rate of resources, optimizes the allocation of input factors, and realizes the optimization of the entire agricultural production value chain. Therefore, it can effectively curb the intensity of agricultural carbon emissions.
Table 6.
Effect of the digital economy on carbon emission intensity of agriculture.
Industrial structure and reservoir capacity, as control variables, both have a significant negative impact on agricultural carbon emissions. Upgrading industrial structure is conducive to urban–rural integration, promotes coordinated regional development, enhances the flow of urban and rural resource factors, improves the utilization efficiency of agricultural waste, and effectively mitigates the intensity of agricultural carbon emissions. In addition, the reservoir capacity reflects the degree of farmland water conservancy construction, which is a fundamental requirement for realizing rural revitalization and accelerating agricultural modernization. Farmland water conservancy construction is conducive to the integration and co-ordination of the agricultural economy and ecological environment and promotes agricultural modernization [39]. Both the OLS model and the SDM model show that there is a significant positive correlation between the coefficients of the intensity of agricultural chemical inputs and agricultural carbon emissions. Since 2004, China’s grain output has achieved 12 consecutive increases, and the heavy use of agrochemicals, especially chemical fertilizers, has played a crucial role in driving this remarkable growth [28]. Excessive application of fertilizers is associated with surface runoff, causing environmental pollution and significant carbon emissions [41]. The limited level of financial support for agriculture may be due to the fact that the government prefers objectives with long-term strategic or economic value when allocating financial assistance [42]. In addition, financial support for agriculture in China currently faces structural challenges that hinder its ability to have an ecological impact [43].
5.2.3. Spatial Spillover Analysis
The spatial autocorrelation coefficients obtained in the previous section indicate a clear spatial relationship between the development of the digital economy and the intensity of agricultural carbon emissions. However, the regression coefficients obtained from the spatial Durbin model were unable to fully explain this quantitative relationship. Therefore, it is necessary to conduct further analysis to examine the impact of the digital economy on the intensity of agricultural carbon emissions. The specific conclusions are presented in Table 7. The results of the effect decomposition analysis reveal that both the direct and indirect effects have a significant negative impact. This suggests that the development of the digital economy in our province and neighboring provinces has a significant inhibitory effect on the intensity of agricultural carbon emissions in our province, accompanied by spatial spillover effects, thereby confirming Hypothesis 1. Compared to the direct effect, the indirect effect resulting from the development of the digital economy is more prominent, exhibiting an evident phenomenon of industrial agglomeration and a negative spatial spillover effect. This may be attributed to the digital economic infrastructure, which facilitates the cross-regional circulation and transfer of factors in the agricultural industry, resulting in changes in the agricultural industry in the neighboring areas, thereby reducing agricultural carbon emissions per unit of output.
Table 7.
Influence effect.
According to the results of the analysis of control variables, the impact of digital economic development on the intensity of agricultural carbon emissions is primarily attributed to changes in the industrial structure and the construction of reservoirs. In recent years, the Chinese government has actively implemented the “Three Rural Policies” to unlock the potential of the agricultural economy, in which the upgrading of the industrial structure serves as the cornerstone of this policy, while the construction of water conservancy facilities provides strong support for rural development. The combination of these two factors has guided the agricultural sector toward a more environmentally conscious trajectory. Under the pressure to ensure food security, agricultural production activities have become more concentrated, thereby exacerbating the issue of excessive fertilizer use. As the production scale expands, the emission of pollutants from fertilizers per unit of land area increases, resulting in an increase in the intensity of agricultural carbon emissions [28]. Additionally, the indirect effect of financial support for agriculture on the intensity of agricultural carbon emissions is also significant. This suggests that the reduction effect of carbon emissions resulting from financial support for agriculture primarily stems from neighboring provinces. This may be attributed to the fact that neighboring provinces’ agricultural support policies further optimize the structure of agricultural production, achieve a precise division of labor in agricultural production activities, fully leverage the comparative advantages of inter-provincial collaboration, and significantly enhance the efficiency of agricultural production in the region, thereby reducing the intensity of agricultural carbon emissions [44].
5.3. Heterogeneity Analysis
To examine the diverse effects of digital economic development on the carbon intensity of agriculture, a categorization method was employed to classify China’s 31 provinces into distinct perspectives. The provinces were categorized based on criteria including grain production capacity and the level of economic development. Initially, the Outline of the Medium- and Long-Term Plan for National Food Security (2008–2020) categorized the 31 provinces into main grain-producing areas, main marketing areas, and areas of balanced production and marketing based on differences in the positioning of agricultural production functions. To emphasize the impact of the “grain-oriented” grain production model on agricultural carbon emissions, this paper assigns the main marketing areas and the areas of balanced production and marketing to non-main grain-producing regions. Subsequently, considering economic development and policy implementation, the provinces were categorized into three subsamples: Developed economic region, Moderately Developed Economic region, and Underdeveloped economic region. This is shown in Table 8. Finally, a regression analysis was performed using a two-way fixed-effect model to examine the relationships in the survey.
Table 8.
Division of provinces.
5.3.1. Differential Impacts of Digital Economy Development on Agricultural Carbon Emissions in Different Functional Food Production Zones
The regression results for the main food-producing and non-food-producing regions are presented in Table 9. The regression coefficient of the digital economy on the intensity of agricultural carbon emissions in the main food-producing areas is −1.432, which is statistically significant. This suggests that the development of the digital economy can lead to a reduction in the intensity of agricultural carbon emissions in these regions. In contrast, the effect of the digital economy on the intensity of agricultural carbon emissions in non-main food-producing areas was not statistically significant, thereby supporting Hypothesis 2. The reason behind this phenomenon is that the development of the digital economy has infused new vitality into agricultural production. It has facilitated cross-regional integration and resource allocation, enhanced agricultural production efficiency, and enabled major food-producing regions to reduce the excessive use of agricultural materials while prioritizing food production.
Table 9.
Heterogeneity analysis of food production capacity.
5.3.2. Differential Impacts of Digital Economy Development on Agricultural Carbon Emissions in Different Regions of Economic Development
Table 10 presents the regression results for the eastern, central, and western regions. The table reveals that the development of the digital economy has significantly reduced the intensity of agricultural carbon emissions in the central and western regions, with regression coefficients of −0.493 and −1.335, respectively. However, it contributes to an increase in the intensity of agricultural carbon emissions in the eastern region, with a regression coefficient of 0.231. Additionally, all three regression results pass the test of significance, confirming the validity of Hypothesis 2. The rapid development of the digital economy in the eastern region has resulted in a “siphon effect”. However, the disorderly influx of a large amount of capital has led to an intensification of resource mismatches and has affected the intensity of agricultural carbon emissions [45]. In comparison to the western region, the central region has more favorable resource endowments. The development of the digital economy in the central region has moved beyond the initial stage and transitioned to the stage of gradual integration with the agricultural industry, thereby promoting the flow of resource factors in rural areas. However, due to the concentration of grain-producing provinces in the central region, challenges such as food security and the reduction of rural population have emerged, limiting the overall impact.
Table 10.
Regional heterogeneity analysis.
6. Conclusions and Policy Recommendations
Based on panel data from 31 provinces, municipalities, and autonomous regions in China spanning from 2011 to 2020, this study employs spatial econometric modeling to investigate the impact of inter-provincial digital economy development on agricultural carbon emission intensity. The conclusions are as follows:
- The level of the digital economy in provinces and cities has consistently been rising over the years, while the intensity of agricultural carbon emissions exhibits noticeable geographical clustering. Throughout the period from 2011 to 2020, the development of the digital economy has had a substantial inhibiting influence on the intensity of agricultural carbon emissions. Additionally, it demonstrates a significant spatial spillover effect, which means that the progress of the local digital economy can effectively restrict the intensity of agricultural carbon emissions in neighboring provinces.
- The influence of the digital economy on the intensity of agricultural carbon emissions varies. In the main grain-producing areas and the central and western regions, the digital economy has a significant inhibitory effect on agricultural carbon emissions. However, in non-main grain-producing areas, the inhibition of the digital economy on the intensity of agricultural carbon emissions lacks statistical significance. Surprisingly, in the eastern region, the digital economy not only fails to achieve the intended inhibitory effect, but it also increases the intensity of agricultural carbon emissions.
Based on the above conclusions, the following recommendations are made:
- 3.
- Capturing spatial differences and designing agricultural carbon reduction pathways. Given the current state of economic and social development between regions, it is imperative to prioritize emphasizing the scientific and practical nature of green and ecological development paths in the agricultural sector in each region. To ensure the development of their green agriculture-related industries, it is essential to provide the central and western regions, as the main food-producing areas, with the necessary resources. In the eastern region, establishing a sound factor flow mechanism is crucial to minimizing the undesirable involvement of capital in the agricultural industry and addressing the problem of resource mismatch. Additionally, considering the significant spatial spillover and homogeneous agglomeration of agricultural carbon emissions, adopting the development model of “linking cities into lines and provinces into surfaces” can drive the development of less-developed regions by leveraging advanced regions, co-ordinating the allocation of agricultural resources between regions, implementing scientific regulations on the use of agrochemicals and agricultural machinery, and reducing the average production cost per unit area and carbon emissions.
- 4.
- Implementing infrastructure to expand the application scenarios of the digital economy. To address the challenge of the “digital divide”, it is imperative to expedite the development and construction of digital economy infrastructure while enhancing support for underdeveloped regions such as Jilin, Heilongjiang, and Gansu. Emphasis will be placed on bolstering the construction of key infrastructure, including rural power grids, rural gigabit networks, mobile Internet of Things, and fifth-generation mobile communications. The establishment of a “digital-networked-intelligent” framework will facilitate a new paradigm in agricultural development. This includes expanding the application of agricultural and rural big data and promoting practices such as precision fertilizer application, digital seed selection, and meteorological observation. These endeavors contribute to agricultural technological innovation, facilitate sustainable production, and mitigate carbon emissions across the entire agricultural process.
- 5.
- Enhance top-level design and promote effective agricultural carbon reduction policies. Firstly, effectively provide conceptual guidance by implementing the new development concept and actively promoting the low-carbon agricultural economy. This will integrate low-carbon living and low-carbon development into the lives of agricultural practitioners, fostering a consensus on agricultural green development. Secondly, establish an effective reward and punishment dual-incentive mechanism. Provide strong support for the research and development of agricultural digital energy-saving technology and encourage green innovation among agricultural production and management entities. This will enable agricultural practitioners to achieve higher yields and make more environmentally friendly choices. Moreover, it is essential to strengthen supervision to prevent the circumvention of regulations and laws regarding the misuse of agrochemicals and negligent post-production straw resource management, which contribute to high-carbon emissions.
This study empirically investigates the suppressive impact of digital economic development on agricultural carbon emission intensity using Chinese provincial panel data and a spatial Durbin model. However, the data on agricultural carbon emissions selected in this paper were derived from a narrowly defined agricultural perspective. Future studies can adopt a more comprehensive approach to thoroughly examine the agricultural industry, thereby providing a more profound and exhaustive analysis.
Author Contributions
Conceptualization, W.W.; methodology, W.W. and T.M.; software, T.M.; data curation, T.M.; writing—original draft preparation, W.W. and T.M.; writing—review and editing, W.W. and T.M. All authors have read and agreed to the published version of the manuscript.
Funding
This research received no external funding.
Institutional Review Board Statement
Not applicable.
Informed Consent Statement
Not applicable.
Data Availability Statement
The data presented in this study are available on https://www.stats.gov.cn/.
Conflicts of Interest
The authors declare no conflicts of interest.
References
- Tian, Y.; Zhang, J.B. Study on regional differences in the development level of green agriculture and its causes in China. Res. Agric. Mod. 2013, 34, 85–89. [Google Scholar]
- Tian, Y.; Zhang, J.B.; Luo, X.F. A regional comparative study on the harmonization of net carbon benefits and economic benefits in China’s plantation industry. Econ. Geogr. 2014, 34, 142–148. [Google Scholar]
- China Digital Economy Development Report; China Academy of Information and Communications Technology: Beijing, China, 2023.
- Tian, H.Y.; Guan, H.L. A study on the impact of digital economy on carbon emissions from food production—Empirical evidence from 108 prefecture-level cities in the Yangtze River Economic Belt. China Agric. Resour. Zoning 2023, 44, 145–157. [Google Scholar]
- Wen, T.; Chen, Y.M. Integrated development of digital economy and agricultural and rural economy: Practice mode, realistic obstacles and breakthrough path. Agric. Econ. Issues 2020, 487, 118–129. [Google Scholar]
- Wang, Q.L.; Ouyang, Y.S. Spatial and temporal evolution of agricultural green total factor productivity in Jiangxi Province. Zhejiang Agric. Sci. 2024, 65, 213–219. [Google Scholar]
- Feng, Q.J. Analysis of effective integration of digital economy and agricultural economy in China. South. Agric. 2022, 16, 115–117. [Google Scholar]
- Moulton, B.R. GDP and the digital economy. Underst. Digit. Econ. Data 2000, 3, 34–48. [Google Scholar]
- Kling, R.; Lamb, R. IT and organizational change in digital economies. ACM Sigcas Comput. Soc. 1999, 29, 17–25. [Google Scholar] [CrossRef]
- White Paper on Digital Economy Index of Chinese Cities (2017) Release; China Informatization: Beijing, China, 2017.
- Wang, Y. Low-carbon Agricultural Economy. Chin. Soc. Ecol. Econ. 2008, 8, 12–15. [Google Scholar]
- Luo, J.W.; Xu, L. On the Generation, Connotation and Development Countermeasures of Low-Carbon Agriculture. Agric. Mod. Res. 2010, 31, 701–703+728. [Google Scholar]
- Li, J.J. Measurement of Carbon Emission from Agricultural Land Utilization and Influencing Factors in Ethnic Areas. China Popul.-Resour. Environ. 2012, 22, 42–47. [Google Scholar]
- Li, B.; Zhang, J.B.; Li, H.P. Spatial and temporal characteristics of agricultural carbon emissions in China and decomposition of influencing factors. China Popul.-Resour. Environ. 2011, 21, 80–86. [Google Scholar]
- Liu, Y.X.; Liu, J.; Wu, W.L. Analysis of spatial and temporal changes in greenhouse gas emissions from livestock and poultry in Beijing. Chin. J. Ecol. Agric. 2013, 21, 891–897. [Google Scholar] [CrossRef]
- Shao, G.L.; Kong, H.Z.; Yu, J.K.; Li, C. Research on decomposition of carbon emission drivers of China’s marine fisheries based on LMDI method. Agric. Technol. Econ. 2015, 06, 119–128. [Google Scholar]
- Yang, J. Impact of agricultural technological progress on agricultural carbon emissions—A test of Chinese provincial data. Soft Sci. 2013, 27, 116–120. [Google Scholar]
- Luo, C.J.; Chen, M.P. Theory and Path Analysis of Utilizing Carbon Trading to Promote Agricultural Emission Reduction: International Experience and Its Implications for China. Prog. Clim. Chang. Res. 2023, 19, 761–770. [Google Scholar]
- Chen, Y.H.; Hong, B.Y. Research on the Impact of Digital Economy on High Quality Development of Agriculture. Res. Tech. Econ. Manag. 2022, 2, 105–109. [Google Scholar]
- Wu, Y.Q.; Mao, L.; Liao, X.L. Impact of digital economy on high-quality development of agriculture. J. Hebei Agric. Univ. 2022, 24, 18–27. [Google Scholar]
- Guo, H.H. Digital village construction, resource factor mismatch and green total factor productivity in agriculture. J. China Univ. Geosci. 2024, 24, 102–116. [Google Scholar]
- Xie, Y.X. Analysis of spatial and temporal differentiation pattern and obstacle factors of coordination between digital countryside and agricultural green development. Shanghai Energy Conserv. 2023, 10, 1415–1427. [Google Scholar]
- Jia, J. Realistic Problems, Target Reconstruction and Implementation Path of Agricultural Development under Digital Economy Ecology. Agric. Econ. 2023, 10, 23–25. [Google Scholar]
- Miao, W.Q. Digital economy drives high-quality development of agriculture: Theoretical basis, internal mechanism and practical approach. Reform Strategy 2023, 39, 1–13. [Google Scholar]
- Zhu, H.H.; Zheng, X. Digital economy, urban-rural integration and agricultural economic resilience. Stat. Decis. Mak. 2023, 39, 22–27. [Google Scholar]
- Mu, T.Q.; Qi, J.L. Exploring the path of agricultural green development in the era of digital economy—Taking Yunnan Province as an example. South. Agric. Mach. 2024, 55, 184–186+198. [Google Scholar]
- Yu, F.W. Research on the Motivation, Core and Countermeasures of Agricultural Green Development in the New Era. China Rural Econ. 2018, 5, 19–34. [Google Scholar]
- Luo, S.X.; He, K.; Zhang, J.B. Increasing Production Increases Pollution? —An Empirical Study Based on Policies in Main Grain Producing Areas. China Rural Econ. 2020, 1, 108–131. [Google Scholar]
- Yan, D.S.; Sun, W.; Li, P.P. Mechanism of income gap between urban and rural residents on carbon emission intensity in China—An empirical analysis based on panel data. J. Nat. Resour. 2023, 38, 2403–2417. [Google Scholar]
- Ding, B.G.; Zhao, Y.; Deng, J.H. A study on the measurement, decoupling characteristics and driving factors of carbon emissions from China’s plantation industry. China Agric. Resour. Zoning 2022, 43, 1–11. [Google Scholar]
- CO2 Emissions from Fuel Combustion; IPCC United Nations Intergovernmental Panel on Climate Change Committee: Geneva, Switzerland, 2013.
- West, T.O.; Marland, G. A Synthesis of carbon sequestration, carbon missions, and net carbon flux in agriculture: Comparing tillage practices in the United States. Agric. Ecosyst. Environ. 2002, 91, 217–232. [Google Scholar] [CrossRef]
- Duan, H.P.; Zhang, Y.; Zhao, J.B. Carbon footprint analysis of farmland ecosystems in China. J. Soil Water Conserv. 2011, 25, 203–208. [Google Scholar]
- Wang, J.; Zhu, J.; Luo, X. Development level and evolution measurement of China’s digital economy. Res. Quant. Tech. Econ. 2021, 38, 26–42. [Google Scholar]
- Wei, Y.Y.; Ma, X. Measurement and analysis of digital economy development level in six central provinces. Ind. Innov. Res. 2022, 23, 18–20. [Google Scholar]
- Guo, F.; Yang, S.G.; Jin, H. The impact of digital economy on enterprise total factor productivity and its mechanism. Mod. Financ. Econ. 2022, 42, 20–36. [Google Scholar]
- Xue, X.D.; Xu, S. How the digital economy affects the resilience of agricultural development—A consideration based on heterogeneity and nonlinearity. Ecol. Econ. 2023, 1–18. [Google Scholar]
- Liu, Z.; Zhang, X.X.; Wei, W.G. Impact of rural digital economy development on agricultural carbon emissions—Panel data analysis based on 29 provinces. J. Jiangsu Univ. (Soc. Sci. Ed.) 2023, 25, 20–32+47. [Google Scholar]
- Lai, H.B.; Lu, X. Research on the relationship between the development of agricultural modernization and rural water conservancy construction in China. China Agric. Resour. Zoning 2020, 41, 66–74. [Google Scholar]
- Chen, Y.Q.; Wang, Z.Y.; Zhang, S.Z.; Ye, X.Y.; Jiang, H.M. Spatial Measurement of Carbon Emission Intensity of Energy Consumption and Its Influencing Factors in China. J. Geogr. 2013, 68, 1418–1431. [Google Scholar]
- Sun, C.; Zhou, H.Z.; Chen, L.; Shen, Z.Y. Risk assessment of nitrogen and phosphorus surface runoff pollution from agricultural fertilizers. J. Agric. Environ. Sci. 2017, 36, 1266–1273. [Google Scholar]
- Xiao, W.; Lin, G.B. Government Support, R&D Management and Technological Innovation Efficiency—An Empirical Analysis Based on Chinese Industrial Sectors. Manag. World 2014, 4, 71–80. [Google Scholar]
- Zhang, J.; Huang, X.Y.; Peng, Y.Q. Spatial and temporal heterogeneity of plantation carbon footprints in the Yellow River Basin under the “double carbon” target. J. Henan Agric. Univ. 2023, 57, 884–896. [Google Scholar]
- Han, J.Y.; Qu, J.S.; Xu, L.; Li, H.J.; Liu, L.N. Spatial effects of financial support to agriculture on agricultural carbon emission intensity: An empirical analysis based on the spatial Durbin mode. J. Ecol. Rural Environ. 2021, 37, 1404–1412. [Google Scholar]
- Chen, C.W.; Zhang, X.Y. Can Digital Rural Construction Alleviate Agricultural Resource Factor Mismatch? J. Agric. For. Econ. Manag. 2022, 21, 736–743. [Google Scholar]

Disclaimer/Publisher’s Note: The statements, opinions and data contained in all publications are solely those of the individual author(s) and contributor(s) and not of MDPI and/or the editor(s). MDPI and/or the editor(s) disclaim responsibility for any injury to people or property resulting from any ideas, methods, instructions or products referred to in the content. |
© 2024 by the authors. Licensee MDPI, Basel, Switzerland. This article is an open access article distributed under the terms and conditions of the Creative Commons Attribution (CC BY) license (https://creativecommons.org/licenses/by/4.0/).