Abstract
In the cultural heritage field, non-invasive analyses are becoming more important as they avoid any sampling, allowing in situ measurements to be performed. XRF is one of the most common among those techniques, as it allows elemental speciation of the sample with a range that goes from F to U. However, the main limitation of this technique on cultural heritage objects is due to their intrinsic inhomogeneity, both lateral and in-depth. If MA-XRF has overcome the lateral inhomogeneity through the collection of multiple XRF spectra in different positions, it is more difficult to find an optimal way to perform in-depth analyses. Now, only confocal micro XRF allows for precise 3D analyses, as other techniques are limited to certain kinds of samples. In recent years, however, angle-resolved XRF has given promising results in the analysis of layered samples. In this study, we will review the information about this new analytical technique and its advantages and disadvantages in studying cultural heritage objects following our recent studies.
1. Introduction
Cultural heritage artifacts are the manifestation of humankind’s evolution, both in terms of technology and inner expression. They comprehend a wide variety of objects: paintings, vases, jewels, weapons, and parchments, and are made of very different materials, e.g., wood, metals, stone, pottery, and glass. The study of the materials composing the archeological and historical artifacts has become more and more important in the last century, along with the scientific evolution, as it helps to answer many questions on the technology of production, the raw materials provenance [1,2,3,4,5,6], the trading routes [7,8,9,10,11], and degradation processes [12,13,14].
To achieve this goal, scientists have started employing different analytical techniques to obtain information on their elemental composition and molecular or crystalline structure. With the evolution of such techniques, the scientific community has tried to retrieve more precise data and avoid altering the sample.
Moreover, we must consider that cultural heritage artifacts are not only very rare or unique, but they can be very fragile. As they represent a part of our history, their preservation, even during their study, is of the utmost importance. Considering the damage produced on the samples, analytical techniques are usually divided into three groups: (I) destructive techniques: a specimen is taken from the objects and is consumed during the analysis; (II) invasive techniques: a specimen is taken from the object but is not consumed, thus is possible to perform more analyses without collecting any other specimen; and (III) non-invasive techniques: no specimen is taken from the object, and the object is not altered during the analysis (or is altered under a reasonable level).
Non-invasive analysis stands as a pivotal methodology in the field of characterizing cultural heritage, offering a green and sustainable approach that circumvents the need for damaging extractions. This form of analysis allows the characterization of artifacts without compromising their integrity, providing deep insight into their composition without the necessity of moving or harming the examined sample [15,16,17,18].
The sustainability of these techniques lies in their limited impact on the art object, as they do not require the extraction of parts of the sample. Moreover, non-invasive analyses enable multiple investigations without causing permanent damage to cultural heritage, thereby promoting responsible conservation.
However, challenges arise when dealing with layered samples, which are common cultural artifacts. The need to non-invasively characterize layers of gilding, paintings, enamels, glass, and metals presents a dilemma. The complexity of such stratifications and the variety of thicknesses involved make it challenging to obtain precise results without compromising the artifact’s integrity.
Different methods can be employed to analyze layered samples, where IBAs (ion beam analyses) offer the best results. These techniques, coupled with induced X-ray emission (PIXE), characterize the layers composing the sample, evaluating the energy distribution of the backscattered particles, which depends on the nature of the elements composing the layers and the layers’ thickness [19,20,21,22,23]. Additionally, as the volume of interaction of the particle depends on the particle energy, a variation of this energy (differential PIXE) allows for discrimination of the composition at different depths of the sample [24,25,26,27]. The problem with the application of these techniques is that they both require access to a particle accelerator, which is not feasible for many laboratories.
X-ray fluorescence (XRF) analysis is a well-established and widespread technique in the field of cultural heritage, and it can be considered sustainable for several reasons, aligning with environmentally conscious and responsible conservation practices.
First, it is a non-invasive technique that ensures the preservation of the object’s integrity, contributing to sustainable conservation practices. Unlike some other analytical methods that may necessitate extracting samples or applying chemical treatments, XRF allows for analysis in situ without the need for invasive procedures. This minimizes the impact on the cultural artifact and supports sustainable conservation efforts [28,29,30,31,32].
Moreover, XRF instruments do not involve the use of harmful chemicals or solvents, reducing the environmental impact associated with the analysis. This aligns with sustainability goals by minimizing the generation of hazardous waste and promoting environmentally friendly analytical practices. It provides a versatile tool for characterizing a wide range of materials, including metals, ceramics, pigments, and more. Its capability to perform multi-elemental analysis in a single scan enhances efficiency, reducing the need for multiple analyses with different techniques. This efficiency contributes to time and resource conservation.
Indeed, XRF exploits X-rays to analyze the elemental composition of the sample. The energy of the electrons bonded to the atom falls in the order of hundreds/thousands of electronvolts, i.e., the same energy as X-rays. If the sample is irradiated with photons with enough energy, the atoms composing the sample can be ionized, losing a bond electron. The vacancy created during the ionization is immediately filled through a relaxation process involving another electron from an outer shell. The energy excess from the former and the final shells is emitted as an X-ray photon [33,34]. As the energy of each electronic shell is characteristic of each atomic species, the photons emitted following the ionization process can be employed to characterize the elemental composition of the sample.
An XRF spectrometer is made of two essential parts: the X-ray source and the detector. The former irradiates the sample, and the latter collects the fluorescence signal emitted by the sample. In principle, no other requirements are needed; for this reason, XRF can be conducted in situ, directly on the artifact [35,36,37,38,39,40,41], without the need for sample transportation. Due to the absorption of air and the detector efficiency, XRF can generally detect atoms heavier than silicon, up to uranium; however, some spectrometers can detect elements as light as fluorine [42].
The possibility to perform in situ measurements is particularly beneficial for large or delicate objects that may be challenging to move. In situ analysis not only preserves the artifact but also reduces the risk of damage during transportation, aligning with sustainable conservation practices.
Finally, this analysis can be employed for long-term monitoring of cultural artifacts. By periodically assessing the elemental composition over time, conservators can track changes and implement preventive conservation measures. This proactive approach contributes to the sustainable preservation of cultural heritage.
In summary, XRF analyses in the cultural heritage field are sustainable due to their non-destructive nature, minimal sample preparation requirements, reduced environmental impact, versatility, efficiency, capability for in situ analysis, and suitability for long-term monitoring. These characteristics make XRF a valuable tool for understanding and preserving cultural artifacts while minimizing the ecological footprint associated with analytical techniques.
While X-ray fluorescence (XRF) analysis is generally considered a sustainable and non-destructive technique in the cultural heritage field, there are certain scenarios or considerations where it may be perceived as less sustainable or may face limitations. As an example, XRF has a limited depth of penetration, which can be a limitation when analyzing multi-layered cultural artifacts. However, if the layers are thick or if the composition needs to be examined deep within the object, XRF may not provide comprehensive results, necessitating the use of additional techniques that could be more invasive. Moreover, in cases where the composition of the outer layers differs significantly from the inner layers, XRF may not capture the complete picture. This limitation might require supplementary analyses, potentially involving more invasive methods.
It is important to note that while XRF may face limitations, it is often part of a broader analytical strategy in the cultural heritage field. The choice of analytical methods should be tailored to the specific needs of the artifact under investigation, and a combination of techniques may be employed to achieve a comprehensive understanding while minimizing the impact on cultural heritage objects.
Throughout this analysis, we will explore specific challenges related to characterizing layered samples in cultural heritage with XRF, examining examples of common layers and significant thicknesses at play. We will also identify current limitations in non-invasive techniques, understanding why, despite advancements, some characterizations remain inaccessible without resorting to more invasive methods.
2. Angle-Dependent XRF Techniques
In XRF, the data collected reflects the overall composition of the whole volume investigated, as this volume can be several hundreds of micrometers deep. Depending on the sample and the energies, XRF is considered a bulk analysis. This gives an overall composition of the sample investigated, which is close to reality if the sample is homogeneous. However, this seldom happens in cultural heritage artifacts, as they are often layered due to the alteration layers that are formed on the surface or due to their manufacture [43,44,45,46,47,48,49]. For this reason, distinguishing the composition of each layer can be of the utmost importance, as it can give information on the nature of the alteration or also on the technological process.
With this perspective, XRF does not seem to be recommended for the characterization of the different layers; however, its application for this kind of problem is not a novelty. Indeed, though XRF averages out the composition of the whole volume investigated, different attempts have been made to retrieve the elemental distribution inside a multi-layered sample. In particular, the ratio between different fluorescence lines (Kα/Kβ or Lα/Lβ intensities ratio) is often applied on metallic artifacts to measure the thickness of gildings [50,51,52,53,54,55,56] or the Monte Carlo simulations are used to create theoretical spectra of multi-layered samples, which are compared with the experimental data obtained on the unknown samples [57,58,59]; and finally, confocal micro XRF (CμXRF), employs capillaries to select a small volume of the sample to be analyzed, performing this task for more than twenty years [60,61,62,63,64,65].
A similar task can also be achieved by properly adjusting the geometry of analysis: with angle-dependent XRF, we refer to all the XRF techniques that employ an angular variation during the analysis of the sample; depending on the angular range, we can have grazing techniques (i.e., grazing incident, GI, and grazing emission, GE-XRF) [66,67,68,69,70,71,72] and the more general angle-resolved (AR) XRF [73,74,75,76].
In grazing techniques, the sample is analyzed with the source (grazing incidence) or the detector (grazing emission) moving around the critical angles of total reflection, generally in the order of a few degrees. In this angular region, phenomena of interference are the main players, causing the formation of a standing wave field inside (in case of GE-XRF) or above the surface (in case of GI-XRF) of the sample, hence, allowing for probing and characterizing the nanostructure in the surface of the sample. However, for this application, we need the surface to be optically smooth for X-rays, and this is never the case with cultural heritage samples. As a result, grazing techniques are mostly applied in material science.
Despite the impossibility of employing interference to enhance the sample signal, we can exploit another phenomenon: the change in path length crossed via the source/fluorescence radiation inside the sample.
2.1. AR-XRF
A theoretical description of the functioning of AR-XRF can be given starting from the well-known Lambert–Beer equation:
where are the transmitted and impinging radiation intensity, is the massive attenuation coefficient, is the material density, and is the path length traveled by the radiation. Given a layer of a thickness and an angle of analysis , we can calculate the absorbed intensity of the radiation as:
From Equation (2), it is immediate that we can change the path length of the radiation inside the topmost layer of the sample just by changing the angle of irradiation or detection. For shallow angles of irradiation, most of the photons will be absorbed on the surface of the sample; thus, we will have a higher surface sensitivity. Similarly, for shallow angles of detection, most of the fluorescence photons emitted from the bulk will be highly attenuated before reaching the detector, and only those coming from the surface will be detected. More concisely, we can reduce the penetration depth and the escape depth of the photons, lowering the angles of irradiation and detection.
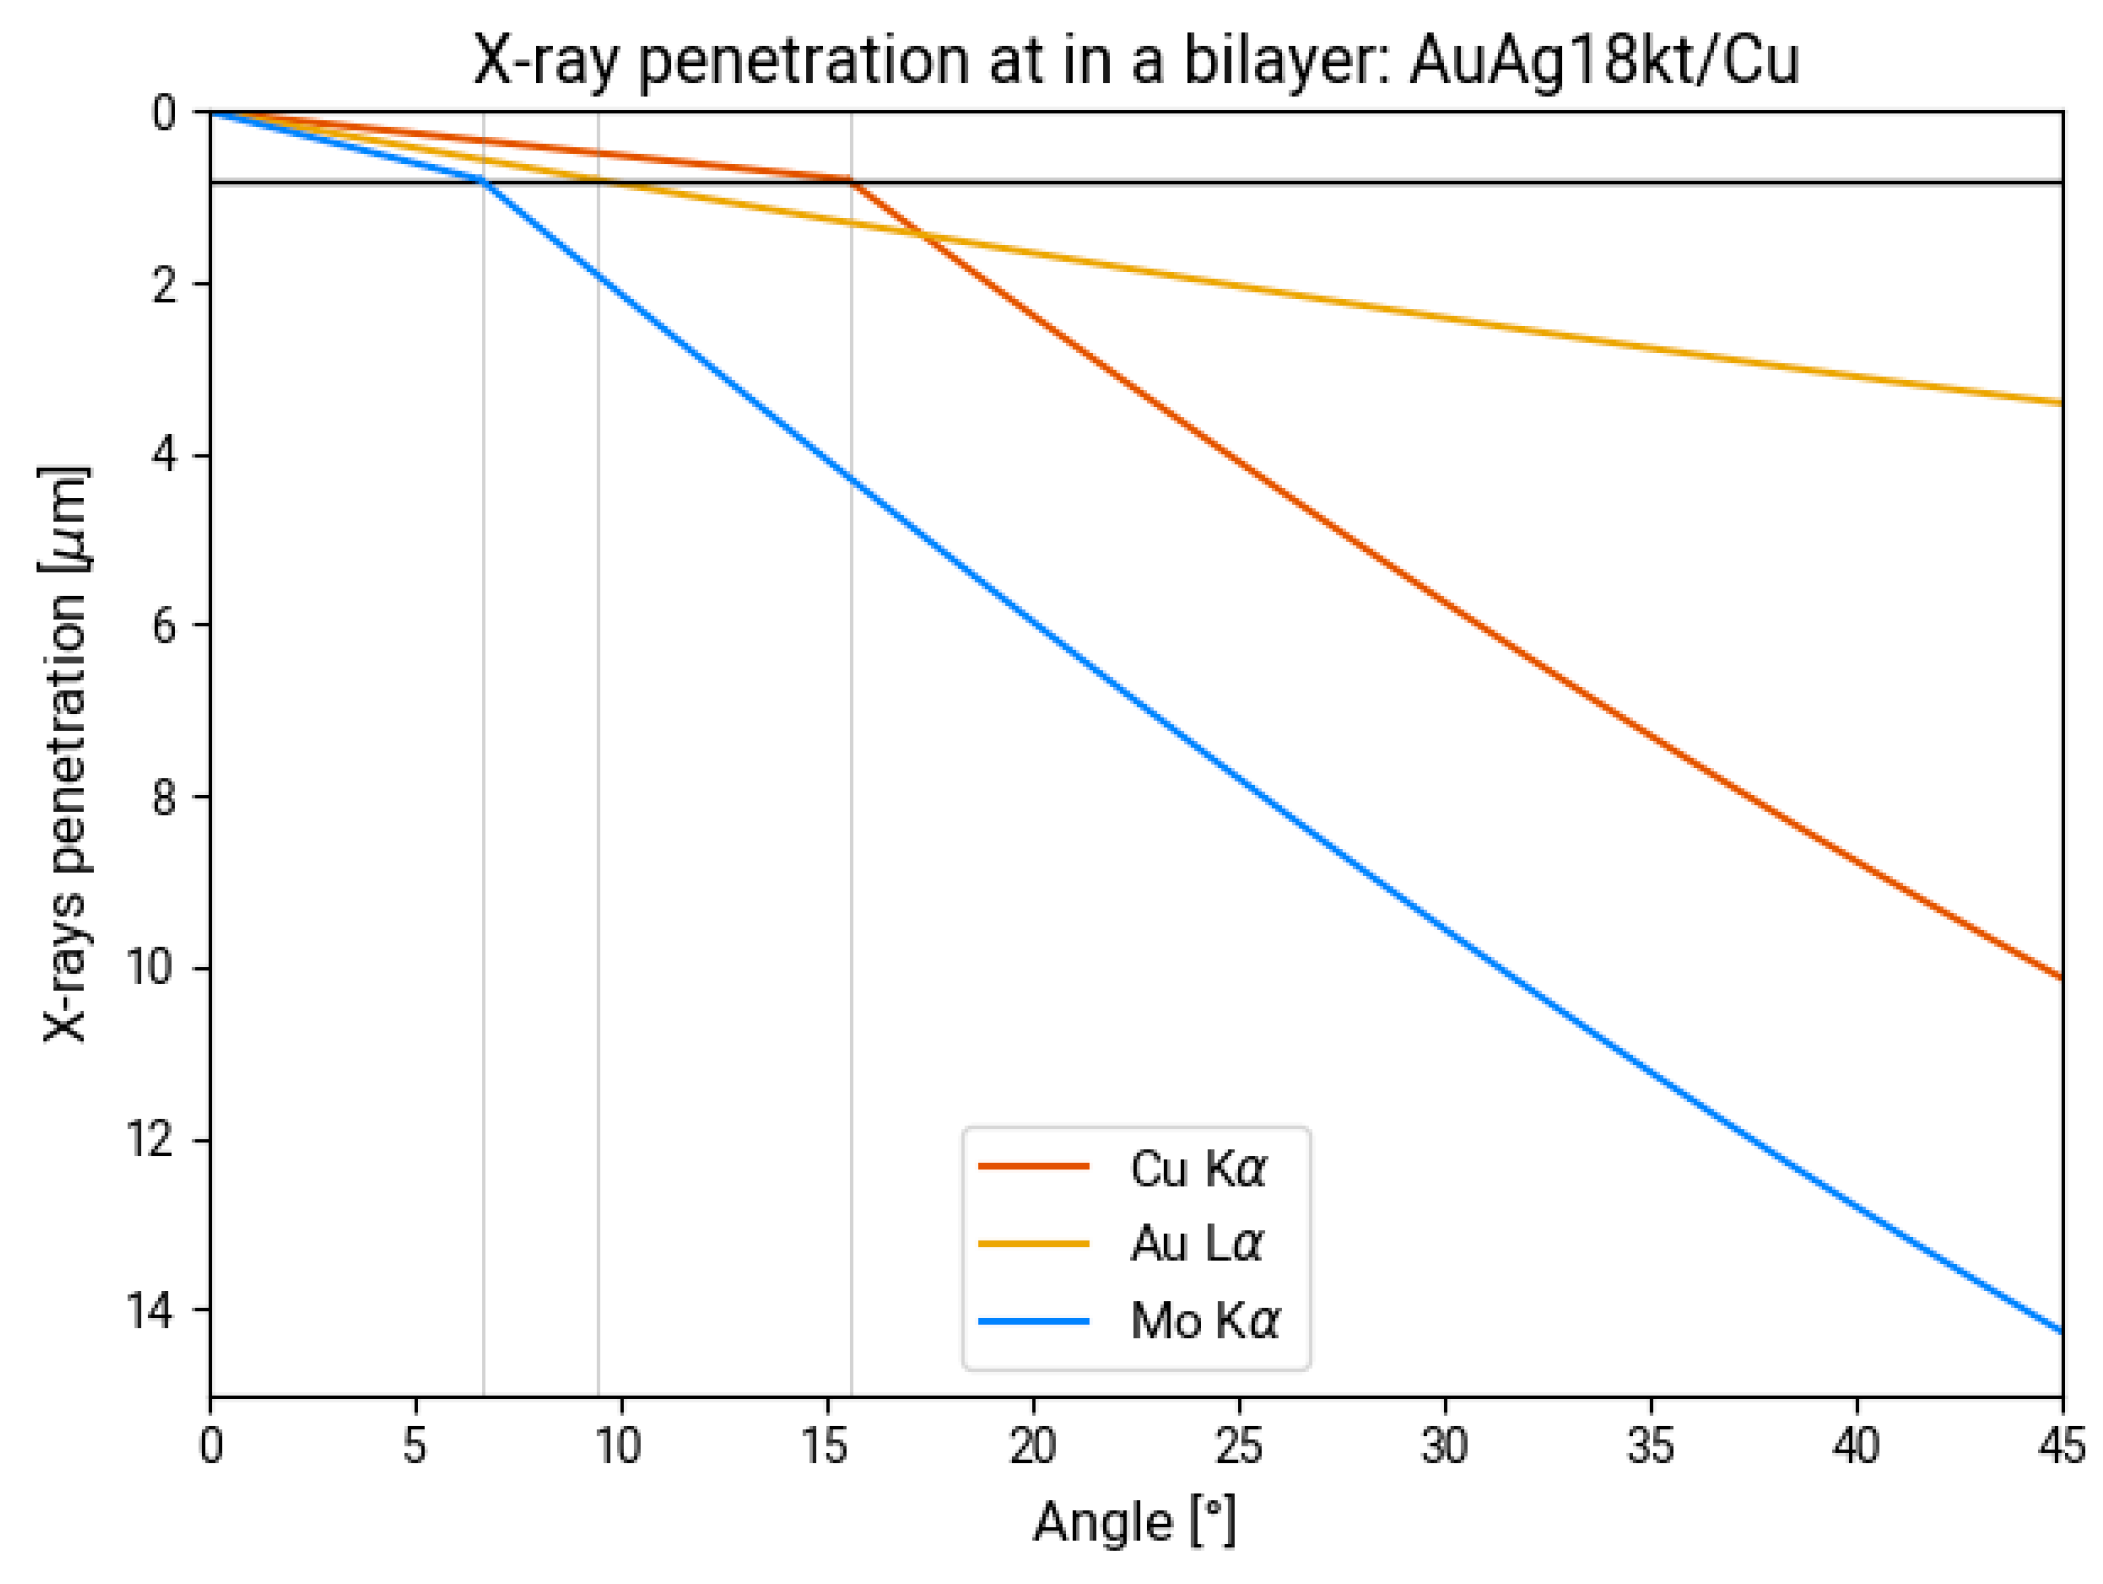
For example, if we analyze a gilding where a layer 0.8 µm of 18 kt gold is on top of a copper plate, we can observe how the probed volume varies if we consider the Cu Kα line (8.04 keV), the Au Lα line (9.71 keV), or the primary energy (e.g., Mo Kα line, 17.45 keV). If we collect the fluorescence signal at 45°, the Cu Ka line will escape for a maximum of 10 µm, while the Au La line will probe the entire volume of the golden layer. However, if we change the angle of irradiation (with the hypothesis of a monochromatic, non-divergent beam and a perfectly smooth surface), we will not detect any signal of the bulk until 7°, as for shallower angles, only the golden layer will be excited. Similarly, if we irradiate the sample at 45°, we will excite the sample 14 µm deep. However, if we collect the fluorescence signal at different angles, we will not see the signal of copper until more than 15°. As for shallower angles, the fluorescence signal will be highly attenuated by the covering golden layer, as depicted in Figure 1.
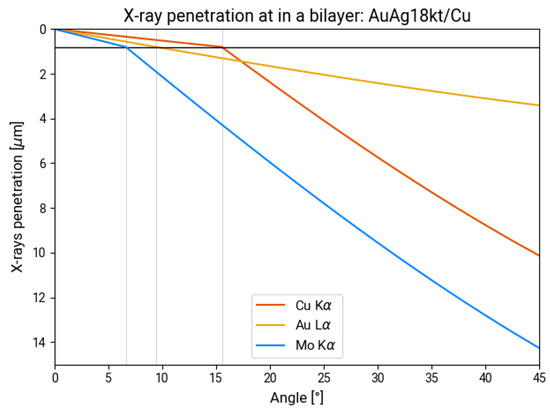
Figure 1.
The penetration depth of beams with different energies inside a sample made of 18 kt gold alloy (Au and Ag) 0.8 µm thick and a bulk of copper.
The intensity of the fluorescence signal, thus, for an element present in the layer will follow Shermans’ equation for multilayer samples, which is, without considering enhancements factors:
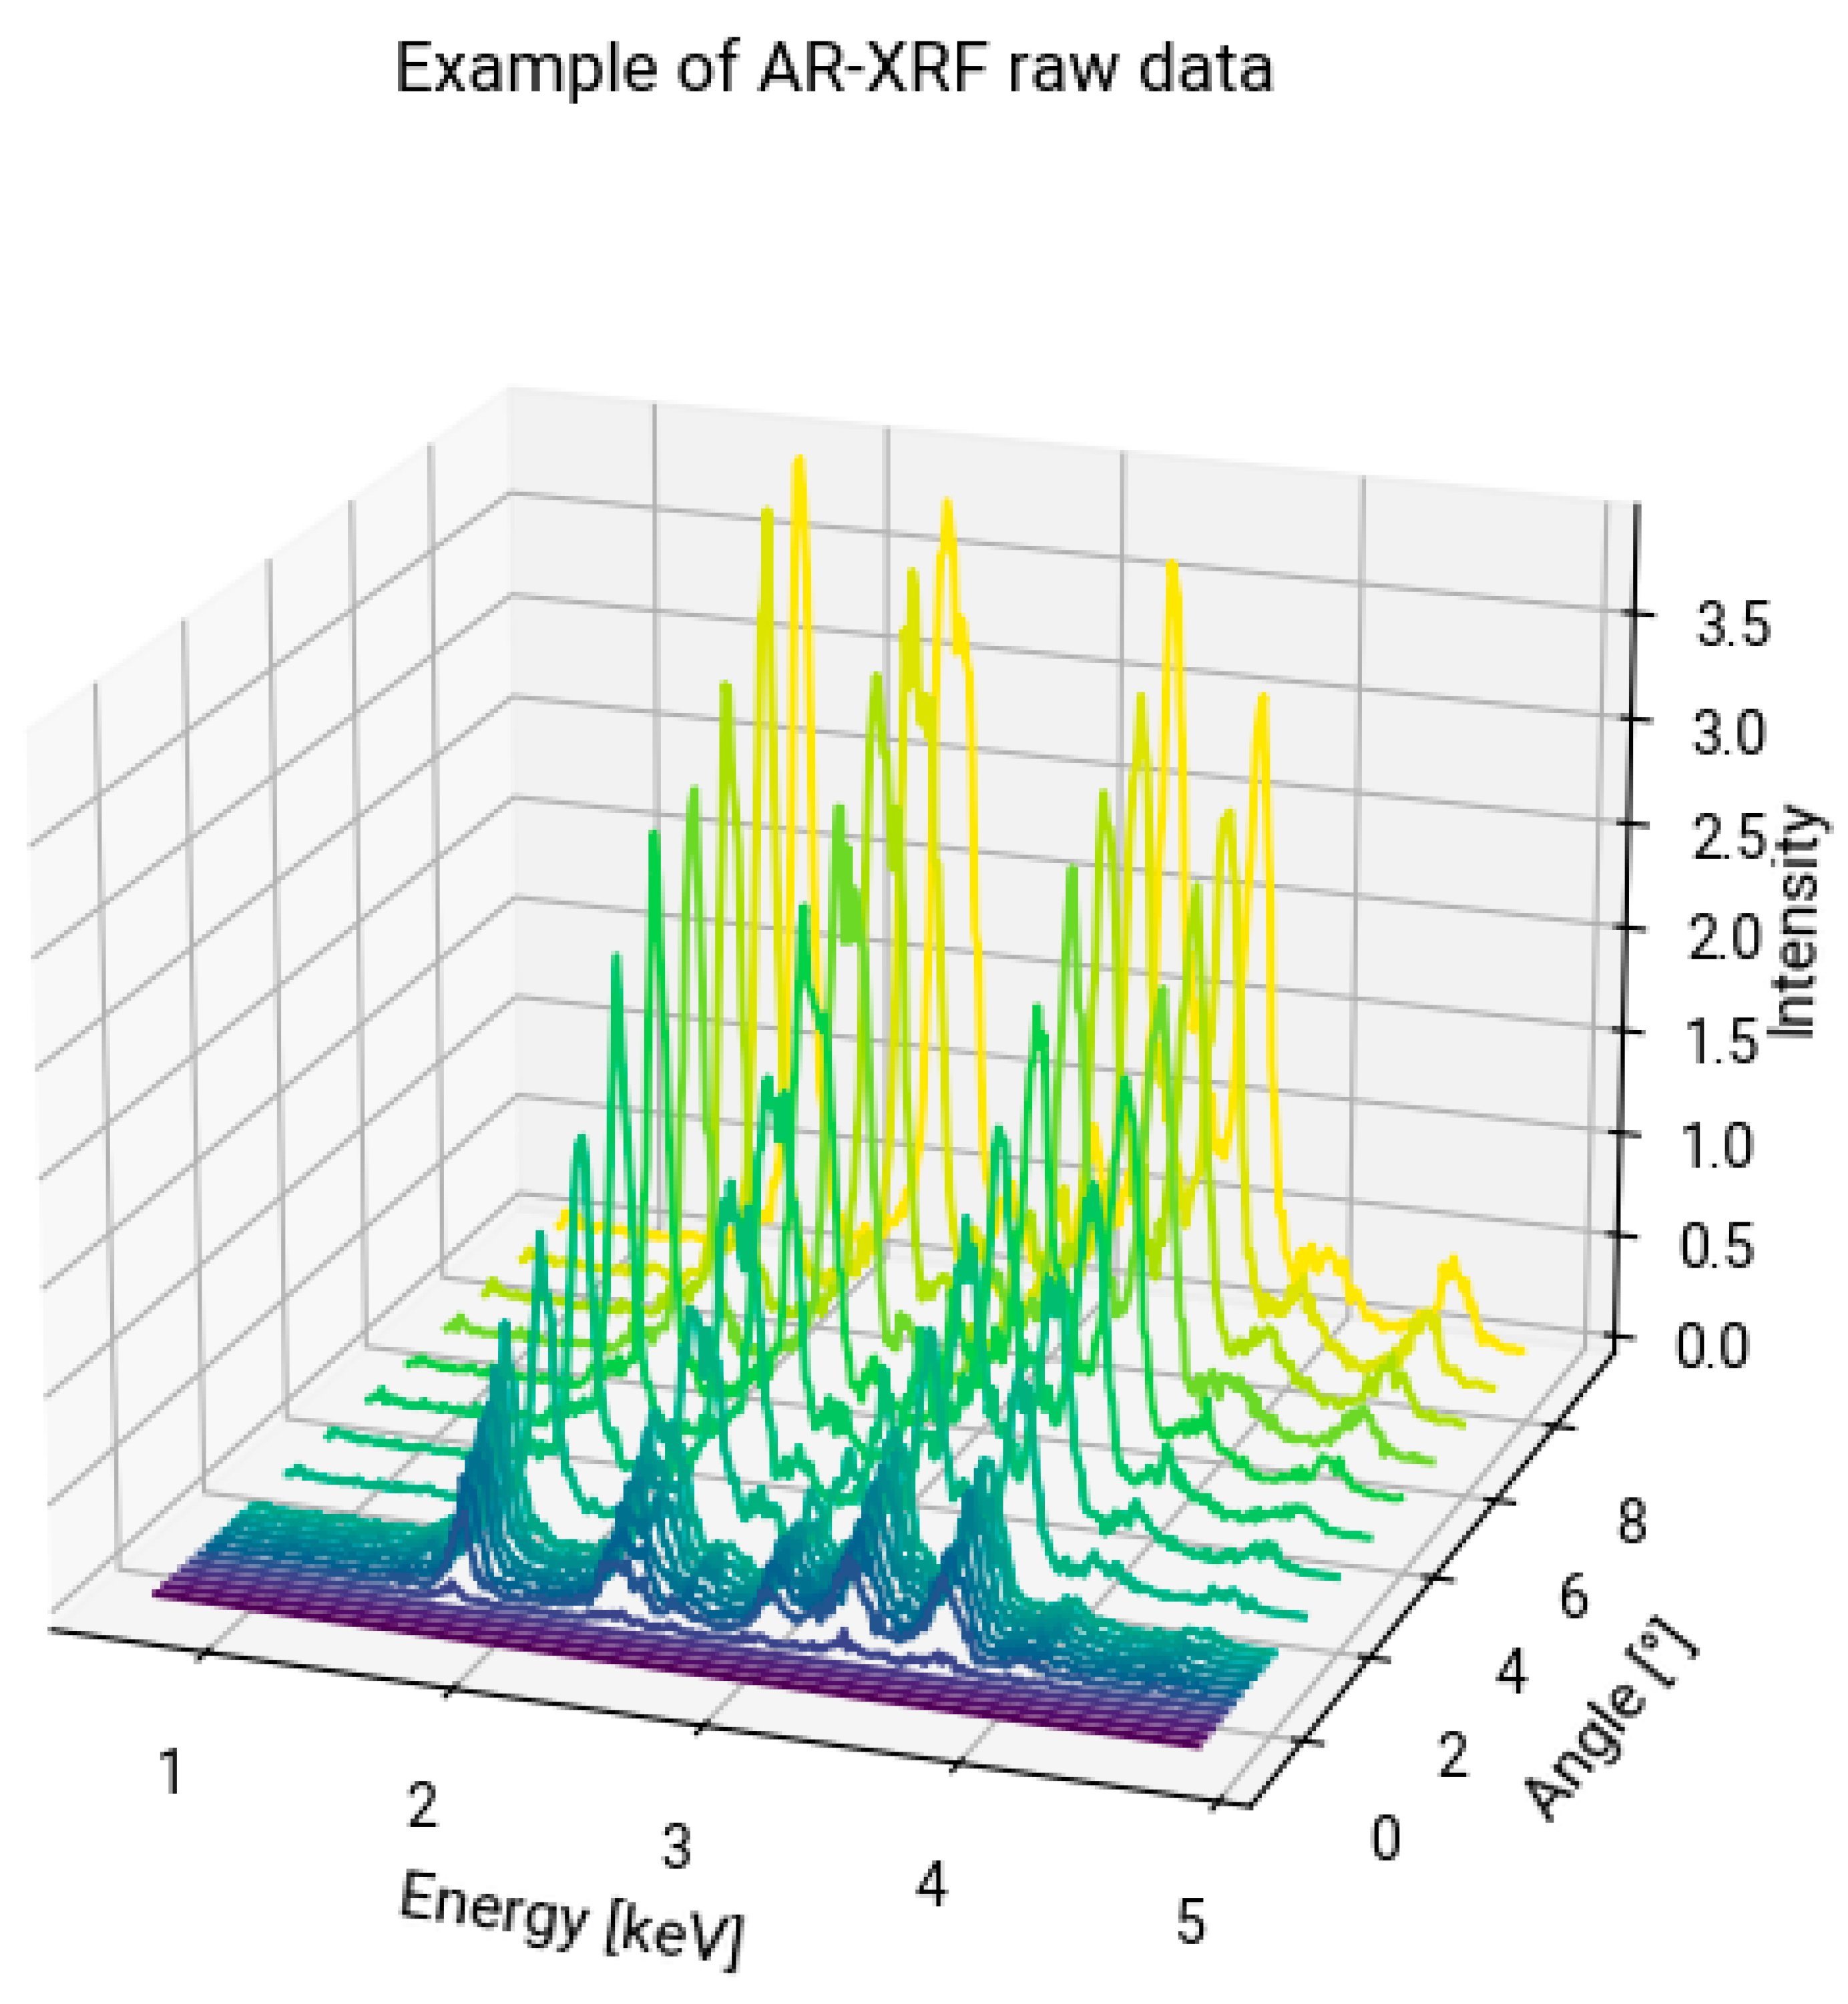
where is the geometric factor considering the detector solid angle and the irradiated area, is the detector efficiency at the fluorescence energy, is the element concentration into the layer of interest, is the probability of emission of the fluorescence line, is the source intensity, is the element photoelectric absorption, and are the attenuation of the layer at the source and fluorescence energy, and are the irradiation and detection angles, is the layer density, and is the layer thickness. The first exponential corrects for the self-attenuation of the layer if it is not of infinite thickness, while the second exponential corrects for the attenuation due to the covering layers. An example of an AR-XRF profile is plotted in Figure 2, in which the scanning on a lustered ceramic sample is shown. These ceramics present quite complex stratigraphy and production technology: they are made of a high lead content glaze covered with a metallic shine layer, the so-called luster. They were produced in the IX century in the Middle East, and then the technique, which required a double firing at oxidizing and reducing atmospheres of the ceramic, painted with a mixture of copper and silver salts, was transmitted in North Africa, Spain, and then in Italy. On the surface, we can observe the presence of a few nanometers’ thick silica layer, then the copper/silver metallic nanoparticle layer, which has a thickness of tens/hundreds of nanometers, and then the high lead glaze. In this figure, it is possible to see the fluorescence signal collected at low energies, from 1 to 4 keV, using a source at 4.5 keV. The main peaks are the Si peak at 1.74 keV, the lead M lines at 2.3 keV, the Ag L lines at 2.9 keV, and the K and Ca K lines, respectively, at 3.3 and 3.6 keV. In this sample, silver is present only on the first hundreds of nanometers of the surface, yet at shallow angles, its intensity is in the same order of magnitude as the other peaks, even though they are major elements composing the sample bulk.

Figure 2.
Example of XRF spectra collected in AR-XRF measurements, you can see the change in intensity in the function of the angle of detection.
2.2. Instrumentation
AR-XRF can be performed in a laboratory, with a tabletop spectrometer, or in synchrotron facilities; however, the technical requirements to apply this technique are not very demanding compared to other techniques like confocal XRF. Other than the basic equipment (source and detector), what we need are slits to collimate the radiation and a motor to perform the scanning. The collimation and the motorized system are the crucial parts concerning the development of the instrument; the first one limits the angular resolution, which can be translated into an in-depth resolution, and the second one defines the steps that the instrument can mechanically perform. Additionally, depending on the samples we want to analyze, we can choose if it is better to have the source moving, the detector, or the sample, Figure 3.

Figure 3.
Alternatives for performing AR-XRF, the source is in dark green, and the fluorescence detected beam is in yellow. From left to right: moving the source, the detector, or tilting the sample.
The advantage of having the source moving lies in the fact that for shallower angles, we have a high footprint of the source on the sample surface; thus, a big area of the sample is irradiated. The footprint of the beam is, if we consider its emission profile uniform, proportional to:
where is the width of the beam. The increase in the footprint at shallow angles will compensate for the decrease in the signal caused by the thin volume excited. In that case, however, we have to ensure a small divergence of the source with a collimator. The choice of moving the source is optimal if we want to analyze laterally homogenous samples; otherwise, areas with different compositions will be excited at the same time. If we want to increase the spatial resolution, we need instead to move the detector. In this case, indeed, the irradiated spot will not change during the measurement; however, the decrease in the signal at shallow angles will not be compensated by the footprint of the beam, so a higher measurement time will be needed. In this second geometry, the collimator in front of the detector will ensure a small divergence for the fluorescence beam.
A final and more versatile choice is to tilt the sample, keeping a scattering angle fixed at 90°. In this case, we can choose each time if we want to analyze at shallow angles of detection or shallow angles of excitation, exploiting the enhancement of the source footprint or the better spatial resolution of the two alternatives. In this case, a collimator to be placed either in front of the detector or the source may be the better choice.
As high collimation is needed, with a divergence that should be at least in the order or below milliradians, the best way to collimate is to use slits placed parallel to the rotation axis so that even though the divergence is optimized, the flux is reduced only on the rotation plane.
3. Data Collecting and Analysis
The main concerns regarding the data collection are due to the photon flux and the sample alignment. The former is influenced by the set-up choice (rotation of the source or the detector and subsequent need for collimation) and the source flux. This (coupled with the sample matrix composition) inherently will define the lower detection limit of the technique and which elements inside these layers can be employed to characterize the sample. The alignment of the sample instead will define a correct assignment of the angular position and a good estimate of the probed depth. The sample alignment is also influenced by the shape of the sample surface, which should be planar enough to allow the collection of the data from grazing angles. This is extremely important as depression on the sample surface cannot be analyzed as the fluorescence beam cannot penetrate in grazing conditions, and, in the same way, the fluorescence signal cannot escape.
To perform the sample alignment, the most precise way is to apply the same method employed for GI/GE-XRF, Figure 4. The detector is placed in front of the source, and the sample is tilted so that the sample surface is parallel to the source–detector axis of the rotation plane. The sample is moved on the z-axis until the source signal is halved, then it is tilted. If, during the tilting, the source signal increases, it means that the sample was not correctly aligned. The new angle of reference will be found where the source signal is at its maximum; then again, the sample is moved on the z-axis to halve the source signal and then tilted to find the new reference angle. This iterative process will place the sample surface parallel to the source; then, the detector can be rotated 90°. If AR-XRF is performed by tilting the source, the sample will be kept in this position; otherwise, it will also be tilted at 90° so that its surface will be parallel to the detector and perpendicular to the source. This alignment procedure is, however, optimal for perfectly flat surfaces and is indeed employed for grazing techniques in laboratory-made samples. It will align the overall sample surface but will not consider the presence of hills and valleys on the sample. The former will also emit signals for negative angles, while the latter will emit no signals in grazing conditions.
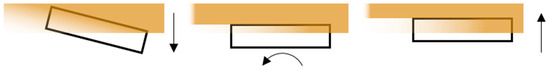
Figure 4.
Procedure of alignment of the sample: in the first step, the sample is moved along the z-axis until the source intensity is halved, then it is rotated until the maximum intensity is reached, and then again moved along the z-axis. The procedure is iterated until the sample is fully aligned.
For this reason, a correction of the data alignment may be necessary depending on the analyzed spot. To proceed with this correction, one of the elements present on the surface can be employed as a reference, and the rising of its signal can be used as 0 of the angle scale. Indeed, as the surface of cultural heritage samples is not optically flat for wavelengths in the range of X-rays, we have a low reflectivity also below the critical angle of total reflection. For this very reason, a second way, even though less precise, is to perform a first scanning of the sample to find the angle from which the signal of an element present on the surface starts to rise and to use this angle as zero.
During the data collection, we must also consider that because XRF is a bulk analysis, we detect an average composition of the volume investigated; thus, the deeper we reach inside the sample, the higher the inhomogeneities we will merge in the signal, and the small variation in the composition will not be distinguished anymore. Instead, AR-XRF is highly surface sensitive; thus, small variations will be distinguished in the surface composition, which is probed at shallower angles. For this reason, when collecting data, it may be useful to change the angular step during the acquisition, with a denser data collection for shallow angles and a higher angular step for steeper angles, always considering as a limit the angular resolution (thus the divergence of the beam or the collected signal). This variation in the angular step may also reflect a variation in acquisition time, allowing a higher dwell time in regions where the signal is lower and optimizing the data collection even more. Indeed, if, for a source rotating system, the lower signal at shallow angles is compensated with a higher footprint, this does not happen for a detector rotating system.
3.1. Data Analysis
After collecting the data, we need to reconstruct the sample structure. To perform this task, we employ the Sherman equation and, thus, the fundamental parameters method. As the instruments employed are well characterized, and the geometry is known, the only unknown parameter is indeed the sample structure.
Due to the amount of data and the possible complexity of the sample (both in terms of composition and number of layers), some a priori knowledge may be needed. If not, it should be acquired before the AR-XRF data analysis. In complex cases, the most important information to obtain is the composition of the bulk, which, if not known, should be estimated. We must keep in mind that we call bulk the maximum depth probed using the analysis, which can be a non-oxidized layer in the case of metal artifacts, the ceramic glaze or biscuit, or the preparation layer of a painting. Additionally, we also have to find elements that are characteristic of each layer that can be employed to probe the sample, i.e., if a sample presents one element in all its layers with just a slight variation in concentration, it will be nearly impossible to use that element to reconstruct the layers, instead if one element is present only in the top layer or only in bulk, the change in intensity of that same element can be used to characterize the sample structure.
The elements used as a reference to perform the characterization are usually abundant elements characteristic of each layer; then, a first estimate of the composition is performed, and the simulation procedure can begin. The more parameters are known, of course, the easier it will be to reconstruct the sample structure. The simulated data will then be compared with the experimental data until convergence is found.
3.2. Case Studies
We applied AR-XRF for the analyses of metal and ceramic artifacts; the former samples are laboratory-made gildings with a thickness between 0.45 and 1.05 µm, made of a copper plate covered with a variable number of golden leaves. The second sample was a ceramic sherd coming from Puebla, Mexico (XVII-XVIII centuries), made of a ceramic biscuit covered with a high-lead white glaze and different decorations.
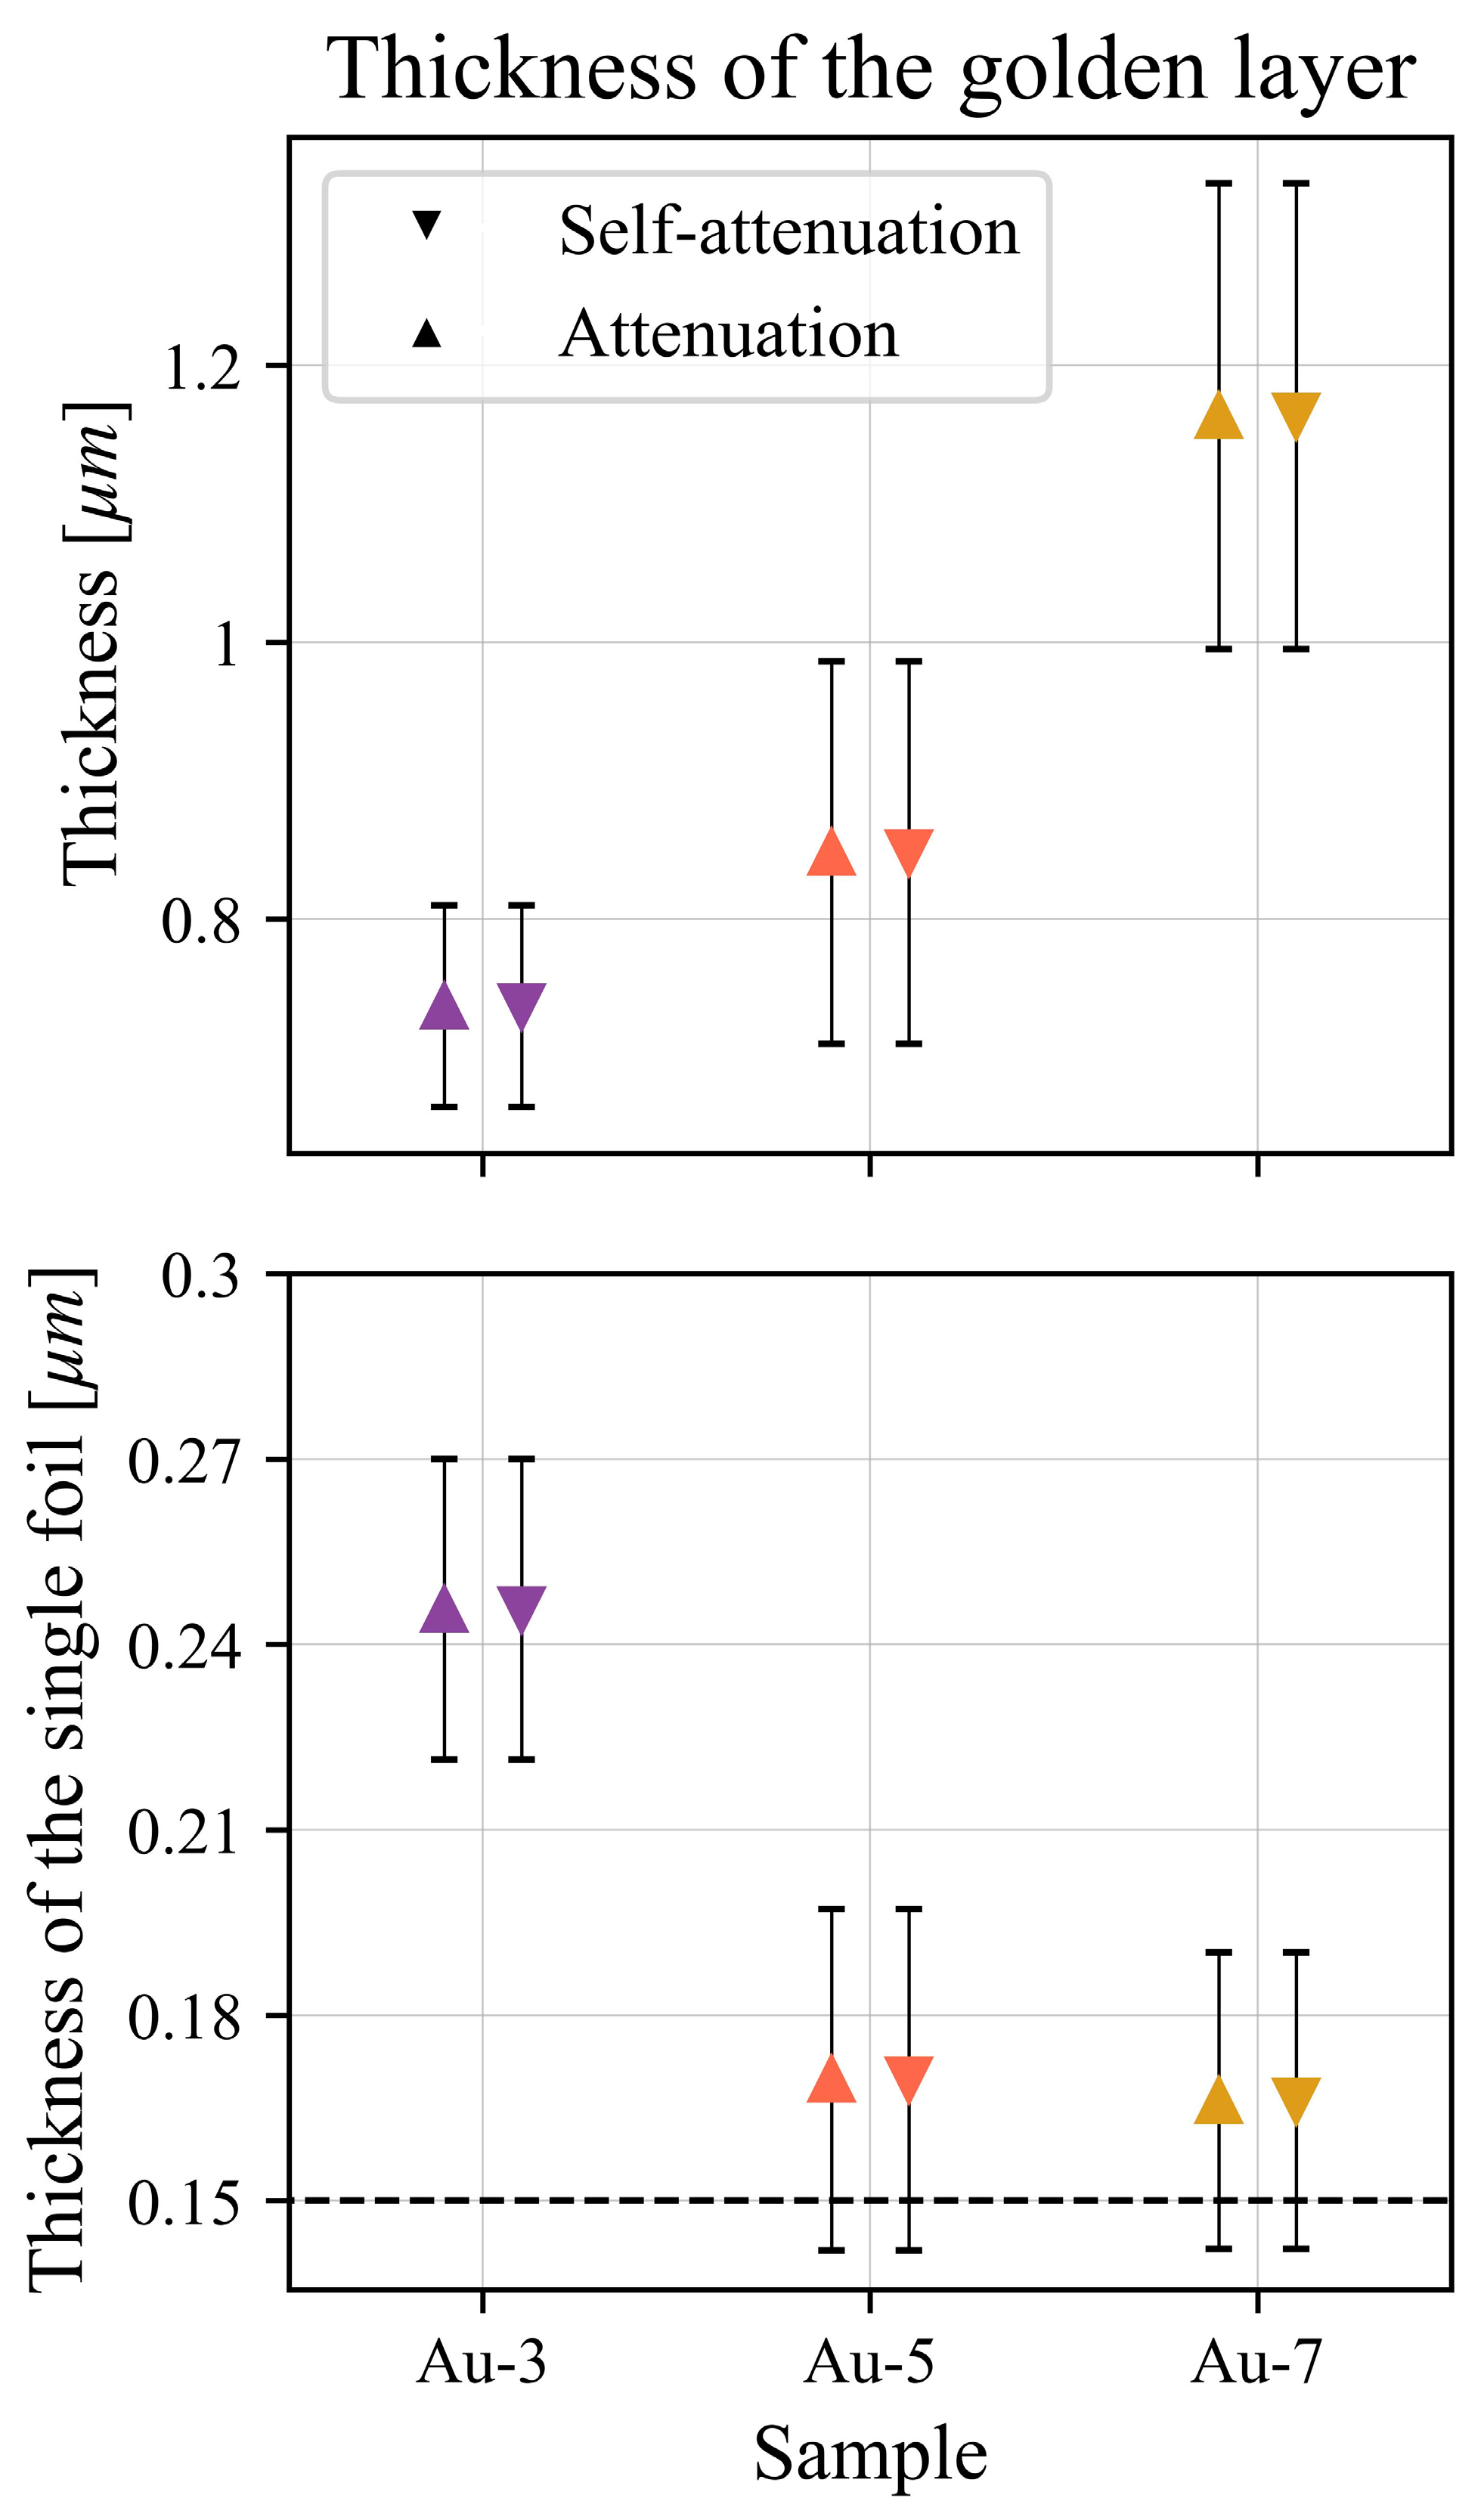
In our first experiment [77], we tested if AR-XRF could be employed for samples that present lateral inhomogeneities, as this is one of the main differences between samples in the cultural heritage and samples in the field of material science. For this reason, we prepared gilded metal samples using a copper sheet and covered them with a sequence of golden leaves. The golden foils, made of 18 kt gold (75% gold and 25% silver alloy), have been stacked and glued using an organic glue. Their mean thickness is 0.15 µm, and we prepared specimens with three, five, and seven golden foils. The samples have been analyzed at the Nuclear Science Instrumentation Laboratories (NSIL) of the International Atomic Energy Agency (IAEA) [78]. The spectrometer was equipped with a Mo source, collimated with capillaries. The sample was placed on a sample holder that allows for a rotation, and the SDD detector, placed at 90° with respect to the source, was collimated with a metallic slit with an opening of 60 µm, resulting in an angular resolution of nearly 5.5 mrad. For each sample, three spots have been measured, rotating the sample from 0° to 30° with respect to the detector. The AR-XRF spectra of copper and gold were then compared with theoretical AR-XRF profiles, calculated for different thicknesses of the gold layer. The signal of copper, which is the bulk layer, is affected by the attenuation of the layer of gold; thus, the thicker the layer of gold, the higher its attenuation; the signal of gold, instead, is affected only by the layer self-attenuation and increases as the gold layer thickens. In Figure 5 (taken from [77]), the calculated thicknesses of the golden layers are plotted on top, on the bottom instead of the thickness of the single leaf, compared with its nominal value. The thickness calculated using both the signal of copper (upward triangles) and gold (downward triangles) agrees with the theoretical thickness, especially for the samples with five and seven golden leaves, while in the sample with only three foils, there is an overestimation, probably due to the leaves deposition that has caused the formation of folds where the layer is thicker.
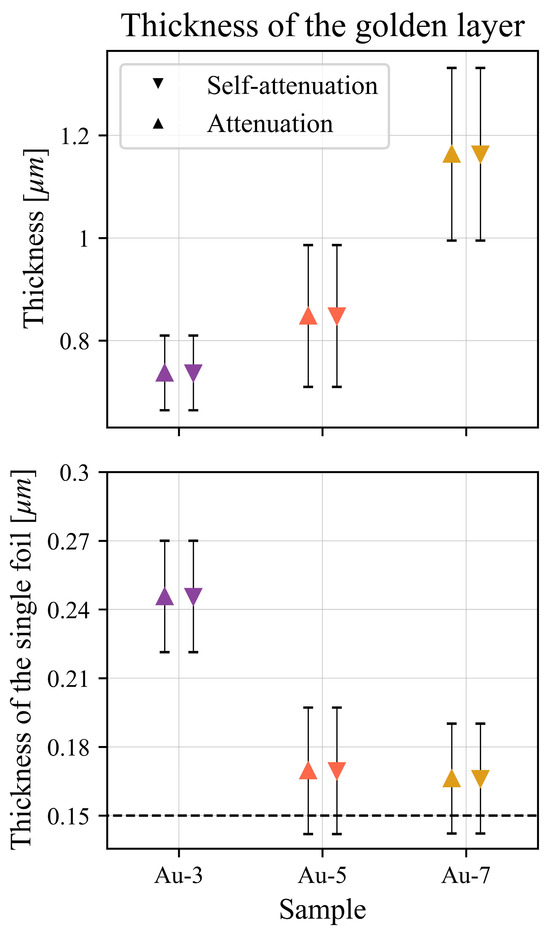
Figure 5.
Results of the measurements on gilded samples, from [77], on top the thickness of the golden layer, on the bottom the thickness of the single foil. For the samples with five and seven foils, the measures agree with the nominal thickness given by the manufacturer.
The second experiment instead aimed to push this technique to its limit, observing what information we can obtain with layers of different thicknesses (in the order of tens to hundreds of micrometers) [79] in the more complex case of painted ceramic, shown in Figure 6 (coming from the same research paper). This ceramic sample has been previously studied with other analytical techniques [80,81]; thus, the composition of the bulk (that for X-rays is the white glaze) was known. The unknown parameters were instead the composition and thickness of the blue and black decorations.
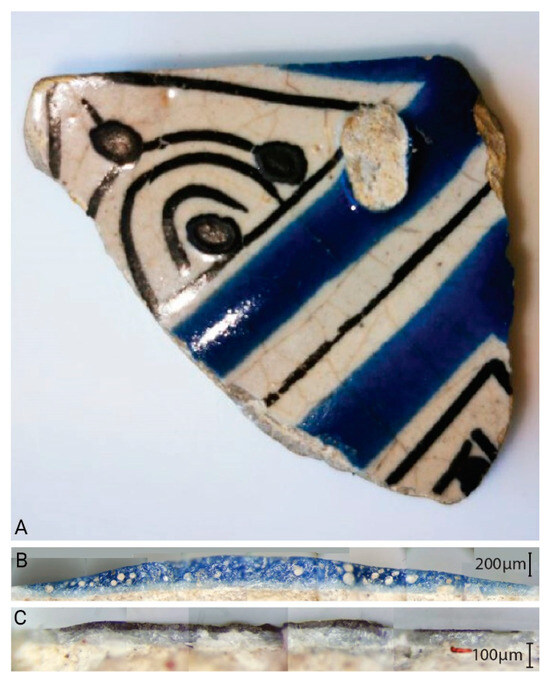
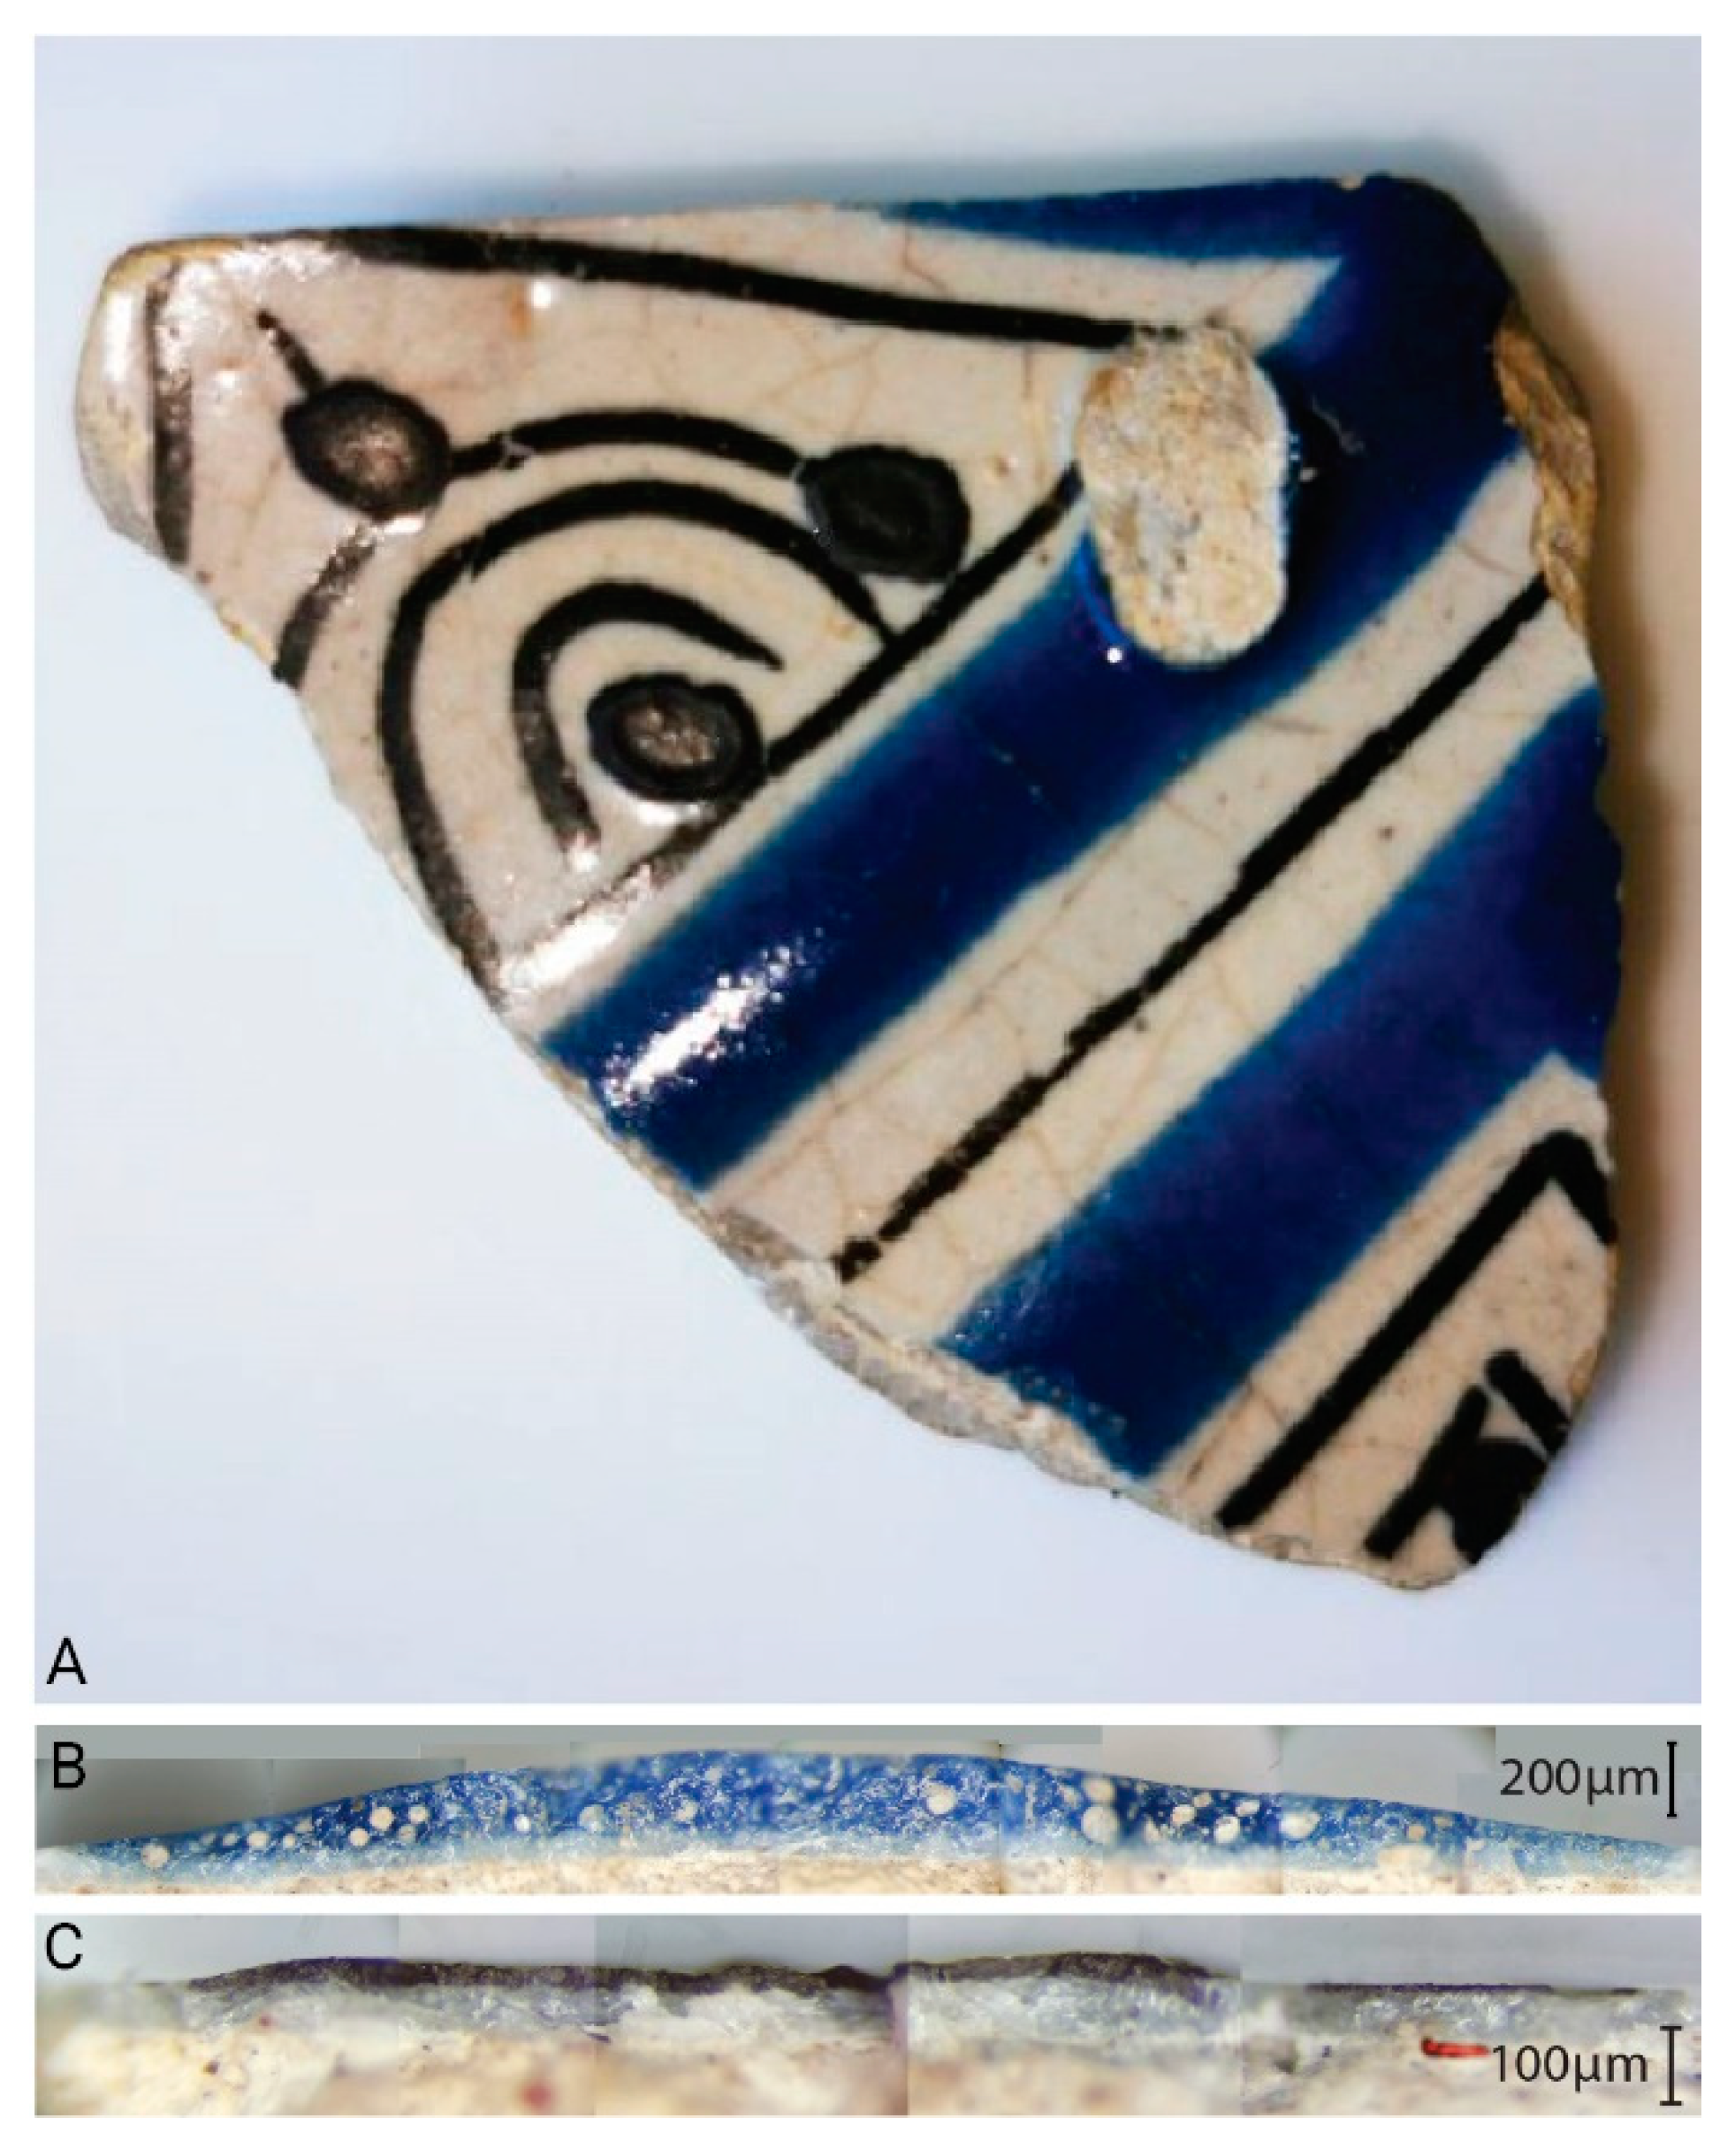
Figure 6.
Puebla ceramic sample, picture from [79]. Over the white glaze, there are blue and black decorations. Picture (A) front view of the shard, picture (B,C) lateral profiles of the shard, the thickness of the black and blue decorations can be appreciated.
The experiment has been performed with the same spectrometer employed for the gilded sample, in this case, collecting three points for each decoration. On the blue decorations, we collected points on the central part of the blue stripe, which is thicker, and three points on the border, where the color is lighter and the decoration is thinner. Similarly, on the black decorations, we collected three points on the stripes, which have a glassy shine, and on the spots with a metallic shine. The elements used as references to study the AR-XRF profiles are those characteristic of each decoration, i.e., the chromophores: cobalt for the blue and iron for the black, we finally used lead for the white glaze. As the sample is more complex and more variables must be considered, the study was not as straightforward as the one of the gildings.
The first consideration is on the shape of the ceramic and of the decorations, as they are not flat, they affect the signal intensity; for this reason, we did not directly employ the AR-XRF profile, but instead, we chose to calculate the ratio of each AR-XRF profile with the one of lead. The second consideration is that we are not certain to penetrate inside the white glaze, so we are not sure that we can retrieve the thickness of the colored glaze. Finally, we do not know the composition of the blue and the black glaze, so we have to estimate it.
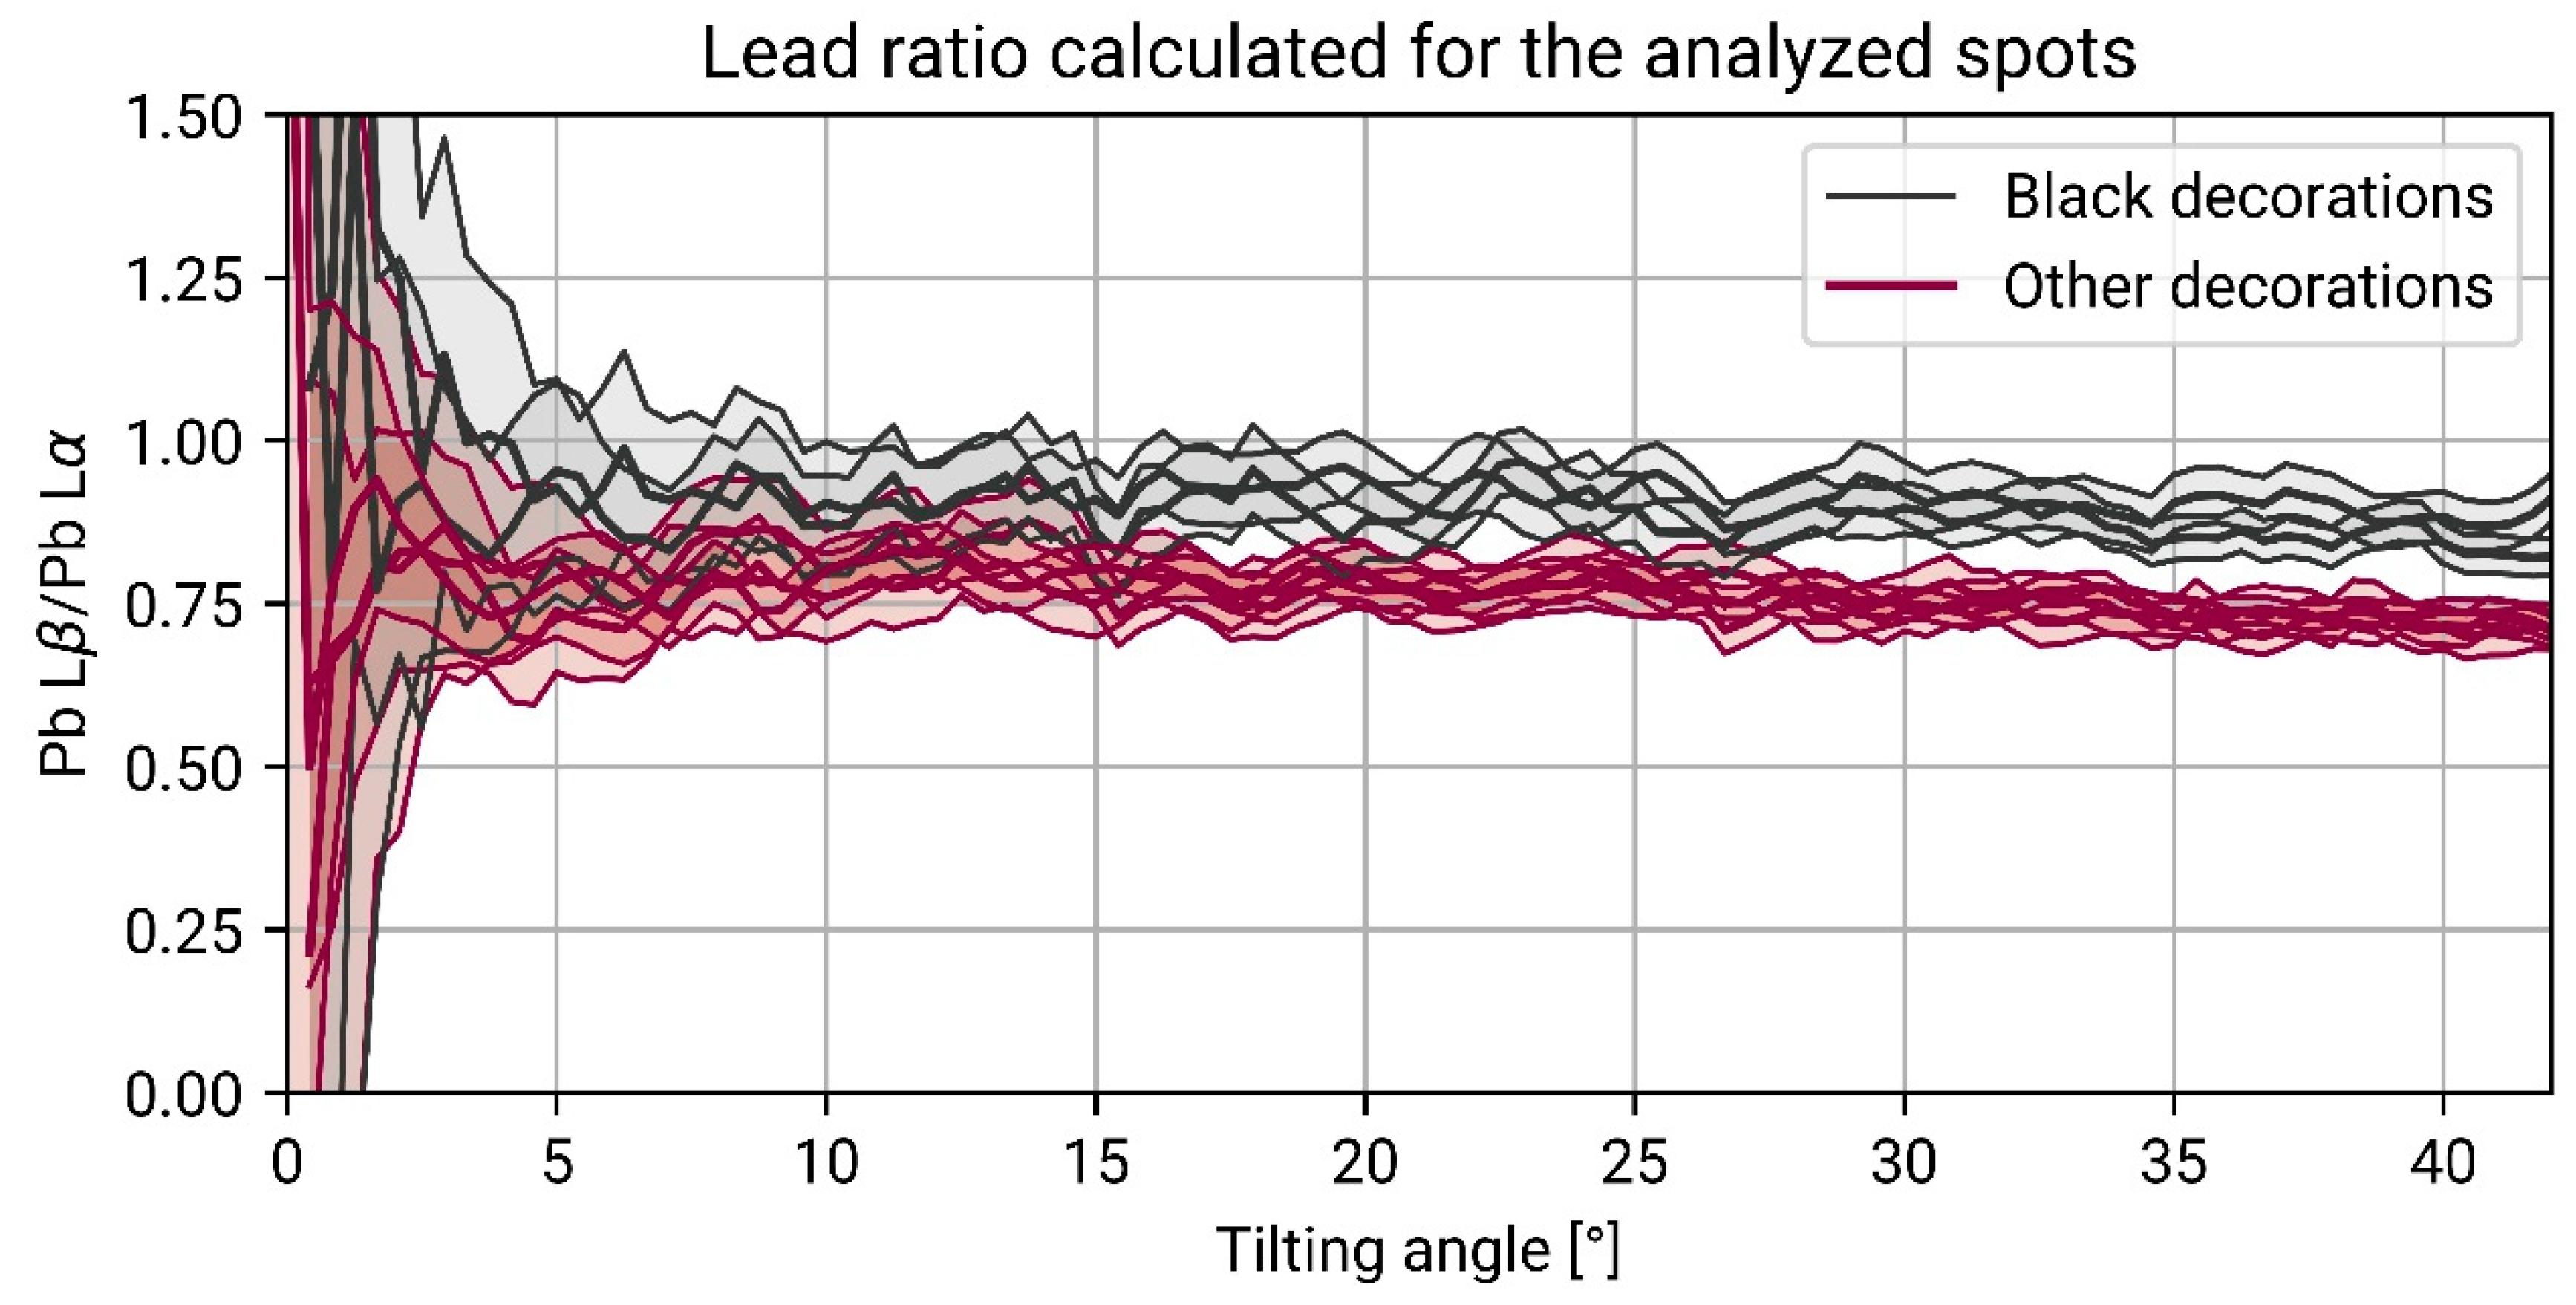
To observe if we could penetrate inside the white glaze and have a meaningful difference in composition with the colored glaze, we looked at the ratio of AR-XRF of lead Lβ/Lα and at the ratio of the chromophore over the lead Lα. The lead ratio, Figure 7, taken from [79], shows that the blue glaze has a very similar composition with respect to the white glaze (the ratio is the same as the white glaze for the whole angular scanning), while the black decorations have a different ratio.

Figure 7.
AR-XRF profile of the lead ratio, taken from [79]. As can be observed, the ratio of the black decorations is different with respect to the ratio obtained in the white and blue decorations, which cannot be distinguished.
The ratio of the chromophore over the lead, Figure 8 (from [79]), then showed that we could not penetrate inside the white glaze for the blue decorations (the ratio was linear over the angular scan, Figure 8 on the left), while we could enter the white glaze in the case of the black decorations (the ratio was not linear, indicating a loss in concentration of the chromophore as we penetrate, Figure 8 on the right). For this reason, we observed that the blue glaze was either too thick or had diffused inside the white glaze, making it impossible to distinguish them.
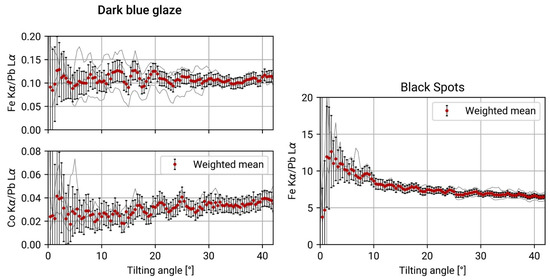
Figure 8.
Modified from [79]. On the (left), AR-XRF ratios calculated for the dark blue glaze, using iron and cobalt as characteristic elements. On the (right), the ratio obtained on the black spots.
We then proceeded to calculate the thickness and estimate the composition of the black decorations. We estimated the composition to be made up of the main components of the glaze, i.e., silicon oxide, lead oxide, and iron oxide. We then simulated the AR-XRF profiles for different thicknesses and compositions to find the range that could describe our sample. We observed that the black spots have a minimum thickness of 20 µm and that they contain less lead oxide concerning the white glaze. Instead, the black stripes are thinner, with a thickness between 25 and 75 µm depending on the point of analysis, with an iron oxide concentration between 7 and 16% and a low concentration of lead oxide (1 to 4.5%).
3.3. Applicability and Limitation of the Technique
Our studies in the cultural heritage fields until now showed that AR-XRF is optimal when (I) dealing with layers with a very different composition, as we observed with the gilded sample or the black decorations, (II) when each layer contains a characteristic element (for example a chromophore), and (III) when some a priori knowledge is present. Instead, it becomes more difficult to interpret or even get good data when the thickness of the layers increases (thus, when little information from the bulk is collected), as in the case of blue decorations of the ceramic, and when a slight variation in composition differentiates the layers. Indeed, as we probe inside the sample, we have to consider two factors: (I) the information we obtain concerns the whole volume; thus, the information added at each step must be weighted for the whole volume investigated with that step, and (II) the signal coming from that volume is highly attenuated by the covering material. Thus, the more we reach inside the sample, the lower the variation in fluorescence signal we can detect. Additionally, we must consider that the maximum limit of depth reached using this technique depends solely on the matrix composition and on the energies employed; thus, it cannot be completely controlled unless we can choose from different fluorescence lines (e.g., if we can detect both Sn K and L lines). This depth limit is the main difference between the applicability of AR-XRF and cross-section, as stressed by Margreiter et al. [82]. As for heavy matrix, it may be restrained only on the first micrometers of the sample.
With these considerations, we can try to compare AR-XRF with other similar techniques. Firstly, we can consider AR-XRF as a complementary technique with respect to CμXRF, as they are both non-invasive and can be applied in a laboratory. While AR is very sensitive to the variations on the sample surface, CμXRF allows us to better distinguish compositional variations deeper inside the sample. Additionally, as confocal XRF selects the volume to be analyzed, it does not put other limitations on the layers’ composition difference and thus gives more flexibility on the mapping of the elements. However, AR-XRF has a better spatial resolution on the sample surface depth profiling, in the order of hundreds of nanometers, while CμXRF has a bigger volume of analysis (generally in the order of tens of micrometers). We must also consider that even the analysis of a cross-section using a laboratory XRF spectrometer cannot give better results in terms of spatial resolution (as, in this case, it is limited by the beam size). We must also remember that even if CμXRF and AR-XRF give complementary results, they cannot be performed with the same spectrometer, as the former deploys a highly divergent beam to maximize the fluorescence signal coming from a small volume of the sample and requires a high divergence also on the detecting system to maximize the fluorescence signal collected from the small volume. In contrast, AR-XRF requires a small divergence to select the volume of analysis.
To obtain a better spatial resolution, we must perform SEM (EDX) analyses or techniques requiring particle beams (IBAs) or synchrotron radiation (thus accessing particular facilities). However, we underline that these two options are not considered sustainable as the first involves sampling, and the second requires access to a large facility.
Finally, the data analysis of multilayer samples made with AR-XRF requires the use of simulations and a first estimation of the sample composition that becomes refined, the same procedures that are employed for GE and GI-XRF. This is certainly a pitfall in the case of cultural heritage samples, as the sample composition is usually very complex; however, the starting composition of the bulk can be estimated with different techniques or with the data already present in the literature.
4. Conclusions
XRF is a diffuse, non-invasive elemental technique often applied in the field of cultural heritage. It is very appreciated as it allows us to obtain fast information without any sample pre-treatment. The avoidance of chemicals, the possibility of re-analyzing the sample with other techniques, and the fact that no part of the sample is altered during the analysis allow us to include this technique in the sustainable and green analyses. One of the limitations of this technique is the impossibility of completely characterizing inhomogeneous samples, as we obtain information on the whole volume analyzed, and we cannot discriminate the contribution of the different layers. To overcome this, we can change the geometry of the analysis, taking advantage of the variation in the path length crossed by the radiation inside the sample and its consequent attenuation, applying the so-called AR-XRF.
In this study, we have then reviewed the capability of AR-XRF to infer the composition and thickness of different layers in a multi-layered sample. This technique has the advantage of being easily implemented in a laboratory, as it only requires a way to tilt either the source, the detector, or the sample, and a collimator. This technique also has the advantage of being very sensitive to the surface composition, allowing the observation of small variations in concentration in the first micrometers of the sample. As the probed volume increases, the technique loses sensitivity. For this reason, the application of this technique is suggested only when major changes in the composition are expected. Considering these factors, AR-XRF can be considered a complementary technique of CμXRF, which, on the other hand, has a bigger volume of analysis yet is more sensitive to small changes even at deeper probed depths.
Cultural heritage artifacts are precious as they store information about our past. For this reason, analyzing them with the lowest possible amount of damage is of the utmost importance. To achieve this objective, non-invasive techniques have to be preferred, and as limited information can be obtained from each technique without collecting samples, it is essential to combine many techniques as reasonably practicable, integrating elemental, molecular, and structural data, extrapolating information with imaging techniques, and limiting the sampling only when strictly necessary. Collaboration and synergy of different specialties and techniques are then the core keys for a more sustainable analytical protocol of cultural heritage samples.
Author Contributions
Conceptualization, J.O. and A.G.; data curation, J.O.; funding acquisition, A.G.; investigation, J.O.; methodology, J.O.; project administration, A.G.; supervision, A.G.; validation, J.O. and A.G.; writing—original draft, J.O. and A.G.; writing—review and editing, J.O. and A.G. All authors have read and agreed to the published version of the manuscript.
Funding
This research received no external funding.
Data Availability Statement
The data presented in this study are available on request from the corresponding author. The data are not publicly available due to privacy restriction.
Acknowledgments
We kindly thank Alessandro Migliori and Romand Padilla Alvarez for allowing us to perform our AR-XRF analyses with their multipurpose spectrometer at the Nuclear Science Instrumentation Laboratories of the International Atomic Energy Agency, Seiberdorf, Austria.
Conflicts of Interest
The authors declare no conflict of interest.
References
- Agha-Aligol, D.; Oliaiy, P.; Mohsenian, M.; Lamehi-Rachti, M.; Shokouhi, F. Provenance Study of Ancient Iranian Luster Pottery Using PIXE Multivariate Statistical Analysis. J. Cult. Herit. 2009, 10, 487–492. [Google Scholar] [CrossRef]
- Eramo, G. Ceramic Technology: How to Recognize Clay Processing. Archaeol. Anthropol. Sci. 2020, 12, 164. [Google Scholar] [CrossRef]
- Hein, A.; Kilikoglou, V. Ceramic Raw Materials: How to Recognize Them and Locate the Supply Basins: Chemistry. Archaeol. Anthropol. Sci. 2020, 12, 180. [Google Scholar] [CrossRef]
- Zipkin, A.M.; Ambrose, S.H.; Lundstrom, C.C.; Bartov, G.; Dwyer, A.; Taylor, A.H. Red Earth, Green Glass, and Compositional Data: A New Procedure for Solid-State Elemental Characterization, Source Discrimination, and Provenience Analysis of Ochres. J. Archaeol. Method Theory 2020, 27, 930–970. [Google Scholar] [CrossRef]
- Liu, H.; Beaudoin, G.; Makvandi, S.; Jackson, S.E.; Huang, X. Multivariate Statistical Analysis of Trace Element Compositions of Native Gold from Orogenic Gold Deposits: Implication for Mineral Exploration. Ore Geol. Rev. 2021, 131, 104061. [Google Scholar] [CrossRef]
- Belfiore, C.M.; Mastelloni, M.A.; Barone, G.; Mazzoleni, P. In Situ XRF Investigations to Unravel the Provenance Area of Corinthian Ware from Excavations in Milazzo (Mylai) and Lipari (Lipára). Herit. Sci. 2022, 10, 32. [Google Scholar] [CrossRef]
- De Ryck, I.; Adriaens, A.; Adams, F. An Overview of Mesopotamian Bronze Metallurgy during the 3rd Millennium BC. J. Cult. Herit. 2005, 6, 261–268. [Google Scholar] [CrossRef]
- Germinario, L.; Zara, A.; Maritan, L.; Bonetto, J.; Hanchar, J.M.; Sassi, R.; Siegesmund, S.; Mazzoli, C. Tracking Trachyte on the Roman Routes: Provenance Study of Roman Infrastructure and Insights into Ancient Trades in Northern Italy. Geoarchaeology 2018, 33, 417–429. [Google Scholar] [CrossRef]
- Lucarini, G.; Barca, D.; Manzo, A. The Provenance of Obsidian Artefacts from the Middle Kingdom Harbour of Mersa/Wadi Gawasis, Egypt, and Its Implications for Red Sea Trade Routes in the 2nd Millennium BC. Quat. Int. 2020, 555, 85–95. [Google Scholar] [CrossRef]
- Casale, S.; Jean, J.S.; Capelli, C.; Braekmans, D.; Degryse, P.; Hofman, C. Transatlantic Connections in Colonial and Post-Colonial Haiti: Archaeometric Evidence for Taches Noires Glazed Tableware Imported from Albissola, Italy to Fort Liberté, Haiti. Int. J. Hist. Archaeol. 2021, 25, 423–447. [Google Scholar] [CrossRef]
- Nørgaard, H.W.; Pernicka, E.; Vandkilde, H. Shifting Networks and Mixing Metals: Changing Metal Trade Routes to Scandinavia Correlate with Neolithic and Bronze Age Transformations. PLoS ONE 2021, 16, e0252376. [Google Scholar] [CrossRef]
- García-Florentino, C.; Maguregui, M.; Marguí, E.; Torrent, L.; Queralt, I.; Madariaga, J.M. Development of Total Reflection X-ray Fluorescence Spectrometry Quantitative Methodologies for Elemental Characterization of Building Materials and Their Degradation Products. Spectrochim. Acta Part B At. Spectrosc. 2018, 143, 18–25. [Google Scholar] [CrossRef]
- Ghirardello, M.; Gonzalez, V.; Monico, L.; Nevin, A.; MacLennan, D.; Patterson, C.S.; Burghammer, M.; Réfrégiers, M.; Comelli, D.; Cotte, M. Application of Synchrotron Radiation-Based Micro-Analysis on Cadmium Yellows in Pablo Picasso’s Femme. Microsc. Microanal. Off. J. Microsc. Soc. Am. Microbeam Anal. Soc. Microsc. Soc. Can. 2022, 28, 1504–1513. [Google Scholar] [CrossRef]
- Stoean, R.; Bacanin, N.; Stoean, C.; Ionescu, L.; Atencia, M.; Joya, G. Computational Framework for the Evaluation of the Composition and Degradation State of Metal Heritage Assets by Deep Learning. J. Cult. Herit. 2023, 64, 198–206. [Google Scholar] [CrossRef]
- Miliani, C.; Rosi, F.; Brunetti, B.G.; Sgamellotti, A. In Situ Noninvasive Study of Artworks: The MOLAB Multitechnique Approach. Acc. Chem. Res. 2010, 43, 728–738. [Google Scholar] [CrossRef]
- Bonizzoni, L.; Canevari, C.; Galli, A.; Gargano, M.; Ludwig, N.; Malagodi, M.; Rovetta, T. A Multidisciplinary Materials Characterization of a Joannes Marcus Viol (16th Century). Herit. Sci. 2014, 2, 15. [Google Scholar] [CrossRef]
- Thickett, D.; Cheung, C.S.; Liang, H.; Twydle, J.; Maev, R.G.; Gavrilov, D. Using Non-Invasive Non-Destructive Techniques to Monitor Cultural Heritage Objects. Insight—Non-Destr. Test. Cond. Monit. 2017, 59, 230–234. [Google Scholar] [CrossRef]
- Melada, J.; Ludwig, N.; Micheletti, F.; Orsilli, J.; Gargano, M.; Grifoni, E.; Bonizzoni, L. Visualization of Defects in Glass through Pulsed Thermography. Appl. Opt. 2020, 59, E57. [Google Scholar] [CrossRef]
- Padeletti, G.; Ingo, G.M.; Bouquillon, A.; Pages, S.; Aucouturier, M.; Röhrs, S.; Fermo, P. First-Time Observation of Mastro Giorgio Masterpieces by Means of Non-Destructive Techniques. Appl. Phys. A 2006, 83, 475–483. [Google Scholar] [CrossRef]
- Pradell, T.; Climent-Font, A.; Molera, J.; Zucchiatti, A.; Ynsa, M.D.; Roura, P.; Crespo, D. Metallic and Nonmetallic Shine in Luster: An Elastic Ion Backscattering Study. J. Appl. Phys. 2007, 101, 103518. [Google Scholar] [CrossRef]
- Ager, F.J.; Ferretti, M.; Grilli, M.L.; Juanes, D.; Ortega-Feliu, I.; Respaldiza, M.A.; Roldán, C.; Scrivano, S. Reconsidering the Accuracy of X-ray Fluorescence and Ion Beam Based Methods When Used to Measure the Thickness of Ancient Gildings. Spectrochim. Acta Part B At. Spectrosc. 2017, 135, 42–47. [Google Scholar] [CrossRef]
- Ortega-Feliu, I.; Ager, F.J.; Roldán, C.; Ferretti, M.; Juanes, D.; Scrivano, S.; Respaldiza, M.A.; Ferrazza, L.; Traver, I.; Grilli, M.L. Multi-Technique Characterization of Gold Electroplating on Silver Substrates for Cultural Heritage Applications. Nucl. Instrum. Methods Phys. Res. Sect. B Beam Interact. Mater. At. 2017, 406, 318–323. [Google Scholar] [CrossRef]
- Radepont, M.; Robinet, L.; Bonnot-Diconne, C.; Pacheco, C.; Pichon, L.; Lemasson, Q.; Moignard, B. Ion Beam Analysis of Silver Leaves in Gilt Leather Wall Coverings. Talanta 2020, 206, 120191. [Google Scholar] [CrossRef]
- Mandò, P.A.; Fedi, M.E.; Grassi, N.; Migliori, A. Differential PIXE for Investigating the Layer Structure of Paintings. Nucl. Instrum. Methods Phys. Res. Sect. B Beam Interact. Mater. At. 2005, 239, 71–76. [Google Scholar] [CrossRef]
- Karydas, A.-G.; Sokaras, D.; Zarkadas, C.; Grlj, N.; Pelicon, P.; Žitnik, M.; Schütz, R.; Malzer, W.; Kanngießer, B. 3D Micro PIXE—A New Technique for Depth-Resolved Elemental Analysis. J. Anal. At. Spectrom. 2007, 22, 1260–1265. [Google Scholar] [CrossRef]
- Leon, Y.; Sciau, P.; Bouquillon, A.; Pichon, L.; de Parseval, P. PIXE (Particle Induced X-ray Emission): A Non-Destructive Analysis Method Adapted to the Thin Decorative Coatings of Antique Ceramics. Nucl. Instrum. Methods Phys. Res. Sect. B Beam Interact. Mater. At. 2012, 291, 45–52. [Google Scholar] [CrossRef]
- Pappalardo, L.; Barresi, S.; Biondi, G.; Caliri, C.; Caruso, F.; Catalano, R.; Lamagna, G.; Manenti, G.A.; Monterosso, G.; Orlando, A.; et al. PIXE-Alpha Non-Destructive and In Situ Compositional Investigation of Black Gloss on Ancient Pottery. X-ray Spectrom. 2016, 45, 258–262. [Google Scholar] [CrossRef]
- Karydas, A.G. Application of a Portable XRF Spectrometer for the Non-Invasive Analysis of Museum Metal Artefacts. Ann. Chim. 2007, 97, 419–432. [Google Scholar] [CrossRef]
- Bonizzoni, L.; Galli, A.; Spinolo, G.; Palanza, V. EDXRF Quantitative Analysis of Chromophore Chemical Elements in Corundum Samples. Anal. Bioanal. Chem. 2009, 395, 2021–2027. [Google Scholar] [CrossRef]
- Galli, A.; Bonizzoni, L.; Sibilia, E.; Martini, M. EDXRF Analysis of Metal Artefacts from the Grave Goods of the Royal Tomb 14 of Sipán, Peru. X-ray Spectrom. 2011, 40, 74–78. [Google Scholar] [CrossRef]
- Eveno, M.; Ravaud, E.; Calligaro, T.; Pichon, L.; Laval, E. The Louvre Crucifix by Giotto—Unveiling the Original Decoration by 2D-XRF, X-ray Radiography, Emissiography and SEM-EDX Analysis. Herit. Sci. 2014, 2, 17. [Google Scholar] [CrossRef]
- da Silva, A.T.; Legrand, S.; Van der Snickt, G.; Featherstone, R.; Janssens, K.; Bottinelli, G. MA-XRF Imaging on René Magritte’s La Condition Humaine: Insights into the Artist’s Palette and Technique and the Discovery of a Third Quarter of La Pose Enchantée. Herit. Sci. 2017, 5, 37. [Google Scholar] [CrossRef]
- van Grieken, R.; Markowicz, A. (Eds.) Handbook of X-ray Spectrometry, 2nd ed.; Practical spectroscopy; rev.expanded; Marcel Dekker: New York, NY, USA, 2002; Volume 29, ISBN 978-0-8247-0600-5. [Google Scholar]
- Beckhoff, B. (Ed.) Handbook of Practical X-ray Fluorescence Analysis; Springer: Berlin/Heidelberg, Germany; New York, NY, USA, 2006; ISBN 978-3-540-28603-5. [Google Scholar]
- Karydas, A.G.; Brecoulaki, H.; Bourgeois, B.; Jockey, P. In Situ X-ray Fluorescence Analysis of Raw Pigments and Traces of Polychromy on Hellenistic Sculpture at the Archaeological Museum of Delos. BCH. Suppl. 2009, 51, 811–829. [Google Scholar]
- Galli, A.; Caccia, M.; Alberti, R.; Bonizzoni, L.; Aresi, N.; Frizzi, T.; Bombelli, L.; Gironda, M.; Martini, M. Discovering the Material Palette of the Artist: A p-XRF Stratigraphic Study of the Giotto Panel ‘God the Father with Angels’: Discovering the Pigment Palette Using a p-XRF Stratigraphic Analysis. X-ray Spectrom. 2017, 46, 435–441. [Google Scholar] [CrossRef]
- Trojek, T.; Prokeš, R.; Šefců, R.; Bilavčíková, H.; Čechák, T. Confocal X-ray Fluorescence Spectrometer for In-Situ Analyses of Paintings. Radiat. Phys. Chem. 2017, 137, 238–242. [Google Scholar] [CrossRef]
- Van der Snickt, G.; Legrand, S.; Slama, I.; Van Zuien, E.; Gruber, G.; Van der Stighelen, K.; Klaassen, L.; Oberthaler, E.; Janssens, K. In Situ Macro X-ray Fluorescence (MA-XRF) Scanning as a Non-Invasive Tool to Probe for Subsurface Modifications in Paintings by P.P. Rubens. Microchem. J. 2018, 138, 238–245. [Google Scholar] [CrossRef]
- Campos, P.H.O.V.; Appoloni, C.R.; Rizzutto, M.A.; Leite, A.R.; Assis, R.F.; Santos, H.C.; Silva, T.F.; Rodrigues, C.L.; Tabacniks, M.H.; Added, N. A Low-Cost Portable System for Elemental Mapping by XRF Aiming In Situ Analyses. Appl. Radiat. Isot. 2019, 152, 78–85. [Google Scholar] [CrossRef]
- Tapia, J.; Eveno, M.; Calligaro, T.; Pichon, L.; Laval, E.; Ravaud, E.; Reiche, I. Efficiency of Combined MA-XRF and CXRF to Give Nondestructive Insights about Changes of a Historical Painting. Eur. Phys. J. Plus 2023, 138, 46. [Google Scholar] [CrossRef]
- Gerken, M.; Sander, J.; Krekel, C. Visualising Iron Gall Ink Underdrawings in Sixteenth Century Paintings In-Situ by Micro-XRF Scanning (MA-XRF) and LED-Excited IRR (LEDE-IRR). Herit. Sci. 2022, 10, 78. [Google Scholar] [CrossRef]
- Kuz’mina, T.G.; Romashova, T.V.; Troneva, M.A.; Khokhlova, I.V. Experience of the Determination of Fluorine in Rocks by X-ray Fluorescence Spectrometry. J. Anal. Chem. 2023, 78, 975–979. [Google Scholar] [CrossRef]
- Bonizzoni, L.; Galli, A.; Poldi, G. In Situ EDXRF Analyses on Renaissance Plaquettes and Indoor Bronzes Patina Problems and Provenance Clues. X-ray Spectrom. Int. J. 2008, 37, 388–394. [Google Scholar] [CrossRef]
- Greiner-Wronowa, E.; Zabiegaj, D.; Piccardo, P. Glass–Metal Objects from Archaeological Excavation: Corrosion Study. Appl. Phys. A 2013, 113, 999–1008. [Google Scholar] [CrossRef]
- Ingo, G.M.; Bustamante, A.D.; Alva, W.; Angelini, E.; Cesareo, R.; Gigante, G.E.; Zambrano, S.D.P.A.; Riccucci, C.; Di Carlo, G.; Parisi, E.I.; et al. Gold Coated Copper Artifacts from the Royal Tombs of Sipán (Huaca Rajada, Perù): Manufacturing Techniques and Corrosion Phenomena. Appl. Phys. A 2013, 113, 877–887. [Google Scholar] [CrossRef]
- Alloteau, F.; Lehuédé, P.; Majérus, O.; Biron, I.; Dervanian, A.; Charpentier, T.; Caurant, D. New Insight into Atmospheric Alteration of Alkali-Lime Silicate Glasses. Corros. Sci. 2017, 122, 12–25. [Google Scholar] [CrossRef]
- Bethencourt, M.; Fernández-Montblanc, T.; Izquierdo, A.; González-Duarte, M.M.; Muñoz-Mas, C. Study of the Influence of Physical, Chemical and Biological Conditions That Influence the Deterioration and Protection of Underwater Cultural Heritage. Sci. Total Environ. 2018, 613–614, 98–114. [Google Scholar] [CrossRef]
- Negi, A.; Sarethy, I.P. Microbial Biodeterioration of Cultural Heritage: Events, Colonization, and Analyses. Microb. Ecol. 2019, 78, 1014–1029. [Google Scholar] [CrossRef]
- Majérus, O.; Lehuédé, P.; Biron, I.; Alloteau, F.; Narayanasamy, S.; Caurant, D. Glass Alteration in Atmospheric Conditions: Crossing Perspectives from Cultural Heritage, Glass Industry, and Nuclear Waste Management. Mater. Degrad. 2020, 4, 27. [Google Scholar] [CrossRef]
- Karimi, M.; Amiri, N.; Tabbakh Shabani, A.A. Thickness Measurement of Coated Ni on Brass Plate Using Kα/Kβ Ratio by XRF Spectrometry. X-ray Spectrom. 2009, 38, 234–238. [Google Scholar] [CrossRef]
- Cesareo, R.; de Assis, J.T.; Roldán, C.; Bustamante, A.D.; Brunetti, A.; Schiavon, N. Multilayered Samples Reconstructed by Measuring Kα/Kβ or Lα/Lβ X-ray Intensity Ratios by EDXRF. Nucl. Instrum. Methods Phys. Res. Sect. B Beam Interact. Mater. At. 2013, 312, 15–22. [Google Scholar] [CrossRef]
- Bottaini, C.; Mirão, J.; Candeias, A.; Catarino, H.; Silva, R.J.; Brunetti, A. Elemental Characterisation of a Collection of Metallic Oil Lamps from South-Western al-Andalus Using EDXRF and Monte Carlo Simulation. Eur. Phys. J. Plus 2019, 134, 365. [Google Scholar] [CrossRef]
- Pessanha, S.; Queralt, I.; Carvalho, M.L.; Sampaio, J.M. Determination of Gold Leaf Thickness Using X-ray Fluorescence Spectrometry: Accuracy Comparison Using Analytical Methodology and Monte Carlo Simulations. Appl. Radiat. Isot. 2019, 152, 6–10. [Google Scholar] [CrossRef]
- Brocchieri, J.; Scialla, E.; Sabbarese, C. Estimation of Ag Coating Thickness by Different Methods Using a Handheld XRF Instrument. Nucl. Instrum. Methods Phys. Res. Sect. B Beam Interact. Mater. At. 2021, 486, 73–84. [Google Scholar] [CrossRef]
- Sabbarese, C.; Brocchieri, J.; Scialla, E. Gold-Coating Thickness Determination on Ag, Cu, Fe, and Pb Using a Handheld X-ray Instrument. X-ray Spectrom. 2021, 50, 425–435. [Google Scholar] [CrossRef]
- Brocchieri, J.; Scialla, E.; Manzone, A.; Oreste Graziano, G.; Sabbarese, C. Gouache Gilding on Lead and Wood Objects Studied by Multivariate and Graph Analyses Applied to XRF Spectra. J. Archaeol. Sci. Rep. 2022, 42, 103382. [Google Scholar] [CrossRef]
- Trojek, T.; Wegrzynek, D. X-ray Fluorescence Kα/Kβ Ratios for a Layered Specimen: Comparison of Measurements and Monte Carlo Calculations with the MCNPX Code. Nucl. Instrum. Methods Phys. Res. Sect. Accel. Spectrometers Detect. Assoc. Equip. 2010, 619, 311–315. [Google Scholar] [CrossRef]
- Bottaini, C.E.; Brunetti, A.; Montero-Ruiz, I.; Valera, A.; Candeias, A.; Mirão, J. Use of Monte Carlo Simulation as a Tool for the Nondestructive Energy Dispersive X-ray Fluorescence (ED-XRF) Spectroscopy Analysis of Archaeological Copper-Based Artifacts from the Chalcolithic Site of Perdigões, Southern Portugal. Appl. Spectrosc. 2018, 72, 17–27. [Google Scholar] [CrossRef]
- Trojek, T. Iterative Monte Carlo Procedure for Quantitative X-ray Fluorescence Analysis of Copper Alloys with a Covering Layer. Radiat. Phys. Chem. 2020, 167, 108294. [Google Scholar] [CrossRef]
- Šmit, Ž.; Janssens, K.; Proost, K.; Langus, I. Confocal μ-XRF Depth Analysis of Paint Layers. Nucl. Instrum. Methods Phys. Res. Sect. B Beam Interact. Mater. At. 2004, 219–220, 35–40. [Google Scholar] [CrossRef]
- Nakano, K.; Tsuji, K. Nondestructive Elemental Depth Profiling of Japanese Lacquerware ‘Tamamushi-Nuri’ by Confocal 3D-XRF Analysis in Comparison with Micro GE-XRF. X-ray Spectrom. 2009, 38, 446–450. [Google Scholar] [CrossRef]
- Kanngießer, B.; Malzer, W.; Mantouvalou, I.; Sokaras, D.; Karydas, A.G. A Deep View in Cultural Heritage—Confocal Micro X-ray Spectroscopy for Depth Resolved Elemental Analysis. Appl. Phys. A 2012, 106, 325–338. [Google Scholar] [CrossRef]
- Ager, F.J.; Respaldiza, M.A.; Scrivano, S.; Ortega-Feliu, I.; Kriznar, A.; Gómez-Tubío, B. Cultural Heritage Science at CNA (Seville, Spain): Applications of XRF and IBA Techniques to Art and Archaeological Objects. Radiat. Phys. Chem. 2020, 167, 108324. [Google Scholar] [CrossRef]
- Trojek, T.; Hložek, M. Confocal XRF Imaging for Determination of Arsenic Distribution in a Sample of Historic Plaster. Radiat. Phys. Chem. 2022, 200, 110201. [Google Scholar] [CrossRef]
- Heimler, K.; Gottschalk, C.; Vogt, C. Confocal Micro X-ray Fluorescence Analysis for the Non-Destructive Investigation of Structured and Inhomogeneous Samples. Anal. Bioanal. Chem. 2023, 415, 5083–5100. [Google Scholar] [CrossRef]
- de Bokx, P.K.; Kok, C.; Bailleul, A.; Wiener, G.; Urbach, H.P. Grazing-Emission X-ray Fluorescence Spectrometry; Principles and Applications. Spectrochim. Acta Part B At. Spectrosc. 1997, 52, 829–840. [Google Scholar] [CrossRef]
- Stoev, K.N.; Sakurai, K. Review on Grazing Incidence X-ray Spectrometry and Reflectometry. Spectrochim. Acta Part B At. Spectrosc. 1999, 54, 41–82. [Google Scholar] [CrossRef]
- Krämer, M.; von Bohlen, A.; Sternemann, C.; Paulus, M.; Hergenröder, R. X-ray Standing Waves: A Method for Thin Layered Systems. J. Anal. At. Spectrom. 2006, 21, 1136–1142. [Google Scholar] [CrossRef]
- von Bohlen, A. Total Reflection X-ray Fluorescence and Grazing Incidence X-ray Spectrometry—Tools for Micro- and Surface Analysis. A Review. Spectrochim. Acta Part B At. Spectrosc. 2009, 64, 821–832. [Google Scholar] [CrossRef]
- Kayser, Y.; Sá, J.; Szlachetko, J. Depth-Resolved X-ray Absorption Spectroscopy by Means of Grazing Emission X-ray Fluorescence. Anal. Chem. 2015, 87, 10815–10821. [Google Scholar] [CrossRef] [PubMed]
- Baumann, J.; Kayser, Y.; Kanngießer, B. Grazing Emission X-ray Fluorescence: Novel Concepts and Applications for Nano-Analytics. Phys. Status Solidi B 2021, 258, 2000471. [Google Scholar] [CrossRef]
- Staeck, S.; Andrle, A.; Hönicke, P.; Baumann, J.; Grötzsch, D.; Weser, J.; Goetzke, G.; Jonas, A.; Kayser, Y.; Förste, F.; et al. Scan-Free GEXRF in the Soft X-ray Range for the Investigation of Structured Nanosamples. Nanomaterials 2022, 12, 3766. [Google Scholar] [CrossRef]
- Fiorini, C.; Gianoncelli, A.; Longoni, A.; Zaraga, F. Determination of the Thickness of Coatings by Means of a New XRF Spectrometer. X-ray Spectrom. 2002, 31, 92–99. [Google Scholar] [CrossRef]
- Szwedowski-Rammert, V.; Baumann, J.; Schlesiger, C.; Waldschläger, U.; Gross, A.; Kanngießer, B.; Mantouvalou, I. Laboratory Based GIXRF and GEXRF Spectrometers for Multilayer Structure Investigations. J. Anal. At. Spectrom. 2019, 34, 922–929. [Google Scholar] [CrossRef]
- Szwedowski-Rammert, V. New Approaches in Angle Resolved X-ray Analysis of Stratified Materials in the Laboratory; Technischen Universität Berlin: Berlin, Germany, 2019. [Google Scholar]
- Baumann, J.; Grötzsch, D.; Scharf, O.; Kodalle, T.; Bergmann, R.; Bilchenko, F.; Mantouvalou, I.; Kanngießer, B. A Compact and Efficient Angle-Resolved X-ray Fluorescence Spectrometer for Elemental Depth Profiling. Spectrochim. Acta Part B At. Spectrosc. 2021, 181, 106216. [Google Scholar] [CrossRef]
- Orsilli, J.; Migliori, A.; Padilla-Alvarez, R.; Martini, M.; Galli, A. AR-XRF Measurements and Data Treatment for the Evaluation of Gilding Samples of Cultural Heritage. J. Anal. At. Spectrom. 2023, 38, 174–185. [Google Scholar] [CrossRef]
- Karydas, A.G.; Czyzycki, M.; Leani, J.J.; Migliori, A.; Osan, J.; Bogovac, M.; Wrobel, P.; Vakula, N.; Padilla-Alvarez, R.; Menk, R.H.; et al. An IAEA Multi-Technique X-ray Spectrometry Endstation at Elettra Sincrotrone Trieste: Benchmarking Results and Interdisciplinary Applications. J. Synchrotron Radiat. 2018, 25, 189–203. [Google Scholar] [CrossRef] [PubMed]
- Orsilli, J.; Martini, M.; Galli, A. Angle Resolved-XRF Analysis of Puebla Ceramic Decorations. Spectrochim. Acta Part B At. Spectrosc. 2023, 210, 106809. [Google Scholar] [CrossRef]
- Padilla Alvarez, R.; Arrazcaeta Delgado, R.; Oliva, C.; Bishop, R.; Blackmann, J.; Schalm, O. Consideraciones Adicionales a La Clasificación de Cerámica Colonial En Antrosoles Habaneros. Boletín Gab. Arqueol. 2005, 4, 14–28. [Google Scholar]
- Padilla, R.; Schalm, O.; Janssens, K.; Arrazcaeta, R.; Van Espen, P. Microanalytical Characterization of Surface Decoration in Majolica Pottery. Anal. Chim. Acta 2005, 535, 201–211. [Google Scholar] [CrossRef]
- Margreiter, R.; Baumann, J.; Mantouvalou, I.; Radtke, M.; Reinholz, U.; Strub, E. Investigations on Fire-Gilding. Archaeometry 2022, 64, 1465–1478. [Google Scholar] [CrossRef]


Disclaimer/Publisher’s Note: The statements, opinions and data contained in all publications are solely those of the individual author(s) and contributor(s) and not of MDPI and/or the editor(s). MDPI and/or the editor(s) disclaim responsibility for any injury to people or property resulting from any ideas, methods, instructions or products referred to in the content. |
© 2024 by the authors. Licensee MDPI, Basel, Switzerland. This article is an open access article distributed under the terms and conditions of the Creative Commons Attribution (CC BY) license (https://creativecommons.org/licenses/by/4.0/).