

Assessing Subjective and Objective Road Environment Perception in the Bangkok Metropolitan Region, Thailand: A Deep Learning Approach Utilizing Street Images

 ,
,
Abstract
:1. Introduction
2. Literature Review
2.1. Road Environment and Perception
2.2. Assessment of Urban and Road Environments Perception
2.3. Applying Street Images and Deep-Learning Technique for Urban and Road Environments Perception
3. Data and Methods
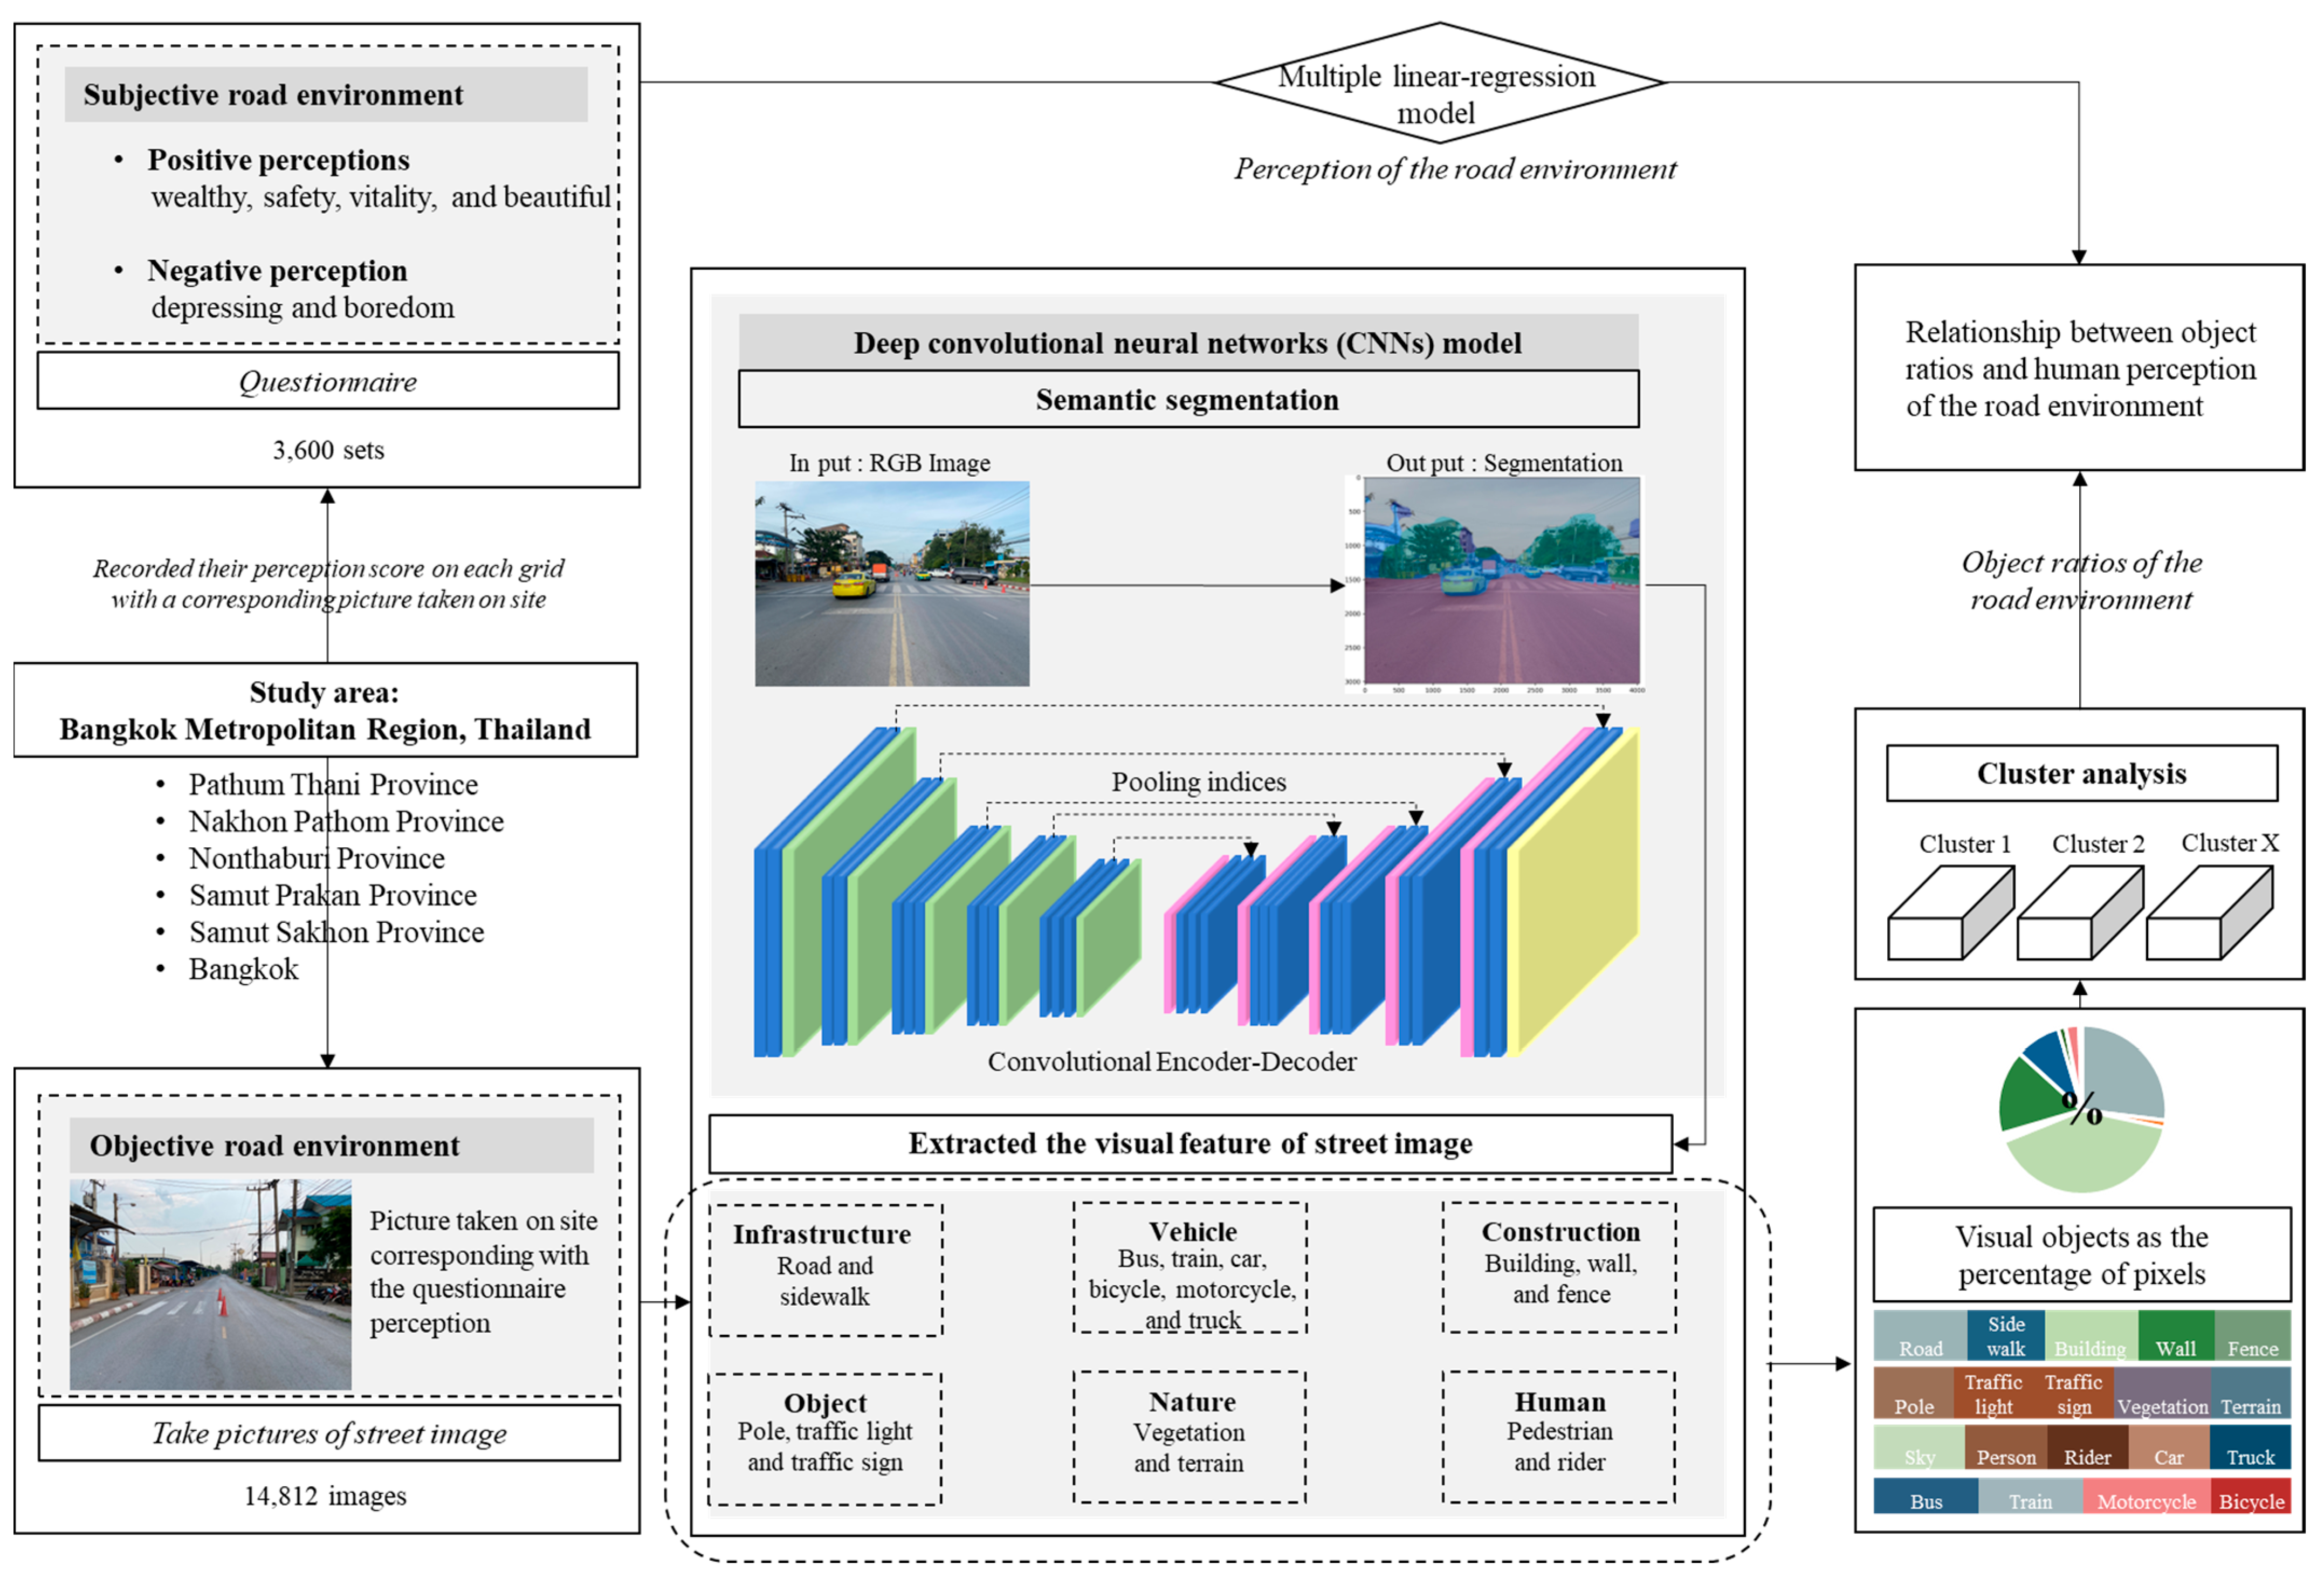
3.1. Analytical Framework
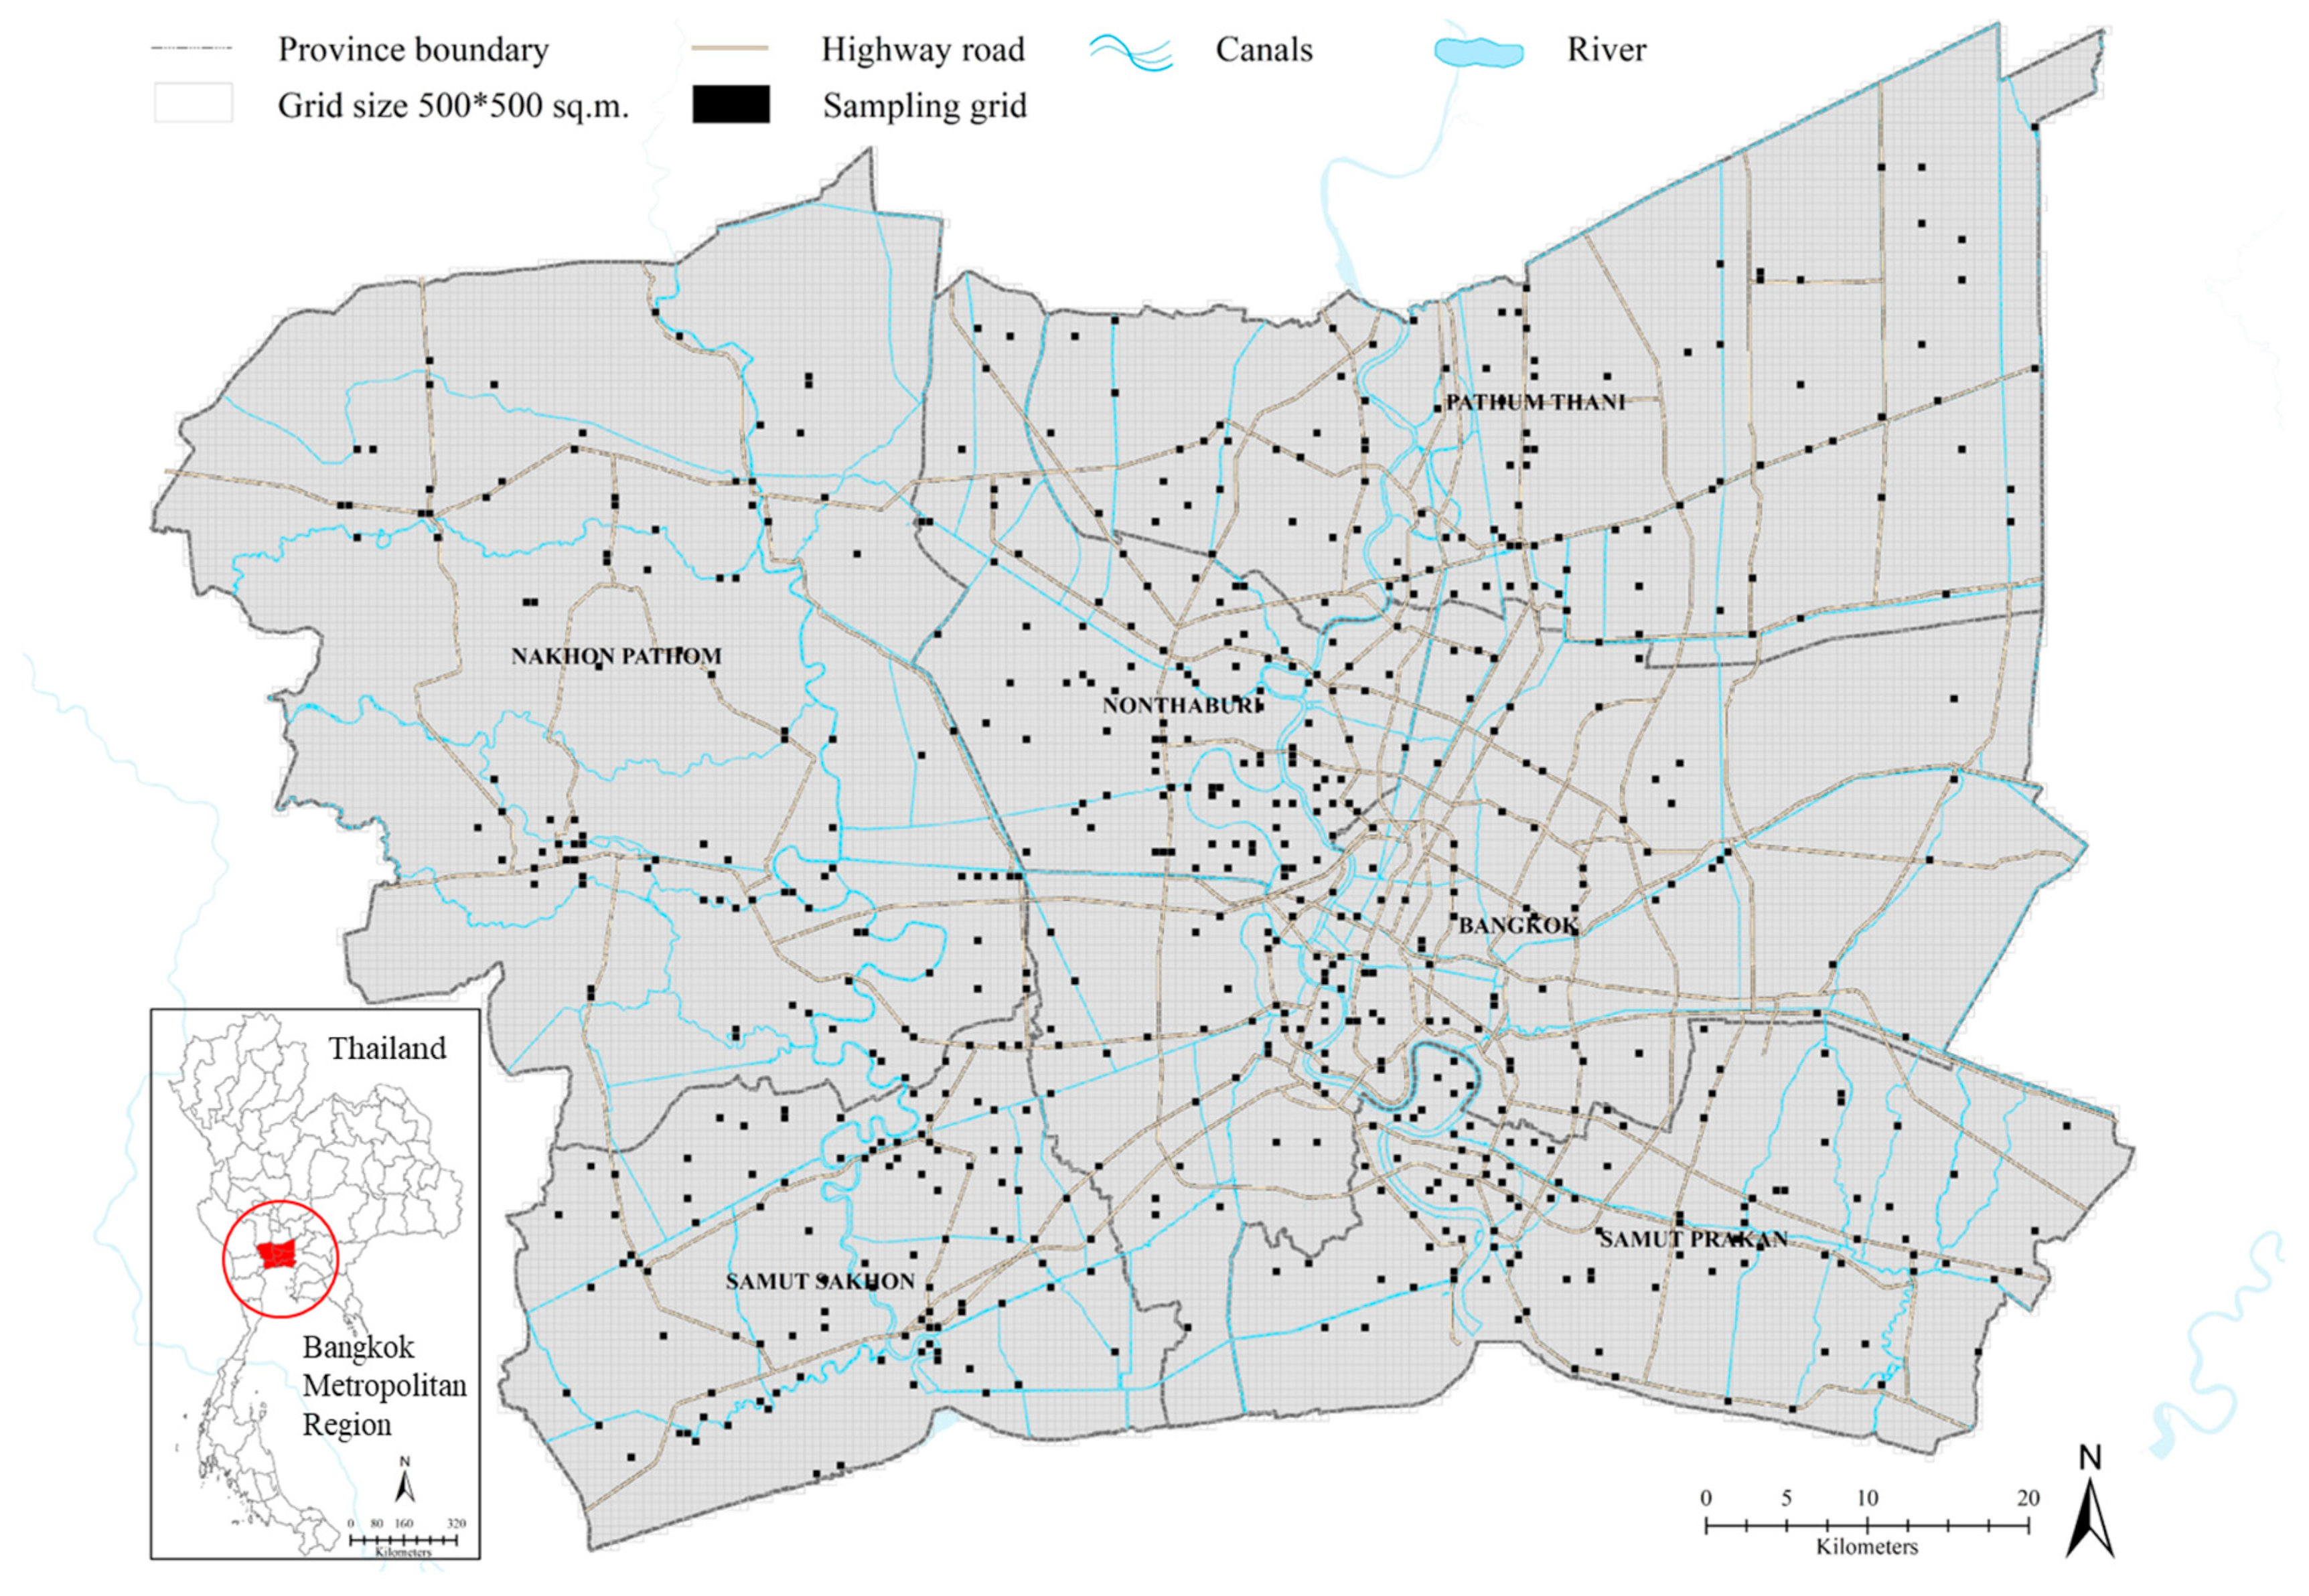
3.2. Study Area and Sampling Design
3.3. Subjective and Objective Road Environment Data
- Road environment image data: This data is collected through extensive area surveys, involving the capture of photographs of the road environment. This study concentrates on the environmental perception of individuals residing in the vicinity of the surveyed road. The participants are both residents and individuals familiar with traveling under these conditions. The utilization of road imagery in analysis necessitates careful consideration of the analysis’s purpose to ensure the provision of the most comprehensive representation of the data. For instance, when investigating issues related to the walking and cycling environment, the visual perspective should emphasize infrastructure relevant to walking and cycling [34,35]. Consequently, the focused imagery captures the central segment of the road, providing a comprehensive view of the surroundings on both sides. Ensuring inclusivity of contextual details, such as sidewalks and bicycle paths, in the images is crucial. Additionally, apart from having a view from the center of the road, the quality of the images must be assessed to achieve optimal outcomes by excluding common issues such as poor lighting, sharpness, and inclement weather [35,36]. Therefore, in this study, images were captured under clear skies on a day with normal weather conditions, and the timing of capture coincided with travel, incorporating up-to-date information. The image data were thoroughly screened before undergoing analysis. This approach enables the images to mirror the road environment extensively, as illustrated in Figure 3. A total of 14,812 images were captured within the Bangkok Metropolitan Region (Nakhon Pathom (A1–A5), Nonthaburi (B1–B5), Pathum Thani (C1–C5), Bangkok (D1–D5), Samut Prakan (E1–E5), and Samut Sakhon (F1–F5)) during a specific time period for comparative analysis. The images were captured at the same location as the questionnaire data collection, depicting the real-time environment within the area at that particular moment. This contrasts with Google Street View images, as our data reflects the current conditions during the survey period.

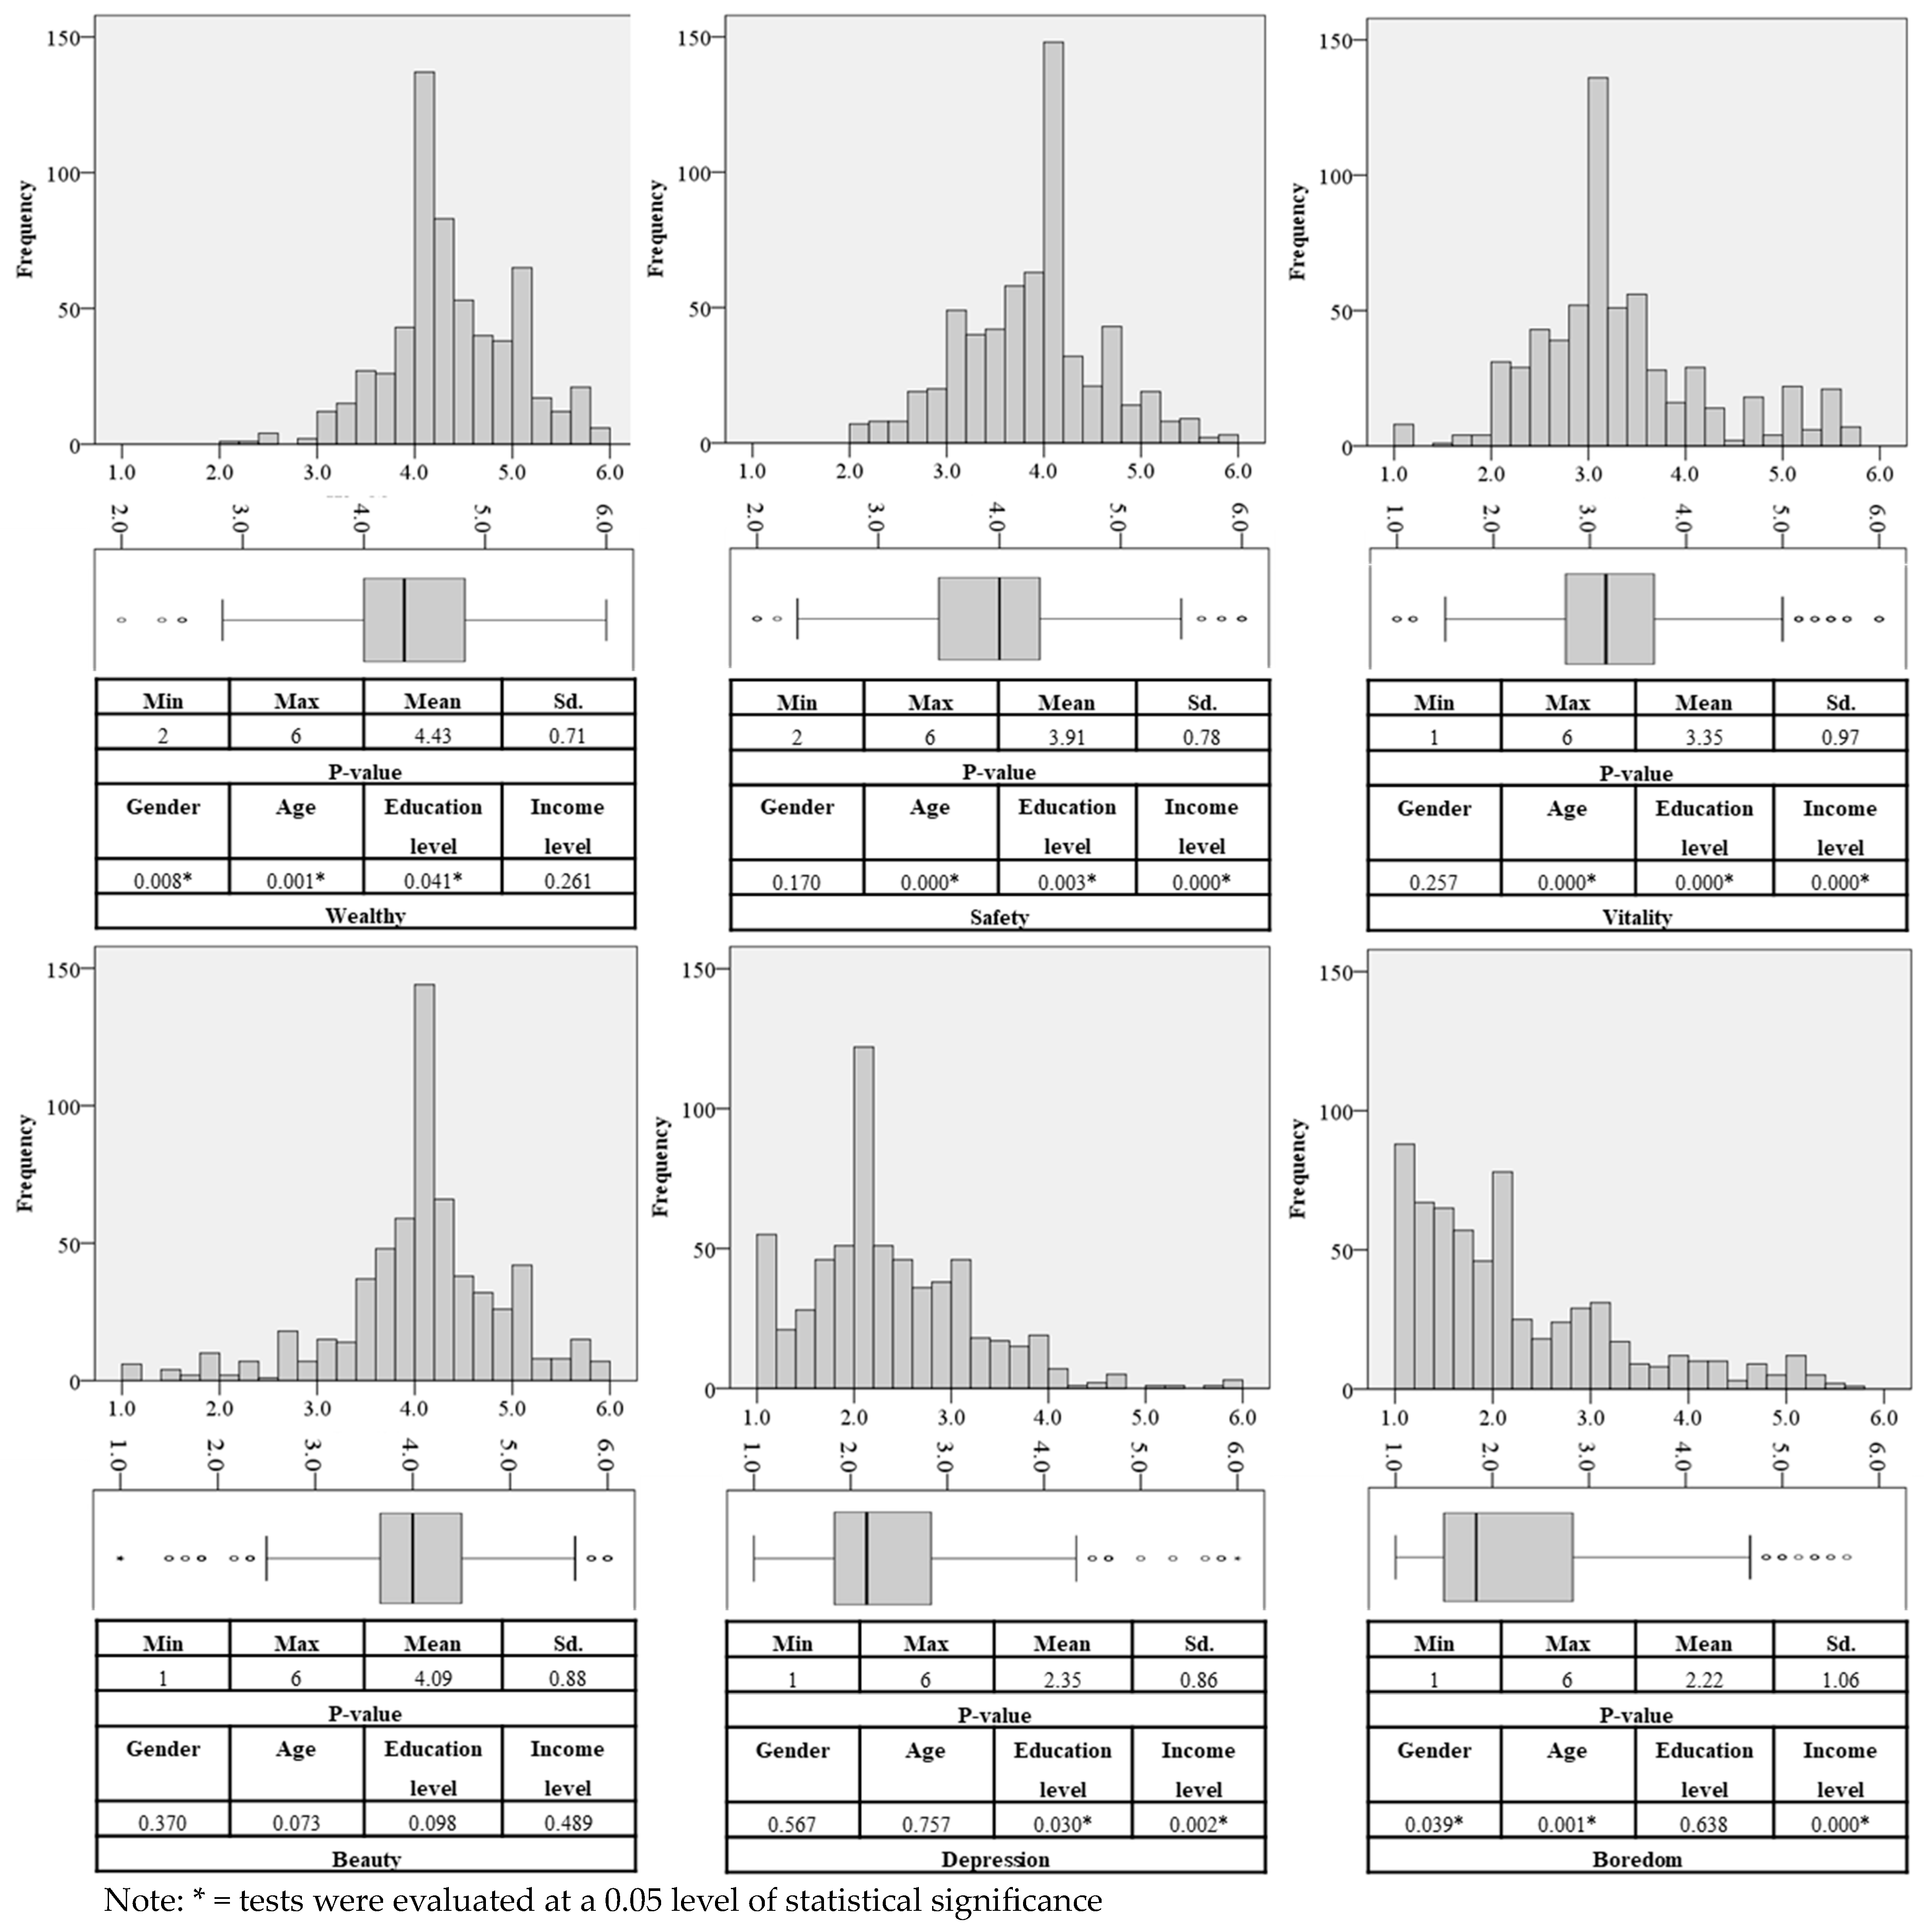
- Perceptions of the road environment: Data were gathered through a questionnaire designed to assess individuals’ perceptions of the road environment. The questionnaire consisted of inquiries categorized into two main areas, comprising two parts: (1) questions related to the socio-economic characteristics of the sample, and (2) questions concerning the sample’s perception of the road environment, consisting of 6 items. This section encompasses positive perceptions, including notions of wealth, safety, vitality, and beauty, along with negative perceptions associated with feelings of depression and boredom. Commuters’ perceptions were measured on a 6-level scale, where 1 represented the lowest perception and 6 corresponded to the highest perceptibility. The questionnaire underwent meticulous design and refinement in close consultation with experts. Prior to collecting the actual data from the comprehensive questionnaire, a pilot study was conducted to assess the respondents’ understanding and to identify discrepancies in the questions. The questionnaire was then improved based on the feedback from the pilot study. Subsequently, the documents were submitted for human ethics consideration before commencing with data collection. The data were surveyed over a period of two months, from December 2022 to January 2023.
3.4. Data Collection
3.5. Data Analysis
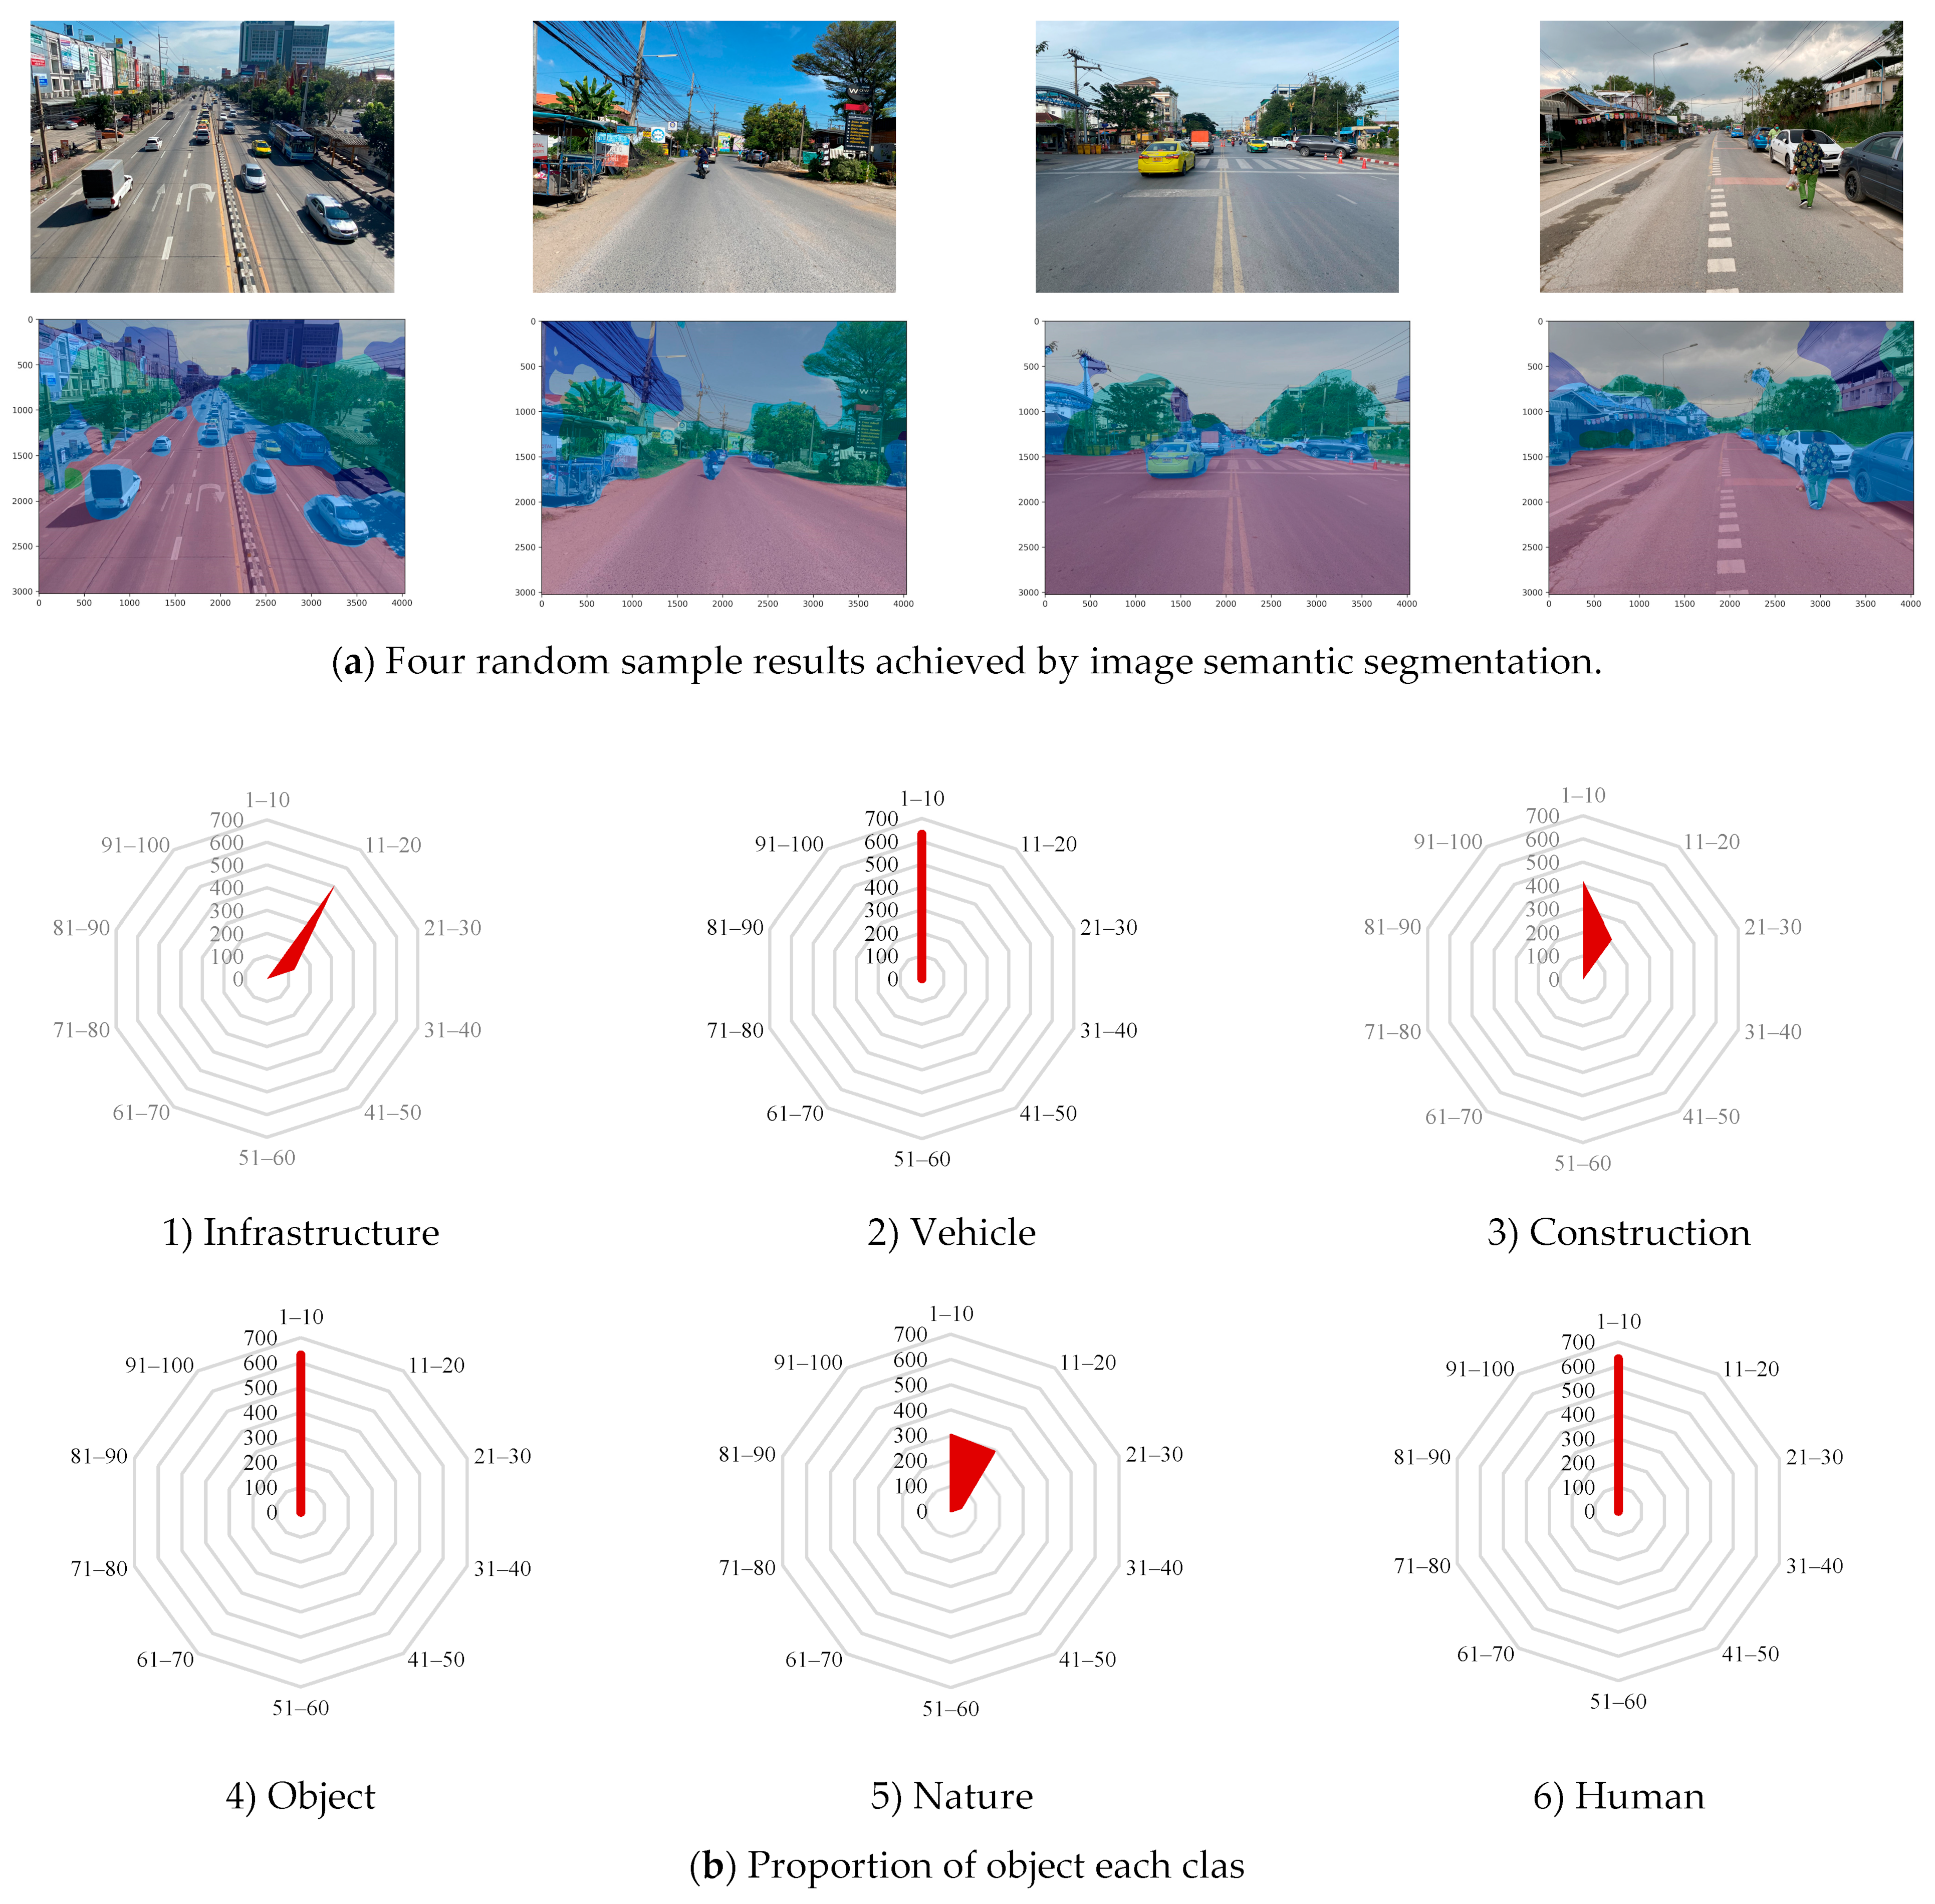
3.5.1. Image Semantic Segmentation and Deep Learning Technique
3.5.2. Incorporating Additional Micro-Scale Urban Perception Data: Bridging the Gap between Subjective and Objective Road Environments
3.5.3. Analysis of the Relationship between Objective Road Environment Factors and Individuals’ Perceptions of the Road Environment
4. Results
4.1. Socio-Economic Characteristic of Respondents
4.2. Road and Street Environment
4.3. Perception of Road Environment
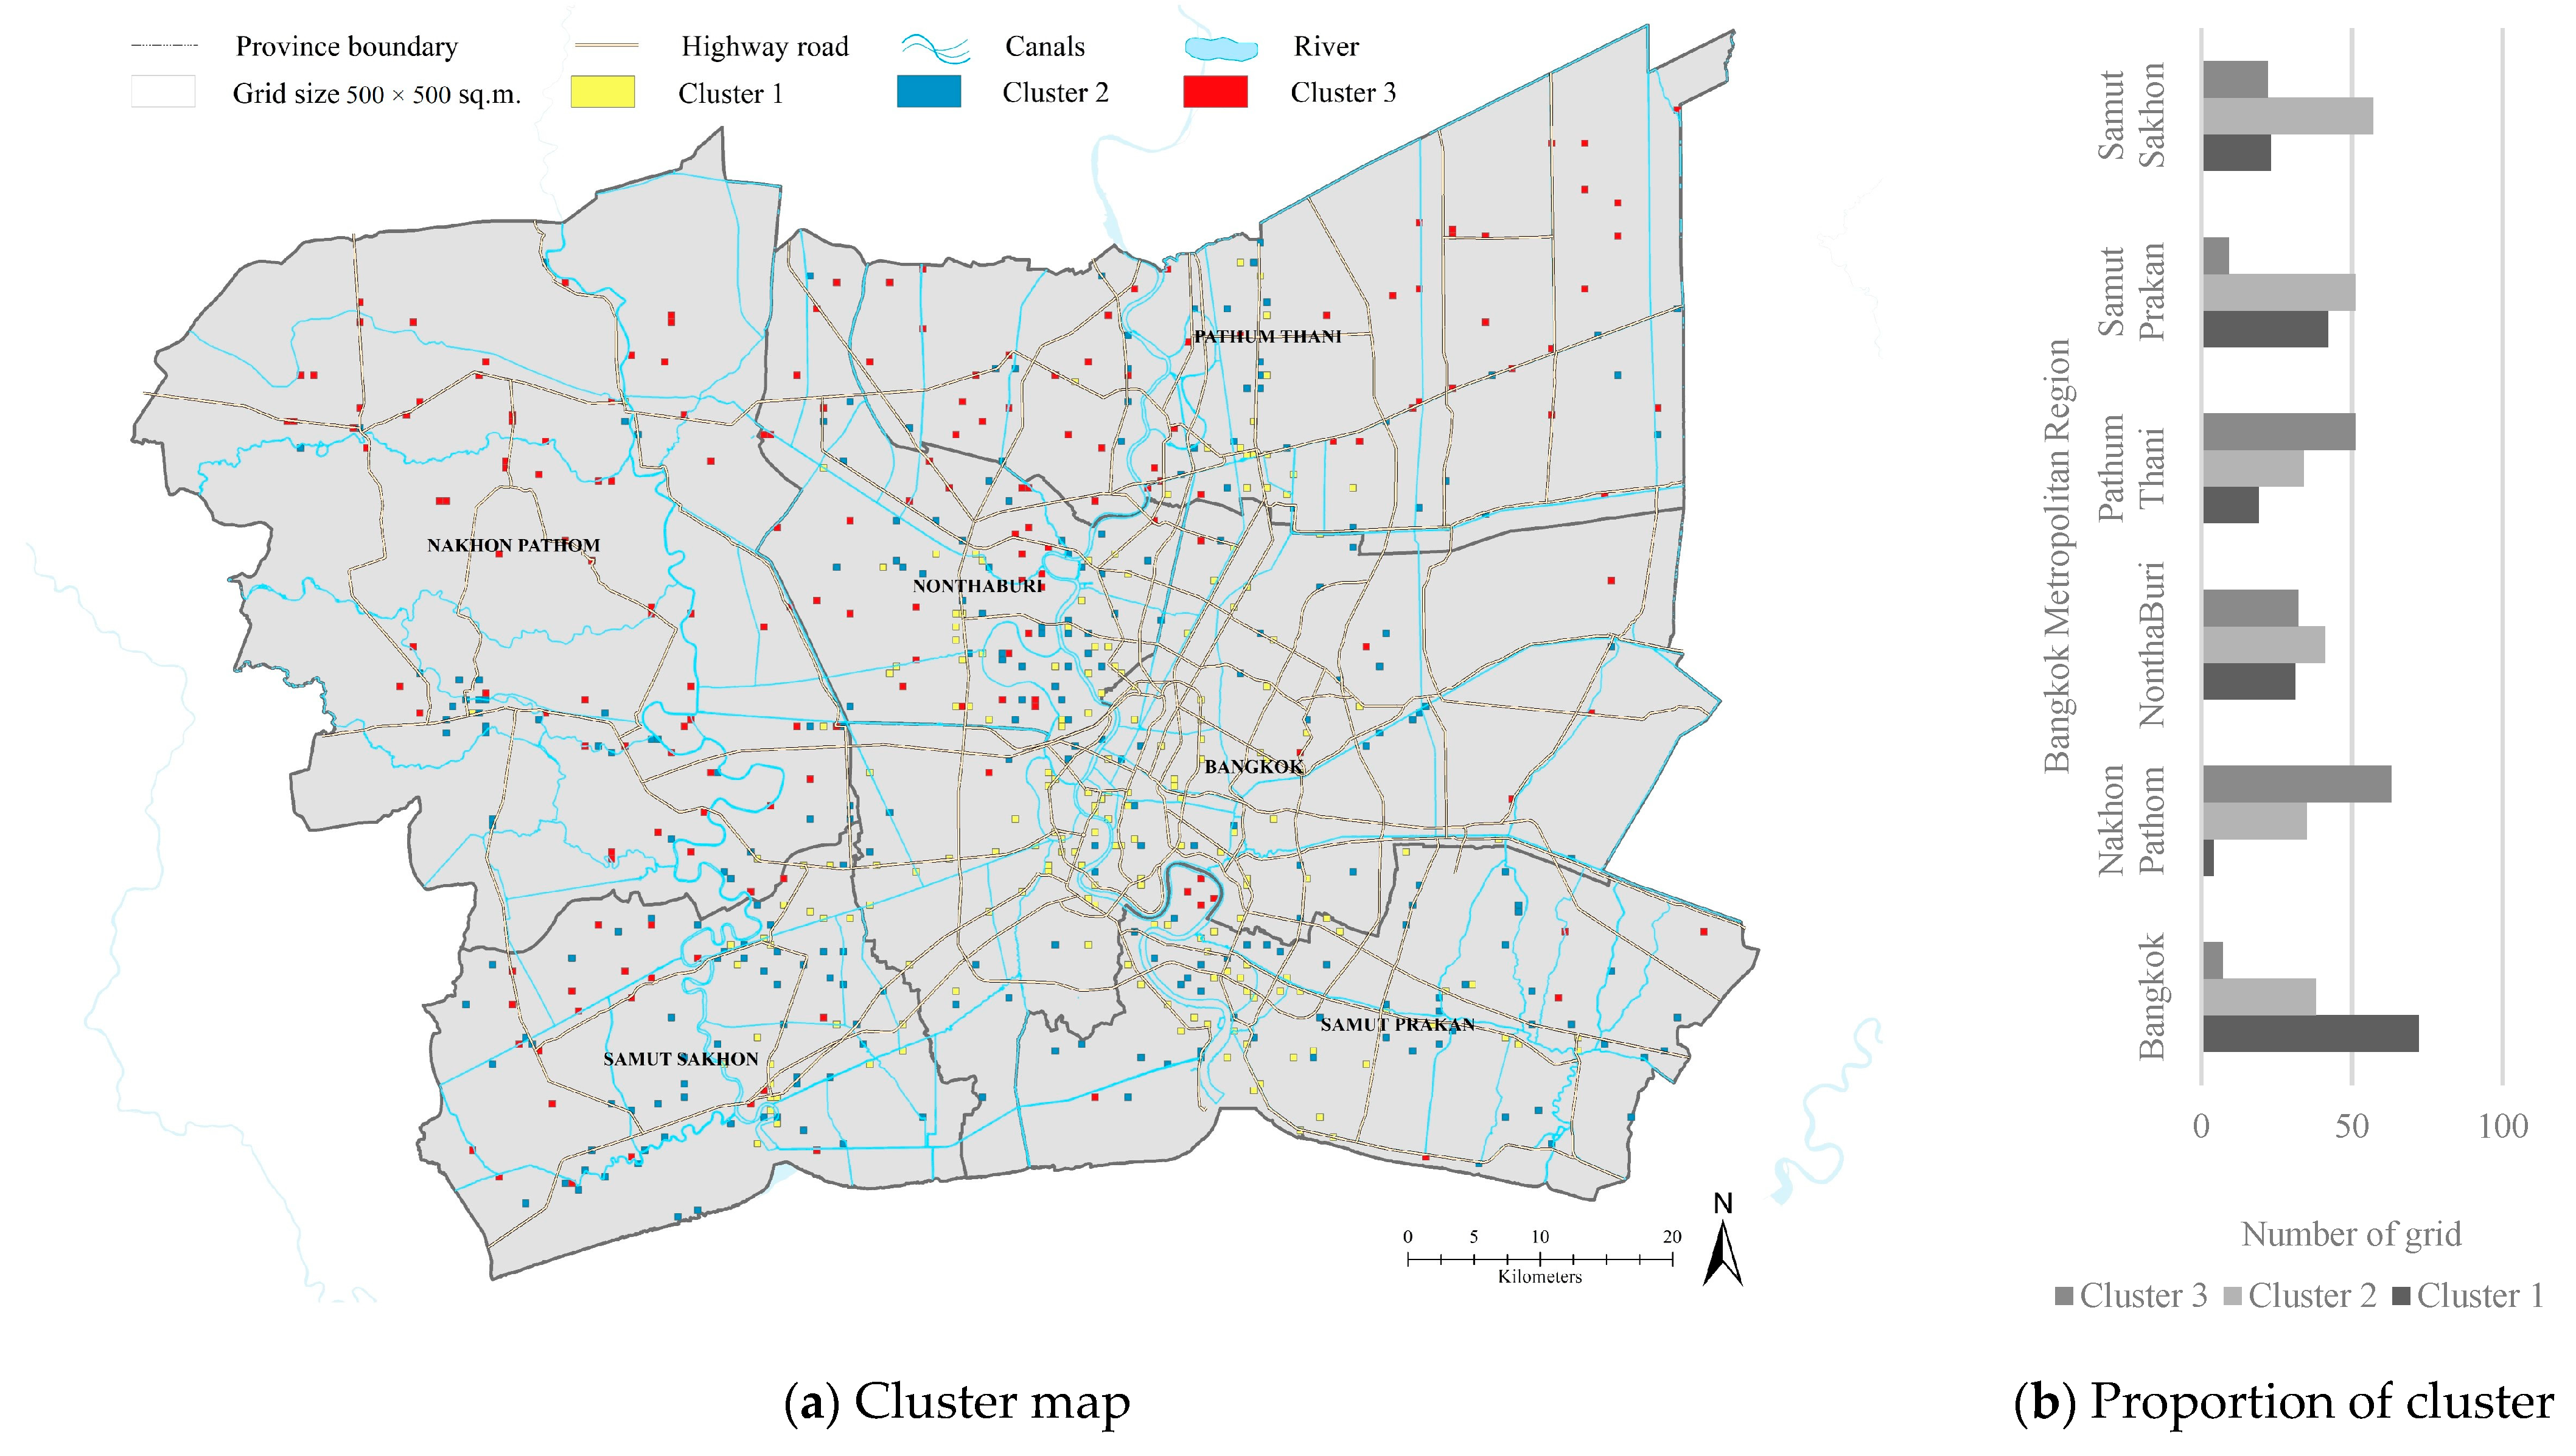
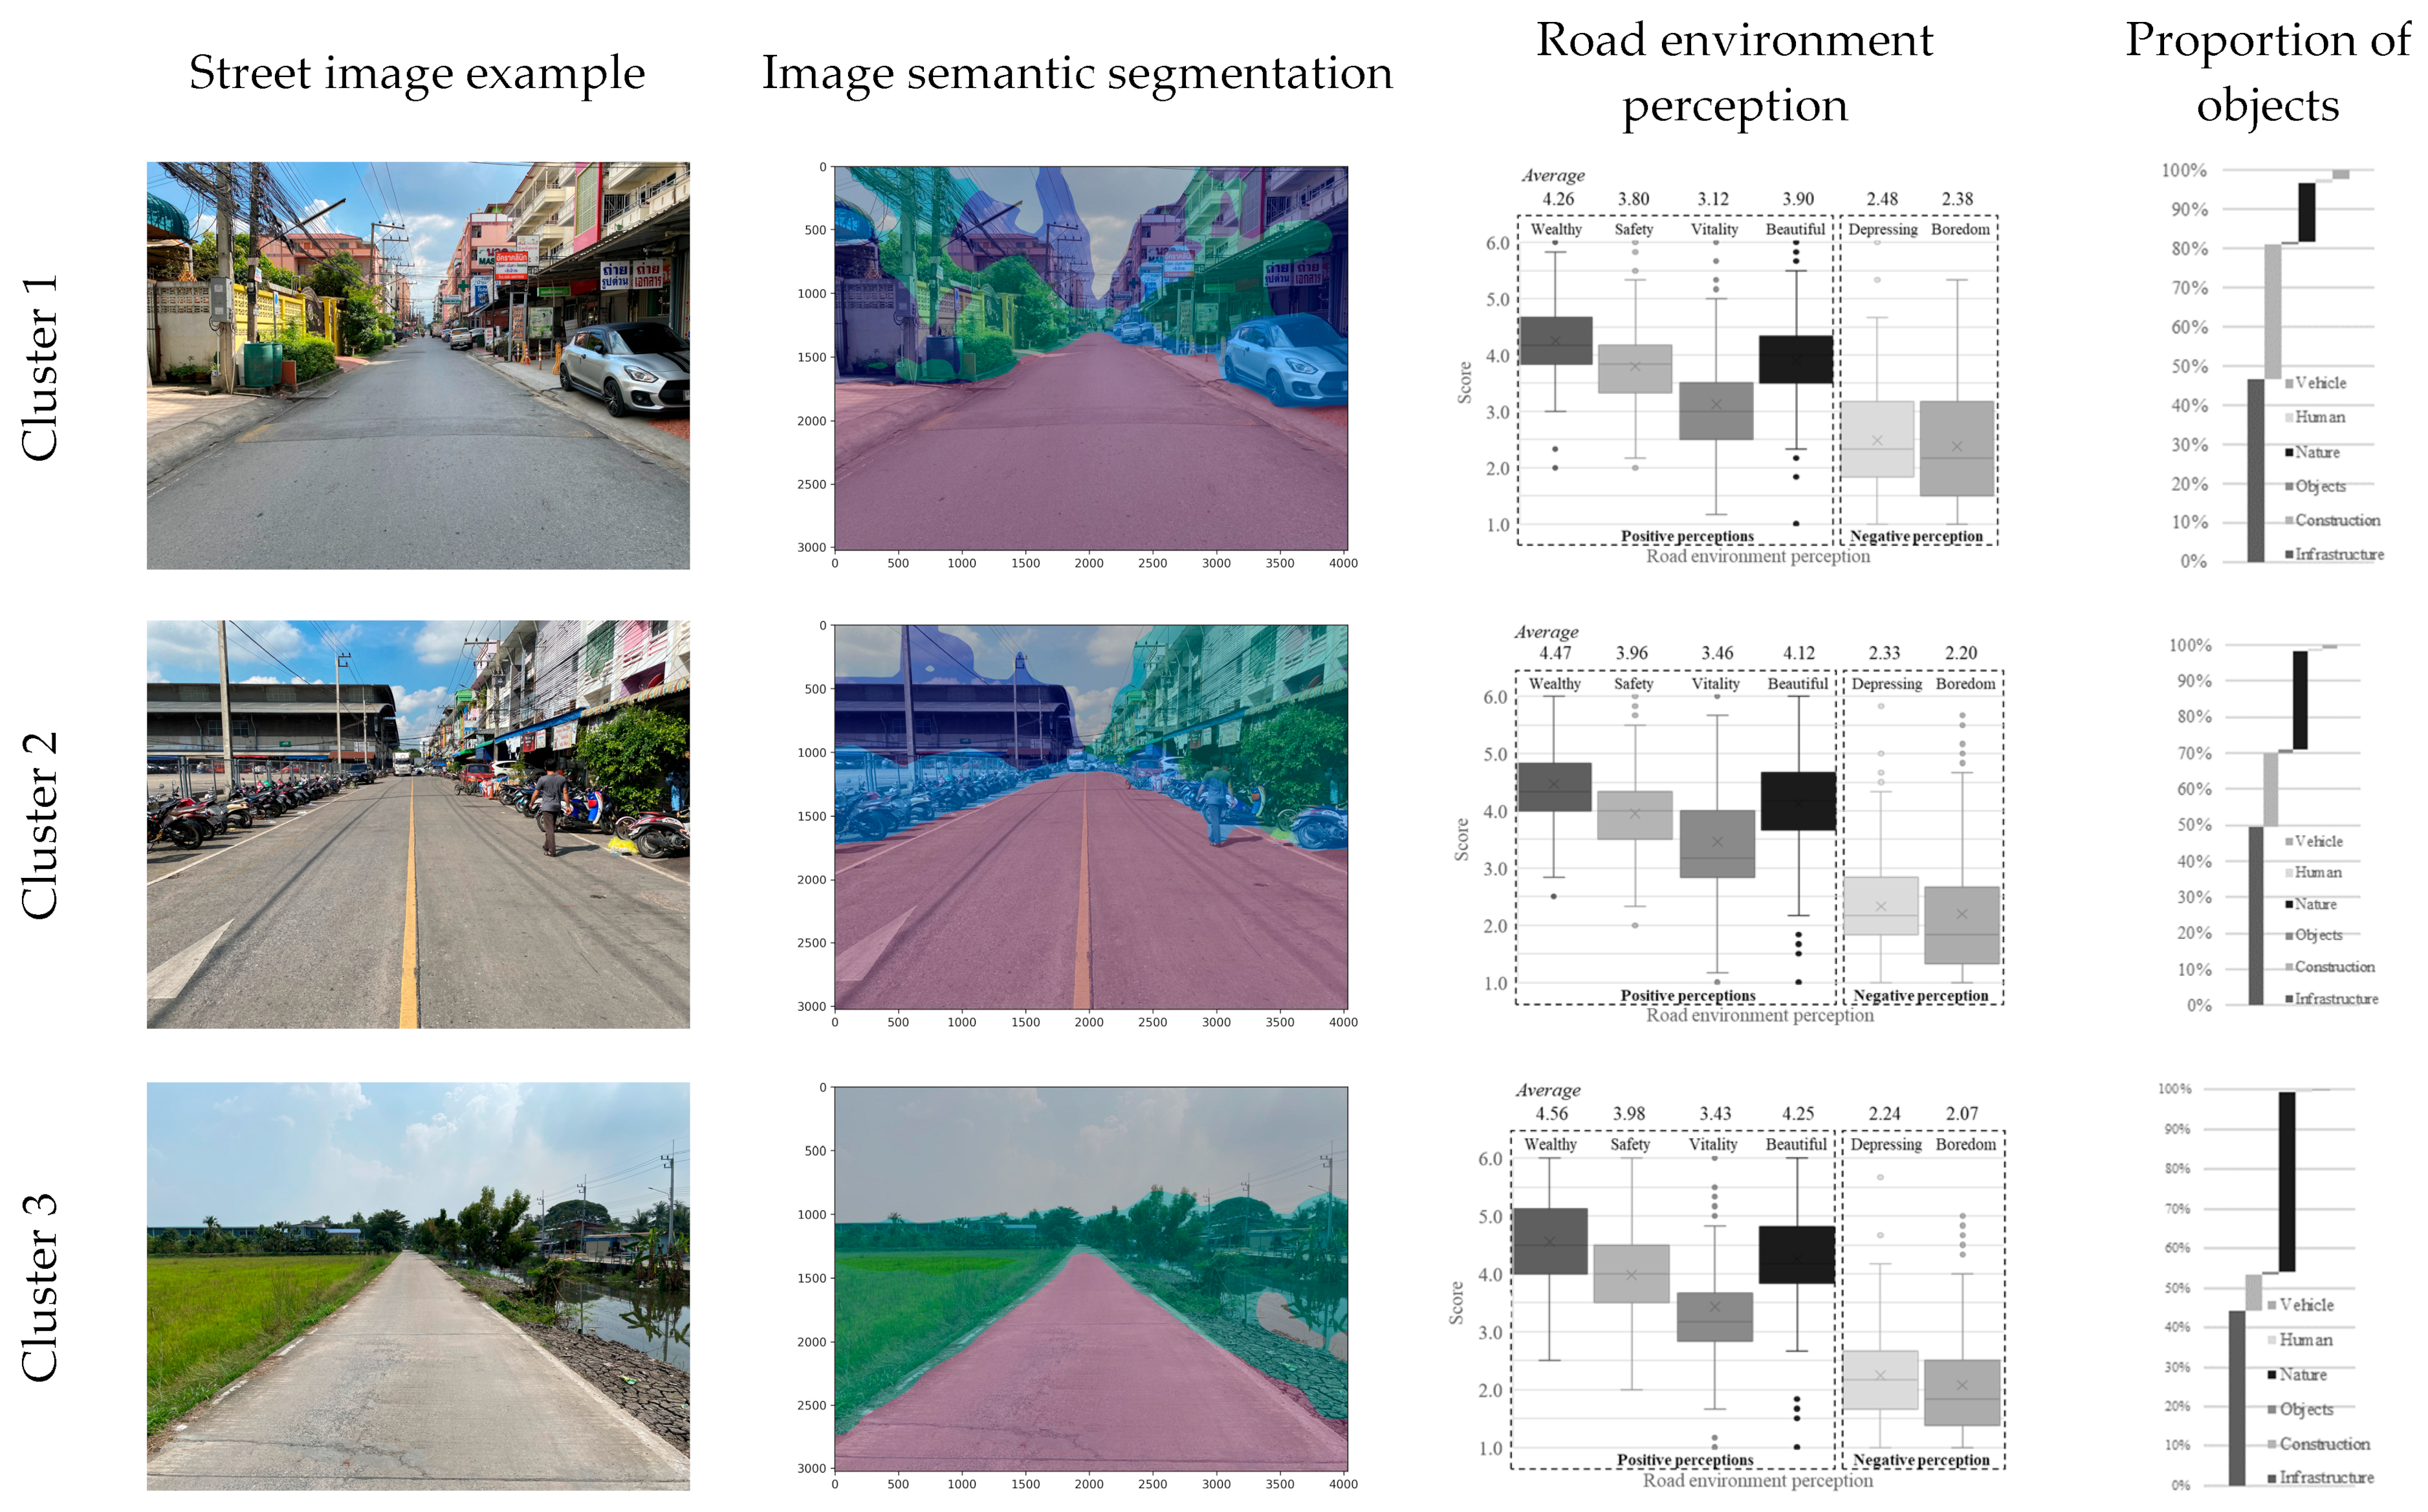
- Cluster 1: The image’s location is depicted by the yellow grid. It was observed that the identified road environment clusters are situated within the urban regions of each province, characterized by high-density buildings and road infrastructure. Notably, Cluster 1 exhibits a higher proportion of prominent objects in the image, specifically buildings and roads, compared to the other clusters.
- Cluster 2: The image’s location is indicated by the blue grid. The road environment clusters in this group are dispersed in regions situated at a distance from urban areas, yet still exhibiting a high density of activity. These areas feature a lower density of building and road infrastructure activities compared to Cluster 1, but they display a greater presence of vegetation than Cluster 1, although less than Cluster 3.
- Cluster 3: The image’s location is denoted by the red grid. In this case, the identified road environment clusters are primarily situated within the suburban communities of each province, which are predominantly agricultural regions. These areas exhibit relatively low densities and limited activity variety. In this context, the road environment is predominantly characterized by vegetation rather than buildings.
4.4. Perception of the Road Environment and Its Relationship
5. Discussion
6. Conclusions
Author Contributions
Funding
Institutional Review Board Statement
Informed Consent Statement
Data Availability Statement
Acknowledgments
Conflicts of Interest
References
- Hosono, A. Addressing Challenges of Urbanization for Quality of Growth. In SDGs, Transformation, and Quality Growth; Sustainable Development Goals Series; Springer: Singapore, 2022. [Google Scholar] [CrossRef]
- Iamtrakul, P.; Chayphong, S.; Kantavat, P.; Hayashi, Y.; Kijsirikul, B.; Iwahori, Y. Exploring the Spatial Effects of Built Environment on Quality of Life Related Transportation by Integrating GIS and Deep Learning Approaches. Sustainability 2023, 15, 2785. [Google Scholar] [CrossRef]
- Dugundji, E.R.; Páez, A.; Arentze, T.A.; Walker, J.L.; Carrasco, J.A.; Marchal, F.; Nakanishi, H. Transportation and social interactions. Transp. Res. A Policy Pract. 2011, 45, 239–247. [Google Scholar] [CrossRef]
- PIARC. The Contribution of Road Transport to Sustainability and Economic Development. 2020. Available online: https://www.piarc.org/en/order-library/33885-en-The%20Contribution%20of%20Road%20Transport%20to%20Sustainability%20and%20Economic%20Development (accessed on 1 September 2023).
- Akgün-Tanbay, N.; Campisi, T.; Tanbay, T.; Tesoriere, G.; Dissanayake, D. Modelling Road User Perceptions towards Safety, Comfort, and Chaos at Shared Space: The via Maqueda Case Study, Italy. J. Adv. Transp. 2022, 2022, 4979496. [Google Scholar] [CrossRef]
- Wang, Y.; Qiu, W.; Jiang, Q.; Li, W.; Ji, T.; Dong, L. Drivers or Pedestrians, Whose Dynamic Perceptions Are More Effective to Explain Street Vitality? A Case Study in Guangzhou. Remote Sens. 2023, 15, 568. [Google Scholar] [CrossRef]
- Saxena, A.; Yadav, A.K. Clustering pedestrians’ perceptions towards road infrastructure and traffic characteristics. Int. J. Inj. Contr. Saf. Promot. 2023, 30, 68–78. [Google Scholar] [CrossRef] [PubMed]
- Kang, Y.; Zhang, F.; Gao, S.; Lin, H.; Liu, Y. A review of urban physical environment sensing using street view imagery in public health studies. Ann. GIS. 2020, 26, 261–275. [Google Scholar] [CrossRef]
- Wang, R.; Liu, Y.; Lu, Y.; Zhang, J.; Liu, P.; Yao, Y.; Grekousis, G. Perceptions of built environment and health outcomes for older Chinese in Beijing: A big data approach with street view images and deep learning technique. Comput. Environ. Urban Syst. 2019, 78, 101386. [Google Scholar] [CrossRef]
- Li, Y.; Yabuki, N.; and Fukuda, T. Measuring visual walkability perception using panoramic street view images, virtual reality, and deep learning. Sustain. Cities Soc. 2022, 86, 104140. [Google Scholar] [CrossRef]
- Iamtrakul, P.; Kardi, T.; Jian, G.; Kazunori, H. Interaction of activity involvement and recreational location selection behavior in Lowland City: A case study of public parks in Saga City, Japan. J. Zhejiang Univ. Sci. 2005, 6A, 900–906. [Google Scholar] [CrossRef]
- Xu, S.; Sun, C.; Wei, H.; Hou, X. Road construction and air pollution: Analysis of road area ratio in China. Appl. Energy 2023, 351, 121794. [Google Scholar] [CrossRef]
- Liu, L.; Gao, Z.; Luo, P.; Duan, W.; Hu, M.; Mohd Arif Zainol, M.R.R.; and Zawawi, M.H. The Influence of Visual Landscapes on Road Traffic Safety: An Assessment Using Remote Sensing and Deep Learning. Remote Sens. 2023, 15, 4437. [Google Scholar] [CrossRef]
- Qi, Y.; Drolma, S.C.; Zhang, X.; Liang, J.; Jiang, H.; Xu, J.; Ni, T. An investigation of the visual features of urban street vitality using a convolutional neural network. Geo-Spat. Inf. Sci. 2020, 23, 341–351. [Google Scholar] [CrossRef]
- Xu, X.; Qiu, W.; Li, W.; Liu, X.; Zhang, Z.; Li, X.; Luo, D. Associations between Street-View Perceptions and Housing Prices: Subjective vs. Objective Measures Using Computer Vision and Machine Learning Techniques. Remote Sens. 2022, 14, 891. [Google Scholar] [CrossRef]
- Dubey, A.; Naik, N.; Parikh, D.; Raskar, R.; Hidalgo, C.A. Deep Learning the City: Quantifying Urban Perception at a Global Scale. arXiv 2016, arXiv:1608.01769. [Google Scholar]
- Ma, X.; Ma, C.; Wu, C.; Xi, Y.; Yang, R.; Peng, N.; Zhang, C.; Ren, F. Measuring Human Perceptions of Streetscapes to Better Inform Urban Renewal: A Perspective of Scene Semantic Parsing. Cities 2021, 110, 103086. [Google Scholar] [CrossRef]
- Qiu, W.; Zhang, Z.; Liu, X.; Li, W.; Li, X.; Xu, X.; Huang, X. Subjective or Objective Measures of Street Environment, Which Are More Effective in Explaining Housing Prices? Landsc. Urban Plan. 2022, 221, 104358. [Google Scholar] [CrossRef]
- Nyunt, M.S.Z.; Shuvo, F.K.; Eng, J.Y.; Yap, K.B.; Scherer, S.; Hee, L.M.; Chan, S.P.; Ng, T.P. Objective and subjective measures of neighborhood environment (NE): Relationships with transportation physical activity among older persons. Int. J. Behav. Nutr. Phys. Act. 2015, 12, 108. [Google Scholar] [CrossRef] [PubMed]
- Yang, S.; Krenz, K.; Qiu, W.; Li, W. The Role of Subjective Perceptions and Objective Measurements of the Urban Environment in Explaining House Prices in Greater London: A Multi-Scale Urban Morphology Analysis. ISPRS Int. J. Geo-Inf. 2023, 12, 249. [Google Scholar] [CrossRef]
- Saelens, B.E.; Frank, L.D.; Auffrey, C.; Whitaker, R.C.; Burdette, H.L.; Colabianchi, N. Measuring Physical Environments of Parks and Playgrounds: EAPRS Instrument Development and Inter-Rater Reliability. J. Phys. Act. Health 2016, 3, S190–S207. [Google Scholar] [CrossRef]
- Long, Y.; Tang, J. Large-scale Quantitative Measurement of the Quality of Urban Street Space: The Research Progress. City Plan. Rev. 2019, 43, 107–114. [Google Scholar]
- He, N.; Li, G. Urban neighbourhood environment assessment based on street view image processing: A review of research trends. Environ. Chall. 2021, 4, 100090. [Google Scholar] [CrossRef]
- Hu, C.-B.; Zhang, F.; Gong, F.-Y.; Ratti, C.; Li, X. Classification and mapping of urban canyon geometry using Google Street View images and deep multitask learning. Build. Environ. 2020, 167, 106424. [Google Scholar] [CrossRef]
- Wu, C.; Peng, N.; Ma, X.; Li, S.; Rao, J. Assessing multiscale visual appearance characteristics of neighbourhoods using geographically weighted principal component analysis in Shenzhen, China. Comput. Environ. Urban Syst. 2020, 84, 101547. [Google Scholar] [CrossRef]
- Nagata, S.; Nakaya, T.; Hanibuchi, T.; Amagasa, S.; Kikuchi, H.; Inoue, S. Objective scoring of streetscape walkability related to leisure walking: Statistical modeling approach with semantic segmentation of Google Street View images. Health Place 2020, 66, 102428. [Google Scholar] [CrossRef] [PubMed]
- Liu, Y.; Yang, S.; Wang, S. Heterogeneity Study of the Visual Features Based on Geographically Weighted Principal Components Analysis Applied to an Urban Community. Sustainability 2021, 13, 13488. [Google Scholar] [CrossRef]
- Wang, L.; Han, X.; He, J.; Jung, T. Measuring residents’ perceptions of city streets to inform better street planning through deep learning and space syntax. ISPRS J. Photogramm. Remote Sens. 2022, 190, 215–230. [Google Scholar] [CrossRef]
- Iamtrakul, P.; Chayphong, S. Factors affecting the development of a healthy city in Suburban areas, Thailand. J. Urban Manag. 2023, 12, 208–220. [Google Scholar] [CrossRef]
- Qin, Y.; Chen, Y.; Lin, K. Quantifying the Effects of Visual Road Information on Drivers’ Speed Choices to Promote Self-Explaining Roads. Int. J. Environ. Res. Public Health 2020, 17, 2437. [Google Scholar] [CrossRef] [PubMed]
- Wang, R.; Liu, Y.; Lu, Y.; Yuan, Y.; Zhang, J.; Liu, P.; Yao, Y. The linkage between the perception of neighbourhood and physical activity in Guangzhou, China: Using street view imagery with deep learning techniques. Int. J. Health Geogr. 2019, 18, 18. [Google Scholar] [CrossRef] [PubMed]
- Dai, L.; Zheng, C.; Dong, Z.; Yao, Y.; Wang, R.; Zhang, X.; Ren, S.; Zhang, J.; Song, X.; Guan, Q. Analyzing the correlation between visual space and residents’ psychology in Wuhan, China using street-view images and deep-learning technique. City Environ. Interact. 2021, 11, 100069. [Google Scholar] [CrossRef]
- Yamane, T. Statistic: An Introductory Analysis, 2nd ed.; Harper & Row: New York, NY, USA, 1970. [Google Scholar]
- Ding, X.; Fan, H.; Gong, J. Towards generating network of bikeways from Mapillary data. Comput. Environ. Urban Syst. 2021, 88, 101632. [Google Scholar] [CrossRef]
- Hou, Y.; Bilijecki, F. A comprehensive framework for evaluating the quality of street view imagery. Int. J. Appl. Earth. Obs. Geoinf. 2022, 115, 103094. [Google Scholar] [CrossRef]
- Lauko, I.G.; Honts, A.; Beihoff, J.; Rupprecht, S. Local color and morphological image feature based vegetation identification and its application to human environment street view vegetation mapping, or how green is our county? Geo-Spat. Inf. Sci. 2020, 23, 222–236. [Google Scholar] [CrossRef]
- Badrinarayanan, V.; Handa, A.; Cipolla, R. Segnet: A deep convolutional encoder-decoder architecture for robust semantic pixel-wise labelling. arXiv 2015, arXiv:1505.07293. [Google Scholar]
- Kim, H.; Lee, J.H.; Lee, S. A Hybrid Image Segmentation Method for Accurate Measurement of Urban Environments. Electronics 2023, 12, 1845. [Google Scholar] [CrossRef]
- Jiang, H.; Dong, L.; Qiu, B. How are macro-scale and micro-scale built environments associated with running activity? The application of strava data and deep learning in inner London. ISPRS Int. J. Geo-Inf. 2022, 11, 504. [Google Scholar] [CrossRef]
- Rita, L.; Peliteiro, M.; Bostan, T.-C.; Tamagusko, T.; Ferreira, A. Using Deep Learning and Google Street View Imagery to Assess and Improve Cyclist Safety in London. Sustainability 2023, 15, 10270. [Google Scholar] [CrossRef]
- Cai, Q.; Abdel-Aty, M.; Zheng, O.; Wu, Y. Applying machine learning and google street view to explore effects of drivers’ visual environment on traffic safety. Transp. Res. Part C Emerg. Technol. 2022, 135, 103541. [Google Scholar] [CrossRef]
- Liu, Y.; Chu, L.; Chen, G.; Wu, Z.; Chen, Z.; Lai, B.; Hao, Y. PaddleSeg: A High-Efficient Development Toolkit for Image Segmentation, arXiv–CS–Computer Vision and Pattern Recognition. arXiv 2021, arXiv:2101.06175. [Google Scholar]
- GitHub. PaddlePaddle Contributors. 2019. Available online: https://github.com/PaddlePaddle/PaddleSeg/tree/release/2.3/contrib/CityscapesSOTA (accessed on 1 September 2023).
- Li, X.; Yan, H.; Wang, Z.; Wang, B. Evaluation of Road Environment Safety Perception and Analysis of Influencing Factors Combining Street View Imagery and Machine Learning. Int. J. Geogr. Inf. Sci. 2023, 25, 852–865. [Google Scholar] [CrossRef]
- Edguist, J.; Rudin-Brown, C.M.; Lenne, M.G. The effects of on-street parking and road environment visual complexity on travel speed and reaction time. Accid. Anal. Prev. 2012, 45, 759–765. [Google Scholar] [CrossRef]
- Atombo, C.; Wu, C.; Zhong, M.; Zhang, H. Investigating the motivational factors influencing drivers intentions to unsafe driving behaviours: Speeding and overtaking violations. Transp. Res. Part F Traffic Psychol. Behav. 2016, 43, 104–121. [Google Scholar] [CrossRef]
- Xu, J.; Liu, Y.; Liu, Y.; An, R.; Tong, Z. Integrating street view images and deep learning to explore the association between human perceptions of the built environment and cardiovascular disease in older adults. Soc. Sci. Med. 2023, 338, 116304. [Google Scholar] [CrossRef] [PubMed]
- Campbell, A.; Both, A.; Sun, Q.C. Detecting and mapping traffic signs from Google Street View images using deep learning and GIS. Comput. Environ. Urban Syst. Comput. Environ. Urban Syst. 2019, 77, 101350. [Google Scholar] [CrossRef]
- Lynch, K. The Image of the City; The MIT Press: Cambridge, MA, USA, 1960; Available online: https://mitpress.mit.edu/books/image-city (accessed on 1 September 2023).

| Main Aspect | Aspect | Description | References |
|---|---|---|---|
| Road environment image | |||
| Infrastructure | Road | Areas frequently traversed by automobiles, including lanes, pathways, and roadways | [2,18] |
| Sidewalk | An area situated adjacent to a road and separated from it by a barrier, intended for use by pedestrians or cyclists. | ||
| Vehicle | Vehicle more than 2 wheel over | Vehicles with more than two wheels, including cars, trucks, buses, trains, motorcycles, and bicycles. | [37,38] |
| Construction | Building | An area comprising predominantly man-made structures, including buildings and various architectural elements such as houses, carports, and similar constructions | [39,40] |
| Wall | A freestanding wall, whether personal or public, not integrated into a building structure | ||
| Fence | A fence, encompassing any openings or apertures | ||
| Object | Pole | Poles positioned alongside the road or on the roadside, e.g., sign poles, traffic light poles, and streetlights | [37,38] |
| Traffic sign | Traffic signs that convey information related to traffic, encompassing signs for traffic regulations, parking guidance, and directional information. | ||
| Traffic light | A traffic signal control box separated from its supporting poles. | ||
| Nature | Vegetation | Elements representing vegetation, encompassing trees, shrubs, and various vertical plant types. | [2,37] |
| Terrain | This category encompasses grass, various forms of landscaping vegetation, as well as dirt or sand. Additionally, it includes the road edge that may serve as a boundary marker. | ||
| Human | Person | This category pertains to human figures, whether they are depicted sitting, walking, or standing engaged in various activities as observed in the image. It does not encompass individuals who are riders. | [38,39] |
| Rider | People employ various devices for transportation, including riders on bicycles, motorcycles, scooters, individuals on rollerblades, and those using wheelchairs, among others. | ||
| Perceptions of road environment | |||
| Positive perception | Wealthy | The road environment creates the perception of being a suitable path for travel. | [9,15,16] |
| Safety | Travelers experience a sense of safety as they traverse the road environment on their journey to their destination. | [5,13,22] | |
| Vitality | The surrounding road environment creates a sense of vitality in the traveler. | [6,14,20] | |
| Beauty | The road environment induces a sense of beauty and pleasantness throughout the journey. | [6,16] | |
| Negative perception | Depression | The road environment can generate feelings of sadness or depression during travel. | [9,16] |
| Boredom | The road environment can evoke a sense of monotony during travel. | [9,16] | |
| Main Aspect | Aspect | Descriptive Statistics | |||||||||||||
|---|---|---|---|---|---|---|---|---|---|---|---|---|---|---|---|
| Bangkok | Samut Prakan | Samut Sakhon | Nakhon Pathom | Nonthaburi | Pathum Thani | All | |||||||||
| N | % | N | % | N | % | N | % | N | % | N | % | N | % | ||
| Gender | Male | 115 | 19.17 | 213 | 35.50 | 255 | 42.50 | 196 | 32.67 | 199 | 33.17 | 141 | 23.50 | 1119 | 31.08 |
| Female | 483 | 80.50 | 387 | 64.50 | 344 | 57.33 | 404 | 67.33 | 401 | 66.83 | 448 | 74.67 | 2467 | 68.53 | |
| Others | 2 | 0.33 | 0 | 0.00 | 1 | 0.17 | 0 | 0.00 | 0 | 0.00 | 11 | 1.83 | 14 | 0.39 | |
| Age (years) | 18–24 | 77 | 12.83 | 0 | 0.00 | 1 | 0.17 | 22 | 3.67 | 29 | 4.83 | 45 | 7.50 | 174 | 4.83 |
| 25–34 | 274 | 45.67 | 147 | 24.50 | 172 | 28.67 | 178 | 29.67 | 245 | 40.83 | 286 | 47.67 | 1302 | 36.17 | |
| 35–44 | 189 | 31.50 | 190 | 31.67 | 184 | 30.67 | 205 | 34.17 | 210 | 35.00 | 205 | 34.17 | 1183 | 32.86 | |
| 45–59 | 57 | 9.50 | 259 | 43.17 | 241 | 40.17 | 184 | 30.67 | 107 | 17.83 | 60 | 10.00 | 908 | 25.22 | |
| ≥60 | 3 | 0.50 | 4 | 0.67 | 2 | 0.33 | 11 | 1.83 | 9 | 1.50 | 4 | 0.67 | 33 | 0.92 | |
| Education level | Lower primary school | 0 | 0.00 | 0 | 0.00 | 0 | 0.00 | 0 | 0.00 | 0 | 0.00 | 0 | 0.00 | 0 | 0.00 |
| Primary school | 0 | 0.00 | 0 | 0.00 | 0 | 0.00 | 1 | 0.17 | 0 | 0.00 | 0 | 0.00 | 1 | 0.03 | |
| Junior high school | 2 | 0.33 | 4 | 0.67 | 6 | 1.00 | 3 | 0.50 | 13 | 2.17 | 2 | 0.33 | 30 | 0.83 | |
| High school | 26 | 4.33 | 0 | 0.00 | 19 | 3.17 | 37 | 6.17 | 41 | 6.83 | 11 | 1.83 | 134 | 3.72 | |
| Vocational college | 11 | 1.83 | 0 | 0.00 | 11 | 1.83 | 28 | 4.67 | 41 | 6.83 | 8 | 1.33 | 99 | 2.75 | |
| Bachelor’s degree | 558 | 93.00 | 596 | 99.33 | 564 | 94.00 | 531 | 88.50 | 505 | 84.17 | 569 | 94.83 | 3323 | 92.31 | |
| Postgraduate | 3 | 0.50 | 0 | 0.00 | 0.00 | 0 | 0.00 | 0 | 0.00 | 10 | 1.67 | 13 | 0.36 | ||
| Income level (baht/month) | Less than 10,000 | 2 | 0.33 | 4 | 0.67 | 10 | 1.67 | 0 | 0.00 | 0 | 0.00 | 1 | 0.17 | 17 | 0.47 |
| 10,000–25,000 | 369 | 61.50 | 596 | 99.33 | 578 | 96.33 | 538 | 89.67 | 495 | 82.50 | 206 | 34.33 | 2782 | 77.28 | |
| 25,001–40,000 | 141 | 23.50 | 0 | 0.00 | 9 | 1.50 | 39 | 6.50 | 63 | 10.50 | 323 | 53.83 | 575 | 15.97 | |
| 40,000–55,000 | 49 | 8.17 | 0 | 0.00 | 3 | 0.50 | 16 | 2.67 | 31 | 5.17 | 50 | 8.33 | 149 | 4.14 | |
| 55,001–70,000 | 30 | 5.00 | 0 | 0.00 | 0 | 0.00 | 5 | 0.83 | 11 | 1.83 | 19 | 3.17 | 65 | 1.81 | |
| 70,001–85,000 | 6 | 1.00 | 0 | 0.00 | 0 | 0.00 | 2 | 0.33 | 0 | 0.00 | 1 | 0.17 | 9 | 0.25 | |
| More than 85,000 | 3 | 0.50 | 0 | 0.00 | 0 | 0.00 | 0 | 0.00 | 0 | 0.00 | 0 | 0.00 | 3 | 0.08 | |
| Visual Feature | Road Environment Perception | |||||||||||
|---|---|---|---|---|---|---|---|---|---|---|---|---|
| Positive Perspective | Negative Perspective | |||||||||||
| Wealthy | Safety | Vitality | Beauty | Depression | Boredom | |||||||
| B | Std. Error | B | Std. Error | B | Std. Error | B | Std. Error | B | Std. Error | B | Std. Error | |
| Infrastructure | 0.080 * | 0.018 | 0.102 * | 0.020 | 0.090 * | 0.025 | 0.080 * | 0.023 | −0.070 * | 0.023 | −0.113 * | 0.028 |
| Construction | −0.038 * | 0.017 | −0.011 | 0.019 | −0.011 | 0.025 | 0.035 | 0.023 | −0.006 | 0.022 | −0.082 * | 0.027 |
| Objects | 0.142 | 0.281 | −0.098 | 0.311 | −0.216 | 0.397 | 0.252 | 0.366 | −0.138 | 0.357 | −0.713 | 0.442 |
| Nature | −0.010 | 0.014 | −0.003 | 0.016 | 0.008 | 0.020 | 0.057 * | 0.018 | −0.020 | 0.018 | −0.089 * | 0.022 |
| Human | 0.024 | 0.135 | 0.055 | 0.149 | 0.009 | 0.190 | −0.064 | 0.176 | −0.001 | 0.171 | −0.060 | 0.212 |
| Vehicle | 0.080 | 0.018 | −0.176 * | 0.103 | −0.164 | 0.132 | 0.151 | 0.121 | −0.011 | 0.118 | −0.222 | 0.147 |
| R Square | 0.371 | 0.338 | 0.259 | 0.206 | 0.184 | 0.191 | ||||||
Disclaimer/Publisher’s Note: The statements, opinions and data contained in all publications are solely those of the individual author(s) and contributor(s) and not of MDPI and/or the editor(s). MDPI and/or the editor(s) disclaim responsibility for any injury to people or property resulting from any ideas, methods, instructions or products referred to in the content. |
© 2024 by the authors. Licensee MDPI, Basel, Switzerland. This article is an open access article distributed under the terms and conditions of the Creative Commons Attribution (CC BY) license (https://creativecommons.org/licenses/by/4.0/).
Share and Cite
Iamtrakul, P.; Chayphong, S.; Kantavat, P.; Nakamura, K.; Hayashi, Y.; Kijsirikul, B.; Iwahori, Y. Assessing Subjective and Objective Road Environment Perception in the Bangkok Metropolitan Region, Thailand: A Deep Learning Approach Utilizing Street Images. Sustainability 2024, 16, 1494. https://doi.org/10.3390/su16041494
Iamtrakul P, Chayphong S, Kantavat P, Nakamura K, Hayashi Y, Kijsirikul B, Iwahori Y. Assessing Subjective and Objective Road Environment Perception in the Bangkok Metropolitan Region, Thailand: A Deep Learning Approach Utilizing Street Images. Sustainability. 2024; 16(4):1494. https://doi.org/10.3390/su16041494
Chicago/Turabian StyleIamtrakul, Pawinee, Sararad Chayphong, Pittipol Kantavat, Kazuki Nakamura, Yoshitsugu Hayashi, Boonserm Kijsirikul, and Yuji Iwahori. 2024. "Assessing Subjective and Objective Road Environment Perception in the Bangkok Metropolitan Region, Thailand: A Deep Learning Approach Utilizing Street Images" Sustainability 16, no. 4: 1494. https://doi.org/10.3390/su16041494