Article

Research on Radiation Monitoring Strategy for Spent Fuel Reprocessing Plant Based on Coordination of Nuclear Security Risk and Facility Importance Evaluation

1
School of Resource Environment and Safety Engineering, University of South China, Hengyang 421001, China
2
Nuclear Power Institute of China, Chengdu 610213, China
3
Technical Innovation Center, No. 203 Research Institute of Nuclear Industry, Xi’an 710086, China
*
Authors to whom correspondence should be addressed.
Sustainability 2024, 16(4), 1495; https://doi.org/10.3390/su16041495
Submission received: 9 January 2024 / Revised: 2 February 2024 / Accepted: 7 February 2024 / Published: 9 February 2024
(This article belongs to the Special Issue Nuclear Energy and Technology and Its Environmental Impact)

Abstract

:
This paper examines a method and scheme for optimizing the allocation of nuclear radiation monitoring resources, based on the analysis of the risk of nuclear security events and the importance of facilities in a spent fuel reprocessing plant. By constructing a nuclear security radiation accident tree for a plant, the importance of different security events was calculated using fuzzy mathematics and expert scoring methods. The importance of each facility was determined by establishing a fuzzy comprehensive decision model, and a resource allocation scheme for nuclear radiation monitoring was proposed based on the importance level of facilities. The research findings demonstrated that the extraction process plant in the main process area, and the centralized control room in the front area of the plant, were of highest importance. Accordingly, three levels of nuclear radiation monitoring programs were established based on the importance of each facility. This study offers theoretical and technical support for the safety management and operation of a spent fuel reprocessing plant. Additionally, the analysis results can serve as a reference for allocating nuclear radiation monitoring resources in various facilities in a reasonable manner.

1. Introduction

The optimal utilization of spent fuel reprocessing plays a pivotal role in achieving a well-functioning nuclear fuel cycle and advancing the sustainable growth of nuclear power. Nevertheless, it is crucial to acknowledge that the unique attributes of uranium and plutonium, byproducts of the spent fuel reprocessing procedure, elicit considerable apprehension surrounding nuclear security [1]. Specifically, the potential occurrence of a nuclear security radiation incident raises grave concerns regarding the potential release of radioactive materials, consequently yielding significant socio-economic and enduring environmental consequences [2]. However, by strategically deploying nuclear security forces, the risks associated with such incidents can be averted and mitigated effectively.
In recent years, both domestic and international scholars have conducted extensive research on risk prevention and nuclear security. These works have provided valuable methods and strategies for dealing with nuclear security events [3]. Furthermore, the findings of the research confirm the feasibility of utilizing safety systems engineering in addressing nuclear security issues [4]. Among various methods, the fault tree analysis (FTA) method is widely employed in the reliability analysis and deductive evaluation of safety systems in nuclear facilities. It can effectively quantify the probability of accidents [5]. Through FTA, it becomes possible to systematically analyze and quantitatively evaluate potential failure scenarios in nuclear facilities, thereby offering effective solutions and measurements for nuclear security [6]. To deal with the ambiguity, imprecision, and uncertainty inherent in existing data and information, the fuzzy decision method is widely employed. This method provides a reliable reference basis for engineering decisions and finds application in various fields such as construction, management, biotechnology, medicine, and environmental science [7,8,9,10,11,12]. For instance, Tian Yumin et al. utilized the fuzzy comprehensive evaluation method to assess the fire risk of high-rise buildings, and successfully verified the accuracy and effectiveness of the approach by using a specific high-rise building as an example [13]. Similarly, the method is also applicable to the spent fuel reprocessing device in this study. Currently, the main types of events leading to nuclear security radiation incidents in spent fuel reprocessing plants can be categorized as employee theft; external terrorist attacks; theft; cyber information terrorist events in nuclear facilities; potential threats from employee injuries and equipment failures in spent fuel reprocessing plants; and natural disasters and fires [14,15,16,17,18,19,20,21]. However, obtaining the occurrence probabilities of these basic events within the context of spent fuel reprocessing plants is challenging. To address this difficulty, a combination of expert scoring and fuzzy mathematics was used [22,23,24,25].
In summary, by using FTA to quantitatively analyze nuclear security radiation events in spent fuel reprocessing plants, the importance of the relationships between basic events can be obtained. The application of the fuzzy synthetic decision method allows for both qualitative and quantitative evaluations of fundamental events. This indicates that, in situations where the probability of basic nuclear security incidents is difficult to acquire, the fuzzy comprehensive evaluation method possesses significant advantages in the nuclear security risk analysis of spent fuel reprocessing facilities, while also ensuring the accuracy and effectiveness of the results. In this study, we employ a method that combines expert scoring with fuzzy mathematics to address the challenge of acquiring the basic event probabilities for spent fuel reprocessing plants. By constructing accident tree models, an analysis of the significance of nuclear security incidents in spent fuel reprocessing plants is conducted. The fuzzy synthetic decision method is used to quantify fundamental events, and to conduct both qualitative and quantitative evaluations of potential nuclear security incidents of spent fuel reprocessing plants. Ultimately, an optimization scheme for radiation monitoring resources in spent fuel reprocessing plants has been proposed, taking into account both the importance analysis methods and the risk analysis results. This study herein confirms the value of importance analysis methods in the quantitative analysis of special events such as nuclear security. It provides a significant research approach and reference value for the optimal allocation of resources in nuclear facilities.

2. Importance Analysis of the Nuclear Security Radiation Incident at Spent Fuel Reprocessing Plants

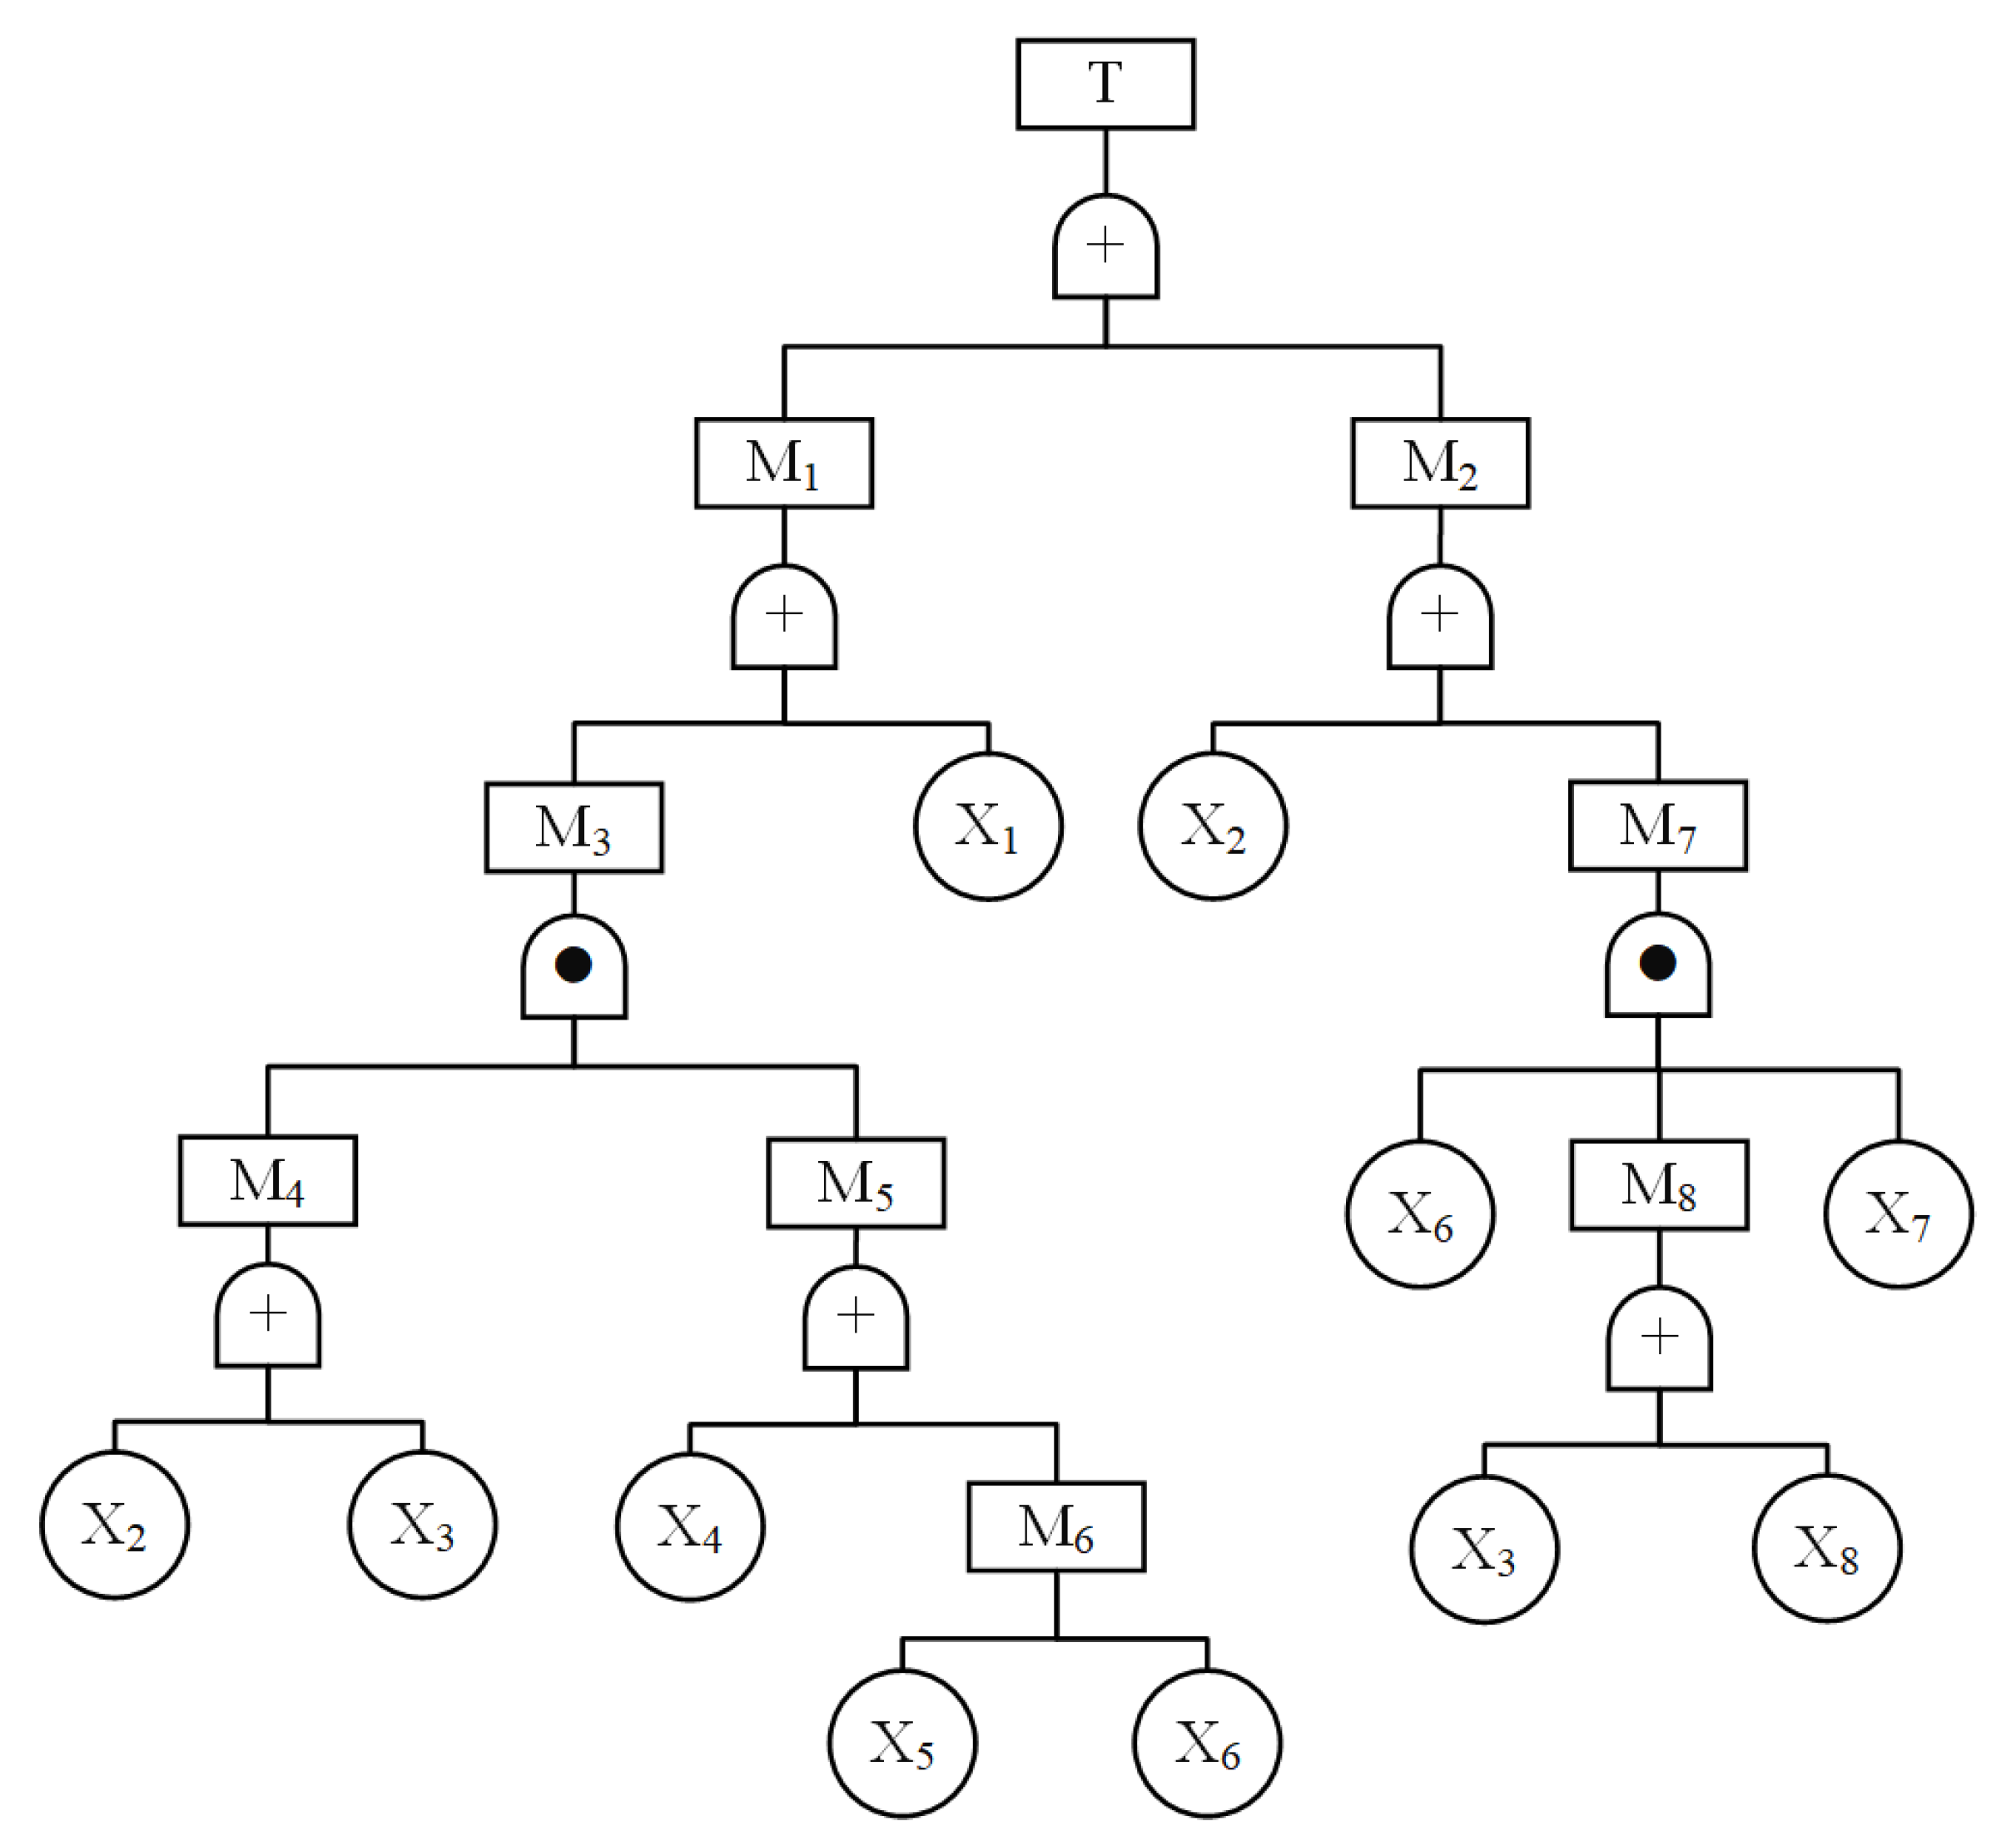
2.1. Establishment of Fault Tree

Combined with the radiation characteristics of spent fuel, among the possible nuclear security events in spent fuel reprocessing plants, radiation incidents have the greatest danger and severity. Therefore, a “nuclear security radiation incident” was selected as the top event of the fault tree for analysis. Considering the process characteristics of a spent fuel reprocessing plant, the cause events (basic events) that may cause a “nuclear security radiation incident” (top event), and the relationship between the cause events (logical relationships) were established, and a nuclear security radiation fault tree model of the spent fuel reprocessing plant, as shown in Figure 1, was constructed. The symbols corresponding to each event in Figure 1 are listed in Table 1.

2.1.1. Minimum Cut Set

The fault tree was analyzed and Boolean algebra algorithms were applied to transform the fault tree into a mathematical expression, to find the minimum cut set as follows:
T = M 1 + M 2 = M 3 + X 1 + X 2 + M 7 = M 4 M 5 + X 1 + X 2 + X 6 M 8 X 7 = X 2 + X 3 X 4 X 5 + X 6 + X 1 + X 2 + X 6 X 3 + X 8 X 7 = X 2 X 4 X 5 + X 2 X 4 X 6 + X 3 X 4 X 5 + X 3 X 4 X 6 + X 1 + X 2 + X 3 X 6 X 7 + X 6 X 7 X 8 = X 1 + X 2 + X 3 X 4 X 5 + X 3 X 4 X 6 + X 3 X 6 X 7 + X 6 X 7 X 8
Six minimum cut sets were obtained: { X 1 } , { X 2 } , { X 3 , X 4 , X 5 } , { X 3 , X 4 , X 6 } , { X 3 , X 6 , X 7 } , and { X 6 , X 7 , X 8 } .
The minimal cut set is a set of minimal basic events that causes the top event to occur. The top event occurred when X 1 and X 2 occurred. The top event occurred when X 3 , X 4 , and X 5 occurred simultaneously. The top event occurred when X 3 , X 4 and X 6 occurred simultaneously. The top event occurred when X 3 , X 6 , and X 7 occurred simultaneously. The top event occurred when X 6 , X 7 , and X 8 occurred simultaneously.

2.1.2. Structural Importance of Basic Events

Structural importance analysis is a qualitative method. It starts with the structure of the fault tree to analyze the importance of each basic event.
The formula for calculating the structural importance is
I Φ i = 1 k j = 1 k 1 n j   j k j
where k refers to the total number of minimal cut sets, k j refers to the j-th minimal cut set, and n j refers to the basic event tree of the k j -th minimum cut set.
The structural importance ranking of each basic event can be calculated using Equation (1). The calculation results were as follows: I Φ ( X 2 ) = I Φ X 1 > I Φ ( X 6 ) = I Φ ( X 3 ) > I Φ ( X 7 ) = I Φ ( X 4 ) > I Φ ( X 8 ) = I Φ ( X 5 ) .
The results of the structural importance ranking showed that the basic events X 1 as the employee theft, and X 2 as the external terrorist attack, have the greatest impact on the nuclear security radiation incident, followed by X 3 natural disaster, X 6 employee injury,   X 5 stealing, and X 8 fire, which have the least impact on nuclear security radiation events.

2.2. Quantitative Analysis of Nuclear Security Radiation Fault Tree for Spent Fuel Reprocessing Plants

A sophisticated approach combining fuzzy mathematics and expert scoring was utilized to create a model for determining the probability of nuclear security events occurring in spent fuel reprocessing plants. To gather insights, expert panels well-versed in the workings of these plants were established. Assessing the probability of each fundamental event involved the utilization of seven fuzzy natural languages spanning from small to large. A meticulous examination was conducted to establish the relationship between natural language and fuzzy numbers, subsequently leading to the calculation of an average fuzzy number. To convert the average fuzzy number into a precise measure of failure probability, the left–right fuzzy ranking method was employed. The specific steps involved in the process are illustrated in Figure 2.

2.2.1. Obtaining the Probability of Occurrence of Basic Events

(1)
Expert scoring to judge probabilities of occurrence of basic events.
In this analysis, a total of 30 experts who were actively involved in the operations of a spent fuel reprocessing plant were invited to assess the probability of occurrence for eight different types of basic events within the plant area. To ensure accuracy, the fuzzy mathematics method was employed, requiring a comprehensive treatment of fuzzy natural language. Hence, at the stage of determining the probability of basic event occurrence, only the experts’ scores for each event’s likelihood were taken into consideration.
(2)
Expert evaluation results.
The likelihood of an event happening was divided into seven levels: Very Small (VS), Small (S), Single Small (SS), Medium (M), Single Large (SL), Large (L), and Very Large (VL). The data presented in Table 2 shows the findings from expert evaluation regarding the probability of occurrence for basic events. The table illustrates that the majority of experts categorized the possibility of employee theft and assault as small. Conversely, for natural disaster events and network information events, the highest number of experts regarded the possibility as greater. In the case of theft, most experts deemed the possibility as small. The experts’ opinions regarding the possibility of employee injury, equipment failure, and fire incidents were less consistent, which was likely due to the complex internal environment of a spent fuel reprocessing plant.
(3)
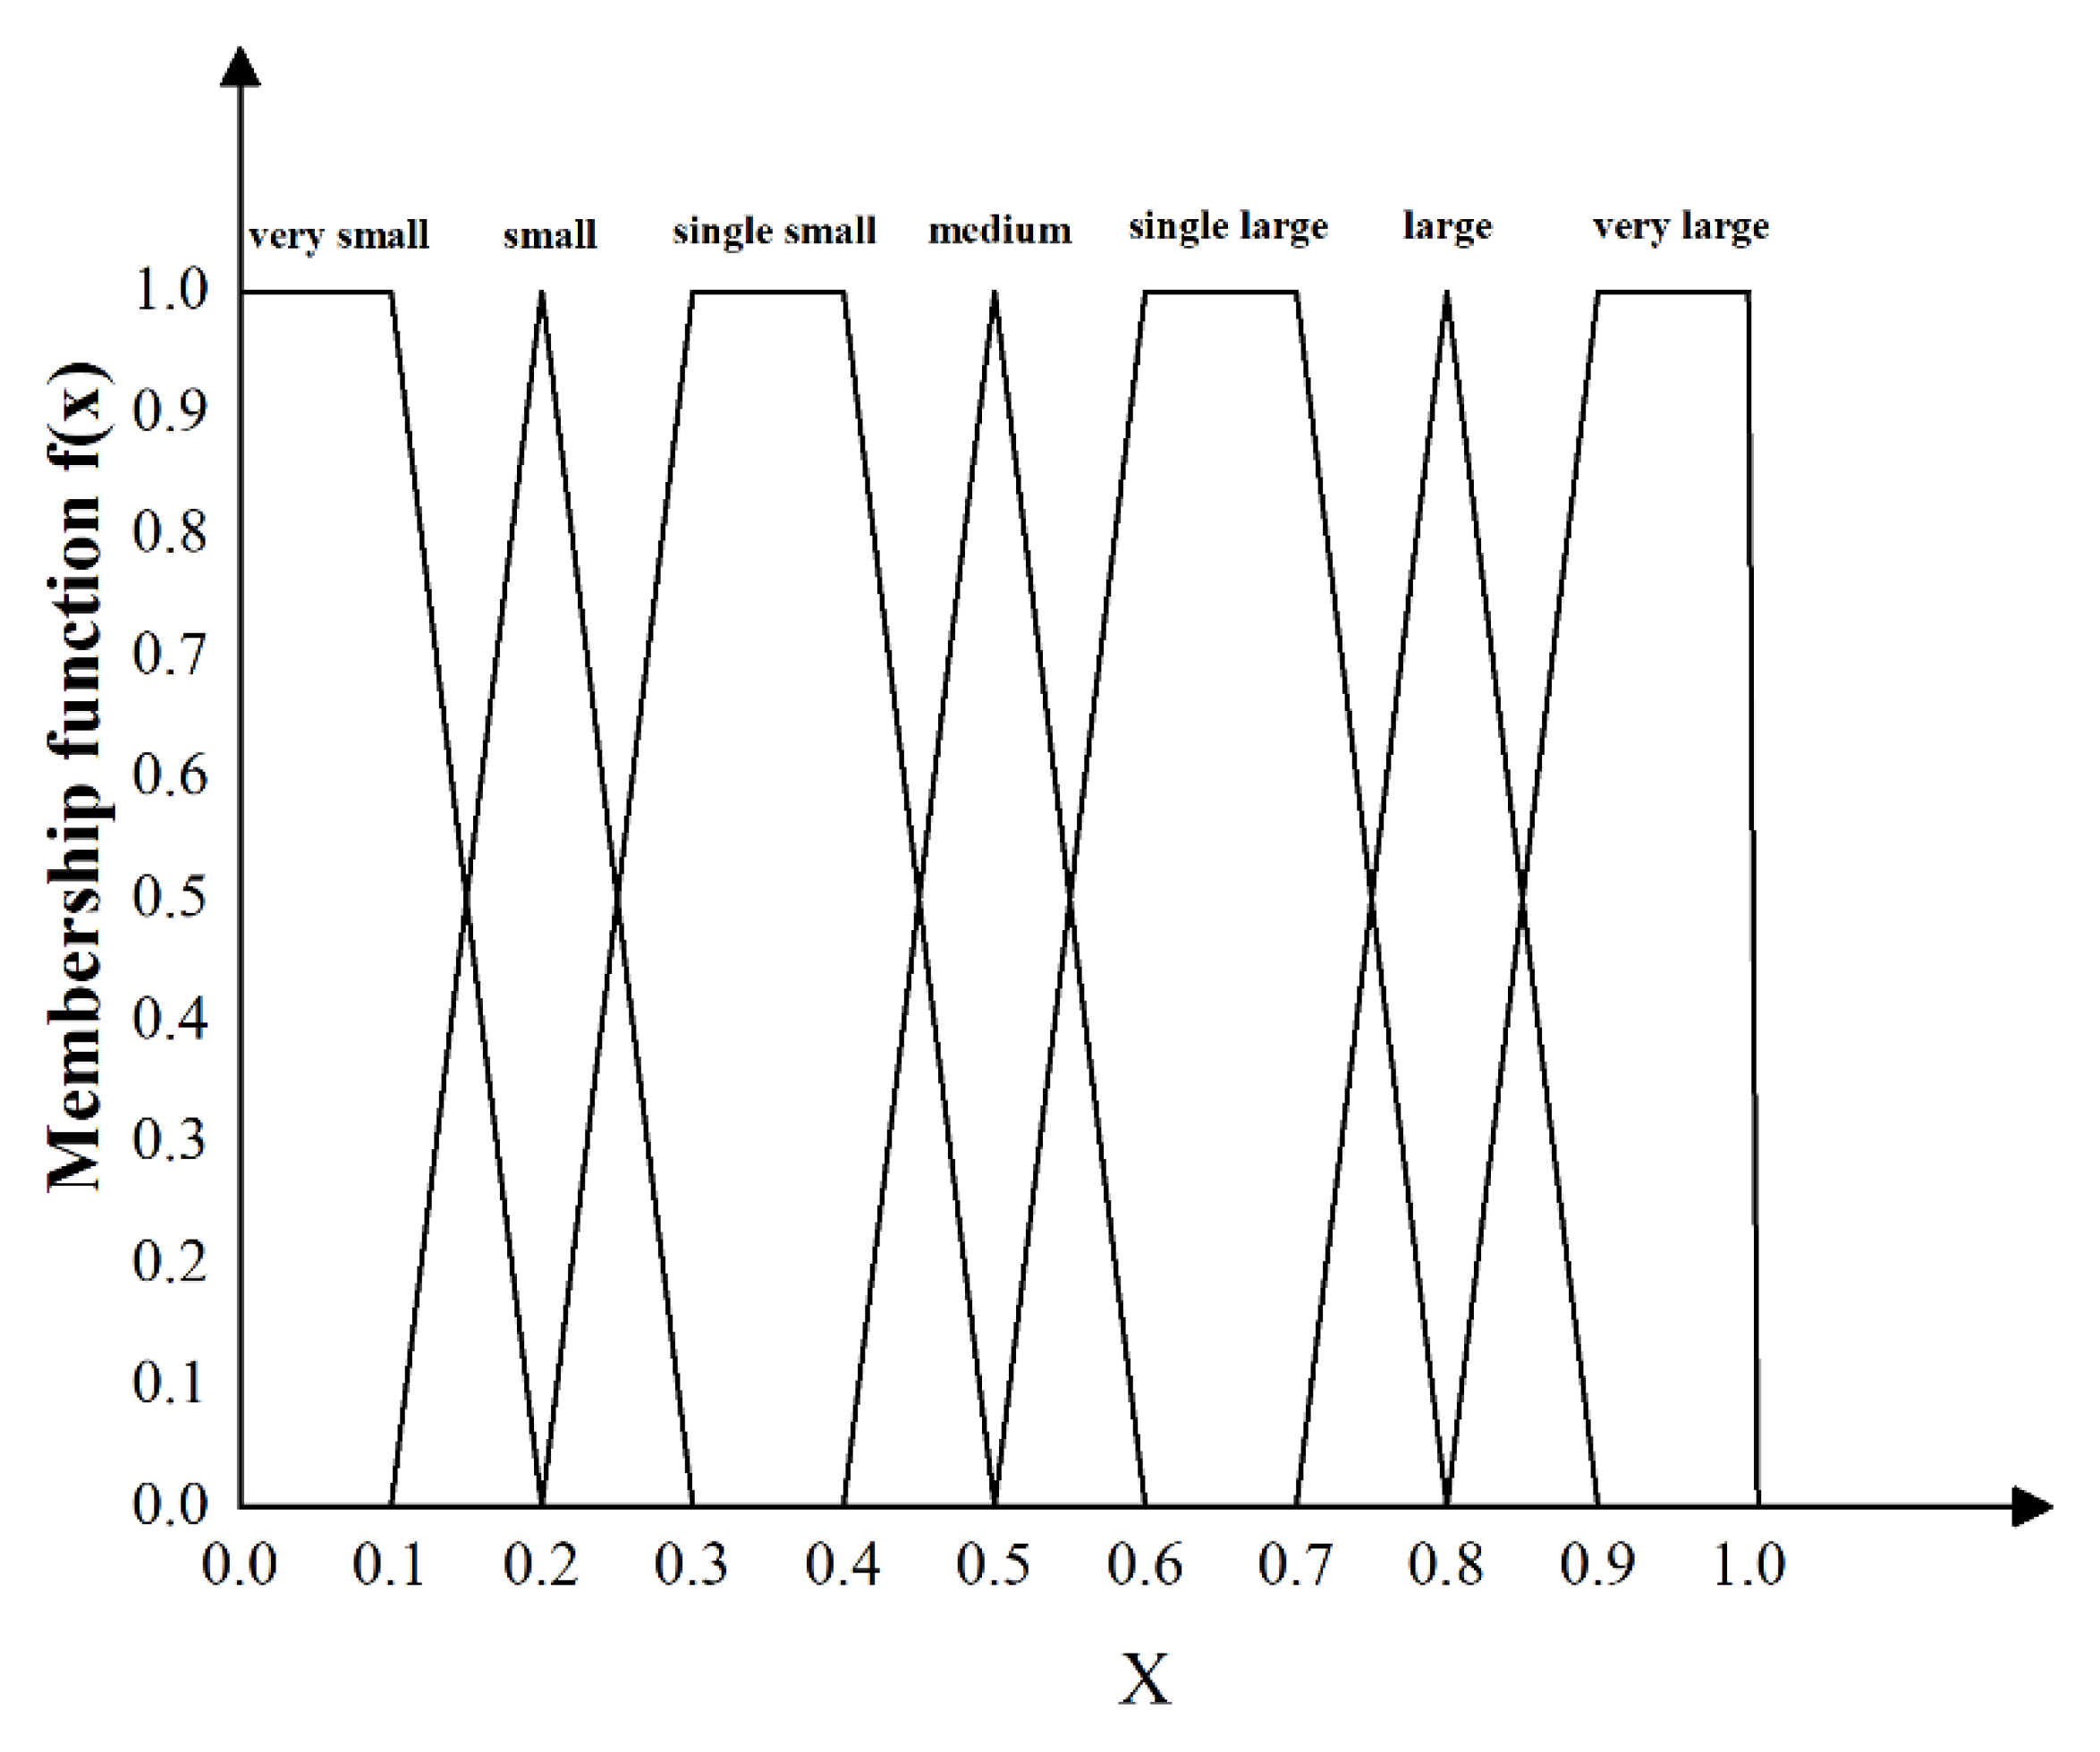
Quantification of expert opinions based on the affiliation function
After evaluating the likelihood of the occurrence of each basic event, experts applied fuzzy set theory to address these fuzzy natural languages. Assuming that U is an object-composed domain, a fuzzy set F(x) on domain U is defined as an affiliation function that represents the degree to which an element x in domain U belongs to fuzzy set F, referred to as the affiliation degree of x to F. Trapezoidal and triangular affiliation functions have gentle rise and fall curves compared with ridge affiliation functions, which provide better stability and reliability. In this study, by constructing the membership function of Chen and Hwang [26], the membership function was used to quantify expert opinions. A specific representation of this is presented in Figure 3.
The expression of the affiliation function is derived from the natural-language fuzzy number graph shown in Figure 3 as follows:
f V S x =               1 , 0 x < 0.1 0.2 x 0.1 , 0.1 x < 0.2               0 , e l s e
f S x = x 0.1 0.1 , 0.1 x < 0.2 0.3 x 0.1 , 0.2 x < 0.3               0 , e l s e  
f S S x = x 0.2 0.1 , 0.2 x < 0.3 0.5 x 0.1 , 0.4 x < 0.5               1 , 0.3 x < 0.4               0 , e l s e              
f M x = x 0.4 0.1 , 0.4 x < 0.5 0.6 x 0.1 , 0.5 x < 0.6               0 , e l s e
    f S L x = x 0.5 0.1 , 0.5 x < 0.6 0.8 x 0.1 , 0.6 x < 0.7               1 , 0.7 x < 0.8               0 , e l s e
f L x = x 0.7 0.1 , 0.7 x < 0.8 0.9 x 0.1 , 0.8 x < 0.9               0 , e l s e
f V L x = x 0.8 0.1 , 0.8 x < 0.9               1 , 0.9 x < 1               0 , e l s e
(4)
Calculation of the average fuzzy number.
After determining the relative affiliation function of the comment set, the fuzzy number of the expert opinions was calculated. Typically, the α-intercept set of the fuzzy set is used for processing. Let the α-intercept set of the affiliation function for “ V S ” be ( v s 1 , v s 2 ), where v s 1 and v s 2 are the upper and lower limits of the α-intercept set, then v s 1 = 0 , v s 2 = 0.2 0.1 α .
Similarly, the fuzzy set with the comment “ S ” was obtained as follows: s 1 = 0.1 + 0.1 α ,   s 2 = 0.3 0.1 α .
The fuzzy set for “ S S ” was obtained as follows: s s 1 = 0.2 + 0.1 α , s s 2 = 0.5 0.1 α .
The fuzzy set for “ M ” was obtained as follows: m 1 = 0.4 + 0.1 α , m 2 = 0.6 0.1 α .
The fuzzy set for the rating “ S L ” was obtained as follows: s l 1 = 0.5 + 0.1 α , s l 2 = 0.8 0.1 α .
The fuzzy set for the rating “ L ” was obtained as follows: l 1 = 0.7 + 0.1 α , l 2 = 0.9 0.1 α .
The fuzzy set for “ V L ” was obtained as follows: v l 1 = 0.8 + 0.1 α , v l 2 = 1 .
Taking the example of “employee theft”, combined with the evaluation results of 30 experts, the fuzzy set of expert opinions under the α-intercept set was obtained as follows:
f ( x ) = m a x | V S V S V S V S V S V S V S V S V S V S V S V S S S S S S S M M M M M M S L S L S L S L S L S L V L V L V L | = | 12 × 0 + 3 × ( 0.2 + 0.1 α ) + 6 × ( 0.4 + 0.1 α ) + 6 × ( 0.5 + 0.1 α ) + 3 × ( 0.8 + 0.1 α ) , 12 × ( 0.2 0.1 α ) + 3 × ( 0.5 0.1 α ) + 6 × ( 0.6 0.1 α ) + 6 × ( 0.8 0.1 α ) + 3 × 1 | = | 8.4 + 1.8 α , 15.3 2.7 α |
Fuzzy extension theory was used to calculate the mean fuzzy number W as follows:
W = 1 30 8.4 + 1.8 α , 15.3 2.7 α
Let W α = x 1 , x 2 , W α = x 1 , x 2 = 0.28 + 0.06 α , 0.51 0.09 α is obtained, then α 1 = x 1 0.28 0.06 ,     α 2 = 0.51 x 2 0.09 is obtained. The relational function is as follows:
f W x = x 0.28 0.06 , 0.28 x < 0.34 0.51 x 0.09 , 0.42 x < 0.51               1 , 0.34 x < 0.42               0 , e l s e
which indicates the mean fuzzy number W was obtained.
(5)
Transformation of fuzzy numbers into fuzzy probabilities using the left-right fuzzy ranking method.
The average fuzzy number was calculated, and the expert opinion was transformed into a set in the range of [0, 1]. The left-right fuzzy ranking method proposed by Chen and Hwang et al. in 1992 was used to transform the fuzzy number into a fuzzy probability value (S), and its fuzzy probability was obtained. The maximum fuzzy set and minimum fuzzy set are defined as follows:
f max x = x ,   0 < x < 1 0 ,   e l s e
f min x = 1 x ,   0 < x < 1 0 ,   e l s e
The formulas for the left and right fuzzy possible values are as follows:
S R w = s u p f w x f m a x x
S L w = s u p f w x f m i n x
S w = S R w + 1 S L w 2
The fuzzy possible values for “employee theft” were calculated as S R ( w ) = 0.468 ,   S L w = 0.679 ,     a n d     S ( w ) = 0.395.
The fuzzy possible values were transformed into fuzzy probabilities.
P = 1 10 k , S 0 0 , S = 0
where k = 2.301 × ( 1 S S ) 1 3 .
S ( w ) = 0.395 was substituted into Equation (15) to obtain k = 2.652, and the fuzzy probability of “employee theft” was obtained as P = 2.228 × 10 3 .
Similarly, the probability of other basic events can be obtained. The probability of each basic event was taken as the reference basis, and the result of probability normalization was taken as the weight of each basic event. The probability and weight of basic events are shown in Table 3.

2.2.2. Probabilistic Importance of Basic Events

Probabilistic importance is a quantitative analysis method used to analyze the importance of each basic event from the perspective of the importance of the basic event occurrence probabilities on the probability of occurrence of the top event. Through the basic event occurrence probabilities obtained above, and fault tree calculation, the probability importance ranking of each basic event was obtained as follows:
I q i = δ Q δ q i
where i represents the eight types of basic events, Q represents the probability of occurrence of the top event, and q represents the probability of occurrence of each basic event.
The probability importance of each basic event was obtained through calculation, as shown in Table 4.
The probability importance ranking of basic events was Ig(X1) > Ig(X2) > Ig(X6) > Ig(X3) > Ig(X7) > Ig(X5) > Ig(X8) > Ig(X4). That is, employee theft > attack > employee injury > natural disaster > equipment failure > stealing > fire > internet information events.
Based on the ranking results of basic event probability importance, it can be concluded that the probability change of X1 has the most significant impact on the occurrence of the top event. To reduce the likelihood of nuclear security radiation events, it is crucial to decrease the probability of X1 employees engaging in burglary. On the other hand, the effect of X4 network information event on the probability of top event occurrence was minimal. Altering X4 has little influence on the occurrence of the top event.

2.2.3. Critical Importance of Basic Events

Critical importance is a measure of the importance standard of each basic event from the dual perspectives of sensitivity and probability. The probabilistic importance formula is as follows:
I C i = q i Q I q i
The critical importance of each basic event was calculated as shown in Table 5.
The critical importance ranking of basic events was obtained as follows:
Ι δ ( X 1 )   >   Ι δ ( X 2 )   >   Ι δ ( X 6 )   >   Ι δ ( X 3 )   >   Ι δ ( X 7 )   >   Ι δ ( X 4 )   >   Ι δ ( X 8 )   >   Ι δ ( X 5 )
That is, employee theft > assault > employee injury > natural disaster > equipment failure > internet information events > fire > stealing.
Based on the critical importance ranking of basic events, it is evident that the basic event X 1 , employee theft, has the most significant impact on the change rate of the occurrence probability of the top event. On the other hand, the basic event X 5 , stealing, has the least impact on the change rate of the occurrence probability of the top event. By conducting a fault tree analysis, it becomes evident that the significance of employee theft and stealing events far surpasses that of other basic events.

3. Fuzzy Comprehensive Decision Making

After obtaining the importance analysis results of nuclear security events at the spent fuel reprocessing plant, the importance of each facility at the spent fuel reprocessing plant was further analyzed, a fuzzy integrated decision-making model was established, and the importance ranking of the facilities at the spent fuel reprocessing plant was obtained.

3.1. Factor Set

In this study, eight types of nuclear security basic events at a spent fuel reprocessing plant were taken as the factor sets for the importance of each facility in the spent fuel reprocessing plant area: employee theft (U1), attack (U2), natural disaster (U3), internet information events (U4), stealing (U5), employee injury (U6), equipment failure (U7), and fire (U8).

3.2. Weighting Set

For spent fuel reprocessing plants, the factors in a factor set do not have the same influence on the safety system. To reflect the importance of each factor, the result of the basic event probability weight analysis as the weight set of each factor assigned weight Q i to each factor. The weight set A was obtained as follows:
A = a 1 , a 2 , a 3 , a 4 , a 5 , a 6 , a 7 , a 8 = 0.068 , 0.032 , 0.142 , 0.242 , 0.048 , 0.142 , 0.208 , 0.118

3.3. Evaluation Set

The seven levels of possibility of a nuclear security event were taken as the evaluation set: V = {Very Small (VS), Small (S), Single Small (SS), Medium (M), Single Large (SL), Large (L), and Very Large (VL)}.
Based on the affiliation functions of the seven fuzzy natural languages established in the previous section, the fuzzy possible values of the seven fuzzy natural languages were obtained using the left-right fuzzy ranking method, as shown in Table 6.
The set of possible values for the seven fuzzy natural languages was
S = {S1, S2, S3, S4, S5, S6, S7} = {0.091, 0.227, 0.363, 0.500, 0.636, 0.773, 0.909}.
The four plant areas of the spent fuel reprocessing plant were further divided into 13 evaluation units: spent fuel pool; extraction process plant; tail-end conversion plant; waste liquid purification plant; curing workshop; discharge workshop; solid waste preparation workshop; equipment room; storehouse; centralized control room; office area; dormitory; and laboratory.
Thirty experts were scored for their service years, qualifications, and academic qualifications. In order to facilitate the display of data, experts with the same score were divided into the same group. The expert weights were calculated as shown in Table 7 below.
The evaluation results for the 13 evaluation units were obtained using the expert scoring method as shown in Figure 4.

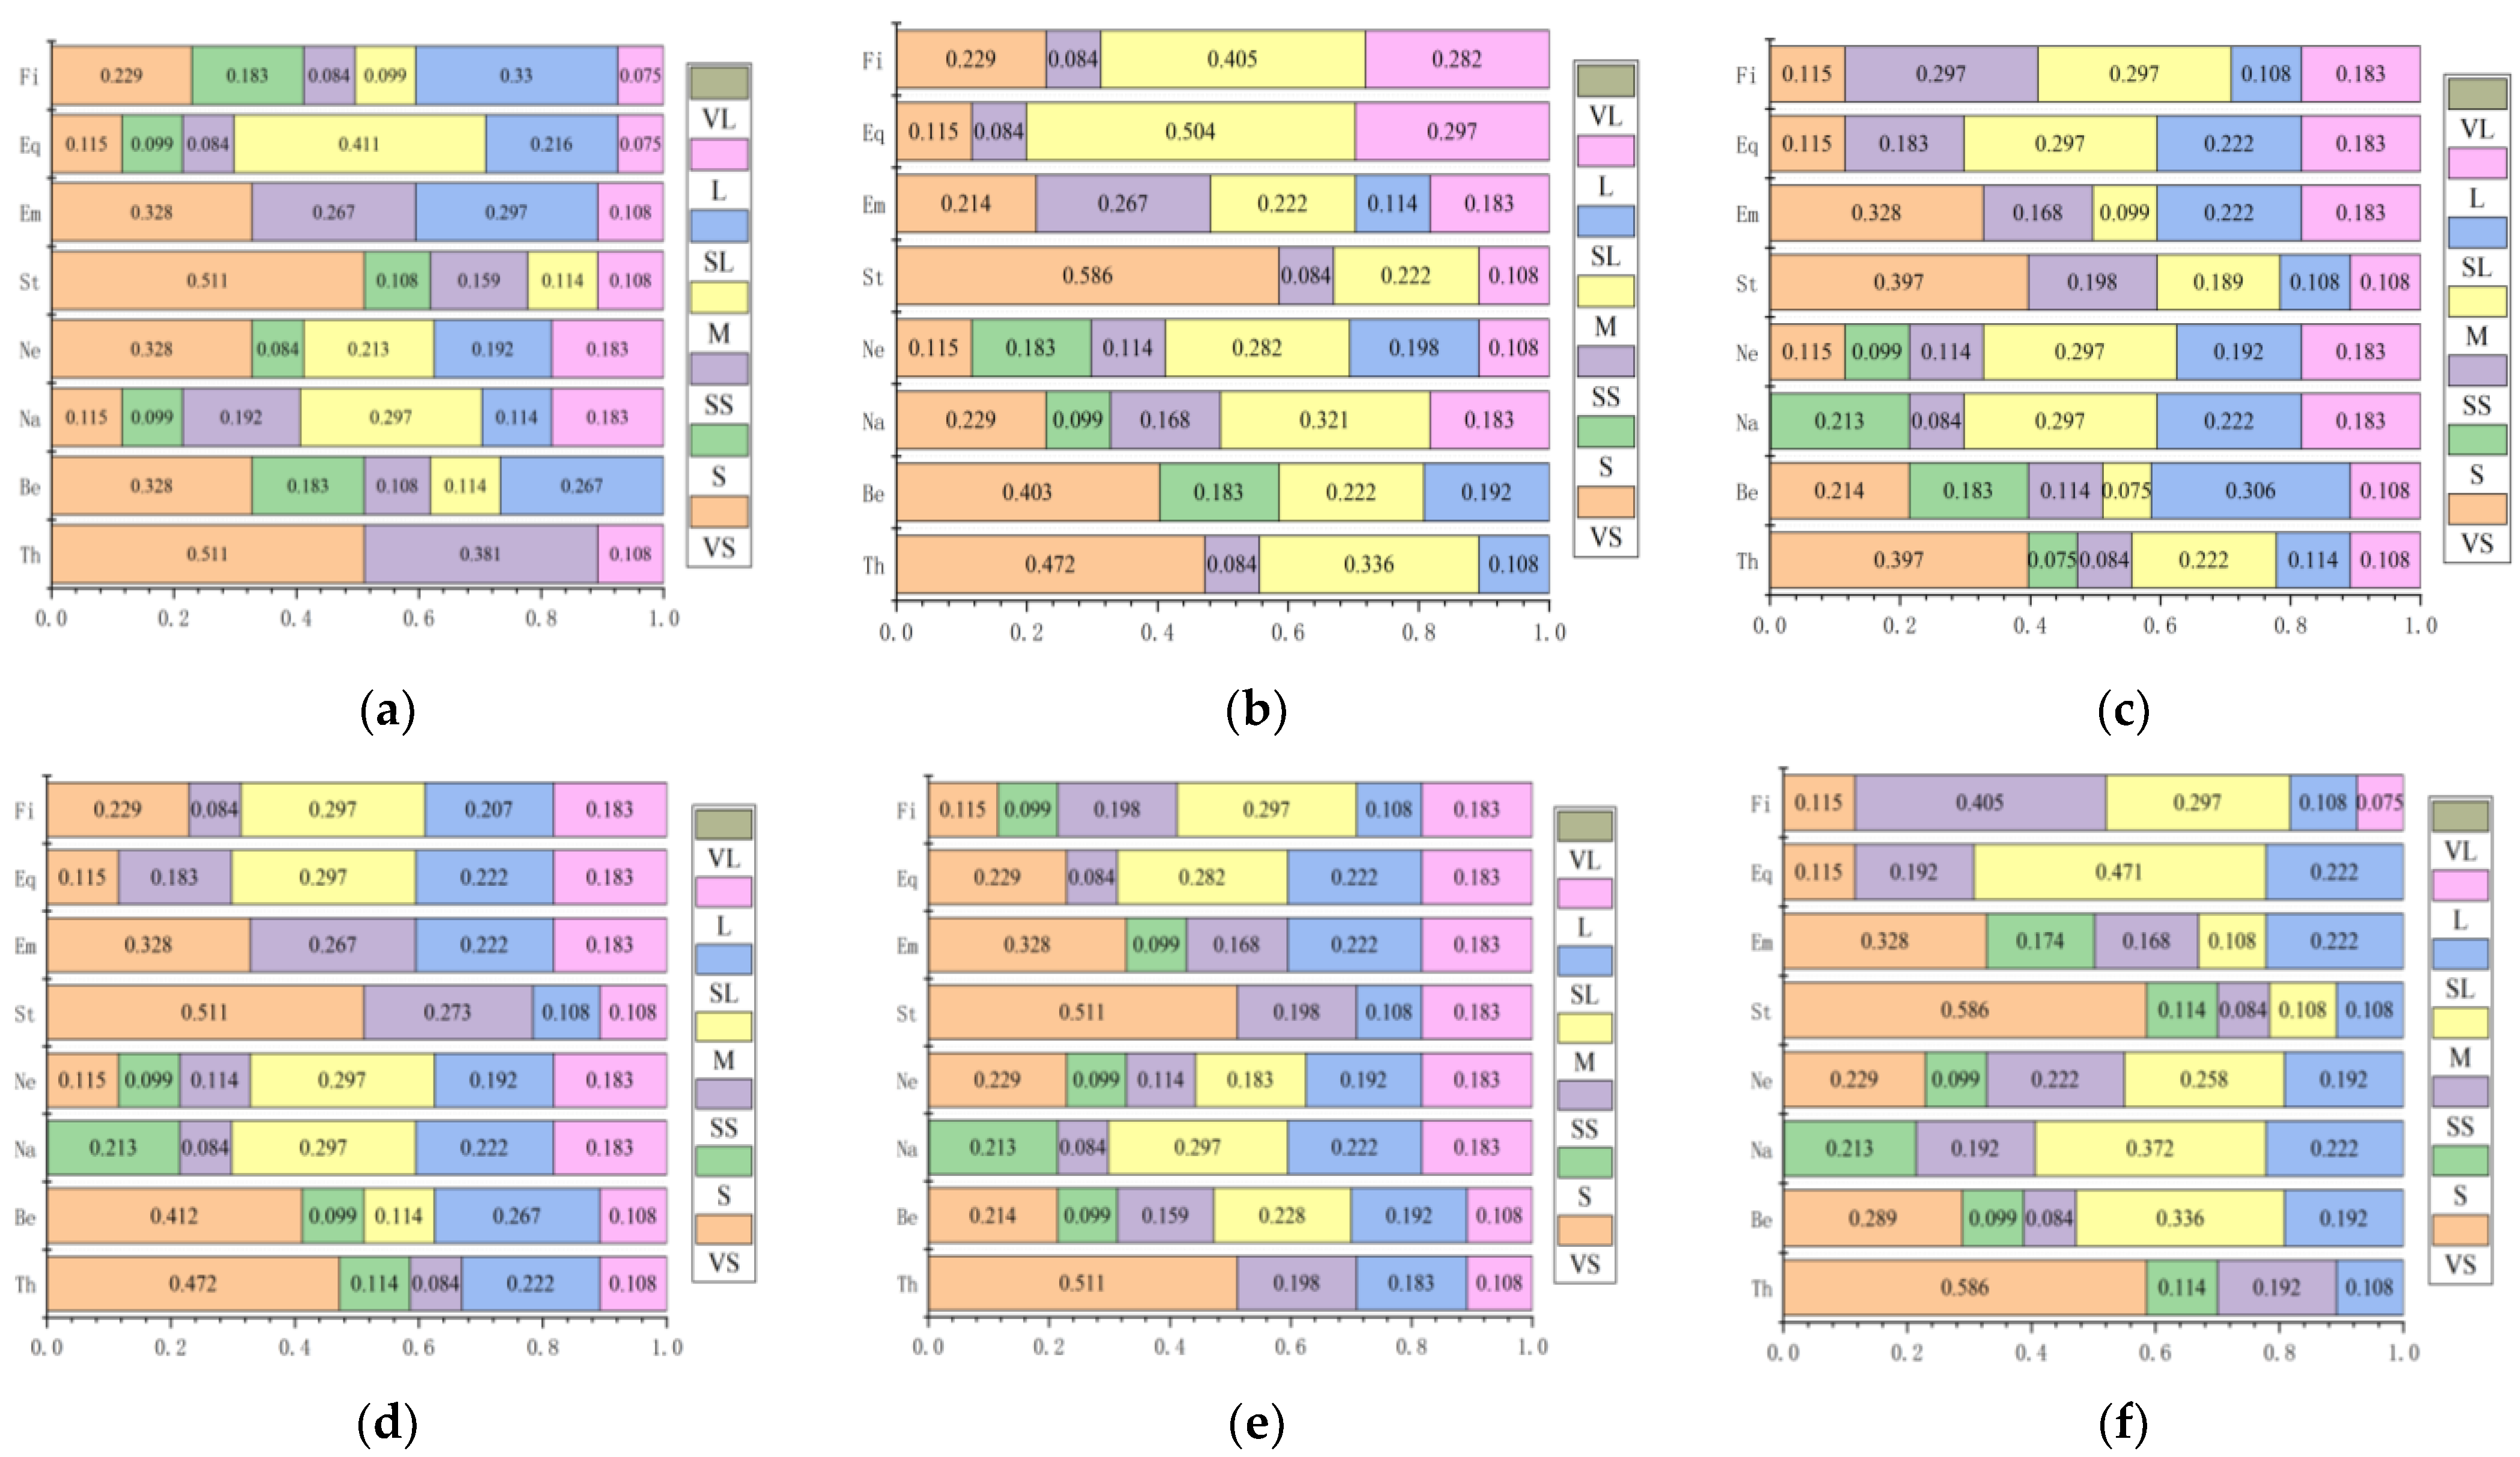
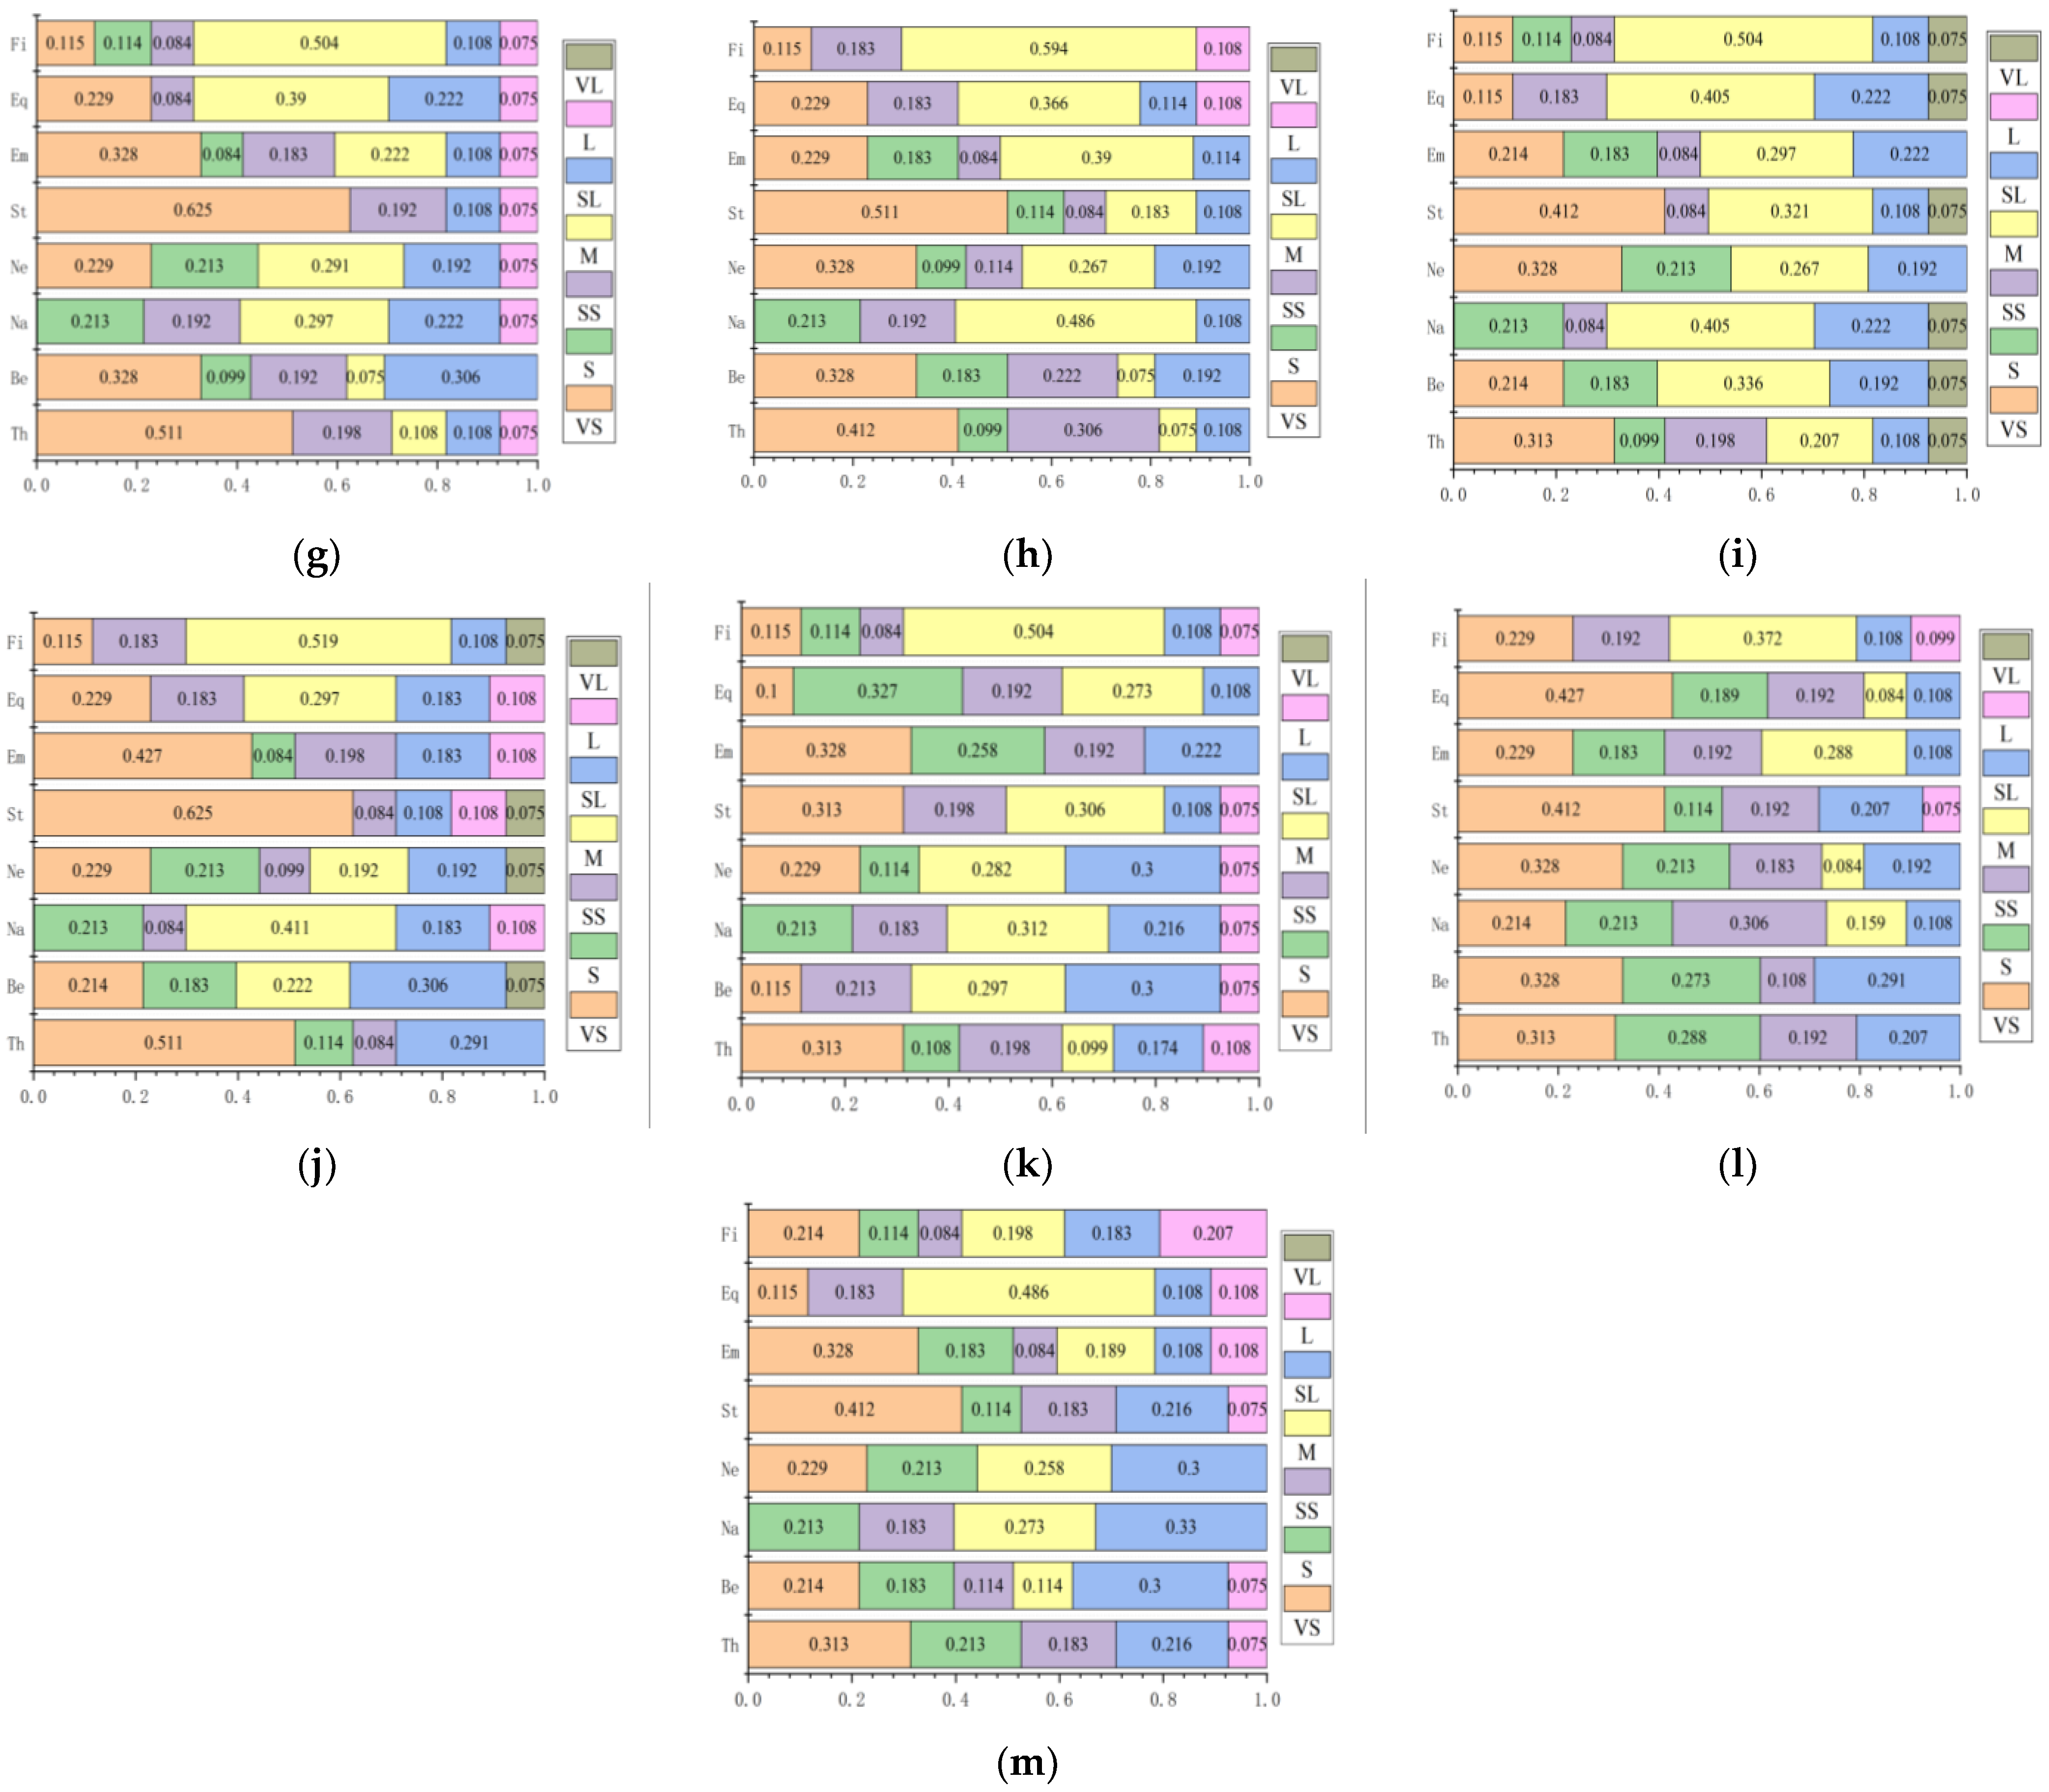
3.4. Single Factor Evaluation Matrix

After the experts were invited to score, the matrix representing the evaluation results given by the five groups of experts was multiplied by the corresponding expert weights, to determine the membership degree of a single factor to the evaluation index of nuclear safety accidents.
Taking the incident of “employee theft” in the spent fuel pool as an example, the first group of nine experts believed that the possibility of “employee theft” in the spent fuel pool area was very small for six experts, and the possibility was less for three. The second group of six experts believed that the possibility of “employee theft” in the spent fuel pool area was less for three, and more for three. The third group of experts considered the possibility of “employee theft” in the spent fuel pool area to be very small. The fourth group of experts believed that the possibility of “employee theft” in the spent fuel pool area was very small for three, and less likely for three. A fifth group of three experts identified “employee theft” incidents in the spent fuel pool area as less likely.
Thus, the matrix T 1 1 of the five groups of expert evaluation results was obtained, where the superscript represents the basic event number, and the subscript represents the evaluation unit number.
T 1 1 = 6       0       3       0       0       0       0 0       0       3       0       0       3       0 6       0       0       0       0       0       0 3       0       3       0       0       0       0 0       0       3       0       0       0       0
By multiplying the expert weight with the evaluation result matrix, R 1 1 can be obtained as follows:
R 1 1 = ( 0.347 / 9       0.215 / 6       0.198 / 6       0.165 / 6       0.075 / 3 ) T 1 1
The calculated evaluation matrix of R 1 1 is as follows:
R 1 1 = 0.511       0.000       0.381       0.000       0.000       0.108       0.000
Similarly, the evaluation matrix of the remaining basic events in the spent fuel pool area can be obtained as follows:
R 1 2 = 0.328       0.183       0.108       0.114       0.267       0.000       0.000 R 1 3 = 0.115       0.099       0.192       0.297       0114       0.183       0.000 R 1 4 = 0.328       0.084       0.000       0.213       0.192       0.183       0.000 R 1 5 = 0.511       0.108       0.159       0.114       0.000       0.108       0.000 R 1 6 = 0.328       0.000       0.267       0.000       0.297       0.108       0.000 R 1 7 = 0.115       0.099       0.084       0.411       0.216       0.075       0.000 R 1 8 = 0.229     0.183       0.084       0.099       0.330       0.075       0.000
The expert scoring results were used to determine the affiliation degree of a single factor to the evaluation index of the nuclear security incident, and the evaluation matrix R = (rij)8×7 was obtained as follows:
R = r 11 r 12 r 21 r 22 r 1 j r 2 j r i 1 r i 2 r i j
The evaluation matrix for each facility was obtained as follows:
Spent Fuel Pool—
R 1 = 0.511       0.000       0.381       0.000       0.000       0.108       0.000 0.328       0.183       0.108       0.114       0.267       0.000       0.000 0.115       0.099       0.192       0.297       0114       0.183       0.000 0.328       0.084       0.000       0.213       0.192       0.183       0.000 0.511       0.108       0.159       0.114       0.000       0.108       0.000 0.328       0.000       0.267       0.000       0.297       0.108       0.000 0.115       0.099       0.084       0.411       0.216       0.075       0.000 0.229       0.183     0.084       0.099       0.330       0.075       0.000
Extraction Process Plant—
R 2 = 0.472       0.000       0.084       0.336       0.108       0.000       0.000 0.403       0.183       0.000       0.222       0.192       0.000       0.000 0.229       0.099       0.168       0.321       0.000       0.183       0.000 0.115       0.183       0.114       0.282       0.198       0.108       0.000 0.586       0.000       0.084       0.222       0.000       0.108       0.000 0.214       0.000       0.267       0.222       0.114       0.183       0.000 0.115       0.000       0.084       0.504       0.000       0.297       0.000 0.229       0.000       0.084       0.405       0.000       0.282       0.000
Tail-End Conversion Plant—
R 3 = 0.397       0.075       0.084       0.222       0.114       0.108       0.000 0.214       0.183       0.114       0.075       0.306       0.108       0.000 0.001       0.213       0.084       0.297       0.222       0.183       0.000 0.115       0.099       0.114       0.297       0.192       0.183       0.000 0.397       0.000       0.198       0.189       0.108       0.108       0.000 0.328       0.000       0.168       0.099       0.222       0.183       0.000 0.115       0.000       0.183       0.297       0.222       0.183       0.000 0.115       0.000       0.297       0.297       0.108       0.183       0.000
Waste Liquid Purification Plant—
R 4 = 0.472       0.114       0.084       0.000       0.222       0.108       0.000 0.412       0.099       0.000       0.114       0.267       0.108       0.000 0.001       0.213       0.084       0.297       0.222       0.183       0.000 0.115       0.099       0.114       0.297       0.192       0.183       0.000 0.511       0.000       0.273       0.000       0.108       0.108       0.000 0.328       0.000       0.267       0.000       0.222       0.183       0.000 0.115       0.000       0.183       0.297       0.222       0.183       0.000 0.229       0.000       0.084       0.297       0.207       0.183       0.000
Curing Workshop—
R 5 = 0.511       0.000       0.198       0.000       0.183       0.108       0.000 0.214       0.099       0.159       0.228       0.192       0.108       0.000 0.001       0.213       0.084       0.297       0.222       0.183       0.000 0.229       0.099       0.114       0.183       0.192       0.183       0.000 0.511       0.000       0.198       0.000       0.108       0.183       0.000 0.328       0.099       0.168       0.000       0.222       0.183       0.000 0.229       0.000       0.084       0.282       0.222       0.183       0.000 0.115       0.099       0.198       0.297       0.108       0.183       0.000
Discharge Workshop—
R 6 = 0.586       0.114       0.192       0.000       0.108       0.000       0.000 0.289       0.099       0.084       0.336       0.192       0.000       0.000 0.001       0.213       0.192       0.372       0.222       0.000       0.000 0.229       0.099       0.222       0.258       0.192       0.000       0.000 0.586       0.114       0.084       0.108       0.108       0.000       0.000 0.328       0.174       0.168       0.108       0.222       0.000       0.000 0.115       0.000       0.192       0.471       0.222       0.000       0.000 0.115       0.000       0.405       0.297       0.108       0.075       0.000
Solid Waste Preparation Workshop—
R 7 = 0.511       0.000       0.198       0.108       0.108       0.075       0.000 0.328       0.099       0.192       0.075       0.306       0.000       0.000 0.001       0.213       0.192       0.297       0.222       0.075       0.000 0.229       0.213       0.000       0.291       0.192       0.075       0.000 0.625       0.000       0.192       0.000       0.108       0.075       0.000 0.328       0.084       0.183       0.222       0.108       0.075       0.000 0.229       0.000       0.084       0.390       0.222       0.075       0.000 0.115       0.114       0.084       0.504       0.108       0.075       0.000
Equipment Room—
R 8 = 0.412       0.099       0.306       0.075       0.108       0.000       0.000 0.328       0.183       0.222       0.075       0.192       0.000       0.000 0.001       0.213       0.192       0.486       0.108       0.000       0.000 0.328       0.099       0.114       0.267       0.192       0.000       0.000 0.511       0.114       0.084       0.183       0.108       0.000       0.000 0.229       0.183       0.084       0.390       0.114       0.000       0.000 0.229       0.000       0.183       0.366       0.114       0.108       0.000 0.115       0.000       0.183       0.594       0.000       0.108       0.000
Storehouse—
R 9 = 0.313       0.099         0.198       0.207       0.108       0.000       0.075 0.214       0.183       0.000       0.336       0.192       0.000       0.075 0.001       0.213       0.084       0.405       0.222       0.000       0.075 0.328       0.213       0.000       0.267       0.192       0.000       0.000 0.412       0.000       0.084       0.321       0.108       0.000       0.075 0.214       0.183       0.084       0.297       0.222       0.000       0.000 0.115       0.000       0.183       0.405       0.222       0.000       0.075 0.115       0.114       0.084       0.504       0.108       0.000       0.075
Centralized Control Room—
R 10 = 0.511       0.114       0.084       0.000       0.291       0.000       0.000 0.214       0.183       0.000       0.222       0.306       0.000       0.075 0.001       0.213       0.084       0.411       0.183       0.108       0.000 0.229       0.213       0.099       0.192       0.192       0.000       0.075 0.625       0.000       0.084       0.000       0.108       0.108       0.075 0.427       0.084       0.198       0.000       0.183       0.108       0.000 0.229       0.000       0.183       0.297       0.183       0.108       0.000 0.115       0.000       0.183       0.519       0.108       0.000       0.075
Office Area—
R 11 = 0.313       0.108       0.198       0.099       0.174       0.108       0.000 0.115       0.000       0.213       0.297       0.300       0.075       0.000 0.001       0.213       0.183       0.312       0.216       0.075       0.000 0.229       0.114       0.000       0.282       0.300       0.075       0.000 0.313       0.000       0.198       0.306       0.108       0.075       0.000 0.328       0.258       0.192       0.000       0.222       0.000       0.000 0.100       0.327       0.192       0.273       0.108       0.000       0.000 0.115       0.114       0.084       0.504       0.108       0.075       0.000
Dormitory—
R 12 = 0.313       0.288       0.192       0.000       0.207       0.000       0.000 0.328       0.273       0.108       0.000       0.291       0.000       0.000 0.214       0.213       0.306       0.159       0.108       0.000       0.000 0.328       0.213       0.183       0.084       0.192       0.000       0.000 0.412       0.114       0.192       0.000       0.207       0.075       0.000 0.229       0.183       0.192       0.288       0.108       0.000       0.000 0.427       0.189       0.192       0.084       0.108       0.000       0.000 0.229       0.000       0.192       0.372       0.108       0.099       0.000
Laboratory—
R 13 = 0.313       0.213       0.183       0.000       0.216       0.075       0.000 0.214       0.183       0.114       0.114       0.300       0.075       0.000 0.001       0.213       0.183       0.273       0.330       0.000       0.000 0.229       0.213       0.000       0.258       0.300       0.000       0.000 0.412       0.114       0.183       0.000       0.216       0.075       0.000 0.328       0.183       0.084       0.189       0.108       0.108       0.000 0.115       0.000       0.183       0.486       0.108       0.108       0.000 0.214       0.114       0.084       0.198       0.183       0.207       0.000

3.5. Fuzzy Synthesis Evaluation

The take smaller–take larger operator in the synthesis operation of the fuzzy evaluation matrix and weight set were used to perform the synthesis operation. Therefore, the bias caused by factors that cannot be excluded, such as the expert’s preference, the number of basic events that are not large enough, and other effects, were corrected. The formula of the model M(∧,∨) was expressed as M ( , ) = ( A i , r i j ) = m a x { A 1 r 1 j ,   A 2 r 2 j , A 3 r 3 j , . . . , A i r i j } .
The take smaller–take larger operator in the synthesis operation of the fuzzy evaluation matrix and the weight set were used to perform the synthesis operation. The formula for the fuzzy comprehensive decision model was as follows:
B i = A R i
The fuzzy comprehensive evaluation sets of the units were calculated as follows—
  • Spent Fuel Pool: B 1 = [ 0.242   0.118   0.142   0.213   0.208   0.208   0.000   ]
  • Extraction Process Plant: B 2 = [ 0.142   0.183   0.142   0.242   0.198   0.208   0.000 ]
  • Tail-End Conversion Plant: B 3 = [ 0.142   0.142   0.183   0.242   0.192   0.183   0.000 ]
  • Waste Liquid Purification Plant: B 4 = [ 0.142   0.142   0.183   0.242   0.208   0.183   0.000 ]
  • Curing Workshop: B 5 = [ 0.229   0.142   0.118   0.208   0.208   0.183   0.000   ]
  • Discharge Workshop: B 6 = [ 0.229   0.142   0.222   0.242   0.192   0.075   0.000 ]
  • Solid Waste Preparation Workshop: B 7 = [ 0.229   0.213   0.124   0.242   0.208   0.075   0.000 ]
  • Equipment Room: B 8 = [ 0.242   0.142   0.142   0.242   0.192   0.000   0.000 ]
  • Storehouse: B 9 = [ 0.242   0.213   0.183   0.242   0.192   0.000   0.075 ]
  • Centralized Control Room: B 10 = [ 0.229   0.213   0.183   0.208   0.192   0.108   0.075 ]
  • Office Area: B 11 = [ 0.229   0.208   0.192   0.242   0.242   0.075   0.000 ]
  • Dormitory: B 12 = [ 0.242   0.213   0.192   0.142   0.192   0.099   0.000 ]
  • Laboratory: B 13 = [ 0.229   0.213   0.183   0.208   0.242   0.118   0.000 ]

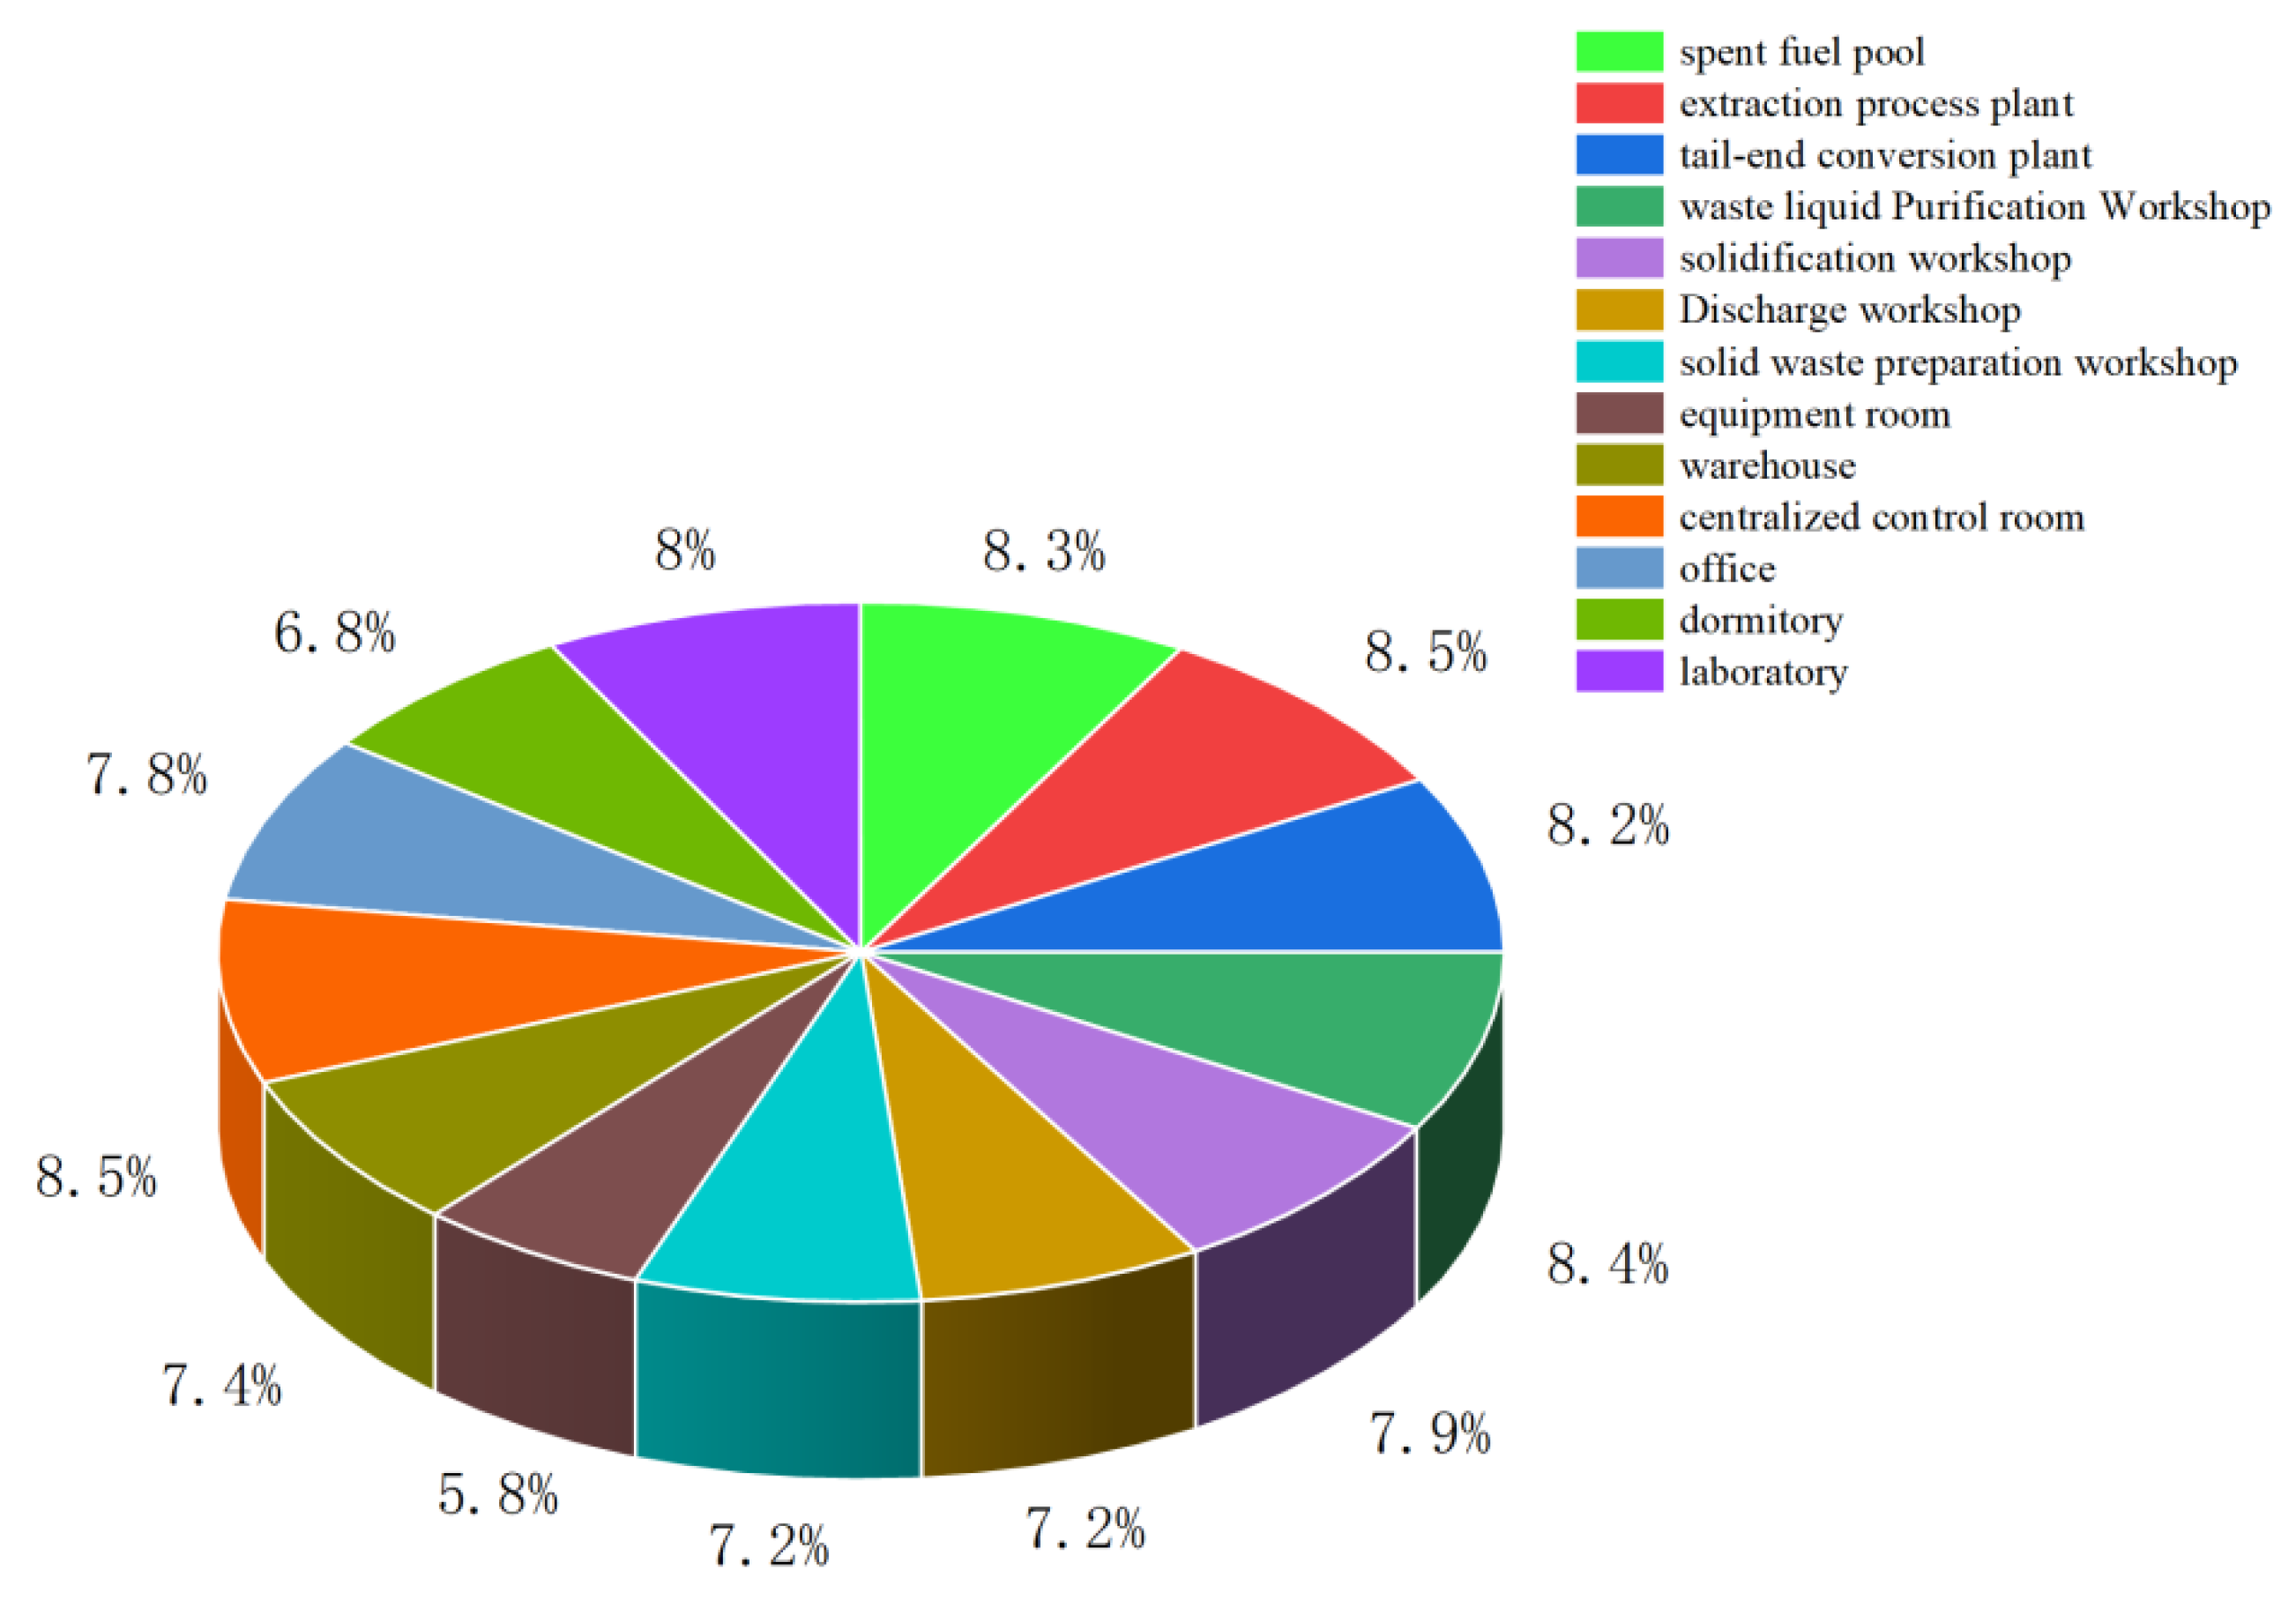
3.6. Fuzzy Comprehensive Evaluation

The fuzzy possible value S representing seven natural languages can be multiplied by the fuzzy comprehensive evaluation set Bi of 13 units, to obtain the final evaluation result B i of the importance of each facility as follows:
B i = B i S T
The calculation of the importance of radiation monitoring for each critical facility is illustrated in Figure 5. The order of importance of radiation monitoring for each facility was as follows: extraction process plant = centralized control room > waste liquid purification workshop > spent fuel pool > tail-end conversion plant > laboratory > curing workshop > office > warehouse > discharge workshop = solid waste preparation workshop > dormitory > equipment room.
According to the importance calculation result of the unit facilities, it can be seen that the centralized control room in the plant front area, and the extraction process plant in the main process area were more important than the other units. Therefore, in the process of the daily management of spent fuel reprocessing plants, it is necessary to focus on installing monitoring equipment and arranging monitoring forces for the extraction process plant and centralized control room to prevent nuclear security radiation incidents.

3.7. Comparison and Verification

According to the risk evaluation of each evaluation unit by experts, the method of probability theory and mathematical statistics was used for analysis. Probability theory and the mathematical statistics method used the expert scoring method combined with expert weight, using the weighted average method to get the probability of each basic event, and used frequency instead of the probability method. The results of the evaluation unit risk calculated by the index method are shown in Table 8.
Based on the data, it can be observed that the four evaluation units of the main process area still held a higher level of facility importance. Furthermore, the facility importance of the main process area was found to be the highest among the four regions, which aligned with the conclusions drawn from the fuzzy comprehensive evaluation and fuzzy mathematics. However, it is noteworthy that the results concerning the facility importance of auxiliary equipment to and from the pre-plant area differ significantly from the findings derived from the main methods employed in this study. This discrepancy can be primarily attributed to the fact that the influence of fuzzy natural language fuzziness was disregarded during the calculation, which mainly concentrated on probability theory and mathematical statistics. Consequently, this study provides a theoretical basis for both the fuzzy comprehensive evaluation and the applicability of the fuzzy mathematics method.

4. Optimization of Radiation Source Monitoring for Radiation Events at Each Facility

4.1. Importance Grading

According to the importance evaluation results of the facilities in the spent fuel reprocessing plant in Table 8, this study divided the facilities into three levels according to their importance in accordance with the interval as follows: high-importance, medium-importance, and general-importance facilities. The probability of a nuclear security event occurring in a high-importance facility is very high, and the damage caused to the system is also destructive, requiring managers to take mandatory safety measures, invest a large amount of radiation monitoring resources to monitor it, and prevent nuclear security events from occurring. For a medium-importance facility, the likelihood of a nuclear security event is general, but it also causes casualties and major system damage, requiring managers to take immediate measures to prevent nuclear security events. For a general-importance facility, a nuclear security event is less likely to result in damage to personnel and major systems, but it requires managers to preclude and control it to the extent possible. Table 9 shows the grading of facility importance.
Based on the above criteria for grading importance, and the results of analyzing the importance of each facility, the corresponding importance grading results for the facilities were obtained. (Table 10).

4.2. Monitoring Program

Nuclear facilities often contain radioactive γ nuclides 238U, 232Th, 226Ra, 40K, 137Cs, and a certain amount of α, β radiation. Therefore, the types of equipment selected for this system included α and β radiation surface contamination monitoring; X and γ radiation surface contamination monitoring; pyro-optical dosimetry; electronic dosimetry; and personal dosage. They are listed in the reference model in Table 11.
Based on the results of the above grading of importance, the monitoring program for radiation source items corresponding to the three grades is presented in Table 12.
For each facility, this study proposed a corresponding grade of radiation monitoring program, which could effectively reduce the risk of nuclear security radiation incidents in spent fuel reprocessing plant facilities, while optimizing the radiation monitoring resources of spent fuel reprocessing facilities to avoid waste. This provides a reference for the nuclear security staff working in reprocessing plants.

5. Conclusions and Future Works

Due to the particularity of a spent fuel reprocessing plant, there is little public data on nuclear security events of the reprocessing plant. However, the issue of nuclear security cannot be ignored. The radiation incident risk of nuclear security cannot be ignored. By summarizing eight types of nuclear security events that may lead to nuclear security radiation events, this paper analyzes the importance of key process facilities of spent fuel reprocessing plants, and puts forward a set of optimization schemes for the radiation monitoring of spent fuel reprocessing plants through analysis results. The results of this paper can be used as a reference for the optimal allocation of radiation monitoring resources in the spent fuel reprocessing plants of nuclear facilities, so as to allocate funds and manpower reasonably, reduce risks, and avoid the waste of resources.
However, the expert scoring method used in this paper has certain limitations, and it is difficult to avoid the influence of subjective factors. Therefore, our future work will mainly focus on how to correctly handle the impact of subjective and objective factors on the results, and minimize the impact of subjectivity. At the same time, the optimal allocation scheme of radiation monitoring resources also needs to comprehensively consider more influencing factors in further research work, to improve the efficiency of resource allocation optimization.

Author Contributions

Conceptualization, M.S., Q.L. and S.X.; data curation, M.S., Q.L. and Y.H.; formal analysis, M.S., Q.L. and C.W.; investigation, M.S. and Y.L.; methodology, S.X. and S.Z.; resources, S.X. and S.Z.; software, Q.L. and C.W.; supervision, S.X. and S.Z.; validation, M.S. and S.X.; visualization, Q.L., C.W. and Y.L.; writing—original draft, M.S.; writing—review & editing, Q.L., C.W. and S.X. All authors have read and agreed to the published version of the manuscript.

Funding

This research is funded by the National Natural Science Foundation of China (11905102).

Institutional Review Board Statement

This study did not require ethical approval.

Informed Consent Statement

Informed consent was obtained from all subjects involved in the study.

Data Availability Statement

The data presented in this study are available on request from the corresponding author.

Conflicts of Interest

The authors declare no conflicts of interest.

References

  1. Ibrahim, M.; Hamdan, S.N.; Haris, M.F.; Sulaiman, M.S.; Aris, S.N.M.; Hasan, M.H.B.; Ab Hamid, A.H. Big data analytics nuclear security framework. IOP Conf. Ser. Mater. Sci. Eng. 2021, 1106, 012026. [Google Scholar] [CrossRef]
  2. Tolo, S.; Patelli, E.; Beer, M. Risk Assessment of spent nuclear fuel facilities considering climate change. ASCE-ASME J. Risk Uncertain. Eng. Syst. Part A Civ. Eng. 2017, 3, G4016003. [Google Scholar] [CrossRef]
  3. Dimitrov, D. Examples of nuclear security measures for nuclear facilities. Secur. Future 2021, 5, 51–54. [Google Scholar]
  4. Li, R.R. Application of Risk Assessment Grading Method in Accident Analysis of Nuclear Fuel Reprocessing Plant; University of South China: Hengyang, China, 2018. [Google Scholar]
  5. Rajakarunakaran, S.; Kumar, A.M.; Prabhu, V.A. Applications of fuzzy faulty tree analysis and expert elicitation for evaluation of risks in LPG refuelling station. J. Loss Prev. Process. Ind. 2015, 33, 109–123. [Google Scholar] [CrossRef]
  6. Wei, C.; Xu, S.; Zou, S.; Zhao, F.; Qin, Z.; Dong, H.; Hou, Z. Risk Analysis and Evaluation of Nuclear Security Radiation Events in Spent Fuel Reprocessing Plants. Sustainability 2022, 15, 781. [Google Scholar] [CrossRef]
  7. Wu, X.; Hu, F. Analysis of ecological carrying capacity using a fuzzy comprehensive evaluation method. Ecol. Indic. 2020, 113, 106243. [Google Scholar] [CrossRef]
  8. Sun, M.; Zheng, W.X.; Duan, X.B. Research on Deep Coal Seam Mining Floor Starta Water Bursting Influenced Factors Based on Analytic Hierachy Process. Appl. Mech. Mater. 2014, 608, 737–741. [Google Scholar]
  9. Xi, J.; Zhao, Y.; Ding, T.; Tian, J.; Li, L. Analysis Model of Risk Factors of Urban Bus Operation Based on FTA-CLR. Adv. Civ. Eng. 2021, 2021, 6657786. [Google Scholar] [CrossRef]
  10. Robati, M.; Rezaei, F. Evaluation and ranking of urban sustainability based on sustainability assessment by fuzzy evaluation model. Int. J. Environ. Sci. Technol. 2021, 19, 625–650. [Google Scholar] [CrossRef]
  11. Yucesan, M.; Gul, M. Hospital service quality evaluation: An integrated model based on Pythagorean fuzzy AHP and fuzzy TOPSIS. Soft Comput. 2020, 24, 3237–3255. [Google Scholar] [CrossRef]
  12. Hu, Y.; Wu, L.; Pan, X.; Wang, Z.; Xu, X. Comprehensive evaluation of cloud manufacturing service based on fuzzy theory. Int. J. Fuzzy Syst. 2021, 23, 1755–1764. [Google Scholar] [CrossRef]
  13. Tian, Y.; Liu, M. Probabilistic fuzzy comprehensive evaluation method for high-rise building fire risk. China Saf. Sci. J. 2004, 14, 99–103. [Google Scholar]
  14. Ni, S.; Zou, S.; Chen, J. Evolutionary Game Model of Internal Threats to Nuclear Security in Spent Fuel Reprocessing Plants Based on RDEU Theory. Sustainability 2022, 14, 2163. [Google Scholar] [CrossRef]
  15. Majewski, M.; Nestler, K.; Veit, D.A.; Diekmeyer, B.; Waldeck, S.; Port, M.; Becker, B.V. Detection of embedded low-level radioactive shrapnel after the explosion of a radiological dispersal device in radiological emergency imaging. Health Phys. 2020, 119, 95–100. [Google Scholar] [CrossRef]
  16. Hileman, B. Nuclear theft poses growing security threat. Chem. Eng. News 2010, 73, 24–25. [Google Scholar] [CrossRef]
  17. Cho, H.S.; Woo, T.H. Cyber security in nuclear industry—Analytic study from the terror incident in nuclear power plants (NPPs). Ann. Nucl. Energy 2017, 99, 47–53. [Google Scholar] [CrossRef]
  18. Solodov, A.; Williams, A.; Al Hanaei, S.; Goddard, B. Analyzing the threat of unmanned aerial vehicles (UAV) to nuclear facilities. Secur. J. 2018, 31, 305–324. [Google Scholar] [CrossRef]
  19. Busch, N. Risks of Nuclear Terror: Vulnerabilities to Theft and Sabotage at Nuclear Weapons Facilities. Contemp. Secur. Policy 2002, 23, 19–60. [Google Scholar] [CrossRef]
  20. Wang, F.; Wang, J.; Wang, J.; Li, Y.; Hu, L.; Wu, Y. Risk monitor riskangel for risk-informed applications in nuclear power plants. Ann. Nucl. Energy 2016, 91, 142–147. [Google Scholar] [CrossRef]
  21. Pękala, B. Uncertainty data in interval-valued fuzzy set theory. In Properties, Algorithms and Applications, Studies in Fuzziness and Soft Computing; Springer: Berlin/Heidelberg, Germany, 2019; Volume 367. [Google Scholar]
  22. Wan, S.P.; Li, D.F. Fuzzy mathematical programming approach to heterogeneous multiattribute decision-making with inter-val-valued intuitionistic fuzzy truth degrees. Inf. Sci. 2015, 325, 484–503. [Google Scholar] [CrossRef]
  23. Krejčí, J.; Krejčí, J. Fuzzy set theory. In Pairwise Comparison Matrices and Their Fuzzy Extension: Multi-Criteria Decision Making with a New Fuzzy Approach; Springer: Berlin/Heidelberg, Germany, 2018; pp. 57–84. [Google Scholar]
  24. Tseng, T.L.; Konada, U.; Kwon, Y. A novel approach to predict surface roughness in machining operations using fuzzy set theory. J. Comput. Des. Eng. 2016, 3, 1–13. [Google Scholar] [CrossRef]
  25. Dombi, J. Membership function as an evaluation. Fuzzy Sets Syst. 1990, 35, 1–21. [Google Scholar] [CrossRef]
  26. Chen, S.J.; Hwang, C.L. Fuzzy multiple attribute decision making methods. In Fuzzy Multiple Attribute Decision Making: Methods and Applications; Springer: Berlin/Heidelberg, Germany, 1992; pp. 289–486. [Google Scholar]
Figure 1. Nuclear radiation fault tree model for spent fuel reprocessing plant.
Sustainability 16 01495 g001
Figure 2. Reliability calculation flow of spent fuel reprocessing plants.
Sustainability 16 01495 g002
Figure 3. Natural language and fuzzy number relationship function.
Sustainability 16 01495 g003
Figure 4. Bar chart of evaluation results for each unit. (a) Spent fuel pool; (b) extraction process plant; (c) tail-end conversion plant; (d) waste liquid purification plant; (e) curing workshop; (f) discharge workshop; (g) solid waste preparation workshop; (h) equipment room; (i) storehouse; (j) centralized control room; (k) office area; (l) dormitory; (m) laboratory.
Sustainability 16 01495 g004aSustainability 16 01495 g004b
Figure 5. Normalized results of importance of each key facility.
Sustainability 16 01495 g005
Table 1. Event symbols and their meanings.
SymbolsEventsSymbolsEvents
T Nuclear Security Radiation Incidents X 1 Employee Theft
M 1 Loss of Radioactive Sources X 2 Attack
M 2 Radiation Source Leakage X 3 Natural Disaster
M 3 Failure of Regulatory Facilities X 4 Internet Information Events
M 4 Failure of Auxiliary Equipment X 5 Stealing
M 5 Failure of Support Equipment X 6 Employee Injury
M 6 Failure of Monitoring Instruments X 7 Equipment Failure
M 7 Highly Radioactive Liquid Leakage X 8 Fire
M 8 Emergency Response Failure
Table 2. Results of expert evaluation of occurrence probabilities of basic events.
Events/PossibilityVery SmallSmallSingle SmallMediumSingle LargeLargeVery Large
Employee Theft12036603
Attack12339300
Natural Disaster0666930
Internet Information Events33061233
Stealing90123600
Employee Injury3096930
Equipment Failure3066690
Fire6336660
Table 3. Probability of occurrence of basic events.
Basic Events and Their SymbolsProbabilityWeight
Employee Theft (X1)2.228 × 10−30.068
Attack (X2)1.033 × 10−30.032
Natural Disaster (X3)4.560 × 10−30.142
Internet information events (X4)7.834 × 10−30.242
Stealing (X5)1.542 × 10−30.048
Employee Injury (X6)4.592 × 10−30.142
Equipment Failure (X7)6.730 × 10−30.208
Fire (X8)3.819 × 10−30.118
Table 4. Basic event probability importance.
Basic Events and Their SymbolsProbability Importance
Employee Theft X10.998967
Attack X20.997772
Natural Disaster X30.000078
Internet information events X40.000027
Stealing X50.000035
Employee Injury X60.000091
Equipment Failure X70.000038
Fire i0.000030
Table 5. Critical importance of basic events.
Basic Events and Their SymbolsCritical Importance
Employee Theft X10.682902
Attack X20.316245
Natural Disaster X30.000110
Internet Information Events X40.000067
Stealing X50.000017
Employee Injury X60.000129
Equipment Failure X70.000079
Fire X80.000036
Table 6. Fuzzy possibility values for seven fuzzy natural languages.
NumberEvaluation (V)Fuzzy Possibility Value (S)
1VS0.091
2S0.227
3SS0.363
4M0.500
5SL0.636
6L0.773
7VL0.909
Table 7. Distribution of expert weights.
NumberNumber of PeopleQualificationLength of ServiceEducationScoreWeight
195 (Senior Engineers)4 (20~30)5 (Doctor)140.347
265 (Professor)3 (10~20)5 (Doctor)130.215
364 (Researcher)3 (10~20)5 (Doctor)120.198
464 (Intermediate Engineer)2 (5~10)4 (Doctor)100.165
533 (Assistant Engineer)2 (5~10)4 (Doctor)90.075
Table 8. Facility importance of each evaluation unit.
Evaluation
Modules
Spent Fuel PoolExtraction
Process Plant
Tail-End
Conversion Plant
Waste Liquid
Purification Plant
Curing
Workshop
Discharge
Workshop
Solid Waste Preparation Workshop
Result0.2830.2900.3010.2950.2990.2920.289
Normalized results0.0770.0790.0820.0800.0810.0790.078
Evaluation
Modules
Equipment RoomStorehouseCentralized
Control Room
Office AreaDormitoryLaboratory
Result0.3420.2760.2010.2620.3010.262
Normalized results0.0920.0750.0540.0710.0820.070
Table 9. Criteria for judging monitoring grades.
Importance Interval(0, 0.070](0.070, 0.080](0.080, 1]
Monitoring GradesGrade IGrade IIGrade III
Table 10. Monitoring grades by facilities.
Evaluation ModulesSpent Fuel PoolExtraction
Process Plant
Tail-End
Conversion Plant
Waste Liquid
Purification Plant
Curing
Workshop
Discharge
Workshop
Solid Waste Preparation Workshop
GradeIIIIIIIIIIIIIIIIII
Evaluation ModulesEquipment RoomStorehouseCentralized
Control Room
Office AreaDormitoryLaboratory
GradeIIIIIIIIIIII
Table 11. Types and models of radiation monitoring sensors.
Equipment TypesReference Models
Monitoring of α and β Radiation Surface ContaminationComo170 (Nuvia SEA, Dlmen, Germany)
X, γ radiation Surface Contamination MonitoringFH40G, FHZ672E-10 (Thermo Fisher, Waltham, MA, USA)
Pyroelectric DosimeterTLD-469 (NAYOU, Shanghai, China)
Electronic DosimeterGHZ1300 (Xiangting, Hangzhou, China)
Individual Dose ClassFN-2000B (FEINUOFEI, Shenzhen, China)
TLD-2000B (FEINUOFEI, Shenzhen, China)
Table 12. Monitoring program for radiation source terms at all levels of significance.
Monitoring GradeTest ItemsInstrumentationMonitoring Method
Grade ISearching for radioactive sourcesMobile Monitoring VehiclePatrol along the suspicious path and forward to the designated center through the communication network system.
NaI (TI) Roving Spectrometer
Delineation of pollution control zonesPortable γ Dose Rate MeterSearch measurements are taken in suspicious areas and calculated using the prediction system. When an increase in the dose rate is detected, the location of the radioactive source is determined using methods such as the center of the circle.
Nuclide analysisNeutron DetectorThe boundaries of the contamination control zone are delineated on the basis of radiation exposure
Portable γ SpectrometerPortable γ-spectrometers and high-performance scintillation neutron detectors have been used for nuclide identification.
Neutron Detector
Surface pollution monitoringMonitoring of α and β Radiation Surface ContaminationSurface contamination meters are used to detect the surface activity on suspected contaminated persons, and surfaces within the contaminated area calculated by the prediction system, as well as on decontaminated surfaces.
X, γ Radiation Surface Contamination Monitoring
Grade IISearching for radioactive sourcesMobile Monitoring VehiclePatrol along the suspicious path and forward to the designated center through the communication network system.
NaI (TI) Roving Spectrometer
Delineation of pollution control zonesPortable γ Dose Rate MeterSearch measurements are taken in suspicious areas and calculated using the prediction system. When an increase in the dose rate is detected, the location of the radioactive source is determined using methods such as the center of the circle.
Nuclide analysisNeutron DetectorThe boundaries of the contamination control zone are delineated on the basis of radiation exposure.
Portable γ SpectrometerPortable γ spectrometers and high-performance scintillation neutron detectors have been used for nuclide identification.
Neutron Detector
Surface pollution monitoringMonitoring of α and β Radiation Surface ContaminationSurface contamination meters are used to detect the surface activity on suspected contaminated persons, and surfaces within the contaminated area calculated by the prediction system, as well as on decontaminated surfaces.
X, γ Radiation Surface Contamination Monitoring
Grade IIISearching for radioactive sourcesMobile Monitoring VehiclePatrol along the suspicious path and forward to the designated center through the communication network system.
NaI (TI) Roving Spectrometer
Delineation of pollution control zonesPortable γ Dose Rate MeterSearch measurements are taken in suspicious areas and calculated using the prediction system. When an increase in the dose rate is detected, the location of the radioactive source is determined using methods such as the center of the circle.
Nuclide analysisNeutron DetectorThe boundaries of the contamination control zone are delineated on the basis of radiation exposure.
Portable γ SpectrometerPortable γ-spectrometers and high-performance scintillation neutron detectors have been used for nuclide identification.
Neutron Detector
Surface pollution monitoringMonitoring of α and β Radiation Surface ContaminationSurface contamination meters are used to detect the surface activity on suspected contaminated persons, and surfaces within the contaminated area calculated by the prediction system, as well as on decontaminated surfaces.
X, γ Radiation Surface Contamination Monitoring
Disclaimer/Publisher’s Note: The statements, opinions and data contained in all publications are solely those of the individual author(s) and contributor(s) and not of MDPI and/or the editor(s). MDPI and/or the editor(s) disclaim responsibility for any injury to people or property resulting from any ideas, methods, instructions or products referred to in the content.

